1.introduction - valenciaport
TRANSCRIPT


1. Introduction
2. Why a new index?
3. Why Valencia?
4. Methodology
5. Conclusions

1. Introduction
IntroductionWhat is an index?
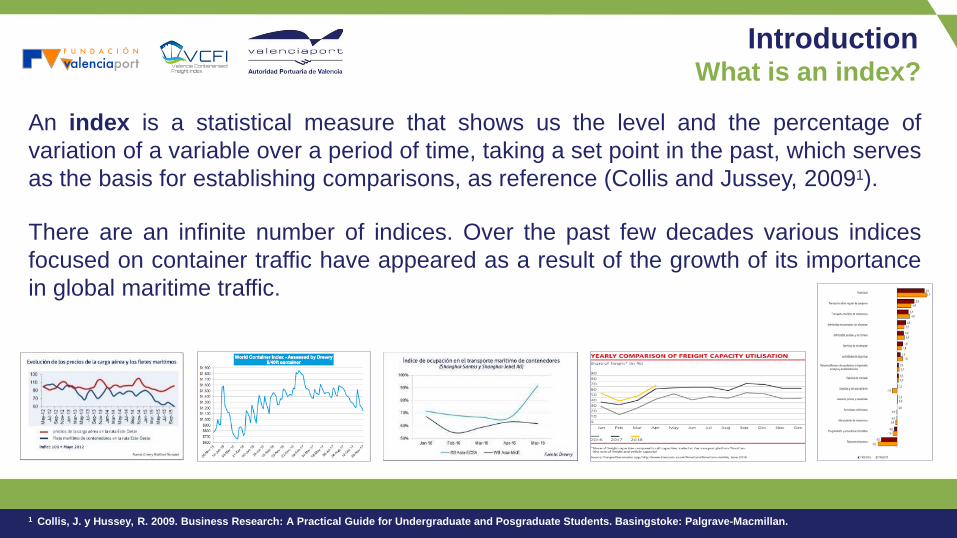
An index is a statistical measure that shows us the level and the percentage of
variation of a variable over a period of time, taking a set point in the past, which serves
as the basis for establishing comparisons, as reference (Collis and Jussey, 20091).
There are an infinite number of indices. Over the past few decades various indices
focused on container traffic have appeared as a result of the growth of its importance
in global maritime traffic.
1 Collis, J. y Hussey, R. 2009. Business Research: A Practical Guide for Undergraduate and Posgraduate Students. Basingstoke: Palgrave-Macmillan.

50,51
16,41
2,75
30,32
1980
Oil and gas
Five major bulks
Container
Other dry cargo
29,70
30,84
16,72
22,74
2016
Oil and gas
Five major bulks
Container
Other dry cargo
Evolution of the relative importance of different types of
merchandise in maritime traffic
IntroductionWhat is an index?

Indices used in maritime transport can be classified in a variety of ways2:
1. By the source of data used:
• Qualitative data: when the data are provided by a group of experts
or a panel that periodically responds to questionnaires (European
Freight Forwarding Index).
• Quantitative data: when the index is built considering the primary
data of the sector concerned (Baltic Dry Index).
IntroductionTypes of index
2 Karamperidis, S., Jackson, E. y Mangan, J. 2013. “The use of índices in the maritime transpor sector”, Maritime Policy & Management, 40:4, 339-350
Cullinane, Kevin (ed.). 2010. International Handbook of Maritime Economics, Edward Elgar, Cheltenham. UK
2. By the way that they fit into the evolution of the economic cycle:
• Leading indicators: indices that are ahead of the cycle (European
Freight Forwarding Index).
• Lagging indicators: show the change after it has occurred in the
economy (Harpex Index).
• Coincident indicators: those that move and change according to
the evolution of the cycle (BDI or Shanghai Containerized Freight
Index).
IntroductionTypes of index

3. By the type of goods transported:
• indices for transport of bulk, Dry Bulk Freight Index. For example, the
Baltic Dry Index.
• indices to analyse freight rates in oil and refined products, Tanker
Freight Index, such as the Baltic Exchange Tanker Index (Dirty Tankers for
crude oil and Clean Tankers for refined petroleum products and chemicals).
• indices for containers such as those developed by Shanghai Shipping
Exchange since 1996 (SCFI), or those published by Drewry Maritime
Research since 2006 (WCI), or the Leibniz Institute for Economic Research
since 2012, or those developed by UNCTAD itself, to mention some of the
most cited in research.
IntroductionTypes of index
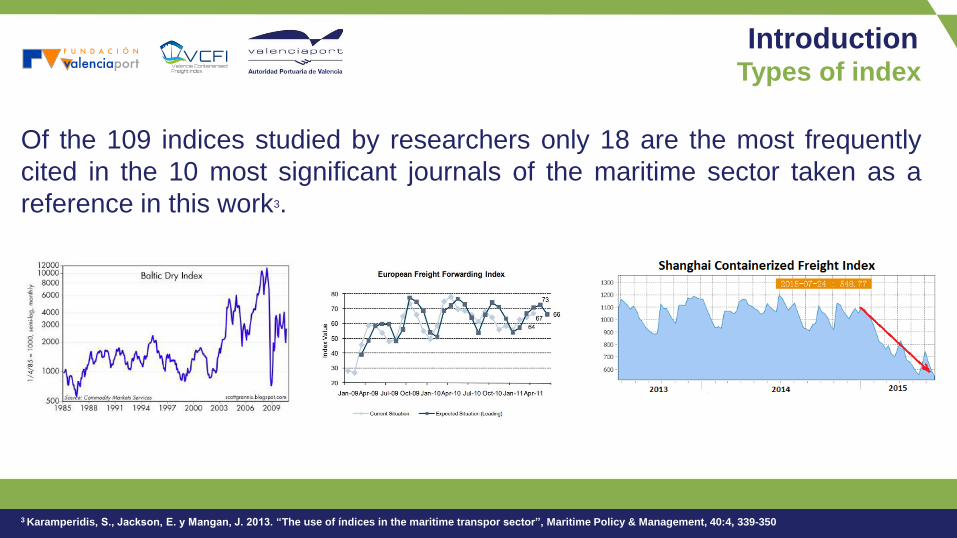
Of the 109 indices studied by researchers only 18 are the most frequently
cited in the 10 most significant journals of the maritime sector taken as a
reference in this work3.
IntroductionTypes of index
3 Karamperidis, S., Jackson, E. y Mangan, J. 2013. “The use of índices in the maritime transpor sector”, Maritime Policy & Management, 40:4, 339-350

The main aim of all these indices is to try to interpret the evolution of the market and
anticipate the decisions to be taken by market operators as far as possible.
The freight market has always shown significant volatility, more or less pronounced
according to the type of goods transported, accompanying the global economic cycles.
Historically4 the cycles in the maritime transport market present three different trends:
1. Long cycles (between 10 and 12 years).
2. Short cycles (4 and 5 years).
3. Those that include the seasonality of the market (Chinese new year).
However, all analysts observe a considerable shortening of these cycles, especially since the
crisis of 2008.
IntroductionThe aim of indices
4 Stopford, M. 2009. Maritime Economics (Third Edition). Abingdon, Routledge
Stopford, M. 2017. Splash247.Com, 4th December 2017
Mowafy, A., Notteboom, T. 2013. "Indexing Container Freight Rates: To Step Toward a Market Pricing Stability Mechanism".
Yifei, Z., Dalí, Z. and Yanagita, T. 2018. "Container liner freight index based on data from e-booking platforms". Maritime Policy & Management.

Introduction
Market cycle-ogy – Sector cycle phases
Optimism
Excitement
Thrill
Euphoria
Anxiety
Denial
Desperation
Fear
PanicDespondency
Depression
Relief
Hope
Still Happy daysHappy days
Optimism
Demand is growing at a faster pace than the growth in fleet capacity
Demand outweighs supply: freight rates on the rise
Orders for new ships under construction. First deliveries within two years: freight rates keeps rising
Orders for new ships can grow very rapidly
Demand stabilises, the first orders begin to be delivered, supply grows
Older vessels for scrapping, reduction in navigation speed, technical stopovers: supply diminishing.
First signs of excess supply
Drop in freight rates and supply continuesto increase
Source: DNV-JL ©2016 Jakub Walenkiewicz
The aim of indices

IntroductionWhich variables influence the evolution of freight rates?
Freight rates depend on the evolution of the supply and demand of load
capacity.
1. While demand is related to factors exogenous to the sector (the behaviour
of the global economy).
2. Supply is linked to endogenous elements to the sector (the strategy of the
shipping companies with respect to the capacity and the size of the ships).

Exogenous variables:
1. GDP growth.
2. Evolution of trade.
3. The price of crude oil.
4. The imposition of environmental
measures.
5. The evolution of technology…
Introduction
Endogenous variables :
1. Demand for new ships in the medium and
long term.
2. Reduction of costs associated with the size.
3. The reduction in costs linked to technological
developments.
4. Vertical and/or horizontal integration
strategies in the sector.
5. Destruction of obsolete production capacity.
Which variables influence the evolution of freight rates?

The “vicious cycle of container traffic”
Over the last decades, since the appearance of the container (1956) container traffic has been
submitted to constant economic cycles that have been associated with:
• Increase in ship size
• Growing efficiency
• Reduction in unit costs
• Which are translated to freight rates.
• Fall in freight rates in nominal and real terms.
• Greater cash-flow needs to maintain pace of investment.
• Need to have an increasingly large market share.
• Considerable competitiveness, agreements between shipping companies, bankruptcies and
mergers.
The key is knowing what was the driver for this vicious cycle:
• While Maersk believes that it is related to a fall in benefits.
• In my opinion the origin lies in technical progress.
IntroductionWhich variables influence the evolution of freight rates?

IntroductionWhich variables influence the evolution of freight rates?
Hansen, Marcos. 2018. "Shipping Trends & The Future Of Shipping", Maersk Line

IntroductionWhich variables influence the evolution of freight rates?
Greater competitiveness
Technical progress associated with new assets
Benefits, profitability and cash flow fall
Freight rate war: freight rates fall
Excess capacity
Increased importance in the market
Increased capacity
Cost reduction
Increase in ship size
Economies of scalePressure to incorporate
other more evolved and
competitive assets

IntroductionWhich variables influence the evolution of freight rates?
While average nominal freight rates, as measured by the CCFI index, have fallen by over 20% since
the beginning of 1998, the real container freight rates, after accounting for changes in the price of
bunker, have fallen by more than 50% in the last 20 years.
Source: Alphaliner Volumen 2018, número 23

IntroductionWhich variables influence the evolution of freight rates?
Of this set of variables we will select five to analyse their impact in the economic
cycle of maritime transport:
1. The GDP growth rate of the G-20
2. The evolution of the demand for container traffic (in TEUs)
3. The evolution of the price of oil (dollars per barrel)
4. The total capacity of the fleet of containerships (in thousands of TEUs)
5. The idle capacity of the fleet (in TEUs)
We will use the SCFI (Shanghai Containerized Freight Index) as a reference.

IntroductionWhich variables influence the evolution of freight rates?
Determinants of the SCFI: Supply
Evolution of fleet capacity of containerships
Source: Alphaliner 2018
Average orderbook23%
1996-1999
Average orderbook31%
2000-2003
Average orderbook55%
2004-2007
Average orderbook23%
2010-2018

IntroductionWhich variables influence the evolution of freight rates?
Determinants of the SCFI: Demand
Growth of GDP G-20 2009-2017(% change)
G20 – Rate growth
of GDP in volume
for the period,
compared with the
previous period
Average annual
mean growth rate
2009-2017
0.8%
Source: OECD
-2,00
-1,50
-1,00
-0,50
0,00
0,50
1,00
1,50
20
00
-Q1
20
01
-Q1
20
02
-Q1
20
03
-Q1
20
04
-Q1
20
05
-Q1
20
06
-Q1
20
07
-Q1
20
08
-Q1
20
09
-Q1
20
10
-Q1
20
11
-Q1
20
12
-Q1
20
13
-Q1
20
14
-Q1
20
15
-Q1
20
16
-Q1
20
17
-Q1
20
18
-Q1
RATE OF CHANGE OF G-20 GDP IN VOLUME

IntroductionWhich variables influence the evolution of freight rates?
Determinants of the SCFI: Demand
International Maritime Container Trade, 1996-2017 (TEUs and % change)
Source: UNCTAD, Review of Maritime Transport 2017
Average cumulative
annual growth rate
1996 - 2008
6.7%
Average cumulative
annual growth rate
2009-2017
5.3%

IntroductionWhich variables influence the evolution of freight rates?
Determinants of the SCFI: Supply
Evolution of fleet capacity of containerships
Source: Alphaliner 2018
Nominal fleet
capacity of
containerships
2017
3.9%
Actual capacity
growth
2017
9.5%

IntroductionWhich variables influence the evolution of freight rates?
Determinants of the SCFI: The Price of Oil Bunkering Costs BAF

IntroductionWhich variables influence the evolution of freight rates?
Determinants of the SCFI: The Price of Oil Bunkering Costs BAF
IntroductionWhich variables influence the evolution of freight rates?
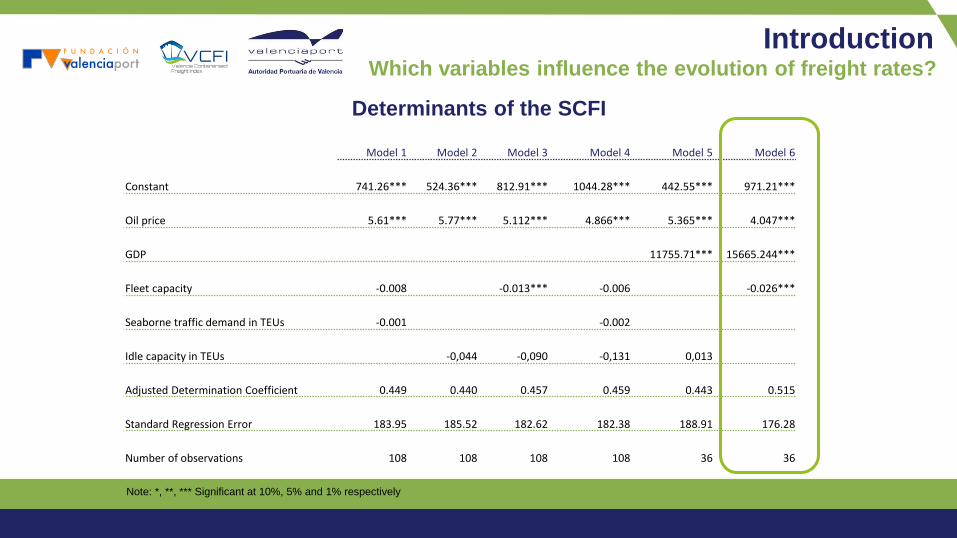
Determinants of the SCFI
Model 1 Model 2 Model 3 Model 4 Model 5 Model 6
Constant 741.26*** 524.36*** 812.91*** 1044.28*** 442.55*** 971.21***
Oil price 5.61*** 5.77*** 5.112*** 4.866*** 5.365*** 4.047***
GDP 11755.71*** 15665.244***
Fleet capacity -0.008 -0.013*** -0.006 -0.026***
Seaborne traffic demand in TEUs -0.001 -0.002
Idle capacity in TEUs -0,044 -0,090 -0,131 0,013
Adjusted Determination Coefficient 0.449 0.440 0.457 0.459 0.443 0.515
Standard Regression Error 183.95 185.52 182.62 182.38 188.91 176.28
Number of observations 108 108 108 108 36 36
Note: *, **, *** Significant at 10%, 5% and 1% respectively

IntroductionWhich variables influence the evolution of freight rates?
Determinants of the SCFI
The variables that presented the best results are:
1. The GDP growth rate of the G-20.
2. The evolution of the price of oil (dollars per barrel).
3. The total capacity of the fleet of containerships (in thousands of TEUs).

IntroductionWhich variables influence the evolution of freight rates?
Determinants of the SCFI
VARIABLE DESCRIPTIONEXPECTED
SIGNESTIMATED
SIGN
OP Oil priceEurope Brent Spot Price FOB (Dollars per Barrel)
+ +
GDP growth% gross domestic product growth rate for G20 countries –
Growth quarterly rate in volume compared to previous quarter Source: OECD data
+ +
FC Fleet capacity Total containership fleet capacity in ‘000s TEUs - -
SCFI = α0 + α1 OP + α2 GDP + α3 FC + μ

IntroductionWhich variables influence the evolution of freight rates?
Determinants of the SCFI
0
200
400
600
800
1000
1200
1400
1600
1800
0 20 40 60 80 100 120 140Shan
ghai
Co
nta
ine
rize
d f
reig
ht
Ind
ex
Europe Brent Spot Price FOB (Dollars per Barrel)
Europe Brent Spot Price FOB (Dollars per Barrel) Adjusted Regression Curve
Shanghai Containerized freight Index Pronóstico Shanghai Containerized freight Index

IntroductionWhich variables influence the evolution of freight rates?
Determinants of the SCFI
0
200
400
600
800
1000
1200
1400
1600
1800
-2,0% -1,5% -1,0% -0,5% 0,0% 0,5% 1,0% 1,5% 2,0%
Shan
ghai
Co
nta
ine
rize
d f
reig
ht
Ind
ex
% GDP growth
% GDP growth Adjusted Regression Curve
Shanghai Containerized freight Index Pronóstico Shanghai Containerized freight Index

IntroductionWhich variables influence the evolution of freight rates?
Determinants of the SCFI
0
200
400
600
800
1000
1200
1400
1600
1800
0 5000 10000 15000 20000 25000
Shan
ghai
Co
nta
ine
rize
d f
reig
ht
Ind
ex
Total fleet capacity in '000s TEUs
Total fleet capacity in '000s TEUs Adjusted Regression Curve
Shanghai Containerized freight Index Pronóstico Shanghai Containerized freight Index
IntroductionWhich variables influence the evolution of freight rates?
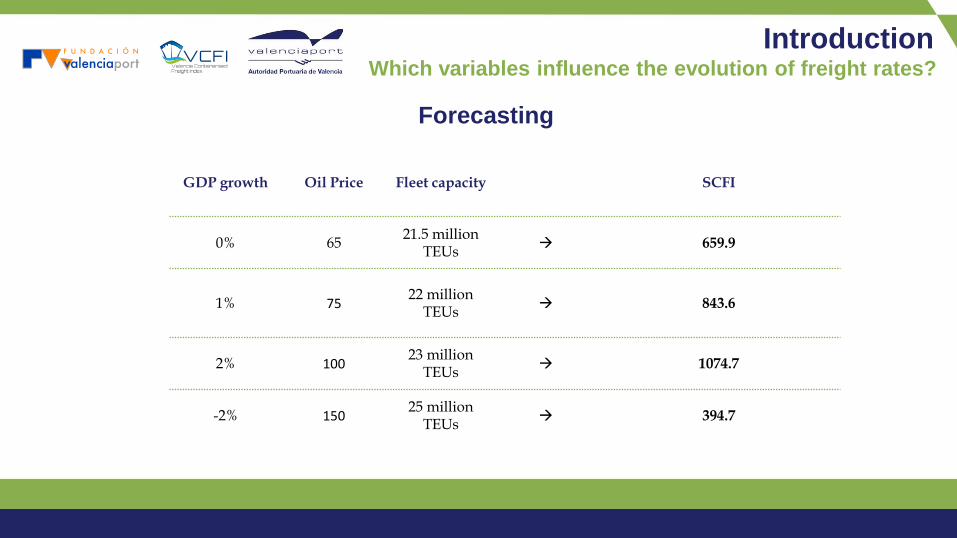
Forecasting
GDP growth Oil Price Fleet capacity SCFI
0% 6521.5 million
TEUs 659.9
1% 7522 million
TEUs 843.6
2% 10023 million
TEUs 1074.7
-2% 15025 million
TEUs 394.7

The fact that these indices act as a barometer means that they are used extensively not only in
research, but also by sector companies in their predictive analysis of the market or explanatory
analysis of the past and present behaviour of their income statements.
IntroductionWhich variables influence the evolution of freight rates?
Source: Hansen, Marcos. 2018. “Shipping Trends & The Future Of Shipping”, Maersk line

Or to explain their own evolution and the health of the world economy (RWI/ISL
Container Throughput Index). As the Leibniz Institute for Economic Research
and the Institute of Shipping Economics and Logistics explain, there is a very
strong correlation between the evolution of container traffic and world trade and
this in turn is closely linked to the behaviour of global GDP.
Therefore, studying the traffic of 88 selected ports that handle 60% of container
traffic globally, two/three weeks from the end of the month it is possible to
observe the evolution of port activity and extrapolate it to the behaviour of global
economy
IntroductionWhich variables influence the evolution of freight rates?

IntroductionWhich variables influence the evolution of freight rates?
https://www.isl.org/en/containerindex/may-2018

IntroductionWhich variables influence the evolution of freight rates?
-2
-1,5
-1
-0,5
0
0,5
1
1,5
2
-15,00
-10,00
-5,00
0,00
5,00en
e.-0
9
may
.-0
9
sep
.-0
9
ene.
-10
may
.-1
0
sep
.-1
0
ene.
-11
may
.-1
1
sep
.-1
1
ene.
-12
may
.-1
2
sep
.-1
2
ene.
-13
may
.-1
3
sep
.-1
3
ene.
-14
may
.-1
4
sep
.-1
4
ene.
-15
may
.-1
5
sep
.-1
5
ene.
-16
may
.-1
6
sep
.-1
6
ene.
-17
may
.-1
7
sep
.-1
7
TASAS DE VARIACIÓN DEL PIB G-20 Y DEL CONTAINER THROUGHPUT INDEX
Source: UNCTAD and RWI/ISL data

2. Why a new index?
1. Spain is an export power. Last year it handled 2,868,120 cargo laden
TEUs, which represents 1.4% of global cargo exports (205M) and there
is no indicator showing the evolution of freight rates.
2. The Western Mediterranean represents 3.8% of global traffic and we are
also not aware of the existence of an indicator for the evolution of cargo
(export) freight rates in this area.
3. For this reason, and given the similarity of freight prices, this index will
likely become the main indicator in the Mediterranean for this type of
traffic, taking into account the similarity of freight prices.
Why a new index?

3. Why Valencia?

Why Valencia?
Valenciaport's position: Container traffic ports world ranking 2017
Source: ALPHALINER 21.03.2018 to 27.03.2018

Why Valencia?
Leading Port in the Mediterranean
Rank Port Name Country2017
Mteu2007 Mteu
1 Rotterdam Netherlands 13.73 10.79
2 Antwerp Belgium 10.45 8.17
3 Hamburg Germany 8.86 9.90
4 Bremerhaven Germany 5.51 4.89
5 Valencia Spain 4.83 3.04
6 Algeciras Spain 4.39 3.41
7 Piraeus Greece 4.15 1.37
8 Barcelona Spain 3.01 2.61
9 Le Havre France 2.88 2.60
10 Genoa Italy 2.62 1.85
Top EUROPEAN Container Port
Top MEDITERRANEAN Container Port
Rank Port Name Country2017
Mteu2007 Mteu
1 Valencia Spain 4.83 3.04
2 Algeciras Spain 4.39 3.41
3 Piraeus Greece 4.15 1.37
4 Tangier Med Morocco 3.31
5 Marsaxlokk Malta 3.15 1.88
6 Barcelona Spain 3.01 2.61
7 Port Said Egypt 3.00 2.76
8 Genoa Italy 2.62 1.85
9 Gioia Tauro Italy 2.45 3.44
10 Mersin Turkey 1.55 0.78
11 La Spezia Italy 1.47 1.18
12 Fos Marseille France 1.36 1.00
Source: ALPHALINER 21.03.2018 to 27.03.2018 y Containerisation International Yearbook

Why Valencia?

Why Valencia?
Leading Port in the Mediterranean
0,00
100.000,00
200.000,00
300.000,00
400.000,00
500.000,00
600.000,00
700.000,00
800.000,00
900.000,00
1.000.000,00
VA
LEN
CIA
BA
RC
ELO
NA
BIL
BA
O
BA
HÍA
DE
ALG
ECIR
AS
CA
STEL
LÓN
ALI
CA
NTE
LAS
PA
LMA
S
VIG
O
SEV
ILLA
STA
CR
UZ
TEN
ERIF
E
BA
HÍA
DE
CÁ
DIZ
CA
RTA
GEN
A
GIJ
ÓN
HU
ELV
A
MA
RÍN
Y P
ON
TEV
EDR
A
TAR
RA
GO
NA
BA
LEA
RES
VIL
AG
AR
CÍA
MÁ
LAG
A
ALM
ERIA
CEU
TA
SAN
TAN
DER
MEL
ILLA
MO
TRIL
FER
RO
L-SA
N C
IBR
AO
PA
SAIA
A C
OR
UÑ
A
AV
ILES
TEU'S LLENOS CARGA 2017
The top export
port in Spain
Source: Puertos del Estado
CARGO LADEN TEUs 2017

4. Methodology

Methodology
The VCFI (Valencia Containerised Freight Index) aims to provide guidance
on the evolution of export freight from the Port of Valencia and be the
reference for certain routes from the Mediterranean.
The VCFI uses very similar methodology to the Shanghai Containerized
Freight Index (SCFI).
The index reflects the evolution of the market rates for the export of full
containers by sea from Valenciaport on a monthly basis.

Methodology
A work system has been defined based on the following principles:
1. Commitment to the provision and the quality of the data.
2. Statistical confidentiality and methodological rigour.
3. Timeliness and punctuality in their dissemination.
4. The VCFI will be audited annually, in order to ensure statistical
confidentiality, the accuracy of the information published and faithful
monitoring of the approved methodology.

2. It is created based on information obtained from primary data sources (twelve top level
panelists that operate in the port of Valencia, including freight forwarders and shipping
companies).
3. Monthly frequency, with data from the fleet rates of the month ending.
4. The composite index is calculated with the individual monthly data on the export freight
rates for each of the ports, obtaining the average freight rates for each port.
5. Taking into account that the freight rates of certain sea routes are negotiated in dollars, the
exchange rates published monthly by the European Central Bank will be used for
conversion to the euro.
6. The type of container under consideration is the standard container with dry general cargo.
Size 20'.
MethodologyCharacteristics of the VCFI
1. It is a quantitative index that enables the objective measurement and comparison of the
data relating to sea freight rates from the Port of Valencia.

MethodologyCharacteristics of the VCFI
7. The rate provided by the panelists includes the ocean freight spot rate and the following
surcharges:
7.1 Bunker Adjustment Factor (BAF)/ Fuel Adjustment Factor (FAF)/ Low Sulphur Surcharge
(LSS).
7.2 Emergency Bunker Surcharge(EBS)/ Emergency Bunker Additional (EBA).
7.3 Currency Adjustment Factor(CAF)/ Yen Appreciation Surcharge (YAS)
7.4 Peak Season Surcharge(PSS).
7.5 War Risk Surcharge(WRS).
7.6 Port Congestion Surcharge (PCS).
7.7 Suez Canal transit Fee/Surcharge (SCS)/ Suez Canal Fee (SCF) / Panama Transit Fee
(PTF)/ Panama Canal Charge (PCC).
8. The VCFI consists of an aggregate composite index. In the future, it will be broken
down into the 13 geographic areas that correspond to the main traffic corridors from
Valencia.

MethodologyCharacteristics of the VCFI
9. Within these 13 geographic areas,
42 ports have been selected that
represent 60% of the export
container traffic from Valenciaport
and whose rates will serve as a
reference for calculating the
index.
Geographic area VCFI Reference ports
WESTERN MEDITERRANEAN Casablanca (MA), El Djazair (DZ), Tunisia (TN)
ATLANTIC EUROPE Felixstowe (GB), Hamburg (DE), Antwerp (BE)
EASTERN MEDITERRANEAN Alexandria (EG) Ashdod (IL) Piraeus (GR) Istanbul (TR)
FAR EAST
Shanghai (CN), Hong Kong (HK), Port Kelang (MY), Singapore
(SG), Busan (KR), Tokyo (JP), Kaohsiung (TW), Bangkok (TH), Ho
Chi Minh City (VN)
MIDDLE EAST Jeddah (SA), Jebel Ali (AE)
USA - ATLANTIC CANADA New York (US), Montreal (CA), Houston (US), Miami (US)
CENTRAL AMERICA AND
CARIBBEANVeracruz (MX), Cartagena (CO) Altamira (MX), Caucedo (OJ)
ATLANTIC LATIN AMERICA Santos (BR), Buenos Aires (AR)
WEST AFRICA Luanda (AO), Bata (GQ), Dakar (SN)
AFRICA EAST COAST Durban (ZA), Port Elisabeth (ZA)
PACIFIC LATIN AMERICA Callao (PE), San Antonio (CL)
INDIAN SUBCONTINENT Nhava Sheva (IN), Kandla (IN)
BALTIC COUNTRIES Saint Petersburg (RU), Helsinki (FI)

MethodologyCharacteristics of the VCFI
10. The index only reflects the freight rates applied to cargo containers, which
correspond to exports.
11. The spot maritime freight rates and their surcharges are those applied by
the shipping companies without considering service contracts.

MethodologyCharacteristics of the VCFI
Panelists
These are the pioneering companies, but you are all invited to collaborate in the index.

El cálculo del índice se materializa a partir de la siguiente formula:
donde:
𝑓𝑗= flete promedio para Puerto j
𝑡_𝑖𝑗= flete informado por el panelista I para el Puerto j
𝑛 = número de panelistas para el Puerto j
𝑘_𝑗 = factor de ponderación para el Puerto j
m = número de puertos
𝑓𝑗 = 𝑡𝑖𝑗
𝑛
𝑛
𝑖=1
𝑉𝐶𝐹𝐼= 𝑘𝑗 ∗ 𝑓𝑗
m
j=1
MethodologyFormula for calculating the VCFI
The index is calculated according to the following formula:
Where:
Fj = average fleet rate for Port j
t_ij = fleet rate informed by the panelist l for Port j
N = number of panelists for Port j
k_j = weighting factor for Port k
M = number of ports

MethodologyFormula for calculating the VCFI
First, the average freight rate per port (𝑓𝑗) is calculated based on the data
received for this port from the panelists.
Second, a weighting factor is applied to the average freight rate according to
the weight of the port within Valenciaport’s traffic, resulting in the final index.
We opted to show the evolution of the index not in absolute values, but to
present it in the form of an index, the VCFI. The basis of the composite
index will be 1,000 points and the base of the period will coincide with the
beginning of the publication, that is to say, January 2018.

This index aims to be a reference index in the Western Mediterranean, as is the Shanghai
Containerised Freight Index for the Asia area.
It will be published on the second Friday of each month at 12:00 CET (CEST when
applicable) on the web pages of the Port Authority of Valencia and the Valenciaport
Foundation.
Methodology
Formula for calculating the VCFI

Methodology
Panel
8Shipping
companies
4Freight
forwarders
176Data
42 destination ports
13 geographic areas
Spot RatesFCL 20”FAK, all in
EUROSPurchase freight rate for freight forwardersSale freight rate for shipping companies
VCFI: January 2018 (Base = 1,000)June 2018
Phase 1Global Index
Phase 2Global Index
Indices by Areas

Conclusions
The VCFI provides information that
allows us to monitor the
transparencyIt providesto the Market
of the export freight
market
It facilitates access to market information for
SMEs operating in the spot market
trends

Methodology
400
450
500
550
600
650
700
750
800
850
980
1000
1020
1040
1060
1080
1100
ENERO FEBRERO MARZO ABRIL MAYO JUNIO
VCFI vs SCFI
VCFI
SCFI
VCFI SCFI
The graph allows us to compare the evolution of freight rates at the Port of Shanghai and the
Port of Valencia. Althrough six observations contribute little, it can be clearly seen that there is
lower volatility in the VCFI with respect to the SCFI.

This graph compares the evolution of freight rates in the Port of Valencia with those of the Baltic Dry Index,
although their methodology is different. However, it allows us to view the trends in both cases.
Methodology

5. Conclusions
Conclusions
1. The VCFI provides valuable information on a key factor for defining port competitiveness, such as
freight rates.
2. The VCFI provides the port community with information that was confidential until now. This
exercise in transparency will help the various users of the port to make better decisions.
3. It will be helpful for shippers because they will have a composite index that will mark the market
trend, on a key cost element in their export operations.
4. The VCFI will serve as a barometer of the health of the market for the major trade routes from
Valencia.
5. It will also be useful for operators that offer such services, providing a benchmark for the evolution
of their own freight rates and those on the market.
6. As a result, the VCFI will promote the operation of a more transparent market and one that has
better information available for decision-making, resulting in a more efficient market.

Freight forwarders
Shippers
Analysts
Benchmarking with market trends
Information for budgets and decision-making
Increased transparency in client negotiation
Benchmarking with market trends
Contract indexation
Increased market knowledge
Information on the trend of transport prices
Availability of historical information on freight rate evolution, with the possibility of forecasting current and future market trends
Benefits for users
Shippingcompanies
Conclusions