2 your speakers - soci
TRANSCRIPT

1

Your Speakers
Peter C. Astles
Peter completed his Chemistry degree and Ph.D. at the University of Oxford. He then spent two years of postdoctoral research with Prof. Leo Paquette at the Ohio State University, USA prior to joining Rhone-Poulenc Rorer, now Sanofi Aventis, in 1992. Peter gained experience of medicinal chemistry working on cardiovascular and asthma/ inflammation projects, becoming a section leader in 1997. In 2000, Peter moved to Eli Lilly based at Windlesham in the UK where he is a Medicinal Chemistry Group Leader and project leader in the CNS therapeutic area.
Dr Ted (AH) Parton
Ted studied Chemistry at Cambridge and after two years in industry began research into insect pheromones at the University of Southampton. After three years as Experimental Officer in mass spectrometry at the University of York, he began his career in pharmaceutical development in 1985 at Upjohn Laboratories in Crawley. In 1993, he moved to Celltech in Slough, acquired by UCB in 2004, where he is a Director in Research DMPK. His current interests include mathematical modelling of PK/PD interactions.
Darren McKerrecher
Darren obtained his Chemistry degree at Edinburgh, and completed his D.Phil with Richard Taylor at York. He joined Zeneca, now AstraZeneca, at Alderley Park in 1997. He has been involved in a number of projects with ADMET challenges, in disease areas as diverse as cancer, diabetes, obesity, asthma and COPD. In 2008, Darren returned to Alderley Park after a 2-year secondment in Lund (Sweden), and is now Associate Director of Medicinal Chemistry and Project Leader in the Diabetes & Obesity research area.
2

3
Medicinal Chemistry – an exercise in precision
Did we pay sufficient attention to therequirements of the dart?

4
Sometimes the compound was unlikely to become a drug:
This was not good Medicinal Chemistry
5
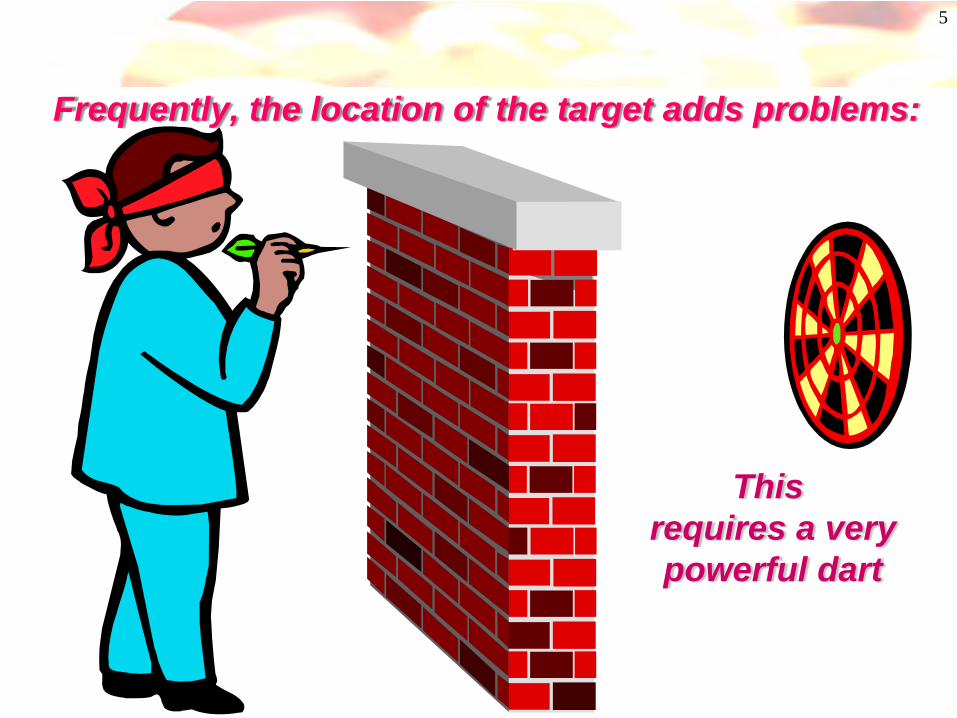
Frequently, the location of the target adds problems:
This requires a verypowerful dart

6
Potential drugs...or merely good ligands?
Pharmacokinetics, Physical & Pharmaceutical Properties
in Medicinal Chemistry
7
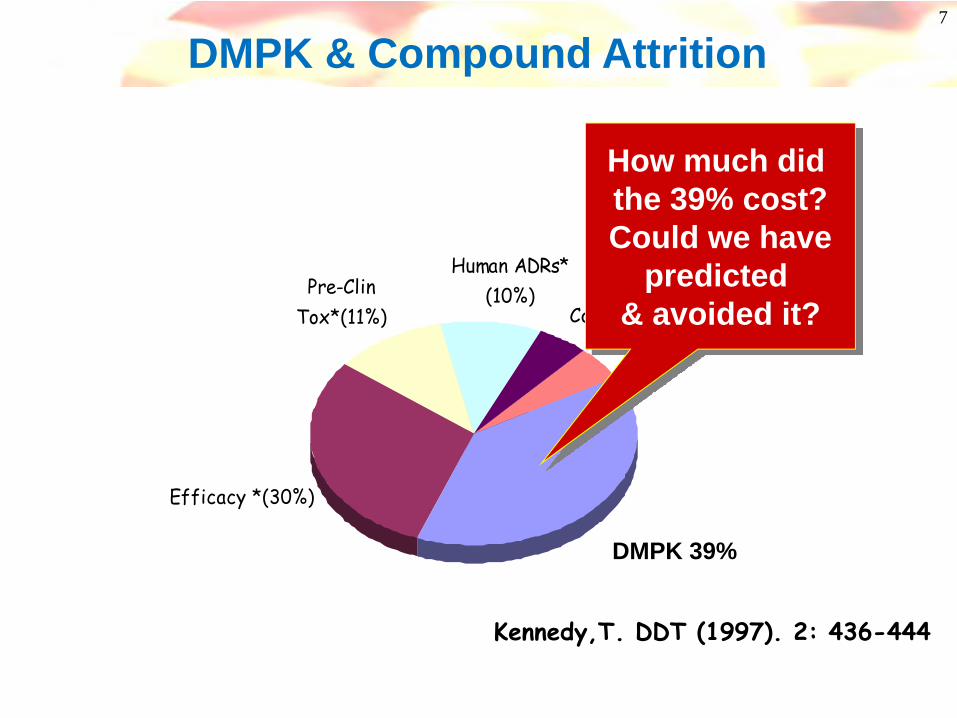
ADME (39%)
Human ADRs* (10%)
Commercial (5%)Misc (5%)
Efficacy *(30%)
Pre-Clin Tox*(11%)
Kennedy,T. DDT (1997). 2: 436-444
DMPK 39%
How much did the 39% cost?Could we have
predicted & avoided it?
DMPK & Compound Attrition
8
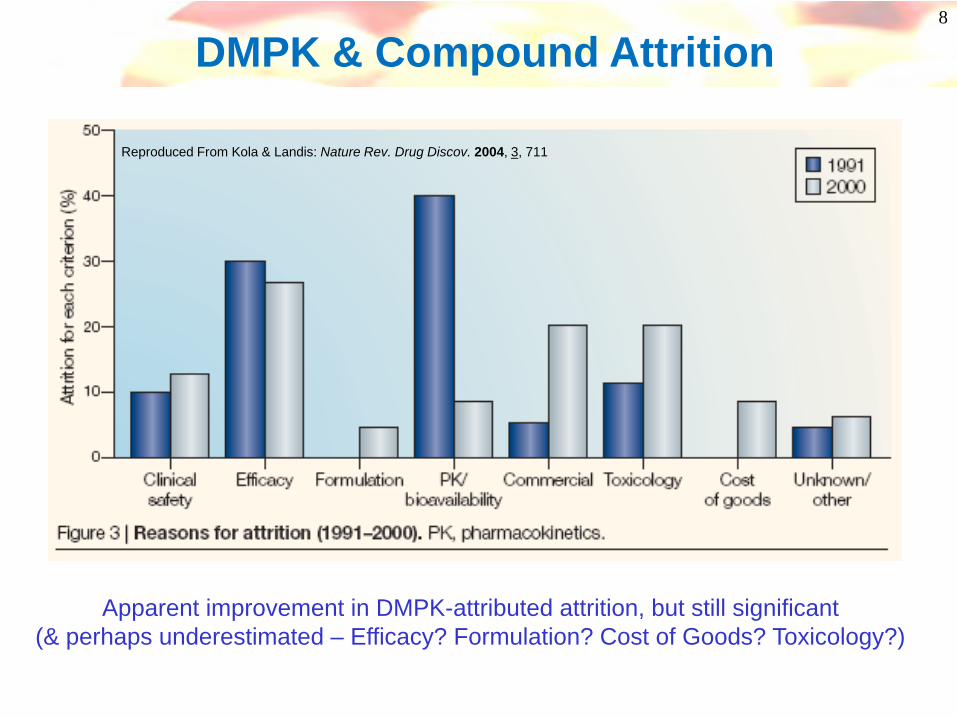
Reproduced From Kola & Landis: Nature Rev. Drug Discov. 2004, 3, 711
DMPK & Compound Attrition
Apparent improvement in DMPK-attributed attrition, but still significant(& perhaps underestimated – Efficacy? Formulation? Cost of Goods? Toxicology?)
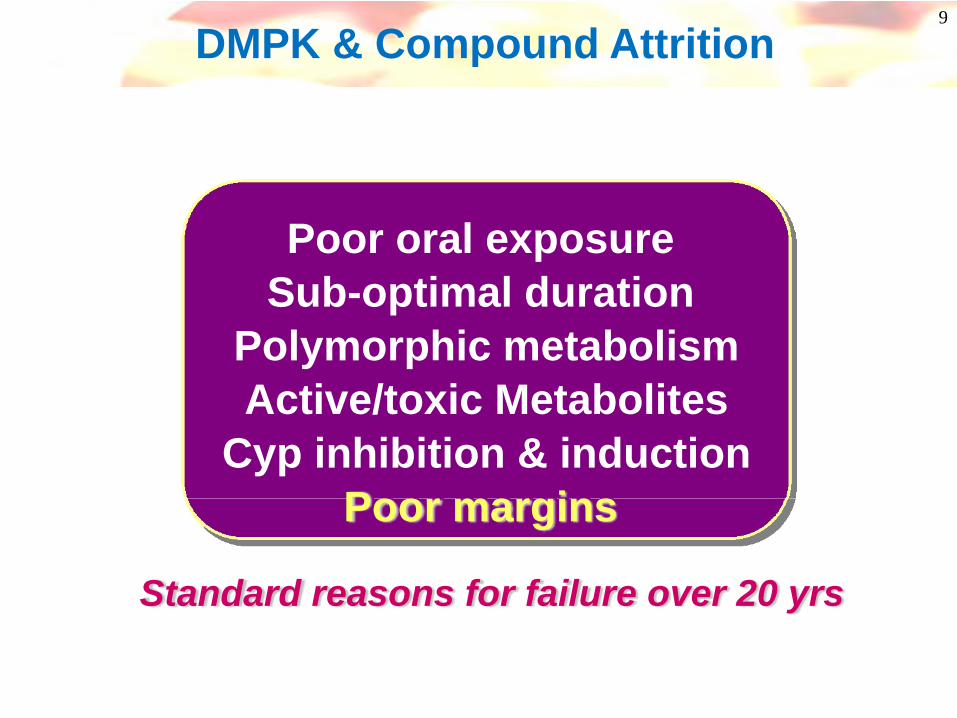
Poor oral exposure Sub-optimal duration
Polymorphic metabolismActive/toxic Metabolites
Cyp inhibition & inductionPoor margins
Standard reasons for failure over 20 yrs
9
DMPK & Compound Attrition

10
Interactions(Cyps)
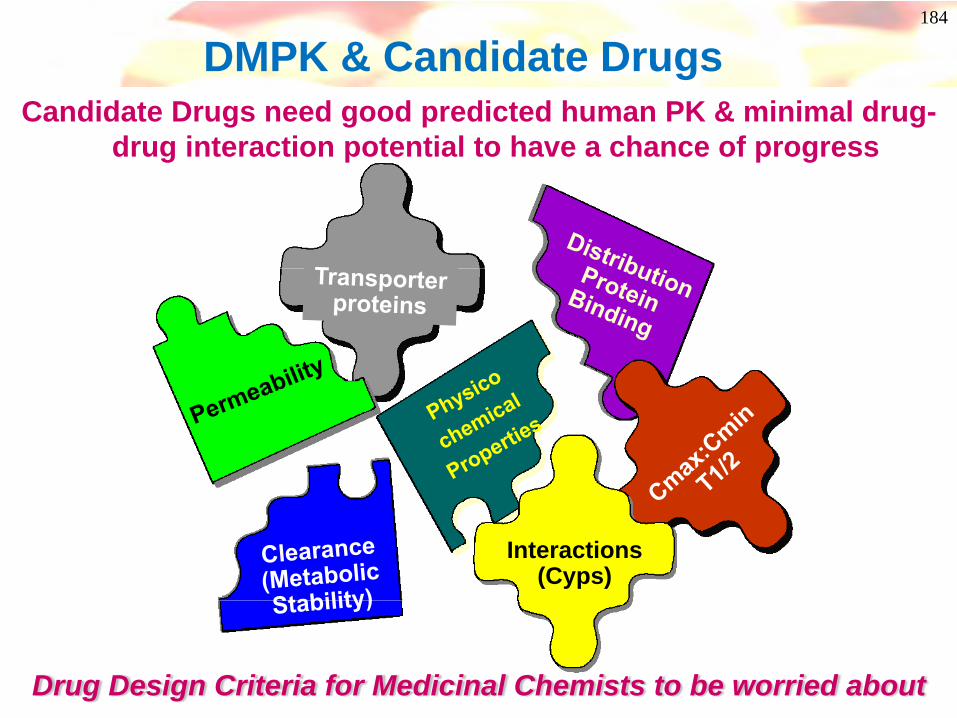
DMPK & Candidate DrugsCandidate Drugs need good predicted human PK & minimal drug-
drug interaction potential to have a chance of progress
Drug Design Criteria for Medicinal Chemists to be worried about

11
ADME Overview
Permeability Efflux Aqueoussolubility
Renalexcretion
Metabolicstability
Biliaryexcretion
Protein binding
Tissuebinding
fabs Cl VD
%F t1/2(poor/med/high) (once, twice or more daily)
Absorption Elimination DistributionCNS
penetration
And once you’ve cracked all that, compounds can still be toxic!
12
Absorption
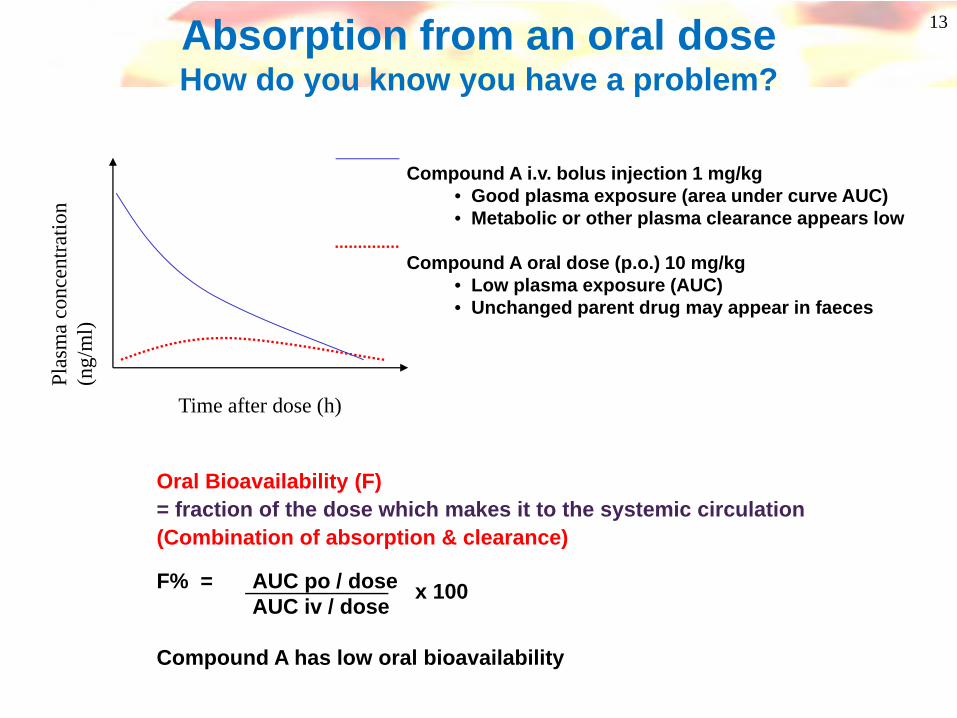
Oral Bioavailability (F)= fraction of the dose which makes it to the systemic circulation(Combination of absorption & clearance)
F% = AUC po / doseAUC iv / dose
Compound A has low oral bioavailability
13Absorption from an oral doseHow do you know you have a problem?
Time after dose (h)
Plas
ma
conc
entra
tion
(ng/
ml)
Compound A i.v. bolus injection 1 mg/kg• Good plasma exposure (area under curve AUC)• Metabolic or other plasma clearance appears low
Compound A oral dose (p.o.) 10 mg/kg• Low plasma exposure (AUC)• Unchanged parent drug may appear in faeces
x 100

14
AbsorptionThe process by which a drug moves from its site of
administration to the systemic circulation
MOUTH
INTESTINE BLOOD
Metabolism
STOMACH
Gut wall
relative surface area ~1pH ~1
relative surfacearea ~600
pH ~7
Liver
Portal vein
Oral dosing
dissolvesurvive range of pH (1.5-8)survive intestinal flora/faunacross membranes
Adapted from a slide by Rhona Cox, AZ Charnwood
15
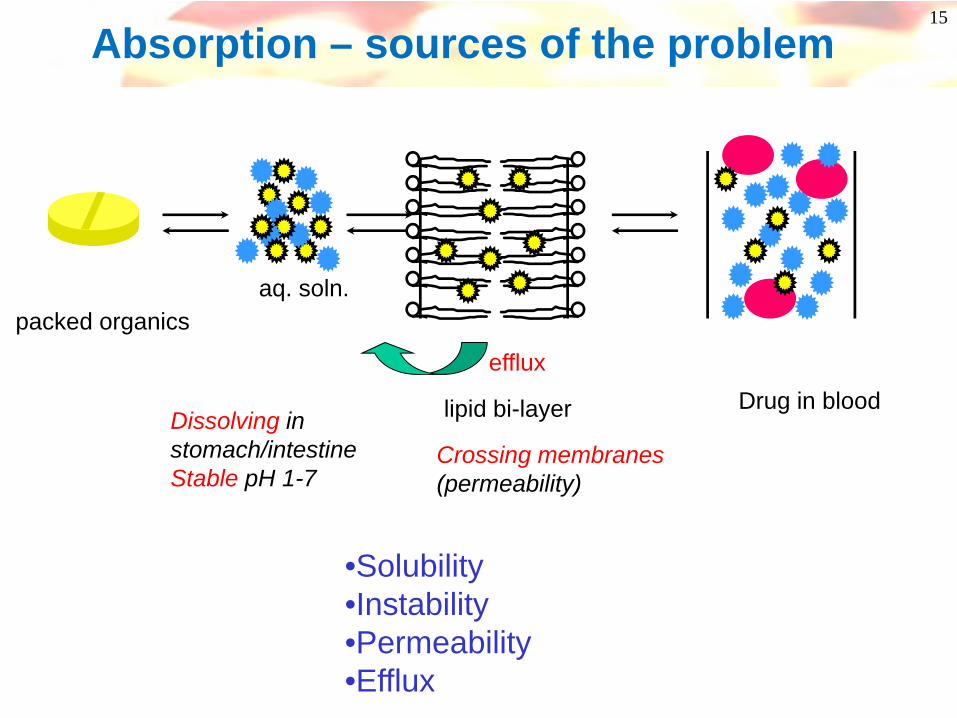
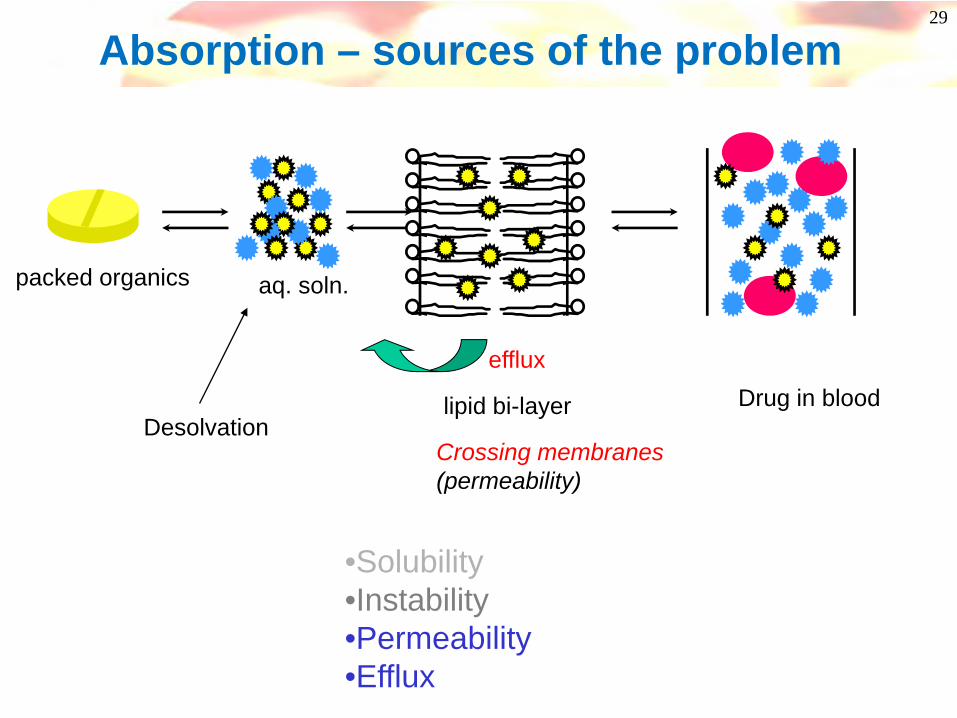
Absorption – sources of the problem
packed organicsaq. soln.
lipid bi-layer Drug in blood Dissolving instomach/intestineStable pH 1-7
Crossing membranes(permeability)
efflux
•Solubility•Instability•Permeability•Efflux
16
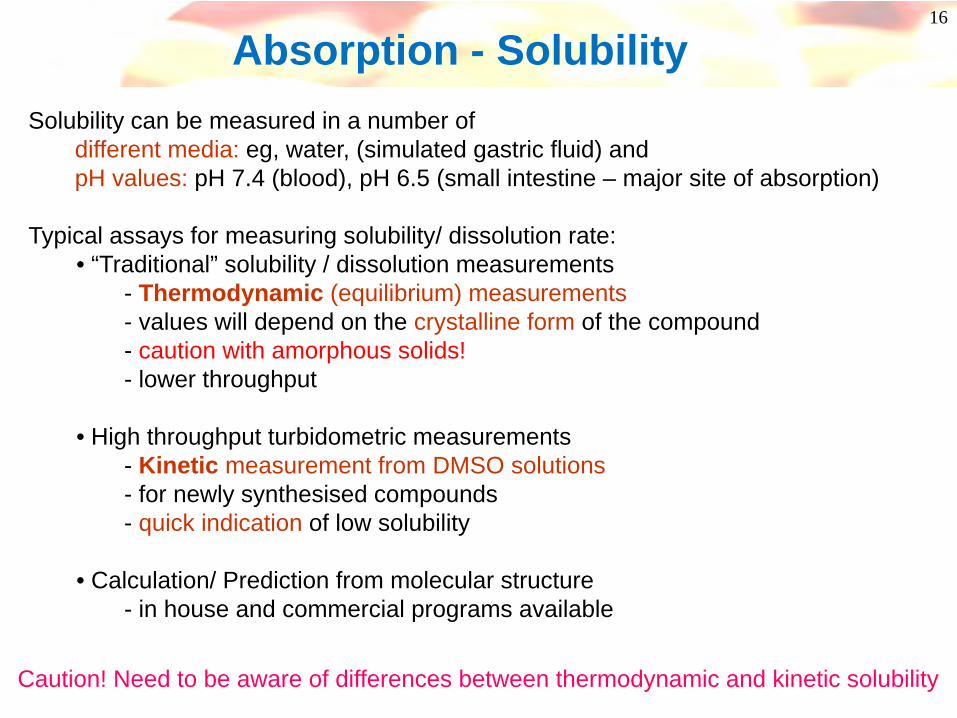
Solubility can be measured in a number of different media: eg, water, (simulated gastric fluid) and pH values: pH 7.4 (blood), pH 6.5 (small intestine – major site of absorption)
Typical assays for measuring solubility/ dissolution rate:• “Traditional” solubility / dissolution measurements
- Thermodynamic (equilibrium) measurements- values will depend on the crystalline form of the compound- caution with amorphous solids!- lower throughput
• High throughput turbidometric measurements- Kinetic measurement from DMSO solutions- for newly synthesised compounds- quick indication of low solubility
• Calculation/ Prediction from molecular structure- in house and commercial programs available
Caution! Need to be aware of differences between thermodynamic and kinetic solubility
Absorption - Solubility
17
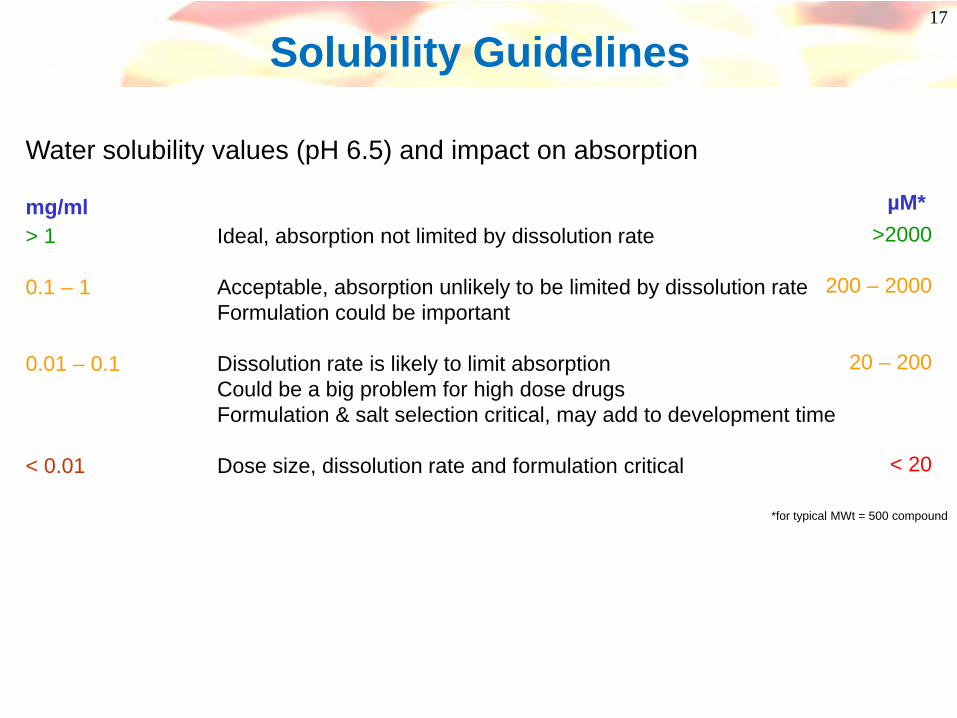
Water solubility values (pH 6.5) and impact on absorption
> 1 Ideal, absorption not limited by dissolution rate
0.1 – 1 Acceptable, absorption unlikely to be limited by dissolution rateFormulation could be important
0.01 – 0.1 Dissolution rate is likely to limit absorptionCould be a big problem for high dose drugsFormulation & salt selection critical, may add to development time
< 0.01 Dose size, dissolution rate and formulation critical
Solubility Guidelines
*for typical MWt = 500 compound
µM*>2000
200 – 2000
20 – 200
< 20
mg/ml

18
What factors govern solubility?
“Brick Dust or Greaseballs”:J. Med. Chem. 2007, 50, 5858-5862
Solubility is physical chemistry
19
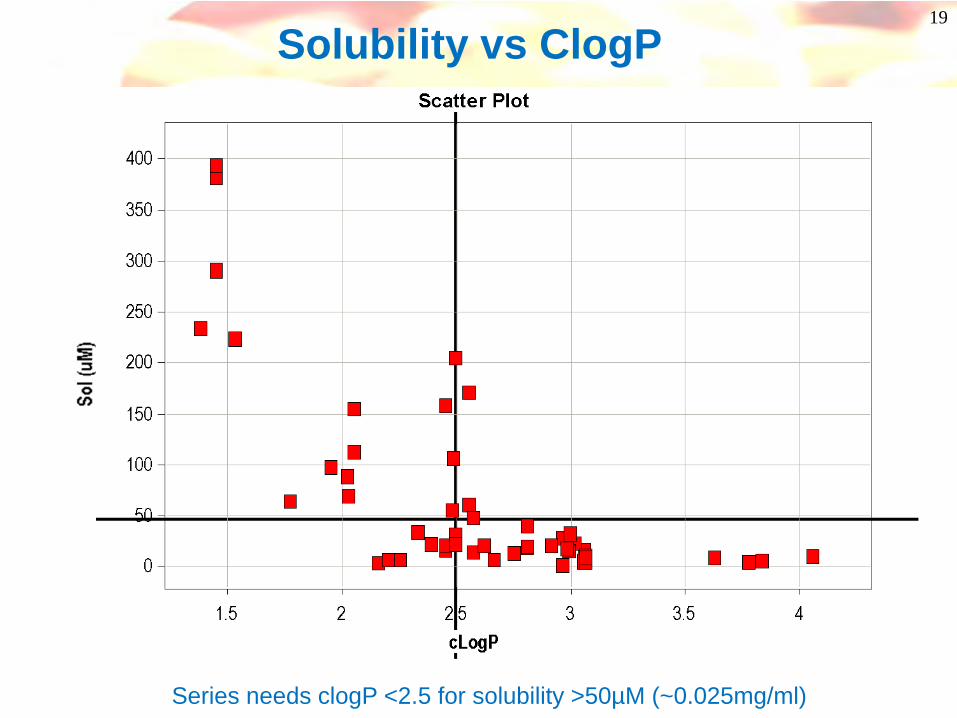
Solubility vs ClogP
Series needs clogP <2.5 for solubility >50µM (~0.025mg/ml)
20
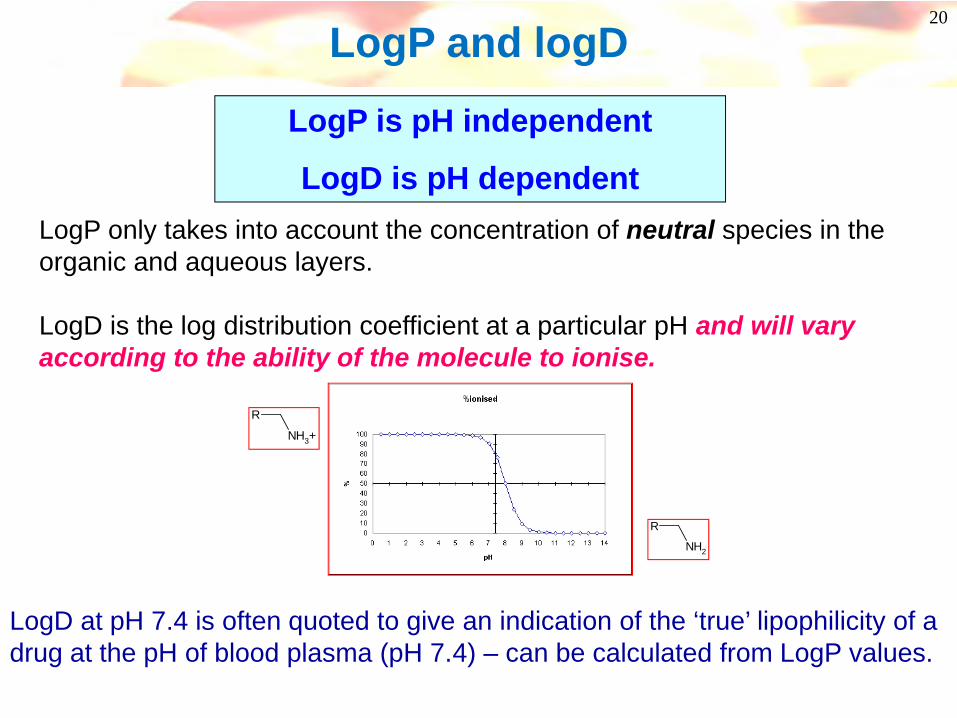
LogP and logD
LogP is pH independent
LogD is pH dependentLogP only takes into account the concentration of neutral species in the organic and aqueous layers.
LogD is the log distribution coefficient at a particular pH and will vary according to the ability of the molecule to ionise.
R
NH3+
R
NH2
LogD at pH 7.4 is often quoted to give an indication of the ‘true’ lipophilicity of a drug at the pH of blood plasma (pH 7.4) – can be calculated from LogP values.
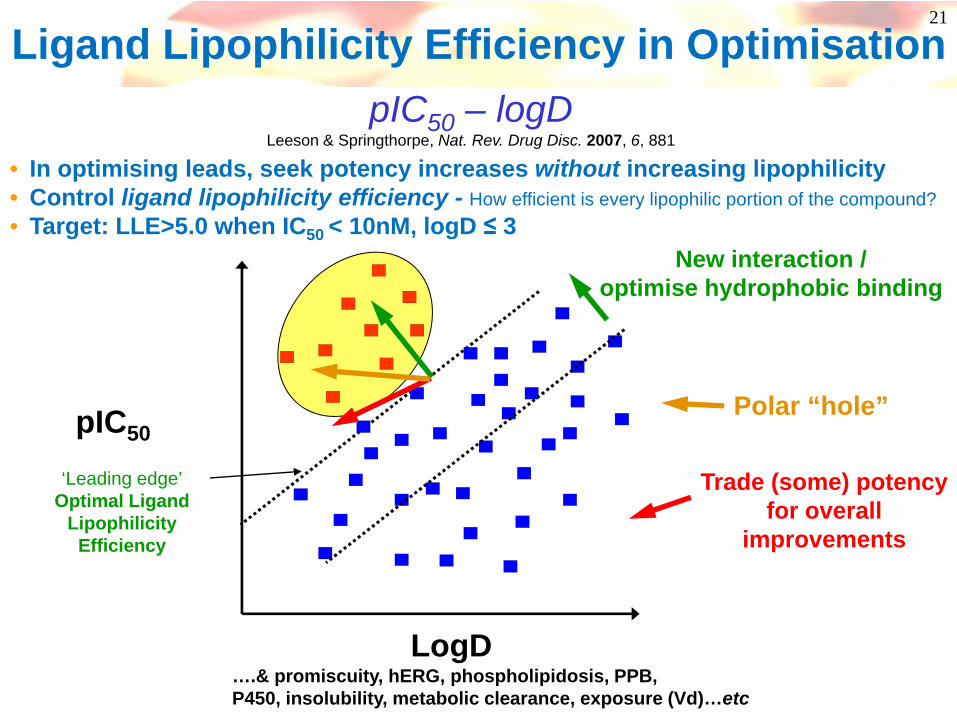
Ligand Lipophilicity Efficiency in Optimisation
….& promiscuity, hERG, phospholipidosis, PPB,P450, insolubility, metabolic clearance, exposure (Vd)…etc
‘Leading edge’Optimal Ligand
Lipophilicity Efficiency
LogD
pIC50
Trade (some) potencyfor overall
improvements
New interaction /optimise hydrophobic binding
Polar “hole”
pIC50 – logDLeeson & Springthorpe, Nat. Rev. Drug Disc. 2007, 6, 881
• In optimising leads, seek potency increases without increasing lipophilicity• Control ligand lipophilicity efficiency - How efficient is every lipophilic portion of the compound?• Target: LLE>5.0 when IC50 < 10nM, logD ≤ 3
21
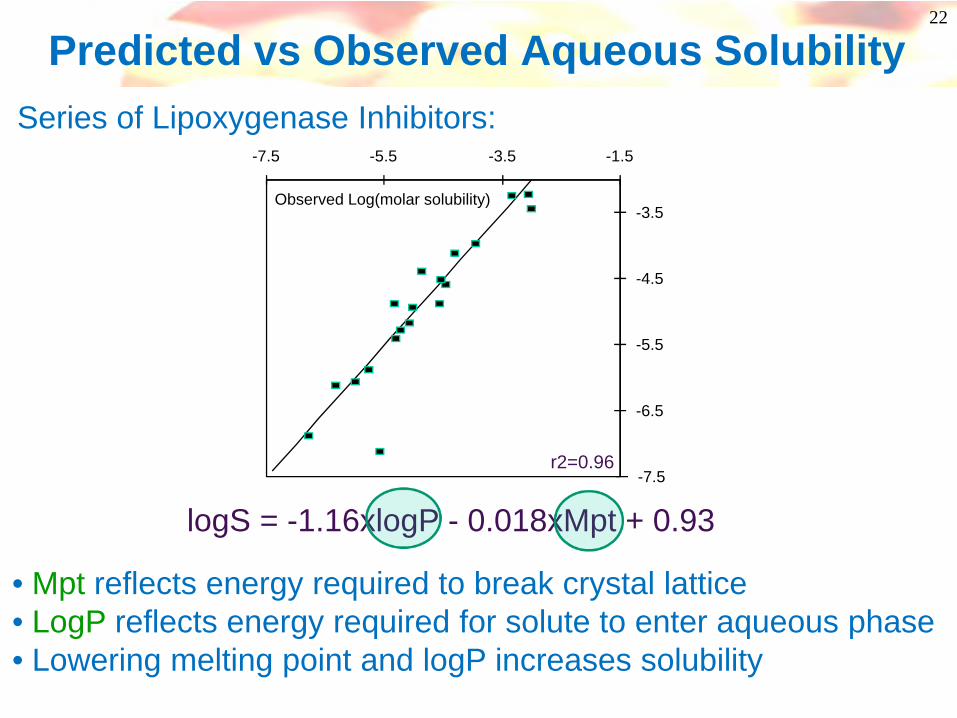
22
Predicted vs Observed Aqueous Solubility
-7.5
-6.5
-5.5
-4.5
-3.5
-7.5 -5.5 -3.5 -1.5
Observed Log(molar solubility)
logS = -1.16xlogP - 0.018xMpt + 0.93
• Mpt reflects energy required to break crystal lattice• LogP reflects energy required for solute to enter aqueous phase• Lowering melting point and logP increases solubility
r2=0.96
Series of Lipoxygenase Inhibitors:
23
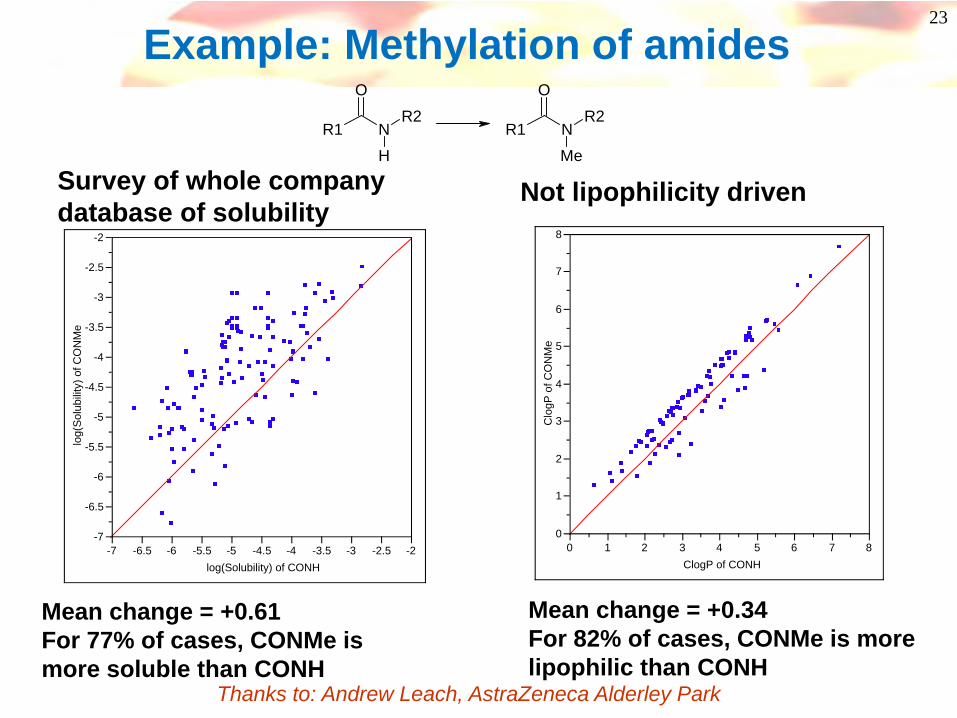
Example: Methylation of amides
Survey of whole company database of solubility
Mean change = +0.61For 77% of cases, CONMe is more soluble than CONH
-7
-6.5
-6
-5.5
-5
-4.5
-4
-3.5
-3
-2.5
-2
log(
Sol
ubili
ty) o
f CO
NM
e
-7 -6.5 -6 -5.5 -5 -4.5 -4 -3.5 -3 -2.5 -2log(Solubility) of CONH
0
1
2
3
4
5
6
7
8
Clo
gP o
f CO
NM
e0 1 2 3 4 5 6 7 8
ClogP of CONH
Not lipophilicity driven
Mean change = +0.34For 82% of cases, CONMe is more lipophilic than CONH
R1
O
NR2
HR1
O
NR2
Me
Thanks to: Andrew Leach, AstraZeneca Alderley Park
24
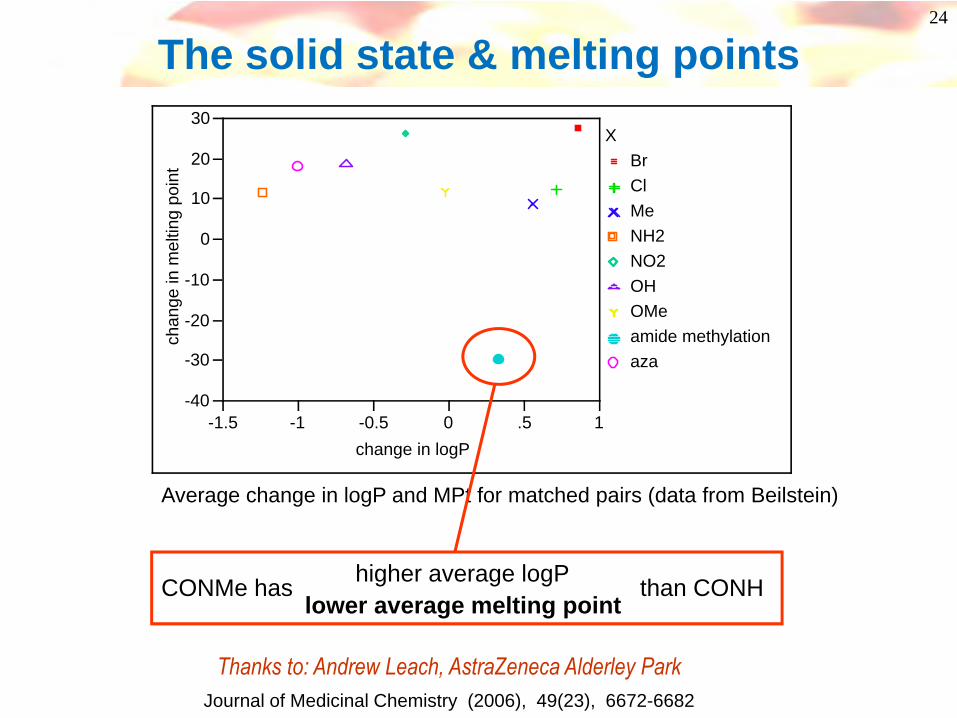
The solid state & melting points
-40
-30
-20
-10
0
10
20
30
chan
ge in
mel
ting
poin
t
-1.5 -1 -0.5 0 .5 1change in logP
BrClMeNH2NO2OHOMeamide methylationaza
X
Average change in logP and MPt for matched pairs (data from Beilstein)
CONMe has than CONHlower average melting point
higher average logP
Thanks to: Andrew Leach, AstraZeneca Alderley Park Journal of Medicinal Chemistry (2006), 49(23), 6672-6682
25
N
t-Bu OO
NNH
H O
i-Pr
Me
2.84
3.06
3.06 2.83
2.83
2.83
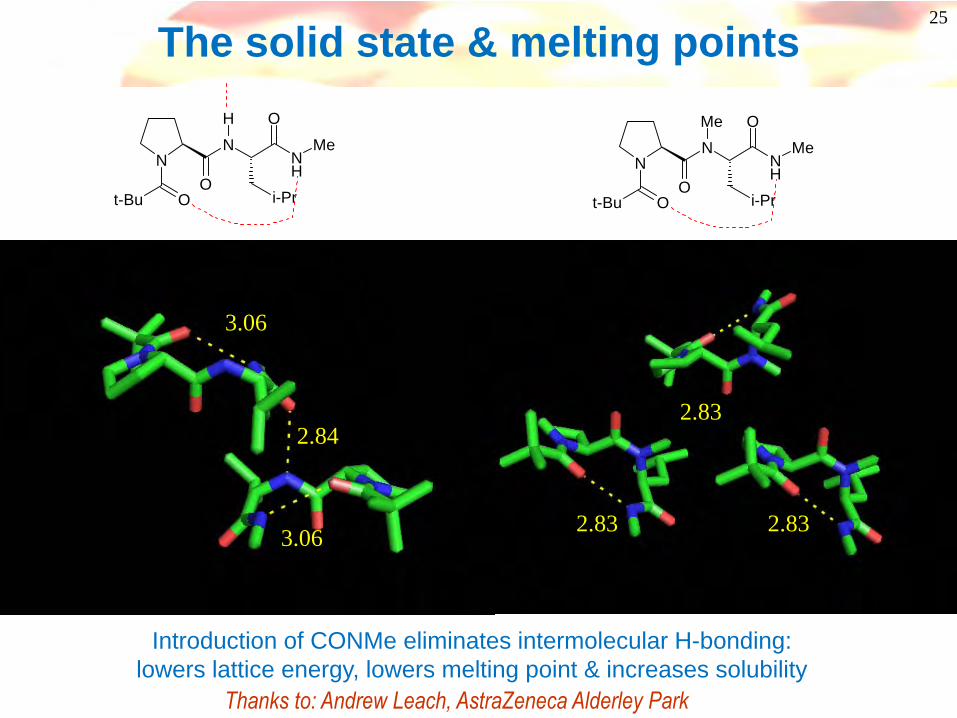
The solid state & melting points
N
t-Bu OO
NNH
Me O
i-Pr
Me
Introduction of CONMe eliminates intermolecular H-bonding:lowers lattice energy, lowers melting point & increases solubility
Thanks to: Andrew Leach, AstraZeneca Alderley Park

26
Absorption – sources of the problem
aq. soln.packed organics
lipid bi-layer Drug in blood Dissolving instomach/intestineStable pH 1-7
Crossing membranes(permeability)
efflux
•Solubility•Instability•Permeability•Efflux
Measure stability in GI fluids/range of pHs
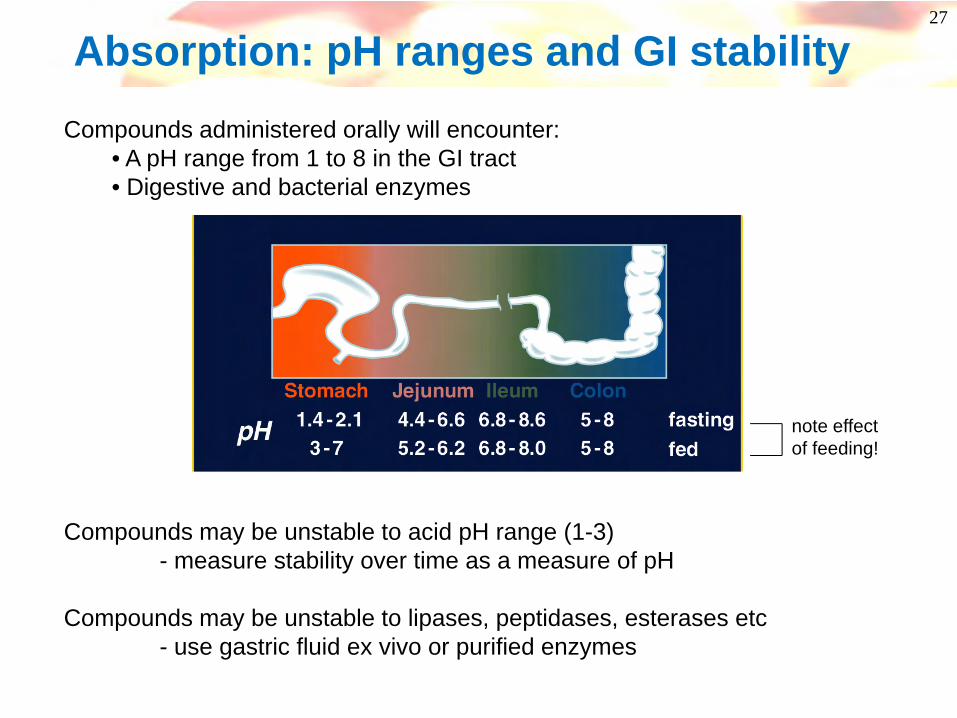
27
Compounds administered orally will encounter:• A pH range from 1 to 8 in the GI tract• Digestive and bacterial enzymes
Compounds may be unstable to acid pH range (1-3)- measure stability over time as a measure of pH
Compounds may be unstable to lipases, peptidases, esterases etc- use gastric fluid ex vivo or purified enzymes
note effect of feeding!
Absorption: pH ranges and GI stability
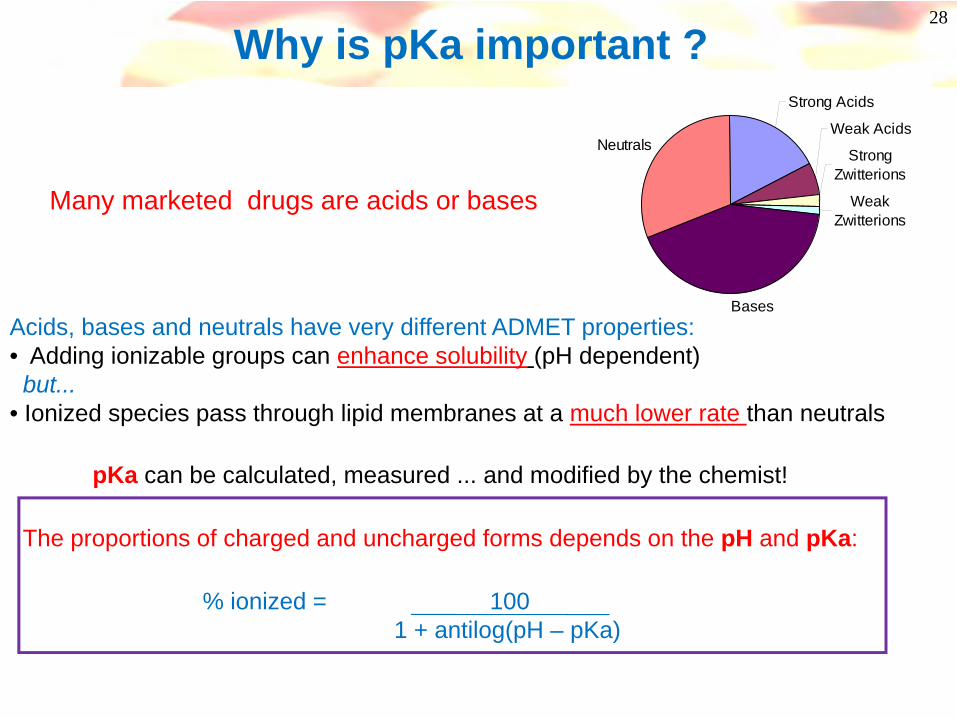
pKa can be calculated, measured ... and modified by the chemist!
The proportions of charged and uncharged forms depends on the pH and pKa:
% ionized = 1001 + antilog(pH – pKa)
Strong Acids
Weak Acids
Strong Zwitterions
Weak Zwitterions
Bases
Neutrals
28
Acids, bases and neutrals have very different ADMET properties:• Adding ionizable groups can enhance solubility (pH dependent)but...
• Ionized species pass through lipid membranes at a much lower rate than neutrals
Many marketed drugs are acids or bases
Why is pKa important ?
29
aq. soln.packed organics
lipid bi-layer Drug in blood
Crossing membranes(permeability)
efflux
•Solubility•Instability•Permeability•Efflux
Desolvation
Absorption – sources of the problem

30
Caco-2 cell system- High throughput method, widely used
- Monolayer of a human intestinal cell line(Caco-2) is grown on a filter support
- Transport is typically measured in Apical (‘A’)to Basolateral (‘B’) direction
-Best measure of passive transcellular transport
- Many reports of good correlations between Caco-2 cell permeability & in vivo absorption
Cell membrane permeability assays
cell monolayer
Basolateral chamber“Blood”
DRUGApical
chamber“Gut”
Other cell lines available(eg. Madin-Darby Canine Kidney (MDCK) epithelial cells)Journal of Pharmaceutical Sciences 1999, 88, 28-33
31
Permeability is also physical chemistry
What factors govern permeability?
32
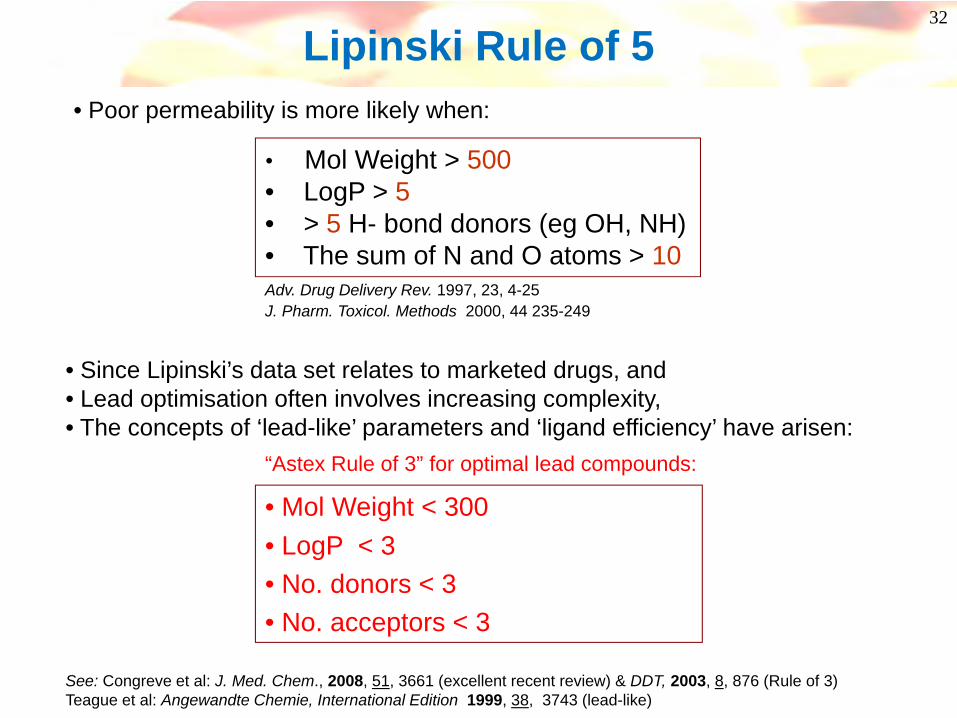
Lipinski Rule of 5
• Mol Weight > 500• LogP > 5• > 5 H- bond donors (eg OH, NH)• The sum of N and O atoms > 10
• Since Lipinski’s data set relates to marketed drugs, and• Lead optimisation often involves increasing complexity,• The concepts of ‘lead-like’ parameters and ‘ligand efficiency’ have arisen:
See: Congreve et al: J. Med. Chem., 2008, 51, 3661 (excellent recent review) & DDT, 2003, 8, 876 (Rule of 3)Teague et al: Angewandte Chemie, International Edition 1999, 38, 3743 (lead-like)
Adv. Drug Delivery Rev. 1997, 23, 4-25J. Pharm. Toxicol. Methods 2000, 44 235-249
• Mol Weight < 300• LogP < 3• No. donors < 3• No. acceptors < 3
• Poor permeability is more likely when:
“Astex Rule of 3” for optimal lead compounds:
Waring, M. J. Bioorg. Med. Chem. Lett. 2009, 19, 2844See also: Johnson, T.; Dress, K.R.; Edwards, M. Bioorg. Med. Chem. Lett. 2009, 19, 5560
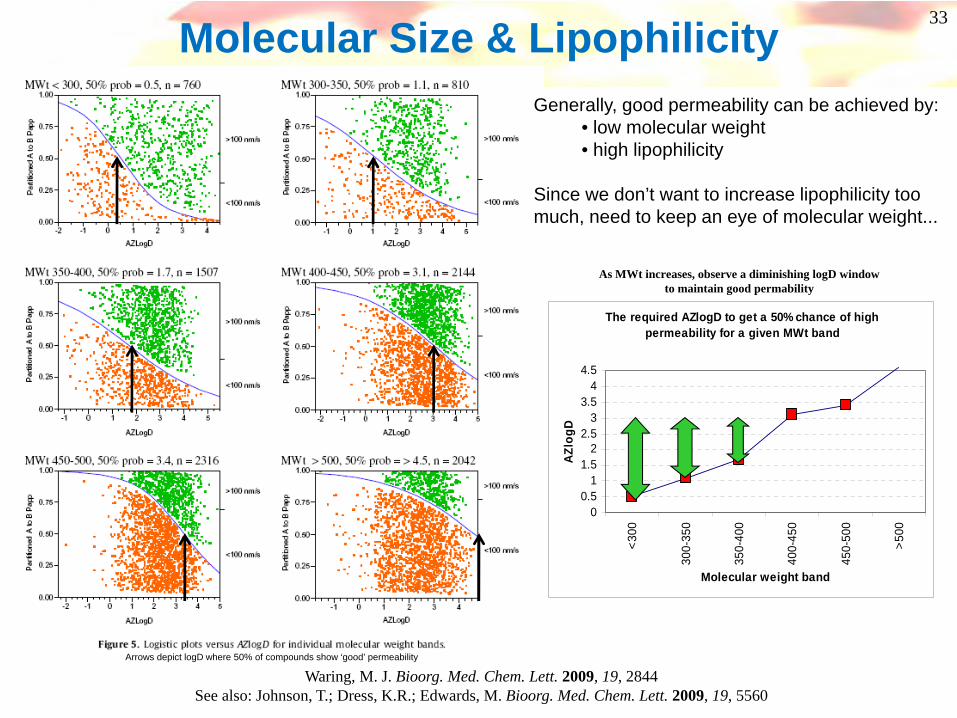
The required AZlogD to get a 50% chance of high permeability for a given MWt band
00.5
11.5
22.5
33.5
44.5
<300
300-
350
350-
400
400-
450
450-
500
>500
Molecular weight bandAZ
logD
As MWt increases, observe a diminishing logD window to maintain good permability
Molecular Size & LipophilicityGenerally, good permeability can be achieved by:
• low molecular weight• high lipophilicity
Since we don’t want to increase lipophilicity too much, need to keep an eye of molecular weight...
Arrows depict logD where 50% of compounds show ‘good’ permeability
33

Optimal Window & Development Compounds
• Development compounds often lie within optimal window – ‘Golden Triangle’• More polar compounds allowed by lower MWt• Does this lead to increased chance of success?
See also: Johnson, T.; Dress, K.R.; Edwards, M. Bioorg. Med. Chem. Lett. 2009, 19, 5560
34
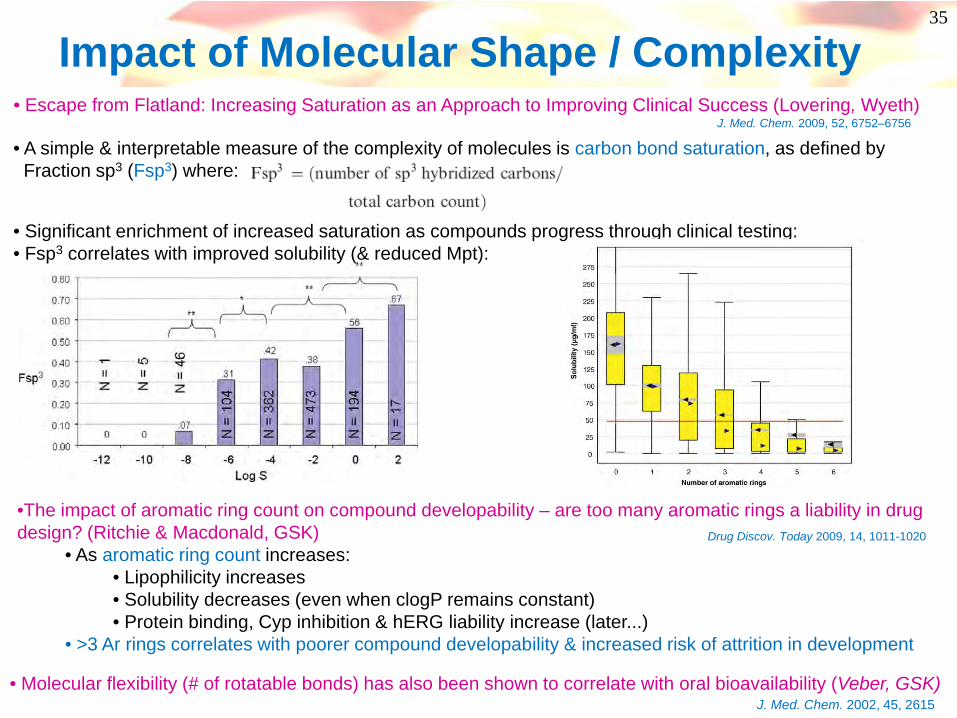
• A simple & interpretable measure of the complexity of molecules is carbon bond saturation, as defined by Fraction sp3 (Fsp3) where:
35
• Escape from Flatland: Increasing Saturation as an Approach to Improving Clinical Success (Lovering, Wyeth)J. Med. Chem. 2009, 52, 6752–6756
• Significant enrichment of increased saturation as compounds progress through clinical testing:• Fsp3 correlates with improved solubility (& reduced Mpt):
Impact of Molecular Shape / Complexity
•The impact of aromatic ring count on compound developability – are too many aromatic rings a liability in drug design? (Ritchie & Macdonald, GSK)
• As aromatic ring count increases:• Lipophilicity increases• Solubility decreases (even when clogP remains constant)• Protein binding, Cyp inhibition & hERG liability increase (later...)
• >3 Ar rings correlates with poorer compound developability & increased risk of attrition in development
Drug Discov. Today 2009, 14, 1011-1020
• Molecular flexibility (# of rotatable bonds) has also been shown to correlate with oral bioavailability (Veber, GSK)J. Med. Chem. 2002, 45, 2615
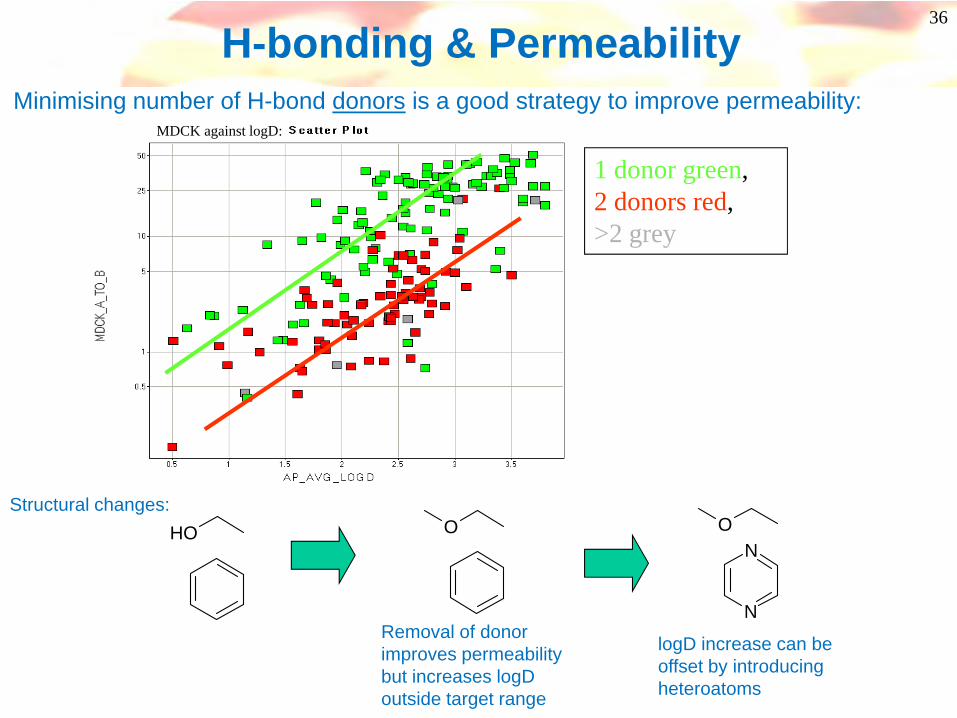
H-bonding & Permeability
1 donor green, 2 donors red, >2 grey
MDCK against logD:
OHStructural changes:
Removal of donor improves permeability but increases logD outside target range
O
logD increase can be offset by introducing heteroatoms
N
N
O
Minimising number of H-bond donors is a good strategy to improve permeability:
36
37
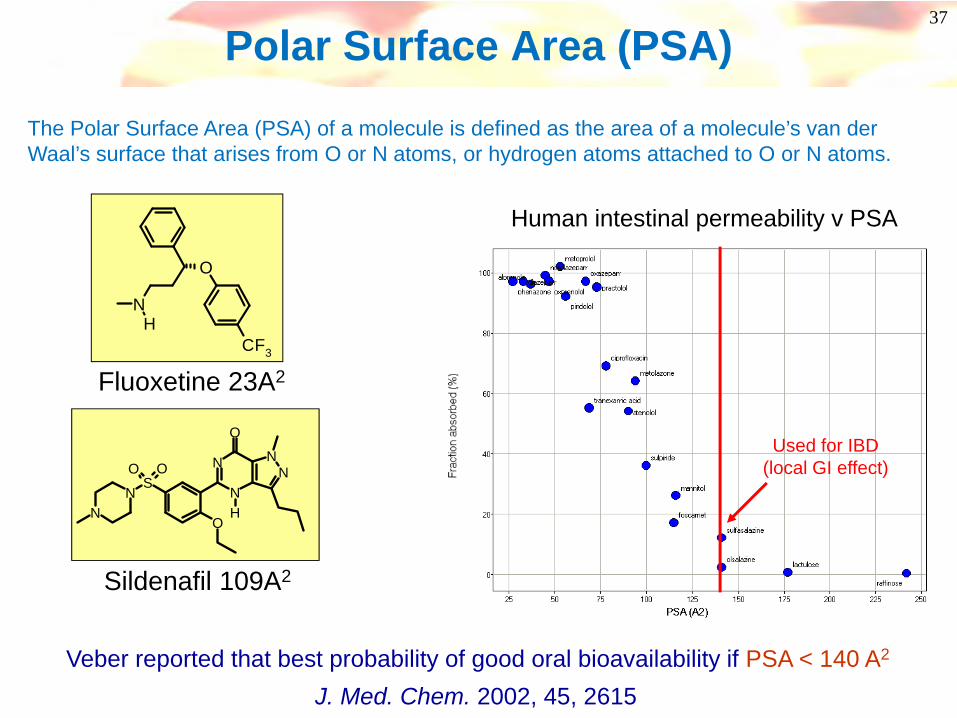
Polar Surface Area (PSA)
The Polar Surface Area (PSA) of a molecule is defined as the area of a molecule’s van der Waal’s surface that arises from O or N atoms, or hydrogen atoms attached to O or N atoms.
SOO
N
NN
N
O
O
NN H
Sildenafil 109A2
O
CF3
NH
Fluoxetine 23A2
Used for IBD (local GI effect)
Human intestinal permeability v PSA
Veber reported that best probability of good oral bioavailability if PSA < 140 A2
J. Med. Chem. 2002, 45, 2615
38
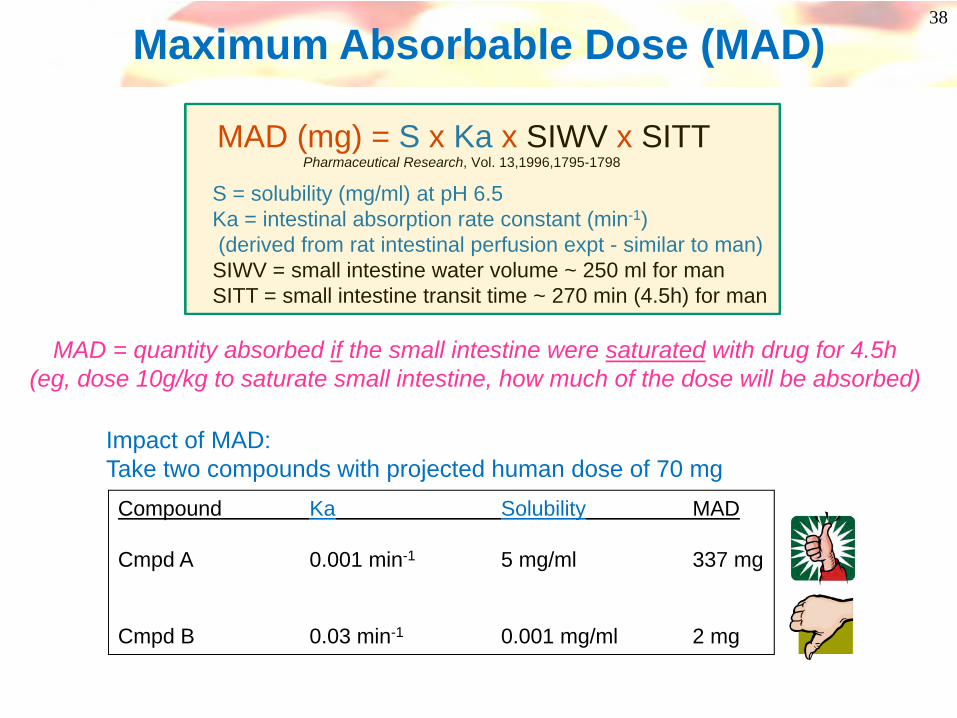
Maximum Absorbable Dose (MAD)
MAD (mg) = S x Ka x SIWV x SITT
S = solubility (mg/ml) at pH 6.5Ka = intestinal absorption rate constant (min-1)(derived from rat intestinal perfusion expt - similar to man)SIWV = small intestine water volume ~ 250 ml for manSITT = small intestine transit time ~ 270 min (4.5h) for man
Compound Ka Solubility MAD
Cmpd A 0.001 min-1 5 mg/ml 337 mg
Cmpd B 0.03 min-1 0.001 mg/ml 2 mg
Impact of MAD:Take two compounds with projected human dose of 70 mg
Pharmaceutical Research, Vol. 13,1996,1795-1798
MAD = quantity absorbed if the small intestine were saturated with drug for 4.5h(eg, dose 10g/kg to saturate small intestine, how much of the dose will be absorbed)

Balancing Solubility & Permeability
O
O
NH
O
N
F
F
MeO
CO2H
logD 1.4
39
Example of need to balance permeability & solubility to optimise in vivo exposure
S
NO
O
NH
O
F
F
MeO
logD 4.1PPB ↑, Soly ↓Solubility-limited exposure?
Want to remove acid functionality
S
NO
O
NH
O
MeO
MeO2S
NeutralsTarget logD range 2-3
Balance Soly & Absorption Excellent exposure
Combine
Combine
O
O
NH
O
NMeO
MeO2S
CO2H
logD –0.4PPB ↓, Soly ↑Absorption-limited exposure?
Sought toincrease solubility

40
Absorption – sources of the problem
aq. soln.packed organics
lipid bi-layer Drug in blood Dissolving instomach/intestineStable pH 1-7
Crossing membranes(permeability)
efflux
•Solubility•Instability•Permeability•Efflux
41
Active Transport
42
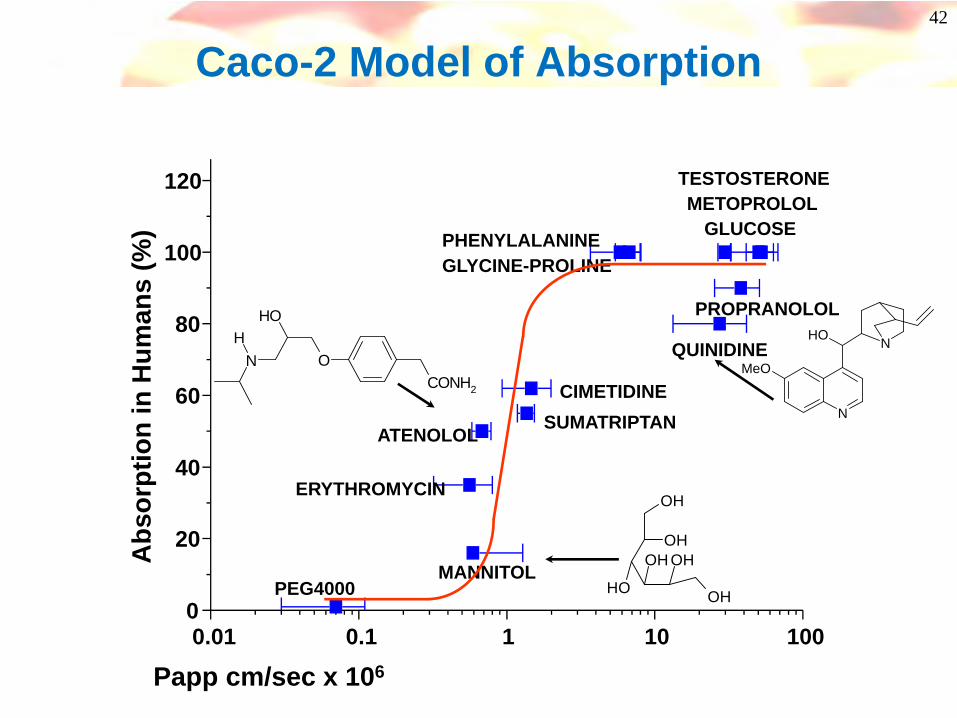
Caco-2 Model of Absorption
0.01 0.1 1 10 1000
20
40
60
80
100
120
PROPRANOLOL
TESTOSTERONEMETOPROLOL
GLUCOSE
QUINIDINE
PHENYLALANINEGLYCINE-PROLINE
CIMETIDINESUMATRIPTAN
ATENOLOL
ERYTHROMYCIN
MANNITOLPEG4000
Abs
orpt
ion
in H
uman
s (%
)
Papp cm/sec x 106
OH
OH
OH
OH OH
OH
CONH2
O
OH
NH N
N
MeO
OH
43
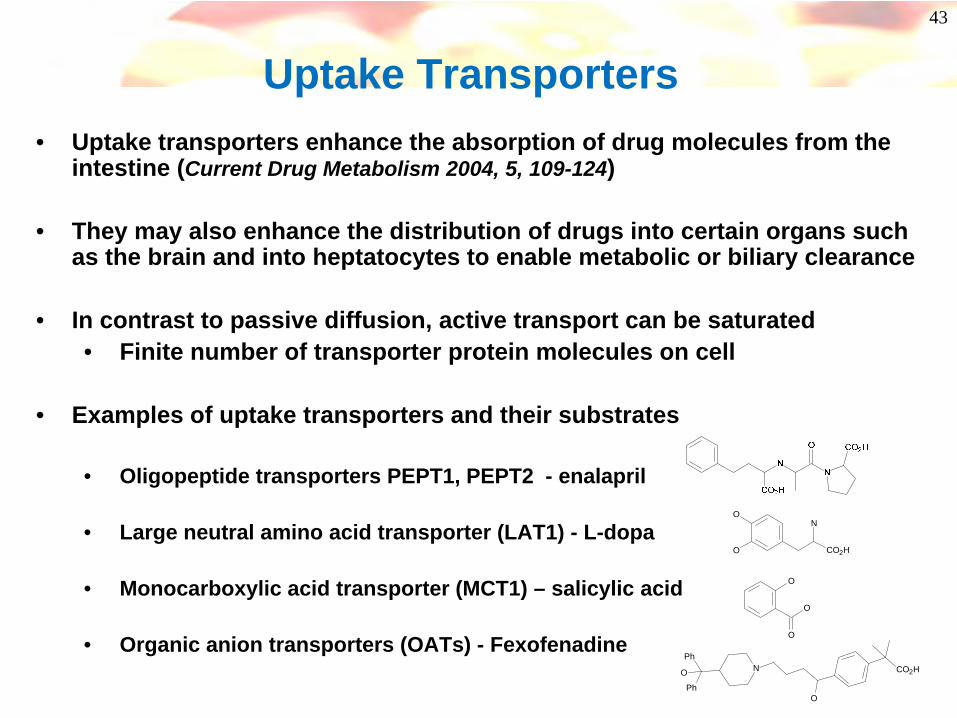
Uptake Transporters• Uptake transporters enhance the absorption of drug molecules from the
intestine (Current Drug Metabolism 2004, 5, 109-124)
• They may also enhance the distribution of drugs into certain organs such as the brain and into heptatocytes to enable metabolic or biliary clearance
• In contrast to passive diffusion, active transport can be saturated• Finite number of transporter protein molecules on cell
• Examples of uptake transporters and their substrates
• Oligopeptide transporters PEPT1, PEPT2 - enalapril
• Large neutral amino acid transporter (LAT1) - L-dopa
• Monocarboxylic acid transporter (MCT1) – salicylic acid
• Organic anion transporters (OATs) - Fexofenadine
N
O
O
CO2H
O
O
O
O
NO CO2HPh
Ph
44
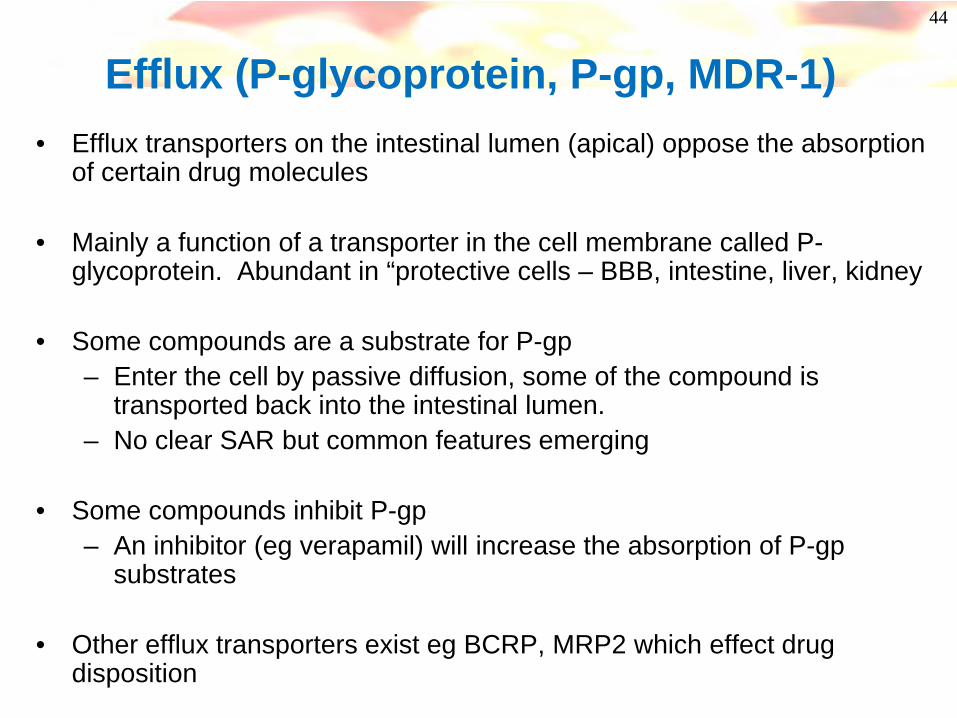
Efflux (P-glycoprotein, P-gp, MDR-1)• Efflux transporters on the intestinal lumen (apical) oppose the absorption
of certain drug molecules
• Mainly a function of a transporter in the cell membrane called P-glycoprotein. Abundant in “protective cells – BBB, intestine, liver, kidney
• Some compounds are a substrate for P-gp– Enter the cell by passive diffusion, some of the compound is
transported back into the intestinal lumen.– No clear SAR but common features emerging
• Some compounds inhibit P-gp– An inhibitor (eg verapamil) will increase the absorption of P-gp
substrates
• Other efflux transporters exist eg BCRP, MRP2 which effect drug disposition

45
Caco-2 cells - Transport Experiment(efflux measurement)
cell monolayer
Apical chamber
“Gut”
Basolateral chamber“Blood”
DRUG
If Papp B-A > A-B then efflux may be operating
46
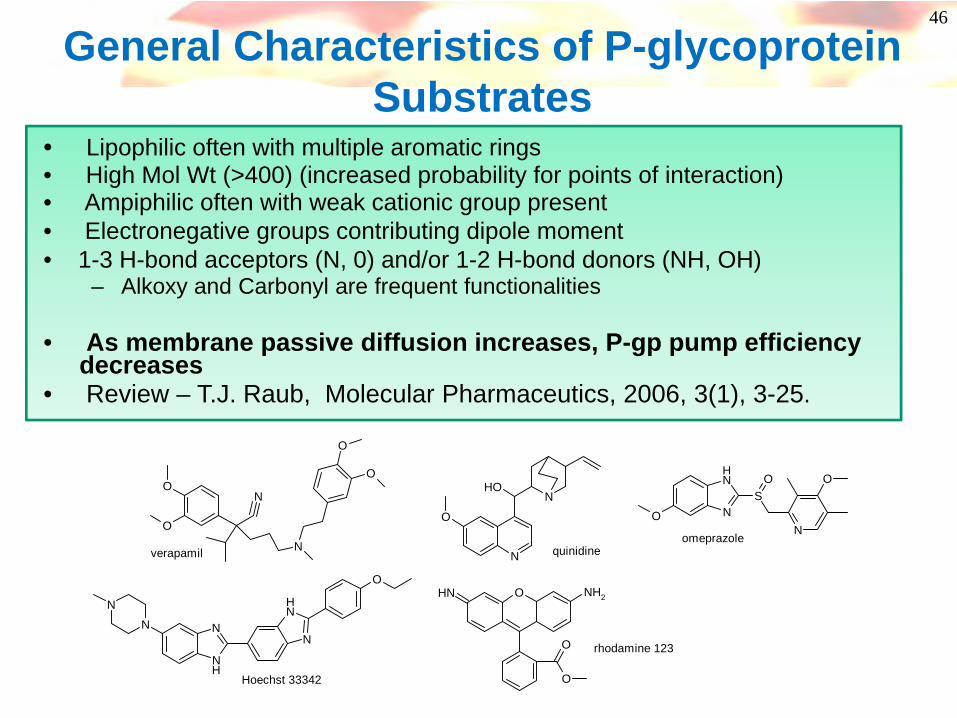
General Characteristics of P-glycoprotein Substrates
• Lipophilic often with multiple aromatic rings• High Mol Wt (>400) (increased probability for points of interaction)• Ampiphilic often with weak cationic group present• Electronegative groups contributing dipole moment• 1-3 H-bond acceptors (N, 0) and/or 1-2 H-bond donors (NH, OH)
– Alkoxy and Carbonyl are frequent functionalities
• As membrane passive diffusion increases, P-gp pump efficiency decreases
• Review – T.J. Raub, Molecular Pharmaceutics, 2006, 3(1), 3-25.
O
O
N
N
O
O
N
O
OHN
NH
NN
NH
O
N
N
N
NH
SO
N
O
O
O NH2
O
O
NH
verapamil quinidineomeprazole
Hoechst 33342
rhodamine 123

47
Pfizer NK2 Antagonists Journal of Medicinal Chemistry (2002),45(24),5365-5377.
NN
NN
ClCl
O
SNH2
O
O
UK-224,671NK2 pIC50 = 8.4
clogP = 2.2Mol weight = 545PSA = 98 A2, HBD = 2
Caco-2 %/h A-B/B-A = 1/18Rat %F < 20 P-gp KO mice > 20%
N
NN
ClCl
O
FFF
UK-290,795NK2 pIC50 = 9.4
clogP = 4.1Mol weight = 561PSA = 27 A2, HBD = 0
Caco-2 %/h A-B/B-A = >35/>35Rat %F > 80

48
Absorption – sources of the problem
aq. soln.packed organics
lipid bi-layer Drug in blood Dissolving instomach/intestineStable pH 1-7
Crossing membranes(permeability)
efflux
•Solubility•Instability•Permeability•Efflux
49
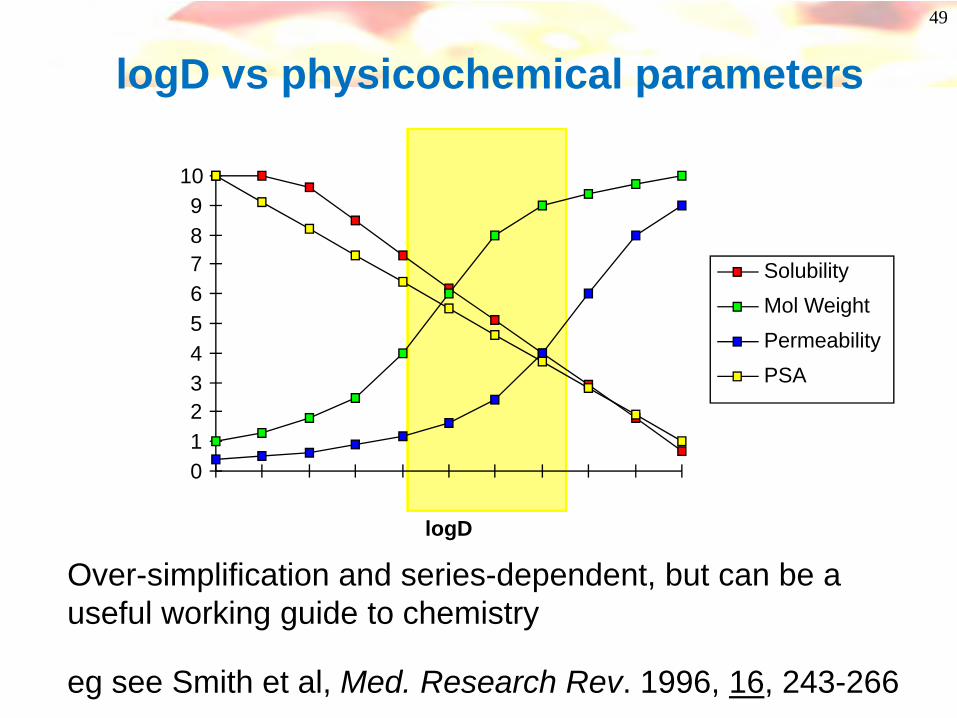
0123456789
10
logD
SolubilityMol WeightPermeabilityPSA
Over-simplification and series-dependent, but can be a useful working guide to chemistry
eg see Smith et al, Med. Research Rev. 1996, 16, 243-266
logD vs physicochemical parameters
50
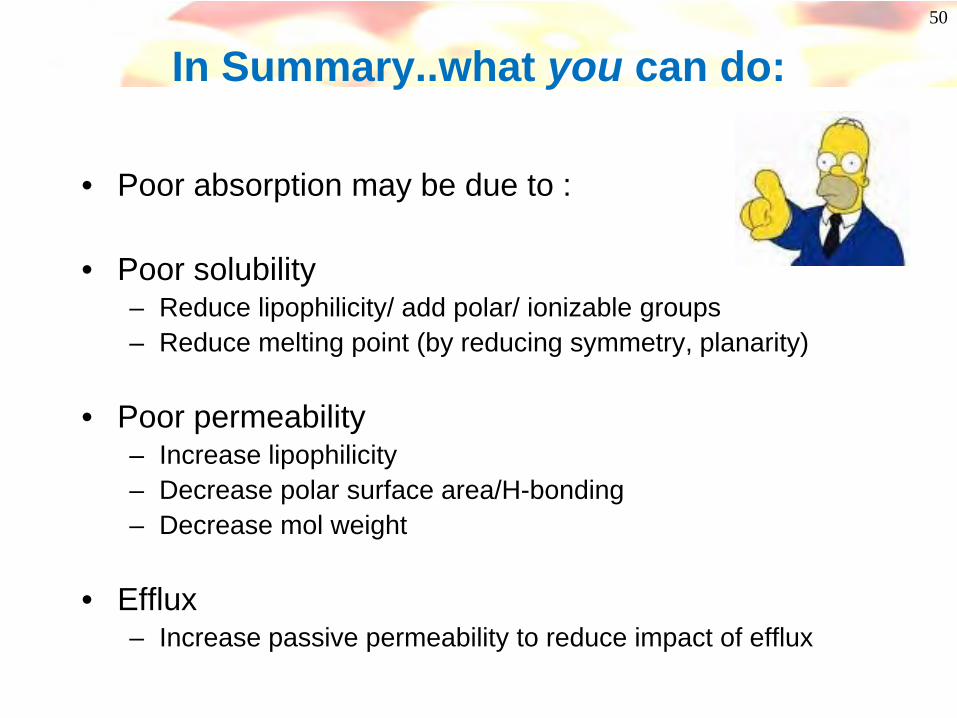
In Summary..what you can do:
• Poor absorption may be due to :
• Poor solubility– Reduce lipophilicity/ add polar/ ionizable groups– Reduce melting point (by reducing symmetry, planarity)
• Poor permeability– Increase lipophilicity– Decrease polar surface area/H-bonding– Decrease mol weight
• Efflux– Increase passive permeability to reduce impact of efflux
51
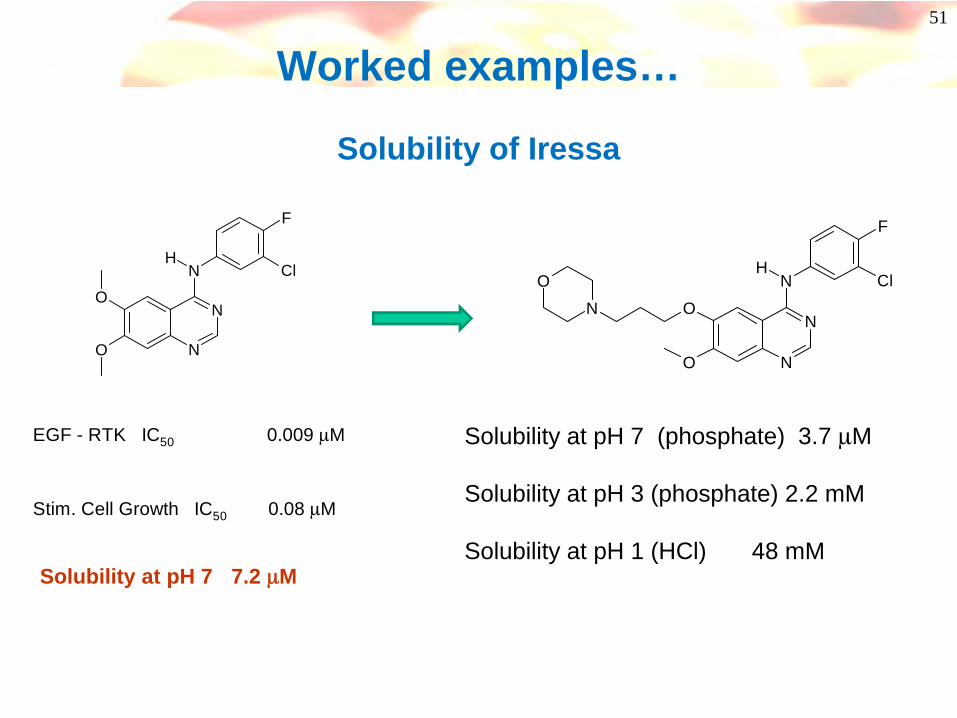
Worked examples…
Solubility of Iressa
N
N
NH
Cl
F
O
O
EGF - RTK IC50 0.009 μM
Stim. Cell Growth IC50 0.08 μM
N
N
NH
O
ONO Cl
F
Solubility at pH 7 (phosphate) 3.7 μM
Solubility at pH 3 (phosphate) 2.2 mM
Solubility at pH 1 (HCl) 48 mMSolubility at pH 7 7.2 μM
52
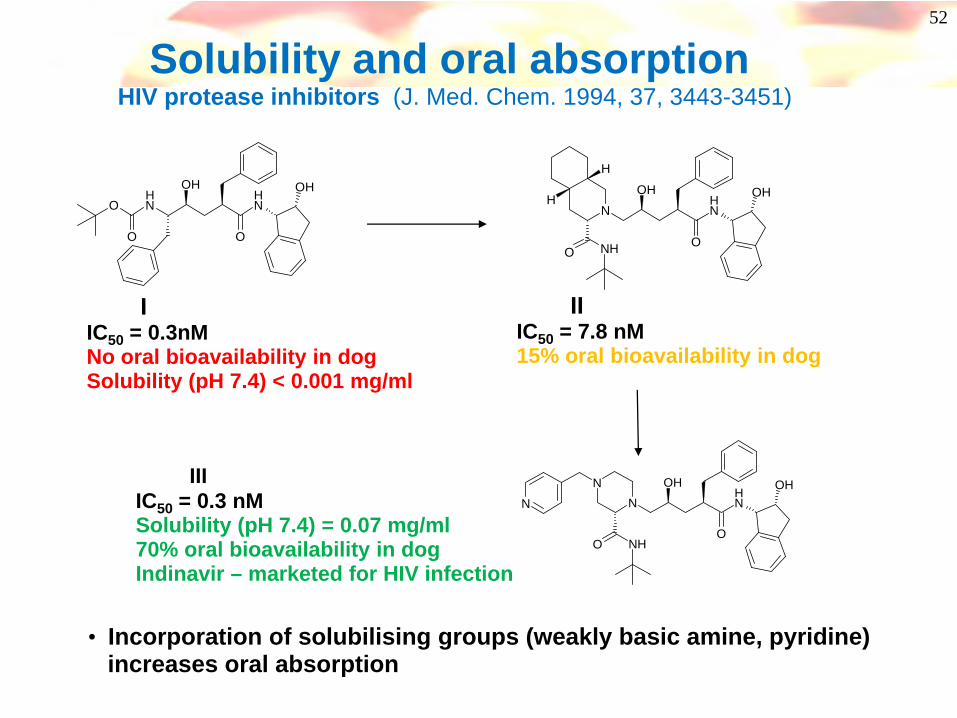
Solubility and oral absorption HIV protease inhibitors (J. Med. Chem. 1994, 37, 3443-3451)
O NH
NH
O
OH
O
OH
IIC50 = 0.3nMNo oral bioavailability in dogSolubility (pH 7.4) < 0.001 mg/ml
NH
OH
O
NN
N
NHO
OH
IIIC50 = 7.8 nM15% oral bioavailability in dog
N NH
OH
O
H
H
O
OH
NH
IIIIC50 = 0.3 nMSolubility (pH 7.4) = 0.07 mg/ml70% oral bioavailability in dogIndinavir – marketed for HIV infection
• Incorporation of solubilising groups (weakly basic amine, pyridine) increases oral absorption
53
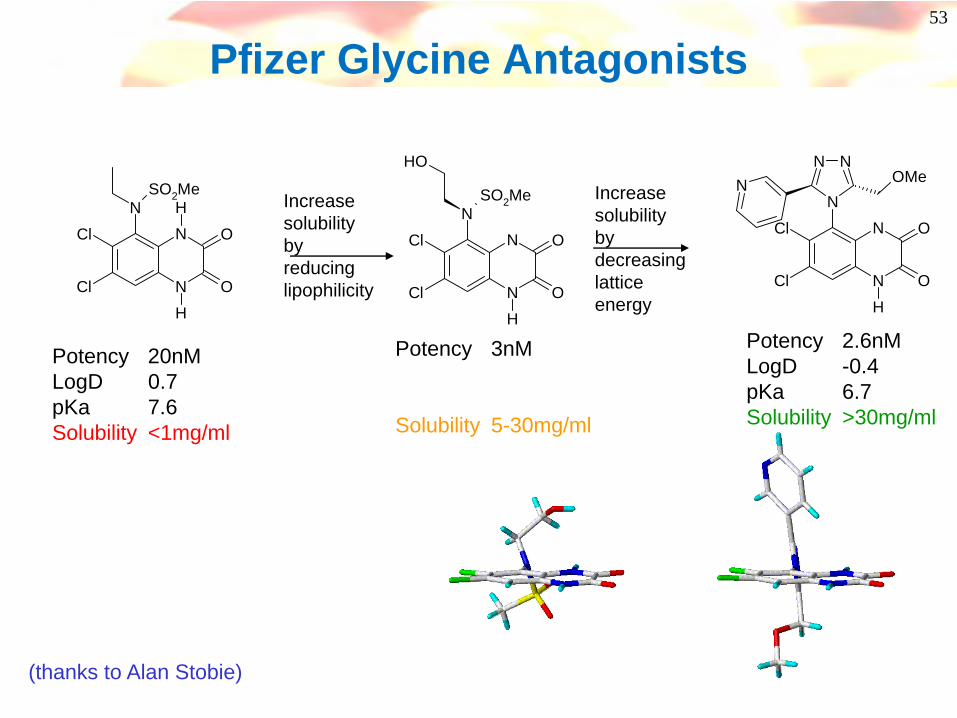
Pfizer Glycine Antagonists
Cl
Cl N
NN H
H
O
O
SO2Me
Potency 20nMLogD 0.7pKa 7.6Solubility <1mg/ml
Cl
Cl N
NN
H
O
O
SO2Me
OH
Potency 3nM
Solubility 5-30mg/ml
Increase solubility by reducing lipophilicity
Increase solubility by decreasing lattice energy
Cl
Cl N
NN
H
O
O
NNN OMe
Potency 2.6nMLogD -0.4pKa 6.7Solubility >30mg/ml
(thanks to Alan Stobie)
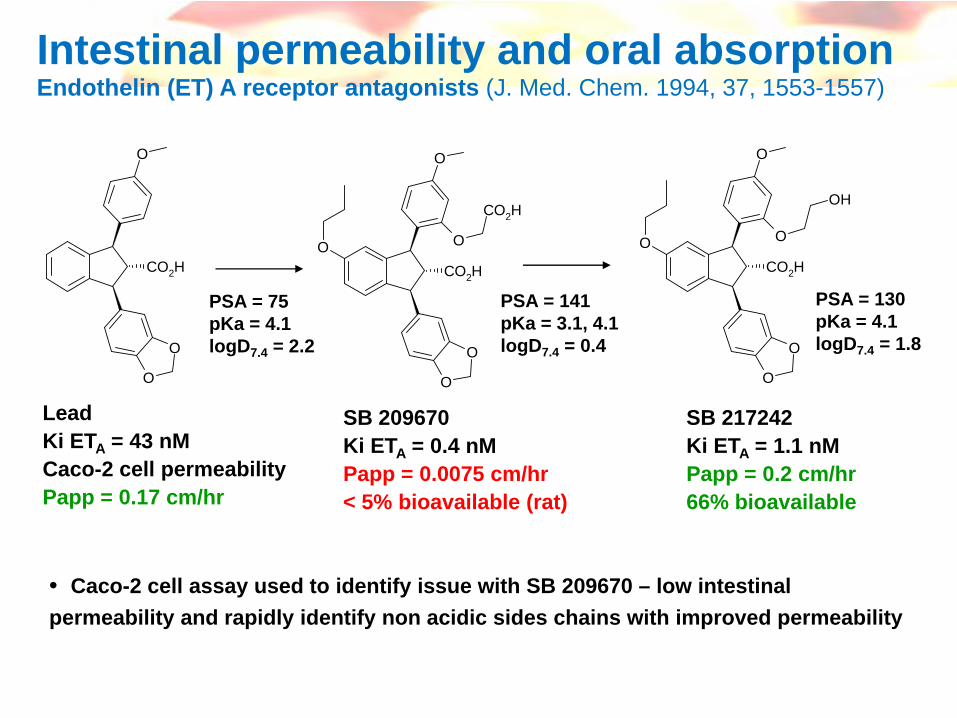
Intestinal permeability and oral absorptionEndothelin (ET) A receptor antagonists (J. Med. Chem. 1994, 37, 1553-1557)
CO2H
O
O
O
LeadKi ETA = 43 nMCaco-2 cell permeabilityPapp = 0.17 cm/hr
CO2H
O
O
O
O O
CO2H
CO2H
O
O
O
O O
OH
SB 209670Ki ETA = 0.4 nMPapp = 0.0075 cm/hr< 5% bioavailable (rat)
SB 217242Ki ETA = 1.1 nMPapp = 0.2 cm/hr66% bioavailable
• Caco-2 cell assay used to identify issue with SB 209670 – low intestinal permeability and rapidly identify non acidic sides chains with improved permeability
PSA = 75pKa = 4.1logD7.4 = 2.2
PSA = 141pKa = 3.1, 4.1logD7.4 = 0.4
PSA = 130pKa = 4.1logD7.4 = 1.8

55
VLA4 Antagonists
N
O
O O
N
ON
O O
O
N
O
NN
OPotent VLA4 antagonistclogP 3.6MW 708PSA 222Administered topically
N OO
O
O
O
N
O
ONN
O
clogP 3.9MW 618PSA 174Caco Papp <1
N
O
OO
O
O
NN
clogP 5.9MW 521PSA 120Caco Papp 4-8Rat Bioavailability 44%

56
And you thought getting from the gut to the blood was a challenge…think some more…
Distribution
BBB

57
What is the BBB?• Blood Brain Barrier is the interface between blood vessels and brain cells
• Protective lipid membrane with tight cellular junctions
• Polar, hydrophilic molecules are prevented from entering CNS
• Active transport does operate eg for peptides, amino acids, glucose, fatty acids
• Efflux pumps (eg P-gp) acts to keep “foreign” drug molecules out of CNS
• BBB has some metabolic capacity
• Main route of CNS drug penetration is by passive diffusion
Distribution to Site of ActionBlood Brain Barrier and CNS Penetration

58
Blood Brain Barrier PenetrationFeatures of CNS drugs
• Mol Weight < 400
• logP/ logD 2 – 4 (optimum ~ 2)Strong correlation of logD and passive permeability to BBB penetration
• PSA < 60-90 Å2
• pKa - optimum pKa range is 7.5 – 10.5
• H-bond donors 0 - 1
• Few CNS drugs are P-gp substrates - harder to achieve saturating concentrations in plasma.
PSA range for 776 oral CNS drugs thatreached phase 2 efficacy studies
Journal of Medicinal Chemistry, 2006, 49, 26, 7559
59
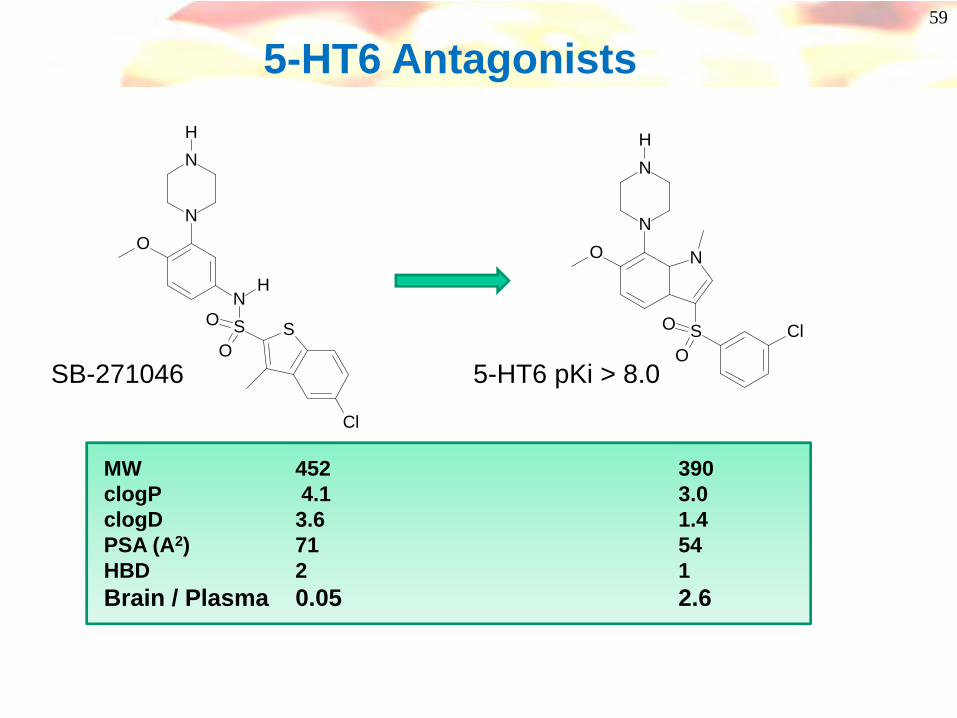
5-HT6 Antagonists
NH
S S
Cl
O
O
N
NH
ON
S ClO
O
N
NH
O
SB-271046 5-HT6 pKi > 8.0
MW 452 390clogP 4.1 3.0clogD 3.6 1.4PSA (A2) 71 54HBD 2 1Brain / Plasma 0.05 2.6
60
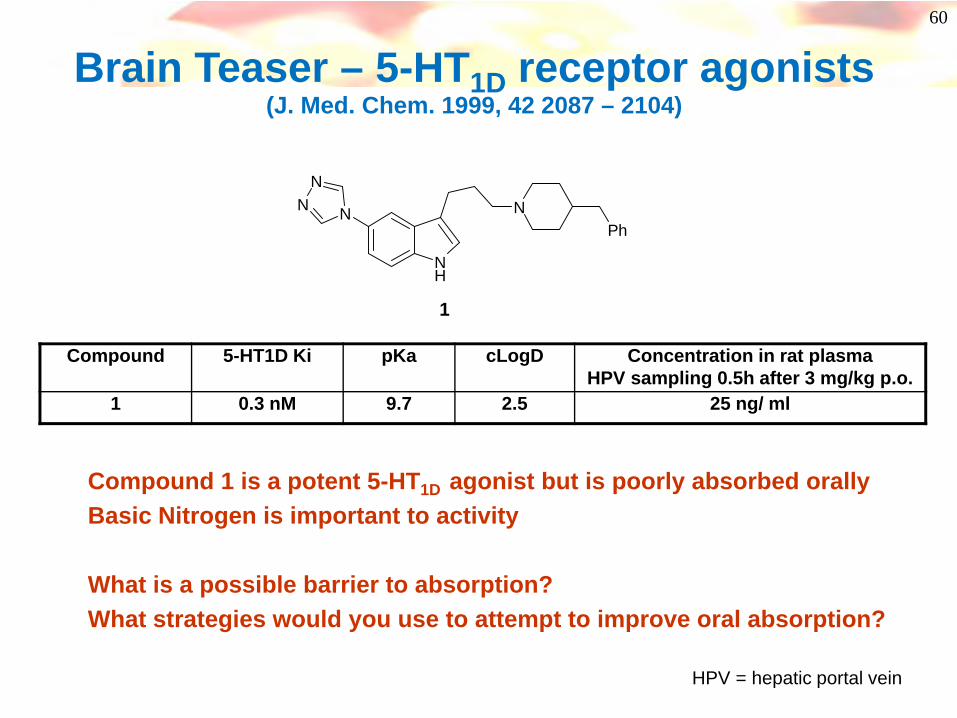
Brain Teaser – 5-HT1D receptor agonists (J. Med. Chem. 1999, 42 2087 – 2104)
N
NN
NH
NPh
1
Compound 5-HT1D Ki pKa cLogD Concentration in rat plasma HPV sampling 0.5h after 3 mg/kg p.o.
1 0.3 nM 9.7 2.5 25 ng/ ml
Compound 1 is a potent 5-HT1D agonist but is poorly absorbed orallyBasic Nitrogen is important to activity
What is a possible barrier to absorption?What strategies would you use to attempt to improve oral absorption?
HPV = hepatic portal vein

61
Coffee Break
62
N
NN
NH
NPh
O
NPh
N
NN
NH
O
N
NN
NH
N NPh
A B
C
Which one would you make……………?
63
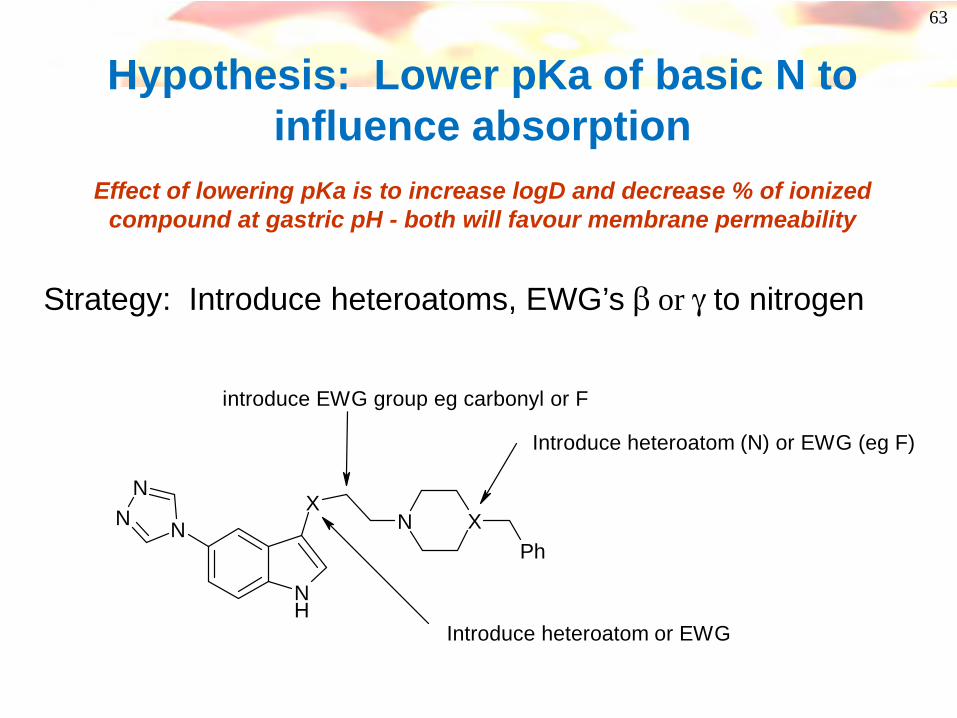
N
NN
NH
XN X
Ph
Introduce heteroatom (N) or EWG (eg F)
introduce EWG group eg carbonyl or F
Introduce heteroatom or EWG
Hypothesis: Lower pKa of basic N to influence absorption
Effect of lowering pKa is to increase logD and decrease % of ionized compound at gastric pH - both will favour membrane permeability
Strategy: Introduce heteroatoms, EWG’s β or γ to nitrogen

64
What was tried…….
N
NN
NH
N XPh N
NN
NH
NPh
FR
1 : X = CH2 : X = CF
3 : R = H4: R = F
Compound 5-HT1D Ki pKa cLogD Concentration in rat plasma HPV sampling 0.5h after
3 mg/kg p.o.1 0.3 nM 9.7 2.5 25 ng/ ml2 0.9 nM 8.8 3.5 570 ng /ml3 0.9 nM 8.7 3.5 781 ng/ ml4 78 nM 6.7 4.7 ND
• Lowering pKa improves permeability and oral absorption • Fluorine atoms have minimal steric influence on structure• NB: fluoropiperidines are possibly toxic but any heteroatom β or γ to a nitrogen will lower pKa

65
But…….
N
NN
NH
NPh
R
Concentration in rat plasma 0.5h after 3 mg/kg p.o.
Compound 5-HT1D Ki pKa cLogD HPV sampling systemic (cardiac) sampling
1 0.3 nM 9.7 2.5 25 ng/ ml < 2 ng/ ml3 0.9 nM 8.7 3.5 781 ng/ ml 196 ng/ ml
1 : R = H3 : R = F
Increase in lipophilicity leads to extensive first pass metabolism- lower than expected systemic exposure……………………
66
Metabolism

67
Metabolism and ClearanceHow do you know you have a problem?
Time after dose (h)
Plas
ma
conc
entra
tion
(ng/
ml)
Compound A iv bolus injection 1 mg/kg• Low plasma exposure (area under curve AUC)• Drug disappears rapidly from plasma
Compound A oral dose (po) 10 mg/kg – jugular vein detection• Low plasma exposure (AUC)• Extensive first pass metabolism
Compound has a short T1/2 (half life)Short durationMay require high or multiple dosing to see a biological effect
68
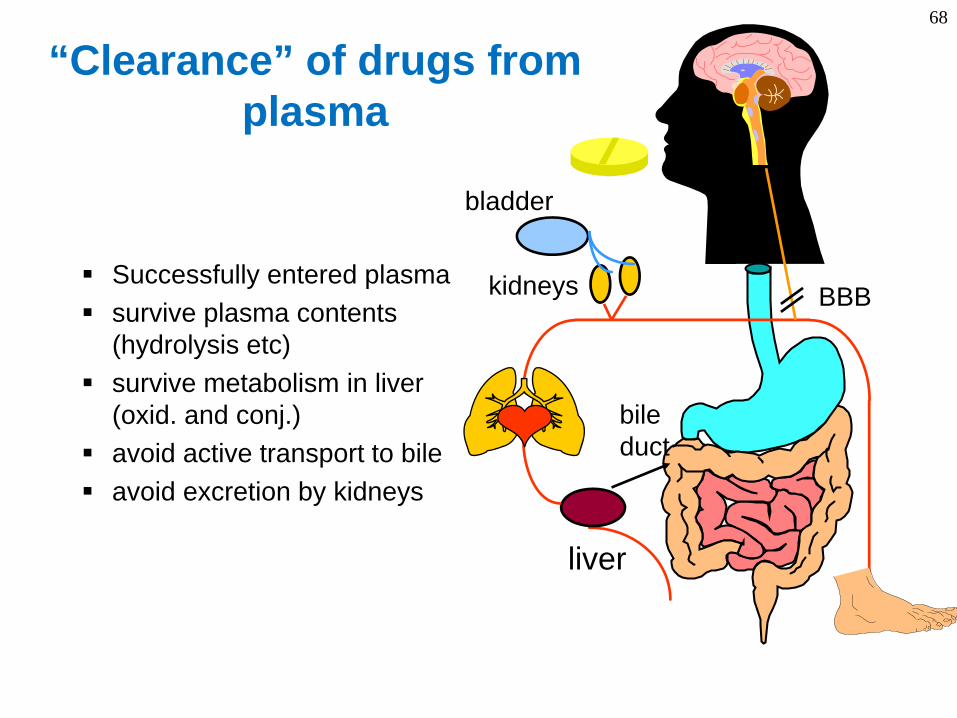
“Clearance” of drugs from plasma
liver
bileduct
kidneys
bladder
BBBSuccessfully entered plasmasurvive plasma contents (hydrolysis etc)survive metabolism in liver (oxid. and conj.)avoid active transport to bileavoid excretion by kidneys
69
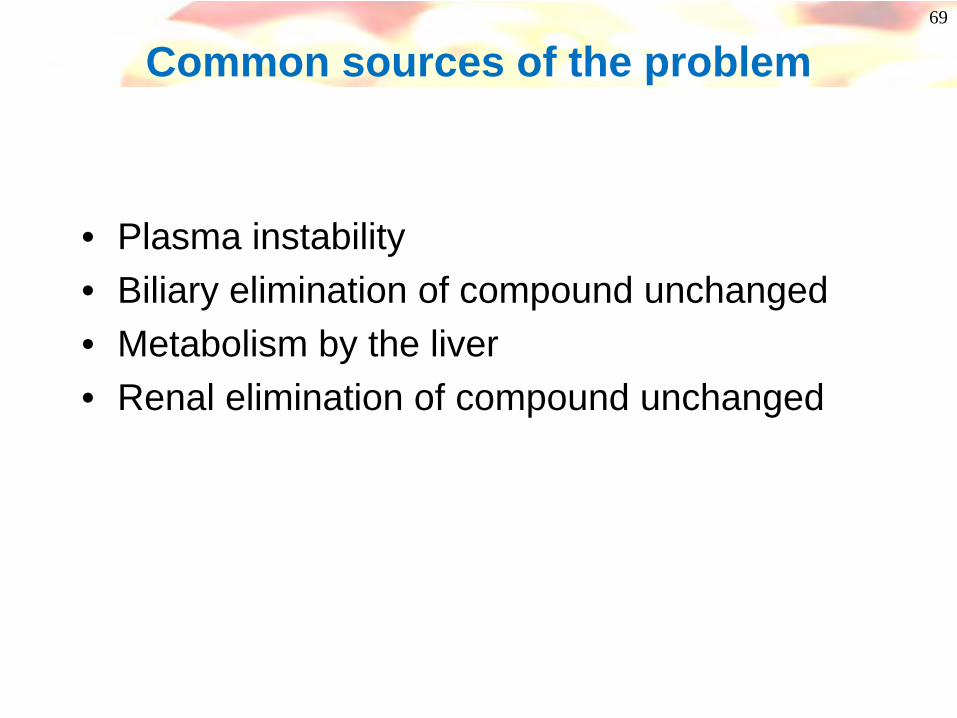
Common sources of the problem
• Plasma instability• Biliary elimination of compound unchanged• Metabolism by the liver• Renal elimination of compound unchanged
70
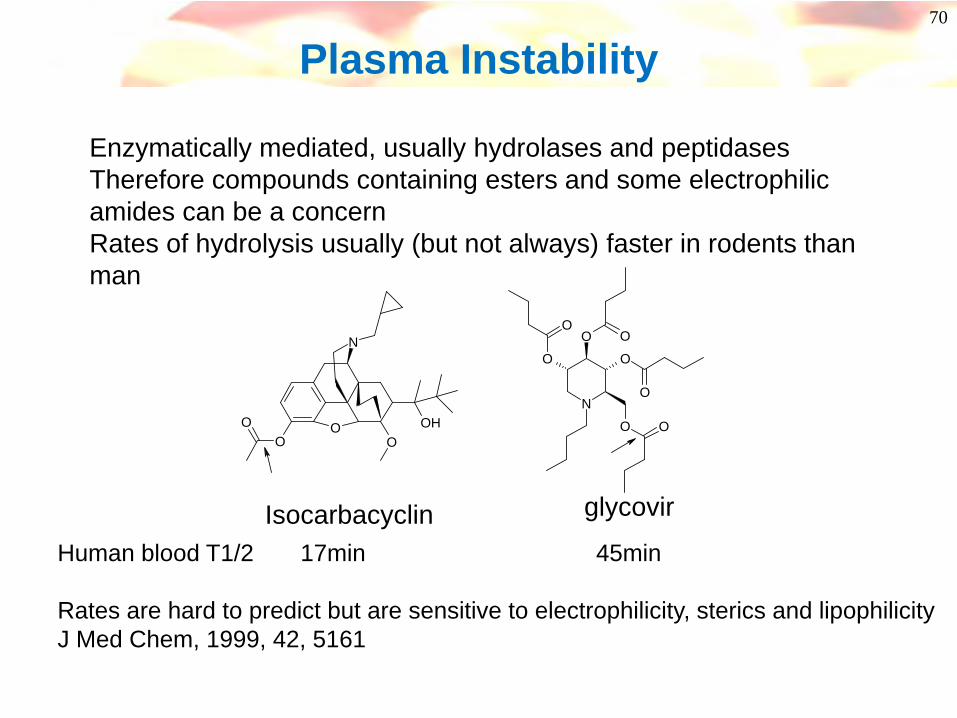
Plasma Instability
Enzymatically mediated, usually hydrolases and peptidasesTherefore compounds containing esters and some electrophilic amides can be a concernRates of hydrolysis usually (but not always) faster in rodents than man
OO
OO
OH
N
N
O
O O
O O
O
OO
Isocarbacyclin glycovir
Human blood T1/2 17min 45min
Rates are hard to predict but are sensitive to electrophilicity, sterics and lipophilicityJ Med Chem, 1999, 42, 5161
71
Clearance by the Liver
Plumbing and liver physiology
Clearance - an important concept
72
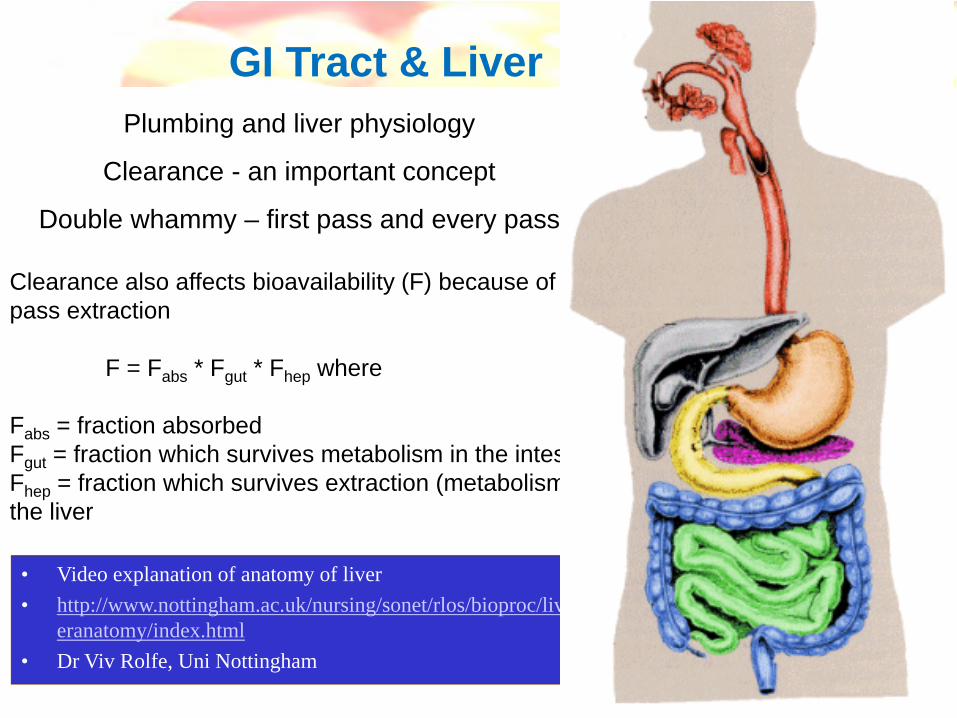
GI Tract & Liver
• Video explanation of anatomy of liver• http://www.nottingham.ac.uk/nursing/sonet/rlos/bioproc/liv
eranatomy/index.html• Dr Viv Rolfe, Uni Nottingham
Plumbing and liver physiology
Clearance - an important concept
Double whammy – first pass and every pass
Clearance also affects bioavailability (F) because of first pass extraction
F = Fabs * Fgut * Fhep where
Fabs = fraction absorbedFgut = fraction which survives metabolism in the intestineFhep = fraction which survives extraction (metabolism) by the liver
73
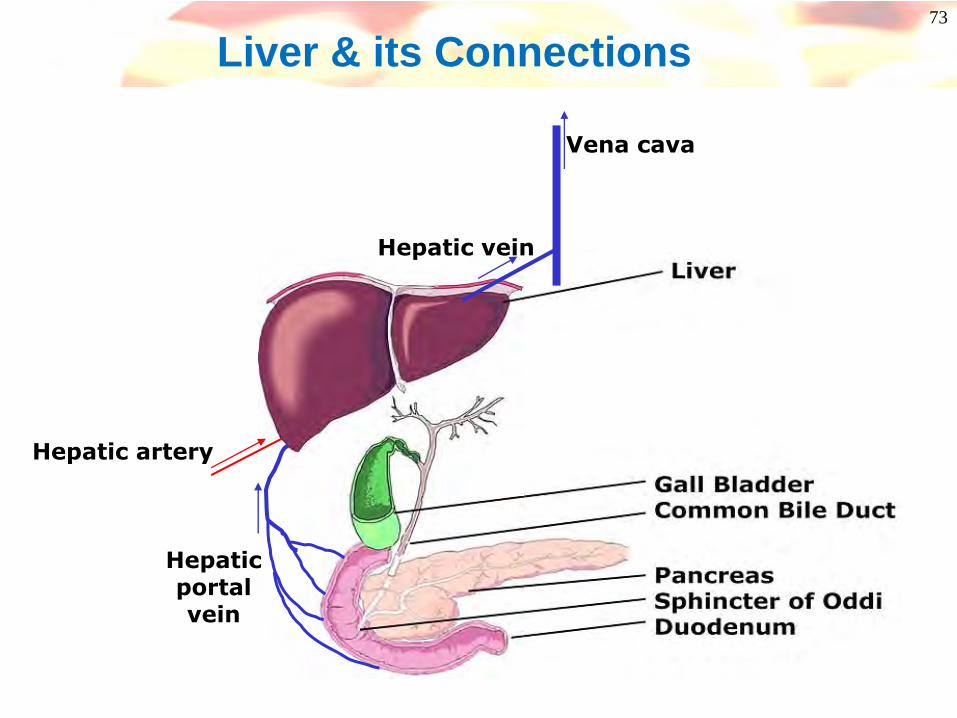
Liver & its Connections
Hepaticportalvein
Hepatic artery
Hepatic vein
Vena cava
74
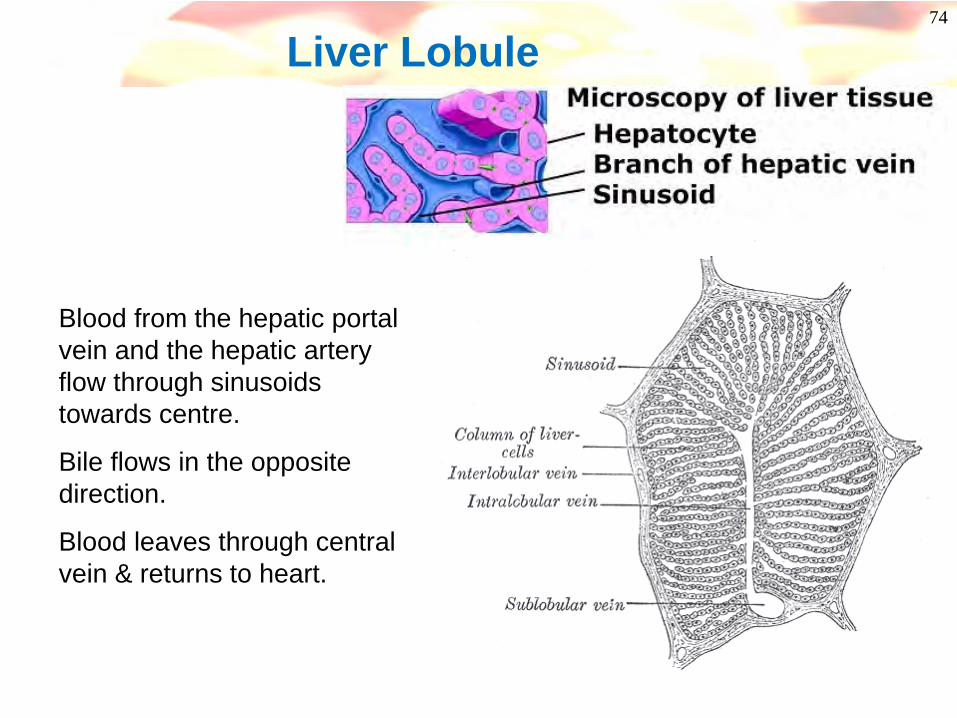
Liver Lobule
Blood from the hepatic portal vein and the hepatic artery flow through sinusoids towards centre.
Bile flows in the opposite direction.
Blood leaves through central vein & returns to heart.

75Liver Histology
76
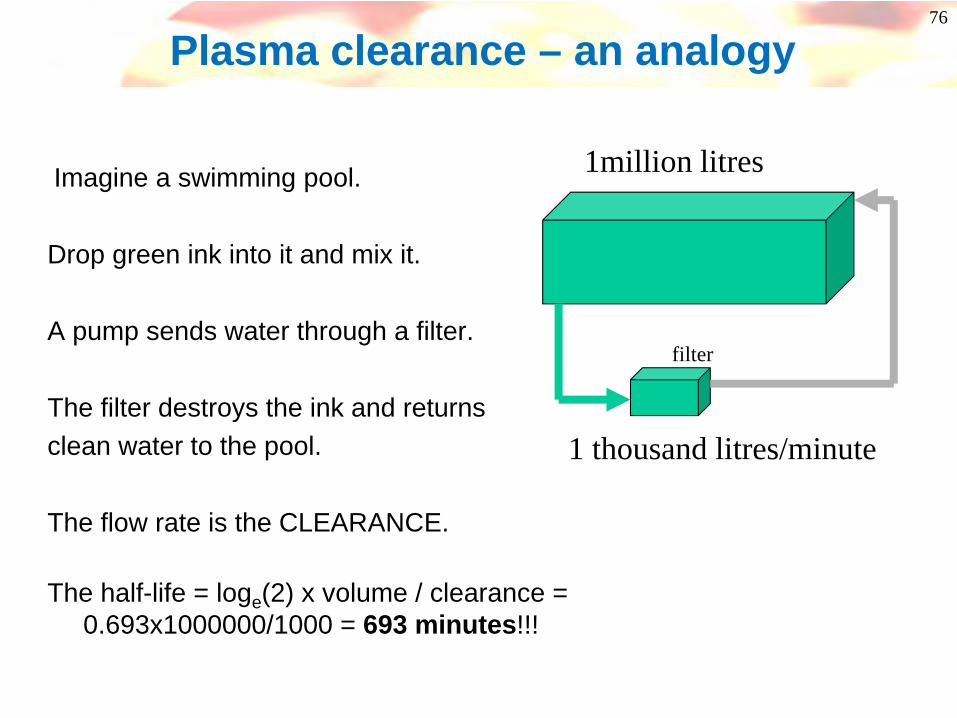
Plasma clearance – an analogy
1million litres
1 thousand litres/minute
filter
Imagine a swimming pool.
Drop green ink into it and mix it.
A pump sends water through a filter.
The filter destroys the ink and returnsclean water to the pool.
The flow rate is the CLEARANCE.
The half-life = loge(2) x volume / clearance = 0.693x1000000/1000 = 693 minutes!!!
77
Plasma clearance – an analogy
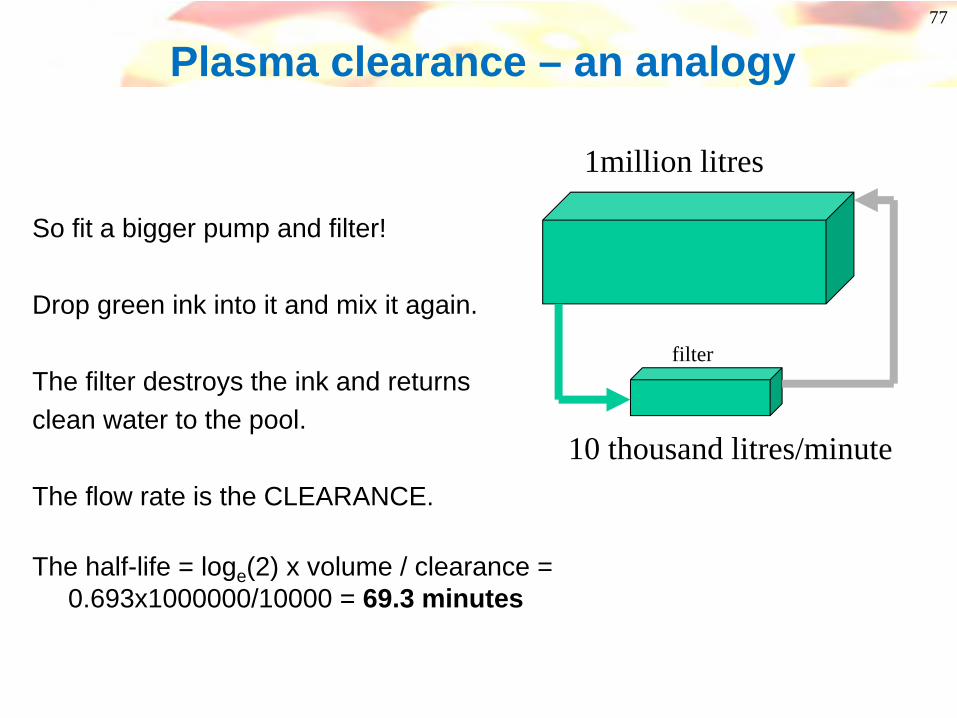
1million litres
10 thousand litres/minute
filter
So fit a bigger pump and filter!
Drop green ink into it and mix it again.
The filter destroys the ink and returnsclean water to the pool.
The flow rate is the CLEARANCE.
The half-life = loge(2) x volume / clearance = 0.693x1000000/10000 = 69.3 minutes
78
Plasma clearance – an analogy
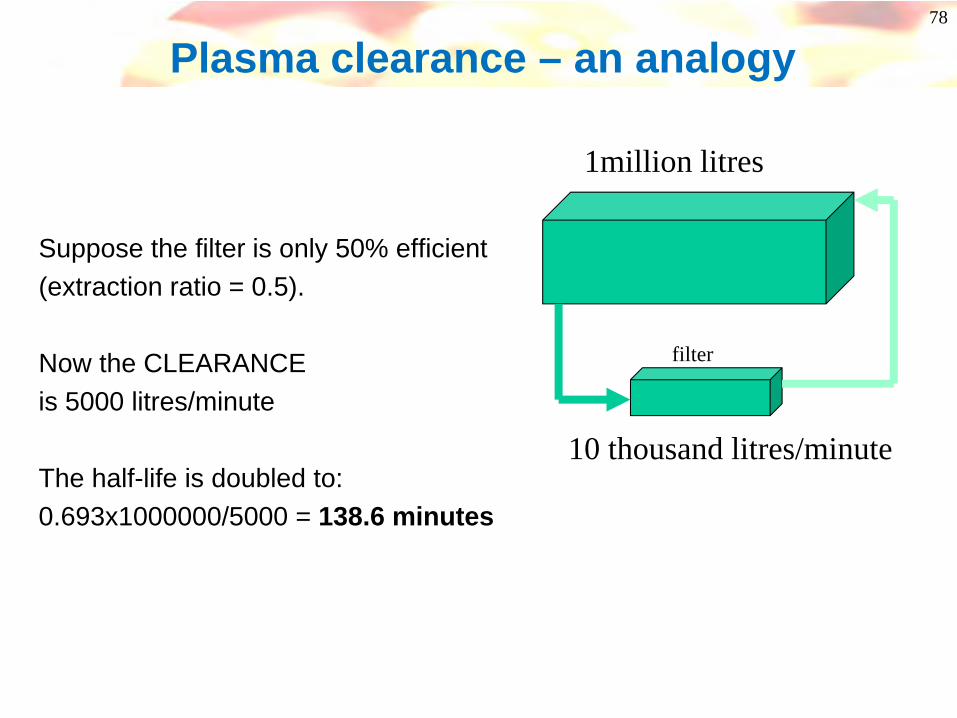
1million litres
10 thousand litres/minute
filter
Suppose the filter is only 50% efficient(extraction ratio = 0.5).
Now the CLEARANCEis 5000 litres/minute
The half-life is doubled to:0.693x1000000/5000 = 138.6 minutes

79
42 litres
? litres/day
filter
Total body water is 42L (70kg person)
The half-life of water is 8 days
What is the clearance of water?
CL = loge(2) x volume / half-life
Clearance – worked example

80
Clearance – worked example
Total body water is 42L (70kg person)
The half-life of water is 8 days
What is the clearance of water?
CL = loge (2) x volume / half-life
= 0.693 x 42 / 8 = 3.64L/day
Is this reasonable?Where does it come from?Where does it go?
42 litres
3.64 litres/day
filter

81
Clearance – worked example
Total body water is 42L (70kg person)
The half-life of water is 8 days
What is the clearance of water?
CL = 3.64L/day = 2.5mL/min
Urine flow = 1.4L/day = 1mL/min
42 litres
3.64L/day
filter
1.4L/day

82
Renal Clearance
• Typically only relevant for low lipophilicity compounds e.g. log D <0
• Therefore not very common!
OOH
NH
Propanolol (logD = 1.5)99% of clearance by metabolism
Atenolol (clogP = -1.9)> 90% excreted unchanged in urine
OOH
NH
NH2
O
Physicochemical Determinants of Human Renal Clearance. Journal of Medicinal Chemistry (2009), 52(15), 4844-4852.
83
Biliary Elimination of Compound
Once believed to be solely a function of molecular weight(MW >500 for human)
However, now more widely regarded as an “active transport” problem
Can affect acids, bases and polar neutrals; bile is alkaline and this can “attract” acid drugs
Concentration gradient from bile to plasma can be 10000 to 1 for low permeability drugs
Difficulty - need to surgically cannulate rats and look for drug in bile fluid- bile is not the easiest matrix to analyse
84
Biliary Clearance We think we are starting to understand what controls it………
Most drugs are sufficiently lipophilic for membrane permeability and oral absorptionCompounds which are less lipophilic tend to experience active transport.Probably active transport is the norm, but permeable compounds can leak out again
So increase in PSA decrease in permeability
increased likelihood of biliary clearance
Details of specific transporters are hard to get and harder to interpret.We have seen compounds which are
>99% plasma boundEh ~ 1 (mostly biliary)bile / plasma ratio ~ 1000:1 (bile unbound plasma ~ 100,000:1!)
Biliary clearance often leads to a high concentration inside hepatocytes, blocking transport of bile acids or other toxins hepatotoxicity
Efflux in Caco-2 assay or increasing PSA increase the risk of hepatic uptake

85
Example of biliary clearance:BMS ETA antagonists
BMS-187308 BMS-193884 BMS-X
moderately fastin vitro & in vivo
slow in vitroslow in vivo
very slow in vitrovery fast in vivo -biliary clearance!
SNH
NOOONH 2
NO
SNH
NOOO
NO
SNH
NOOONH
O
BMS-187308 BMS-193884 BMS-X
moderately fastin vitro & in vivo
slow in vitroslow in vivo
very slow in vitrovery fast in vivo -biliary clearance!
SNH
NOOONH 2
NO
SNH
NOOO
NO
SNH
NOOONH
O
WG Humphreys et al, Xenobiotica, 33 (11), 1109-23, 2003
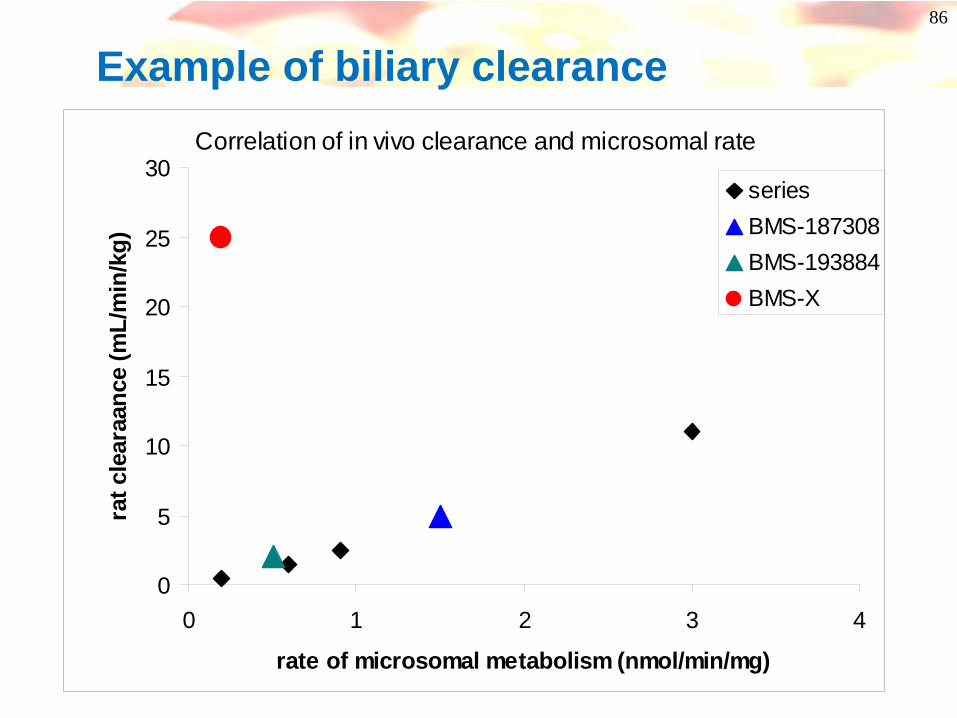
86
Example of biliary clearanceCorrelation of in vivo clearance and microsomal rate
0
5
10
15
20
25
30
0 1 2 3 4
rate of microsomal metabolism (nmol/min/mg)
rat c
lear
aanc
e (m
L/m
in/k
g)
seriesBMS-187308BMS-193884BMS-X
87
Metabolism and Clearance
Most drugs are sufficiently lipophilic for membrane permeability and oral absorptionMetabolism in the liver is therefore the major route of clearance.
Where metabolism in the liver is the principal method of elimination then
Clearance (CLH) = QHE ml/min/kg
QH is the blood flow through the liverE is the liver extraction ratio = (CA – CV)/ CA
CA = Concentration of drug entering liver. CV = Concentration of drug leaving liver

88
Metabolism and ClearanceWhat are high and low clearance values?
Clearance (CLH) = QH * EFor drugs where hepatic elimination is high then E → 1 and CL ~ QHClearance is high and approaches hepatic drug flow
Rat Dog Man
Hepatic blood flow (ml/min/kg)High clearance; E > 0.7 (ml/min/kg)Low clearance; E < 0.3 (ml/min/kg)
90 40 21>63 >28 >15<30 <12 <7
Clearance is measured after an iv dose of compound (all the dose is “absorbed”)
Clearance also affects bioavailability (F) because of first pass extractionF = Fabs * Fgut * Fhep where
Fabs = fraction absorbedFgut = fraction which survives metabolism in the intestineFhep = fraction which survives extraction (metabolism) by the liver
(21mL/min/kg = 2100L/day!!!)
89
Metabolism
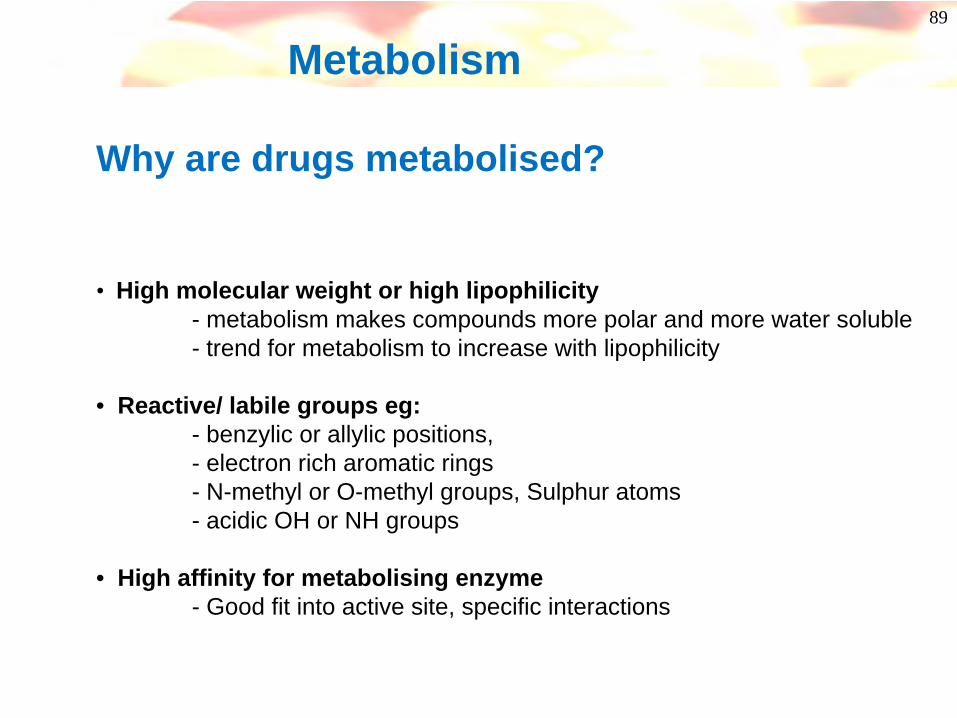
Why are drugs metabolised?
• High molecular weight or high lipophilicity- metabolism makes compounds more polar and more water soluble- trend for metabolism to increase with lipophilicity
• Reactive/ labile groups eg:- benzylic or allylic positions, - electron rich aromatic rings- N-methyl or O-methyl groups, Sulphur atoms- acidic OH or NH groups
• High affinity for metabolising enzyme- Good fit into active site, specific interactions
90
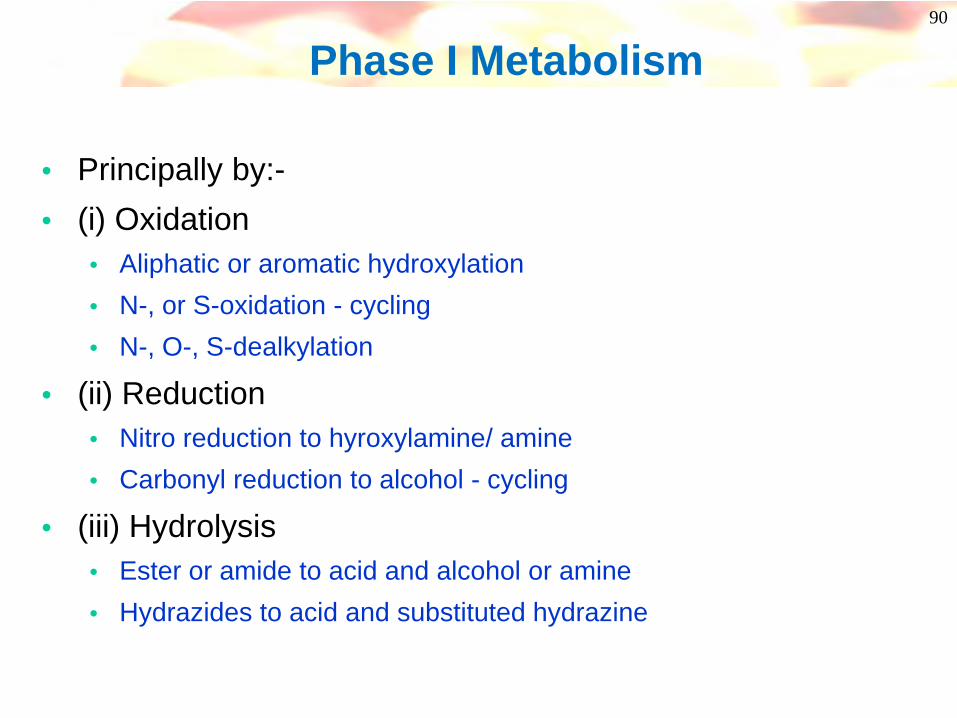
Phase I Metabolism
• Principally by:-• (i) Oxidation
• Aliphatic or aromatic hydroxylation• N-, or S-oxidation - cycling• N-, O-, S-dealkylation
• (ii) Reduction• Nitro reduction to hyroxylamine/ amine• Carbonyl reduction to alcohol - cycling
• (iii) Hydrolysis• Ester or amide to acid and alcohol or amine• Hydrazides to acid and substituted hydrazine
91
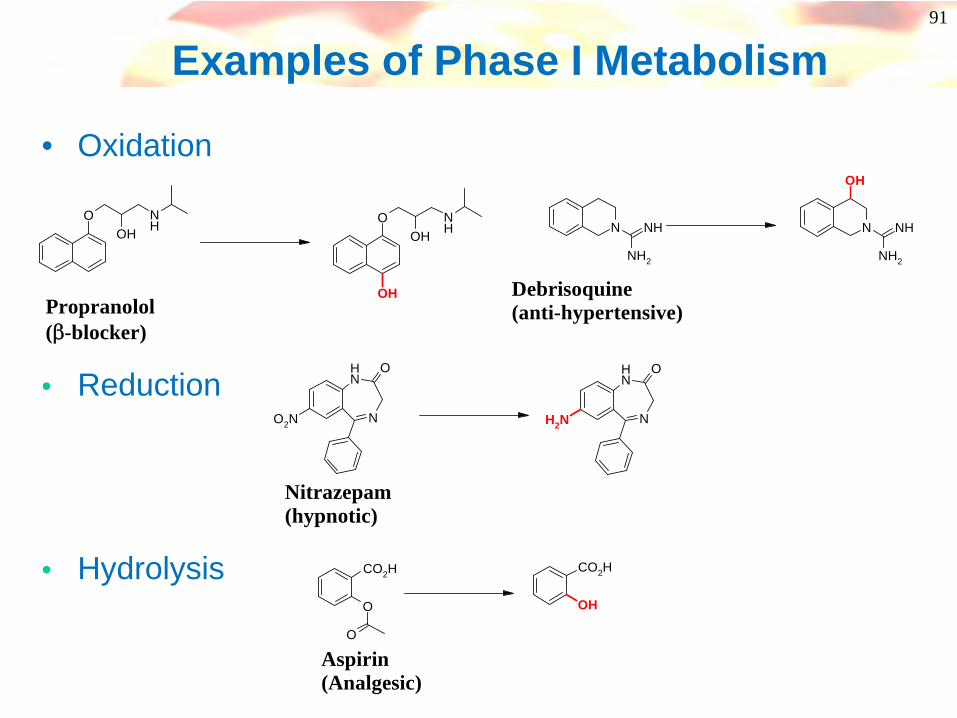
Examples of Phase I Metabolism
• Oxidation
OOH
NH O
OHNH
OHPropranolol(β-blocker)
N
NH O
O2N N
NH O
NH2
Nitrazepam(hypnotic)
O
O
CO2H
OH
CO2H
Aspirin(Analgesic)
N
NH2
NH N
NH2
NH
OH
Debrisoquine(anti-hypertensive)
• Reduction
• Hydrolysis

92
Phase II Metabolism
• Principally by:-• (i) Glucuronidation
• Carboxylic acid, alcohol, phenol, amine
• (ii) Sulphation• Alcohol, phenol, amine
• (iii) Acetylation• Amines
• (iv) Amino acids• Carboxylic acids
• (v) Glutathione conjugation (gly-cys-glu)• Halo-cpds, epoxides, arene oxides, quinone-imine
93
Examples of Phase II Metabolism
• Glucuronidation
• Sulphation
OH
OHNH
O CHCl2
O2N
OOH OH
OHOH
ONH
O CHCl2
O2N
CO2H
Chloramphenicol(antibiotic)
O
OH
OHNH
O
O
OHNH
SO
OH OPrenalterol(β-blocker)
94
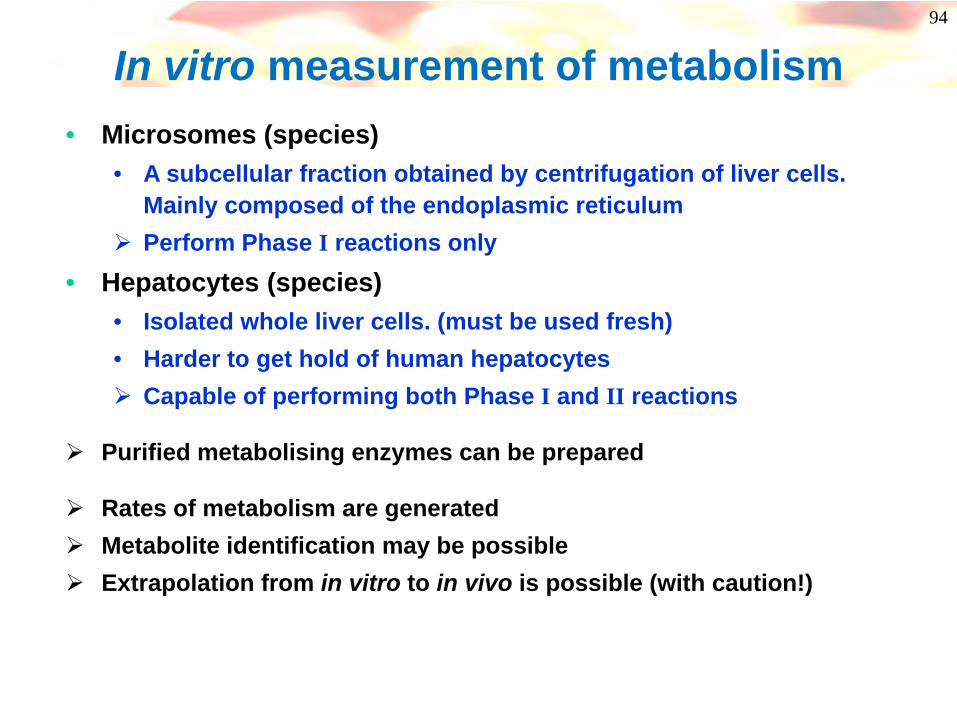
In vitro measurement of metabolism• Microsomes (species)
• A subcellular fraction obtained by centrifugation of liver cells. Mainly composed of the endoplasmic reticulum Perform Phase I reactions only
• Hepatocytes (species)• Isolated whole liver cells. (must be used fresh)• Harder to get hold of human hepatocytes
Capable of performing both Phase I and II reactions
Purified metabolising enzymes can be prepared
Rates of metabolism are generatedMetabolite identification may be possibleExtrapolation from in vitro to in vivo is possible (with caution!)

95
Metabolism Identification of metabolites
Knowing the exact structure of major metabolite(s) is a powerful aid to the medicinal chemist
- metabolism can be blocked/ suppressed- potential toxicity can be predicted- predict if the same metabolites formed in human as rat/ dog
• Advances in LCMS, MS/MS and NMR have allowed minute quantities of metabolites to be identified• In vitro liver preparations (microsomes, hepatocytes)• Ex vivo analysis of plasma or tissue samples• Analysis of urine/ faeces• In vitro and in vivo metabolite profiles may be different eg: dofetolide
O
NH
MeSO2
N
NH
SO2Me O
NH
MeSO2
NH
NH
SO2Me
Only metabolite in vitroOne third of metabolites formed in vivo
96
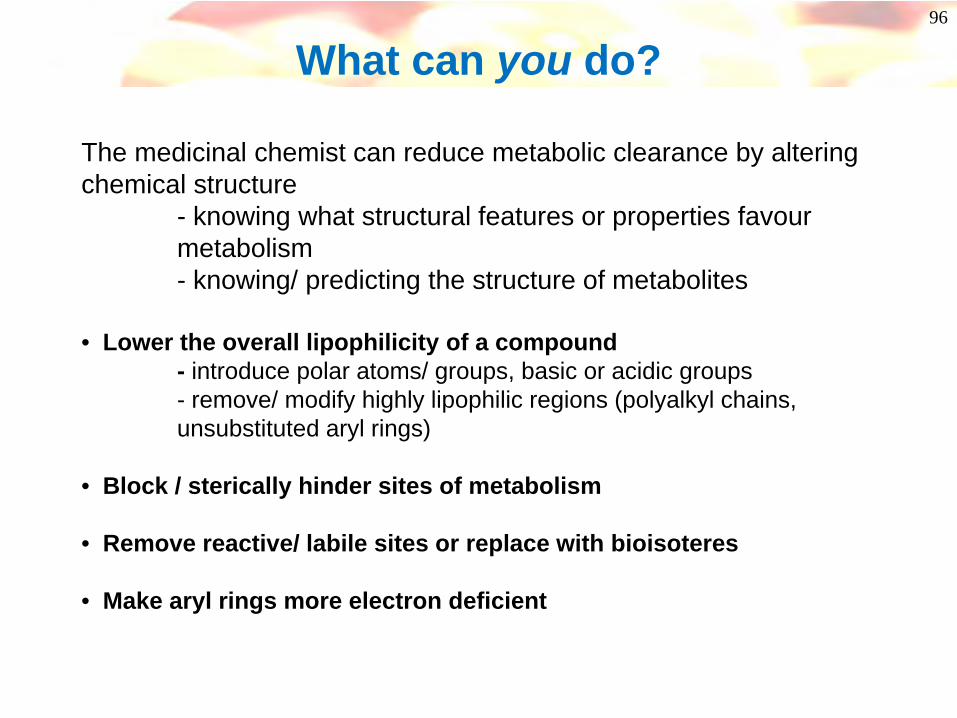
What can you do?
The medicinal chemist can reduce metabolic clearance by altering chemical structure
- knowing what structural features or properties favour metabolism - knowing/ predicting the structure of metabolites
• Lower the overall lipophilicity of a compound- introduce polar atoms/ groups, basic or acidic groups- remove/ modify highly lipophilic regions (polyalkyl chains, unsubstituted aryl rings)
• Block / sterically hinder sites of metabolism
• Remove reactive/ labile sites or replace with bioisoteres
• Make aryl rings more electron deficient
97
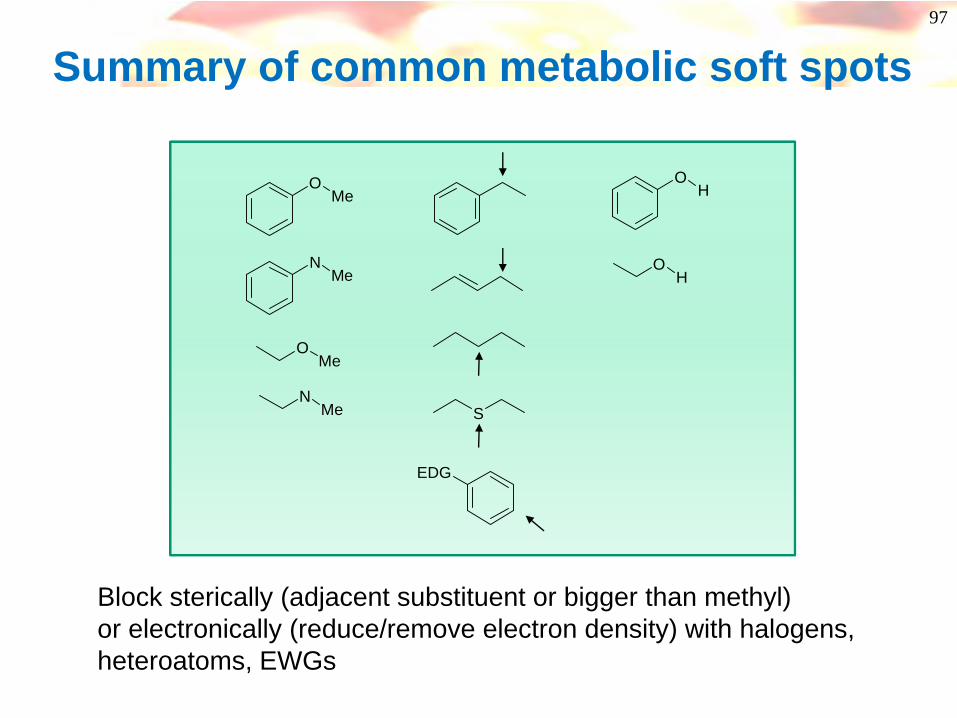
Summary of common metabolic soft spots
OMe
NMe
OMe
NMe S
OH
OH
EDG
Block sterically (adjacent substituent or bigger than methyl)or electronically (reduce/remove electron density) with halogens, heteroatoms, EWGs
98
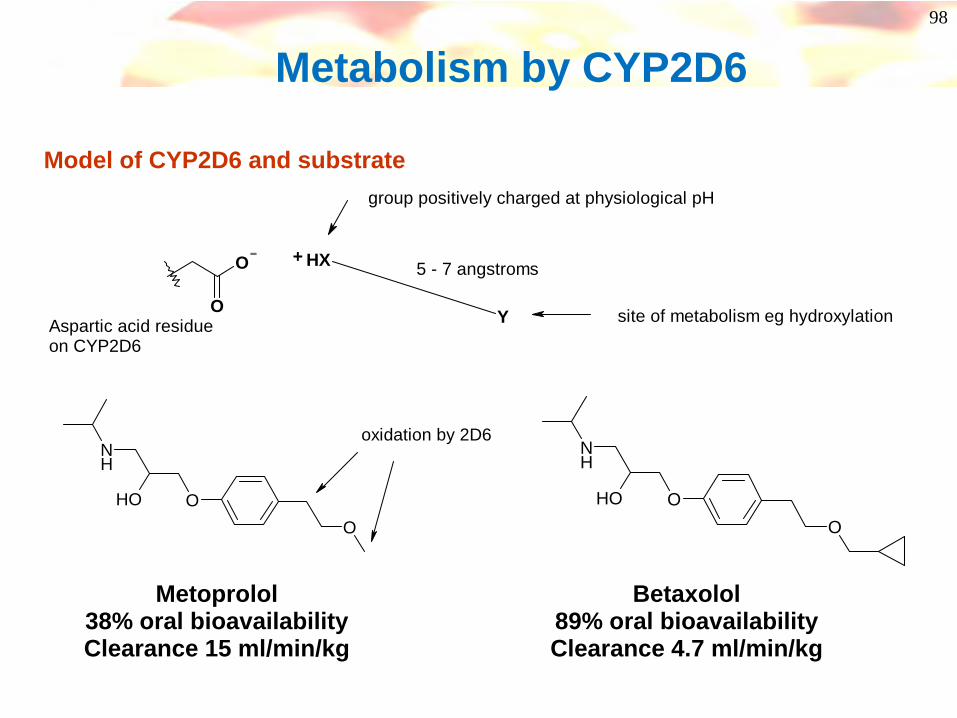
Metabolism by CYP2D6
O
O Y
HX+
Aspartic acid residueon CYP2D6
5 - 7 angstroms
site of metabolism eg hydroxylation
group positively charged at physiological pH
Model of CYP2D6 and substrate
O
NH
OHO
oxidation by 2D6
Metoprolol38% oral bioavailabilityClearance 15 ml/min/kg
O
NH
OHO
Betaxolol89% oral bioavailabilityClearance 4.7 ml/min/kg
99
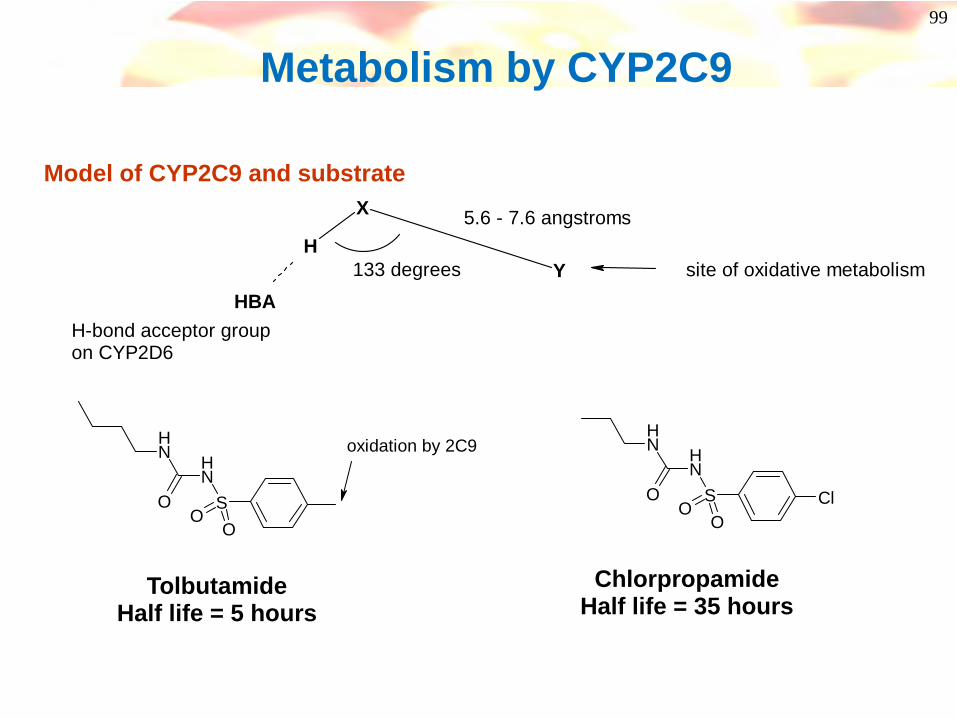
Metabolism by CYP2C9
Y
X
H
H-bond acceptor groupon CYP2D6
5.6 - 7.6 angstroms
site of oxidative metabolism HBA
133 degrees
Model of CYP2C9 and substrate
SNHN
H
OO
O
oxidation by 2C9
TolbutamideHalf life = 5 hours
ChlorpropamideHalf life = 35 hours
SNHN
H
O ClOO
100
Metabolism by CYP3A4
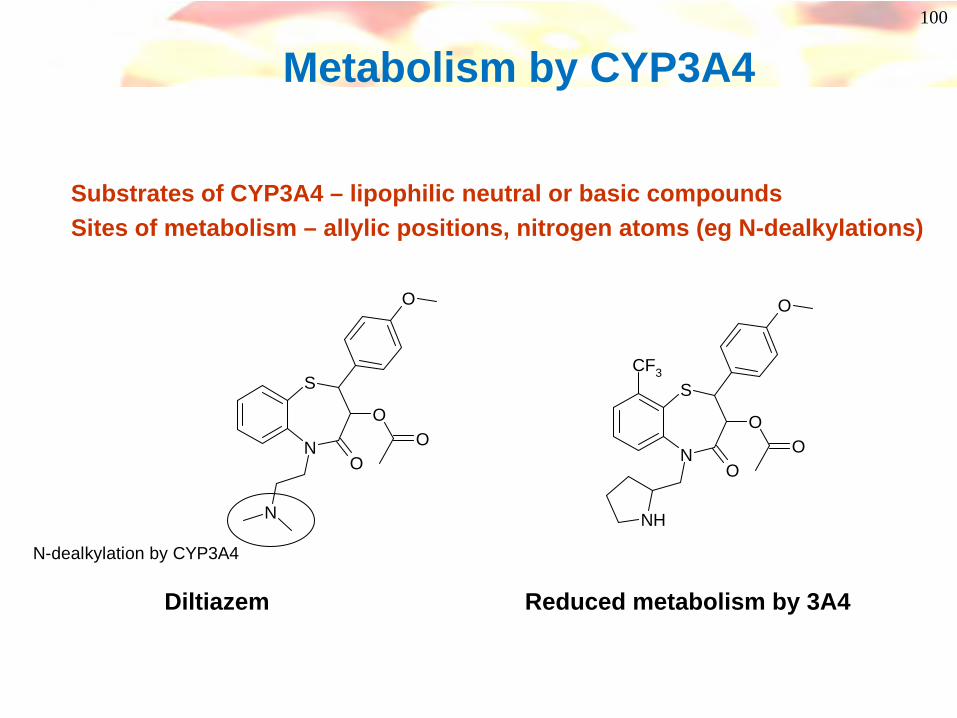
Substrates of CYP3A4 – lipophilic neutral or basic compoundsSites of metabolism – allylic positions, nitrogen atoms (eg N-dealkylations)
S
NO
OO
N
O
N-dealkylation by CYP3A4
Diltiazem Reduced metabolism by 3A4
NH
S
NO
OO
O
CF3
101Use of metabolite identification to drive medicinal chemistry
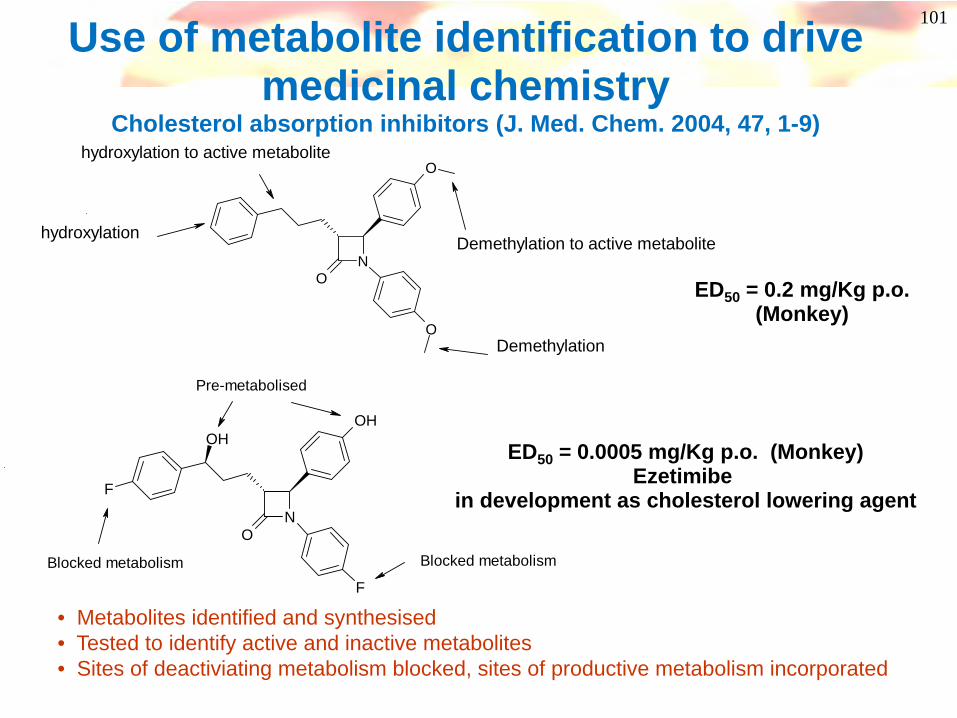
Cholesterol absorption inhibitors (J. Med. Chem. 2004, 47, 1-9)
N
O
O
O
Demethylation
hydroxylation
hydroxylation to active metabolite
Demethylation to active metabolite
N
OH
O
F
F
OH
Pre-metabolised
Blocked metabolism Blocked metabolism
ED50 = 0.2 mg/Kg p.o.(Monkey)
ED50 = 0.0005 mg/Kg p.o. (Monkey)Ezetimibe
in development as cholesterol lowering agent
• Metabolites identified and synthesised• Tested to identify active and inactive metabolites• Sites of deactiviating metabolism blocked, sites of productive metabolism incorporated
102
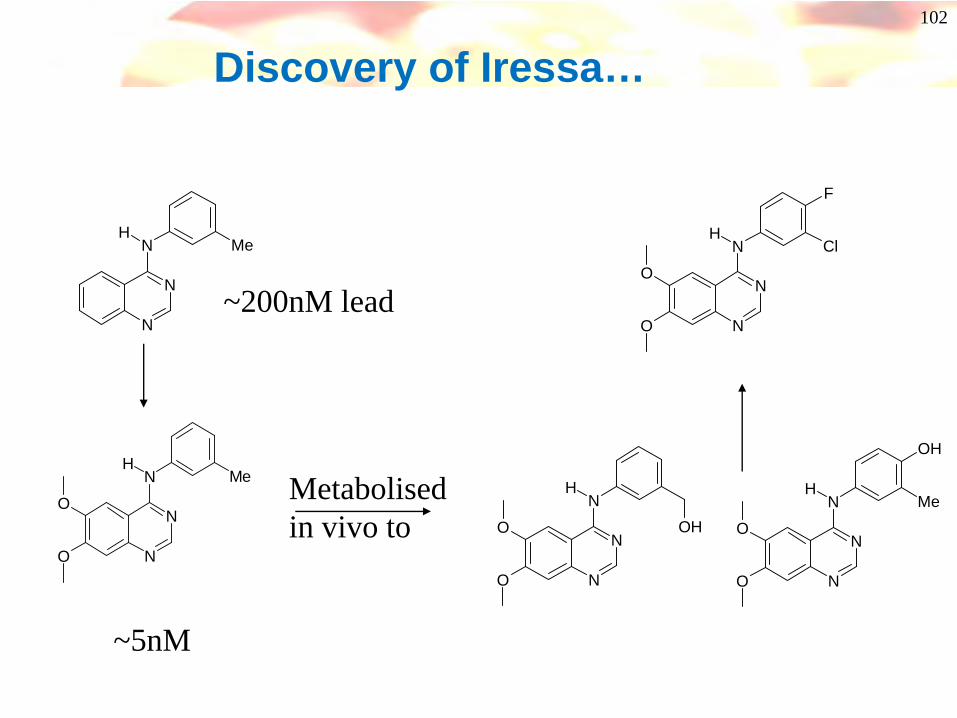
Discovery of Iressa…
N
N
NH
O
O
Me
N
N
NH
Me
~200nM lead
~5nM
Metabolised in vivo to
N
N
NH
O
O
OH
N
N
NH
O
O
Me
OH
N
N
NH
O
O
Cl
F

103
NAr
Blocking Phase II conjugation processes
• Exploration of phenol bioisosteres in a series of NMDA (NR1A/2B) receptor antagonists• Phenol has low oral exposure and no oral activity due to extensive glucuronide formation• Correctly placed phenol bioisostere is resistant to glucuronidation
Ar NR1A/2B IC50 nM In vivo activity
100 Inactive po
38 NT
5.0 active @ 10 mg/kg po
OH
NH
N
NH
NH
O
104
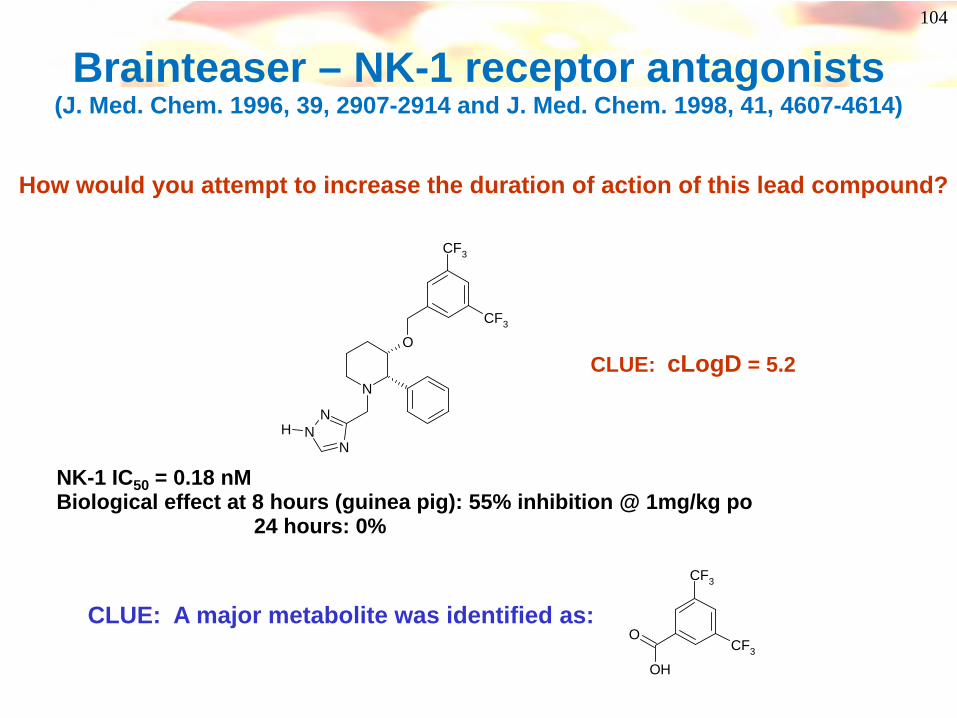
Brainteaser – NK-1 receptor antagonists (J. Med. Chem. 1996, 39, 2907-2914 and J. Med. Chem. 1998, 41, 4607-4614)
N
O
NN
N
CF3
CF3
H
NK-1 IC50 = 0.18 nMBiological effect at 8 hours (guinea pig): 55% inhibition @ 1mg/kg po
24 hours: 0%
How would you attempt to increase the duration of action of this lead compound?
CLUE: cLogD = 5.2
CLUE: A major metabolite was identified as:
OH
CF3
CF3
O

105
Lunch
106
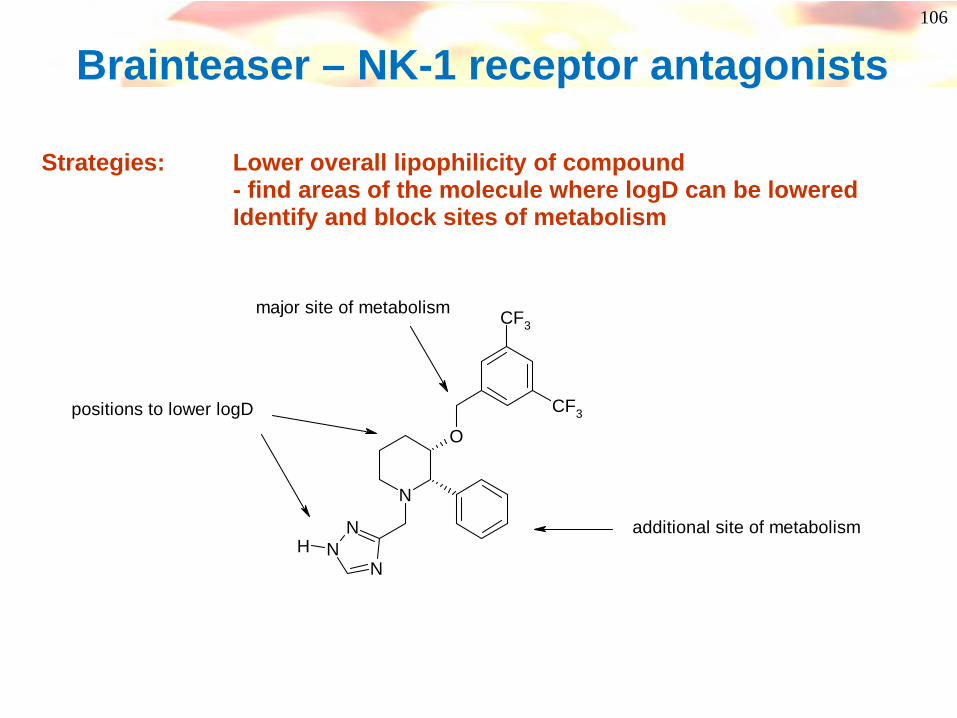
N
O
NN
N
CF3
CF3
H
positions to lower logD
major site of metabolism
additional site of metabolism
Brainteaser – NK-1 receptor antagonists
Strategies: Lower overall lipophilicity of compound - find areas of the molecule where logD can be loweredIdentify and block sites of metabolism
107
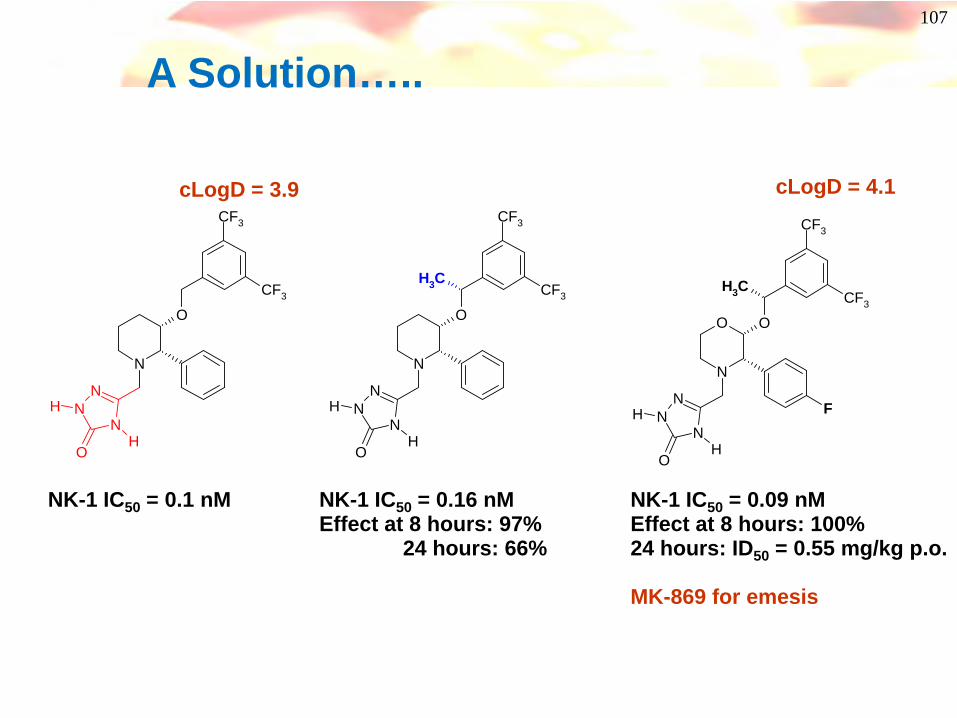
A Solution…..
N
O
NN
N
CF3
CF3
H
CH3
OH
NK-1 IC50 = 0.09 nMEffect at 8 hours: 100%24 hours: ID50 = 0.55 mg/kg p.o.
MK-869 for emesis
N
O
NN
N
CF3
CF3
H
OH
NK-1 IC50 = 0.1 nM
N
O O
NN
N
CF3
CF3
H F
CH3
OH
NK-1 IC50 = 0.16 nMEffect at 8 hours: 97%
24 hours: 66%
cLogD = 4.1cLogD = 3.9
108
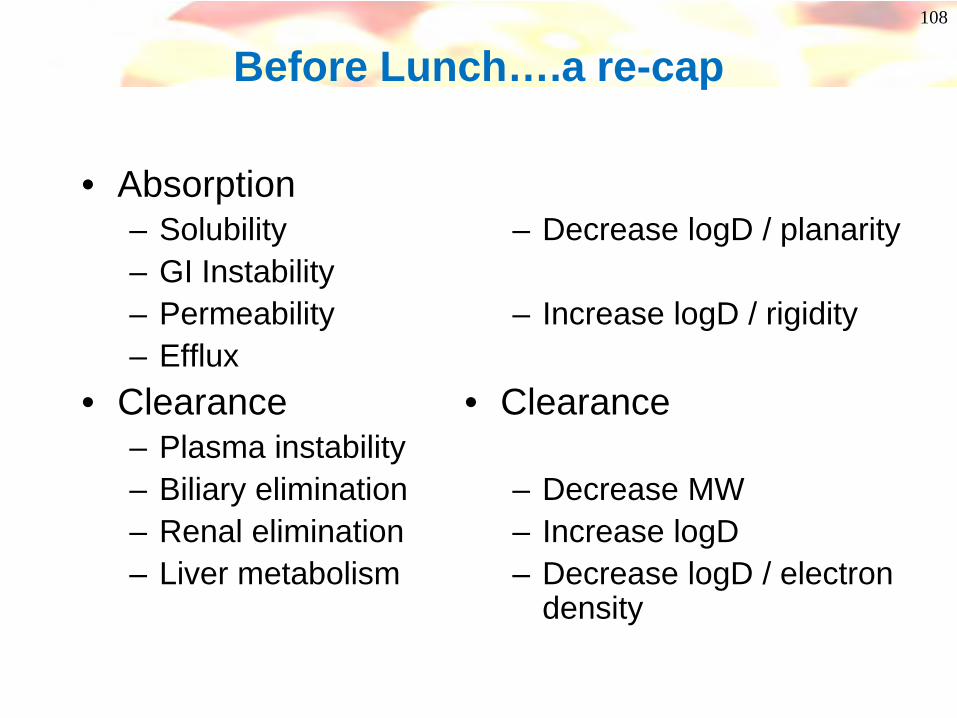
Before Lunch….a re-cap
• Absorption– Solubility– GI Instability– Permeability– Efflux
• Clearance– Plasma instability– Biliary elimination– Renal elimination– Liver metabolism
– Decrease logD / planarity
– Increase logD / rigidity
• Clearance
– Decrease MW– Increase logD– Decrease logD / electron
density

109
Now…
• Clearance continued– What enzymes are involved in PhI
metabolism– Drug:Drug Interactions– Clearance and link to duration of action
• Volume of distribution, half-life, PPB

110
Ph I - Cytochrome P450 Enzymes
• Carry out Phase I oxidations in liver cells (also present in the intestine)
• Membrane-bound Haem-containing proteins coordinating FeII/III at the active site
• Found embedded in the endoplasmic reticulum (a cellular transport system composed of a honeycomb of membrane pervading the entire cytoplasm)
• Account for the biotransformation of approx. 60% of commonly prescribed drugs
• Cofactors: NADPH and molecular oxygen
N N
NN
Fe
S
S
CO2HHO2C
E
E

111
Cytochrome P450 (CYP, P450)
• ~ 1000 isoforms known, > 100 in man!
• 74 families, 17 in man
• Many are responsible for metabolism of endogenous agents – eg steroids
• Some have multiple alleles (polymorphism) eg CYP2D6
• Some are not expressed in liver, but in lung, nasal mucosa, kidney, white blood cells
• CYP2D6 also found in brain
• CYP3A4 also found in intestine
• Some isoforms are inducible – 3A4, 2C9, 2C19, 2E1, 1A1, 1A2, 2B6
• Some are not – 2D6
112
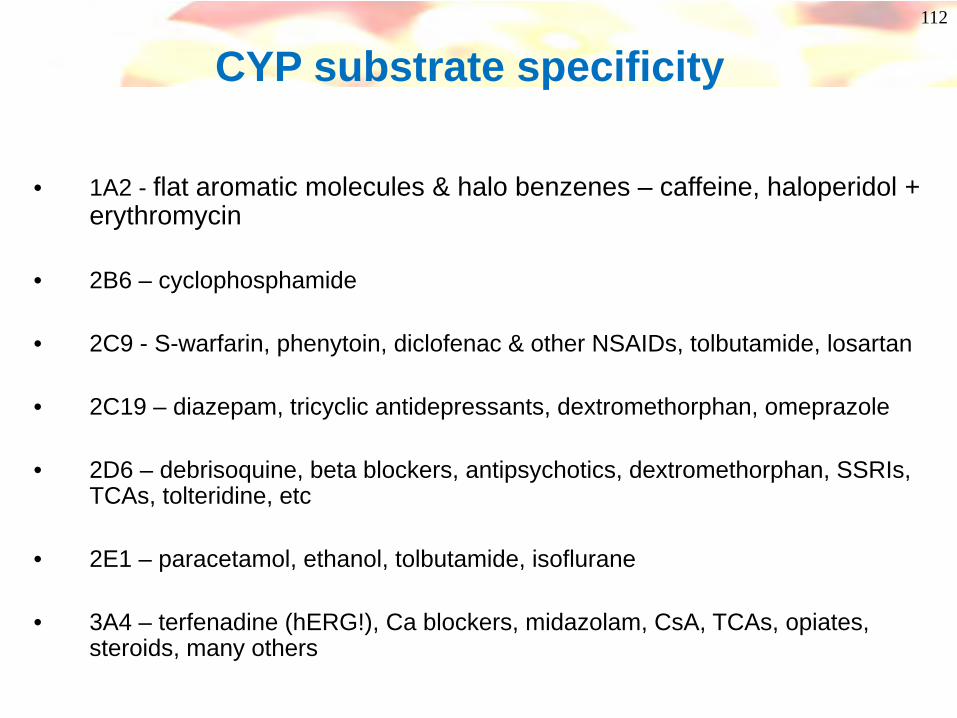
CYP substrate specificity
• 1A2 - flat aromatic molecules & halo benzenes – caffeine, haloperidol + erythromycin
• 2B6 – cyclophosphamide
• 2C9 - S-warfarin, phenytoin, diclofenac & other NSAIDs, tolbutamide, losartan
• 2C19 – diazepam, tricyclic antidepressants, dextromethorphan, omeprazole
• 2D6 – debrisoquine, beta blockers, antipsychotics, dextromethorphan, SSRIs, TCAs, tolteridine, etc
• 2E1 – paracetamol, ethanol, tolbutamide, isoflurane
• 3A4 – terfenadine (hERG!), Ca blockers, midazolam, CsA, TCAs, opiates, steroids, many others

113
Cytochrome P450 Alleles
• Some have multiple alleles (polymorphism) eg CYP2D6
– CYP2D6*1 (wt) + > 25 others (*5 = deleted)– Most are “poor” metabolisers compared to wt, but depends on substrate– Some people have multiple copies of CYP2D6 to be ultra-rapid metabolisers
• Can lead to lack of effect or toxicity from metabolites– Homozygous CYP2D6*4 associated with red/blonde hair and melanoma
• CYP2C9 – 3 alleles – poor metabolisers may suffer phenytoin toxicity
• CYP2C19 – 8 alleles
• CYP3A4 – NO ALLELES!– but wide range of expression and activity, easily induced
114
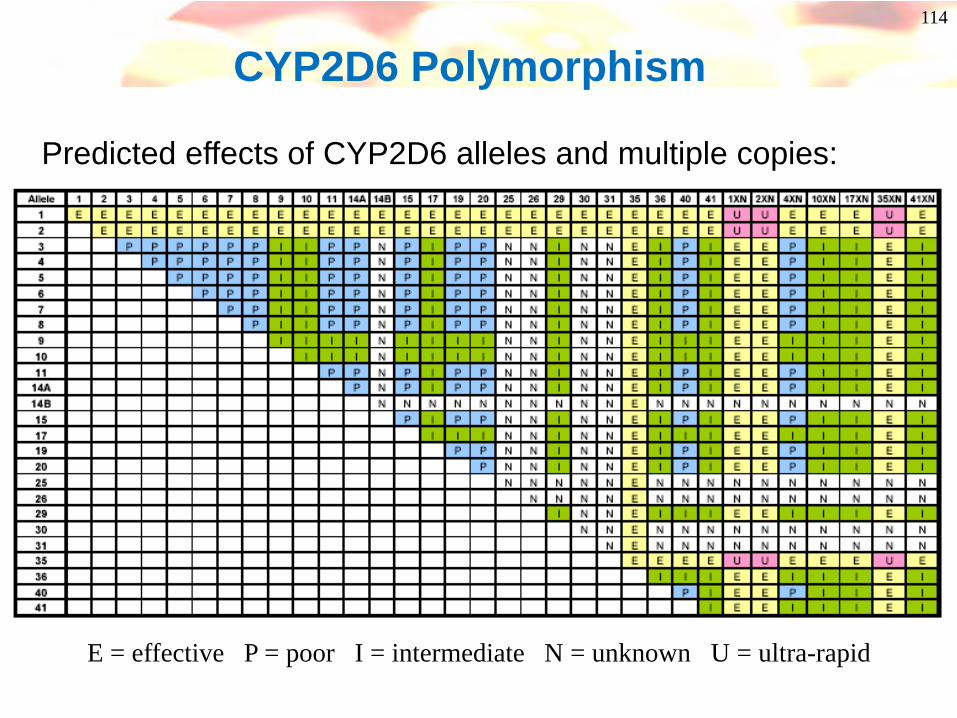
CYP2D6 Polymorphism
Predicted effects of CYP2D6 alleles and multiple copies:
E = effective P = poor I = intermediate N = unknown U = ultra-rapid
115
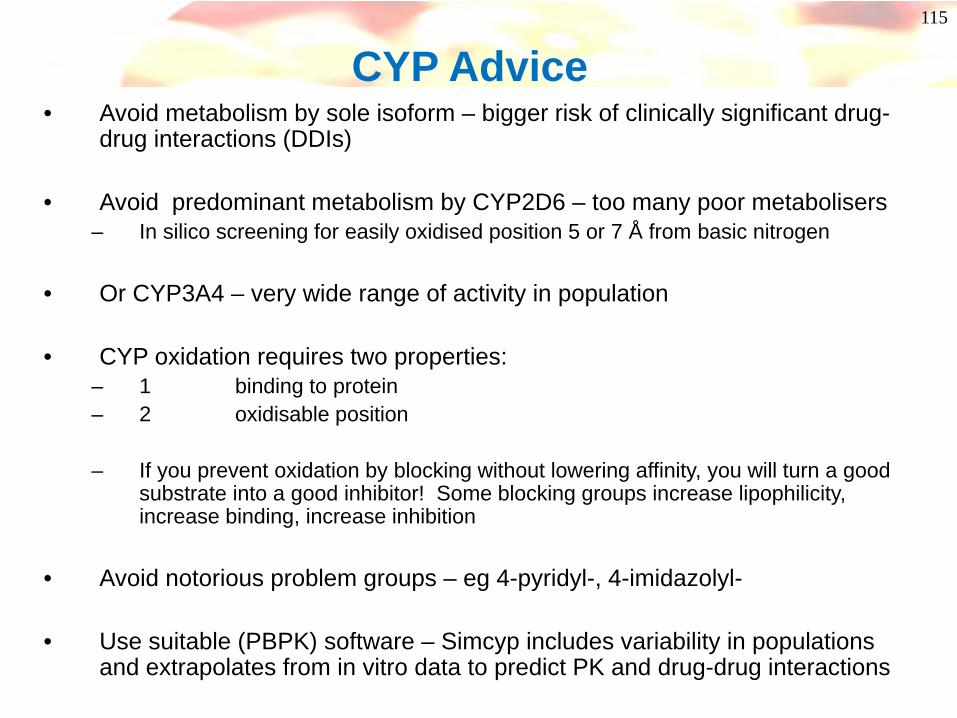
CYP Advice• Avoid metabolism by sole isoform – bigger risk of clinically significant drug-
drug interactions (DDIs)
• Avoid predominant metabolism by CYP2D6 – too many poor metabolisers– In silico screening for easily oxidised position 5 or 7 Å from basic nitrogen
• Or CYP3A4 – very wide range of activity in population
• CYP oxidation requires two properties:– 1 binding to protein– 2 oxidisable position
– If you prevent oxidation by blocking without lowering affinity, you will turn a good substrate into a good inhibitor! Some blocking groups increase lipophilicity, increase binding, increase inhibition
• Avoid notorious problem groups – eg 4-pyridyl-, 4-imidazolyl-
• Use suitable (PBPK) software – Simcyp includes variability in populations and extrapolates from in vitro data to predict PK and drug-drug interactions
116
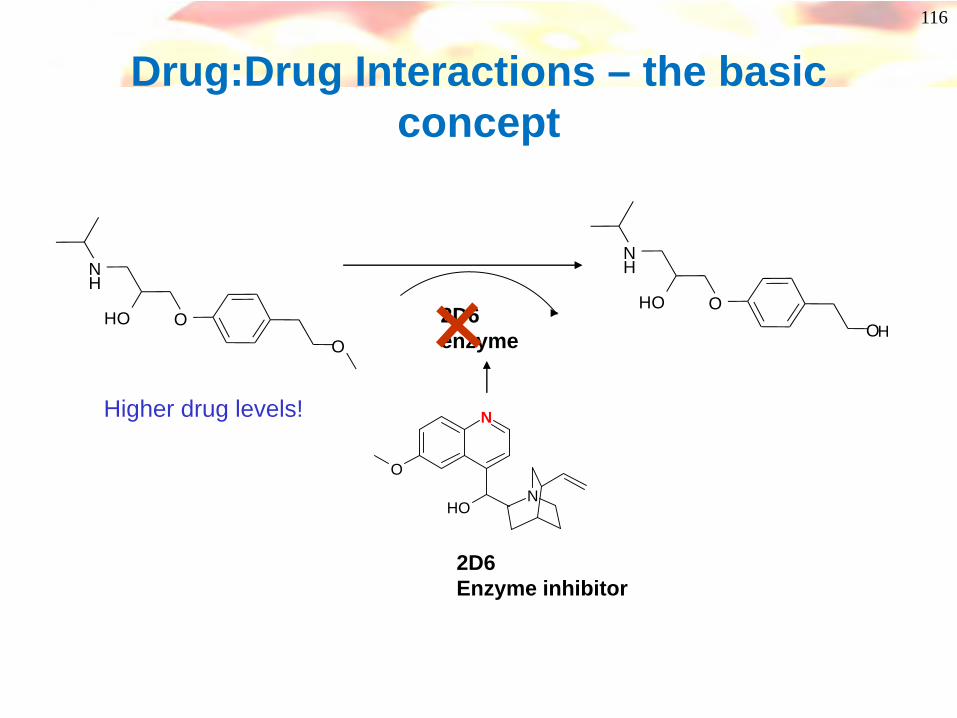
Drug:Drug Interactions – the basic concept
O
NH
OHO
O
NH
OHOH
2D6enzyme
N
N
O
OH
2D6Enzyme inhibitor
Higher drug levels!
117
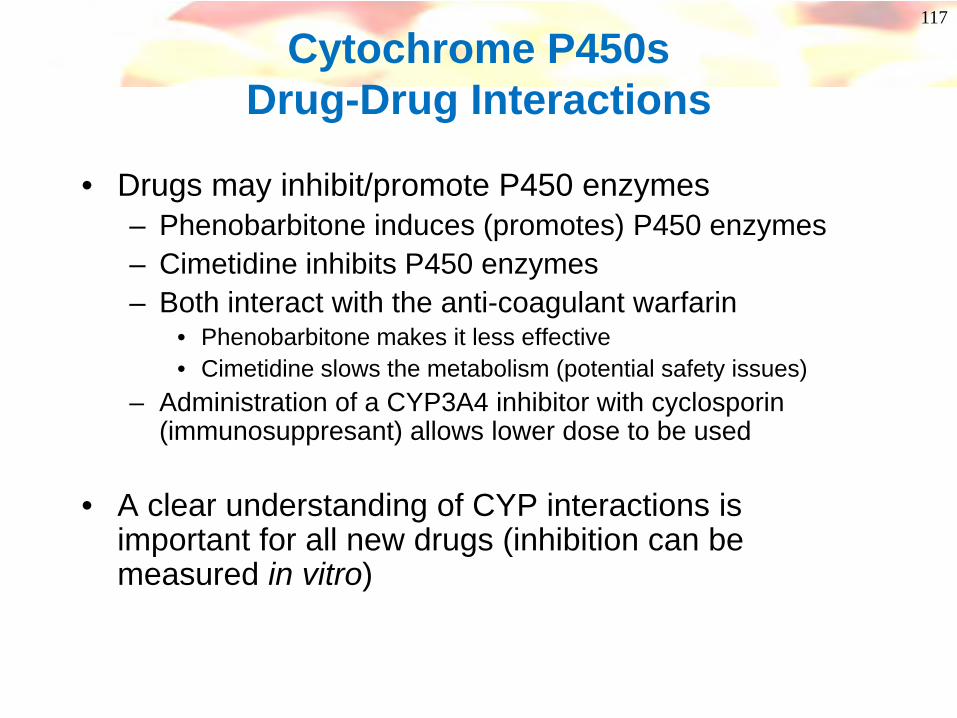
Cytochrome P450sDrug-Drug Interactions
• Drugs may inhibit/promote P450 enzymes– Phenobarbitone induces (promotes) P450 enzymes– Cimetidine inhibits P450 enzymes– Both interact with the anti-coagulant warfarin
• Phenobarbitone makes it less effective• Cimetidine slows the metabolism (potential safety issues)
– Administration of a CYP3A4 inhibitor with cyclosporin (immunosuppresant) allows lower dose to be used
• A clear understanding of CYP interactions is important for all new drugs (inhibition can be measured in vitro)
118
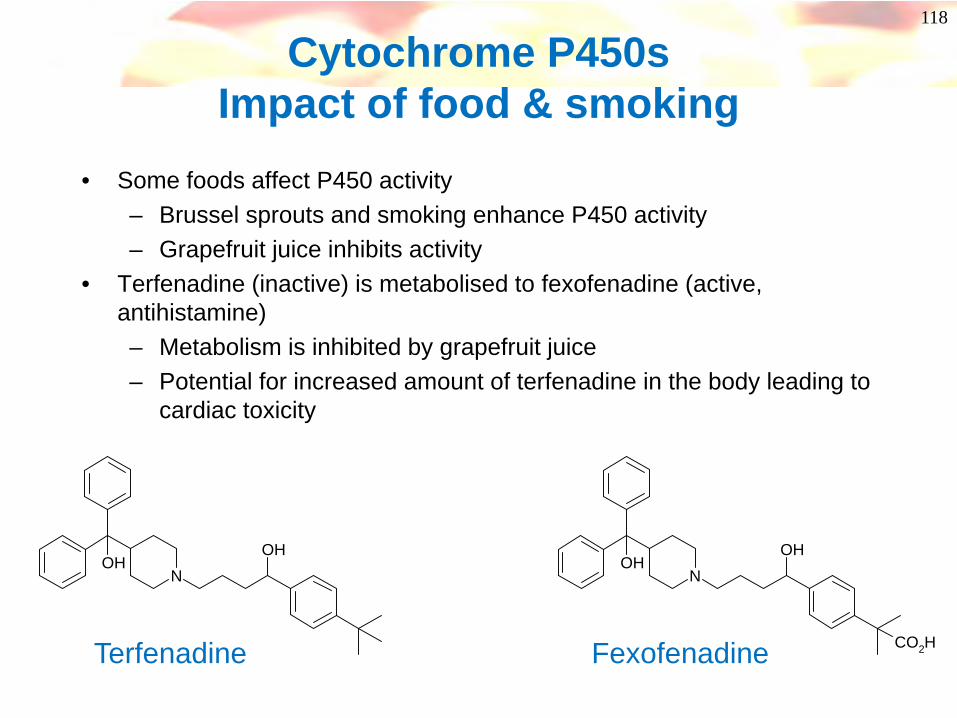
Cytochrome P450sImpact of food & smoking
• Some foods affect P450 activity– Brussel sprouts and smoking enhance P450 activity– Grapefruit juice inhibits activity
• Terfenadine (inactive) is metabolised to fexofenadine (active, antihistamine)– Metabolism is inhibited by grapefruit juice– Potential for increased amount of terfenadine in the body leading to
cardiac toxicity
NOH
OHN
OHOH
CO2HTerfenadine Fexofenadine

119
Inhibition of cytochrome P450’s
• Potency of inhibition has been correlated to lipophilicity of compounds- lowering logP is a good strategy for reducing CYP450 inhibition
• Reactive metabolites of compounds may covalently bind to P450- mechanism based inhibitors (usually irreversible)- N-methyl groups, alkenes, alkynes, furans, thiophenes, methylenedioxy
groups
• Certain structural features may lead to reversible inhibition eg aza, diaza groups
Cl
ClO
ON
N
O
NN
O
NH2 SNH
OO N N
N
N
O
OHKetoconazole – CYP3A4 inhibitor
Sulphaphenazole- CYP2C9 inhibitor
quinidine- CYP2D6 inhibitor
120
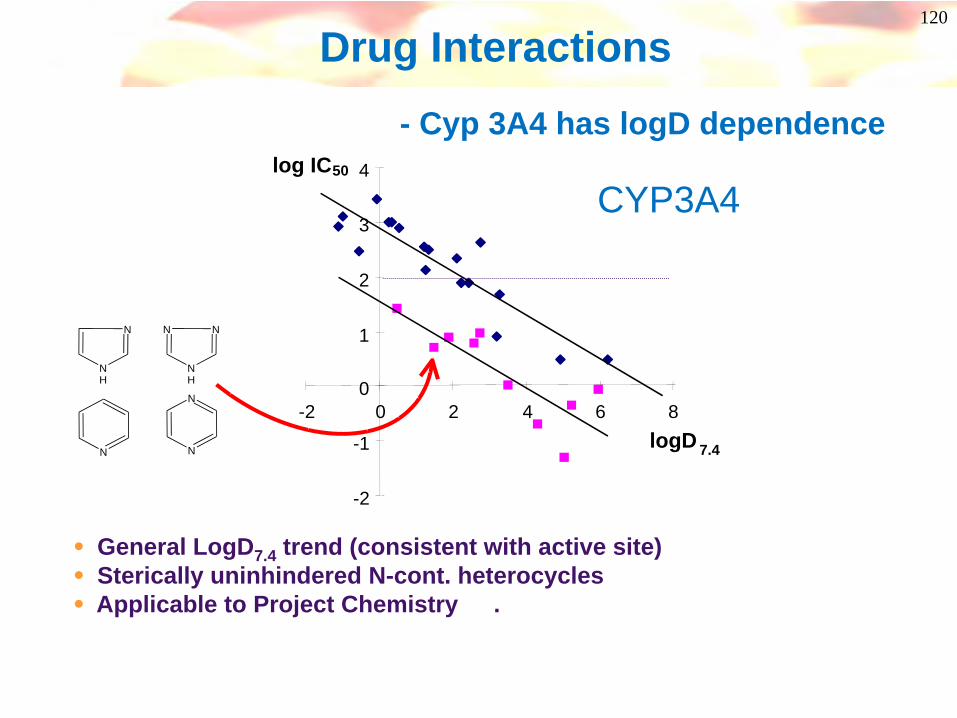
Drug Interactions- Cyp 3A4 has logD dependence
• General LogD7.4 trend (consistent with active site)• Sterically uninhindered N-cont. heterocycles• Applicable to Project Chemistry .
-2
-1
0
1
2
3
4
-2 0 2 4 6 8logD 7.4
log IC50
N
NH
N
NH
N
N
N
N
CYP3A4

121
Inhibition of Cytochrome P450’s
S
FeN N
N NN
N
steric hindrancesteric hindrance
• Nitrogen atom displaces water from haem complex
• Introduction of steric hindrance around N-atom (eg alkyl groups) may reduce interaction
• Look for isosteres of the aza/ diaza groups and reduction of electron density
122
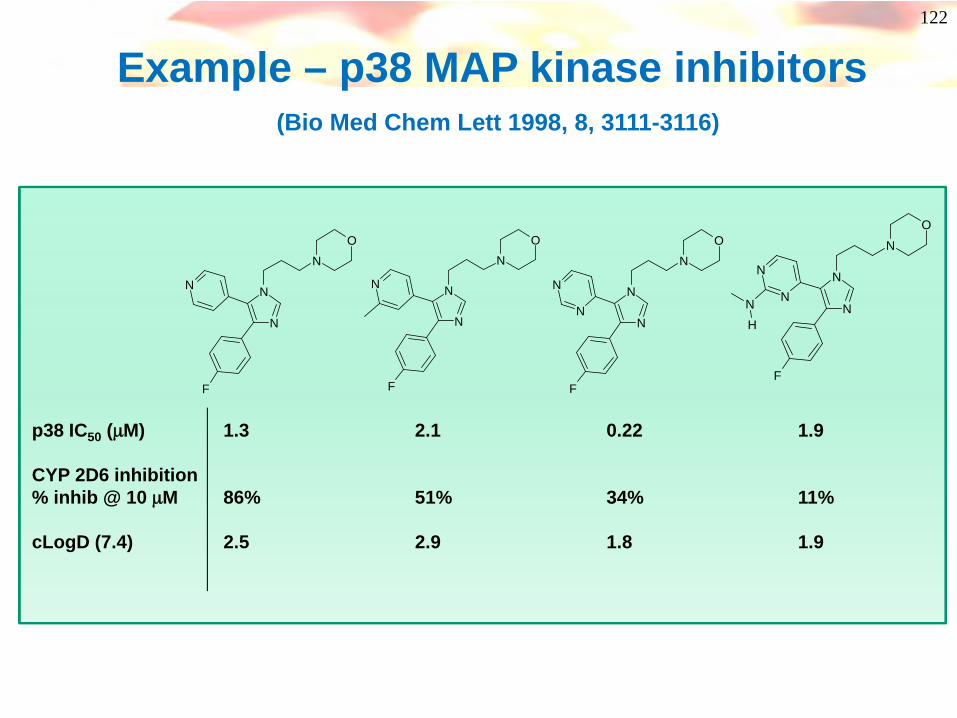
Example – p38 MAP kinase inhibitors(Bio Med Chem Lett 1998, 8, 3111-3116)
N
N
NO
F
N
N
N
NO
F
N
N
N
NO
F
N
N N
N
NO
F
N
NNH
p38 IC50 (μM) 1.3 2.1 0.22 1.9
CYP 2D6 inhibition% inhib @ 10 μM 86% 51% 34% 11%
cLogD (7.4) 2.5 2.9 1.8 1.9
123
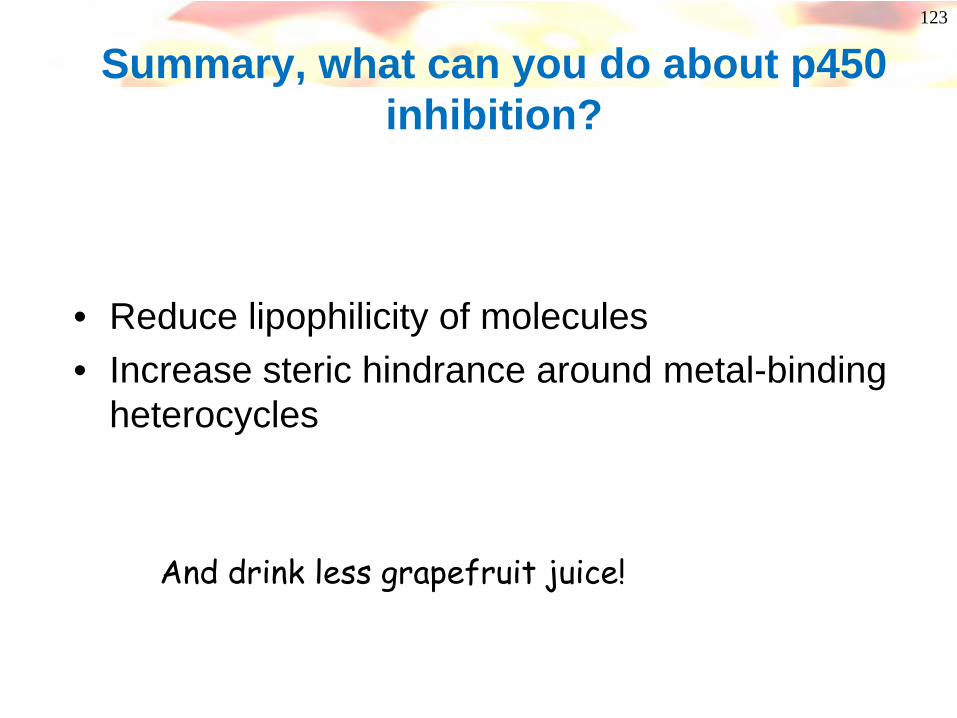
Summary, what can you do about p450 inhibition?
• Reduce lipophilicity of molecules• Increase steric hindrance around metal-binding
heterocycles
And drink less grapefruit juice!
124
Distribution & Duration
125
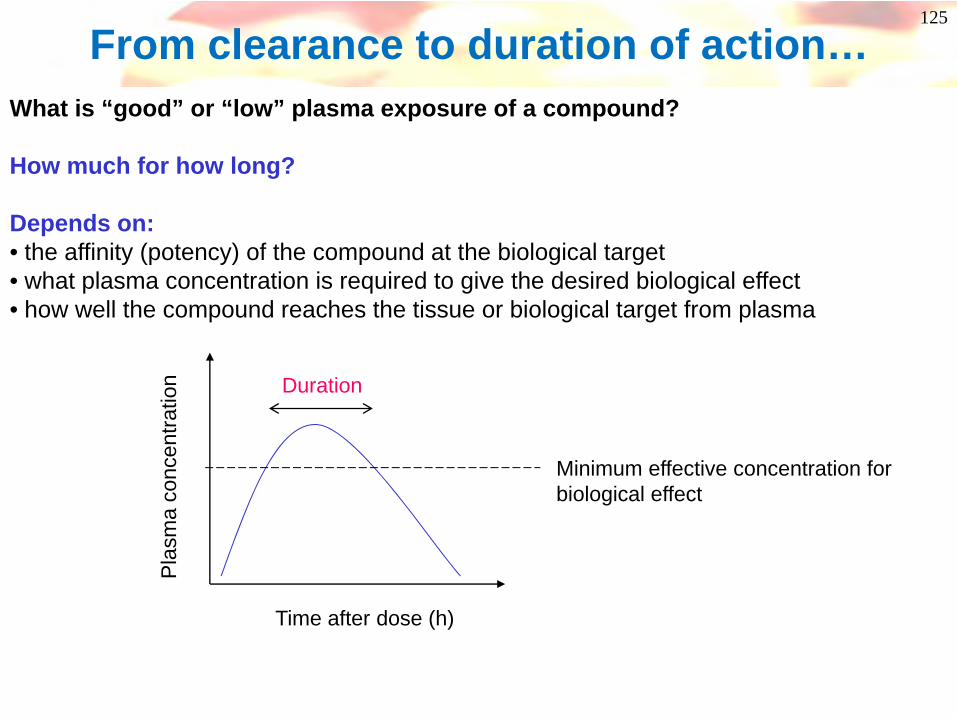
From clearance to duration of action…What is “good” or “low” plasma exposure of a compound?
How much for how long?
Depends on:• the affinity (potency) of the compound at the biological target• what plasma concentration is required to give the desired biological effect• how well the compound reaches the tissue or biological target from plasma
Time after dose (h)
Pla
sma
conc
entra
tion
Minimum effective concentration for biological effect
Duration
126
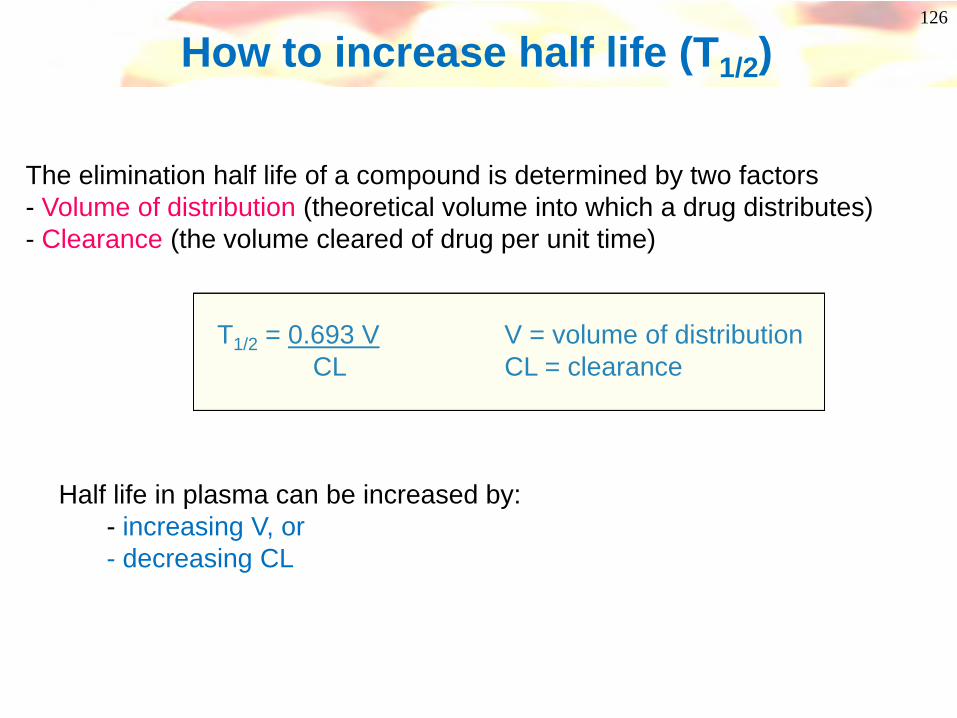
How to increase half life (T1/2)
The elimination half life of a compound is determined by two factors- Volume of distribution (theoretical volume into which a drug distributes)- Clearance (the volume cleared of drug per unit time)
T1/2 = 0.693 V V = volume of distributionCL CL = clearance
Half life in plasma can be increased by:- increasing V, or- decreasing CL
127
Volume of Distribution
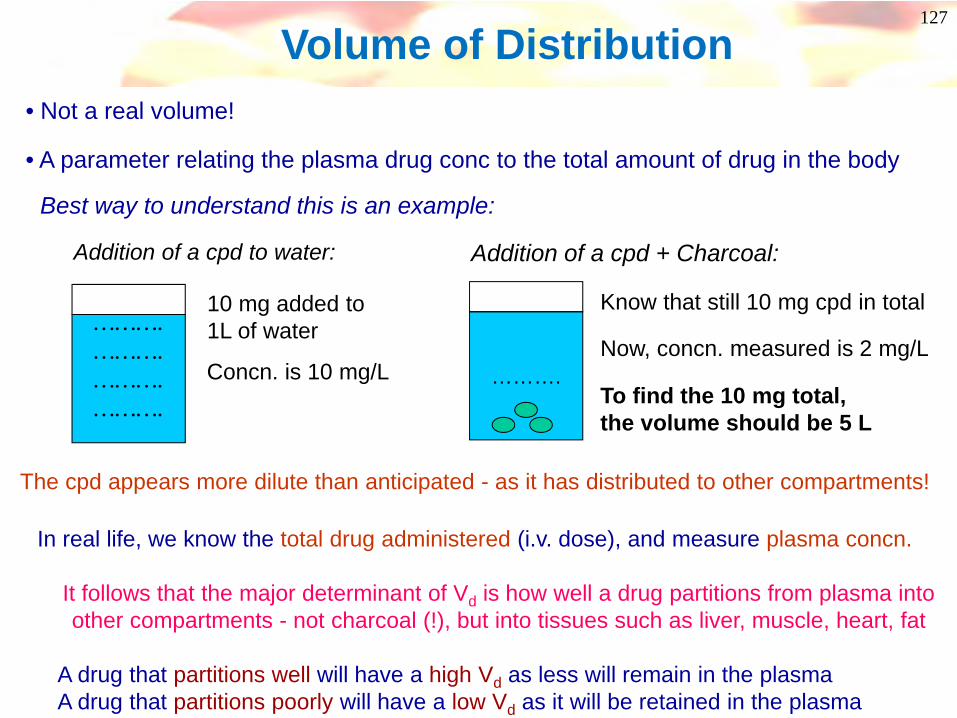
……….……….……….……….
Addition of a cpd to water:
10 mg added to 1L of water
Concn. is 10 mg/LNow, concn. measured is 2 mg/L
……….
Addition of a cpd + Charcoal:
Know that still 10 mg cpd in total
To find the 10 mg total, the volume should be 5 L
Best way to understand this is an example:
The cpd appears more dilute than anticipated - as it has distributed to other compartments!
In real life, we know the total drug administered (i.v. dose), and measure plasma concn.
It follows that the major determinant of Vd is how well a drug partitions from plasma into other compartments - not charcoal (!), but into tissues such as liver, muscle, heart, fat
A drug that partitions well will have a high Vd as less will remain in the plasmaA drug that partitions poorly will have a low Vd as it will be retained in the plasma
• Not a real volume!
• A parameter relating the plasma drug conc to the total amount of drug in the body
128
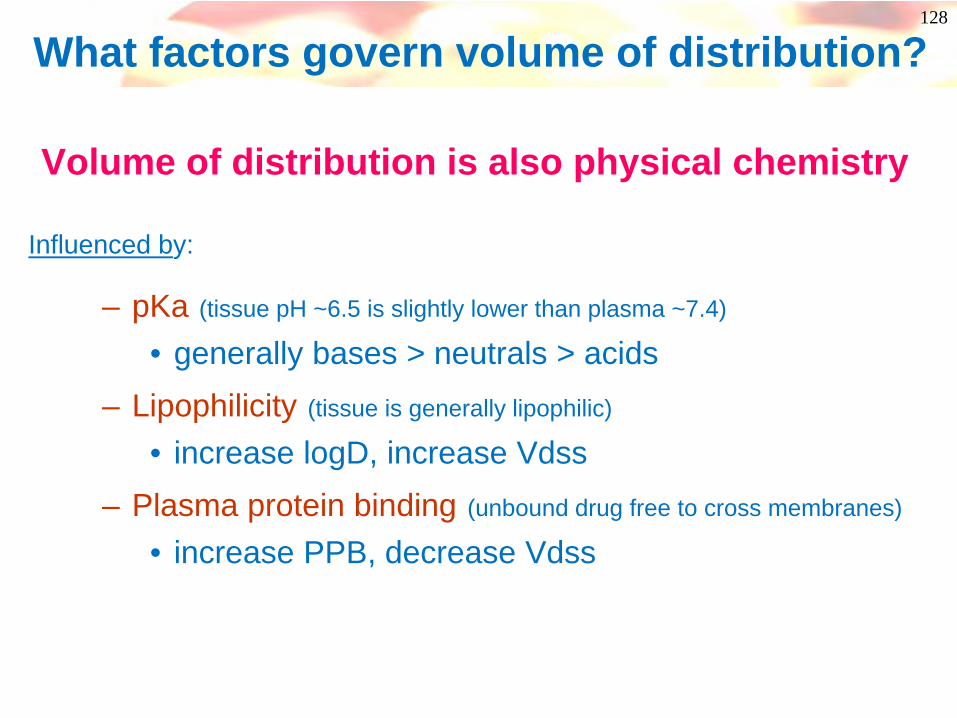
– pKa (tissue pH ~6.5 is slightly lower than plasma ~7.4)
• generally bases > neutrals > acids– Lipophilicity (tissue is generally lipophilic)
• increase logD, increase Vdss– Plasma protein binding (unbound drug free to cross membranes)
• increase PPB, decrease Vdss
What factors govern volume of distribution?
Volume of distribution is also physical chemistry
Influenced by:

129
1000
100
10
1
.1
.01
Vol
ume
of d
isti
buti
on (
L/kg
)
Log D-2 -1 -0 1 2 3 4 5 6 7
BasesAcidsNeutrals
Volume of Distribution correlates with LogD
Typical range
130
Volume of distribution can be modified
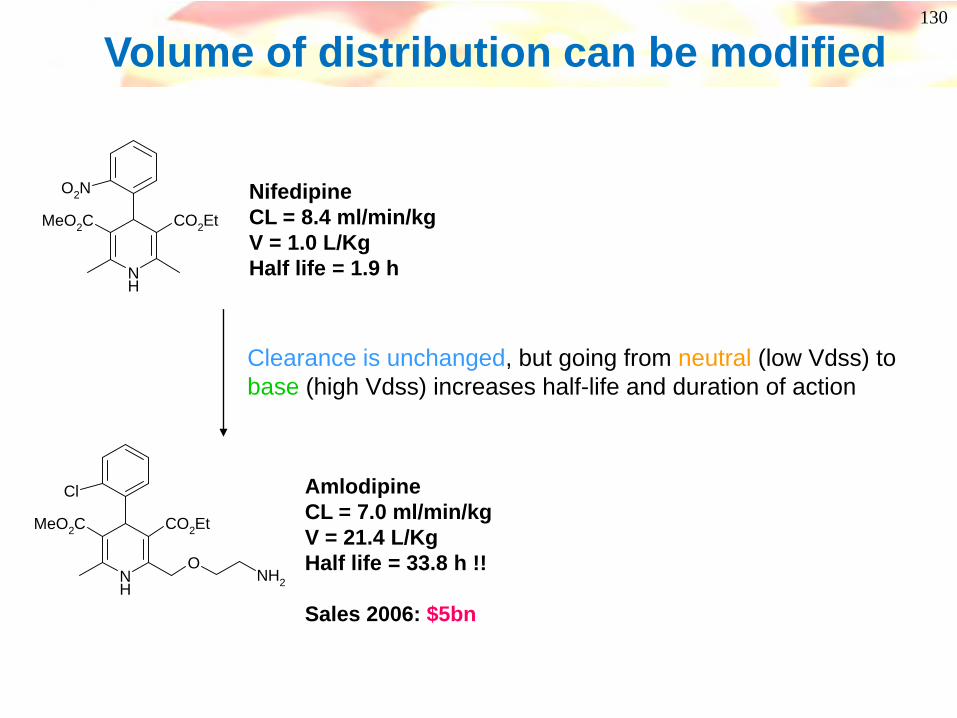
NH
CO2EtMeO2C
O2N
NH
CO2EtMeO2C
Cl
ONH2
NifedipineCL = 8.4 ml/min/kgV = 1.0 L/KgHalf life = 1.9 h
AmlodipineCL = 7.0 ml/min/kgV = 21.4 L/KgHalf life = 33.8 h !!
Sales 2006: $5bn
Clearance is unchanged, but going from neutral (low Vdss) to base (high Vdss) increases half-life and duration of action

131
Volume of distribution can be predictedEquations which combine lipophilicity, PPB and pKa give good predictions of Vdss. See J Med Chem 2004, 47, 1242-1250
logV
ss (
l/kg)
log(predicted Vss )
-2
132
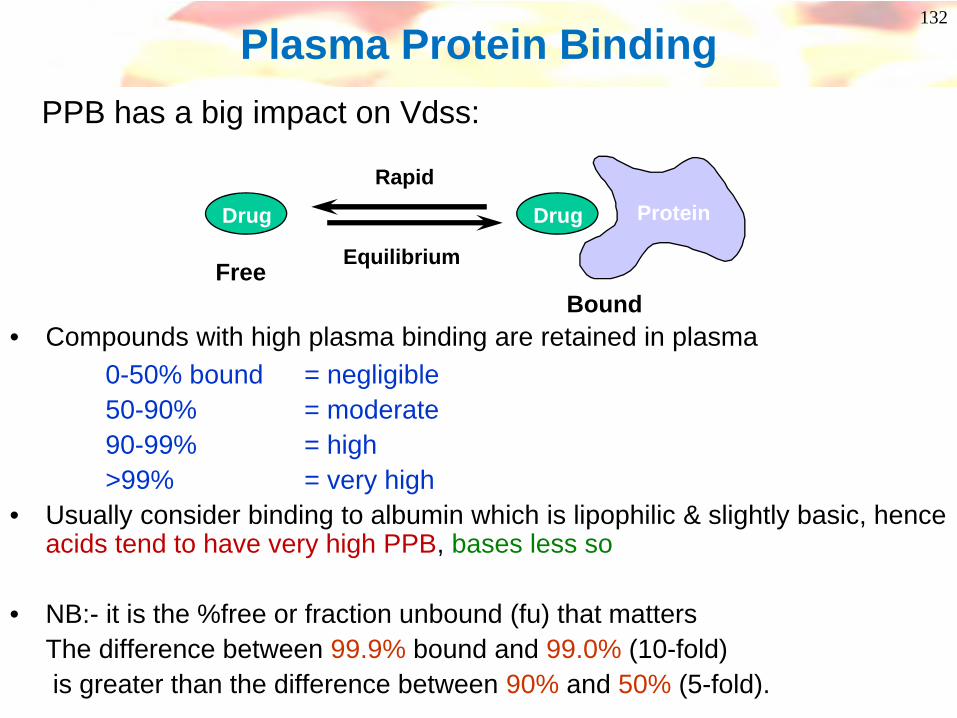
Plasma Protein BindingPPB has a big impact on Vdss:
• Compounds with high plasma binding are retained in plasma0-50% bound = negligible50-90% = moderate90-99% = high>99% = very high
• Usually consider binding to albumin which is lipophilic & slightly basic, hence acids tend to have very high PPB, bases less so
• NB:- it is the %free or fraction unbound (fu) that mattersThe difference between 99.9% bound and 99.0% (10-fold) is greater than the difference between 90% and 50% (5-fold).
Drug ProteinRapid
Equilibrium
Drug
FreeBound
133
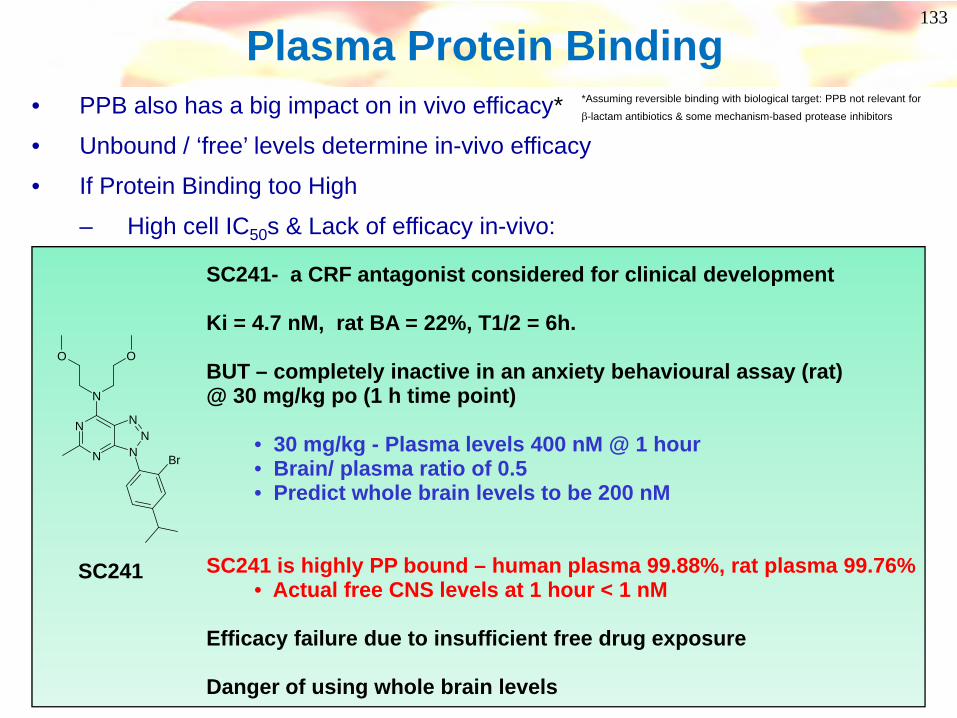
Plasma Protein Binding• PPB also has a big impact on in vivo efficacy*
• Unbound / ‘free’ levels determine in-vivo efficacy
• If Protein Binding too High
– High cell IC50s & Lack of efficacy in-vivo:
SC241- a CRF antagonist considered for clinical development
Ki = 4.7 nM, rat BA = 22%, T1/2 = 6h.
BUT – completely inactive in an anxiety behavioural assay (rat) @ 30 mg/kg po (1 h time point)
• 30 mg/kg - Plasma levels 400 nM @ 1 hour• Brain/ plasma ratio of 0.5• Predict whole brain levels to be 200 nM
SC241 is highly PP bound – human plasma 99.88%, rat plasma 99.76%• Actual free CNS levels at 1 hour < 1 nM
Efficacy failure due to insufficient free drug exposure
Danger of using whole brain levels
N
N NN
N
N
O O
Br
SC241
*Assuming reversible binding with biological target: PPB not relevant for
β-lactam antibiotics & some mechanism-based protease inhibitors
134
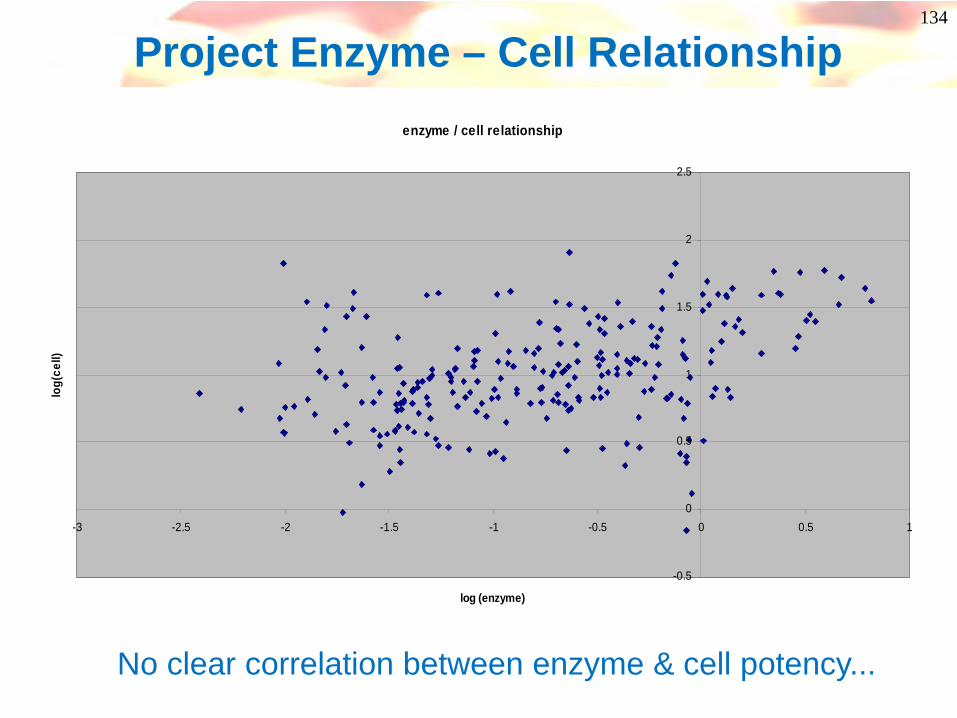
Project Enzyme – Cell Relationshipenzyme / cell relationship
-0.5
0
0.5
1
1.5
2
2.5
-3 -2.5 -2 -1.5 -1 -0.5 0 0.5 1
log (enzyme)
log(
cell)
No clear correlation between enzyme & cell potency...

135
PPB Correction of Enzyme-Cell Correlation
This axisincludes PPB& cellularPotencyparameters
Potency vs Enz
Intrinsic Potency in cells
Enzyme 100nM0.15% freeCell potency 3uM
Cell potency corrected to reflect free drug levels in assay
Factoring in protein binding showsclearer correlation between enzyme & cell potency

136What you can do about PPB– reduce lipophilicity!
O
O
OH
O
N
OO
O
N
OHO
O
O
N
OH
logD (7.4) 1.6 -0.05 -0.04
ETA IC50 4.0 nM 70 nM 3.0 nM
ETA IC50 + 10% plasma 95 nM 150 nM 9.0 nM
Decrease in blood pressure(rat) @ 25 μmol/kg i.v. 10X 90X(shift in drc to ET-1)
Example:Reducing PPB in a series of acidic endothelin ETA receptor antagonistsJ. Med. Chem. 2000, 43, 900-910
137
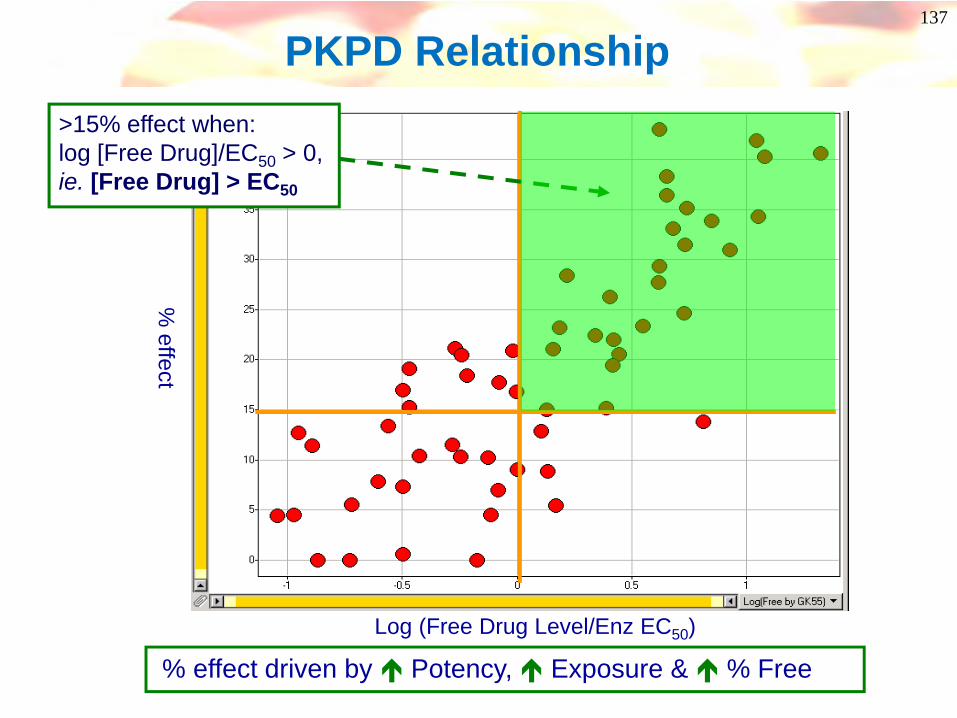
% effect
Log (Free Drug Level/Enz EC50)
PKPD Relationship
% effect driven by Potency, Exposure & % Free
>15% effect when: log [Free Drug]/EC50 > 0, ie. [Free Drug] > EC50

138
So now you can predict in vivo activity!
• Imagine you are in the project team using the model on the slide before.
• You have two compounds, but which is the best?
EC50 0.02 0.07PPB 99.7% 98%Oral Cmax 2.0uM 4.5uMPredicted in vivo activity ? ?
A B

139
Coffee Break

140
You can predict in vivo activity!
IC50 0.02 0.07PPB 99.7% 98%Oral Cmax 2.0uM 4.5uM
Free Cmax 0.3% of 2.0 2% of 4.5= 0.006uM = 0.09uM
Multiple of IC50 0.006/0.02 0.09/0.07=0.3 =1.3
Predicted in vivo <15% >15%activity
A B
141
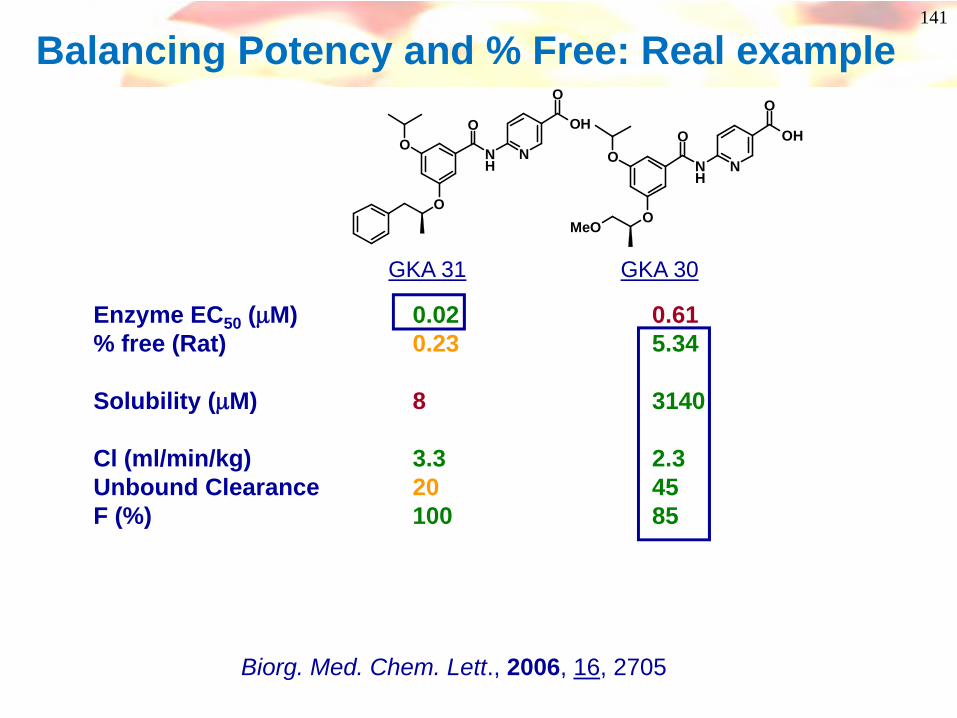
Balancing Potency and % Free: Real example
Enzyme EC50 (μM) 0.02 0.61% free (Rat) 0.23 5.34
Solubility (μM) 8 3140
Cl (ml/min/kg) 3.3 2.3Unbound Clearance 20 45F (%) 100 85
NH
O
O
O N
OH
O
NH
O
O
O N
OH
O
MeO
GKA 31 GKA 30
Biorg. Med. Chem. Lett., 2006, 16, 2705
142
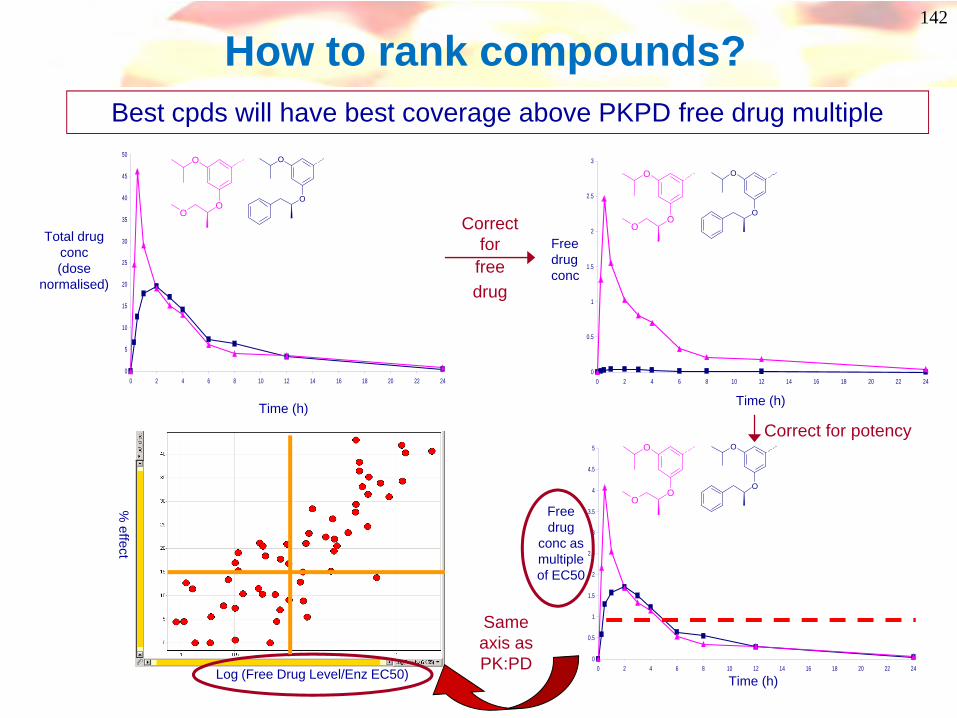
How to rank compounds? Best cpds will have best coverage above PKPD free drug multiple
0
5
10
15
20
25
30
35
40
45
50
0 2 4 6 8 10 12 14 16 18 20 22 24
Total drug conc(dose
normalised)
Time (h)
O
O
OO
O
0
0.5
1
1.5
2
2.5
3
0 2 4 6 8 10 12 14 16 18 20 22 24
Free drug conc
Correct for
free drug
Time (h)
O
O
OO
O
0
0.5
1
1.5
2
2.5
3
3.5
4
4.5
5
0 2 4 6 8 10 12 14 16 18 20 22 24
Correct for potency
Free drug
conc as multiple of EC50
Time (h)
O
O
OO
O
% effect
Same axis as PK:PD
Log (Free Drug Level/Enz EC50)
143
3
4
5
6
7
8
9
10
11
PreCpd
0 20 40 60
Time (mins)
Plas
ma
Glu
cose
(mm
ol/L
)
Vehicle
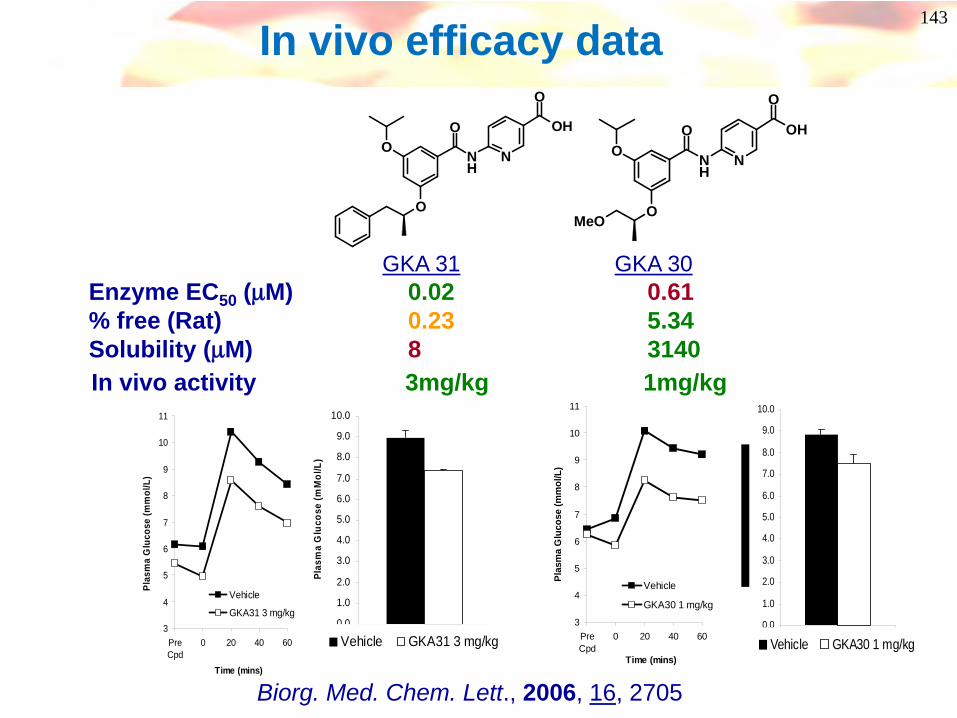
GKA31 3 mg/kg
Enzyme EC50 (μM) 0.02 0.61% free (Rat) 0.23 5.34Solubility (μM) 8 3140In vivo activity 3mg/kg 1mg/kg
In vivo efficacy data
3
4
5
6
7
8
9
10
11
PreCpd
0 20 40 60
Time (mins)
Plas
ma
Glu
cose
(mm
ol/L
)
Vehicle
GKA30 1 mg/kg
0.0
1.0
2.0
3.0
4.0
5.0
6.0
7.0
8.0
9.0
10.0
1
Plas
ma
Glu
cose
(mM
ol/L
)
Vehicle GKA31 3 mg/kg0.0
1.0
2.0
3.0
4.0
5.0
6.0
7.0
8.0
9.0
10.0
1Vehicle GKA30 1 mg/kg
NH
O
O
O N
OH
O
NH
O
O
O N
OH
O
MeO
GKA 31 GKA 30
Biorg. Med. Chem. Lett., 2006, 16, 2705

144
And if you can predict in vivo activity, perhaps you can predict the human
dose too!

145
PredictedDose
PK:PDPred human PK
Fabs(BA)
Half-life
Vdss
Clearance
From in vivo pharmacology
From in vivo preclinical species and permeability (eg Caco)
Assess from in vivo PK work and physical chemistry
Predict human Cl from human microsomes or hepatocytes and in vivo preclinical species
Prediction of Human Dose - Factors
146
Toxicity
147
How do you know you have a problem?
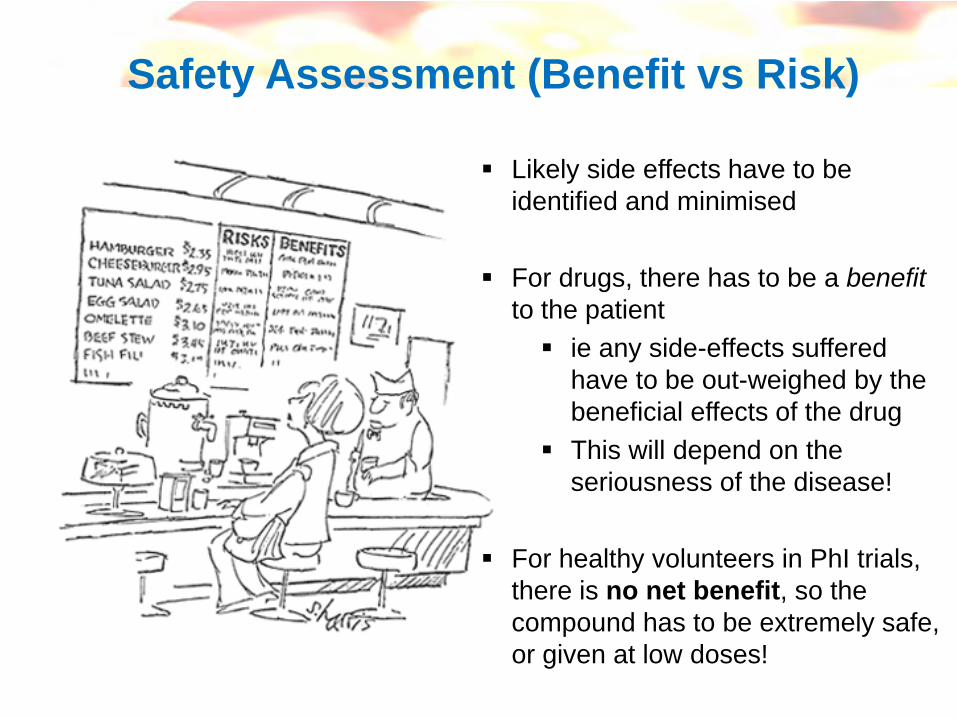
Likely side effects have to be identified and minimised
For drugs, there has to be a benefit to the patient
ie any side-effects suffered have to be out-weighed by the beneficial effects of the drugThis will depend on the seriousness of the disease!
For healthy volunteers in PhI trials, there is no net benefit, so the compound has to be extremely safe, or given at low doses!
Safety Assessment (Benefit vs Risk)
149
The Role of Toxicology• Identify Hazards
– Need to identify potential target organs– Need to know of consequences of overdosing
• Assess Risk to Man– Key is to understand the worst scenario in human - not what happens at
efficacious dose– Need (a regulatory requirement!) to dose as high as possible
• 2g/kg(/day) or MTD or max. solubility or max. total plasma levels are reached
• This can be several hundred fold higher than the efficacious dose• But, to put in context, need to know margin of safety
– Need to look at reversibility of any toxicities– Is the toxicity premonitorable?
• To assess risk you must understand: 1. Hazard2. Margins 3. Relevance to man
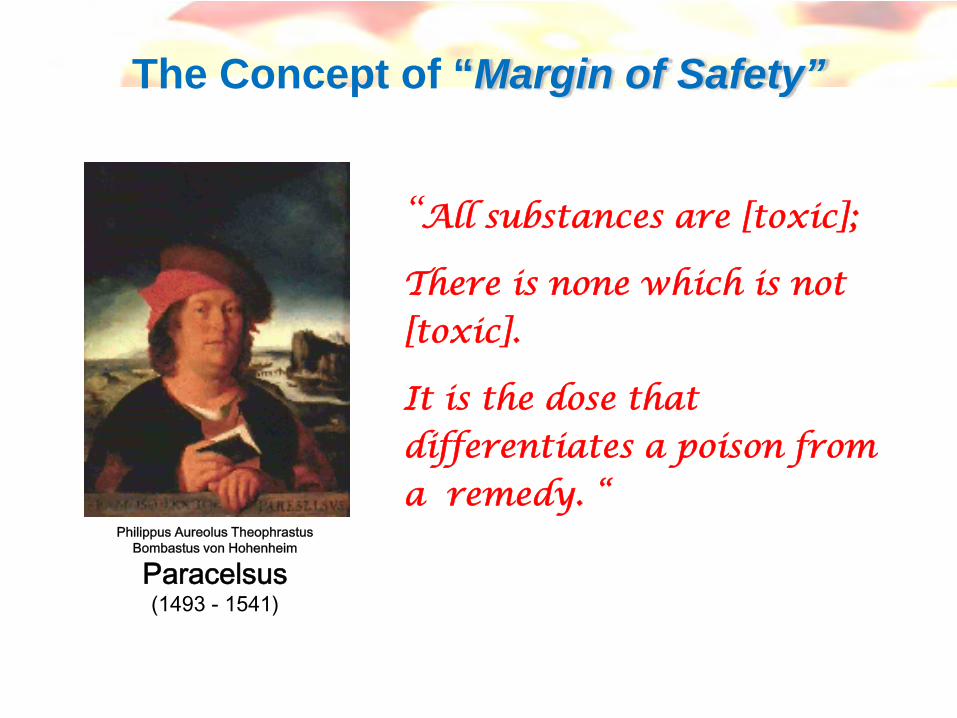
Philippus Aureolus Theophrastus Bombastus von Hohenheim
Paracelsus(1493 - 1541)
“All substances are [toxic];
There is none which is not [toxic].
It is the dose that differentiates a poison from a remedy. “
The Concept of “Margin of Safety”

151
Margin of Safety
Compound exposure (AUC, Cmax)
100
50
% EffectDiseasemodel
Side effect/ toxicity
ED50
No effect limit< MOS >
Highest Exposure Associated with No Toxicity
(No Effect Limit, NOEL)or “Manageable” Toxicity
(No Adverse Effect Limit, NOAEL)
Efficacious Exposure in Appropriate Model
Based on exposure, not dose!

A Narrow Margin of Safety in Non-Clinical Species Does Not Kill Compounds
What Does Kill Compounds?1. Lack of Monitorability2. Lack of Reversibility3. Uncertainty Regarding the Translation to Man
Target Hit Lead CS Ph I Ph II Ph III FS FA FL GL
What Happens to Non-Clinical MOS With Time?
Launch
153
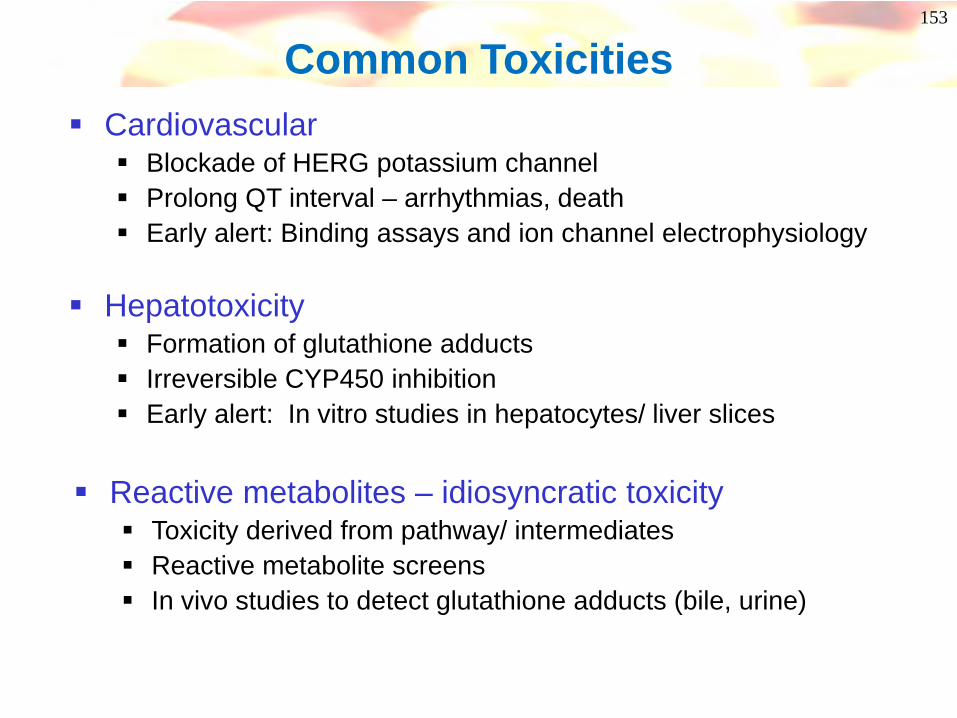
CardiovascularBlockade of HERG potassium channelProlong QT interval – arrhythmias, deathEarly alert: Binding assays and ion channel electrophysiology
Common Toxicities
HepatotoxicityFormation of glutathione adductsIrreversible CYP450 inhibitionEarly alert: In vitro studies in hepatocytes/ liver slices
Reactive metabolites – idiosyncratic toxicityToxicity derived from pathway/ intermediatesReactive metabolite screensIn vivo studies to detect glutathione adducts (bile, urine)

154
Phospholipidosis/ phospholipid accumulation in cellsCationic amphiphilic drugs
Eg: amiodarone - lung and liver toxicityLipophilic ring + hydrophilic chain bearing cationic group
In vitro cellular assays and chromatographic methodsHigh Vd can be a warning
O
Bu
O
I
I
ON
CNS side effectsBBB penetrationOff target pharmacologyEarly alert: broad CNS receptor and enzyme screening
Common Toxicities
Genetic toxicity/ MutagenicityMini-Ames and in vitro micronucleus tests
155
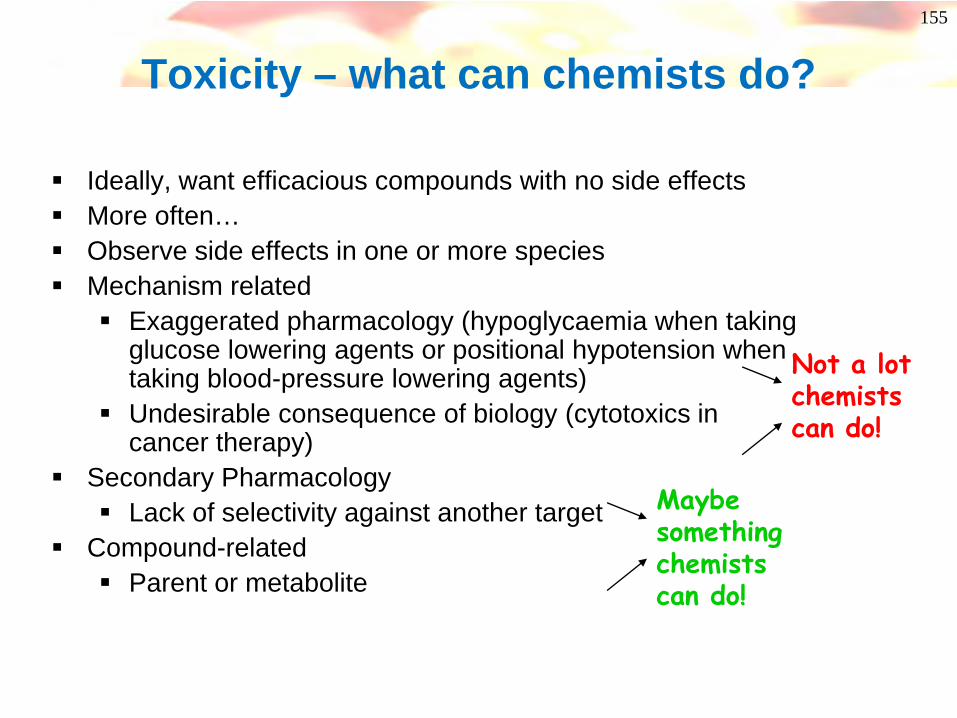
Ideally, want efficacious compounds with no side effectsMore often…Observe side effects in one or more speciesMechanism related
Exaggerated pharmacology (hypoglycaemia when taking glucose lowering agents or positional hypotension when taking blood-pressure lowering agents)Undesirable consequence of biology (cytotoxics in cancer therapy)
Secondary PharmacologyLack of selectivity against another target
Compound-relatedParent or metabolite
Toxicity – what can chemists do?
Not a lot chemists can do!
Maybe something chemists can do!

156
hERG - Background
• Human Ether-a-Go-Go-Related Gene • Potassium ion channel expressed in heart• Associated with QT interval prolongation • Can cause arrythmia and sudden death!• Terfenadine, cisapride and astemizole withdrawn due
to Herg blockade
P
Q
R
TECG
QT

157
hERG – What can chemists do?• Most potent hERG inhibitors seem to be strongly basic + highly
lipophilic molecules – reduce logP and attenuate basicity (pKa)
• Avoid hERG pharmacophores
• Ability to form π-stacking and hydrophobic interactions with aromatic residues on hERG is important – these can be disrupted
• J. Med Chem (2006) 49(17) 5029-5046 for recent review of assays and strategies for reducing hERG activity.
Terfenadine fitted to a QSAR derived Herg PharmacophoreHydrophobic regions in cyanPositive ionizable regions in red
N
OHOH

158
Reducing Activity at hERGNeurogen: Neuropeptide Y-Y5 antagonists
• Lower lipophilicity-adding hydrophilic groupsCF3
NH
N
hERG 60% @ 3µMlogP = 3.34
hERG 6% @ 3µMlogP = 2.3
J. Med. Chem 2004, 47, 2318-2325
CF3
NH
NO
NH
OH
CF3
NH
NNH S
OO
O
hERG 87% @ 300nM hERG 7% @ 3µM
CF3
NH
NNH S
OO
• Acidic
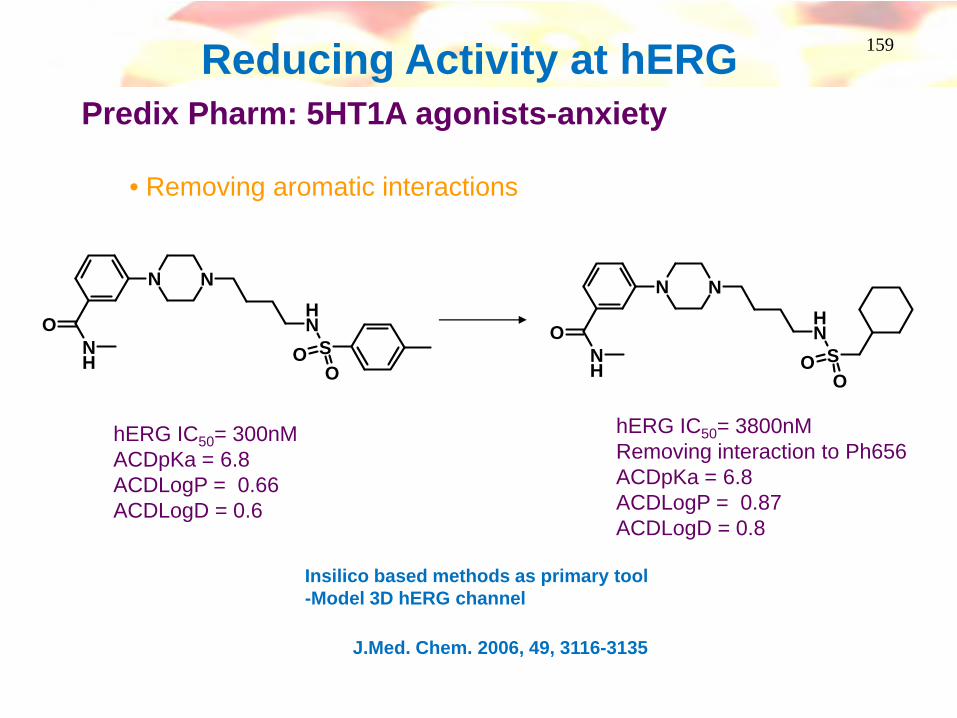
159Reducing Activity at hERGPredix Pharm: 5HT1A agonists-anxiety
• Removing aromatic interactions
N N
NH
SOO
ONH
N N
NH
SOO
ONH
hERG IC50= 300nMACDpKa = 6.8ACDLogP = 0.66ACDLogD = 0.6
hERG IC50= 3800nMRemoving interaction to Ph656ACDpKa = 6.8ACDLogP = 0.87ACDLogD = 0.8
J.Med. Chem. 2006, 49, 3116-3135
Insilico based methods as primary tool-Model 3D hERG channel
160
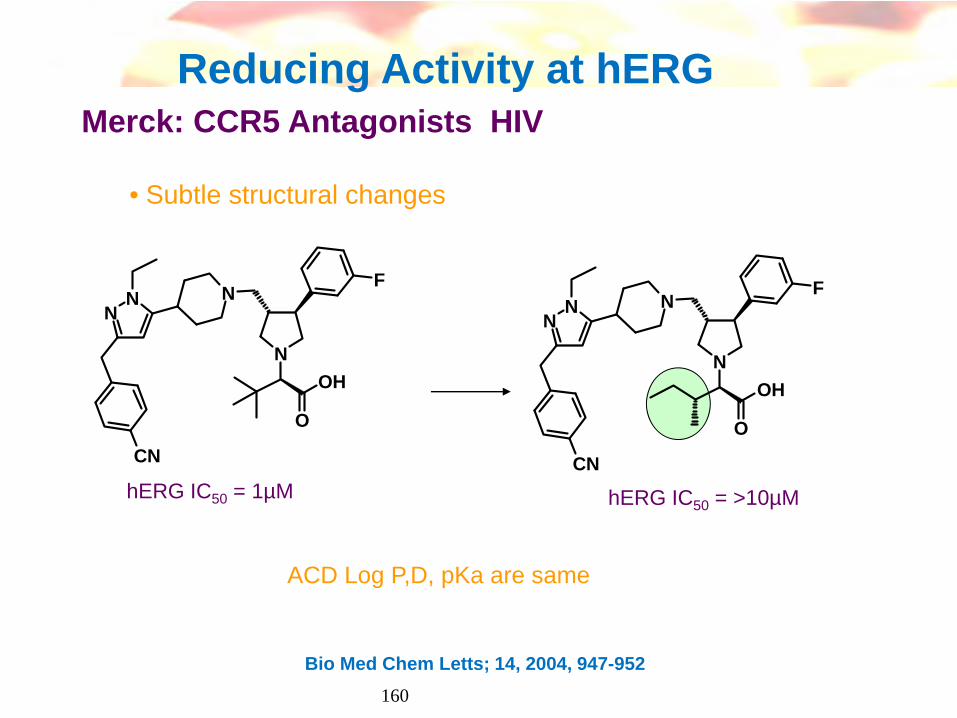
Reducing Activity at hERG Merck: CCR5 Antagonists HIV
• Subtle structural changes
N
N
F
O
OH
NN
CN
hERG IC50 = 1µM hERG IC50 = >10µM
Bio Med Chem Letts; 14, 2004, 947-952
N
N
F
O
OH
NN
CN
ACD Log P,D, pKa are same
161
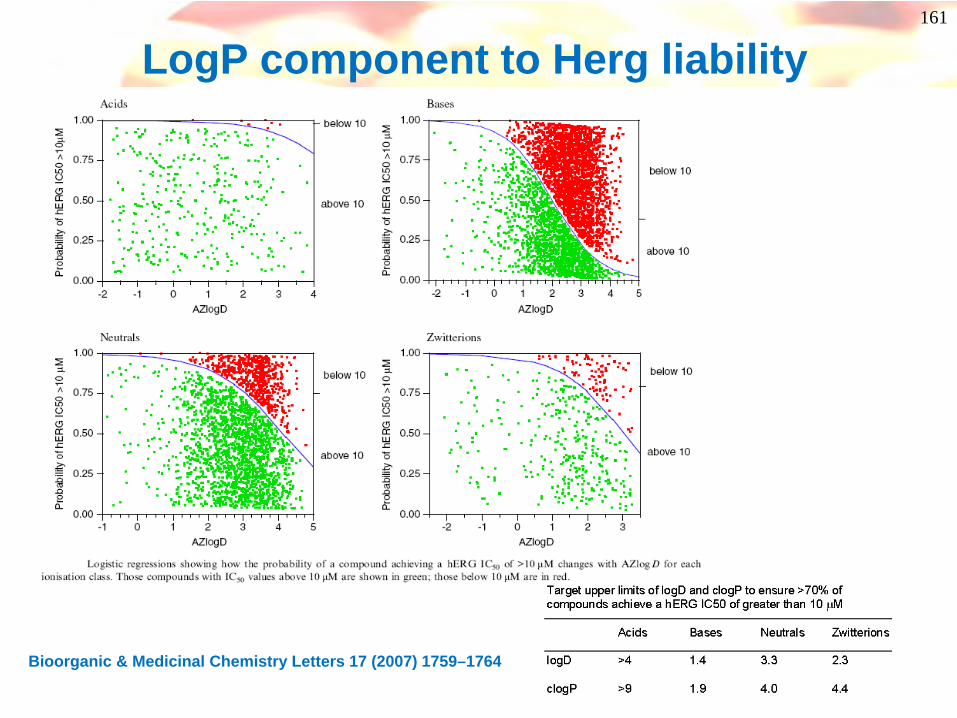
LogP component to Herg liability
Bioorganic & Medicinal Chemistry Letters 17 (2007) 1759–1764
162
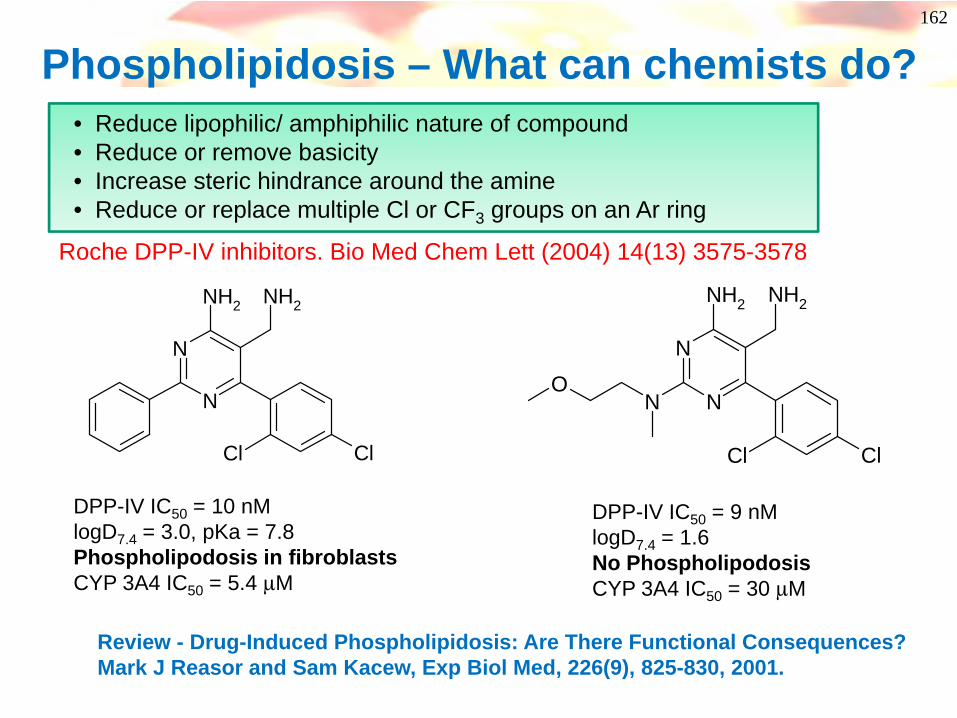
Phospholipidosis – What can chemists do?
N
N
NH2 NH2
Cl Cl
• Reduce lipophilic/ amphiphilic nature of compound • Reduce or remove basicity• Increase steric hindrance around the amine• Reduce or replace multiple Cl or CF3 groups on an Ar ring
Review - Drug-Induced Phospholipidosis: Are There Functional Consequences? Mark J Reasor and Sam Kacew, Exp Biol Med, 226(9), 825-830, 2001.
Roche DPP-IV inhibitors. Bio Med Chem Lett (2004) 14(13) 3575-3578
DPP-IV IC50 = 10 nMlogD7.4 = 3.0, pKa = 7.8Phospholipodosis in fibroblastsCYP 3A4 IC50 = 5.4 μM
N
NN
NH2 NH2
Cl Cl
O
DPP-IV IC50 = 9 nMlogD7.4 = 1.6No Phospholipodosis CYP 3A4 IC50 = 30 μM

163
And sometimes it seems that there’s not a lot that chemists can do….
But look more closely!
164
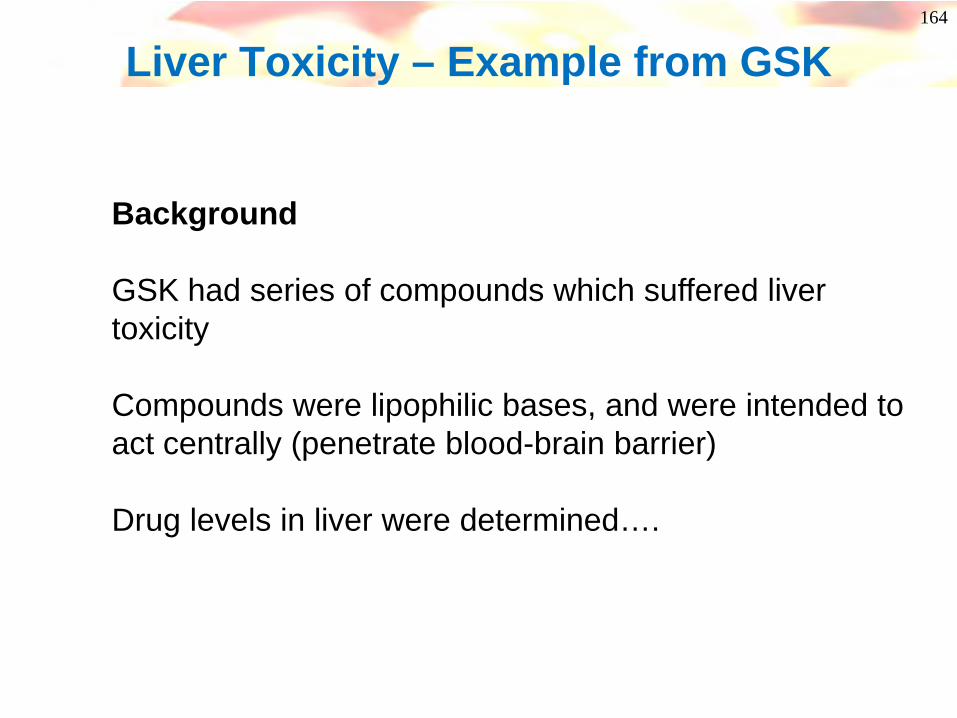
Liver Toxicity – Example from GSK
Background
GSK had series of compounds which suffered liver toxicity
Compounds were lipophilic bases, and were intended to act centrally (penetrate blood-brain barrier)
Drug levels in liver were determined….
165
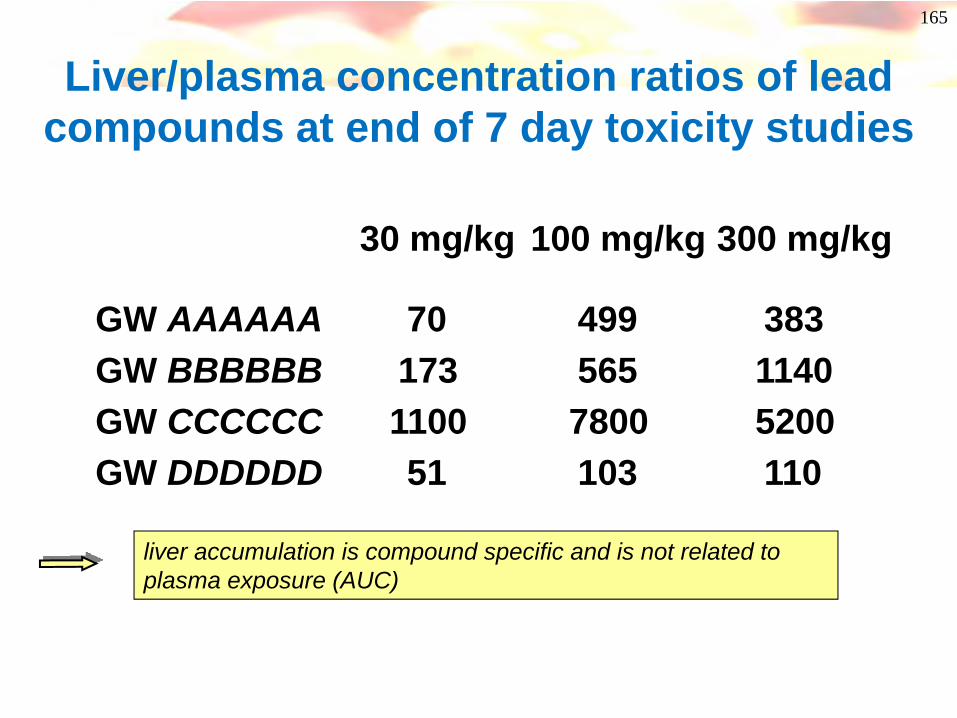
Liver/plasma concentration ratios of lead compounds at end of 7 day toxicity studies
liver accumulation is compound specific and is not related to plasma exposure (AUC)
30 mg/kg 100 mg/kg 300 mg/kg
GW AAAAAA 70 499 383GW BBBBBB 173 565 1140GW CCCCCC 1100 7800 5200GW DDDDDD 51 103 110
166
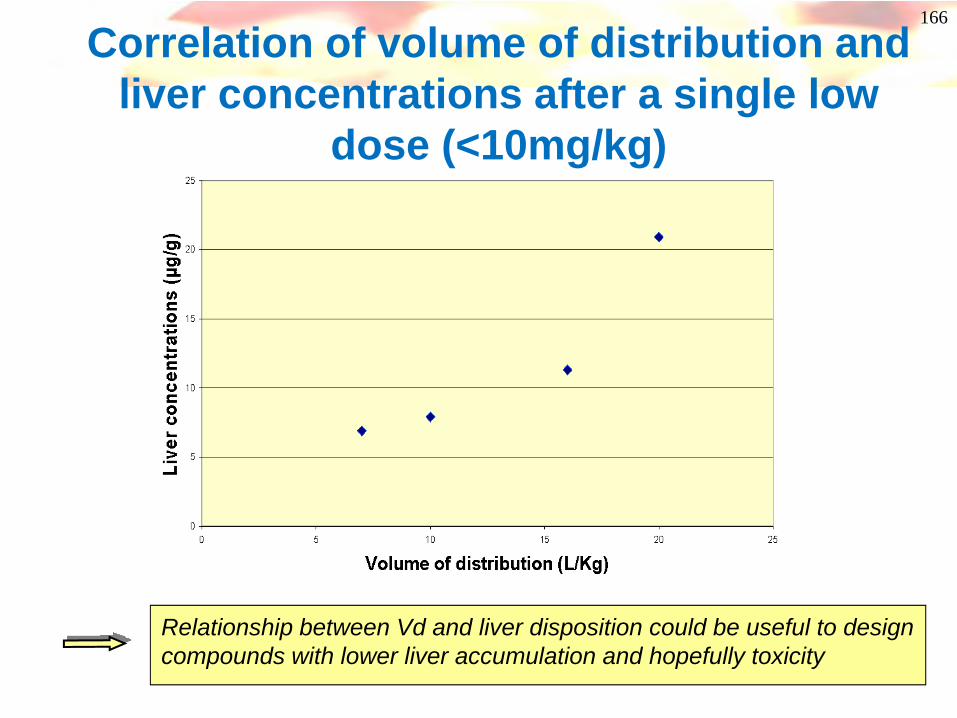
Correlation of volume of distribution and liver concentrations after a single low
dose (<10mg/kg)
Relationship between Vd and liver disposition could be useful to design compounds with lower liver accumulation and hopefully toxicity
167
Volume of Distribution
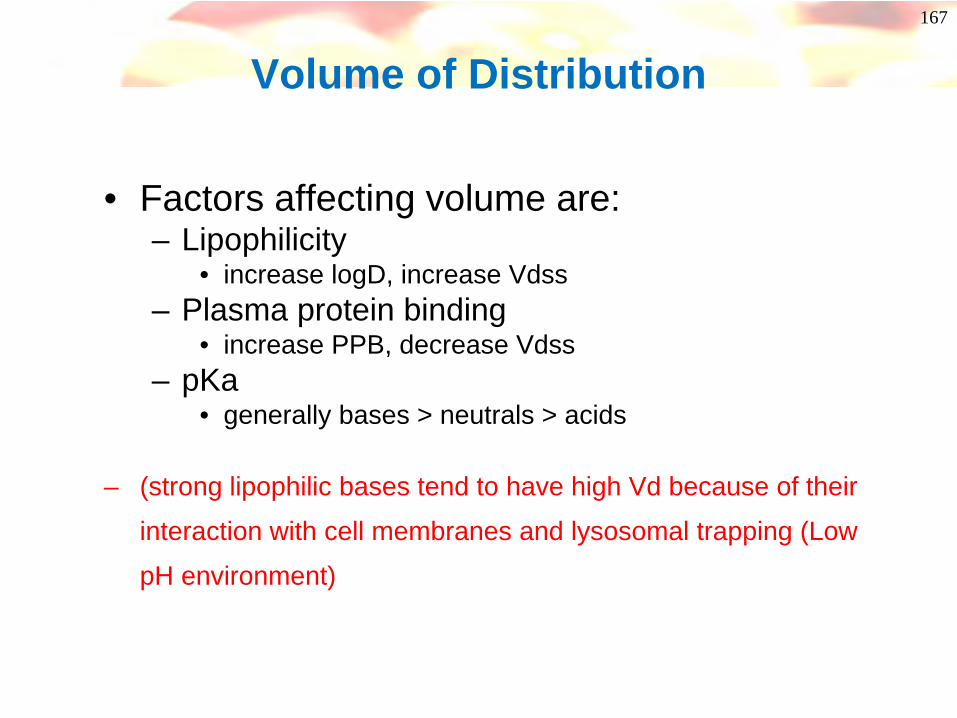
• Factors affecting volume are:– Lipophilicity
• increase logD, increase Vdss– Plasma protein binding
• increase PPB, decrease Vdss– pKa
• generally bases > neutrals > acids
– (strong lipophilic bases tend to have high Vd because of their
interaction with cell membranes and lysosomal trapping (Low
pH environment)
168
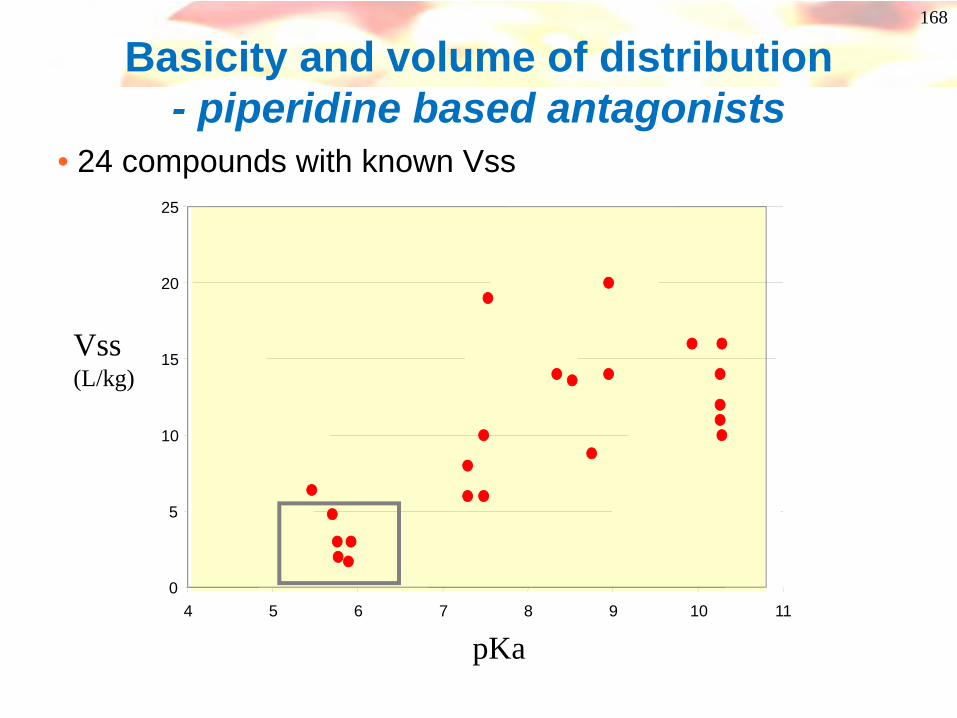
Basicity and volume of distribution - piperidine based antagonists
• 24 compounds with known Vss
pKa
Vss(L/kg)
0
5
10
15
20
25
4 5 6 7 8 9 10 11
169
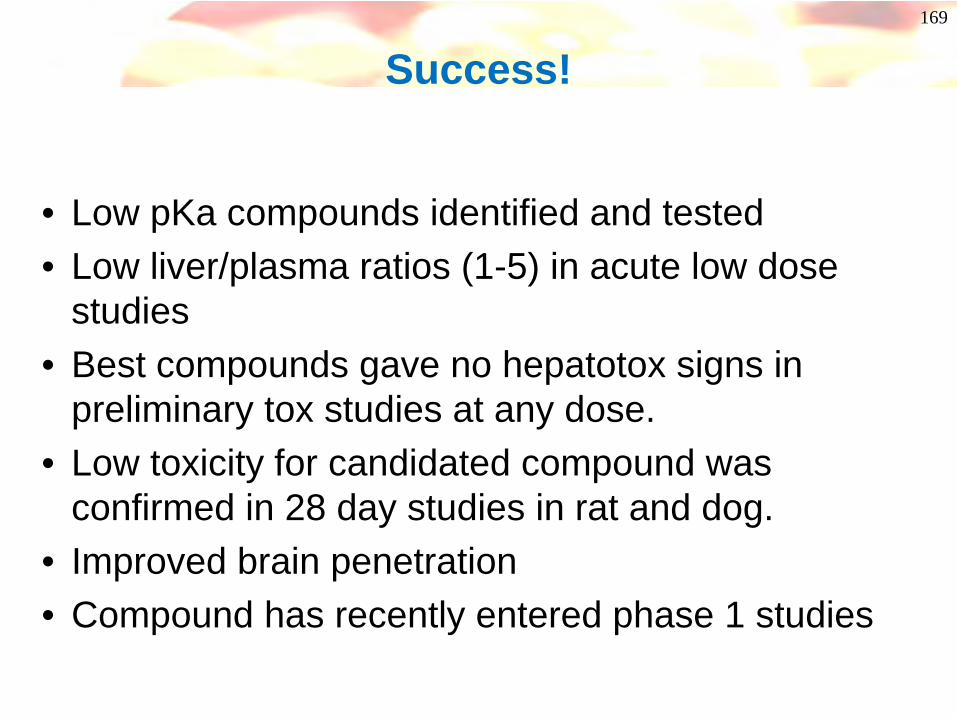
Success!
• Low pKa compounds identified and tested• Low liver/plasma ratios (1-5) in acute low dose
studies• Best compounds gave no hepatotox signs in
preliminary tox studies at any dose.• Low toxicity for candidated compound was
confirmed in 28 day studies in rat and dog.• Improved brain penetration• Compound has recently entered phase 1 studies
170
Reactive molecules and metabolites
• The body is full of mild nucleophiles (proteins, peptides, glutathione etc)
• Reaction between small molecules and proteins or peptides can give rise to foreign adducts
• These adducts can cause immunological responses or further organ toxicities
• This kind of toxicology is often spotted late –very expensive!

171
What can chemists do?• Avoid electrophilic compounds
– eg electron deficient aromatic rings with leaving groups
N Cl
R
N
N
Cl
R
S R S R
O
S R
OH
Nu
Metabolismbiological nucleophile
• And motifs/ groups which could give reactive metabolites – Eg thiophenes, furans
Reviews - A Comprehensive Listing of Bioactivation Pathways of Organic Functional GroupsA.S.Kalgutkar et al , Current Drug Metabolism, 2005, 6, 161-225.- Biotransformation Reactions of Five-Membered Aromatic Heterocyclic Rings, Chem. Res. Toxicol., 2002, 15, 269-299

172
Reactive metabolite example from Pfizer
N NN
O
Cl
Cl
N SO2NH2
NK2 antagonist Oral Bioavailability <10%
Compound stopped due to testicular toxicity
NN
O
Cl
Cl
N F
Absorption increased by raising logP
NH
OO N
H
NH2
OH
O
SH
O
OHGlutathione GSH =
NR N SGR
Oxidation
-F + GSH

173
Acyl Migration and Covalent Binding
OHO
ROOH
OH
O
OH
OHOH
OOHOH
O
OH
OHO
RO
OOHOH
O
OH
OOH
O
R
OOHOH
O
O
OHOH
RO
OOOH
O
OH
OHOH
R
O
OHOH
O
OH
O O
R
OHO
OHOH
O
OH
O O
R
OHN
protein
Parent acid Glucuronic acid
GlucuronylTransfer (UDPGT)
Hydrolysis
1-O-acylglucuronide
2,3,4-O-acyl glucuronides
Reactive aldehydeCovalent bindingto NH2’s of proteins
Rearrangement
ImmunogenicImplicated in GI toxicity
Acyl glucuronides
For a review Current Opinion in Drug Discovery & Development 2007 10(1):58-66

174174
Reactive metabolite example from Pfizer
Major circulating Metabolite in dog
O
O
O
O
NH
SN
N O
O
O
O
NH
SN
N
Gluc
UK 414,495Potent NEP inhibitorPrototype candidate stopped due to GI tox
Rapid formation of reactive diimide in vivo via acyl glucuronideDriven by pKa of amide?
O
O
O
OH
NHThiadiazole
O
O
ONHThiadiazole
SG
Toxic glutathione conjugate
GSH
pKa 9.6
t1/2 = 0.17h
t1/2 = 8.7h
NO
ThiadiazoleO
O
Thanks to David Pryde
SOLUTION – identify equipotent analogue with amide pKa >10UK 447,841 – stable acyl glucuronide and cyclic imide
- successful candidate in P1.
O
O
O
O
NH
Cl
Calc pKa = 16
175
Toxicophores for Mutagenicity
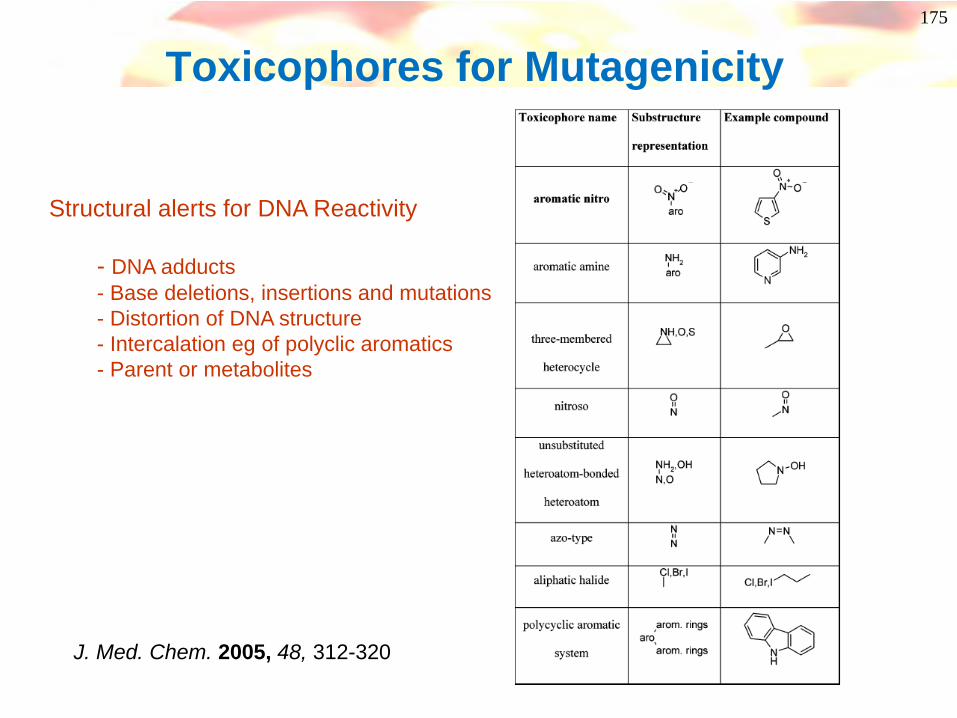
J. Med. Chem. 2005, 48, 312-320
Structural alerts for DNA Reactivity
- DNA adducts- Base deletions, insertions and mutations- Distortion of DNA structure- Intercalation eg of polyclic aromatics- Parent or metabolites

176
Toxicity of anilines and derivatives
NH
AcN
OH
AcN
O
Ac
SO3H
NAc
+
NAc
+
CyP 450
Interaction with proteins or DNAOrgan toxicityGenetic Toxicity
The more electron rich the aniline, the greater the risk!
177
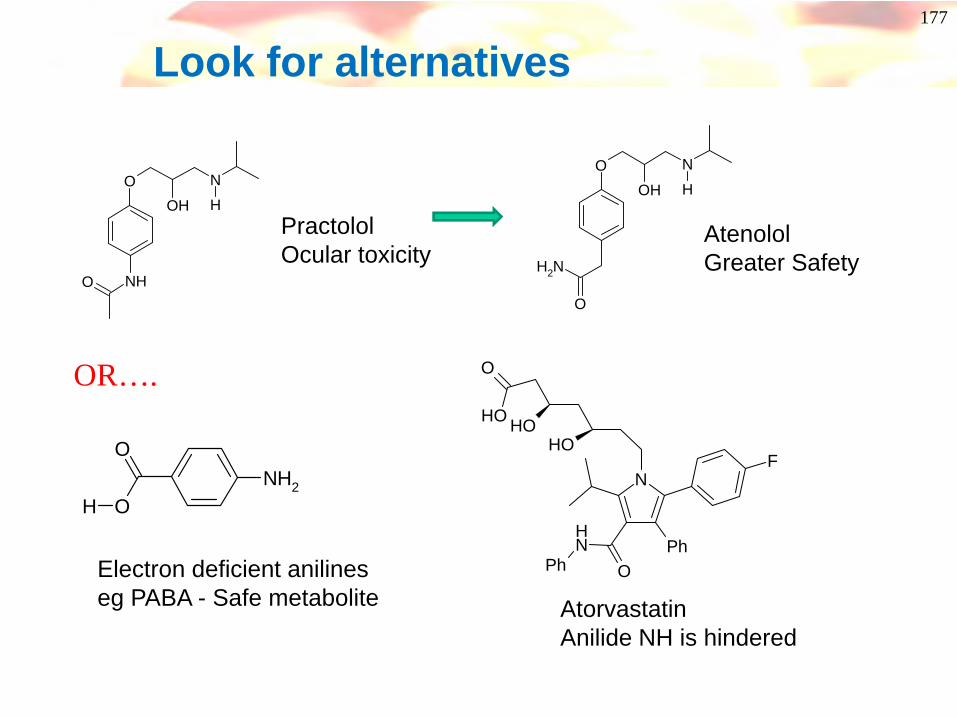
Look for alternatives
OOH
NH
NHO
PractololOcular toxicity
OOH
NH
NH2
O
AtenololGreater Safety
OR….
NH2
O
OH
Electron deficient anilineseg PABA - Safe metabolite
N
Ph
F
ONH
Ph
OH
OH
O
OH
AtorvastatinAnilide NH is hindered
178
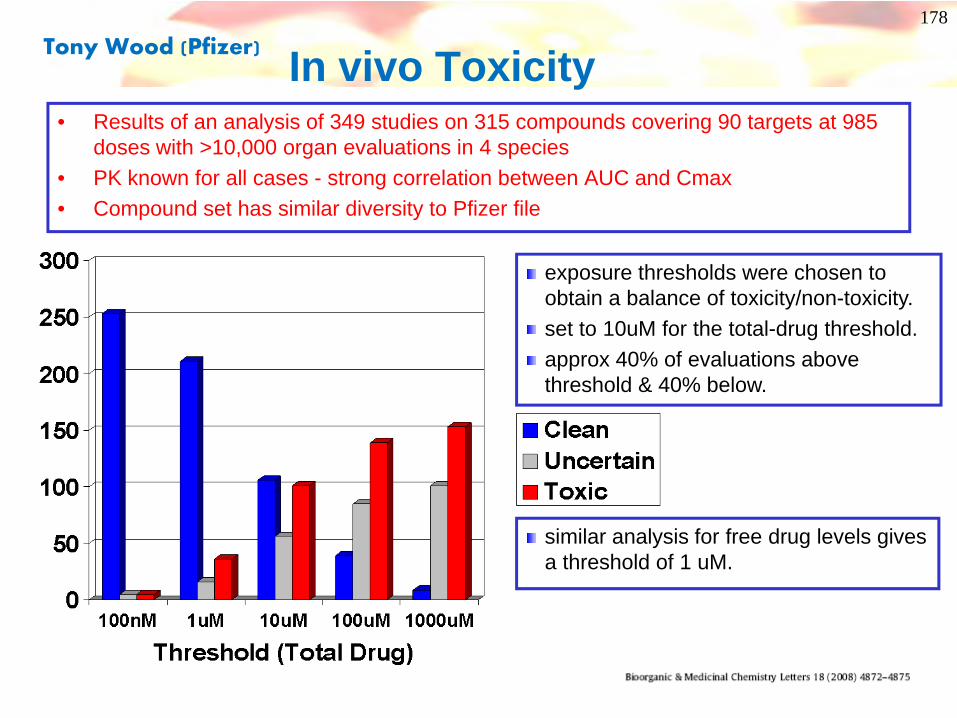
In vivo Toxicity
exposure thresholds were chosen to obtain a balance of toxicity/non-toxicity. set to 10uM for the total-drug threshold.approx 40% of evaluations above threshold & 40% below.
similar analysis for free drug levels gives a threshold of 1 uM.
• Results of an analysis of 349 studies on 315 compounds covering 90 targets at 985 doses with >10,000 organ evaluations in 4 species
• PK known for all cases - strong correlation between AUC and Cmax• Compound set has similar diversity to Pfizer file
Tony Wood (Pfizer)
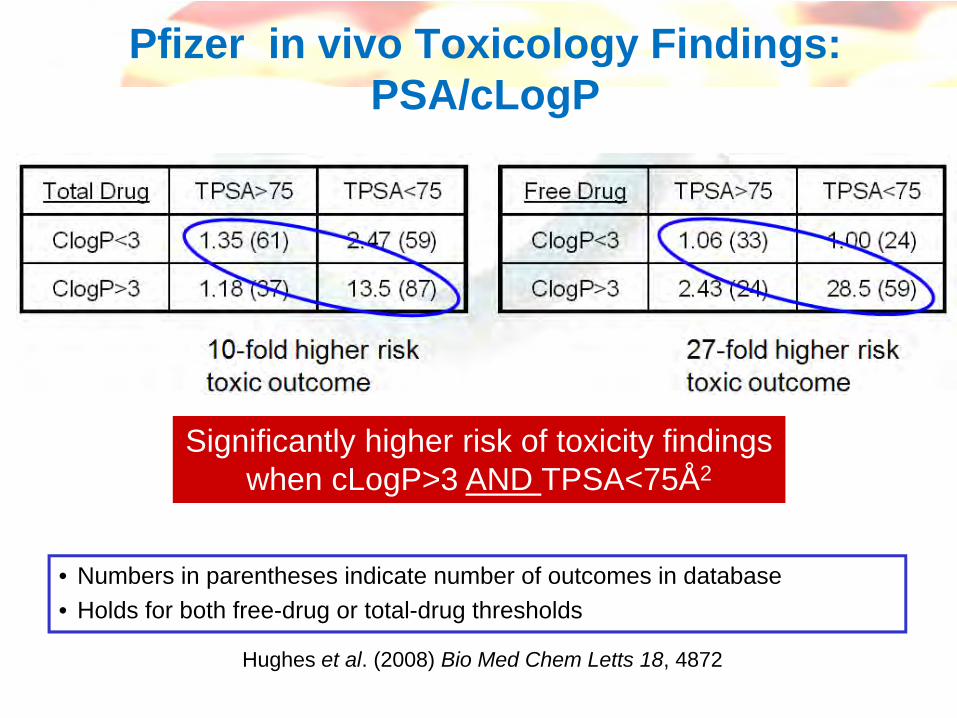
Pfizer in vivo Toxicology Findings: PSA/cLogP
Significantly higher risk of toxicity findingswhen cLogP>3 AND TPSA<75Å2
Hughes et al. (2008) Bio Med Chem Letts 18, 4872
• Numbers in parentheses indicate number of outcomes in database• Holds for both free-drug or total-drug thresholds
180Lipophilicity and Promiscuity
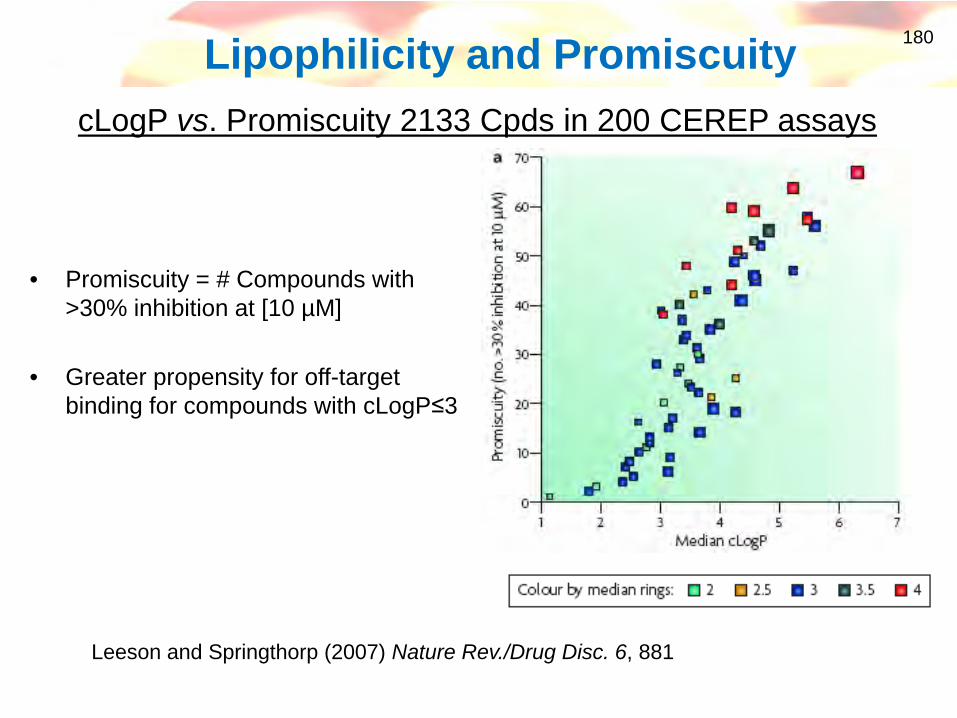
• Promiscuity = # Compounds with >30% inhibition at [10 µM]
• Greater propensity for off-target binding for compounds with cLogP≤3
cLogP vs. Promiscuity 2133 Cpds in 200 CEREP assays
Leeson and Springthorp (2007) Nature Rev./Drug Disc. 6, 881
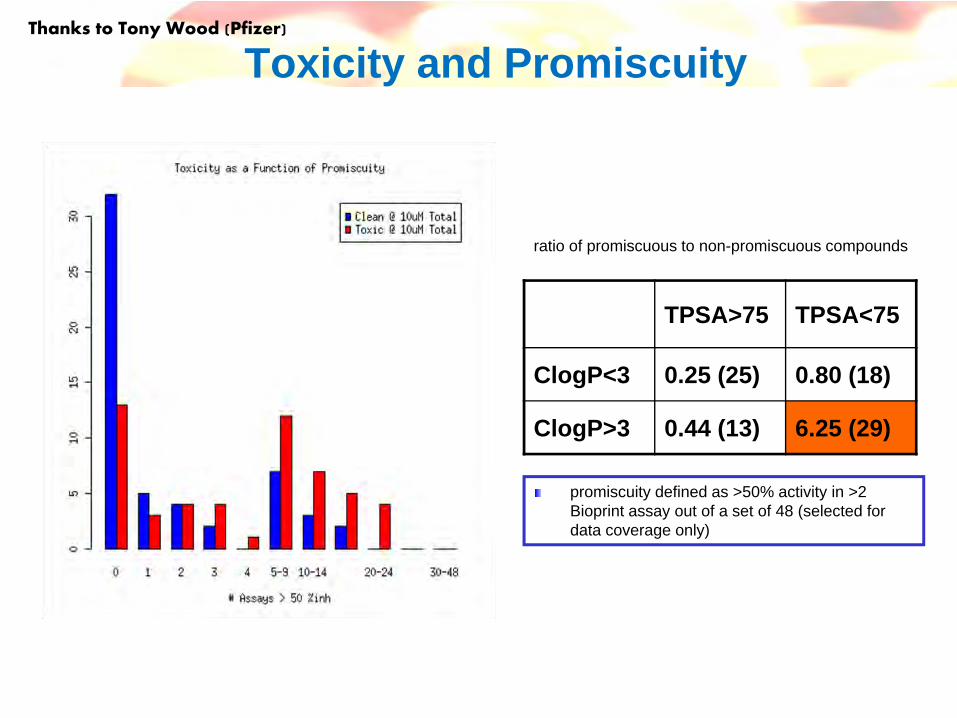
Toxicity and Promiscuity
TPSA>75 TPSA<75
ClogP<3 0.25 (25) 0.80 (18)
ClogP>3 0.44 (13) 6.25 (29)
ratio of promiscuous to non-promiscuous compounds
promiscuity defined as >50% activity in >2 Bioprint assay out of a set of 48 (selected for data coverage only)
Thanks to Tony Wood (Pfizer)
182
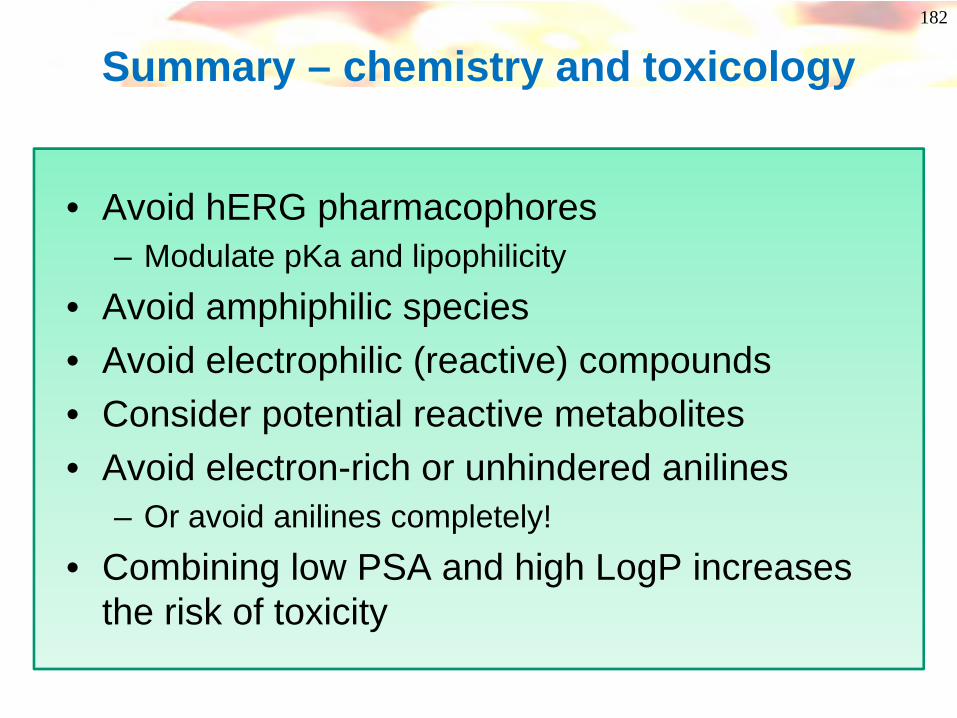
Summary – chemistry and toxicology
• Avoid hERG pharmacophores– Modulate pKa and lipophilicity
• Avoid amphiphilic species• Avoid electrophilic (reactive) compounds • Consider potential reactive metabolites• Avoid electron-rich or unhindered anilines
– Or avoid anilines completely!• Combining low PSA and high LogP increases
the risk of toxicity

183
Closing Remarks
Darren
184
Interactions(Cyps)
DMPK & Candidate DrugsCandidate Drugs need good predicted human PK & minimal drug-
drug interaction potential to have a chance of progress
Drug Design Criteria for Medicinal Chemists to be worried about
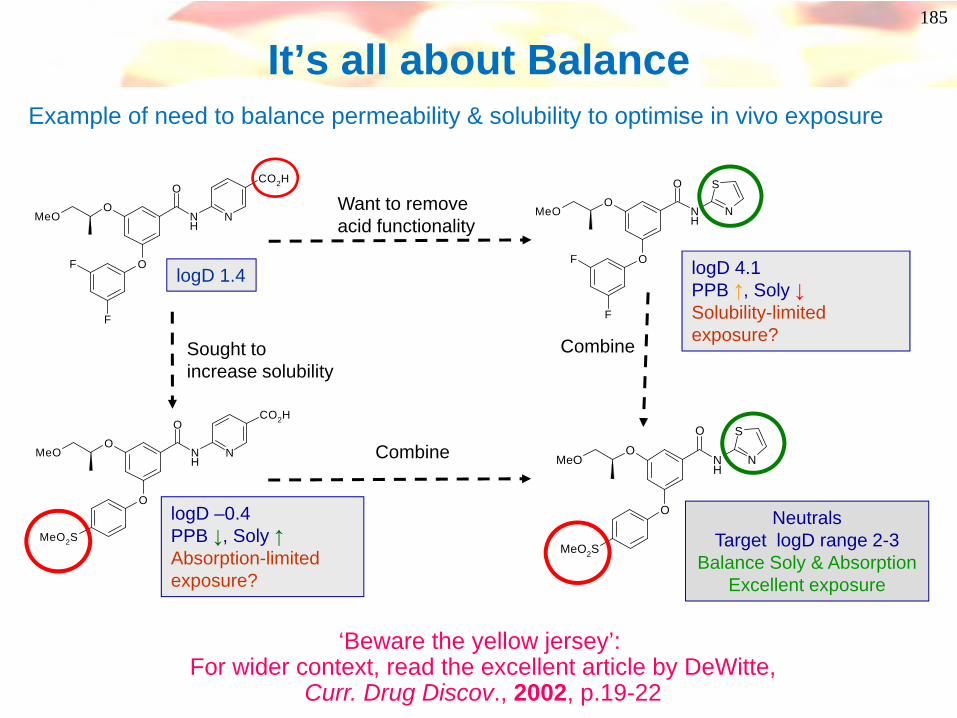
O
O
NH
O
N
F
F
MeO
CO2H
logD 1.4
185
Example of need to balance permeability & solubility to optimise in vivo exposure
S
NO
O
NH
O
F
F
MeO
logD 4.1PPB ↑, Soly ↓Solubility-limited exposure?
Want to remove acid functionality
S
NO
O
NH
O
MeO
MeO2S
NeutralsTarget logD range 2-3
Balance Soly & Absorption Excellent exposure
Combine
Combine
O
O
NH
O
NMeO
MeO2S
CO2H
logD –0.4PPB ↓, Soly ↑Absorption-limited exposure?
Sought toincrease solubility
It’s all about Balance
‘Beware the yellow jersey’: For wider context, read the excellent article by DeWitte,
Curr. Drug Discov., 2002, p.19-22
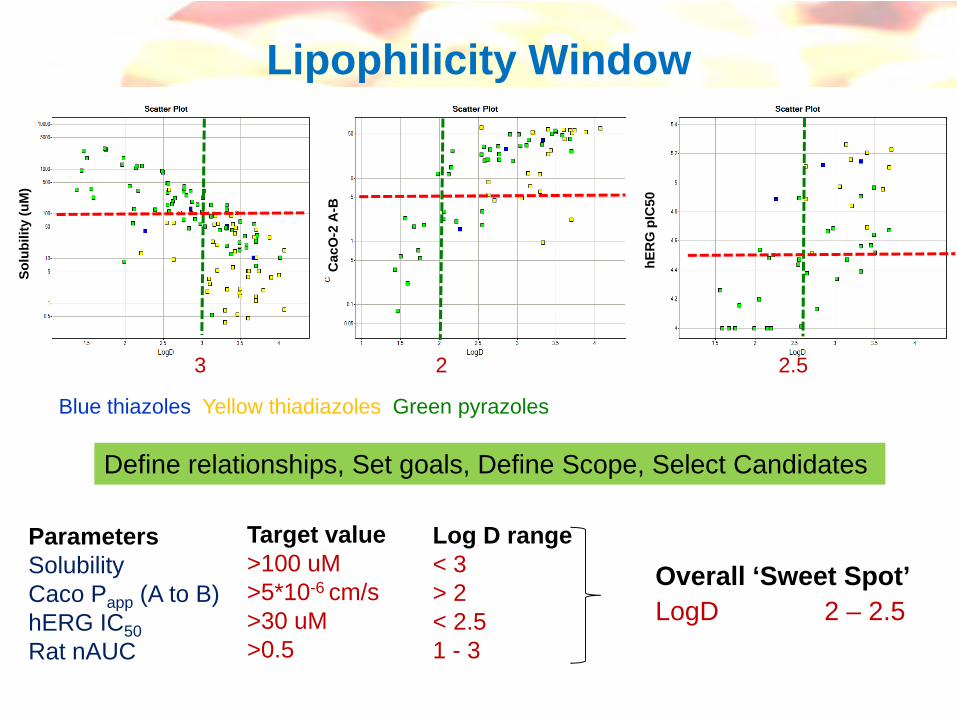
Lipophilicity Window
Blue thiazoles Yellow thiadiazoles Green pyrazoles
Solu
bilit
y (u
M)
Cac
O-2
A-B
hER
G p
IC50
ParametersSolubilityCaco Papp (A to B)hERG IC50Rat nAUC
Target value>100 uM>5*10-6 cm/s>30 uM>0.5
Overall ‘Sweet Spot’LogD 2 – 2.5
Log D range< 3> 2< 2.51 - 3
Define relationships, Set goals, Define Scope, Select Candidates
3 2 2.5

Designing ‘Endgame’ Scope
• Inputs chosen to retain putative pharmacophore
• Create Virtual library - every permutation created and descriptors (eg, logD) calculated
• Synthesis targets refined & selected using calculated properties to target ‘sweet spot’
• Make, test & analyse...
O
NH
OR2
O
R3R4
R1N
NN
NN
N
NNH
NNH
NO
O
O OH
SO
O
O
N
O
N
O
N
O
SO
O
SO
ON
H F
Cl
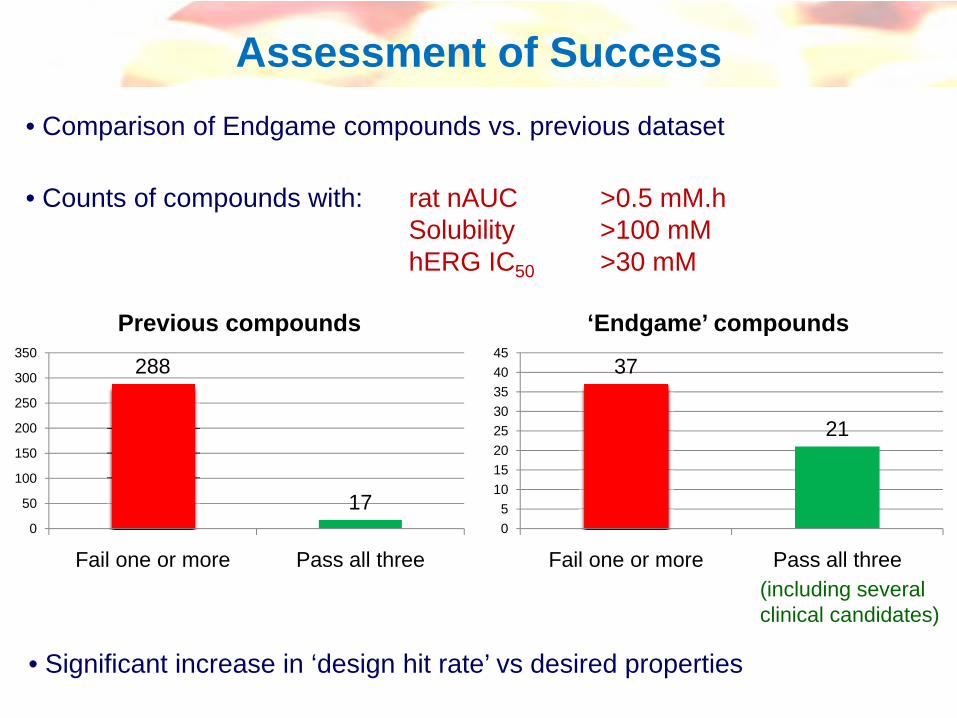
Assessment of Success
• Counts of compounds with: rat nAUC >0.5 mM.hSolubility >100 mMhERG IC50 >30 mM
• Comparison of Endgame compounds vs. previous dataset
37
21
05
1015202530354045
Fail one or more Pass all three
‘Endgame’ compounds
288
170
50
100
150
200
250
300
350
Fail one or more Pass all three
Previous compounds
(including severalclinical candidates)
• Significant increase in ‘design hit rate’ vs desired properties
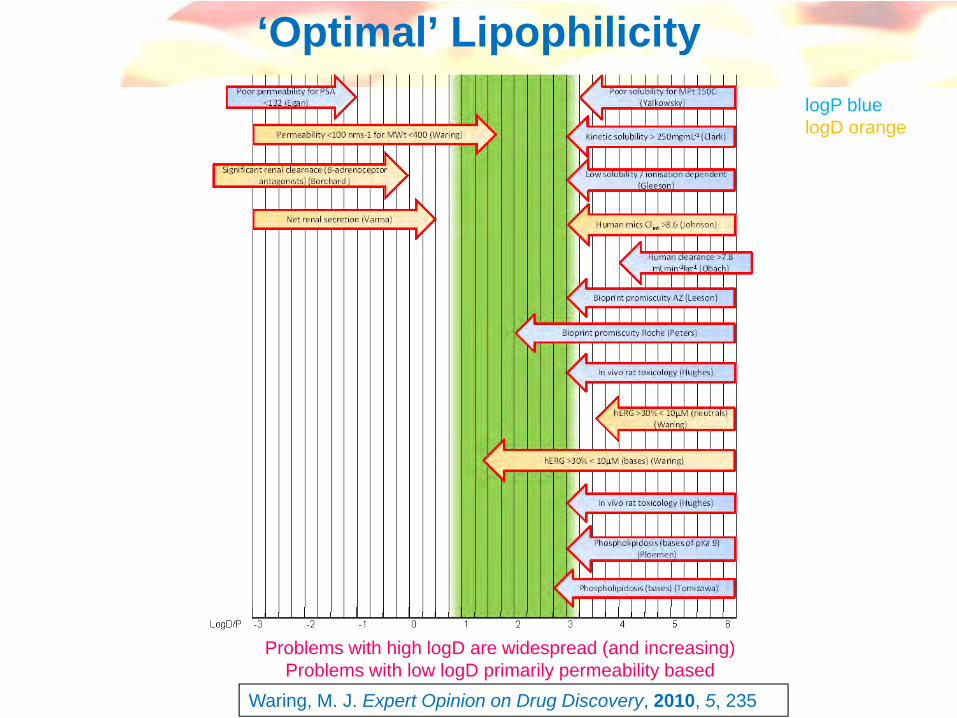
‘Optimal’ Lipophilicity
Waring, M. J. Expert Opinion on Drug Discovery, 2010, 5, 235
Problems with high logD are widespread (and increasing)Problems with low logD primarily permeability based
logP bluelogD orange
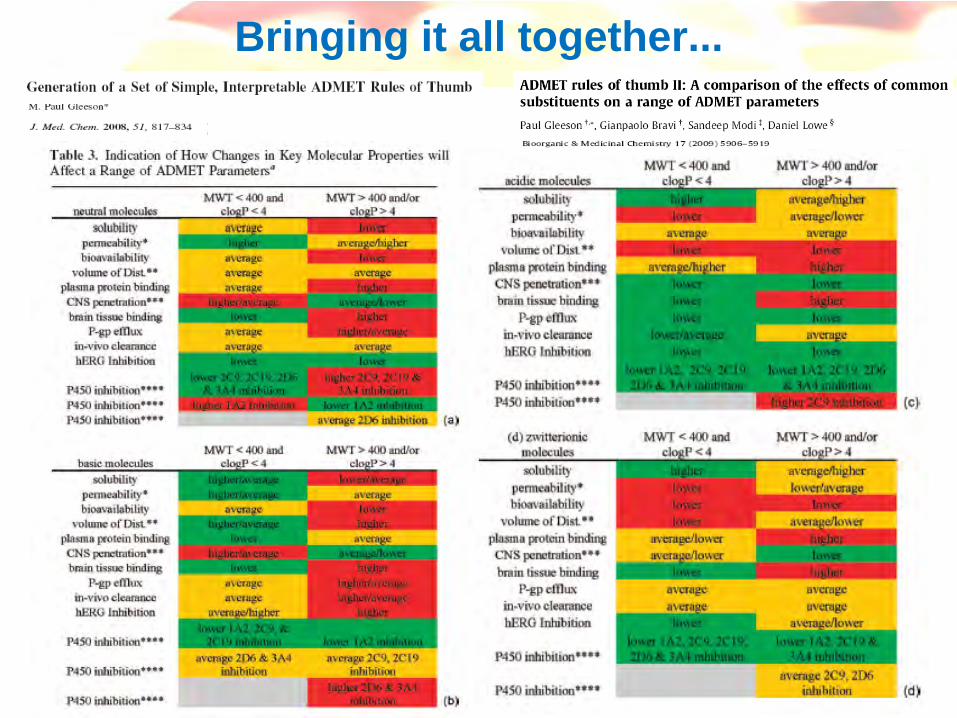
Bringing it all together...

191
More often than not..
• Solubility is too low
• Hepatic Clearance is too high
• Duration is too short
• Selectivity is a problem
• Toxicology is a problem
Reduce lipophilicity!