2000 - mineral resources program - usgs
TRANSCRIPT

LIME—2000 46.1
LIME
By M. Michael Miller
Domestic survey data and tables were prepared by Lisa D. Miller, statistical assistant, and the world production table wasprepared by Glenn J. Wallace, international data coordinator.
Lime is an important chemical with numerous chemical,industrial, and environmental uses in the United States. Someevidence of its use as a lime mortar has been found at a site inwhat is now eastern Turkey dating between 7,000 and 14,000years ago. More definite evidence of its use in mortars in theNear East and in the former Yugoslavia dates from 8,000 yearsago. In Tibet, it was used to stabilize clays in the constructionof the pyramids of Shersi 5,000 years ago. The ancientEgyptians used lime as an ingredient in mortar and plaster. TheChinese, Greek, Roman, and other ancient civilizations usedlime for construction, agriculture, bleaching, and tanning(Oates, 1998, p. 3-4). Its uses began expanding with the adventof the industrial revolution, but it remained primarily aconstruction commodity until the rapid growth of the chemicalprocess industries at the beginning of the 20th century. At theturn of the 20th century, more than 80% of the lime consumedin the United States was used in construction, but currentlymore than 90% is used in chemical and industrial applications.
The term “lime” as used throughout this chapter refersprimarily to six chemicals produced by the calcination of high-purity calcitic or dolomitic limestone followed by hydrationwhere necessary. There are two high-calcium forms—high-calcium quicklime (calcium oxide, CaO) and high-calciumhydrated lime [calcium hydroxide, Ca(OH)
2]. There are four
dolomitic forms—dolomitic quicklime (CaO.MgO), dolomitichydrate type N [Ca(OH)
2
.MgO] and dolomitic hydrate type S[Ca(OH)
2
.Mg(OH)2], and refractory dead-burned dolomite.
Lime also can be produced from a variety of calcareousmaterials, such as aragonite, chalk, coral, marble, and shell. Italso is regenerated (produced as a byproduct) by paper mills,carbide plants, and water-treatment plants. Regenerated lime,however, is beyond the scope of this report.
Production
Lime is a basic chemical that was produced as quicklime at101 plants in 33 States and Puerto Rico (table 2). Hydratedlime was produced at 12 separate hydrating facilities (including1 plant where the kiln has been shut down but hydrate wasmanufactured from quicklime produced offsite). In four Stateswith no quicklime production, hydrating plants used quicklimeshipped in from other States. There were also a small numberof slurry plants, where lime was converted to liquid form priorto sale. Principal producing States were, in descending order ofproduction, Missouri, Kentucky, Alabama, Ohio, Texas, andPennsylvania.
Domestic production data for lime are derived by the U.S.Geological Survey (USGS) from a voluntary survey of U.S.operations. The survey is sent to primary producers ofquicklime and hydrate but not to independent hydrators thatpurchase quicklime for hydration so as to avoid doublecounting. Quantity data are collected for 28 specific andgeneral end uses, and value data are collected by type of lime,such as high calcium or dolomitic. Because value data are notcollected by end use, value data shown in table 4 are determinedby calculating the average value per metric ton of quicklimesold or used for each respondent and then multiplying it by thequantity of quicklime that the respondent reported sold or usedfor each end use. The table lists the total quantity sold or usedfor an end use and the total value of the quicklime and hydratesold or used for that end use calculated as described above. Thesame methodology is used to calculate the value of hydrate soldand used in table 5.
The USGS maintains a list of operations classified asproducing or idle; in 2000, there were 112 operations listed. One of these operations is not surveyed at the producer’s
Lime in the 20th Century
In 1900, U.S. lime production was about 1.8 million metrictons. Historically, lime has always been a very versatilechemical, but when the first survey of lime usage was performedin 1906, nearly 83% of lime was used in building trades formortar, plaster, and sand-lime brick. The remaining was used inagriculture (9%) and for various chemical and industrial uses(8%). Pennsylvania and Ohio accounted for more than 30% ofproduction. There were more than 1,000 lime burners operatingnationwide at the time, and most used vertical shaft kilnsproducing a few hundred to a few thousand tons per year. Thelargest lime plants only produced about 20,000 tons per year.
In 2000, the United States produced nearly 19.6 million metrictons of lime. Changes in technologies, new environmental laws,and entirely new uses have resulted in great changes in how limeis consumed. More than 83% of lime was used in descending
order, for steelmaking, flue gas desulfurization, watertreatment (acid mine drainage, drinking water, and wastewater), nonferrous metallurgy, soil stabilization, precipitatedcalcium carbonate production, sugar refining, and pulp andpaper manufacturing. Only about 2% of lime was consumedin traditional building trades. The two leading producingStates were Missouri and Kentucky, which accounted for 21%of production. The basic lime manufacturing process had notchanged; it still involved heating limestone to dissociatecalcium oxide and carbon dioxide. In the past 100 years, kilnshave become much larger and use computer monitoring andcontrol systems to operate at high efficiencies. In 2000, morethan 10 times as much lime was produced as in 1900, but itwas produced at only 107 plants, some of which hadproduction capacities of more than 1 million tons per year.

U.S. GEOLOGICAL SURVEY MINERALS YEARBOOK—200046.2
request, and estimates are made by using reported prior-yearproduction figures or other industry data. Five of the listedoperations were idle in 2000. Of the 108 operations to whichthe 2000 annual survey request was sent, 107 were in operationall or part of the year and 96 responded to the survey,representing 98% of the total sold or used by producers. Production data for the 12 nonrespondents were estimated basedon prior-year production figures and other commodity data.
Total lime sold or used by domestic producers in 2000decreased by about 100,000 metric tons (t) (110,000 short tons)to 19.6 million metric tons (Mt) (21.6 million short tons) fromthe revised 1999 total of 19.7 Mt (21.7 million short tons) (table1). Production included the commercial sale or captiveconsumption of quicklime, hydrated lime, and dead-burnedrefractory dolomite. These products were valued at $1.19billion. Commercial sales increased by 165,000 t (182,000short tons) to 17.5 Mt (19.3 million short tons), while captiveconsumption decreased by 282,000 t (311,000 short tons) to2.04 Mt (2.25 million short tons).
The most significant factor affecting the lime industry in 2000was the impact of high natural gas prices on lime kilnoperations. Because of the large increase in natural gas prices,some of the kilns burning these fuels were shut down. Fuelprice increases affected mainly plants with vertical shaft andCalcimatic kilns. The commercial lime industry operates arelatively small number of these kilns, but production costs atthose plants that do would have risen dramatically. Commercialplants or individual kilns in Missouri, Pennsylvania, SouthCarolina, Tennessee, Texas, and Virginia were shut down. Kilns in Arizona and Ohio also may have been affected. Sincethe peak demand season for natural gas is the winter, gas priceswere expected to decrease in the spring of 2001, althoughindustry experts still expected prices to be significantly higherthan the average price in 1998 and 1999.
The largest commercial lime company in North America,Carmeuse North America, underwent an internal reorganizationinto central, northern, and southern regions. Plants in Illinois,Indiana, Kentucky, and Pennsylvania were allocated to thecentral region, plants in eastern Canada, Michigan, and Ohio tothe northern region, and plants in Alabama, Louisiana, andTexas to the southern region (William S. Brown, ExecutiveVice President Marketing and Development, Carmeuse NorthAmerica, written commun., January 19, 2001).
Graymont Ltd., the Canadian parent company of ContinentalLime Inc. and others, reorganized and renamed its limesubsidiaries into the following: Graymont Western US Inc.,Graymont Western Canada Inc., Graymont Dolime (OH) Inc.,Graymont (PA) Inc., Graymont (QC) Inc., and Graymont (NB)Inc. Graymont produces lime in six U.S. States and fiveCanadian Provinces (Graymont Ltd., 2000, Related companies,accessed July 11, 2000, at URL http://www.graymont.com/related.htm).
United States Lime & Minerals, Inc. (U.S. Lime & Minerals)started up its new preheater rotary kiln on October 22 at itsArkansas Lime Co. subsidiary in Batesville, AR. The new kilnsuccessfully achieved design volumes in excess of 540 metrictons per day (t/d) (600 short tons per day). U.S. Lime &Minerals is proceeding with financing plans for the constructionof phase II of the Arkansas Lime project. The requisite permitsfor the installation of the phase II kiln have already beenobtained, and the company expected to commence constructionof phase II in midyear 2001, subject to market demand, the
ability to secure competitive bids, and the availability offinancing (United States Lime & Minerals, Inc., October 21,2000, United States Lime & Minerals, Inc. announces results forthe third quarter 2000, the start-up of its new kiln in Arkansas,and proposed financings, accessed April 19, 2001, via URLhttp://www.uslm.com/news.htm).
Chemical Lime Co. and Martin Marietta Materials, Inc.,signed an agreement whereby Martin Marietta would processaggregate materials and provide certain operating services atChemical Lime’s lime plant in New Braunfels, TX. Under theagreement, Martin Marietta will build an aggregates plant toprocess what is currently unusable limestone for the lime plant. The plant is expected to be operational the second half of 2001and will have an initial capacity of about 1.3 to 1.8 millionmetric tons per year (1.5 to 2.0 million short tons per year). Martin Marietta will also assume responsibility for all pitoperations, including supplying kiln feed to the lime plant(Martin Marietta Materials, Inc., July 17, 2000, Martin MariettaMaterials, Inc. announces agreement with Chemical Lime Co. inTexas, accessed September 25, 2000, at URLhttp://www.martinmarietta.com/corpsite/news/press_releases/00_07_17.asp). Chemical Lime’s Ten Mile plant located nearBancroft, ID, shut down in late 1999 and was idle all of 2000. The facility was used as a terminal in 2000 for sales of limeproduced at other Chemical Lime plants in the region.
Baker Refractories and Wülfrath Refractories GmbH, therefractories arm of the Lhoist Group of Belgium, signed anagreement to merge pending approval by antitrust authorities inEurope and the United States. The new unit will operate undera unifying name and will be headquartered in Hilden, Germany. Baker Refractories manufactures dead-burned refractory-dolomite products in York, PA, and also has manufacturingfacilities in the United Kingdom and joint-venture operations inMexico and Taiwan (Industrial Minerals, 2000).
In the captive lime sector, three plants closed permanently. The Dow Chemical Co.’s lime plant at Ludington, MI, closed inlate 1999, when Dow switched to purchasing lime on the openmarket. Holly Sugar Co.’s sugar beet plants and their respectivelime kilns located at Tracy and Woodlands, CA, closed in late2000.
Of the 43 companies manufacturing quicklime at the end of2000, 26 were primarily commercial producers, 13 werepredominantly captive producers, and 4 combined commercialsales with captive production. During 2000, the 26 commercialproducers operated 63 lime plants producing quicklime and 7separate hydrating plants (including 1 lime plant that was idlebut operated its hydrator). The 13 captive producers operated34 plants producing quicklime primarily for internal companyuse. At yearend, the top 10 companies were, in descendingorder of production, (1) Carmeuse North America, (2) ChemicalLime, (3) Graymont Ltd., (4) Mississippi Lime Co., (5) GlobalStone Corp., (6) Martin Marietta Magnesia Specialties, Inc., (7)U.S. Lime & Minerals, (8) Vulcan Materials Co., (9) LTV SteelCo., Inc., and (10) Austin White Lime Co. These companiesoperated 45 lime plants and 6 separate hydrating plants andaccounted for 86% of the combined commercial sales ofquicklime and hydrated lime and 79% of total lime production.
Domestic lime plant capacity is based on 365 days minus theaverage number of days for maintenance multiplied by theaverage 24-hour capacity of quicklime production, includingquicklime converted to hydrated lime. In 2000, based oncapacity data from 48 commercial plants, the U.S. lime industry

LIME—2000 46.3
operated at about 79% of capacity compared with 76% in 1999. The calculations do not include combined commercial andcaptive producers, hydrating plants, and Puerto Rico.
Environment
The most common fuel used to produce lime in the UnitedStates is coal. Emissions generated in the combustion of coaland other fuels make the lime industry subject to regulationunder the Clean Air Act. Of immediate concern to the limeindustry are the costs and obligations expected for additionalmonitoring, reporting, and control of particulate matter andhazardous air pollutants such as hydrogen chloride. Oflongterm concern, with a potentially greater impact, is theinternational debate on the reduction of greenhouse gasemissions, particularly carbon dioxide. Lime productiongenerates carbon dioxide from the combustion of fuels and fromthe calcination process, which dissociates calcium carbonateinto calcium oxide and carbon dioxide. Any program toregulate carbon dioxide emissions would affect lime producers.
Consumption
The breakdown of consumption by major end uses (table 4)was as follows: 38% for metallurgical uses, 26% forenvironmental uses, 24% for chemical and industrial uses, 11%for construction uses, and 1% for refractory dolomite. Captivelime accounted for about 10% of consumption and was usedmainly in the production of steel in basic oxygen furnaces,sugar refining, and magnesia and magnesium production. Almost all data on captive lime consumption, excluding thesugar industry, are withheld to protect company proprietaryinformation. As a result, table 4 lists the total quantity andvalue of lime by end use. End uses with captive consumptionare listed in footnote 4 of the table. Values assigned to specificend uses in table 4 should not be construed as being pricespecific to that market. The USGS does not collect value databy end use, and the values shown in tables 4 and 5 are derived,in general, from average lime values. The market values shownare simply designed to show the relative value of the market.
In steel refining, quicklime is used as a flux to remove suchimpurities as phosphorus, silica, and sulfur. Dolomitic lime isoften substituted for a fraction of the high-calcium lime toextend refractory life. Dolomitic quicklime is also used as aflux in the manufacture of glass. The steel industry accountedfor about 31% of all lime consumed in the United States. Limeconsumption by the iron and steel industry was 6.15 Mt (6.78million short tons), a 2.9% increase compared with that of 1999. This increase is in part explained by the lower usage rate of limein electric arc furnaces. The trend toward using magnesia toreplace some dolomitic lime in the steel furnace appears to haveleveled off after making inroads into dolomitic lime sales.
The U.S. steel industry reported strong production during thefirst and second quarters of 2000, but a slowing economy andincreased imports resulted in a decrease in production of morethan 10% in the third and fourth quarters. For the year, rawsteel production was up by 4.2% (3.1%, basic oxygen processand 5.5%, electric arc process) compared with that in 1999.
In nonferrous metallurgy, lime is used in the beneficiation ofcopper ores to neutralize the acidic effects of pyrite and otheriron sulfides and to maintain the proper pH in the flotationprocess. Lime is used to process alumina and magnesia, to
extract uranium from gold slimes, to recover nickel byprecipitation, and to control the pH of the sodium cyanidesolution used to leach gold and silver from the ore. Suchleaching processes are called dump leaching when large piecesof ore are involved, heap leaching when small pieces of ore areinvolved, and carbon-in-pulp cyanidation when the ore isleached in agitated tanks. Dump and heap leaching involvecrushing the ore, mixing it with lime for pH control andagglomeration, and stacking the ore in heaps for treatment withcyanide solution. Lime is used to maintain the pH of thecyanide solution at a level between 10 and 11 to maximize therecovery of precious metals and to prevent the creation ofhydrogen cyanide. Lime consumed for these various uses isincluded in table 4 under the category “Other nonferrousmetallurgy.”
Lime usage in nonferrous metallurgy (mainly concentration ofcopper and gold ores, aluminum and bauxite processing, andmagnesium production) decreased by 17% in 2000. Previouslyannounced cutbacks and closures by copper producers(including the Continental Mine in Montana) were made moreacute by power disruptions and high energy costs. Decreases incopper output and magnesium production were primary causesof the decrease in lime consumption. Recoverable mineproduction of copper decreased by about 8% (Edelstein, 2001). Magnesium production decreased by 23%; the power andenergy problems of the Pacific northwest caused productionproblems for magnesium producer Northwest Alloys, Inc., andfor its aluminum customers (Kramer, 2001).
The tailings that result from the recovery of precious metalsmay contain elevated levels of cyanides. Lime is used torecover cyanides in such treatment processes as Cyanisorb,alkaline chlorination, and sulfur dioxide/air.
In the environmental sector, lime is used in the softening andclarification of municipal potable water and to neutralize acid-mine and industrial discharges. In sewage treatment, lime’straditional role is to control pH in the sludge digester, whichremoves dissolved and suspended solids that contain phosphatesand nitrogen compounds. Lime also aids clarification and indestroying harmful bacteria. More recently, the largest use insewage treatment has been to stabilize the resulting sewagesludges. Sewage sludge stabilization, also called biosolidsstabilization, reduces odors, pathogens, and putrescibility of thesolids. Lime stabilization involves mixing quicklime with thesludge to raise the temperature and pH of the sludge tominimum levels for a specified period of time. Limeconsumption for all sludge treatment increased by 29%compared with that in 1999. The sewage sludge marketincreased by 53%, but the industrial and hazardous wastemarket decreased by 8%.
In flue gas desulfurization (FGD) systems serving electricutility and industrial plants and incinerators, lime is used toreact with sulfur oxides in the flue gas and is used to stabilizethe resulting sludge before disposal. In 2000, the FGD marketgrew by 13%, recouping the 10% decrease in sales reported in1999. The utility industry increased operating and maintenancebudgets, which improved plant reliability and helped eliminatemuch of the unscheduled downtime experienced by somepowerplants in 1999. Probably just as important, after mildtemperatures in 1999, temperatures returned to more normalranges, thus increasing the demand for electricity. In addition,the price of nitrogen oxide (NO
x) emission allowances dropped.
One of the large midwestern powerplants was forced to reduce

U.S. GEOLOGICAL SURVEY MINERALS YEARBOOK—200046.4
its power generation to limit NOx emissions in 1999 but
resumed normal operations in 2000.Lime is used by the pulp and paper industry in the basic Kraft
pulping process where wood chips and an aqueous solution(called liquor) of sodium hydroxide and sodium sulfide areheated in a digester. The cooked wood chips (pulp) aredischarged under pressure along with the spent liquor. The pulpis screened, washed, and sent directly to the paper machine orfor bleaching. Lime is sometimes used to produce calciumhypochlorite bleach for bleaching the paper pulp. The spentliquor is processed through a recovery furnace where dissolvedorganics are burned to recover waste heat and sodium sulfideand sodium carbonate are recovered. The recovered sodiumsulfide and sodium carbonate are diluted with water and thentreated with slaked lime to recausticize the sodium carbonateinto sodium hydroxide (caustic soda) for reuse. The byproductcalcium carbonate is recalcined in a lime kiln to recover lime forreuse. The paper industry also uses lime as a coagulant aid inthe clarification of plant process water.
The pulp and paper market was adversely affected by theslowdown of the economy and by the trend toward increasedrecycling of byproduct calcium carbonate into lime by pulp andpaper producers. These factors resulted in a 17% decrease inlime consumption.
Lime is used to make precipitated calcium carbonate (PCC), aspecialty filler used in premium-quality coated and uncoatedpapers, paint, and plastics. The most common PCC productionprocess used in the United States is the carbonation process. Carbon dioxide is bubbled through milk-of-lime, a suspensionof hydrated lime in water, to form a precipitate of calciumcarbonate and water. The reaction conditions determine the sizeand shape of the resulting PCC crystals. Lime use for PCCproduction was unchanged compared with that of 1999.
Lime is used, generally in conjunction with soda ash, forsoftening plant process water. This precipitation processremoves bivalent soluble calcium and magnesium cations (and,to a lesser extent, ferrous iron, manganese, strontium, and zinc),which contribute to the hardness of water. This process alsoreduces carbonate alkalinity and dissolved solids content.
The chemical industry uses lime in the manufacture ofalkalies. Quicklime is combined with coke to produce calciumcarbide, which is used to make acetylene and calcium cyanide. Lime is used to make calcium hypochlorite, citric acid,petrochemicals, and other chemicals.
In sugar refining, milk-of-lime is used to raise the pH of theproduct stream, precipitating colloidal impurities. The limeitself is then removed by reaction with carbon dioxide toprecipitate calcium carbonate. The carbon dioxide is obtainedas a byproduct of lime production.
In construction, hydrated lime and quicklime are used insubgrade stabilization to stabilize fine-grained soils in place ofmaterials that are employed as subbases, such as hydraulic clayfills or otherwise poor-quality clay and silty materials obtainedfrom cuts or borrow pits. Lime also is used in basestabilization, which includes upgrading the strength andconsistency properties of aggregates that may be judgedunusable or marginal without stabilization. Commonapplications for lime stabilization included the construction ofroads, airfields, building foundations, earthen dams, and parkingareas. Highway projects, airport runway expansions, andcommercial projects kept the large Texas stabilization market atabout the same level as in 1999, but nationwide lime sales for
stabilization decreased by 7% compared with the revised 1999figures.
Although the overall quantities of lime used for soilstabilization are believed to be accurate, the data reported intable 5 may not accurately reflect how much hydrated lime isactually used in soil stabilization. Much of the lime used in soilstabilization is consumed as slurry, which may be manufacturedby the lime company at a slurry plant or by the user onsite.
In road paving, hydrated lime is used in hot mix asphalt to actas an antistripping agent. Stripping is generally defined as aloss of adhesion between the aggregate surface and the asphaltcement binder in the presence of moisture. Lime also is used incold in-place recycling for the rehabilitation of distressedasphalt pavements. Existing asphalt pavement is pulverized byusing a milling machine, and a hot lime slurry is added alongwith asphalt emulsion. The cold recycled mix is placed andcompacted by using conventional paving equipment, whichproduces a smooth base course for the new asphalt surface. In2000, sales of lime for use in asphalt decreased by nearly 7%compared with the revised 1999 figures.
In the traditional building sector, quicklime is used to makecalcium silicate building products, such as sand-lime brick andautoclaved aerated concrete (AAC). AAC offers the advantageof producing building materials that can be cut, drilled, andnailed like wood but with the advantages of a concrete product.
Hydrated lime is used in the traditional building sector whereit still is used in plaster, stucco, and mortars to improvedurability. The recent growth in this traditional lime market isthe result of strong growth in nonresidential buildingconstruction (industrial buildings, offices, shopping centers,etc.) where architects have specified the use of the traditionallime building materials. According to preliminary data releasedby the U.S. Census Bureau, there was a 6.8% increase in thevalue of nonresidential building construction in 2000; the use ofhydrated lime in traditional building uses increased by morethan 4%. The use of hydrated lime in traditional building useshas increased by 33% since 1997.
A small amount of hydrated lime (estimated to be less than2% of total building uses) also is used on the renovation of oldstructures built with lime-based mortars, which were standardbefore the development of portland cement-based mortars. Modern portland cement-based mortars are incompatible withold lime mortars.
Dead-burned dolomite, also called refractory lime, is used asa component in tar-bonded refractory brick used in basicoxygen furnaces. Hydrated lime is used to produce silicarefractory brick used to line industrial furnaces.
Prices
The average values per ton of lime, rounded to threesignificant figures, are listed in table 8. The values are reportedin dollars per metric ton with accompanying conversions intodollars per short ton. For accuracy, the conversions were madefrom the unrounded metric value and, as a result, may not be anexact conversion of the rounded values. All value data for limeare reported by type of lime produced—high-calciumquicklime, high-calcium hydrate, dolomitic quicklime,dolomitic hydrate, and dead-burned dolomite. Emphasis isplaced on the average value per ton of lime sold.
In 2000, the average value for all types of lime sold and usedwas essentially unchanged from the previous year. Although

LIME—2000 46.5
there was some upward movement in commercial lime prices onan free on board plant basis (less than 2%), because much of thequicklime is sold through long-term contracts to such largecustomers as steel mills and utilities, significant price increasescannot be enacted until current contracts expire. In some cases,however, lime companies passed along increased fuel andenergy costs in the form of surcharges.
The average value per ton of high-calcium quicklime andhigh-calcium hydrate sold increased only slightly, but dolomiticquicklime and dolomitic hydrate values per ton of lime soldincreased by 7% and 17%, respectively. The increase in pricefor dolomitic quicklime was partly the result of an increase inthe steel producer price index in 2000. Steelmaking is thelargest market for dolomitic quicklime, and lime supplycontracts are sometimes tied to the steel index. In addition,there is increased use of dolomitic quicklime in higher valuespecialty products manufactured for the steel markets.
Overall, despite idled capacity, strong competition continuedto keep prices down. Figures 1 and 2 show the average salesvalue per ton of quicklime and hydrate over the past 10 years inactual and constant dollars.
Foreign Trade
The United States exported and imported quicklime, hydratedlime (slaked lime), hydraulic lime, and calcined dolomite(dolomitic lime). Combined exports of lime (table 6) were73,200 t (80,700 short tons) valued at $9.96 million, with 69%exported to Canada, 17% exported to Mexico, 9% exported toArgentina, and the remaining 5% going to various othercountries. Combined imports of lime (table 7) were 113,000 t(125,000 short tons) value at $13.5 million, with 85% comingfrom Canada and 14% coming from Mexico.
Data on imports and exports of hydraulic lime may bequestionable. There is only one known producer of hydrauliclime in the United States, and with exports averaging about10,000 to 11,000 metric tons per year (t/yr) in 1999 and 2000, itis likely that what is being classified as hydraulic lime is in factportland cement (or some other hydraulic cement product). Chemically, hydraulic lime and portland cement are quitesimilar.
No tariffs are placed on imports of hydraulic lime, quicklime,and slaked lime from countries with normal trade relations(NTR) with the United States. There is a 3% ad valorem tariffon imports of calcined dolomite from NTR countries.
World Review
With the exception of industrialized nations with good datacollection, accurate lime data for many countries are frequentlydifficult to acquire. The variations in quality, types of lime,production technologies, and industries manufacturing lime andthe frequent confusion with limestone data make accuratereporting of world lime data (table 9) extremely difficult andcertainly incomplete. The following is a brief discussion ofacquisitions or new construction in specific countries.
Italy.—Calcestruzzi Calò A has purchased a 200-t/d Cim-Reversy oil-fired kiln from Cimprogetti S.p.A. (World Cement,2001).
Jamaica.—Rugby Jamaica Lime and Minerals Ltd.successfully commissioned its new 400-t/d lime plant nearClarendon. The plant includes a Cimprogetti Twin-D 85 twin
shaft regenerative kiln and will supply lime to the local aluminaindustry (World Cement, 2001).
Mexico.—Mexico’s Grupo Calider S.A. de C.V., a joint-venture partner of the Belgian Lhoist Group, acquired Mexicanlime producer Caleras Fernandez S.A. de C.V. CalerasFernandez, which operates in southwestern Mexico, has a300,000-t/yr plant near Guadalajara and a 35,000-t/yr hydratingplant near Cimarron (Lhoist Group, July 2000, Acquisition ofMexican Caleras Fernandez, accessed January 5, 2001, at URLhttp://www.lhoist.com/about/news/intro.html).
Peru.—Cia. De Minas de Buenaventura S.A. de C.V.successfully commissioned its new oil-fired Cimprogetti Cim-Reversy twin shaft regenerative kiln. The 130-t/d kiln is locatedat the Yanococha Gold Mine (World Cement, 2001).
Poland.—In November 2000, Lhoist Bukowa Sp. zo. o.started up its new 600-t/d Maerz kiln. The new kiln increasesthe plant’s capacity to 1,760 t/d and makes it the most modernlime plant in the Kielce region. Additional work on a newhydrating plant and pebble lime storage facilities are expected tobe completed by June 2001 (Lhoist Group, November 2000,New kiln at Lhoist Bukowa, accessed April 30, 2001, at URLhttp://www.lhoist.com/about/news/intro.html).
Spain.—Caleras De San Cucao has placed an order for aCimprogetti gas-fired Twin-D 70 kiln. The kiln is designed toalternate between producing high-calcium lime and dolomiticlime (World Cement, 2001). A Maerz lime kiln was installed atCiarues S.A.’s Aragon plant. The new kiln has a capacity of200 t/d and is natural-gas/coal-dust fired (World Cement, 2001).
United Kingdom.—On December 14, the Lhoist Group ofBelgium acquired the United Kingdom lime business of RMCGroup plc. The acquisition includes two Maerz kilns with anannual capacity of 200,000 t/yr near Hindlow, Derbyshire, and ahydrating plant near Hartley, Cumbria. The new entity willoperate under the name Lhoist UK Ltd. (Lhoist Group,December 2000, Lhoist purchases RMC lime in the UK,accessed January 5, 2001, at URL http://www.lhoist.com/about/news/intro.html).
Outlook
Lime has dozens of end uses in the chemical, industrial, andconstruction industries, but sales are dominated, in descendingorder by tonnage, by the iron and steel markets, FGD, pulp andpaper including the related PCC market, construction, andnonferrous metallurgy. These market groups accounted for75% of total lime consumption in 2000.
In the short term, the slowdown of the economy and theenergy crisis in the western United States will have a negativeimpact on lime sales. The domestic steel industry is plagued byhigh levels of imports, large inventories, and bankruptcies; theslowing economy will only exacerbate the industry’s problems. These factors are expected to cause a decrease in U.S. steelproduction in 2001, and lime sales for steel could be decline by5% to 10% in 2001.
In 2000, the FGD market recovered from the problemsexperienced in 1999, and the future for the lime-based FGDremains promising. Phase II of the Clean Air Act Amendments(CAAA), which went into effect January 1, 2000, remains thedriving force behind the growth in this market. The costs oflime-based scrubbers have decreased to about $330 per ton ofsulfur dioxide removed (from $440 to $1,000 per ton), and limescrubbers display favorable economics and efficiencies for the

U.S. GEOLOGICAL SURVEY MINERALS YEARBOOK—200046.6
smaller units regulated under phase II. Regulations coveringemissions from small municipal incinerators and waste-to-energy incinerators also favor the use of lime scrubbers. Whenphase II went into effect, it was thought that the real boost tolime sales for FGD would be slow in coming because of anexcess of emission allowances accumulated during phase I ofthe CAAA and the low prices for emissions allowances. It wasthought that it would likely take until 2005 for the scrubbermarket to really start seeing the demand increase from the phaseII regulation. There has been a steep rise in the price ofemissions allowances from about $130 per ton to more than$200 per ton between the fall of 2000 and the spring of 2001. Ifallowance prices continue to rise or stay at current levels, theeconomics of installing scrubbers may become more attractiveearlier than the previously forecasted 2005 time period.
Analysis of the energy crisis of 2000 and the potential forenergy shortages in the future has indicated that the quickestway to expand generating capacity is to maximize the use ofexisting powerplants and to add capacity at current facilities. There continues to be strong public support for environmentalcleanup of emissions, so greater use of FGD controls is likely inthe future. The higher prices of natural gas, which has been thepreferred fuel for new powerplants, also has made coal a moreacceptable option for future power plant construction.
In a recent forecast of air pollution control markets, TheMcIlvaine Co. predicted that U.S. utilities will spend $25 billionover the next 9 years on flue gas desulfurization. The majorityof these systems will use lime or limestone and producebyproduct gypsum. About 60% will be for existing powerplantsand 40% for new coal-fired powerplants (The McIlvaine Co.,November 2000, Huge U.S. power plant scrubber market nowdeveloping, accessed April 30, 2001, at URLhttp://www.mcilvainecompany.com/news%20releases/NR600.htm).
Increased funding for highway and airport construction asauthorized by the Transportation Equity Act for the 21stCentury (TEA-21) and the Wendell H. Ford AviationInvestment and Reform Act for the 21st Century (AIR-21)should benefit the soil stabilization and asphalt markets over thenext several years. The following are two examples of projectsthat potentially could benefit from the acts. AIR-21 will helpfund runway expansion projects that have been announced forCorpus Christi International Airport, Dallas-Fort WorthInternational Airport, and McAllen-Miller International Airport(located west of Brownsville, TX). In addition, TEA-21designated the “Ports to Plains” corridor linking Denver, CO,with the Texas-Mexico border as 1 of 43 high-priority corridors. Several transportation studies have been conducted on thiscorridor in the past, but a major feasibility study is underwaythat will examine preferred highway alignments and thefeasibility of highway improvements. The goal would be todevelop a four-lane divided highway linking the two points(Wilbur Smith Associates, January 2001, Ports to plainsfeasibility study process, accessed May 1, 2001, at URLhttp://www.wilbursmith.com/portstoplains). If this corridor getsbuilt, it would provide a large potential market for limestabilization that could last for years.
The traditional building markets (masonry and finishing lime)have shown unexpected growth in recent years and the trendshould continue, but with the economy lagging in 2001 thegrowth rate of nonresidential construction is likely to slow.
Sales to the traditional pulp and paper market have decreasedin recent years mainly because of increased recycling ofbyproduct calcium carbonate. This market will also beadversely affected by the announced closure of threeInternational Paper Co. mills at Mobile, AL, Camden, AR, andLock Haven, PA, and reduced operations at Courtland, AL(Tappi, October 20, 2000, PACE addresses mill closures,downsizing at IP, accessed November 15, 2000, via URLhttp://www.tappi.org). These closures will also adversely affectthe PCC market because Minerals Technologies, Inc., operatessatellite PCC mills at Lock Haven and Mobile, although PCCproduction at Courtland will be unaffected. On the positiveside, Minerals Technologies opened a new merchant PCC millat Brookhaven, MS, which will manufacture PCC for suchnonpaper uses as vinyl siding and automotive and constructionsealants (North American Minerals News, 2000b). In addition,Minerals Technologies signed an agreement to construct asatellite PCC mill at a paper mill in Millinocket, ME, owned byGreat Northern Paper, Inc. The plant is expected to be inoperation in the third quarter of 2001 (North American MineralsNews, 2001). Despite the closures by International Paper,which will slow the growth of PCC in 2001, the PCC marketshould exhibit solid growth in the long term. Its penetration ofthe groundwood paperboard markets is considered a driver offuture PCC demand. Kline & Co., a consultancy based inFairfield, NJ, expects PCC use in paper and paperboard to growon average by 6% per year through 2004 (North AmericanMinerals News, 2000a).
The increase in natural gas prices already has had a dramaticeffect on lime plant operations. With gas prices expected toremain high and coal prices rising because of increased demandas gas users try to switch fuels, lime plant operating costs willincrease. Higher prices for transportation fuels (mainly diesel)will also increase operating costs. If these fuel prices continueat elevated levels, as current long-term contracts expire, limeproducers will certainly attempt to raise prices. In the longterm, coal prices are expected to come down as coal mineoutput catches up with demand. Considering the strongcompetition between lime companies and excess productioncapacity, the biggest impact of the current energy problems onthe lime industry likely will not be big price increases but rathermore production from coal-fired kilns. Companies will, wherepossible, convert gas-fired kilns to coal firing, but it is notknown if this is feasible for all types of kilns.
References Cited
Edelstein, D.L., 2001, Copper in December 2000: U.S. Geological SurveyMineral Industry Surveys, March, 10 p.
Industrial Minerals, 2000, Refractory dolomite consolidation—Lhoist/Wülfrathto merge with Baker Refractories: Industrial Minerals, no. 397, October, p. 8-9.
Kramer, D.A., 2001, Magnesium in the fourth quarter 2000: U.S. GeologicalSurvey Mineral Industry Surveys, February, 4 p.
North American Minerals News, 2000a, Kline predicts pigment growth tooutpace paper production: North American Minerals News, no. 67,December, p. 16.
———2000b, MTI dedicates Brookhaven PCC plant—Expansion likely: NorthAmerican Minerals News, no. 66, November, p. 4.
———2001, MTI to build PCC plant in Maine: North American MineralsNews, no. 69, February, p. 3.
Oates, J.A.H., 1998, Lime and limestone—Chemistry and technology,production and uses: Weinem, Germany, Wiley–VCH, 455 p.
World Cement, 2001, World lime review: World Cement, v. 32, no. 4, April, p. 52-56.

LIME—2000 46.7
GENERAL SOURCES OF INFORMATION
U.S. Geological Survey Publications
Lime. Ch. in Mineral Commodity Summaries, annual.Lime. Ch. in Minerals Yearbook, annual.Limestone and Dolomite. Ch. in United States Mineral
Resources, Professional Paper 820, 1973.
Other
Chemical Economics Handbook. SRI International.
Chemical Market Reporter.Chemistry and Technology of Lime and Limestone. John Wiley
& Sons, 1980.Industrial Minerals (London).Industrial Minerals and Rocks. AIME, 6th ed., 1994.Industrial Specialty News.Lime. Ch. in Mineral Facts and Problems, U.S. Bureau of
Mines Bulletin 675, 1985.Lime and Limestone: Chemistry and Technology, Production
and Uses. Wiley—VCH, 1998.Lime Facts. National Lime Association, 1999.North American Minerals.

TABLE 1SALIENT LIME STATISTICS 1/
(Thousand metric tons, unless otherwise specified) 2/
1996 1997 1998 1999 2000United States: 3/ Number of plants 108 106 107 108 107 Sold or used by producers: High-calcium quicklime NA 14,300 14,800 14,100 14,800 Dolomitic quicklime NA 2,900 2,740 3,000 r/ 2,570 Total 16,800 17,300 17,500 17,100 17,300 High-calcium hydrated lime NA 1,820 1,950 2,010 r/ 1,550 Dolomitic hydrated lime NA 352 383 298 421 Total 2,190 2,170 2,330 r/ 2,310 r/ 1,970 Dead-burned dolomite 4/ 300 300 300 300 200 Grand total 19,200 19,700 20,100 19,700 r/ 19,600 Value 5/ thousands $1,150,000 r/ $1,200,000 $1,250,000 r/ $1,190,000 r/ $1,190,000 Average value per ton $61.50 $61.00 $60.40 $60.40 r/ $60.60 Lime sold 16,800 17,300 17,800 17,400 r/ 17,500 Lime used 2,440 r/ 2,420 2,320 r/ 2,320 r/ 2,040 Exports: 6/ Quantity 68 7/ 80 56 59 73 Value thousands $8,810 7/ $9,550 $9,110 $8,270 r/ $9,960 Imports for consumption: 6/ Quantity 298 7/ 276 r/ 231 140 r/ 113 Value thousands $27,500 7/ $26,500 $22,700 $15,700 r/ $13,500 Consumption, apparent 8/ 19,400 19,900 20,300 19,800 r/ 19,600World, production 114,000 r/ 116,000 r/ 116,000 r/ 116,000 r/ 116,000 e/e/ Estimated. r/ Revised. NA Not available.1/ Data are rounded to no more than three significant digits; may not add to totals shown.2/ To convert metric tons to short tons, multiply metric tons by 1.10231.3/ Excludes regenerated lime.4/ Data rounded to no more than one significant digit to protect company proprietary data.5/ Selling value, f.o.b. plant, excluding cost of containers.6/ U.S. Census Bureau.7/ The 1996 data were revised to correlate with the data for following years.8/ Defined as sold or used plus imports minus exports.
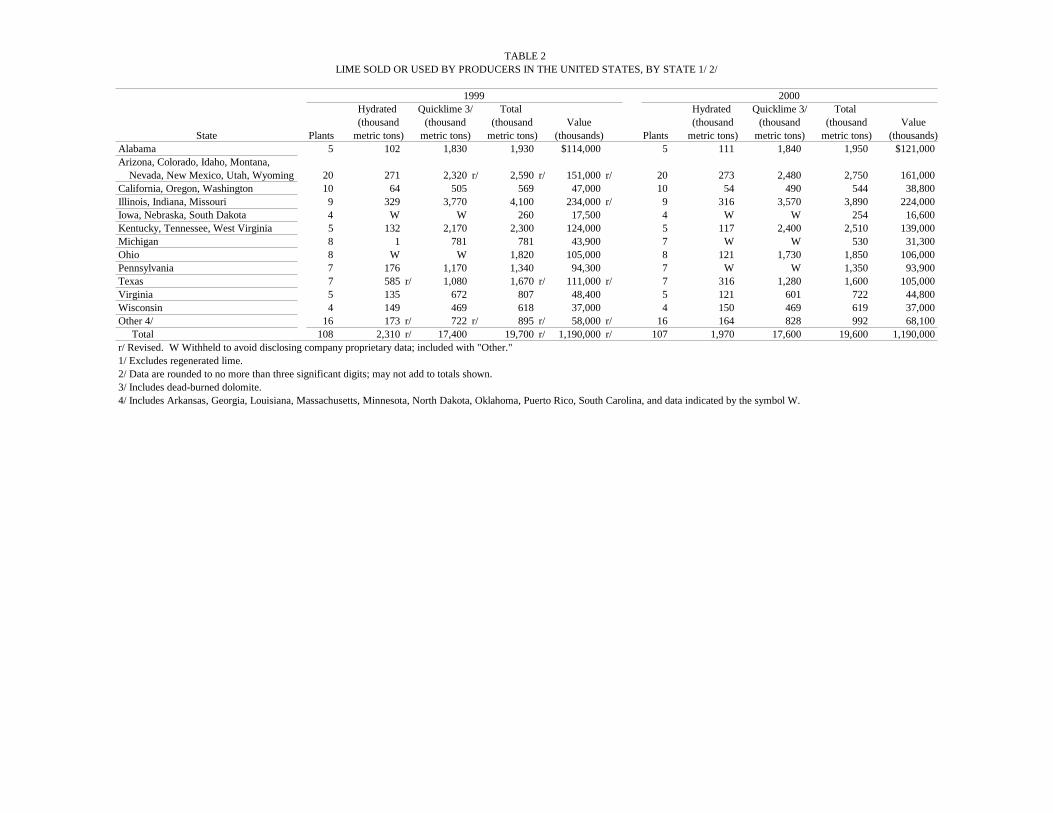
TABLE 2 LIME SOLD OR USED BY PRODUCERS IN THE UNITED STATES, BY STATE 1/ 2/
1999 2000Hydrated Quicklime 3/ Total Hydrated Quicklime 3/ Total (thousand (thousand (thousand Value (thousand (thousand (thousand Value
State Plants metric tons) metric tons) metric tons) (thousands) Plants metric tons) metric tons) metric tons) (thousands)Alabama 5 102 1,830 1,930 $114,000 5 111 1,840 1,950 $121,000Arizona, Colorado, Idaho, Montana, Nevada, New Mexico, Utah, Wyoming 20 271 2,320 r/ 2,590 r/ 151,000 r/ 20 273 2,480 2,750 161,000California, Oregon, Washington 10 64 505 569 47,000 10 54 490 544 38,800Illinois, Indiana, Missouri 9 329 3,770 4,100 234,000 r/ 9 316 3,570 3,890 224,000Iowa, Nebraska, South Dakota 4 W W 260 17,500 4 W W 254 16,600Kentucky, Tennessee, West Virginia 5 132 2,170 2,300 124,000 5 117 2,400 2,510 139,000Michigan 8 1 781 781 43,900 7 W W 530 31,300Ohio 8 W W 1,820 105,000 8 121 1,730 1,850 106,000Pennsylvania 7 176 1,170 1,340 94,300 7 W W 1,350 93,900Texas 7 585 r/ 1,080 1,670 r/ 111,000 r/ 7 316 1,280 1,600 105,000Virginia 5 135 672 807 48,400 5 121 601 722 44,800Wisconsin 4 149 469 618 37,000 4 150 469 619 37,000Other 4/ 16 173 r/ 722 r/ 895 r/ 58,000 r/ 16 164 828 992 68,100 Total 108 2,310 r/ 17,400 19,700 r/ 1,190,000 r/ 107 1,970 17,600 19,600 1,190,000r/ Revised. W Withheld to avoid disclosing company proprietary data; included with "Other."1/ Excludes regenerated lime.2/ Data are rounded to no more than three significant digits; may not add to totals shown.3/ Includes dead-burned dolomite.4/ Includes Arkansas, Georgia, Louisiana, Massachusetts, Minnesota, North Dakota, Oklahoma, Puerto Rico, South Carolina, and data indicated by the symbol W.

TABLE 3LIME SOLD OR USED BY PRODUCERS IN THE UNITED STATES, BY RANGE OF PRODUCTION 1/ 2/
1999 2000Quantity r/ Quantity (thousand Percent (thousand Percent
Range of production Plants metric tons) of total Plants metric tons) of totalLess than 25,000 tons 25 r/ 404 2 22 351 225,000 to 100,000 tons 25 r/ 1,350 7 28 1,480 8100,000 to 200,000 tons 24 r/ 3,510 18 r/ 24 3,370 17200,000 to 300,000 tons 15 r/ 3,580 18 r/ 14 3,390 17300,000 to 400,000 tons 7 r/ 2,330 12 r/ 6 2,040 10400,000 to 600,000 tons 5 r/ 2,550 13 r/ 7 3,530 18More than 600,000 tons 7 r/ 5,950 30 r/ 6 5,400 28 Total 108 19,700 100 107 19,600 100r/ Revised.1/ Excludes regenerated lime. Includes Puerto Rico.2/ Data are rounded to no more than three significant digits; may not add to totals shown.
TABLE 4LIME SOLD OR USED BY PRODUCERS IN THE UNITED STATES, BY USE 1/ 2/
(Thousand metric tons and thousand dollars) 3/
1999 2000Use Quantity 4/ Value Quantity 4/ Value
Chemical and industrial: Fertilizer (aglime and fertilizer) 23 1,900 48 3,540 Glass 98 5,650 84 5,060 Paper and pulp 971 57,800 r/ 802 48,400 Precipitated calcium carbonate 1,200 71,100 1,200 72,900 Sugar refining 792 r/ 46,400 r/ 867 53,000 Other chemical and industrial 1,920 122,000 r/ 1,670 110,000 Total 5,010 r/ 305,000 r/ 4,670 293,000Metallurgical: Steel and iron: Basic oxygen furnaces 3,860 r/ 219,000 r/ 4,000 229,000 Electric arc furnaces 1,870 r/ 111,000 r/ 1,840 111,000 Other steel and iron 239 14,700 300 17,900 Total 5,970 344,000 r/ 6,150 358,000 Nonferrous metals: Aluminum and bauxite 242 r/ 14,600 r/ W W Other nonferrous metallurgy 5/ 1,330 r/ 76,400 r/ W W Total nonferrous metals 1,570 91,000 1,310 66,300 Total metallurgical 7,550 435,000 r/ 7,450 424,000Construction: Asphalt 370 r/ 27,100 r/ 345 27,300 Building uses 396 40,400 437 43,900 Soil stabilization 1,370 r/ 89,200 r/ 1,270 80,500 Other construction 31 r/ 2,130 r/ 14 1,350 Total 2,170 r/ 159,000 r/ 2,070 153,000Environmental: Flue gas sulfur removal: Utility powerplants 2,650 r/ 135,000 r/ 2,990 158,000 Incinerator 140 r/ 8,910 r/ 139 9,020 Other 34 2,110 r/ 31 2,120 Total 2,820 r/ 146,000 r/ 3,160 169,000 Sludge treatment: Sewage 147 9,890 r/ 225 14,100 Other (industrial, hazardous, etc.) 98 6,720 r/ 90 5,690 Total 245 16,600 r/ 316 19,800 Water treatment: Acid mine drainage 91 r/ 5,940 r/ 103 6,650 Drinking water 904 56,000 958 59,600 Waste water 433 r/ 28,100 r/ 424 28,300 Total 1,430 r/ 90,000 r/ 1,480 94,600See footnotes at end of table.

TABLE 4--ContinuedLIME SOLD OR USED BY PRODUCERS IN THE UNITED STATES, BY USE 1/ 2/
(Thousand metric tons and thousand dollars) 3/
1999 2000Use Quantity 4/ Value Quantity 4/ Value
Environmental--Continued: Other environmental 178 r/ 11,700 r/ 155 10,700 Total environmental 4,690 265,000 5,120 294,000Refractories (dead-burned dolomite) 300 6/ 21,800 r/ 7/ 200 6/ 21,900 7/ Grand total 19,700 r/ 1,190,000 r/ 19,600 1,190,000r/ Revised. W Withheld to avoid disclosing company proprietary data; included in "Total."1/ Excludes regenerated lime. Includes Puerto Rico.2/ Data are rounded to no more than three significant digits; may not add to totals shown.3/ To convert metric tons to short tons, multiply metric tons by 1.10231.4/ Quantity includes lime sold and used, where "used" denotes lime produced for internal company use for copper oreconcentration, magnesia, paper and pulp, precipitated calcium carbonate, basic oxygen furnaces, mason's lime, andrefractories.5/ Includes ore concentration (copper, gold, etc.), magnesium, and other.6/ Data rounded to one significant digit to protect company proprietary data.7/ Values are estimated based on average value per ton for 1999 and 2000.
TABLE 5HYDRATED LIME SOLD OR USED IN THE UNITED STATES, BY END USE 1/ 2/
(Thousand metric tons and thousand dollars) 3/
1999 2000Use Quantity 4/ Value Quantity 4/ Value
Chemical and industrial 477 r/ 38,000 r/ 431 37,000Construction: Asphalt paving 356 r/ 26,500 r/ 325 26,200 Building uses 394 40,200 411 42,300 Soil stabilization 528 r/ 39,400 r/ 237 17,600 Other construction 16 1,080 10 1,140 Total 1,290 r/ 107,000 r/ 983 87,200Environmental: Flue gas treatment (FGT): Incinerators 19 r/ 1,380 r/ 25 1,860 Industrial boilers and other FGT 19 r/ 1,280 r/ 37 2,730 Utility powerplants 42 r/ 2,790 r/ 47 3,490 Total 80 r/ 5,460 r/ 109 8,080 Sludge treatment: Sewage 17 r/ 1,420 r/ 28 2,280 Other sludge treatment 21 r/ 1,760 r/ 17 1,470 Total 38 r/ 3,180 r/ 45 3,750 Water treatment: Acid mine drainage 55 r/ 3,620 r/ 54 3,620 Drinking water 199 15,200 143 11,900 Wastewater 114 r/ 8,240 r/ 150 11,300 Total 368 r/ 27,000 r/ 347 26,800 Other environmental 31 r/ 2,670 r/ 33 2,580Metallurgy 22 1,560 r/ 19 1,650 Grand total 2,310 r/ 185,000 r/ 1,970 167,000r/ Revised.1/ Excludes regenerated lime. Includes Puerto Rico.2/ Data are rounded to no more than three significant digits; may not add to totals shown.3/ To convert metric tons to short tons, multiply metric tons by 1.10231.4/ Quantity includes hydrated lime sold or used, where "used" denotes lime produced for internal companyuse in building, chemical and industrial, and metallurgical sectors.

TABLE 6U.S. EXPORTS OF LIME, BY TYPE 1/
1999 2000Quantity Quantity
Type (metric tons) 2/ Value 3/ (metric tons) 2/ Value 3/Calcined dolomite: Brazil -- -- 217 $95,800 Canada 2,050 r/ $483,000 r/ 2,490 553,000 Israel 24 r/ 31,900 r/ 103 25,500 Japan 1,470 r/ 358,000 r/ 90 27,800 Mexico 320 r/ 86,600 r/ 197 36,800 Netherlands 25 33,400 149 40,000 Taiwan 809 r/ 188,000 r/ 772 162,000 Vietnam -- -- 368 108,000 Other 4/ 36 17,900 265 88,300 Total 4,730 r/ 1,200,000 r/ 4,650 1,140,000Hydraulic lime: Canada 10,600 1,280,000 9,680 1,170,000 New Zealand 269 99,800 206 72,900 Other 5/ 211 r/ 62,600 r/ 130 91,400 Total 11,100 1,440,000 10,000 1,330,000Quicklime: Argentina 150 36,400 6,590 1,280,000 Canada 28,300 3,140,000 31,000 3,280,000 Costa Rica 739 124,000 428 63,800 Mexico 7,540 1,240,000 12,400 1,390,000 Russia -- -- 200 19,100 Other 6/ 58 20,000 r/ 132 202,000 Total 36,800 r/ 4,560,000 r/ 50,700 6,230,000Slaked lime (hydrate): Bahamas, The 287 47,600 551 89,300 Canada 5,820 840,000 7,040 1,070,000 France 117 39,400 -- -- Philippines 372 81,800 151 17,300 Other 7/ 163 r/ 66,600 r/ 91 81,700 Total 6,760 1,080,000 7,830 1,260,000 Grand total 59,300 r/ 8,270,000 r/ 73,200 9,960,000r/ Revised. -- Zero.1/ Data are rounded to no more than three significant digits; may not add to totals shown.2/ To convert metric tons to short tons, multiply metric tons by 1.10231.3/ Declared " Free alongside ship" (f.a.s.) valuation.4/ Includes Egypt, New Zealand, South Africa, and Uruguay.5/ Includes The Bahamas, Chile, Germany, Haiti, India, the Republic of Korea, Mexico, Spain,the United Kingdom, and Venezuela.6/ Includes The Bahamas, Barbados, Guatemala, Kuwait, Panama, Slovenia, and the UnitedArab Emirates.7/ Includes Antigua, Ireland, Mexico, Taiwan, Trinidad and Tobago, and the United Kingdom.
Source: U.S. Census Bureau.

TABLE 7U.S. IMPORTS FOR CONSUMPTION OF LIME, BY TYPE 1/
1999 2000Quantity Quantity
Type (metric tons) 2/ Value 3/ (metric tons) 2/ Value 3/Calcined dolomite: Canada 29,500 r/ $4,510,000 r/ 15,700 $2,750,000 Other 4/ 8 r/ 8,320 r/ 404 310,000 Total 29,500 r/ 4,520,000 r/ 16,200 3,060,000Hydraulic lime: Canada 26 r/ 2,750 1 3,460 Mexico 2,870 r/ 189,000 -- -- Total 2,900 r/ 192,000 1 3,460Quicklime: Canada 79,100 r/ $7,570,000 68,200 $6,770,000 Mexico -- -- 701 81,400 Other 5/ 89 r/ 138,000 246 272,000 Total 79,200 r/ 7,700,000 69,200 7,120,000Slaked lime (hydrate): Canada 16,900 r/ 1,590,000 12,400 1,210,000 Mexico 11,800 r/ 1,490,000 15,400 1,880,000 Other 6/ 88 r/ 198,000 119 196,000 Total 28,800 r/ 3,270,000 27,900 3,290,000 Grand total 140,000 r/ 15,700,000 r/ 113,000 13,500,000r/ Revised. -- Zero.1/ Data are rounded to no more than three significant digits; may not add to totals shown.2/ To convert metric tons to short tons, multiply metric tons by 1.10231.3/ Declared "Cost, insurance, and freight" (c.i.f.) valuation.4/ Includes China, Spain, and Switzerland.5/ Includes Australia, Belgium, China, Finland, Japan, Thailand, and the United Kingdom.6/ Includes Ecuador, Germany, Japan, Montserrat, Taiwan, Thailand, and the United Kingdom.
Source: U.S. Census Bureau.
TABLE 8LIME PRICES 1/
1999 2000Dollars per Dollars per Dollars per Dollars per
Type metric ton short ton metric ton short tonSold and used: Quicklime 57.30 52.00 57.50 52.10 Hydrate 80.20 72.70 85.00 77.10 Dead-burned dolomite 85.40 77.40 88.90 80.60 Average all types 60.40 r/ 54.80 60.60 55.00Sold: High-calcium quicklime 56.90 51.70 57.40 52.10 Dolomitic quicklime 55.00 49.90 59.00 53.50 Average quicklime 56.60 51.40 57.60 52.30 High-calcium hydrate 79.10 71.80 80.20 72.70 Dolomitic hydrate 87.90 79.70 103.00 r/ 93.30 Average hydrate 80.30 72.80 85.10 77.20 Dead-burned dolomite 82.40 74.80 89.70 81.40 Average all types 59.90 54.40 60.90 55.20r/ Revised.1/ Average value per ton, on an f.o.b. plant basis, including cost of containers.

TABLE 9QUICKLIME AND HYDRATED LIME, INCLUDING DEAD-BURNED DOLOMITE: WORLD PRODUCTION, BY COUNTRY 1/ 2/
(Thousand metric tons)
Country 3/ 1996 1997 1998 1999 2000 e/Australia e/ 1,500 1,500 1,500 1,500 1,500Austria e/ 1,990 4/ 1,900 2,000 2,000 2,000Belgium e/ 1,800 1,750 1,750 1,750 1,750Brazil e/ 5,700 5,700 5,700 5,700 5,700Bulgaria e/ 1,000 1,200 1,100 1,100 1,100Canada 2,402 2,477 2,514 2,585 2,600Chile e/ 1,050 1,000 1,000 1,000 1,000China e/ 20,000 20,500 21,000 21,500 21,500Colombia e/ 1,300 1,300 1,300 1,300 1,300Czech Republic 1,176 1,217 1,151 1,200 e/ 1,200France e/ 2,714 4/ 2,360 2,400 2,400 2,400Germany e/ 7,570 4/ 7,600 7,600 7,600 7,600Iran 2,000 e/ 2,500 e/ 2,737 2,138 2,200Italy e/ 5/ 3,500 3,500 3,500 3,500 3,500Japan (quicklime only) 7,744 8,104 7,646 7,594 r/ 7,650Mexico e/ 6,600 4/ 6,500 r/ 6,500 r/ 6,500 r/ 6,500Poland 2,461 2,516 2,406 2,500 e/ 2,500Romania 1,712 1,750 1,700 1,700 e/ 1,700Russia 6/ 7,822 7,626 7,000 7,000 e/ 8,000South Africa (sales) 1,650 1,585 1,523 1,920 r/ 1,345 4/Spain e/ 1,000 1,000 1,000 1,000 1,000Turkey 7/ 1,023 1,170 1,066 1,100 e/ 1,100United Kingdom e/ 2,500 2,500 2,500 2,500 2,500United States (sold or used by producers) 8/ 19,200 19,700 20,100 19,700 r/ 19,600 4/Other e/ 8,590 r/ 9,050 r/ 9,310 r/ 9,210 r/ 8,760 Total 114,000 r/ 116,000 r/ 116,000 r/ 116,000 r/ 116,000e/ Estimated. r/ Revised.1/ World totals, U.S. data, and estimated data are rounded to no more than three significant digits; may not add to totals shown.2/ Table includes data available through April 6, 2001.3/ Lime is produced in many other countries besides those included in the total. Argentina, Iraq, Pakistan, and Syria are among the moreimportant countries for which official data are not available. 4/ Reported figure.5/ Includes hydraulic lime.6/ Total industrial and construction production as reported by Russia.7/ Lime produced for steel production; does not include the widespread artisanal production of lime for whitewash and sanitation purposes.8/ Includes Puerto Rico.

FIGURE 1
TIME-VALUE RELATIONS FOR QUICKLIME SOLD
(Dollars per metric ton) 1/
57.60
64.60
57.60
55.00
57.00 56.60
55.00
57.3056.60
55.50
56.4056.80
61.30
65.60
62.50 62.80
61.90
59.4059.00
57.80
52.00
54.00
56.00
58.00
60.00
62.00
64.00
66.00
68.00
1991 1992 1993 1994 1995 1996 1997 1998 1999 2000
YEAR
VALUE
Actual value 2/
2000 dollars 3/
1/ To convert dollars per metric ton to dollars per short ton, divide value by 1.10231.
2/ Based on implicit price deflator for gross domestic product; base year 2000.
3/ Value of quicklime sold as prepared for shipment, f.o.b. plant.
85.10
78.60
85.10
72.10
67.7067.80
72.20
69.80
79.27 80.40
78.40
80.30
84.10
77.1075.40
81.9081.20
84.70
84.3083.20
65.00
70.00
75.00
80.00
85.00
90.00
1991 1992 1993 1994 1995 1996 1997 1998 1999 2000
YEAR
VALUE
Actual value 2/
2000 dollars 3/
FIGURE 2
TIME-VALUE RELATIONS FOR HYDRATED LIME SOLD
(Dollars per metric ton) 1/
1/ To convert dollars per metric ton to dollars per short ton, divide value by 1.10231.
2/ Based on implicit price deflator for gross domestic product; base year is 2000.
3/ Value of hydrated lime sold as prepared for shipment, f.o.b. plant.