2000 special issue synthetic brain imaging: grasping...
TRANSCRIPT

2000 Special Issue
Synthetic brain imaging: grasping, mirror neurons and imitation
M.A. Arbiba,b,* , A. Billardb, M. Iacobonic, E. Oztopa,b
aUSC Brain Project, University of Southern California, Los Angeles, CA 90089-2520, USAbComputer Science Department, University of Southern California, Los Angeles, CA 90089-2520, USA
cDivision of Brain Mapping, Neuropsychiatric Institute, UCLA School of Medicine, Los Angeles, CA 90095-7085, USA
Received 4 July 2000; accepted 5 July 2000
Abstract
The article contributes to the quest to relate global data on brain and behavior (e.g. from PET, Positron Emission Tomography, and fMRI,functional Magnetic Resonance Imaging) to the underpinning neural networks. Models tied to human brain imaging data often focus on a few“boxes” based on brain regions associated with exceptionally high blood flow, rather than analyzing the cooperative computation of multiplebrain regions. For analysis directly at the level of such data, a schema-based model may be most appropriate. To further address neuro-physiological data, the Synthetic PET imaging method uses computational models of biological neural circuitry based on animal data topredict and analyze the results of human PET studies. This technique makes use of the hypothesis that rCBF (regional cerebral blood flow) iscorrelated with the integrated synaptic activity in a localized brain region. We also describe the possible extension of the Synthetic PETmethod to fMRI. The second half of the paper then exemplifies this general research program with two case studies, one on visuo-motorprocessing for control of grasping (Section 3 in which the focus is on Synthetic PET) and the imitation of motor skills (Sections 4 and 5, witha focus on Synthetic fMRI). Our discussion of imitation pays particular attention to data on the mirror system in monkey (neural circuitrywhich allows the brain to recognize actions as well as execute them). Finally, Section 6 outlines the immense challenges in integratingmodels of different portions of the nervous system which address detailed neurophysiological data from studies of primates and other species;summarizes key issues for developing the methodology of Synthetic Brain Imaging; and shows how comparative neuroscience and evolu-tionary arguments will allow us to extend Synthetic Brain Imaging even to language and other cognitive functions for which few or no animaldata are available.q 2000 Published by Elsevier Science Ltd.
Keywords: Affordances; Brain imaging; Computational model; FMRI; Grasping; Imitation; Mirror neurons; Neural networks; Parietal cortex; PET; Premotorcortex; Schemas; Synthetic PET
1. Global brain function
This paper is part of a Special Issue ofNeural Networksonthe subject “The Global Brain: Imaging and Neural Model-ing”, with an emphasis on relating brain imaging data to “theactivities of the underpinning neural networks, considered atthe most appropriate level”. The Call for Papers states that“The hope of … deriving a simple theoretical understandingof the action of the brain drives the research at both theoreticaland experimental levels”. This raises many challenging issues:
1.1. Which “global brain”?
Which “global brain”? A human brain, a monkey brain
(and which species?) or some other brain? If a human brain,is it a mature brain, a developing brain, or a diseased brain?A male brain or a female brain? And what of individualdifferences? What of brain–body interactions? What ofthe effects of nature and nurture and social circumstance?We suspect that this very diversity makes “a simple theore-tical understanding of the action of the brain” impossible.However, we believe that continuing study can develop alarge store of models and methods which will let us inte-grate our insights into diverse brain mechanisms and beha-viors, helping us to see order in complexity even if wecannot achieve simplicity. In particular, this paper willintroduce our insight that data on the anatomy and physiol-ogy of the macaque monkey and the imaging of adulthumans can contribute together to an integrated view ofwhat might otherwise seem quite disparate behaviors:visually guided grasping, imitation, and language (Arbib,2000; Iacoboni et al., 1999; Rizzolatti & Arbib, 1998).Data on the mirror system (neural circuitry which allows
Neural Networks 13 (2000) 975–997PERGAMON
NeuralNetworks
0893-6080/00/$ - see front matterq 2000 Published by Elsevier Science Ltd.PII: S0893-6080(00)00070-8
www.elsevier.com/locate/neunet
* Corresponding author. Address: USC Brain Project, University ofSouthern California, Los Angeles, CA, USA. Tel.:11-213-740-9220;fax: 11-213-740-5687.
E-mail addresses:[email protected] (M.A. Arbib), [email protected] (A. Billard), [email protected] (E. Oztop).

the brain to recognize actions as well as execute them) inmonkey provide the integrating factor.
1.2. The discrepancy between brain imaging andneurophysiology
We note the discrepancy between the methodologiesemployed for gaining data on brain imaging and on theunderpinning biological networks:
1. A brain imaging experiment typically operates at the tasklevel: given a pair of tasks and some level of significance,find all areas of the brain as indicated by “blobs” whichsignal that part of the brain is significantly more active intask A rather than task B. It is common to interpret such a“blob” as indicating that a specific brain region X iscrucial to task A but not to task B. A key challenge isthen to go beyond the “blob” that indicates a statisticalconfidence measure for differences in rCBF to an under-standing of actual “information processing” in neuralnetworks. Brain imaging presents a problem of “toomuch” and “too little” — “too much” because its globalview of brain activity may draw our attention to manybrain regions whose causal role in the given task isunclear; “too little” because, in emphasizing regions“especially active” in the given task, it may downplaythe role of regions whose activity, while not yielding alarge rCBF signal, is nonetheless crucial to the neuralimplementation of the task.
2. Neurophysiological data are normally gathered in experi-ments on animals rather than humans. They typicallyfocus on just one, or very few, brain regions consideredrelevant to execution of a given task. They thus lack the“global assay” of brain imaging, but offer the advantagesof combining greater attention to parametric variation ofthe task with detailed insights into the variation of activ-ity in neurons in such a way as to constrain hypotheses onactual circuitry. The disadvantage is that since eachneurophysiological experiment is “local” as to task andcircuitry, and since protocols for even apparently similarexperiments differ greatly, there may be major interpre-tive challenges in integrating data from different experi-ments.
1.3. “Underpinning” neural networks
Much work in this journal has concernedartificial neuralnetworks — a parallel, often adaptive, computing structure,usually inspired only loosely by neurobiology, whichperforms satisfactorily some given function. But the word“underpinning” implies some measure of biologicalconstraint. The loosest constraint is to have a modular neuralnetwork in which each subnetwork is taken to represent thefunction of a particular brain region, but there is no constrainton the internal workings of the network. Some of the modelingdescribed below is of this category, but we often add (as in the
FARS model below) the constraint that the components of thesubnetwork match the anatomical characterization of celltypes in the brain region being modeled and explain the neuro-physiological data gathered from such neurons when theanimal performs the task of interest. Let us reserve the term“biologicalneural network” for a neural network designed tomodel a specific brain region or set of brain regions, and whoseunit neurons are constrained to match some neurophysiologi-cal data. More detailed models may attend to the dendriticstructure of individual neurons, or the neurochemistry of,e.g. cellular activity.
While there are many ways to represent neural networksfor computer simulation, the models described (with moreor less detail) in this paper (Sections 3.1, 5.2, and 6.1) adoptthe very simpleleaky integratormodel of the neuron, inwhich the internal state of the neuron is described by asingle variable, themembrane potential m(t) at the spikeinitiation zone. The time evolution ofm(t) is given by:
tdm�t�
dt� 2m�t�1
Xi
wiXi�t�1 h �1�
with resting levelh, time constantt , Xi(t) the firing rate atthe ith input, andwi the corresponding synaptic weight. Weusually define the firing rate as a continuously varyingmeasure of the cell’s activity. Thefiring rate is approxi-mated by a sigmoid function of the membrane potential,M�t� � s�m�t��; except in some modules of the imitationmodel (Section 5.2).
Another form of simplification is that, whereas brainimaging implicates a large number of brain regions ineven apparently simple tasks, most specific models of biolo-gical neural networks usually include models of only a smallselection of the brain regions for which neurophysiologicaldata have been gathered for the task under consideration. Inview of this, Section 6.1 quickly reviews several studiesfrom the Arbiblaboratory to indicate the challenges in inte-grating models of different portions of the nervous system toyield an integrated model that provides insight into all thebrain regions implicated by human brain imaging in a givenfamily of tasks.
1.4. Schema theory
A “connectionist” model employing anartificial neuralnetwork has no greater relevance to neurobiology than anyother functional model. Indeed, in some cases such modelsmay be positively misleading if they lead to spurious iden-tifications of elements of, say, a backpropagation networkwith specific neurons of the visual system. It is thus impor-tant to have a language in which to express functionaldecompositions of the implementation of some behaviorin such a way that neuralization of the components isopen to analysis, rather than being built in. Arbib (1981)showed how to analyze perceptual structures and distributedmotor control in terms of interacting schemas (functionalunits); schema theory has been extended to cognitive
M.A. Arbib et al. / Neural Networks 13 (2000) 975–997976

systems as well (see, e.g. Arbib, Conklin, & Hill, 1987).Two important tenets of schema theory are:
1. Schemas may be defined at different granularities. Forexample, the schemas defining some overall task likevisual control of hand movements are at a far higherlevel than the motor schemas for specific goal-relatedactions such as grasping, tearing, or holding. However,the high-level schemas contribute to each of the motorschemas for specific actions. It is thus dangerous to saythat specific neurons “encode” an action when in fact itmay take correlated activity in neurons in a variety ofbrain regions to “commit” the brain to the specific action.(We will need to recall this caveat when we discuss ourpreliminary attempts to model the mirror system inSection 6.1.)
2. Reinforcing this point, a schema defined functionally willin general require the interaction (“cooperative computa-tion”) of multiple brain regions for its implementation;conversely, a given brain region will contribute to multi-ple schemas. Thus although we will speculate below onhow various schemas may be assigned to specific brainregions in the macaque (and thus, presumably, to a homo-logous region in the human), we expect that furtherresearch will lead to more subtle insights into the anato-mical distribution of each schema.
1.5. Boxology, schemas, and synthetic PET
The danger of models based on human brain imaging,then, is that they tend to focus on a few “boxes” based onbrain regions associated with “blobs” of exceptionally highblood flow, rather than analyzing the cooperative computa-tion of multiple brain regions. For analysis directly at thelevel of such data — augmenting the data of brain imagingwith a variety of neurological insights — a schema-basedmodel may be most appropriate, offering in the end acausally complete model of how some task may be imple-mented, achieving success to the extent to which activity ofcertain of the high-level schemas in the overall coordinatedcontrol program (Arbib, 1981) can be identified with activ-ity observed through brain imaging. However, to relatebrain imaging data to “the activities of the underpinningneural networks”, we offer a method — Synthetic PETimaging (Arbib, Biscoff, Fagg, & Grafton, 1995) and itsgeneralizations — which uses neural models based on,e.g. primate, neurophysiology to predict and analyze resultsof brain imaging for a variety of human behaviors. Thisapproach is very different from the approach of covariancestructural modeling (CSEM) developed by many authorsfrom McIntosh and Gonzalez-Lima (1994) to Taylor,Krause, Shah, Horwitz, and Mueller-Gaertner (2000).CSEM makes no use of animal data to constrain our insightsinto the human brain. Instead, it uses randomness and line-arity assumptions to infer task-dependent patterns of
connectivity from the covariances observed in the brainimaging data. However, such “effective connectivity” is atask-dependent “projection” of actual synaptic connections.It is thus a task for future research to understand howto relax the CSEM assumptions and synthesize the “trueconnectivity” of brain regions from the effective connectiv-ities revealed in a wide range of tasks.
1.6. The shape of the paper
Section 2 introduces the Synthetic PET method anddiscusses its extension to fMRI (functional magnetic reso-nance imaging). Section 3 then exemplifies Synthetic PETmethodology by reviewing our earlier work on a detailedbiological neural network model for visually directed grasp-ing (the FARS model; Fagg & Arbib, 1998) and reports onthe comparison of Synthetic PET predictions with our PETstudies of human reaching and grasping. As a backgroundfor our second case study, Section 4 introduces data on themirror system in monkey (neural circuitry which allows thebrain to recognize actions as well as execute them), a systemwhich we believe holds the key to the human capacity forboth imitation (discussed at length in Section 5) andlanguage (discussed briefly in Section 6). With this back-ground, Section 5 summarizes our recent fMRI study of asimple form of imitation and relates it to a loosely biologicalmodel (i.e. made of modules in which each is a neuralnetwork identified with a brain region, but in which eachmodule is implemented as a connectionist, rather thanneurophysiologically constrained, neural network). Finally,Section 6 looks at the many facets of global modeling, witha sampler of detailed modeling of the kind needed to groundfuture global models (modeling the mirror system, the basalganglia and sequential behavior, and the cerebellum and thecoordination of reach and grasp), a brief look at our viewson the relevance of mirror neurons and imitation tolanguage, and a concluding perspective on homologies,brain imaging and neural networks.
2. Synthetic brain imaging defined
In order to provide a causal account of brain functionconstrained by data from both primate neurophysiology andhuman brain imaging, we need a method of “Synthetic Brainimaging”. We first recall the definition (Arbib et al., 1995) ofSynthetic PET imaging— using neural models based onprimate neurophysiology to predict and analyze results fromPET (Positron Emission Tomography) brain imaging takenduring a variety of human behaviors. The key hypothesis isthat PET is correlated with regional cerebral blood flow(rCBF) and that this in turn correlates with the integratedsynaptic activity in a region, and thus reflects in part neuralactivity in regionsafferentto the region studied, rather thanintrinsic neural activity of the region alone. However, themethod can potentially accommodate other hypotheses onsingle cell correlates of imaged activity, and can thus be
M.A. Arbib et al. / Neural Networks 13 (2000) 975–997 977

applied to other imaging techniques, and sowe also discuss theextension of the methodology to Synthetic fMRI. These twoapproaches will be exemplified in Section 3 [Grasp Controland (Synthetic) PET], and Section 5 [Imitation and (Synthetic)fMRI]. For other approaches to relating neural modeling andfunctional brain imaging, and cognition, see Horwitz,Tagamets, and McIntosh (1999), Tagamets and Horwitz(1998) and Taylor et al. (2000).
2.1. Defining synthetic PET
Mapping the activity simulated in neural network modelsof interacting brain regions — based on, say, single-cellrecordings in behaving monkeys — into predictions ofactivity values to be recorded from corresponding regionsof the human brain by imaging techniques such as PETinvolves two primary problems: localization, and modelingactivation.
(i) Localization:Each array in the neural network modelrepresents a neural population in a region identified anato-mically and physiologically in the monkey brain. ASynthetic PET comparison requires explicit hypotheses stat-ing that each such region A is homologous to a region h(A)in the human brain such that — within the tasks underconsideration — A and h(A) perform their tasks in thesame way. In some cases, such homologies are well defined.In other cases, the existence or identity of such a homologyis an open question. Thus, the comparison of a SyntheticPET study with the results of a human brain scan study will,inter alia, be a test of the hypothesis “h(A) in human ishomologous to A in (a given species of) monkey”, andcomparison of synthetic and human studies may suggest anew homology to be tested in further studies.
(ii) Modeling activation:PET typically measures regionalcerebral blood flow (rCBF). Arbib et al. (1995) hypothesizethat the counts acquired in PET scans are correlated withlocal synaptic activity in a particular region (Brownell,Budinger, Lauterbur, & McGeeer, 1982; Fox & Raichle,1985) and call this measure the “raw PET activity”.However, PET studies typically do not work directly withthese values, but with the comparative values of this activityin a given region for two different tasks or behaviors. Wethus define our computational method in two stages:
(a) Compute rPETA, the simulated value of raw PETactivity, for each region A of our network while it is usedto simulate the monkey’s neural activity in some given task:
rPETA �Zt1
t0
XB
wB!A�t� dt �2�
where A is the region of interest, the sum is over all regionsB that project to A,wB!A(t) is the synaptic activity (firingrate× usynaptic strengthu) summed over all the synapsesfrom region B to region A at timet, and the time intervalfrom t0 to t1 corresponds to the duration of the scan.
(b) Compare the activities computed for two differenttasks. The comparative activity PETA(1/2) for task 1 over
task 2 for each region A is then given by:
PETA�1=2� � rPETA�1�2 rPETA�2�rPETA�2� �3�
where rPETA(i) is the value of rPETA in condition i, tocompare the change in PETA from task 2 to task 1. In thepresent study we use a different measure, defining thechange inrelative synaptic activityfor region A from task1 to task 2 with max(rPETA(1), rPETA(2)) replacingrPETA(2) in the denominator of Eq. (3), which gives amore robust measure of relative activity. In either case,the result is a Synthetic PET comparison, which presentsour prediction of human brain activity, as based on neuralnetwork modeling constrained by monkey neurophysiologyand known functional neuroanatomy.
Note that we are comparingsynapticactivity for eachregion A, not the neural activity of A (though, as we shallstress at the end of Section 2.2, it is an open research issueto determine how often the difference between thesemeasures is significant). Indeed, Taylor et al. (2000) statethat although few experiments have been performed to testthe suggestion (Arbib et al., 1995; Jueptner & Weiller, 1995;Tagamets & Horwitz, 1998) that inhibition be treated in thesum with the same (positive) weight as excitation, “the fewgood ones have supported this view (see Horwitz & Sporns,1994; Jueptner & Weiller, 1995, for reviews).” As a compu-tational plus (going beyond the imaging technology), wemay also collect the contributions of the excitatory andinhibitory synapses separately, based on evaluating the inte-gral in (1) over one set of synapses or the other. UsingSynthetic PET, we can break apart different factors thatcontribute to the measure of synaptic activity so that theycan be studied independently. This can allow a much moreinformed view of the actual PET data that are collected,possibly shedding light on apparent contradictions thatarise from interpreting rCBF simply as cell activity (anexample has been demonstrated in Arbib et al., 1995).
2.2. Extending synthetic PET to synthetic fMRI
For the present paper, we shall assume that Synthetic PETand Synthetic fMRI (functional MRI) are defined byprecisely the same formula except for a possible differencein temporal and spatial resolution. In this section, we brieflydiscuss some necessary steps for future research directedtowards more realistic approaches to various modalities ofSynthetic Brain Imaging (SBI).
Our current measure of “raw PET activity”, based on alinear function of the total of the absolute value of synapticactivity, already (as we shall demonstrate in Section 3)yields qualitatively useful results in evaluating the signand small versus large magnitude of activities seen in PETcomparisons. However, we do not claim that this firstapproximation yieldsquantitatively accurate predictions.We note, as a target for further research on SyntheticBrain Imaging, the interest of evaluating a variety of more
M.A. Arbib et al. / Neural Networks 13 (2000) 975–997978

quantitative fits based on (possibly nonlinear) combinationsof cell firing rates, synaptic change, and synaptic activity perse. We also need to add a stochastic analysis to account forthe variation in PET activity seen in the same subject ondifferent trials.
It also worth noting that future developments in SBIwill probably need to be based on neural network modelsextended to include the “vampire model” of the neuron,i.e. looking at interactions between neurons, glia, andblood vessels to model more explicitly the way in whichneurons “suck blood”, embedding the study of their infor-mation processing in a richer model of the metabolicunderpinnings of these computations. For example, whenthe activity of a brain region increases, the, e.g. PETsignal for that region increases not only in intensity butalso in volume. However, this need not imply that moreneurons are being recruited, only that increased blood flowto the same set of neurons means that an increased rCBFsignal will be detected in nearby blood vessels connectingto and from the blood vessels of the stated region. Forexample, if the probability of a square millimeter of tissuesharing blood supply with another square millimeter dropsoff linearly with the distance between them, then thediameter of a circle of above threshold rCBF will increaselinearly as the rCBF within a target region increases. Ofcourse, more detailed studies of activation would have tobe based on sophisticated 3D maps of blood supply tocomplement the maps of patterns of neural innervationsused in the Synthetic PET method. Unfortunately, thesemaps are not yet available. Moreover, it must be acknowl-edged that the relation between neuronal firing, synapticactivity, and metabolic activity is still not entirely under-stood and that different models have been proposed, basedon both theoretical considerations and empirical findings(Raichle, 1998). As far as synthetic PET and syntheticfMRI are concerned, we argue below that we can applysimilar formulas to both approaches on the basis of thefollowing considerations:
The Blood Oxygenation Level-Dependent (BOLD) fMRIsignal is currently interpreted as mainly driven by a regionalchange in the ratio between deoxyhemoglobin and oxyhe-moglobin, due to the increased influx of oxygenated bloodin a given brain region with increased metabolic demand.The blood influx is estimated to be larger than is required bythe increased metabolic demand. Thus, a relative decreasein deoxyhemoglobin (i.e. after oxygen has been removed toserve metabolism), compared to oxyhemoglobin, wouldresult in signal increase due to the different magnetic prop-erties of the two molecules. A change in the ratio betweendeoxyhemoglobin and oxyhemoglobin, however, could, inprinciple, result from increased blood volume, determiningan increase in the water fraction around deoxyhemoglobin.Thus, a change in blood volume without a change in bloodflow may determine the same signal increase determined byan increase in blood flow. With regard to our paper, and tothe plausibility of adopting the synthetic PET approach to
model BOLD fMRI signal, a fair analysis of a wealth ofempirical evidence (the detailed review of which is beyondthe scope of the present article) suggests the followingconclusions:
1. The BOLD signal is probably composed of two mainfactors, blood flow changes and blood volume changes(plus some other minor factors probably contributingvery little to the signal, thus negligible here) (Hess, Stil-ler, Kaulisch, & Scheich, 2000).
2. In spite of this, the BOLD signal co-localizes fairly wellwith the PET signal and with TMS mapping (i.e. usingtranscranial magnetic stimulation) of cortical representa-tion of functions (Paus, 1999; Ro, Cheifet, Ingle, Shoup,& Rafal, 1999), and, at least in the monkey, with changesin the local field potential (N. Logothetis, personalcommunication) that are considered the expression ofneural activity at population level. Also, quantitative esti-mates of single-unit activity in macaques and BOLDfMRI in humans in response to motion coherence in theMT/V5 complex suggest that BOLD fMRI is propor-tional to firing rate (Rees, Friston, & Koch, 2000).
3. Taken together, these data suggest that blood volumeeffects do not dramatically alter the relation betweenthe PET signal and BOLD signal on one side, andBOLD signal and regional neural activity on the other.
4. Moreover, quantitative differences between integratedsynaptic activity and neuronal firing are presumablysmall and negligible. This may be due to the followingconsiderations:
(4a) most of the regional metabolic demand due toneuronal activity is eminently synaptic (Yarowsky,Kadekaro, & Sokoloff, 1983);(4b) the relationship between firing rate and metabolicsynaptic activity is approximately linear (Kadekaro etal., 1987);(4c) the overwhelming majority of synapses arelocal (Douglas, Koch, Mahowald, Martin, & Suarez,1995);(4d) a high level of cortical inhibition, resulting inlow firing rate and high metabolic activity, is unli-kely to be long lasting (van Vreeswijk & Sompo-linsky, 1998).
However, possible discrepancies between measures basedon synaptic activity and neuronal firing — and measureswhich also explore the metabolic costs of synaptic change— will be a topic for future consideration. In the presentpaper, we will first report on a Synthetic PET study of graspingbehavior in which we use the synaptic activity measure,whereas in the Synthetic fMRI experiments for imitationdescribed below we calculated the integral over time of theneural activity and not the synaptic one, since in the DRAMAnetworkused in thatmodel the synaptic weight havea differentmeaning than in the classical Perceptron model and would notrelate directly to the neural activity.
M.A. Arbib et al. / Neural Networks 13 (2000) 975–997 979

3. Grasp control and (synthetic) PET
The first Synthetic PET study (Arbib et al., 1995) focusedon Synthetic PET predictions based on a model of Domineyand Arbib (1992); of mechanisms in the monkey brain forcontrol of saccadic eye movements. Here we summarize afollow-up study (Arbib, Fagg, & Grafton, 2000), based onthe FARS (Fagg–Arbib–Rizzolatti–Sakata) model of thegrasping process of parietal–premotor interactions in thevisual control of monkey grasping movements. We firstsummarize key properties of the FARS model, then showhow we used it to generate Synthetic PET predictions whichwere then compared to a new PET study of human grasping(Grafton, Fagg, & Arbib, 1998).
3.1. The FARS model
The cells of area F5 of the macaque inferior premotorcortex are often selective for the type of grasp made bythe monkey (Rizzolatti et al., 1988). Grasps observed duringthese experiments include precision pinches (using the tipsof the index finger and thumb), lateral pinches (thumbagainst the side of the index finger), and power grasps(four fingers opposing the palm). In addition, the firing ofthese cells typically correlated with a particular phase of theongoing movement.
F5 exchanges cortico-cortical connections with the ante-rior intra-parietal area of parietal cortex (AIP), whose cellsdemonstrate a variety of both visual- and grasp-relatedresponses (Taira, Mine, Georgopoulos, Murata, & Sakata,1990).
The FARS model of the grasping process (Fagg & Arbib,1998) focuses on the roles of several areas, especially theinteractions of F5 and AIP, but also their relationship with
pre-SMA (F6), F2 (dorsal premotor cortex), and the basalganglia (BG).
3.1.1. A brief model overviewThe crucial aspects of the model (see Fig. 1) are the
following:
1. AIP serves the dual role of first computing aset of affor-dancesfor the object being attended (i.e. AIP highlightsproperties of the object relevant for physically interactingwith it), and then maintaining anactive memoryof theselected affordance as the corresponding grasp isprepared and executed.
2. F5 integrates a variety of constraints to decide on thesingle grasp that is to be executed. These constraintsinclude visual information (from the affordancesextracted by AIP), task information (from pre-SMA,F6), instruction stimuli (from dorsal premotor cortex,F2), and a working memory of recently executed grasps.When the movement is triggered, F5 is responsible forthe high-level execution and subsequent monitoring ofthe planned preshape and grasp.
3. As indicated in Fig. 2, F6 (pre-SMA) represents the high-level execution of the sequence, while phase transitionsdictated by the sequence are managed by the basal gang-lia (BG). For a task (“the Sakata protocol”) in which themonkey was presented with an object, then grasped theobject in response to a go signal, held the object, andfinally released the object after a secondary go signal,the following phases in F5 activity were influenced byBG control mechanisms: preparatory (set), finger exten-sion, finger flexion, holding, and release.
4. Fagg and Arbib (1998) offered both a computationalanalysis and an analysis of empirical data in support ofthe hypothesis that not only is F5 responsible for unfold-ing (with BG supervision) the grasp in time during theexecution of the movement, but that F5 also sends recur-rent connections back to AIP to update AIP’sactivememoryfor the grasp that is about to be executed orthat is being executed by F5.
3.1.2. Control of conditional behaviorThe many details of the FARS model (Fagg & Arbib,
1998) are beyond the scope of the present review. Herewe focus on its performance in aconditional task inwhich the grasp is not known prior to a given trial, and isonly determined by an arbitraryinstruction stimulus(IS)made available during the course of the trial (e.g. an LEDwhose color indicates one of two grasps). The dorsal premo-tor cortex (F2) is thought to be responsible for the associa-tion of arbitrary IS with the preparation of motor programs(Mitz, Godshalk, & Wise, 1991; see Fagg & Arbib, 1992 fora related model). In the FARS model, then, F5 combines theview of the object (with its multiple affordances signaled by
M.A. Arbib et al. / Neural Networks 13 (2000) 975–997980
Fig. 1. According to the FARS model, AIP uses visual input to extractaffordances, which highlight the features of the object that are relevant tograsping it. F5 then applies various constraints to select a grasp for execu-tion and to inform AIP of the status of its execution, thus updating AIP’sactive memory. The areas shown are AIP (anterior intraparietal cortex),area F5 (of the ventral premotor cortex), and regions providing supportinginput to F5, namely F6 (pre-SMA), area 46 (dorsolateral prefrontal cortex),and F2 (dorsal premotor cortex).

AIP) with the instruction stimulus (F2) to specify whichgrasp is to be executed.
Fig. 2 presents a schematic view of the model’s architec-ture. Arrows indicate excitatory connections betweenregions; filled circles indicate inhibitory connections. Thedorsal premotor cortex (F2) biases the selection of grasp toexecute as a function of the presented instruction stimulus.The precision pinch and power grasp pools in F5 and AIPare connected through recurrent excitatory connections.Since Rizzolatti noted that more F5 neurons are related tothe precision pinch than to other grasps, the precision pinchpool in the FARS model contains more neurons than othergrasp pools. Arbib et al. (2000) show how this affects theSynthetic PET measure in these and downstream regions,and discuss the implication of these results for reconcilingthe FARS model with actual PET studies of rCBF incomparing the precision pinch task against the powergrasp task. However, in what follows we concentrate onthe comparison of a conditional with a non-conditional task.
3.2. Synthetic PET results
Arbib et al. (2000) conducted two different Synthetic PETexperiments, providing predictions for what we expectwhen the experiments are performed in the human. Inboth experiments, the modeled subject is asked to grasp asingle object using one of two grasps. In the first experi-ment, we examined (i) the effects of knowing which grasp touse prior to the onset of recording (non-conditional task),and (ii) only being told which grasp to use after a delayperiod (conditional task). In the latter task, an instructionstimulus in the form of a bi-colored LED informs the subject
which grasp should be used. Here we summarize thecomparison of conditional and non-conditional tasks.
The most significant predicted change was the level ofactivity exhibited by area F2 (dorsal premotor cortex). Itshigh level of activity in the conditional task is due to the factthat this region is only involved when the model must mapan arbitrary stimulus to a motor program. In the non-condi-tional task, the region does not receive IS inputs, and thus itssynaptic activity is dominated by the general backgroundactivity in the region.
The additional IS inputs in the conditional task have asecond-order effect on the network, yielding small changesin synaptic activity in F5, BG, and AIP (see Arbib et al.,2000 for details). Increased synaptic activity in F5 is due tothe additional positive inputs from F2. These inputs alsocause an increase in the region’sactivity level, which ispassed on through excitatory connections to both AIP andBG (recall Fig. 2).
It is important to recall that synaptic activity does nothave the same meaning asneural activity. This can beseen by examining the definition ofwB!A(t) (see Eq. (2)).The absolute value of the synaptic strength contributes posi-tively to this measure — so increases in either positiveornegative signals into a region will be reflected as anincreasein synaptic activity. Neural activity, on the other hand,depends monotonically on the synaptic strength: increasesin positive signals result in increases in neural activity,whereas increases in negative signals result in decreasesof activation. An important ability of the Synthetic PETtechnique is that the positive and negative contributions tothe Synthetic PET measure can be differentiated in the simu-lation. This information, combined with knowledge of the
M.A. Arbib et al. / Neural Networks 13 (2000) 975–997 981
Fig. 2. Another view of FARS model architecture. Arrows indicate excitatory connections between regions; filled circles indicate inhibitory connections. Theprecision pinch and power grasp pools in F5 and AIP are connected through recurrent excitatory connections. The precision pinch pool contains more neuronsthan other grasps. The dorsal premotor cortex (F2) biases the selection of grasp to execute as a function of the presented instruction stimulus.

gross anatomy (especially the sign of connections betweenregions), can aid in inferring changes in neural activityacross tasks. Although the positive contributions to F5 andAIP essentially dominate the full PET measure, we also sawsmall increases in the negative inputs into these regions.These inhibitory signals are due to negative inputs fromlocal recurrent connections in the respective areas (in thecase of F5, BG also contributes additional negative inputs).This serves as additional evidence that both F5 and AIPexperience increases in their overall neural activity.
3.3. Human brain imaging
To provide human PET data relevant to the aboveSynthetic PET predictions, Grafton et al. (1998) askedsubjects to repeatedly perform grasping movements over a90-s scanning period. The targets for grasping were locatedat three stations mounted on an experimental apparatus,with each station consisting of both a rectangular blockthat could be grasped using a power grasp, and a pair ofplates (mounted in a groove on the side of the block), whichcould be grasped using a precision pinch (thumb and indexfinger). A force sensitive resistive (FSR) material, mountedon the front and back of the block, detected when a solidpower grasp had been established. The pinch plates wereattached to a pair of mechanical micro-switches whichdetected when a successful precision pinch had beenexecuted. For each station, the block and plates weremounted such that the subject could grasp either one withoutrequiring a change in wrist orientation. A bi-colored LED ateach station was used to instruct the subject as to the nexttarget of movement. A successful grasp of this next targetwas indicated to the subject by a change in the color of the
LED. The subject then held the grasp position until the nexttarget was given. Targets were presented every 3^ 0.1 s.
Four different scanning conditions were repeated threetimes each. In the first, subjects repeatedly performed apower grasp to the indicated block. The target block wasidentified by the turning on of the associated LED (green incolor). When the subject grasped the block, the color of theLED changed from green to red. For the second condition, aprecision pinch was used. The target was identified in thesame manner as the first condition. In the third graspingcondition (conditional task), the initial color of the LEDinstructed the subject to use either a precision pinch(green) or a power grasp (red). When contact was estab-lished, the LED changed to the opposite color. In the fourth(control) condition, the subjects were instructed to simplyfixate on the currently lit LED, and not make movements ofthe arm or hand (prior to the scan, the arm was placed in arelaxed position). The lit LED changed from one position toanother at the same rate and variability as in the graspingtasks. Prior to scanning, subjects were allowed to practicethe tasks for several minutes. Grafton et al. (1998) provideresults for Grasp versus Rest, Precision versus Power Grasp,Conditional versus Non-Conditional Grasp. Here we presentonly the third case:
Fig. 3 reflects differences of conditional grasp selection(power or precision based on color cues) as compared to anaverage of the fixed grasping conditions (power and preci-sion tasks): Cond2 (Power1 Precision)/2. The upperarrow indicates a large area of significance in the left super-ior frontal sulcus corresponding to the dorsal premotorcortex. As noted earlier, this region in monkey is thoughtto be involved in the arbitrary association of stimuli with thepreparation of motor programs. The lower arrow indicatesincreased CBF in the left inferior parietal lobule and intra-parietal sulcus. Because this comparison is counterbalancedfor the amount of movement made during execution of thetasks, there is no difference observed in the motor executionareas.
3.4. Comparison of PET and synthetic PET
The model predicts that the conditional task should yieldmuch higher activation in F2 (dorsal premotor cortex), someactivation of F5, and a slight activation of AIP. The humanexperiment confirmed the F2 result, but failed to confirm thepredictions for F5. Furthermore, in human we see an activa-tion of the inferior parietal cortex, along the intra-parietalsulcus, which is perhaps an AIP homologue.
Can we make use of the negative F5 result to furtherrefine the model? Consider the functional connectivity ofthese regions in the model (Fig. 4, left). In the model, thestrength of the projection from F2 to F5 is essentially a freeparameter. In other words, there is a wide range of valuesover which the model will correctly perform the conditionaland non-conditional tasks. The implication is that, by tuningthis parameter, we can control this projection’s contribution
M.A. Arbib et al. / Neural Networks 13 (2000) 975–997982
Fig. 3. Left hemisphere localization of task related effects. PET statisticalcomparisons of the pooled data across subjects (in red,P , 0:005) aresuperimposed on a single subject’s MRI scan centered in the same coordi-nate space. The view is left superior oblique, and denotes differencesbetween conditional grasp selection versus fixed grasping.

to the synaptic activity measure in F5. However, the differ-ence in AIP synaptic activity from the non-conditional to theconditional task will always be less than the differenceobserved in F5. Why is this the case? By increasing theprojection strength from F2 to F5, we observe an increasein both F5 synapticandcell activity. The increase in F5 cellactivity, however, is attenuated by local, recurrent inhibi-tory connections. Thus the excitation that is then passed onto AIP via F5 does not reflect the full magnitude of thesignal received from F2.
The conclusion is that, although we can adjust the freeparameter to match one or the other observations in thehuman experiment (of either F5 or AIP changes), themodel cannot reflect both at the same time. One possibilityfor repairing this problem in the model is to reroute the F2information so that it enters the grasp decision circuitrythrough AIP (or both AIP and F5), rather than exclusivelythrough F5 (Fig. 4, left). This would yield an increase inactivity in AIP due to F2 activation with only an attenuatedsignal being passed on to F5, resulting in only a smallincrease in F5 synaptic activity. Note that we do not neces-sarily assume that there exists a direct cortico-corticalconnection from F2 to AIP or F5, but only that there is afunctional connection (which potentially involves multiplesynapses).
The low-level details of the FARS grasping model (Fagg& Arbib, 1998) were derived primarily from neurophysio-logical results obtained in monkey. The synthetic PETapproach extracts measures of regional synaptic activity asthe model performs a variety of tasks. These measures arethen compared to rCBF (regional cerebral blood flow)observed during human PET experiments as the subjectsperform tasks similar to those simulated in the model. Insome cases, the human results provide confirmation of themodel behavior. In other cases, where there is a mismatchbetween model prediction and human results, it is possible
(as we have shown) to use these negative results to furtherrefine and constrain the model and, on this basis, design newexperiments for both primate neurophysiology and humanbrain imaging (see Arbib et al., 2000 for further details).
4. The mirror system and imitation
As a background for our second case study on SyntheticBrain imaging, on Imitation and (Synthetic) fMRI inSection 5, we now review data on the mirror neuron systemfor grasping in the monkey brain, and then discuss its impli-cations for the study of imitation in humans. We shall brieflydiscuss the relevance of mirror systems and imitation for theevolution of language in Section 6.3.
4.1. The monkey mirror system for grasping
In Section 3.1, we saw that cells of area F5 of inferiorpremotor cortex of the macaque are often selective for thetype of grasp made by the monkey (Rizzolatti et al., 1988),while the anterior intra-parietal area of parietal cortex (AIP)has cells demonstrating a variety of both visual- and grasp-related responses (Taira et al., 1990). Here we extend the F5database by noting the discovery by Gallese, Fadiga,Fogassi, and Rizzolatti (1996) and Rizzolatti, Fadiga,Gallese, and Fogassi (1996) of a subset of F5 grasp cellswhich they calledmirror neurons. Like other F5 neurons,mirror neurons are active when the monkey performs aparticular class of actions. However, in addition the mirrorneurons become active when the monkey observes theexperimenter or another monkey performing an action. Inmost of the mirror neurons, there is a clear relation betweenthe coded observed and executed action. The actions studiedso far include grasping, manipulating and placing. Thecongruence between the observed and executed actionvaries. For some of the mirror neurons, the congruence is
M.A. Arbib et al. / Neural Networks 13 (2000) 975–997 983
Fig. 4. Previous functional model (left; compare Fig. 2) and updated functional model (right). In the revised model, the information from F2 flows (primarily)into the circuit through a projection into AIP.

quite loose; for others, not only must the general action (e.g.grasping) match but also the way the action is executed (e.g.power grasp) must match as well. To be triggered the mirrorneurons require an interaction between the experimenterand the object. The sight of the experimenter or the objectalone does not trigger mirror activity.
Fig. 5 demonstrates the dual response property of mirrorneurons. The recorded neuron in the figure is silent duringthe presentation of the object, but starts firing when theexperimenter picks up the object. The neuron interestinglydoes not fire during the time the tray is moved towards themonkey (the monkey knows that he is going to pick up theobject) and finally it starts firing again when the monkey,himself, picks up the object. A range of congruence (thedegree of strictness of the match between the actionobserved and the executed action) is found in mirrorneurons. The most congruent responses require the observedaction and the executed action to use the same grasp type.
Fogassi, Gallese, Fadiga, and Rizzolatti (1998) find that F5is not the only area that has mirror neurons. The rostral part ofthe inferior parietal lobule of the macaque monkey (area 7b orPF) also has neurons with similar mirror properties.
Recent human PET studies indicate that a similar mirrorneuron system exists in the human brain. Grafton, Arbib,Fadiga, and Rizzolatti (1996a) scanned subjects under threeconditions: object viewing (the control condition), obser-ving a precision grasping of common objects, and imaginingthemselves doing the same grasp. The imagined minuscontrol and observation minus control results werecompared. Differences were seen in both lateral activationsand medial/dorsal activations. In the observation minuscontrol condition, activity locations were left STS (thecortex of superior temporal sulcus), left inferior frontalarea 45, and the left parietal area 40. Also there was someactivation found in the rostral part of the left intraparietalsulcus. Grafton et al. pointed out that the location of the
activated sites during grasping observation in humans corre-sponds rather well to that of monkey cortical areas contain-ing neurons that selectively discharge during hand actionobservation. Finally they conclude that in monkeys andhumans a similar cortical circuit is involved in representingobserved grasping. Unfortunately we cannot be sure that theactivities are due to mirror neuron system since there is noconvincing study showing that the same regions get acti-vated selectivelyfor self executed grasps (Grafton, Fagg,Woods, & Arbib, 1996).
4.2. Imitation in humans
Imitation is a complex behavior requiring the integrationof a multitude of sensory stimuli and of a variety of move-ments. This integration process is affected by attentional,emotional, social, and environmental factors. All thesefactors modulate learning by imitation. Still, some funda-mental principles of learning by imitation can be extrapo-lated by the investigation of its neural mechanisms. Theseprinciples can be used to define the mental representationsunderlying learning by imitation in neural, computational,psychological, and social terms.
In spite of the complexity of imitative behavior, there aredata (still somewhat controversial) supporting the claim thateven soon after birth human infants can imitate facial andsome manual gestures (Meltzoff & Moore, 1977). However,it is important to stress that there may be different mirrormechanisms for different acts, and that imitation for grasp-ing requires months to develop. Smiling is probably aninnate releasing mechanism for smiling (whether the infantsmiles at the parent or the parent smiles at the infant)depending, like laughing and weeping, on “built-in” circui-try. We distinguish this from building a novel repertoire andthen building further to assemblages of variations.
Our hypothesis is that an appropriate mirror system(observation/execution matching system) orchestrates thevarious components involved in the sensorimotor transfor-mations required by imitation of behaviors more complexthan smiling, laughing and weeping. More complex beha-viors are not simply learned and replicated as unified non-decomposed patterns. In terms of neural control, the braingenerates internal models (neural mechanisms that canmimic the input–output characteristics of the learningsystem: Jordan & Rumelhart, 1992; Wolpert, Ghahramani,& Jordan, 1995). To learn, a system must be able to general-ize beyond the set of sensory stimuli and movements thathas been experienced in the past. This is possible onlythrough the internal representation of sensory consequencesof motor commands (the forward model) or, inversely,through the extrapolation of motor commands from theobservation of motor behavior (the inverse model).
The representation of action supported by mirror neuronsseems to be more a representation of action goals than ofmotor outputs (Arbib & Rizzolatti, 1997). We must thusseek to establish how these goals may be combined to form
M.A. Arbib et al. / Neural Networks 13 (2000) 975–997984
Fig. 5. Activity of a cell during action observation (left) and action execu-tion (right). There is no activity during either initial presentation of theobject or as the tray is brought towards the monkey (from Gallese et al.,1996).

a repertoire of purposeful and adaptive behavior. Moreover,action goals are hierarchically organized in human imitativebehavior. Studies on imitation in children show that pre-schoolers represent the most salient goal of the action to beimitated, but often ignore lower goals (Bekkering, Wohlschal-ger, & Gattis, 2000) (incidentally, this is the same behavior ofpatients with aphasia, Head, 1920; supporting the possiblelinks between imitation and language to be taken up brieflyin Section 6.3). Goals are easily embodied by objects (Marygrasps a cup). Thus, the role of objects in action observationand learning by imitation seems to be a crucial one and needsto be clarified.
In Section 5.1, we present the results of an fMRI study ofan imitation task that involves a subject observing a verysimple finger movement and responding with a movementwhich in its entirety is already in the subject’s own reper-toire. Skill acquisition more generally (consider, for exam-ple, learning a new dance), however, rests on a far morecomplex form of imitation that involves “parsing” acomplex movement into more or less familiar pieces, andthen performing the corresponding composite of (variationson) familiar actions. Note the insistence on “more or lessfamiliar pieces” and “variations”. Elsewhere, we (Arbib,1981) have introduced the notion of a coordinated controlprogram, to show how a new behavior could be composedfrom an available repertoire of perceptual and motor sche-mas (the execution of a successful action will in generalrequire perceptual constraints on the relevant movements).However, skill acquisition not only involves the formationof new schemas as composites of old ones, it also involvesthe tuning of these schemas to match a new set of condi-tions, to the point that the unity of the new schema mayover-ride the original identity of the components. For exam-ple, if one is acquiring a tennis stroke and a badmintonstroke through imitation, the initial coordinated controlprogram may be identical, yet in the end the very differentdynamics of the tennis ball and shuttlecock lead to divergentschemas. Conversely, a skill may require attention to detailsnot handled by the constituent schemas of the preliminarycoordinated control program. Fractionation may berequired, as when the infant progresses from “swipinggrasps” at objects to the differentiation of separate schemasfor the control of arm and hand movements. Later, the handmovement repertoire becomes expanded as one acquiressuch novel skills as typing or piano playing, with this exten-sion matched by increased subtlety of eye–arm–hand coor-dination. Thus we have three mechanisms (at least) to learncompletely new actions: forming new constructs (coordi-nated control programs) based on familiar actions; tuningof these constructs to yield new encapsulated actions, andfractionation of existing actions to yield more adaptiveactions as tuned, coordinated control programs of novelschemas.
However, the study of imitation mechanisms based on thebuilding up and/or the fractionation of coordinated controlprograms is a task for the future. Instead, Section 5.1 will
present fMRI data on human imitation of simple fingermovements, while Section 5.2 will offer a preliminaryglobal model of imitation based on the joint-by-joint repro-duction of an observed movement which Section 5.3 willbuild upon to provide a Synthetic fMRI study of graspingand finger tapping.
5. Imitation and (synthetic) fMRI
5.1. An fMRI study of “simple” imitation
In a recent study of “simple” imitation in humans (Iaco-boni et al., 1999), we compared fMRI activity during imita-tion with fMRI activity during two control tasks in whichsubjects were required to perform the same finger move-ments as in the imitation task, but in response to symbolicor spatial cues. We reasoned that if some human brain areashad mirror properties during imitation, then these areasshould become active during action execution regardlessof how the action was elicited, and should also becomemore active during imitation. This is because the action tobe performed was also observed and so a brain area withmirror properties would be simultaneously activated by themotor command to be executed and by the visual inputrepresenting the observed action. Moreover, these areasshould become active during action observation comparedto rest.
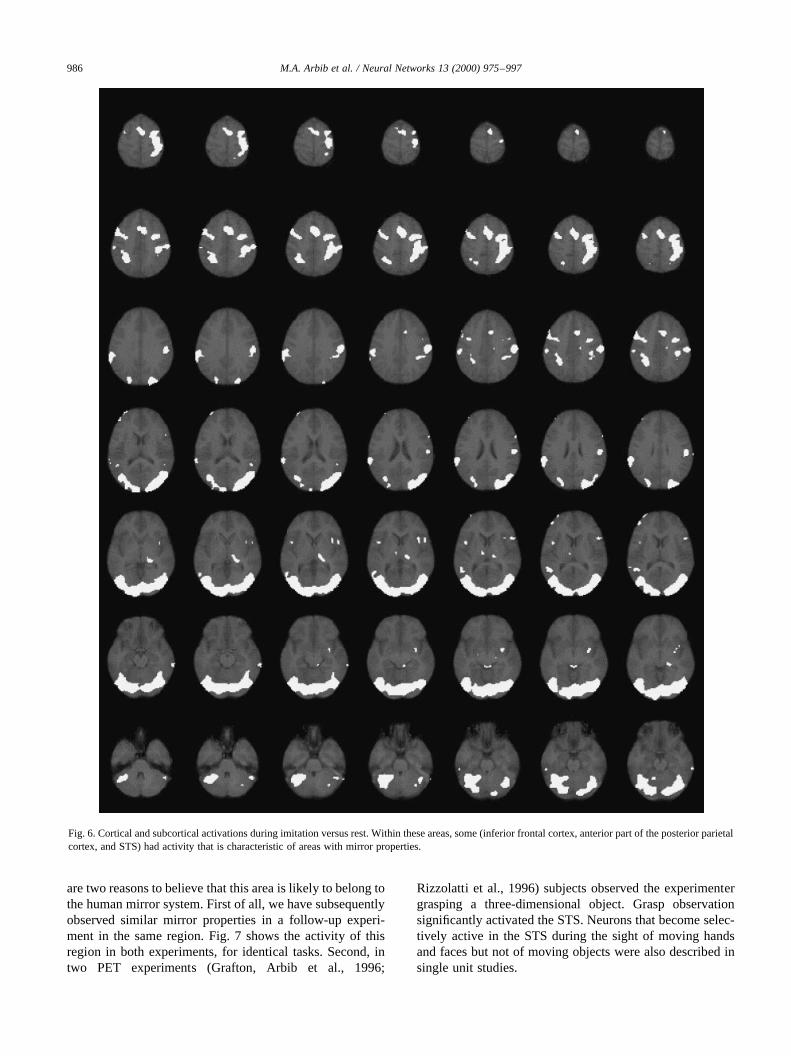
Fig. 6 shows a comprehensive view of activated areasduring imitation versus rest in this experiment. Amongthese activated areas, we found two areas with mirror prop-erties, i.e. they were simultaneously activated by the motorcommand to be executed and by the visual input represent-ing the observed action. One was located in the inferiorfrontal cortex of the left hemisphere and corresponded toBrodmann area 44 (Broca’s area). The other was located inthe rostral part of the posterior parietal cortex in the righthemisphere (area PE/PC). We proposed that the left inferiorfrontal cortex (area 44) describes the observed action interms of its motor goal, whereas the right posterior parietalarea (PE/PC) codes the precise kinesthetic aspect of themovement (Iacoboni et al., 1999). Note, however, that thelateralization of the activations is rather relative. In fact,when statistical thresholds are lowered, bilateral activationsare observed in both inferior frontal and posterior parietalcortices.
The demonstration of mirror properties in Broca’s areaduring imitation is in support of the hypothesis thatlanguage evolved from a basic mechanism not originallyrelated to communication: the mirror system with its abilityto generate and recognize actions (Rizzolatti & Arbib, 1998;see also Section 6.3).
We also observed mirror properties in the activity of anarea located in STS. The activity in this region did not reachfull significance after correction for multiple comparisonsand was not reported in the original paper. However, there
M.A. Arbib et al. / Neural Networks 13 (2000) 975–997 985
are two reasons to believe that this area is likely to belong tothe human mirror system. First of all, we have subsequentlyobserved similar mirror properties in a follow-up experi-ment in the same region. Fig. 7 shows the activity of thisregion in both experiments, for identical tasks. Second, intwo PET experiments (Grafton, Arbib et al., 1996;
Rizzolatti et al., 1996) subjects observed the experimentergrasping a three-dimensional object. Grasp observationsignificantly activated the STS. Neurons that become selec-tively active in the STS during the sight of moving handsand faces but not of moving objects were also described insingle unit studies.
M.A. Arbib et al. / Neural Networks 13 (2000) 975–997986
Fig. 6. Cortical and subcortical activations during imitation versus rest. Within these areas, some (inferior frontal cortex, anterior part of the posterior parietalcortex, and STS) had activity that is characteristic of areas with mirror properties.

The mirror area in STS is more posterior than the STSregion found active in previous studies of action observationin humans and in macaques. (See Section 6.1 for furtherdiscussion of data on STS.) It is possible that the STSregion, a region critical for the understanding of socialsignals, is constituted of a rostral sector with sensory proper-ties only and a caudal sector with mirror properties. It hasbeen proposed that the anterior STS neurons that are acti-vated by the sight of moving hands and faces analyze theactions of others. This anterior ‘sensory-only’ STS regionmay feed into the more posterior “mirror” STS regionduring imitation. The anterior STS region would provide avisual analysis of the actions of others, whereas the moreposterior STS regions would provide a first level of match-ing between observation and execution. The other twomirror areas described in our paper would describe theobserved action in terms of its motor goal (BrodmannArea 44), and would code the precise kinesthetic aspect ofthe movement (PE/PC). It is possible that each of these othermirror areas has a dedicated cortical area for preprocessingof the action to be imitated during action observation. Infact, in our fMRI experiment on imitation we did observegreater activation for action observation than for observa-tion of the symbolic or spatial cues in two areas, one in thedorsolateral prefrontal cortex (that would feed into Brod-mann Area 44) and one in the caudalmost part of the intra-parietal sulcus (that would feed into PE/PC).
We saw (Section 4.1) that mirror neurons are found in themacaque brain for object-oriented grasping actions andshow a narrow tuning with respect to the type of objectand the way it is treated but quite a broad tuning for thetrajectory of the movement or the motor effector involved(Gallese et al., 1996). In our fMRI study we used an intran-sitive action, and no objects were involved. The presence ofreal objects, however, alters the motor component of thetask and makes it more difficult to interpret imaging data.However, dots or marks on a table can be used as end-pointsof imitated actions. These dots or marks are known to alterthe imitative behavior of preschoolers and adults. In a recent
study, the experimenter initiated hand movements to one oftwo dots on a table and asked children to imitate his actions.In another condition the same movements were performedand were imitated, except that this time the movements weredirected to the same places on the table but no dots werevisible. In the latter condition children imitated well themovements of the experimenter, including their laterality,whereas when dots were visible children would often reachfor the correct dot with the incorrect hand (Bekkering et al.,2000). This is because when observing object-orientedactions, the object activates a ‘direct’ motor program; i.e.a motor program that leads most directly to the effect theaction has on the object, like grasping, pointing, covering,etc. Without objects, the relative positions of the fingersbecome the goal of the action. These goals also call the‘direct’ motor program, but now the ‘direct’ motor programis matching the observed non-object oriented action. Thispredicts that goal-oriented areas, such as Broca’s area,should be more active during the imitation of object-oriented actionsthan during the imitation of non-object-oriented movements. The reasoning is that if Broca’s areais the homologue of the monkeys mirror neuron system(tuned for object-oriented actions), then Broca’s area shouldalso be better tuned for object-oriented actions. For theparietal area PE/PC we might expect that the visiblepresence of goals would not modulate its activity and thusgoal-oriented actions and intransitive actions to be imitatedwill activate this region similarly. Preliminary data fromongoing fMRI experiments performed in the Iacobonilaboratory seem consistent with these predictions.
Taken together, these data suggest a first draft of an infor-mation processing model of human imitation according towhich the early “description” of the action is performed inSTS. From this region, inputs would be transferred to theposterior parietal cortex for precise coding of the kines-thetics of the action. This region would in turn send infor-mation to Broca’s area for defining the goal of the action.Information would be recursively shuffled among theseareas for a tight coupling of these three ‘levels’ of
M.A. Arbib et al. / Neural Networks 13 (2000) 975–997 987
Fig. 7. Activity in STS showing mirror properties. This activity was observed in two separate experiments comprising 12 subjects in the first experiment and 10different subjects in the second experiment. I: imitation; MC: motor control; AO: action observation; OC: observation control.

M.A
.A
rbib
et
al.
/N
eu
ralN
etw
orks
13
(20
00
)9
75
–9
97
988
Fig. 8. The global imitation model consists of three parts for visual recognition, motor control and learning and is composed of biologically inspired modules, namely the superior temporal sulcus (STS), thespinal cord, the primary motor cortex (M1), the dorsal premotor area (PMd) and the cerebellum.

information processing, i.e. motion recognition, kines-thetics, and goal-orientation. In Section 6.1 we outline thestructure of a model which develops some of these ideas onthe basis of neurophysiological data. However, the presentarticle emphasizes a “global” model (Section 5.2) based ona high-level view of a few large brain regions, each modeledconnectionistically without attempting to address details ofneurophysiology. We then offer (Section 5.3) a SyntheticfMRI analysis of the model. The integration of these twocomplementary models, and the development there from fora model of complex imitation based on coordinated controlprograms, is a goal for future research.
5.2. Imitation: a global model
Our Global Imitation Model (Fig. 8) is a preliminarymodel of primate imitative ability (Billard, 2000). Ouraim was to build a comprehensive, but simplified modelof the visuo-motor pathway behind learning by imitation,from processing real video data to directing a completedynamic simulation of a humanoid.
This model is biologically inspired in its function, as itscomposite modules have functionalities similar to that ofspecific brain regions, but the modules are composed ofartificial neural networks whose neurons are littleconstrained by biological data. It is loosely based on neuro-logical findings in primates and incorporates abstractmodels of some brain areas involved in visuo-motor control,namely STS, the spinal cord, the primary motor cortex(M1), the dorsal premotor area (PMd) and the cerebellum.The model is implemented in a dynamic simulation of a 65degrees of freedom avatar which allows us to approximatethe motions of a humanoid.
The STS module takes as input the Cartesian coordinatesof each joint of the demonstrator’s limbs in an exocentricframe of reference. It then transforms these coordinates to anew set of coordinates relative to an egocentric frame ofreference. Our assumption of the existence of orientation-sensitive cells in an egocentric frame of reference in STS issustained by neurological evidence in monkeys (Perrett,Harries, Mistlin, & Chitty, 1989; Perrett, Harries, Bevanet al., 1989) and humans (Andersen, Lawrence, Bradley,& Xing, 1997; Kertzman, Schwarz, Zeffiro, & Hallett,1997; Vallar et al., 1999). The vision system also incorpo-rates a simplified attentional mechanism which triggerswhenever a significant change of position (relative to theposition at the previous time step) in one of the limbs isobserved. Note that, at this stage of the modeling and giventhe simplicity of this module, the attentional module doesnot relate to any specific brain area. The attentional mechan-ism creates an inhibition, preventing information flow fromM1 to PMd and further to the cerebellum, thereby allowinglearning of new movements only when a change in the limbposition is observed. In previous experiments, we usedvideo recording of human motion to drive the imitationexperiments, see Billard (2000).
Motor control in our model is hierarchical with, at thelowest level, the spinal cord module, composed of primaryneural circuits (central pattern generators (CPGs); Stein,Grillner, Selverston, & Stuart, 1997), made ofmotorneuronsand interneurons. The structure of the CPGs isstrongly inspired by Ijspeert’s model of vertebrate spinalcircuits (Ijspeert, Hallam, & Willshaw, 1999), and encodesimple rhythmic movements of arm and legs for open-loopwalking, as well as primary motor behaviors, such asretracting and stretch arm movements of the humanoidavatar. The motor neurons in our simulation activate theavatar’s muscles. We model two muscles per degree of free-dom per joint. Each muscle is represented as a spring and adamper (Lacquaniti & Soechting, 1986).
The M1 module monitors the activation of the spinalnetworks. Nodes in M1 are distributed following a topo-graphic map of the body. Learning of movements is donein the PMd and cerebellum modules. These modules areimplemented using the Dynamical Recurrent AssociativeMemory Architecture (DRAMA) (Billard & Hayes, 1999)which allows learning of times series and of spatio-temporalinvariants in multi-modal inputs. Finally, the decisionmodule controls the passage between observing and repro-ducing the motor sequences, i.e. it inhibits PMd neuralactivity due to STS (visual) input to flow downwards toM1 (for motor activation). It is implemented as a set ofif–then rules and has no direct biological inspiration.
Neurons in the PMd module respond to both visual infor-mation (from STS) and to corresponding motor commandsproduced by the cerebellum. The STS–PMd–M1 intercon-nection is a simplified version of the mirror neuron modeldescribed in Section 6.1.
Each submodule of the model is implemented at aconnectionist level. In the spinal cord module, we useEq. (1) to model each neuron unit as a leaky integrator,whereas in the M1, PMd and cerebellum modules, wefollow the DRAMA neural architecture (see Billard &Hayes, 1999 for a complete description). This differs fromthe Hopfield network in several ways, especially in itsdifferent topology, training and retrieval rules. Each connec-tion of the network is associated not only with a weight (asusual) but also time parameter. Both are updated duringlearning. The time parameters represent the decay of neuralactivity along the synapses, while the weights keep amemory of the frequency of neural activation (weights areincreased following classical Hebbian rules, i.e. whenevertwo neurons are simultaneously co-activated). The DRAMAnetwork provides a general ability for learning complextime series by recording explicitly the temporal and spatialaspect of the patterns in its two different sets of connectionparameters.
5.3. Synthetic fMRI for grasping and finger tapping
We present here two synthetic fMRI experiments onimitation of grasping and finger tapping movements. The
M.A. Arbib et al. / Neural Networks 13 (2000) 975–997 989

second experiment was meant to reproduce the fMRIexperiment described in Section 5.1 on human imitationof an index finger tapping task. We use a pair of demonstra-tor and imitator avatars. In the grasping experiment, thedemonstrator avatar moves its right arm from rest position(alongside its body) to reaching a horizontal and frontalposition with all fingers closed in a strong grasp. The fingertapping experiments consists of having the demonstratorlifting upwards four times its index finger. This experimentsstarts with the avatar’s right arm lifted in the horizontal,frontal position, all fingers relaxed.
During each demonstration, the imitator avatar processes,in the STS module, the simulated Cartesian coordinates ofthe demonstrator’s limbs and learns the demonstratedmotion by processing the information upwards to the PMdand cerebellum modules. Once the demonstration isfinished, the imitator avatar is allowed to reproduce thesequence of movements by reactivating the node in thecerebellum which had first been activated during the demon-stration. This automatically leads to sequential reactivationof the other relevant nodes in the Cerebellum and PMdmodules. The PMd activity projects downwards to M1and spinal cord to activate the imitator’s muscles. Fig. 9shows the activity in cerebellum and PMd modules duringobservation and imitation.
Computing synthetic fMRI as with our equation forSynthetic PET (Eqs. (2) and (3)) we calculated the rawfMRI activity (fMRI A) of the cerebellum, PMd, M1 andSTS modules during observation and imitation tasks.Table 1 shows the raw values for cerebellum and PMd forthe two experiments. Data on synthetic grasping are predic-tive, and could be compared to future fMRI experiments. Inthe following, we compare synthetic data on finger tappingto the fMRI experiment described in the previous section.
Fig. 10 shows the ratio of activity of the four regions forreal and synthetic fMRI data during the finger tapping task.The error bars on the real fMRI data are the standard devia-tion calculated across the 12 subjects and the four trials (persubject). In both our model and the real data, M1 has thebiggest activity. The ratio of activity across the four regionsin our model is comprised within the error margin (or closeto it, as it is the case for STS). This qualitative similarity ofthe model to the data is obtained by adjusting the number ofconnections across modules and the encoding (the numberof nodes active) in each module.
Fig. 10 shows the comparative fMRI activity of the cere-bellum and PMd modules (those are the only modules acti-vated during both tasks) for imitation against observationtasks in the finger tapping experiment. This is compared tothe real fMRI activity of the same regions as measured byIacoboni et al. (1999). The reason why the ratio in simula-tion is not equal to one, even though the same nodes incerebellum and PMd are activated in both tasks, is due tothe fact that each node stays at the maximum of activityslightly longer in the retrieving/imitation task than duringthe observation. This is an artifact due to the neural activa-tion function in the DRAMA architecture which allows for
M.A. Arbib et al. / Neural Networks 13 (2000) 975–997990
Fig. 9. Neural activity in cerebellum and PMd modules during observation and imitation.
Table 1Raw data of synthetic fMRI for imitation of grasping and finger tapping
Grasp Finger tapping
Cerebellum 0.75 0.64PMd 0.77 0.75

an imprecision in the timing of the retrieval of the neuralactivation (Billard & Hayes, 1999). This effect can beobserved in Fig. 11, where one sees that the neural activityin cerebellum and PMd during imitation follows a smallplateau at the maximum of activity before decaying,which it does not do during observation. This artifact ismeant to compensate for random noise in the visual input
during learning. In short, our model assumes an equal (plusa random error) activity between observation and imitationin cerebellum and PMd modules.
The synthetic activity returned consistently lower ratiosthan the fMRI data. This may be due to two factors. First, aswe noted in Section 2.2, BOLD fMRI is probably affectedby both blood flow and blood volume changes (Hess et al.,
M.A. Arbib et al. / Neural Networks 13 (2000) 975–997 991
Fig. 10. Ratio of synthetic and real fMRI activity in cerebellum, PMd, and STS against that of M1.
Fig. 11. Ratio of synthetic and real fMRI activity in cerebellum and PMd, observation against imitation task.

2000). The model does not explicitly account for bloodvolume effects, given that these effects are not closelylinked to neural activity. Second, empirical data on MTneurons have suggested that the neuronal population activ-ity may be mainly driven by low firing rate neurons theactivity of which is unaffected by the task or the stimulus(Scannell & Young, 1999). Thus, task-related changes inneural activity may result in small changes in the overallneuronal population activity, determining smaller changesin BOLD signal, compared to expected values based ontheoretical considerations or single-unit data. Both factorsmay conjointly contribute to higher ratios for fMRI datathan for synthetic data. The point is not to claim that wehave achieved the final model of imitation, but rather tohighlight the importance of being able to use multiplesources of data in validating a model, and the utility ofSynthetic fMRI in bringing human brain imaging to bearin developing a model of “the supporting neural networks”.Section 6 discusses further issues in developing the researchprogram exemplified in the present article.
6. The many facets of global modeling
6.1. Modeling the mirror system
As is clear from Fig. 6, brain imaging implicates a largenumber of brain regions in even apparently simple tasks,and we have discussed only a few of the regions in Fig. 6explicitly in this article. In view of this, we quickly reviewseveral studies from the Arbiblaboratory (of course the workof many other laboratories could have been marshaled to
make the same point) to indicate the immense challenges inintegrating models of different portions of the nervoussystem which address detailed neurophysiological datafrom studies of primates and other species. Such studiesare necessary to complement the high-level views ofhuman regional brain activity provided by PET and fMRIstudies. We focus on modeling of the Mirror System, thennote (verybriefly) the challenges of modeling other systemsrelevant to brain activity during imitation, such as the role ofbasal ganglia in sequential behavior, and the role of cere-bellum in the coordination of reach and grasp.
To complement the model of Section 5.2, we offer a high-level view of a model (Oztop, Rizzolatti, & Arbib, 2000) ofthe function and development of the mirror system in termsof interacting schemas which should be equally applicableto studies of human and monkey. The schemas to the left ofFig. 12 implement the visual system of the model. TheHandshape recognitionschema recognizes the hand shape (e.g.precision grasp) whereas theHand motion detectionschemalocates the hand moving in space and sends related informa-tion to theHand–Object spatial relation analysisschemawhich also receives object-related signals from theObjectfeaturesschema. TheHand–Object spatial relation analy-sis schema is needed because, in order to elicit mirrorneuron activity in the monkey, seeing the agent and objectis necessary but not sufficient — a hand mimicking a match-ing grasp would fail to elicit mirror neuron activity unlessthe hand’s trajectory were taking it toward an object with agrasp that matches one of the affordances of the object. Theoutput of this visual analysis is relayed to theObject affor-dance–hand state associationschema. This, together withthe Action recognition(mirror neurons) schema forms the
M.A. Arbib et al. / Neural Networks 13 (2000) 975–997992
Fig. 12. Schemas of the mirror neuron model with brain regions assigned. The three regions with shared background at right are incorporated from the FARSmodel (Oztop et al., 2000).

core mirror (learning) circuit, marked by the gray slantedrectangle in Fig. 12, which mediates the development ofmirror neurons. Note that theassociationschema is alsothe target of theHand shape recognitionschema as wellas theobject affordancesignals supplied by the AIP moduleof the FARS model. In this way, the association schemahas access to complete (visually observed)hand stateinformation.
Details of the implementation of these schemas arebeyond the scope of this article. Instead, we offer somepreliminary suggestions (also shown in Fig. 12) on theneural localization of the various schemas.
Object Recognitionschema: We follow the usual assump-tion that this is localized in inferotemporal cortex (IT).
Object features schema: Sakata, Taira, Kusunoki,Murata, and Tanaka (1997) and Sakata, Taira, Murataet al. (1997) discovered binocular visual neurons in thelateral bank of the caudal intraparietal sulcus (cIPS), andthe neighboring area V3a. These neurons respond preferen-tially to a bar, plate or solid object in a particular orientationin space. They also found neurons selective for a particularaxis of the objects (AOS neurons) and for particular orienta-tion of the surfaces (SOS, surface orientation selectiveneurons). Such 3D features of the objects are certainlyrelevant to a grasp affordance (e.g. axis of object determinesthe wrist angle of the hand). We thus localize theObjectfeaturesschema in cIPS.
Object affordance extractionschema: Following theFARS assumption, we localize this in AIP.
Motor program and Action recognitionschemas: The F5neurons of the FARSMotor program(Grasp) schema arethe “canonical” (non-mirror) neurons; while the newActionrecognitionschema includes the F5 mirror neurons. F4 isimplicated as coding the target position in the FARS modeland we relate this to theMotor program(Reach) schema,though we do not yet include this schema in our simulations.For completeness reasons we included not only area F4, butcIPS and IT as well (cIPS replaces PIP in the FARS model,where it was hypothesized that PIP codes object featuresupon which AIP can extract affordances, whereas ITcodes the identity of the object being recognized).
Object Location schema: We distribute this betweenareas MIP, LIP and VIP. These areas (see Colby & Gold-berg, 1999 for a review) triple encode the space around theanimal. Although it is hard to assign a single type of encod-ing to each of these regions a rough separation is possible.VIP is more concentrated on encoding the ultra-near space(less than 5 cm from the face); neurons in MIP are specia-lized for responding to stimuli within reaching distance; andLIP represents the further space that we explore best withour eyes rather than our hands.
TheHand shape recognitionandHand motion detectionschemas: We propose that STS implements both schemas.Perrett, Harries, Benson, Chitty, and Mistlin (1990) andPerrett, Mistlin, Harries, and Chitty (1990) report neuronsin STS responsive to goal directed hand motion. Some of the
STS area cells show responses to goal directed hand motionin a translation/scale/rotation invariant way. Andersen,Asanuma, Essick, and Siegel (1990) show that motionprocessing input originating from middle temporal area(MT) is channeled via medial superior temporal area(MST) or LIP. MT projects to MST and to other areas inthe parietal cortex concerned with visuospatial function.Visual input from V1 is further elaborated in MT, wherethe firing pattern of neurons reflects the speed and directionof motion of visual targets. Barnes and Pandya (1992) reportthat area 7a (PG-Opt) is reciprocally connected to STS andsuggests that the visuospatial analysis that is associated withposterior intraparietal lobule (which includes 7a) could beamplified in the multimodal regions of STS (TPO and Pga).Therefore, the neurons of multimodal areas of the STS couldbe envisioned as being concerned with analyzing the posi-tion of the organism in relation to the environment (Barnes& Pandya, 1992).
Object affordance–hand state associationschema: Welocalize this in area 7b because recent findings on the exis-tence of mirror and mirror-like neurons in area 7b andconnection of this area with the mirror neuron region ofarea F5 (Fogassi et al., 1998) indicates an intimate relationbetween 7b and F5 mirror neurons. Anecdotal notes(Fogassi, personal communication, 1999) indicate thatthere exist 7b mirror-like neurons, which fire for simplearm/hand actions. We propose that PF mirror-like neuronsform the building blocks of F5 mirror neurons. The similar-ity of STS and 7b responses to active hands, combined withthe connectivity pattern of STS and area 7 makes the STS-7b circuit suggested in Fig. 12 a plausible approximation tothe primate hand shape-motion recognition circuit.
Hand–Object spatial relation analysisschema: The kindof computation we are pursuing may be implemented bymultiple regions but, as a speculation, one can propose 7aas a possible area involved in this computation. Area 7a iscertainly involved in some sort of spatial coding. Stein(1991) suggests that 7a represent extra-personal space.Siegel and Read (1997) show 7a neuron involvement inthe analysis of motion evoked during locomotion or bythemanipulation of objects by the hands. Andersen, Shenoy,Snyder, Bradley, and Crowell (1999) suggests that 7a repre-sent targets in aworld-centeredcoordinate frame. FinallyMaunsell (1995) suggests an object location coding in 7a,which is capable of coding the location of objects evenwithout visual stimuli ever falling into the receptive fieldsof some 7a neurons.
For details the core circuit and details of the learningmechanisms, and especially on the role of the hand statein linking observation of own-hand to other’s hand, seeOztop et al. (2000). Our point here is to emphasize howmany brain regions must be considered, and to sample thewealth of data which must be taken into account to groundthe neural networks which ground a model of the globalbrain function involved in mirror activity and imitation,complementing the high-level model of Section 5.2.
M.A. Arbib et al. / Neural Networks 13 (2000) 975–997 993

However, even a model including all the brain regions asshown in Fig. 12 will be inadequate for at least two reasons:
1. As noted in Section 1.4, high-level schemas may contri-bute to the motor schemas for many specific actions. It isthus dangerous to say that specific neurons “encode” anaction when in fact it may take correlated activity inneurons in a variety of brain regions to “commit” thebrain to the specific action. Similarly, Fig. 12 is toorigid in assigning schemas to specific regions. However,modeling must start somewhere, and Fig. 12 provides agood starting point for the development of more distrib-uted models.
2. Brain imaging shows activation of areas not included inFig. 12, such as the basal ganglia (which were included inthe FARS model) and cerebellum (which was not). Wethus close this section by briefly citing our modelingefforts on basal ganglia and cerebellum.
We have argued that the basal ganglia may be involved inassisting cortical planning centers in some fashion as well asproviding sequencing information, and have thus developed(Bischoff-Grethe, Crowley, & Arbib, 2000) a model whichincludes the control of arm movements as well as saccades,with a recent focus on control of sequences of skeletomotoractions (Bischoff, 1998; Bischoff-Grethe & Arbib, 2000).We postulate that the basal ganglia’s direct and indirectpathways perform two different roles: the indirect pathwayinhibits upcoming motor commands from being performedwhile the current movement is in progress, while the directpathway projects the next sensory state back to cortex. Thisinforms supplementary motor area region SMA-proper andmotor cortex of the expected next state and allows theseregions to switch to the next movement of the sequence.
Our models of cerebellar involvement in motor controlhypothesize that where basal ganglia is involved in the phas-ing in and out of various actions, cerebellum is concernedwith the tuning and coordination of movements. In ourview, the cerebellum does not act directly on the muscles,but rather acts through Motor Pattern Generators (MPGs)— circuits which combine, e.g. trajectory or rhythmiccontrol with local feedback circuitry. We view the cerebel-lum as divided intomicrocomplexes. Each microcomplex isa general computational module which combines a patch ofcerebellar cortex (Purkinje cells and Golgi cell) with theunderlying set of cells in the cerebellar nucleus to whichthe Purkinje cells project, and the inferior olive cells whoseclimbing fibers provide error signals for motor learning. The“contextual input” is provided by the parallel fibers, thegranule cell axons which provide a nonlinear combinationof mossy fiber inputs. The job of the Purkinje cells is to learnto pair the parallel fiber output with a pattern of inhibition ofthe nuclear cells so as to ensure that these cells better tunethe MPGs. The parallel fibers are long enough that —through their shared contextual input — Purkinje cellsmay learn not only to tune individual MPGs to changing
circumstances, but also to coordinate multiple MPGs (suchas those for reaching and grasping) so that a complex move-ment may be achieved in a smooth and integrated way. Inshort, we donot hypothesize that the cerebellar microcom-plex learns toreplacethe MPG. Rather, we view the cere-bellum as applying its compensations by modulating MPGs,whether cortical or subcortical, and this compensationoccurs on multiple time scales. Further, the compensationpatterns can be stored and recalled based on higher leveltask information.
A cerebellar model must be tested and developed inconjunction not only with an MPG model but also with a“plant model” which contains sufficient complexity to“challenge” the cerebellum model. Schweighofer, Spoel-stra, Arbib, and Kawato (1998) and Spoelstra, Arbib, andSchweighofer (2000) showed how the cerebellum maycompensate for Coriolis forces and other joint interactionsin allowing coordinated control of multiple joints in reach-ing. In the context of the models of reaching and grasping,and of mirror neurons and imitation described above, theproblem is to understand how to extend cerebellar modelingfor reaching — and we have shown none of the details here— to encompass not only the coordination of reach andgrasp in well-learned movements but also to understandhow the cerebellum serves to ensure the graceful coordina-tion of arm and hand and body “on the fly” when we carryout a novel behavior, whether in imitation of an observedbehavior or in reacting appropriately to novel circum-stances.
This quick tour indicates the immense challenges we willhave to face in integrating diverse models of differentportions of the nervous system if Synthetic Brain Imagingis to reach its full potential in linking models based ondetailed neurophysiology to the high-level views of humanregional brain activity provided by PET and fMRI studies.
6.2. Homologies, brain imaging and neural networks
The fundamental benefit of Synthetic Brain Imaging isthat it allows for specific predictions of PET or fMRI activ-ity in human brain imaging studies, based on neural networkmodels of behavior constrained by animal neurophysiologyand arguments from homology. Since the models them-selves are a product of functional anatomy, measuredsingle-unit recordings, and behavioral measurements,Synthetic Brain Imaging provides a powerful bridgebetween all of these approaches. An additional strength ofthe Synthetic PET implementation is that the contribution ofexcitatory and inhibitory influences can be teased apart.Becausesynaptic activityis not the same asneural activity,being able to distinguish excitatory from inhibitory influ-ences can be an aid to inferring neural activity from therCBF measure, possibly clarifying apparent contradictionsin rCBF data.
In Section 2.2 we suggested that quantitative differencesbetween integrated synaptic activity and neuronal firing are
M.A. Arbib et al. / Neural Networks 13 (2000) 975–997994

often negligible. However, there are as yet no models whichadequately link neural activity to the BOLD signal, and sothe differences between fMRI and PET methods, which wehave minimized in the present study, deserve much futurestudy. In particular, we need to develop the “vampiremodel” of the neuron to relate synaptic and neuronal activityand the metabolic costs of synaptic change to rCBF.
Synthetic Brain Imaging is sufficiently flexible that it willbe possible to have network implementations spanningmultiple species. Homologies and differences betweenspecies (cf. Bota & Arbib, 2000) can then be tested morerigorously using predictions generated by the SyntheticBrain Imaging, while the human data provide anotherform of validation of neural network models derived frommonkey data. It is certainly satisfying when the humanresults provide confirmation of the behavior of a model ofdiverse interacting biological neural networks, but far moreis learned when there is a mismatch between model predic-tion and human results. The challenge is then to use thesenegative results to further refine and constrain the modeland, on this basis, design new experiments for both primateneurophysiology and human brain imaging. The resultingdata can then catalyze the development of new globalmodels which synthesize our evolving understanding ofthe human brain in relation to the details we glean from theanatomy and neurophysiology of the brains of other species.
6.3. Language and “higher cognitive functions”
In “Language Within Our Grasp”, Rizzolatti and Arbib(1998) showed that the mirror system in monkey is thehomologue of Broca’s area, a crucial speech area in humans,and argued that this observation provides a neurobiological“missing link” for the long-argued hypothesis that primitiveforms of communication based on manual gesture precededspeech in the evolution of language. Their “Mirror SystemHypothesis” states that the matching of neural code forexecution and observation of hand movements in themonkey is present in the common ancestor of monkey andhuman, and is the precursor of the crucial language propertyof parity, namely that an utterance usually carries similarmeaning for speaker and hearer (or signer and perceiver,etc.). Arbib (2000) refines this hypothesis by suggestingthat imitation plays a crucial role in human language acqui-sition and performance, and that brain mechanisms support-ing imitation were crucial to the emergence ofHomo sapiens.
As already argued, imitation in general requires the abil-ity to break down a complex performance into a coordinatedcontrol program of schemas which approximate the piecesof the performance to be imitated. This then provides theframework in which attention can be shifted to specificcomponents which can then be tuned and/or fractionatedappropriately, or better coordinated with other componentsof the skill. This process is recursive, yielding both themastery of ever finer details, and the increasing grace andaccuracy of the overall performance. Arbib (2000) argues
that what marks humans as distinct from their commonancestors with chimpanzees is that whereas the chimpanzeecan imitate short novel sequences through repeated expo-sure, humans can acquire (longer) novel sequences in asingle trial if the sequences are not too long and the compo-nents are relatively familiar. The very structure of thesesequences can serve as the basis for immediate imitationor for the immediate construction of an appropriateresponse, as well as contributing to the longer-term enrich-ment of behavior. Of course, as sequences get longer, or thecomponents become less familiar, more and more practice isrequired to fully comprehend or imitate the behavior. Arbib(2000) then analyzes seven hypothesized stages of evolu-tion: grasping; a mirror system for grasping; a simple imita-tion system for grasping; a complex imitation system forgrasping; a manual-based communication system; proto-speech, characterized as being the open-ended productionand perception of sequences of vocal gestures, withoutimplying that these sequences constitute a language; and,finally, with cultural evolution predominating over biologi-cal evolution, speech and languages as we currently knowthem. At each stage, the earlier capabilities are preserved.Moreover, the addition of a new stage may involve enhance-ment of the repertoire for the primordial behaviors on whichit is based.
Development of the full argument would take us beyondthe scope of this paper. The point to be emphasized here isthat our future work on applying Synthetic Brain Imaging toglobal brain function can even address areas of cognitivescience for which no animal data are available if we employcomparative neuroscience and evolutionary arguments torelate brain regions for “higher cognitive functions” tohomologous brain regions in other species.
Acknowledgements
This work was supported in part by a Program Project(P20) grant from the Human Brain Project (P01MH52194),and in part by a Human Frontier Science Program grant toIacoboni and Arbib. We thank Giacomo Rizzolatti for hiscontribution to the research program described here. Writ-ing of the paper was also supported in part by an ARC-IREXgrant for the study of “Hand Movement Recognition andLanguage: Assistive Technologies and Neural Mechan-isms” while Arbibwas a Visiting Professor in the ComputerScience Department at the University of Western Australia,and by a personal fellowship from the Swiss NationalScience Foundation to Aude Billard.
References
Andersen, R. A., Asanuma, C., Essick, G., & Siegel, R. M. (1990). Corti-cocortical connections of anatomically and physiologically definedsubdivisions within the inferior parietal lobule.Journal of ComparativeNeurology, 296, 65–113.
M.A. Arbib et al. / Neural Networks 13 (2000) 975–997 995

Andersen, R. A., Lawrence, H. S., Bradley, D. C., & Xing, J. (1997). Multi-modal representation of space in the posterior parietal cortex and its usein planning movements.Annual Review of Neuroscience, 20, 303–330.
Andersen, R. A., Shenoy, K. V., Snyder, L. H., Bradley, D. C., & Crowell,J. A. (1999). The contributions of vestibular signals to the representa-tions of space in the posterior parietal cortex.Annals of the New YorkAcademy of Sciences, 871, 282–292.
Arbib, M. A. (1981). Perceptual structures and distributed motor control. InV. B. Brooks,Handbook of physiology, Section 2: the nervous system,vol. II, Motor control, Part 1(pp. 1449–1480). American PhysiologicalSociety.
Arbib, M. A. (2000). The mirror system, imitation, and the evolution oflanguage. In C. Nehaniv & K. Dautenhahn,Imitation in animals andartifacts. Cambridge, MA: MIT Press (in press).
Arbib, M. A., Bischoff, A., Fagg, A., & Grafton, S. (1995). Synthetic PET:analyzing large-scale properties of neural networks.Human BrainMapping, 2, 225–233.
Arbib, M. A., Conklin, E. J., & Hill, J. C. (1987).From schema theory tolanguage. Oxford: Oxford University Press.
Arbib, M.A., Fagg, A.H., & Grafton, S.T. (2000). Synthetic PET imagingfor grasping: from primate neurophysiology to human behavior.Submitted for publication.
Arbib, M., & Rizzolatti, G. (1997). Neural expectations: a possible evolu-tionary path from manual skills to language.Communication andCognition, 29, 393–424.
Barnes, C. L., & Pandya, D. N. (1992). Efferent cortical connections ofmultimodal cortex of the superior temporal sulcus in the Rhesus-monkey.Journal of Comparative Neurology, 318 (2), 222–244.
Bekkering, H., Wohlschlager, A., & Gattis, M. (2000). Imitation of gesturesin children is goal-directed.Quarterly Journal of ExperimentalPsychology, Section A: Human Experimental Psychology, 53, 153–164.
Billard, A. (2000). Learning motor skills by imitation: a biologicallyinspired robotic model.Cybernetics and Systems Journal[SpecialIssue on Imitation in Animals and Artifacts, in press].
Billard, A., & Hayes, G. (1999). Drama, a connectionist architecture forcontrol and learning in autonomous robots.Adaptive Behavior, 7, 35–64.
Bischoff, A. (1998).Modeling the basal ganglia in the control of armmovements. PhD thesis, Department of Computer Science, Universityof Southern California.
Bischoff-Grethe, A., & Arbib, M.A. (2000). Sequential movements: acomputational model of the roles of the basal ganglia and the supple-mentary motor area. In preparation.
Bischoff-Grethe, A., Crowley, M.G., & Arbib, M.A. (2000). Movementinhibition and next sensory state prediction in the basal ganglia.IBAGS Proceedings, Chapter 23.
Bota, M., & Arbib, M. A. (2000). The neurohomology database. In M. A.Arbib & J. Grethe,Computing the brain: a guide to neuroinformatics-San Diego: Academic Press (in press).
Brownell, G. L., Budinger, T. F., Lauterbur, P. C., & McGeer, P. L. (1982).Positron tomography and nuclear magnetic resonance imaging.Science,215, 619–626.
Colby, C. L., & Goldberg, M. E. (1999). Space and attention in parietalcortex.Annual Review of Neuroscience, 22, 319–349.
Dominey, P. F., & Arbib, M. A. (1992). A cortico-subcortical model forgeneration of spatially accurate sequential saccades.Cerebral Cortex,2, 153–175.
Douglas, R. J., Koch, C., Mahowald, M., Martin, K. A. C., & Suarez, H. H.(1995). Recurrent excitation in neocortical circuits.Science, 269, 981–985.
Fagg, A., & Arbib, M. A. (1992). A model of primate visual-motor condi-tional learning.Journal of Adaptive Behavior, 1 (1), 3–37.
Fagg, A. H., & Arbib, M. A. (1998). Modeling parietal–premotor inter-actions in primate control of grasping.Neural Networks, 11 (7–8),1277–1303.
Fogassi, L., Gallese, V., Fadiga, L., & Rizzolatti, G. (1998). Neuronsresponding to the sight of goal-directed hand/arm actions in the parietal
area PF (7b) of the macaque monkey.28th Annual Meeting of Societyfor Neuroscience.
Fox, P. T., & Raichle, M. E. (1985). Stimulus rate determines regional brainflow in striate cortex.Annals of Neurology, 17, 303–305.
Gallese, V., Fadiga, L., Fogassi, L., & Rizzolatti, G. (1996). Action recog-nition in the premotor cortex.Brain, 119, 592–609.
Grafton, S. T., Arbib, M. A., Fadiga, L., & Rizzolatti, G. (1996). Localiza-tion of grasp representations in humans by PET: 2. Observationcompared with imagination.Experimental Brain Research, 112, 103–111.
Grafton, S. T., Fagg, A. H., Woods, R. P., & Arbib, M. A. (1996). Func-tional anatomy of pointing and grasping in humans.Cerebral Cortex, 6(2), 226–237.
Grafton, S. T., Fagg, A. H., & Arbib, M. A. (1998). Dorsal premotor cortexand conditional movement selection: a PET functional mapping study.Journal of Neurophysiology, 79, 1092–1097.
Head, H. (1920). Aphasia and kindred disorders of speech.Brain, 43, 87–165.
Hess, A., Stiller, D., Kaulisch, T., Heil, P., & Scheich, H. (2000). Newinsights into the hemodynamic blood oxygenation level-dependentresponse through combination of functional magnetic resonanceimaging and optical recording in gerbil barrel cortex.Journal ofNeuroscience, 20, 3328–3338.
Horwitz, B., & Sporns, O. (1994). Neural modeling and functional neuroi-maging.Human Brain Mapping, 1, 269–283.
Horwitz, B., Tagamets, M. -A., & McIntosh, A. R. (1999). Neural model-ing, functional brain imaging, and cognition.Trends in CognitionScience, 3, 91–98.
Iacoboni, M., Woods, R. P., Brass, M., Bekkering, H., Mazziotta, J. C., &Rizzolatti, G. (1999). Cortical mechanisms of human imitation.Science, 286, 2526–2528.
Ijspeert, A. J., Hallam, J., & Willshaw, D. (1999). Evolving swimmingcontrollers for a simulated lamprey with inspiration from neurobiology.Adaptive Behavior, 7, 151–172.
Jordan, M. I., & Rumelhart, D. E. (1992). Forward models: supervisedlearning with a distal teacher.Cognitive Science, 16, 307–354.
Jueptner, M., & Weiller, C. (1995). Review: does measurement of regionalcerebral blood flow reflect synaptic activity? — Implications for PETand fMRI. NeuroImage, 2, 148–156.
Kadekaro, M., Vance, W. H., Terrell, M. L., Gary, H., Eisenberg, H. M., &Sokoloff, L. (1987). Effects of antidromic stimulation of the ventral rooton glucose utilization in the ventral horn of the spinal cord in the rat.Proceedings of the National Academy of Sciences of the United States ofAmerica, 84, 5492–5495.
Kertzman, C., Schwarz, U., Zeffiro, T. A., & Hallett, M. (1997). The role ofposterior parietal cortex in visually guided reaching movements inhumans.Experimental Brain Research, 114, 170–183.
Lacquaniti, F., & Soechting, J. F. (1986). Simulation studies on the controlof posture and movement in a multi-jointed limb.Biological Cyber-netics, 54, 367–378.
Maunsell, J. H. R. (1995). The brain’s visual world — representation ofvisual targets in cerebral-cortex.Science, 270 (5237), 764–769.
McIntosh, A. R., & Gonzalez-Lima, F. (1994). Structural equation model-ing and its application in functional brain imaging.Human BrainMapping, 2, 2–22.
Meltzoff, A. N., & Moore, M. K. (1977). Imitation of facial and manualgestures by human neonates.Science, 198, 74–78.
Mitz, A. R., Godshalk, M., & Wise, S. P. (1991). Learning-dependentneuronal activity in the premotor cortex.Journal of Neuroscience, 11(6), 1855–1872.
Oztop, E., Rizzolatti, G., & Arbib, M.A. (2000). Mirror neuron system forgrasping: a computational model. Submitted for publication.
Paus, T. (1999). Imaging the brain before, during, and after transcranialmagnetic stimulation.Neuropsychologia, 37 (2), 219–224.
Perrett, D. I., Harries, M.H., Benson, P.J., Chitty, A. J., & Mistlin, A. J. (1990).Retrieval of structure from rigid and biological motion: an analysis of the
M.A. Arbib et al. / Neural Networks 13 (2000) 975–997996

visual responses of neurons in the macaque temporal cortex. In A. Blake &T. Troscianko,AI and the eye(pp. 181–199). New York: Wiley.
Perrett, D. I., Mistlin, A. J., Harries, M. H., & Chitty, A. J. (1990). Under-standing the visual appearance and consequence of hand actions. In M.A. Goodale,Vision and action: the control of grasping(pp. 163–180).Norwood, NJ: Ablex.
Perrett, D. I., Harries, M., Mistlin, A. J., & Chitty, A. J. (1989). Three stagesin the classification of body movements by visual neurons. In H. B.Barlow, et al.,Images and understanding(pp. 94–107). Cambridge:Cambridge University Press.
Perrett, D. I., Harries, M., Bevan, R., Thomas, S., Benson, P. J., Mistlin, A.J., Chitty, A. J., Hietanene, J. K., & Ortega, J. E. (1989). Frameworks ofanalysis for the neural representation of animate objects and actions.Journal of Experimental Biology, 146, 87–113.
Raichle, M. E. (1998). Behind the scenes of functional brain imaging: ahistorical and physiological perspective.Proceedings of the NationalAcademy of Sciences of the United States of America, 95 (3), 765–772.
Rees, G., Friston, K., & Koch, K. (2000). A direct quantitative relationshipbetween the functional properties of human and macaque V5.NatureNeuroscience, 3, 716–723.
Rizzolatti, G., & Arbib, M. (1998). Language within our grasp.Trends inNeuroscience, 21, 188–194.
Rizzolatti, G., Camarda, R., Fogassi, L., Gentilucci, M., Luppino, G., &Matelli, M. (1988). Functional organization of inferior area 6 in theMacaque monkey II. Area F5 and the control of distal movements.Experimental Brain Research, 71, 491–507.
Rizzolatti, G., Fadiga, L., Gallese, V., & Fogassi, L. (1996). Premotorcortex and the recognition of motor actions.Cognitive Brain Research,3 (2), 131–141.
Ro, T., Cheifet, S., Ingle, H., Shoup, R., & Rafal, R. (1999). Localization ofthe human frontal eye fields and motor hand area with transcranialmagnetic stimulation and magnetic resonance imaging.Neuropsycho-logia, 37 (2), 225–231.
Sakata, H., Taira, M., Kusunoki, M., Murata, A., & Tanaka, Y. (1997). Theparietal association cortex in depth perception and visual control ofaction.Trends in Neuroscience, 20, 350–357.
Sakata, H., Taira, M., Murata, A., Gallese, V., Tanaka, Y., Shikata, E., &Kusunoki, M. (1997). In P. Their & H. O. Karnath,Parietal visualneurons coding three-dimensional characteristics of objects and theirrelation to hand action, parietal lobe contributions to orientation in 3Dspace.Heidelberg: Springer.
Scannell, J. W., & Young, M. P. (1999). Neuronal population activity andfunctional imaging.Proceedings of the Royal Society of London B:Biological Sciences, 266, 875–881.
Schweighofer, N., Spoelstra, J., Arbib, M. A., & Kawato, M. (1998). Roleof the cerebellum in reaching quickly and accurately: II. A detailedmodel of the intermediate cerebellum.European Journal ofNeuroscience, 10, 95–105.
Siegel, R. M., & Read, H. L. (1997). Analysis of optic flow in the monkeyparietal area 7a.Cerebral Cortex, 7 (4), 327–346.
Spoelstra, J., Arbib, M. A., & Schweighofer, N. (2000). Cerebellar controlof a simulated biomimetic manipulator for fast movements.BiologicalCybernetics(in press).
Stein, J. F. (1991). Space and the parietal association areas. In J. Paillard,Brain and space. Oxford: Oxford University Press (Chapter 11).
Stein, P. S. G., Grillner, S., Selverston, A. I., & Stuart, D. G. (1997).Neurons, networks and motor behavior, A Bradford Book. Cambridge,MA: MIT Press.
Tagamets, M. A., & Horwitz, B. (1998). Integrating electrophysiologicaland anatomical data to create a large-scale model that simulates adelayed match-to-sample human brain imaging study.Cerebral Cortex,8, 310–320.
Taira, M., Mine, S., Georgopoulos, A. P., Murata, A., & Sakata, H. (1990).Parietal cortex neurons of the monkey related to the visual guidance ofhand movement.Experimental Brain Research, 83, 29–36.
Taylor, J. G., Krause, B., Shah, N. J., Horwitz, B., & Mueller-Gaertner, H. -W. (2000). On the relation between brain images and brain neuralnetworks.Human Brain Mapping, 9, 165–182.
Vallar, G., Lobel, E., Galati, G., Berthoz, A., Pizzamiglio, L., & Le Bihan,D. (1999). A fronto-parietal system for computing the egocentric spatialframe of references in humans.Experimental Brain Research, 124,281–286.
van Vreeswijk, C., & Sompolinsky, H. (1998). Chaotic balanced state in amodel of cortical circuits.Neural Computations, 10, 1321–1371.
Wolpert, D. M., Ghahramani, Z., & Jordan, M. I. (1995). An internal modelfor sensorimotor integration.Science, 269, 1880–1882.
Yarowsky, P., Kadekaro, M., & Sokoloff, L. (1983). Frequency-dependentactivation of glucose utilization in the superior cervical ganglion byelectrical stimulation of cervical sympathetic trunk.Proceedings ofthe National Academy of Sciences of the United States of America,80, 4179–4183.
M.A. Arbib et al. / Neural Networks 13 (2000) 975–997 997