2005 annual water column monitoring report
TRANSCRIPT
2005 Annual Water Column
Monitoring Report
Massachusetts Water Resources Authority
Environmental Quality Department Report ENQUAD 2006-20

Citation Libby PS, Geyer WR, Keller AA, Mansfield AD, Turner JT, Anderson DM, Borkman D, Rust SW, Hyde K, Oviatt CA. 2006. 2005 Annual Water Column Monitoring Report. Boston: Massachusetts Water Resources Authority. Report ENQUAD 2006-20. 182 p.
2005 Annual Water Column Monitoring Report
Submitted to
Massachusetts Water Resources Authority Environmental Quality Department
100 First Avenue Charleston Navy Yard
Boston, MA 02129 (617) 242-6000
prepared by
Scott Libby1 Rocky Geyer2
Aimee Keller3 Alex Mansfield1
Jeff Turner4 Donald M. Anderson2
David Borkman4 Steve Rust5 Kim Hyde3
Candace Oviatt3
1Battelle 397 Washington Street Duxbury, MA 02332
2Woods Hole Oceanographic Institute
Woods Hole, MA 02543
3University of Rhode Island Narragansett, RI 02882
4University of Massachusetts Dartmouth
North Dartmouth, MA 02747
5Battelle Columbus, OH 43201
November 2006
Report No. 2006-20
2005 Annual Water Column Monitoring Report November 2006
i
EXECUTIVE SUMMARY
The Massachusetts Water Resources Authority (MWRA) has collected ambient water quality data in Massachusetts and Cape Cod Bays since 1992 to assess the environmental effects of the relocation of effluent discharge from Boston Harbor to Massachusetts Bay. Data from 1992 through September 5, 2000 established baseline water quality conditions and a means to detect significant departure from the baseline after the bay outfall became operational. The surveys are designed to evaluate water quality on both a high-frequency basis for a limited area in the vicinity of the outfall site and a low-frequency basis over an extended area throughout Boston Harbor, Massachusetts Bay, and Cape Cod Bay. The 2005 data represent the fifth full year of conditions since initiation of discharge from the bay outfall. This annual report evaluates the 2005 water column monitoring results, assesses spatial and temporal patterns in the data, compares 2005 data against seasonal and annual water quality thresholds, and examines responses in the nearfield to the transfer of effluent discharge from the Boston Harbor outfall to the bay outfall. Water quality conditions in the bays are evaluated in the context of questions posed in the Ambient Monitoring Plan (MWRA 1991). Over the course of the ambient monitoring program, a general sequence of water quality events has emerged from the data collected in Massachusetts and Cape Cod Bays. The patterns are evident even though the timing and year-to-year manifestations of these events are variable. In general, but not always, a winter/spring phytoplankton bloom occurs as light becomes more available, temperature increases, and nutrients are readily available. Later in the spring, the water column transitions from well mixed to stratified conditions. This serves to cut off the supply of nutrients to the surface waters and to terminate the spring bloom. The summer is generally a period of strong stratification, depleted surface water nutrients, low biomass, and a relatively stable mixed-assemblage phytoplankton community. In the fall, stratification deteriorates and mixing supplies nutrients to surface waters, which often contributes to the development of a fall phytoplankton bloom. Dissolved oxygen (DO) concentrations are lowest in the bottom waters prior to the fall overturn of the water column – usually in October. By late fall or early winter, the water column becomes well mixed and resets to winter conditions. In winter, the combination of wind mixing and low light levels serve to inhibit primary production thus keeping biomass and phytoplankton abundance low until the following year’s winter/spring bloom. This sequence has continued since the bay outfall became operational on September 6, 2000 and was generally evident in 2005. The major features and differences from the baseline in 2005 include:
• 2005 was generally wetter than normal, most notably during the late spring and late fall. Merrimack River flow was the highest it has been for the monitoring program during the April-June period, with three substantial discharge events. The unusually wet conditions in October also caused extreme run-off during that time.
• The high river discharge and accompanying wind events during the spring were the most notable physical attributes in 2005. The occurrence of strong northeaster storms in May produced lower salinities due to high river inputs to the coastal waters, much larger waves than usual for the month of May, deep mixing of the low-salinity waters, and higher near-bottom dissolved oxygen levels than usual.
• These meteorological and physical oceanographic conditions contributed to the occurrence, severity, and duration of the most notable biological event in 2005 – an unprecedented bloom of the toxic dinoflagellate Alexandrium fundyense in Massachusetts and Cape Cod Bays.
2005 Annual Water Column Monitoring Report November 2006
ii
• The 2005 A. fundyense bloom was the largest red tide episode in New England since 1972, and may have been even larger than the less well-documented event that occurred that year. The bloom extended from Maine to south of Martha’s Vineyard, and prompted shellfish closures throughout the entire region. Typical concentrations of A. fundyense in most years are a few tens of cells L-1, but in 2005, many samples had counts of >1,000 cells L-1, with maximum counts in Cape Cod Bay of ~40,000 cells L-1. Levels in the nearfield in 2005 were orders-of-magnitude higher than in previous years and easily exceeded the Contingency Plan threshold of 100 cells L-1.
• Despite the economic impact and attention, the A. fundyense abundances were only a minor portion of the overall phytoplankton assemblage and had little impact on patterns observed in other water quality parameters such as chlorophyll and nutrient concentrations, primary production, and overall phytoplankton abundance. By these measures, 2005 was a fairly typical year.
• A Phaeocystis bloom was observed for the sixth consecutive year. The bloom was observed from February to April with maximum abundances observed in April (up to 4 × 10⁶ cells L-1). These abundances were much lower, however, than those observed in 2004.
• In June, Phaeocystis was observed in a single sample collected from station N18 (mid-depth; ~10,000 cells L-1). The cells in this sample appeared to be degraded and likely the remnants of the April offshore bloom. Regardless, their presence resulted in an exceedance of the summer Phaeocystis threshold of 357 cells L-1. This exceedance was of no ecological significance; the new pattern for annual Phaeocystis blooms with detectable abundances persisting into May and even June appears to be related to cooler water temperatures (Libby et al. 2006b).
• Nutrient patterns generally followed typical seasonal progressions. The main exception was due to the precipitation and wind events in May. The northeaster storms led to increased runoff and water column mixing that increased surface nutrient concentrations from April to May, especially SiO4 concentrations. The availability of nutrients not only supported the A. fundyense bloom, but the SiO4 also allowed for a fairly substantial diatom bloom which dominated the overall phytoplankton abundance in May.
• At the Boston Harbor station F23, productivity in 2005 generally fell well below the baseline mean with no spring bloom but a distinct peak in late summer productivity. At nearfield station N18, areal production for 2005 was less than the long-term average for almost all data points while productivity at station N04 exceeded the baseline mean during both the summer and the fall (near baseline maxima in May and June and exceeding the baseline maximum in September).
• The post-transfer productivity rates in Boston Harbor continue to suggest a pattern more typical of temperate waters with a winter/spring peak, lower summer rates, and a late summer/early fall peak. There has been a nearly significant increase in post-transfer spring production in the harbor compared to baseline, while there has been a statistically significant decrease in summer production and a nearly significant decrease in annual production in the harbor. Overall, the decline in productivity seen at the station does indicate a shift to a less-enriched environment
• In the nearfield, only minor changes in seasonal and annual production have been observed between pre- and post-transfer periods. Mean production values have increased slightly for spring while decreasing somewhat in the summer and fall, but none of these changes is statistically significant.
2005 Annual Water Column Monitoring Report November 2006
iii
• Bottom water dissolved oxygen was relatively high in 2005. This was in part the result of the strong mixing during May and in part because of the upwelling-favorable conditions in August and September. The regression model based on bottom temperature and salinity indicated that high dissolved oxygen should occur, consistent with the observations.
• Since the bay outfall came on line, DO levels in the nearfield and Stellwagen Basin have remained within the baseline range and 2005 was no exception. However, the 2005 bottom water DO minima in the nearfield were among the highest measured over the monitoring program. Minimum survey mean %saturation values in the nearfield and Stellwagen areas were only slightly below 80% (79.4% and 76.5% respectively). The 2005 DO concentration minima were well above caution levels.
• Zooplankton community structure and seasonal relative abundance patterns were similar to previous years. Zooplankton abundance was dominated by copepod nauplii, and adults and copepodites of Oithona similis and Pseudocalanus spp., with subdominant contributions by other copepods and sporadic pulses of meroplankters. Zooplankton abundance increased from winter through spring to summer, and declined through the fall.
• Notably, zooplankton abundance was lower than typically observed over the baseline during much of 2005 and during many of the post-transfer years. The low abundance in spring and summer has been observed over most of Massachusetts Bay and may have been influenced by the occurrence of Phaeocystis blooms that have occurred annually since 2000 or could be related to changes in temperature. The low zooplankton abundances in the fall could conceivably be related to either bottom-up (comparatively minimal fall bloom – reduced food) or top-down controls (continued presence of ctenophores). Process and rate studies would be necessary to elevate such speculation to the status of explanation.
The major water quality event in 2005 was the extensive bloom of Alexandrium fundyense that occurred along the coast of southern New England. This bloom, the largest red tide in New England since 1972, extended from Maine to south of Martha’s Vineyard, and prompted shellfish closures throughout the region. The bloom was exceptional in several ways: high toxin levels were measured farther south than ever before in New England; levels of toxicity in many locations were higher than previously observed at those stations; for some locations, toxicity above quarantine levels (levels high enough to close the shellfish beds) was documented for the first time; and cell concentrations far exceeded those observed in the coastal waters of southern New England in the past. The 2005 Alexandrium bloom and any potential impact on the bloom related to MWRA effluent are the focus of a separate technical report, currently under preparation. The extraordinary 2005 Alexandrium bloom was due to an unusual and unprecedented confluence of factors (Anderson et al. 2005a). Heavy rainfall and snowmelt increased runoff of freshwater into the Gulf of Maine in early spring. This runoff is thought to have enriched the water with macro-and micro-nutrients, stratified the nearshore water column, and in combination with several storms with winds from the northeast that set up downwelling conditions, transported red tide cells from nearshore and offshore waters along the coast of central Maine to the southwest into Massachusetts and Cape Cod Bays, and as far south as Nantucket and Martha’s Vineyard and beyond. Woods Hole Oceanographic Institute surveys during fall 2005 indicate that although the bloom was extraordinarily large, it did not lead to a high number of post-bloom cysts in sediments in Massachusetts and Cape Cod Bays. There were, however, a substantial number of cysts deposited in the sediments of the western Gulf of Maine, which contributed to another extensive A. fundyense bloom in May 2006. Due to different wind conditions from 2005, the 2006 bloom only affected the northern portions of Massachusetts Bay.
2005 Annual Water Column Monitoring Report November 2006
iv
Previously observed changes in the nutrient regimes following diversion are unambiguous – NH4 has dramatically decreased in Boston Harbor (by ~80%) and nearby coastal waters while increasing in the nearfield (by ~50%). The signature levels of NH4 in the plume are confined to an area within ~20 km of the outfall. The higher nearfield NH4 concentrations have not translated directly into changes in biomass, whether measured as chlorophyll, POC, or phytoplankton abundance although there has been a significant increase in winter/spring biomass at some nearfield and nearby stations. In Boston Harbor, the dramatic decrease in NH4 has been concomitant with significant decreases in other nutrients (NO3 and PO4) and chlorophyll and POC and lower production, and results suggest that the seasonal pattern in productivity is changing from a eutrophic to a more normal temperate coastal pattern. In addition to the obvious changes just detailed, statistical intervention analysis indicates that there have been significant changes in key parameter trends post-transfer to the offshore outfall (dissolved inorganic nutrients and biomass). The intervention analysis methodology employed assumes that temporal parameter trends follow a linear model before and after outfall diversion and identifies cases where the linear temporal trend after diversion is significantly different than the trend before diversion. This methodology is a generalization of the t-test methodology which assumes no temporal parameter trends and identifies cases where the average parameter value after diversion is significantly different from the average parameter value before diversion. Although the significant changes in NH4 concentrations in the nearfield can plausibly be ascribed to the relocation of the outfall, the data suggest that this increase occurred on top of regional changes in nutrient concentrations. It is unknown whether the changes in regional nutrient concentrations are due to different loadings to the system (riverine, offshore Gulf of Maine surface or bottom waters, etc.), changes in seasonal biological patterns (i.e. fewer and less intense fall blooms) or related to more circulation shifts related to larger scale processes (e.g. North Atlantic Oscillation). More sophisticated intervention models may need to be employed in the future to take into consideration the serial autocorrelation among parameter concentrations from season to season or the spatial correlation patterns in parameter concentrations from stations that are geographically close to each other.
2005 Annual Water Column Monitoring Report November 2006
v
TABLE OF CONTENTS
1.0 INTRODUCTION............................................................................................................................1-1
2.0 2005 WATER COLUMN MONITORING PROGRAM.................................................................2-1 2.1 Data Sources...........................................................................................................................2-1 2.2 2005 Water Column Monitoring Program Overview.............................................................2-1
3.0 RESULTS AND DISCUSSION ......................................................................................................3-1 3.1 Overview of System Characteristics ......................................................................................3-1 3.2 Synopsis of 2005 Results .......................................................................................................3-2 3.3 Contingency Plan Thresholds.................................................................................................3-4 3.4 2005 Alexandrium fundyense Bloom......................................................................................3-9
3.4.1 Bloom Development and Transport into the Bays ....................................................3-9 3.4.2 Characterization of the 2005 Alexandrium fundyense Bloom.................................3-15 3.4.3 Phytoplankton Community Structure ......................................................................3-22
3.5 Interannual Comparisons......................................................................................................3-26 3.5.1 Nutrients ..................................................................................................................3-26 3.5.2 Phytoplankton Biomass...........................................................................................3-31 3.5.3 Productivity .............................................................................................................3-34 3.5.4 Intervention Analyses..............................................................................................3-37
4.0 CONCLUSIONS..............................................................................................................................4-1
5.0 REFERENCES.................................................................................................................................5-1
FIGURES Figure 2-1. Locations of nearfield and farfield stations and regional station groupings,
MWRA outfall, and USGS and GoMOOS moorings. ...........................................................2-3 Figure 3-1. Survey mean bottom water dissolved oxygen concentrations and percent saturation
in the nearfield and Stellwagen Basin compared to Contingency Plan threshold levels........3-5 Figure 3-2. Comparison of baseline and post-transfer seasonal and annual mean areal chlorophyll
in the nearfield. ......................................................................................................................3-6 Figure 3-3. Nearfield Alexandrium abundance for individual samples for 1992 to 2005.........................3-7 Figure 3-4. Winter/spring and summer seasonal mean nearfield Phaeocystis abundance for 1992
to 2005. ..................................................................................................................................3-8 Figure 3-5. Gulf of Maine circulation, showing the major current systems that influence
A. fundyense bloom dynamics and PSP toxicity in the region............................................3-10 Figure 3-6. Conceptual model of A. fundyense bloom dynamics in the Gulf of Maine..........................3-11 Figure 3-7. Comparison of the 2005 discharge of the Charles and Merrimack Rivers with the
observations of the past 15 years .........................................................................................3-12 Figure 3-8. Time series of Merrimack discharge, N-S winds at the Boston Buoy, NE-SW current
velocity at GoMOOS-A and salinity at GoMOOS-A at 5, 25 and 50-m depth. ..................3-13 Figure 3-9. Monthly average N-S wind stress at Boston buoy for 2005 compared with the
previous 11 years of observations .......................................................................................3-14 Figure 3-10. Average significant wave height in May for all of the years of the ambient
monitoring program. ..........................................................................................................3-14 Figure 3-11. A. fundyense cyst abundance in the top cm of sediment, mapped in October 2004...........3-15
2005 Annual Water Column Monitoring Report November 2006
vi
Figure 3-12. A. fundyense abundance in surface and subsurface samples, grouped into four regions................................................................................................................................3-16
Figure 3-13. Alexandrium, salinity, nitrate, and silicate in surface waters on May 10-13 2005.............3-17 Figure 3-14. Alexandrium, salinity, ammonium, and silicate in surface waters on May 27-28 2005.....3-18 Figure 3-15. Alexandrium, salinity, ammonium, and silicate in surface waters on June 2-4 2005.........3-19 Figure 3-16. Alexandrium and ammonium in surface and ~10 m waters on June 13-18 2005...............3-20 Figure 3-17. Alexandrium in surface and ~10 m waters on June 28-29 2005.........................................3-21 Figure 3-18. MDS plot of all phytoplankton samples labeled by survey month ....................................3-23 Figure 3-19. MDS plot of phytoplankton samples labeled by survey date showing sorting of
samples into 4 distinct groups: April, early May, late May – mid June and late June to July ........................................................................................................................3-24
Figure 3-20. Succession of dominant functional phytoplankton groups during April to July 2005 A. fundyense bloom............................................................................................................3-24
Figure 3-21. Time-series of baseline and post-transfer survey mean NH4 concentrations in the nearfield and Boston Harbor. .............................................................................................3-27
Figure 3-22. Time-series of annual mean NH4 and NO3 concentrations by area....................................3-28 Figure 3-23. Change in seasonal NH4 concentrations from baseline to post-transfer.............................3-28 Figure 3-24. Change in seasonal NO3 concentrations from baseline to post-transfer.............................3-31 Figure 3-25. Time-series of baseline and post-transfer nearfield survey mean areal chlorophyll
and POC concentration......................................................................................................3-32 Figure 3-26. Time-series of baseline and post-transfer Boston Harbor survey mean areal
chlorophyll and POC concentration ...................................................................................3-32 Figure 3-27. Change in seasonal areal fluorescence from baseline to post-transfer ...............................3-33 Figure 3-28. Change in seasonal POC concentrations from baseline to post-transfer ............................3-34 Figure 3-29. Time-series of baseline and post-transfer survey mean Areal Production in the
nearfield and Boston Harbor ..............................................................................................3-35 Figure 3-30. Annual potential production for stations F23, N04 and N16/N18 baseline and
post-transfer. ......................................................................................................................3-37
TABLES Table 1-1. Major Upgrades to the MWRA Treatment System. ................................................................1-1 Table 2-1. Water quality surveys for 2005. Typical ambient monitoring surveys in bold. ......................2-2 Table 3-1. Contingency Plan threshold values for water column monitoring. .........................................3-4 Table 3-2. Seasonal and annual mean areal chlorophyll in the nearfield..................................................3-6 Table 3-3. Summary of six dominant species and phytoplankton functional groups during four
phases of phytoplankton succession related to the 2005 Alexandrium bloom as identified by SimPer, with corresponding abundance. .........................................................3-25
Table 3-4. Summary table of Studentized t-test results comparing baseline versus post-transfer seasonal NH4 means by station. ............................................................................................3-30
Table 3-5. Annual mean production .......................................................................................................3-36 Table 3-6. Results of testing whether intercepts and slopes significantly differed between
baseline and post-transfer by parameter, season, and grouped stations. ...............................3-40
APPENDICES APPENDIX A: Physical Characterization ............................................................................................A-1 APPENDIX B: Water Quality .............................................................................................................. B-1 APPENDIX C: Productivity ................................................................................................................. C-1 APPENDIX D: Plankton.......................................................................................................................D-1
2005 Annual Water Column Monitoring Report November 2006
1-1
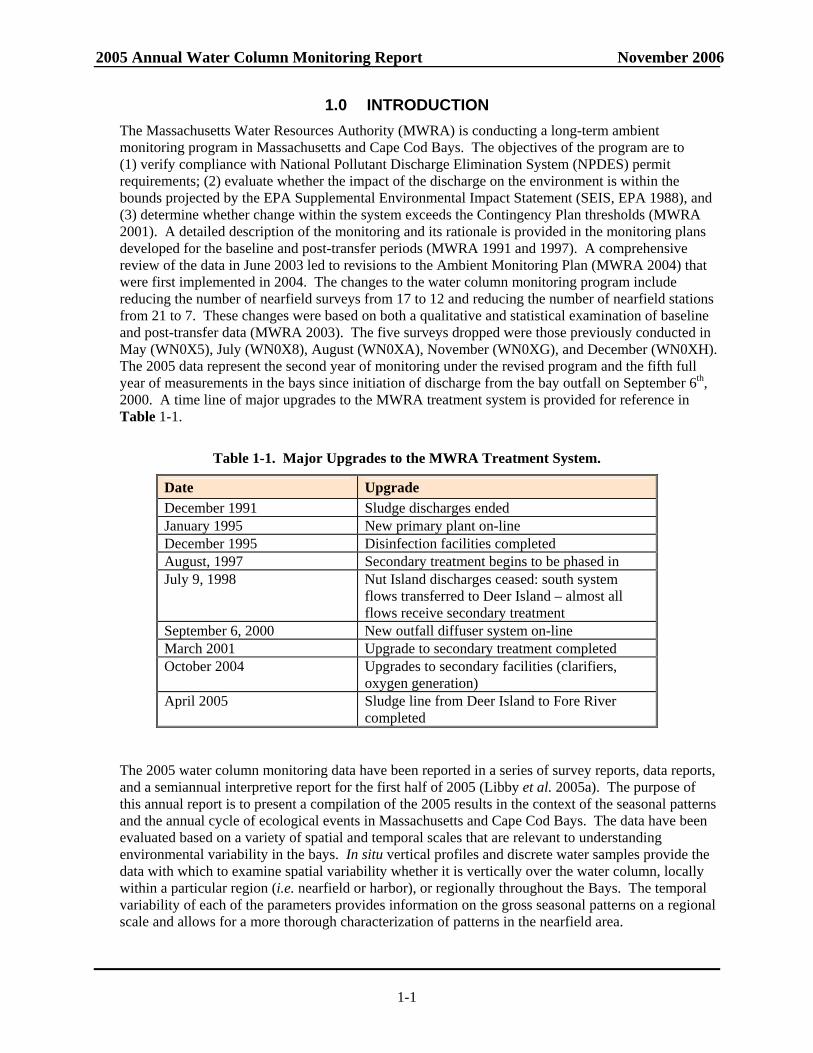
1.0 INTRODUCTION The Massachusetts Water Resources Authority (MWRA) is conducting a long-term ambient monitoring program in Massachusetts and Cape Cod Bays. The objectives of the program are to (1) verify compliance with National Pollutant Discharge Elimination System (NPDES) permit requirements; (2) evaluate whether the impact of the discharge on the environment is within the bounds projected by the EPA Supplemental Environmental Impact Statement (SEIS, EPA 1988), and (3) determine whether change within the system exceeds the Contingency Plan thresholds (MWRA 2001). A detailed description of the monitoring and its rationale is provided in the monitoring plans developed for the baseline and post-transfer periods (MWRA 1991 and 1997). A comprehensive review of the data in June 2003 led to revisions to the Ambient Monitoring Plan (MWRA 2004) that were first implemented in 2004. The changes to the water column monitoring program include reducing the number of nearfield surveys from 17 to 12 and reducing the number of nearfield stations from 21 to 7. These changes were based on both a qualitative and statistical examination of baseline and post-transfer data (MWRA 2003). The five surveys dropped were those previously conducted in May (WN0X5), July (WN0X8), August (WN0XA), November (WN0XG), and December (WN0XH). The 2005 data represent the second year of monitoring under the revised program and the fifth full year of measurements in the bays since initiation of discharge from the bay outfall on September 6th, 2000. A time line of major upgrades to the MWRA treatment system is provided for reference in Table 1-1.
Table 1-1. Major Upgrades to the MWRA Treatment System.
Date Upgrade December 1991 Sludge discharges ended January 1995 New primary plant on-line December 1995 Disinfection facilities completed August, 1997 Secondary treatment begins to be phased in July 9, 1998 Nut Island discharges ceased: south system
flows transferred to Deer Island – almost all flows receive secondary treatment
September 6, 2000 New outfall diffuser system on-line March 2001 Upgrade to secondary treatment completed October 2004 Upgrades to secondary facilities (clarifiers,
oxygen generation) April 2005 Sludge line from Deer Island to Fore River
completed The 2005 water column monitoring data have been reported in a series of survey reports, data reports, and a semiannual interpretive report for the first half of 2005 (Libby et al. 2005a). The purpose of this annual report is to present a compilation of the 2005 results in the context of the seasonal patterns and the annual cycle of ecological events in Massachusetts and Cape Cod Bays. The data have been evaluated based on a variety of spatial and temporal scales that are relevant to understanding environmental variability in the bays. In situ vertical profiles and discrete water samples provide the data with which to examine spatial variability whether it is vertically over the water column, locally within a particular region (i.e. nearfield or harbor), or regionally throughout the Bays. The temporal variability of each of the parameters provides information on the gross seasonal patterns on a regional scale and allows for a more thorough characterization of patterns in the nearfield area.
2005 Annual Water Column Monitoring Report November 2006
1-2
The 2005 data have also been compared to previous baseline monitoring data to characterize patterns or departure from patterns that may be related to discharge from the bay outfall. The post-diversion data from September 6, 2000 to December 2005 are also examined in context of the monitoring questions posed in 1991 that describe a series of possible environmental responses to the transfer of the discharge from the harbor to the bay outfall (MWRA 1991). These questions were originally conceived as a basis for evaluating changes and possible responses, but not necessarily actual or the only responses that could occur. A summary of the questions pertaining to the water column monitoring effort is provided below.
Water Circulation • What are the nearfield and farfield water circulation patterns? Aesthetics • Has the clarity and/or color of water around the outfall changed? • Has the amount of floatable debris around the outfall changed? Nutrients • Have nutrient concentrations changed in the water near the outfall? • Have nutrient concentrations changed in Massachusetts Bay or Cape Cod Bay and, if so, are
they correlated with changes in the nearfield? Biology and Productivity • Has phytoplankton biomass changed and, if so, can changes be correlated with ambient water
nutrient concentrations? • Has phytoplankton biomass changed in Massachusetts Bay or Cape Cod Bay and, if so, are
the changes correlated with changes in the nearfield or changes in nutrient concentrations in the farfield?
• Have production rates changed in the vicinity of the outfall or Boston Harbor and, if so, can these changes be correlated with changes in ambient water nutrient concentrations?
• Has phytoplankton or zooplankton species composition changed in the vicinity of the outfall and, if so, can these changes be correlated with ambient water nutrient concentrations?
• Has phytoplankton or zooplankton species composition changed in Massachusetts Bay or Cape Cod Bay and, if so, can the changes be correlated with changes in the nearfield or changes in nutrient concentrations in the farfield?
• Has the abundance of nuisance or noxious phytoplankton species changed? Dissolved Oxygen • Has dissolved oxygen in the nearfield changed relative to baseline and, if so, can changes be
correlated with effluent or ambient water nutrient concentrations? • Has dissolved oxygen changed in Massachusetts Bay or Cape Cod Bay and, if so, are the
changes correlated with changes in the nearfield or changes in nutrient concentrations in the farfield?
• Does dissolved oxygen in the water column meet the State Water Quality Standard in the nearfield and farfield?
2005 Annual Water Column Monitoring Report November 2006
1-3
A detailed examination of 2005 results and interannual patterns in physical, chemical and biological parameters is presented in the appendices: physical characteristics – temperature, salinity, and density (Appendix A), water quality parameters – nutrients, chlorophyll, and DO (Appendix B), primary production (Appendix C), and phytoplankton and zooplankton community composition (Appendix D). As with the 2003 and 2004 annual reports (Libby et al. 2004, 2006a), this report focuses on addressing the 1991 monitoring questions. A summary of the current understanding of the system is presented in Section 3 and serves as a basis for discussion of topics pertinent to the post -transfer data in general and 2005 monitoring data specifically presented in that section. The discussion includes an overview of the major findings from the 2005 water column data, comparisons of 2005 data against the established Contingency Plan (MWRA 2001) thresholds, the A. fundyense bloom of 2005, and integration and comparisons of baseline and post-transfer data including a statistical analysis of baseline to post-transfer changes. The final section summarizes these discussions and presents the current understanding in respect to the monitoring questions (MWRA 1991).
2005 Annual Water Column Monitoring Report November 2006
2-1
2.0 2005 WATER COLUMN MONITORING PROGRAM This section summarizes the design of the 2005 ambient water quality monitoring program. The sources of information and data discussed in this report are identified and a general overview of the monitoring program is provided.
2.1 Data Sources A detailed presentation of field sampling equipment and procedures, sample handling and custody, sample processing and laboratory analysis, and instrument performance specifications and data quality objectives are discussed in the Combined Work/Quality Assurance Project Plan (CW/QAPP) for Water Quality Monitoring: 2004-2005 (Libby et al. 2005b). Details on any deviations from the methods outlined in the CW/QAPP have been provided in individual survey reports and the semiannual report. For each water column survey, the survey objectives, station locations and tracklines, instrumentation and vessel information, sampling methodologies, and staffing were documented in a survey plan. Following each survey, the activities that were accomplished, the actual sequence of events and tracklines, the number and types of samples collected, a preliminary summary of in situ water quality data, >20 µm phytoplankton species abundance, whale watch information, and any deviations from the plan were summarized in a survey report. Results for 2005 water column surveys have been presented in quarterly data reports and submitted to MWRA. Additional data pertaining to the A. fundyense bloom were obtained from MWRA Alexandrium Rapid Response surveys (ARRS), Boston Harbor Water Quality Monitoring surveys (BHWQM; Rex and Taylor 2000), Woods Hole Oceanographic Institute (WHOI) cruises, Center for Coastal Studies (CCS) surveys, and a University of Massachusetts Dartmouth (UMD) survey. Shellfish toxicity data were obtained from the Massachusetts Division of Marine Fisheries (MA DMF).
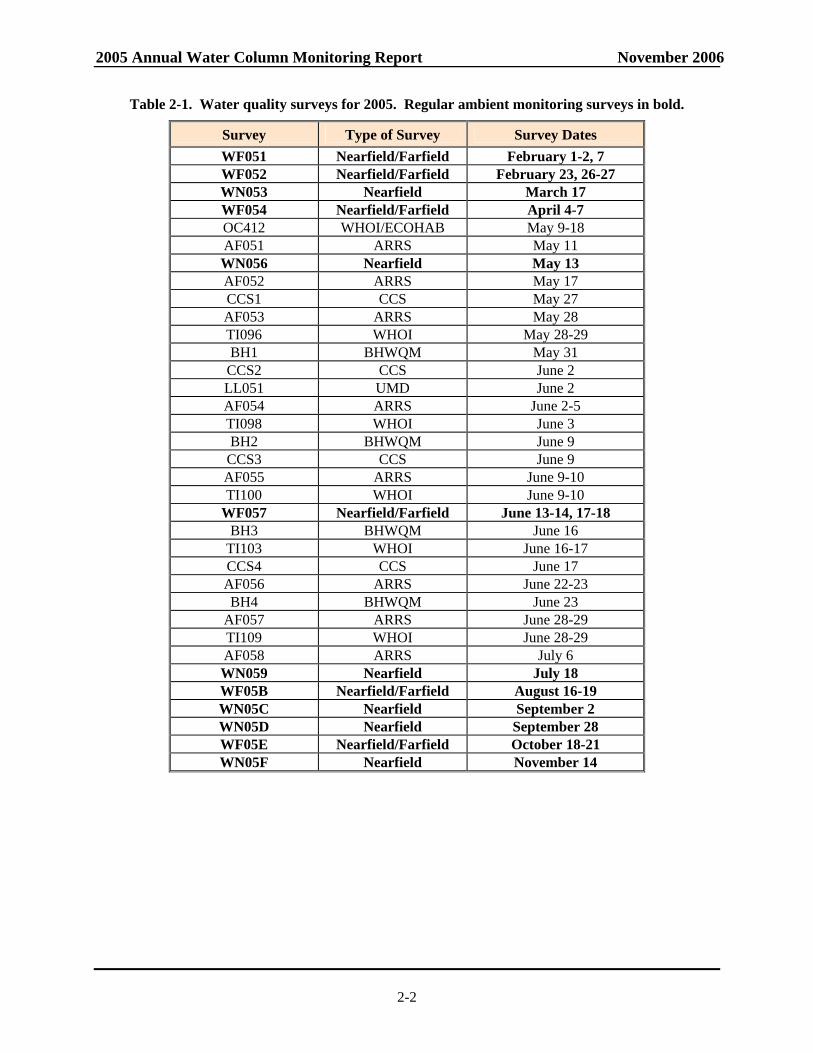
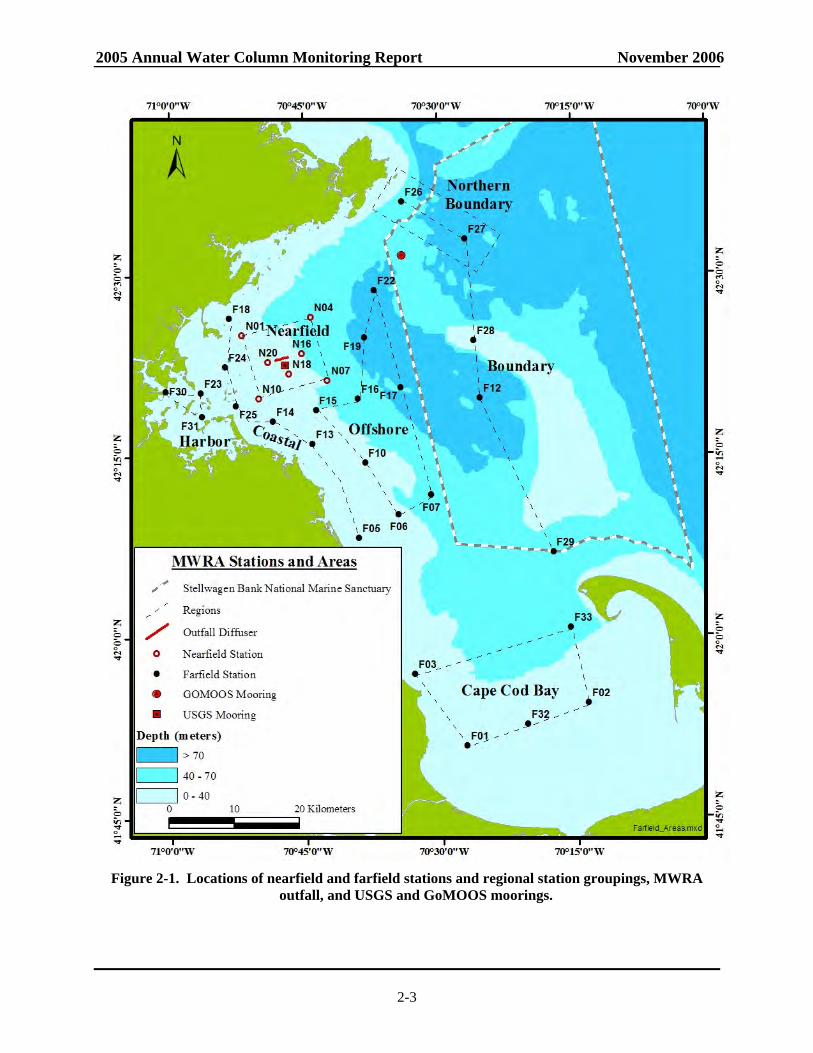
2.2 2005 Water Column Monitoring Program Overview This annual report summarizes and evaluates water column monitoring results from the 12 water column surveys conducted in 2005 (Table 2-1). The surveys have been designed to evaluate water quality on both a high-frequency basis for a limited area (nearfield surveys) and a low-frequency basis for an extended area (farfield). A total of 34 stations are distributed throughout Boston Harbor, Massachusetts Bay and Cape Cod Bay in a strategic pattern that is intended to provide a comprehensive characterization of the area (Figure 2-1). The nearfield stations, located in Massachusetts Bay in the vicinity of the outfall site, were sampled during each of the 12 surveys. The farfield stations, located throughout Boston Harbor, Massachusetts Bay, and Cape Cod Bay, were sampled during the six combined farfield/nearfield surveys. The Gulf of Maine Ocean Observing System (GoMOOS) and USGS moorings are also shown in Figure 2-1. An additional 23 surveys were conducted by MWRA and other research groups in response to the 2005 Alexandrium bloom (Table 2-1). Sampling procedures, station locations, and detailed results are provided in a separate technical report focused on the bloom (Anderson et al. in prep). Samples were collected for Alexandrium probe analysis during all 23 of these surveys and during surveys WN056, WF057, and WN059, which were modified to focus on the bloom. The seven nearfield stations are located in a grid pattern covering an area of approximately 110 km2 centered on the MWRA bay outfall (Figure 2-1). The 27 farfield stations are located throughout Boston Harbor, Massachusetts Bay, and Cape Cod Bay (Figure 2-1). Station N16 is sampled twice during the combined surveys as both a farfield and a nearfield station.
2005 Annual Water Column Monitoring Report November 2006
2-2
Table 2-1. Water quality surveys for 2005. Regular ambient monitoring surveys in bold.
Survey Type of Survey Survey Dates WF051 Nearfield/Farfield February 1-2, 7 WF052 Nearfield/Farfield February 23, 26-27 WN053 Nearfield March 17 WF054 Nearfield/Farfield April 4-7
OC412 WHOI/ECOHAB May 9-18 AF051 ARRS May 11 WN056 Nearfield May 13 AF052 ARRS May 17 CCS1 CCS May 27 AF053 ARRS May 28 TI096 WHOI May 28-29 BH1 BHWQM May 31
CCS2 CCS June 2 LL051 UMD June 2 AF054 ARRS June 2-5 TI098 WHOI June 3 BH2 BHWQM June 9
CCS3 CCS June 9 AF055 ARRS June 9-10 TI100 WHOI June 9-10
WF057 Nearfield/Farfield June 13-14, 17-18 BH3 BHWQM June 16
TI103 WHOI June 16-17 CCS4 CCS June 17 AF056 ARRS June 22-23 BH4 BHWQM June 23
AF057 ARRS June 28-29 TI109 WHOI June 28-29 AF058 ARRS July 6 WN059 Nearfield July 18 WF05B Nearfield/Farfield August 16-19 WN05C Nearfield September 2 WN05D Nearfield September 28 WF05E Nearfield/Farfield October 18-21 WN05F Nearfield November 14
2005 Annual Water Column Monitoring Report November 2006
2-3
Figure 2-1. Locations of nearfield and farfield stations and regional station groupings, MWRA
outfall, and USGS and GoMOOS moorings.
2005 Annual Water Column Monitoring Report November 2006
2-4
The stations for the farfield surveys have been further separated into regional groupings according to geographic location to simplify regional data comparisons. These regional groupings include Boston Harbor (three stations), coastal (six stations along the coastline from Nahant to Marshfield), offshore (eight deeper-water stations in central Massachusetts Bay), boundary (five stations in an arc from Cape Ann to Provincetown and in or adjacent to the Stellwagen Bank National Marine Sanctuary), and Cape Cod Bay (five stations, two of which are only sampled for zooplankton during the three farfield surveys from February to April). The regional nomenclature is used throughout this report and regional comparisons are made by partitioning the total data set by these groupings. For this report, subsets of the data have also been grouped to focus on the deep-water stations off of Cape Ann (F26 and F27 – Northern Boundary) and in Stellwagen Basin (F12, F17, F19 and F22 – see Figure 2-1). Details on the sampling protocols can be found in the CW/QAPP (Libby et al. 2005b). The data are also grouped by season for comparisons of biological and nutrient data and also for calculation of chlorophyll and nuisance algae Contingency Plan thresholds. The seasons are defined as the following 4-month periods: winter/spring from January to April, summer from May to August, and fall from September to December. Note that for the interannual comparisons including the intervention analysis in Section 3.5.4, December data are not used as those surveys were dropped from the ambient water quality monitoring program in 2004.
2005 Annual Water Column Monitoring Report November 2006
3-1
3.0 RESULTS AND DISCUSSION
3.1 Overview of System Characteristics Over the course of the ambient water quality monitoring program, general temporal and spatial patterns in water quality characteristics have emerged from the data collected in Massachusetts and Cape Cod Bays. The patterns are evident even though the timing, year-to-year manifestations and spatial extent of these events are variable. The physical dynamics of the system are the primary influences on the occurrence, timing and extent of water quality events in the bays. Although Massachusetts and Cape Cod Bays generally follow an annual cycle typical for temperate coastal waters, the timing of events over the cycle is strongly influenced by regional meteorological and oceanographic conditions. In the winter, the water column is well mixed, nutrient levels are high, and plankton biomass is low. The transition from winter to spring in Massachusetts and Cape Cod Bays is characterized by a series of physical, biological, and chemical events. A phytoplankton bloom often occurs as light increases and temperatures rise. Centric diatoms, usually assorted species of Thalassiosira and Chaetoceros, dominate early winter/spring blooms (February), while blooms of Phaeocystis pouchetii have tended to occur later in the spring (April). Winter/spring diatom blooms, when they occur, usually begin in the shallower waters of Cape Cod Bay. Blooms at deeper stations of Massachusetts Bay usually begin two to three weeks later. Spring phytoplankton blooms are typically followed by an increase in zooplankton abundance. Later in the spring, stratification increases due to the decrease in surface water salinity associated with the spring freshet and is further strengthened by warming of surface waters. The increase in stratification effectively separates the surface and bottom waters, preventing replenishment of nutrients to the surface and of oxygen to the bottom waters. Phytoplankton in the surface waters deplete the available nutrients, undergo senescence, and are also grazed by zooplankton. Late spring also brings the threat of blooms of the ‘red tide’ organism Alexandrium fundyense. Since the ambient water quality monitoring program began in 1992, A. fundyense has been rarely found in the bays. The presence or absence of A. fundyense is influenced by local forcing conditions, which control the input of Gulf of Maine (GOM) waters to Massachusetts Bay. Winds, currents and spring runoff in May determine whether blooms of A. fundyense (that are often present in GOM waters during this time of year) enter Massachusetts Bay or are transported out to sea (Anderson 1997, Anderson et al. 2002). The former appears to have been the case in 2005 when meteorological conditions were such that an ongoing bloom of A. fundyense in the western GOM was transported into Massachusetts and Cape Cod Bays (Anderson et al. 2005a). This unprecedented red tide event is one of the main topics in this annual report and will be examined in even greater detail in an upcoming interpretive report focused on the event (Anderson et al. in prep).
The summer is generally a period of strong stratification, depleted surface water nutrients, low biomass, and a relatively stable mixed-assemblage phytoplankton community dominated by microflagellates. Dissolved oxygen declines in the bottom waters over the summer as stratification prevents bottom water DO from being replenished from the surface while respiration continues to consume DO present in the bottom waters. Advection has been shown to greatly influence bottom DO concentrations (Geyer et al. 2002). Nearfield bottom water DO tends to be lowest when these waters are warm and salty, reflecting increased respiration and slower currents (higher residence time), respectively, both of which result in stronger drawdown of DO in this region. Temperature also has a direct effect on DO levels by increasing rates of respiration. In the fall, cooling surface waters weakens stratification and strong winds promote mixing of the water column. When stratification breaks down, oxygen is replenished in the bottom waters and nutrients are
2005 Annual Water Column Monitoring Report November 2006
3-2
supplied to surface waters usually stimulating a fall phytoplankton bloom. The fall bloom is typically a mixed assemblage of diatoms including Asterionellopsis glacialis, Rhizosolenia delicatula, Skeletonema costatum, Leptocylindrus minimus, and L. danicus. Some of the largest blooms, however, have been nearly monospecific such as the A. glacialis bloom in September-October 1993. Typically, fall blooms end by early winter, when declining light levels limit photosynthesis. The lowest bottom water DO concentrations are observed just prior to the overturn of the water column – usually in October. By late fall or early winter, the water column becomes well mixed and resets to winter conditions. In winter, the combination of wind mixing and low light levels serve to inhibit primary production thus keeping biomass and phytoplankton abundance low until the following year’s winter/spring bloom.
3.2 Synopsis of 2005 Results The sequence of events described in Section 3.1 was generally evident in 2005 with some notable variations. Details on the physical, chemical and biological data collected in 2005 can be found in Appendices A-D. The major water quality features and differences from the baseline in 2005 are summarized below:
• 2005 was generally wetter than normal, most notably during the late spring and late fall. Merrimack River flow was the highest it has been for the monitoring program during the April-June period, with three substantial discharge events. The unusually wet conditions in October also caused extreme run-off during that time.
• The high river discharge and accompanying wind events during the spring were the most notable physical attributes in 2005. The occurrence of strong northeaster storms in May produced lower salinities due to high river inputs to the coastal waters, much larger waves than usual for the month of May, deep mixing of the low-salinity waters, and higher near-bottom dissolved oxygen levels than usual.
• These meteorological and physical oceanographic conditions contributed to the occurrence, severity, and duration of the most notable biological event in 2005 – an unprecedented bloom of the toxic dinoflagellate Alexandrium fundyense in Massachusetts and Cape Cod Bays.
• The 2005 A. fundyense bloom was the largest red tide episode in New England since 1972, and may have been even larger than the less well-documented event that occurred that year. The bloom extended from Maine to south of Martha’s Vineyard, and prompted shellfish closures throughout the entire region. Typical concentrations of A. fundyense in most years are a few tens of cells L-1, but in 2005, many samples had counts of >1,000 cells L-1, with maximum counts in Cape Cod Bay of ~40,000 cells L-1. Levels in the nearfield in 2005 were orders-of-magnitude higher than in previous years and easily exceeded the Contingency Plan threshold of 100 cells L-1.
• Despite the economic impact and attention, the A. fundyense abundances were only a minor portion of the overall phytoplankton assemblage and had little impact on patterns observed in other water quality parameters such as chlorophyll and nutrient concentrations, primary production, and phytoplankton abundance. By these measures, 2005 was a fairly typical year.
• A Phaeocystis bloom was observed for the sixth consecutive year. The bloom was observed from February to April with maximum abundances observed in April (up to 4 × 10⁶ cells L-1). These abundances were much lower, however, than had been observed in 2004.
• In June, Phaeocystis was observed in a single sample collected from station N18 (mid-depth; ~10,000 cells L-1). The cells in this sample appeared to be degraded and likely the remnants of the April offshore bloom. Regardless, their presence resulted in an exceedance of the summer Phaeocystis threshold of 357 cells L-1. This exceedance was of no ecological significance; the
2005 Annual Water Column Monitoring Report November 2006
3-3
new pattern for annual Phaeocystis blooms with detectable abundances persisting into May and even June appears to be related to cooler water temperatures (Libby et al. 2006b).
• Nutrient patterns generally followed typical seasonal progressions. The main exception was due to the precipitation and wind events in May. The northeaster storms led to increased runoff and water column mixing that increased nutrient concentrations from April to May, especially SiO4 concentrations. The availability of nutrients not only supported the Alexandrium bloom, but the SiO4 also allowed for a fairly substantial diatom bloom which dominated the overall phytoplankton abundance in May.
• At the Boston Harbor station F23, productivity in 2005 generally fell well below the baseline mean with no spring bloom but a distinct peak in late summer productivity. At nearfield station N18, areal production for 2005 was less than the long-term average for almost all data points while productivity at station N04 exceeded the baseline mean during both summer and fall.
• The post-transfer productivity rates in Boston Harbor continue to suggest a pattern more typical of temperate waters with a winter/spring peak, lower summer rates, and a late summer/early fall peak. There has been a nearly significant increase in post-transfer spring production in the harbor compared to baseline, while there has been a statistically significant decrease in summer production and a nearly significant decrease in annual production in the harbor. Overall, the decline in productivity seen at the station does indicate a shift to a less-enriched environment
• In the nearfield, only minor changes in seasonal and annual production have been observed between pre- and post-transfer periods. Mean production values have increased slightly for spring while decreasing somewhat in the summer and fall, but none of these changes is statistically significant.
• Bottom water dissolved oxygen was relatively high in 2005. This was in part the result of the strong mixing during May and in part because of the upwelling-favorable conditions in August and September. The regression model based on bottom temperature and salinity indicated that high dissolved oxygen should occur, consistent with the observations.
• Since the bay outfall came on line, DO levels in the nearfield and Stellwagen Basin have remained within the baseline range and 2005 was no exception. However, the 2005 bottom water DO minima in the nearfield were among the highest measured over the monitoring program. Minimum survey mean %saturation values in the nearfield and Stellwagen areas were only slightly below 80% (79.4% and 76.5% respectively). The 2005 DO concentration minima were well above caution levels.
• Zooplankton community structure and relative seasonal abundance patterns were similar to previous years. Zooplankton abundance was dominated by copepod nauplii, and adults and copepodites of Oithona similis and Pseudocalanus spp., with subdominant contributions by other copepods and sporadic pulses of meroplankters. Zooplankton abundance increased from winter through spring to summer, and declined through the fall.
• Notably, zooplankton abundance was lower than typically observed over the baseline during much of 2005 and during many of the post-transfer years. The low abundance in spring and summer has been observed over most of Massachusetts Bay and may have been influenced by the occurrence of Phaeocystis blooms that have occurred annually since 2000 or could be related to changes in temperature. The low zooplankton abundances in the fall could conceivably be related to either bottom-up (comparatively minimal fall bloom – reduced food) or top-down controls (continued presence of ctenophores). Process and rate studies would be necessary to elevate such speculation to the status of explanation.
2005 Annual Water Column Monitoring Report November 2006
3-4
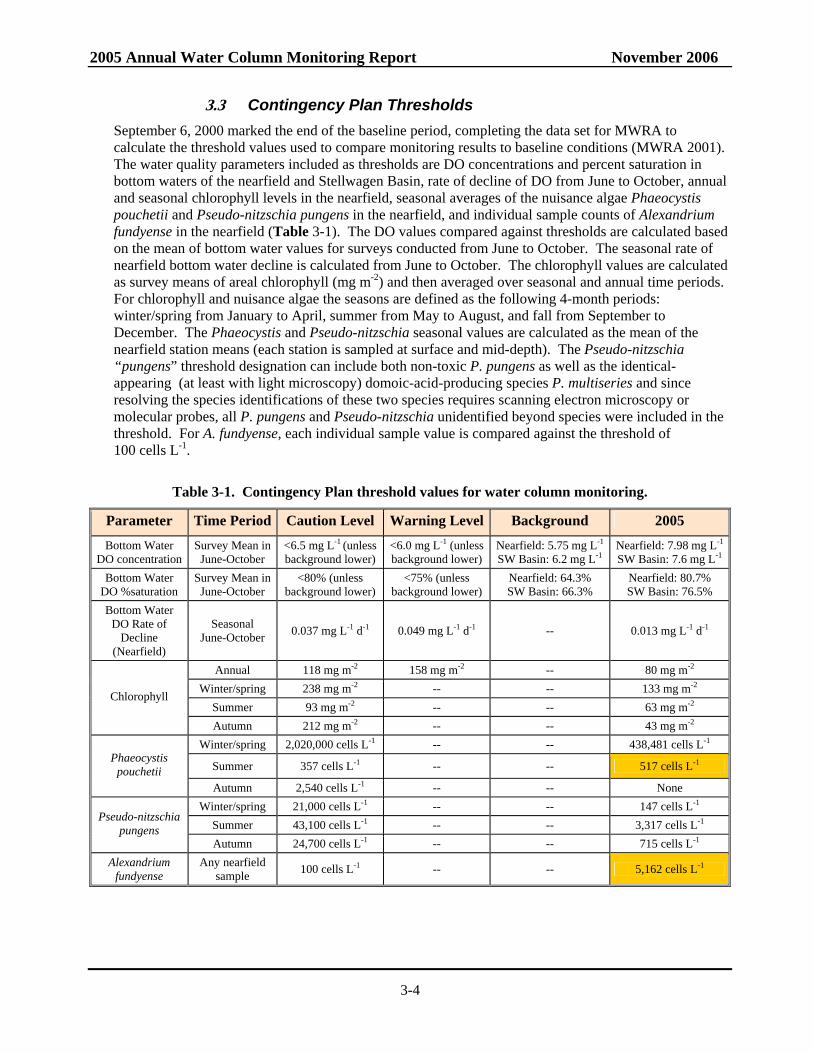
3.3 Contingency Plan Thresholds September 6, 2000 marked the end of the baseline period, completing the data set for MWRA to calculate the threshold values used to compare monitoring results to baseline conditions (MWRA 2001). The water quality parameters included as thresholds are DO concentrations and percent saturation in bottom waters of the nearfield and Stellwagen Basin, rate of decline of DO from June to October, annual and seasonal chlorophyll levels in the nearfield, seasonal averages of the nuisance algae Phaeocystis pouchetii and Pseudo-nitzschia pungens in the nearfield, and individual sample counts of Alexandrium fundyense in the nearfield (Table 3-1). The DO values compared against thresholds are calculated based on the mean of bottom water values for surveys conducted from June to October. The seasonal rate of nearfield bottom water decline is calculated from June to October. The chlorophyll values are calculated as survey means of areal chlorophyll (mg m-2) and then averaged over seasonal and annual time periods. For chlorophyll and nuisance algae the seasons are defined as the following 4-month periods: winter/spring from January to April, summer from May to August, and fall from September to December. The Phaeocystis and Pseudo-nitzschia seasonal values are calculated as the mean of the nearfield station means (each station is sampled at surface and mid-depth). The Pseudo-nitzschia “pungens” threshold designation can include both non-toxic P. pungens as well as the identical-appearing (at least with light microscopy) domoic-acid-producing species P. multiseries and since resolving the species identifications of these two species requires scanning electron microscopy or molecular probes, all P. pungens and Pseudo-nitzschia unidentified beyond species were included in the threshold. For A. fundyense, each individual sample value is compared against the threshold of 100 cells L-1.
Table 3-1. Contingency Plan threshold values for water column monitoring.
Parameter Time Period Caution Level Warning Level Background 2005 Bottom Water
DO concentration Survey Mean in June-October
<6.5 mg L-1 (unless background lower)
<6.0 mg L-1 (unless background lower)
Nearfield: 5.75 mg L-1 SW Basin: 6.2 mg L-1
Nearfield: 7.98 mg L-1
SW Basin: 7.6 mg L-1 Bottom Water
DO %saturation Survey Mean in June-October
<80% (unless background lower)
<75% (unless background lower)
Nearfield: 64.3% SW Basin: 66.3%
Nearfield: 80.7% SW Basin: 76.5%
Bottom Water DO Rate of
Decline (Nearfield)
Seasonal June-October 0.037 mg L-1 d-1 0.049 mg L-1 d-1 -- 0.013 mg L-1 d-1
Annual 118 mg m-2 158 mg m-2 -- 80 mg m-2 Winter/spring 238 mg m-2 -- -- 133 mg m-2
Summer 93 mg m-2 -- -- 63 mg m-2 Chlorophyll
Autumn 212 mg m-2 -- -- 43 mg m-2 Winter/spring 2,020,000 cells L-1 -- -- 438,481 cells L-1
Summer 357 cells L-1 -- -- 517 cells L-1 Phaeocystis
pouchetii Autumn 2,540 cells L-1 -- -- None
Winter/spring 21,000 cells L-1 -- -- 147 cells L-1 Summer 43,100 cells L-1 -- -- 3,317 cells L-1
Pseudo-nitzschia pungens
Autumn 24,700 cells L-1 -- -- 715 cells L-1 Alexandrium
fundyense Any nearfield
sample 100 cells L-1 -- -- 5,162 cells L-1
2005 Annual Water Column Monitoring Report November 2006
3-5
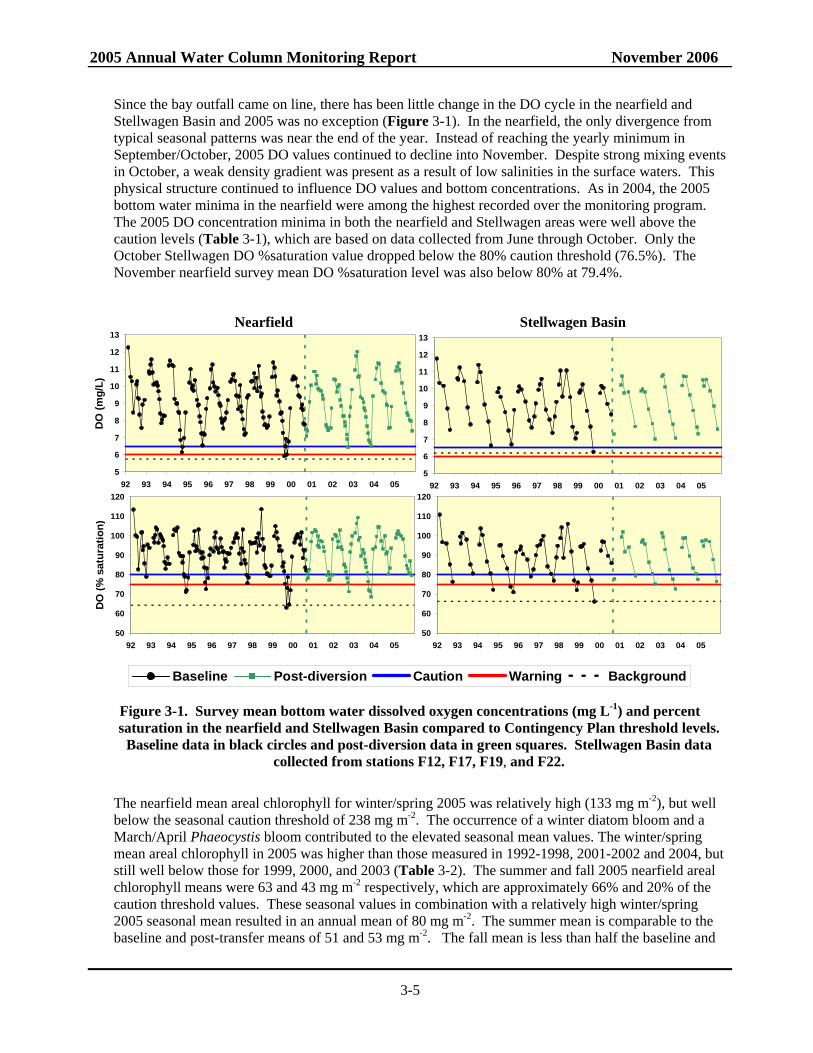
Since the bay outfall came on line, there has been little change in the DO cycle in the nearfield and Stellwagen Basin and 2005 was no exception (Figure 3-1). In the nearfield, the only divergence from typical seasonal patterns was near the end of the year. Instead of reaching the yearly minimum in September/October, 2005 DO values continued to decline into November. Despite strong mixing events in October, a weak density gradient was present as a result of low salinities in the surface waters. This physical structure continued to influence DO values and bottom concentrations. As in 2004, the 2005 bottom water minima in the nearfield were among the highest recorded over the monitoring program. The 2005 DO concentration minima in both the nearfield and Stellwagen areas were well above the caution levels (Table 3-1), which are based on data collected from June through October. Only the October Stellwagen DO %saturation value dropped below the 80% caution threshold (76.5%). The November nearfield survey mean DO %saturation level was also below 80% at 79.4%.
Nearfield Stellwagen Basin
5
6
7
8
9
10
11
12
13
92 93 94 95 96 97 98 99 00 01 02 03 04 05
DO
(mg/
L)
5
6
7
8
9
10
11
12
13
92 93 94 95 96 97 98 99 00 01 02 03 04 05
50
60
70
80
90
100
110
120
92 93 94 95 96 97 98 99 00 01 02 03 04 05
DO
(% s
atur
atio
n)
50
60
70
80
90
100
110
120
92 93 94 95 96 97 98 99 00 01 02 03 04 05
Baseline Post-diversion Caution Warning Background
Figure 3-1. Survey mean bottom water dissolved oxygen concentrations (mg L-1) and percent saturation in the nearfield and Stellwagen Basin compared to Contingency Plan threshold levels.
Baseline data in black circles and post-diversion data in green squares. Stellwagen Basin data collected from stations F12, F17, F19, and F22.
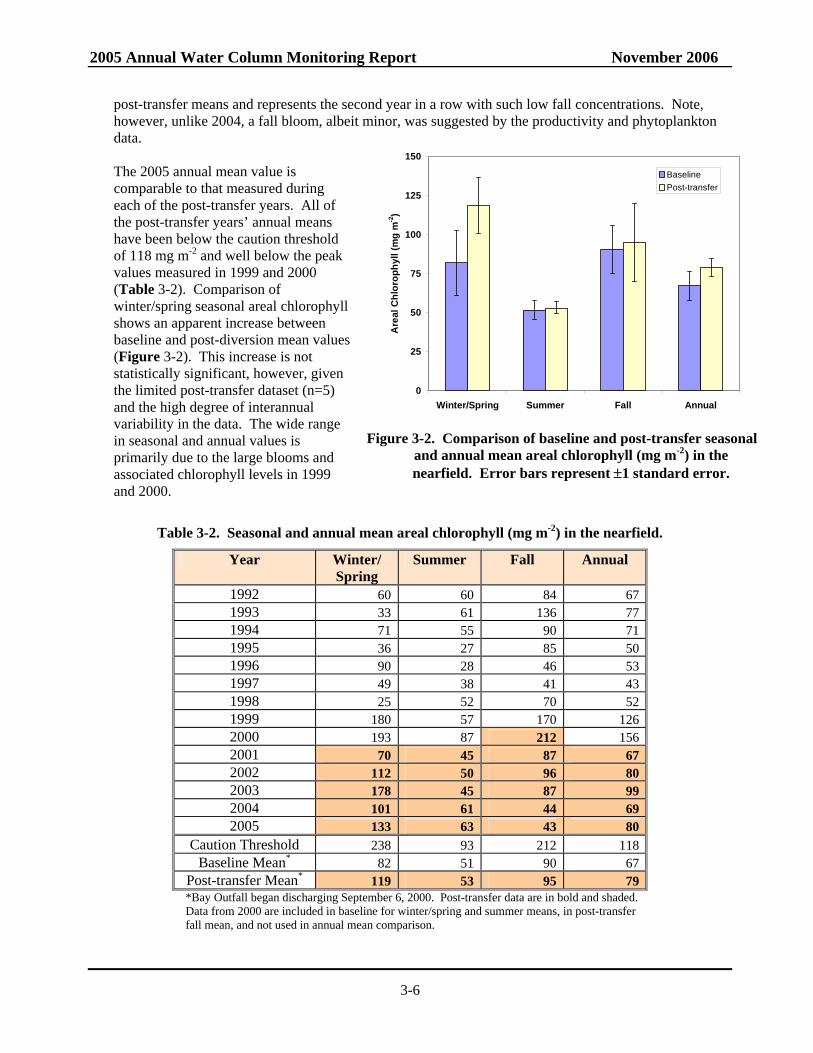
The nearfield mean areal chlorophyll for winter/spring 2005 was relatively high (133 mg m-2), but well below the seasonal caution threshold of 238 mg m-2. The occurrence of a winter diatom bloom and a March/April Phaeocystis bloom contributed to the elevated seasonal mean values. The winter/spring mean areal chlorophyll in 2005 was higher than those measured in 1992-1998, 2001-2002 and 2004, but still well below those for 1999, 2000, and 2003 (Table 3-2). The summer and fall 2005 nearfield areal chlorophyll means were 63 and 43 mg m-2 respectively, which are approximately 66% and 20% of the caution threshold values. These seasonal values in combination with a relatively high winter/spring 2005 seasonal mean resulted in an annual mean of 80 mg m-2. The summer mean is comparable to the baseline and post-transfer means of 51 and 53 mg m-2. The fall mean is less than half the baseline and
2005 Annual Water Column Monitoring Report November 2006
3-6
post-transfer means and represents the second year in a row with such low fall concentrations. Note, however, unlike 2004, a fall bloom, albeit minor, was suggested by the productivity and phytoplankton data. The 2005 annual mean value is comparable to that measured during each of the post-transfer years. All of the post-transfer years’ annual means have been below the caution threshold of 118 mg m-2 and well below the peak values measured in 1999 and 2000 (Table 3-2). Comparison of winter/spring seasonal areal chlorophyll shows an apparent increase between baseline and post-diversion mean values (Figure 3-2). This increase is not statistically significant, however, given the limited post-transfer dataset (n=5) and the high degree of interannual variability in the data. The wide range in seasonal and annual values is primarily due to the large blooms and associated chlorophyll levels in 1999 and 2000.
Table 3-2. Seasonal and annual mean areal chlorophyll (mg m-2) in the nearfield.
Year Winter/ Spring
Summer Fall Annual
1992 60 60 84 67 1993 33 61 136 77 1994 71 55 90 71 1995 36 27 85 50 1996 90 28 46 53 1997 49 38 41 43 1998 25 52 70 52 1999 180 57 170 126 2000 193 87 212 156 2001 70 45 87 67 2002 112 50 96 80 2003 178 45 87 99 2004 101 61 44 69 2005 133 63 43 80
Caution Threshold 238 93 212 118 Baseline Mean* 82 51 90 67
Post-transfer Mean* 119 53 95 79 *Bay Outfall began discharging September 6, 2000. Post-transfer data are in bold and shaded. Data from 2000 are included in baseline for winter/spring and summer means, in post-transfer fall mean, and not used in annual mean comparison.
0
25
50
75
100
125
150
Winter/Spring Summer Fall AnnualA
real
Chl
orop
hyll
(mg
m-2
)
BaselinePost-transfer
Figure 3-2. Comparison of baseline and post-transfer seasonal
and annual mean areal chlorophyll (mg m-2) in the nearfield. Error bars represent ±1 standard error.
2005 Annual Water Column Monitoring Report November 2006
3-7
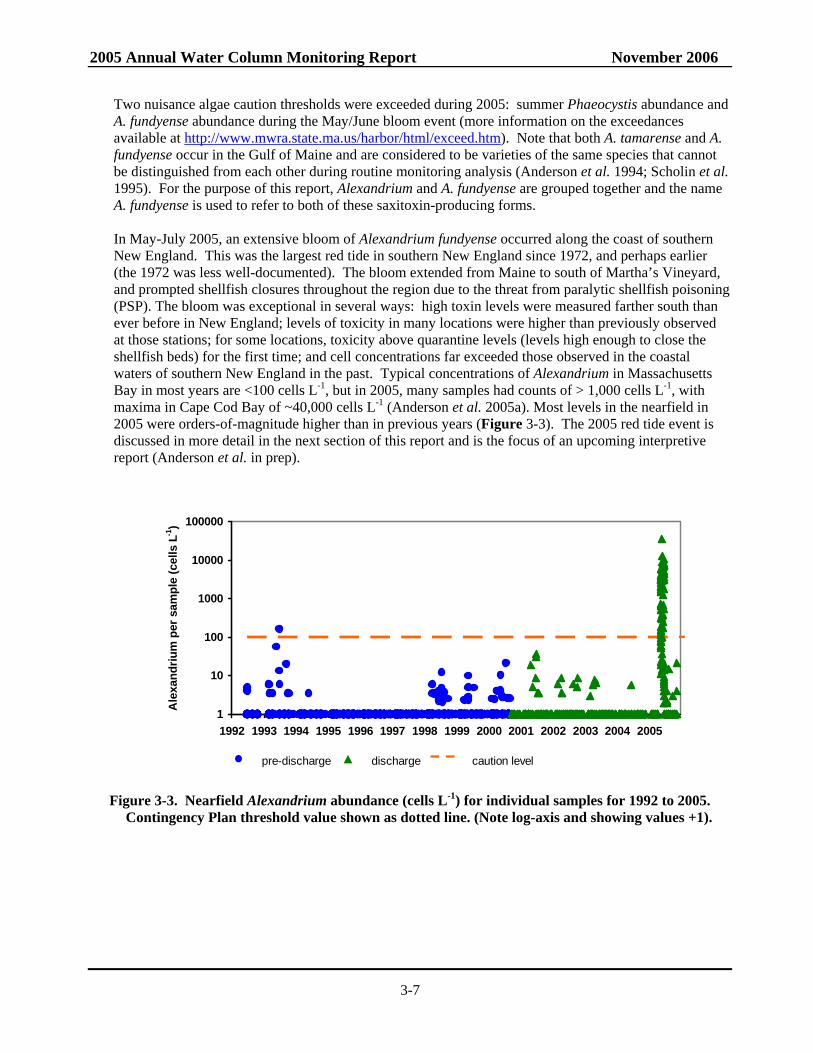
Two nuisance algae caution thresholds were exceeded during 2005: summer Phaeocystis abundance and A. fundyense abundance during the May/June bloom event (more information on the exceedances available at http://www.mwra.state.ma.us/harbor/html/exceed.htm). Note that both A. tamarense and A. fundyense occur in the Gulf of Maine and are considered to be varieties of the same species that cannot be distinguished from each other during routine monitoring analysis (Anderson et al. 1994; Scholin et al. 1995). For the purpose of this report, Alexandrium and A. fundyense are grouped together and the name A. fundyense is used to refer to both of these saxitoxin-producing forms. In May-July 2005, an extensive bloom of Alexandrium fundyense occurred along the coast of southern New England. This was the largest red tide in southern New England since 1972, and perhaps earlier (the 1972 was less well-documented). The bloom extended from Maine to south of Martha’s Vineyard, and prompted shellfish closures throughout the region due to the threat from paralytic shellfish poisoning (PSP). The bloom was exceptional in several ways: high toxin levels were measured farther south than ever before in New England; levels of toxicity in many locations were higher than previously observed at those stations; for some locations, toxicity above quarantine levels (levels high enough to close the shellfish beds) for the first time; and cell concentrations far exceeded those observed in the coastal waters of southern New England in the past. Typical concentrations of Alexandrium in Massachusetts Bay in most years are <100 cells L-1, but in 2005, many samples had counts of > 1,000 cells L-1, with maxima in Cape Cod Bay of ~40,000 cells L-1 (Anderson et al. 2005a). Most levels in the nearfield in 2005 were orders-of-magnitude higher than in previous years (Figure 3-3). The 2005 red tide event is discussed in more detail in the next section of this report and is the focus of an upcoming interpretive report (Anderson et al. in prep).
1
10
100
1000
10000
100000
1992 1993 1994 1995 1996 1997 1998 1999 2000 2001 2002 2003 2004 2005
Ale
xand
rium
per
sam
ple
(cel
ls L
-1)
pre-discharge discharge caution level
Figure 3-3. Nearfield Alexandrium abundance (cells L-1) for individual samples for 1992 to 2005. Contingency Plan threshold value shown as dotted line. (Note log-axis and showing values +1).
2005 Annual Water Column Monitoring Report November 2006
3-8
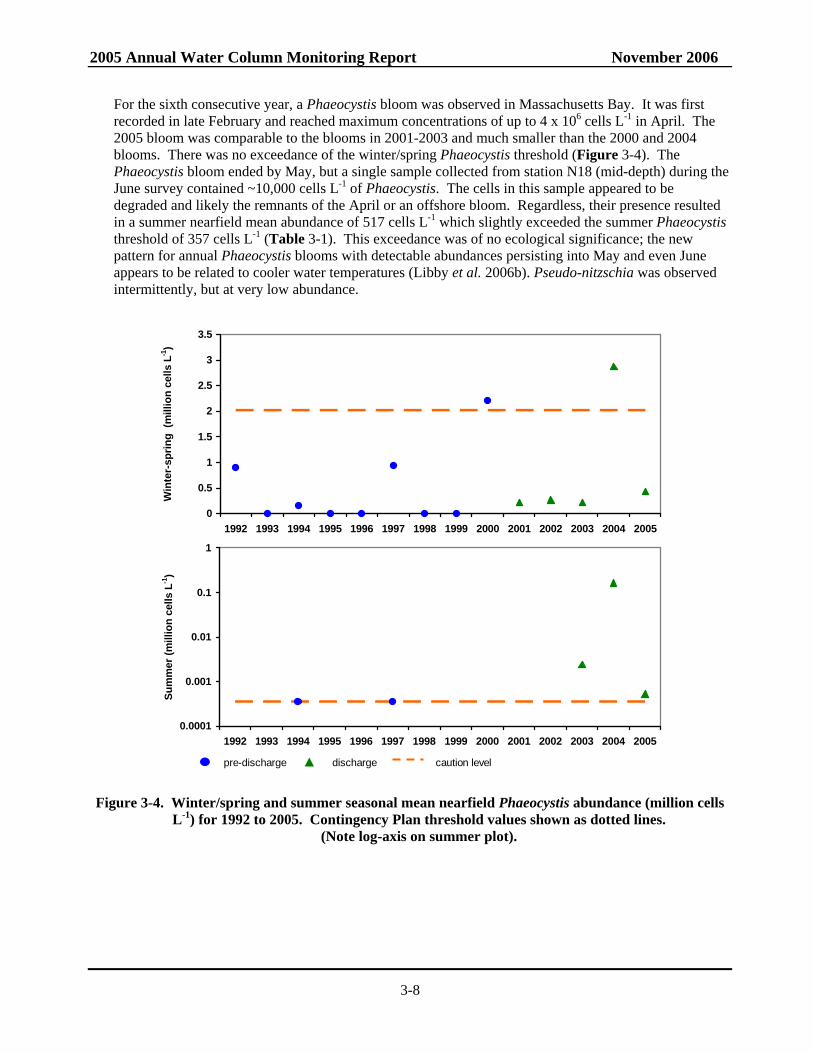
For the sixth consecutive year, a Phaeocystis bloom was observed in Massachusetts Bay. It was first recorded in late February and reached maximum concentrations of up to 4 x 10⁶ cells L-1 in April. The 2005 bloom was comparable to the blooms in 2001-2003 and much smaller than the 2000 and 2004 blooms. There was no exceedance of the winter/spring Phaeocystis threshold (Figure 3-4). The Phaeocystis bloom ended by May, but a single sample collected from station N18 (mid-depth) during the June survey contained ~10,000 cells L-1 of Phaeocystis. The cells in this sample appeared to be degraded and likely the remnants of the April or an offshore bloom. Regardless, their presence resulted in a summer nearfield mean abundance of 517 cells L-1 which slightly exceeded the summer Phaeocystis threshold of 357 cells L-1 (Table 3-1). This exceedance was of no ecological significance; the new pattern for annual Phaeocystis blooms with detectable abundances persisting into May and even June appears to be related to cooler water temperatures (Libby et al. 2006b). Pseudo-nitzschia was observed intermittently, but at very low abundance.
0
0.5
1
1.5
2
2.5
3
3.5
1992 1993 1994 1995 1996 1997 1998 1999 2000 2001 2002 2003 2004 2005
Win
ter-
sprin
g (m
illio
n ce
lls L
-1)
0.0001
0.001
0.01
0.1
1
1992 1993 1994 1995 1996 1997 1998 1999 2000 2001 2002 2003 2004 2005
Sum
mer
(mill
ion
cells
L-1
)
pre-discharge discharge caution level
Figure 3-4. Winter/spring and summer seasonal mean nearfield Phaeocystis abundance (million cells
L-1) for 1992 to 2005. Contingency Plan threshold values shown as dotted lines. (Note log-axis on summer plot).
2005 Annual Water Column Monitoring Report November 2006
3-9
3.4 2005 Alexandrium fundyense Bloom The extraordinary 2005 Alexandrium fundyense bloom was due to an unusual and unprecedented confluence of factors (Anderson et al. 2005a). The bloom received widespread media, public, and scientific attention due to the threat of PSP. These toxins accumulate in filter-feeding shellfish and pose a human health risk through the ingestion of contaminated animals. As a result of the unprecedented A. fundyense bloom and associated PSP toxicity, extensive shellfishery closures were activated from Eastern Maine to the southwest into Massachusetts and Cape Cod Bays, and as far south as Nantucket and Martha’s Vineyard. There was also a federal closure of ~40,000 km2 offshore waters off of New Hampshire and Massachusetts. The 2005 bloom has been the focus of numerous briefings, presentations and papers. This report summarizes the understanding of the bloom as of mid 2006, characterizes conditions in the bays, and provides initial findings from analyses of the phytoplankton community structure.
3.4.1 Bloom Development and Transport into the Bays The input of Gulf of Maine water to Massachusetts and Cape Cod Bays has a major influence on circulation, water properties, and biology within the bays (Beardsley et al. 1997; Anderson 1997). Massachusetts and Cape Cod Bays are clearly part of, and influenced by, the Gulf of Maine. Understanding this connection, and taking it into account, is critical in assessing the relative impact that the MWRA outfall has on water quality in Massachusetts and Cape Cod Bays. The importance and connectivity of the Gulf of Maine to Massachusetts Bay was accentuated in 2005 during the extraordinary A. fundyense bloom.
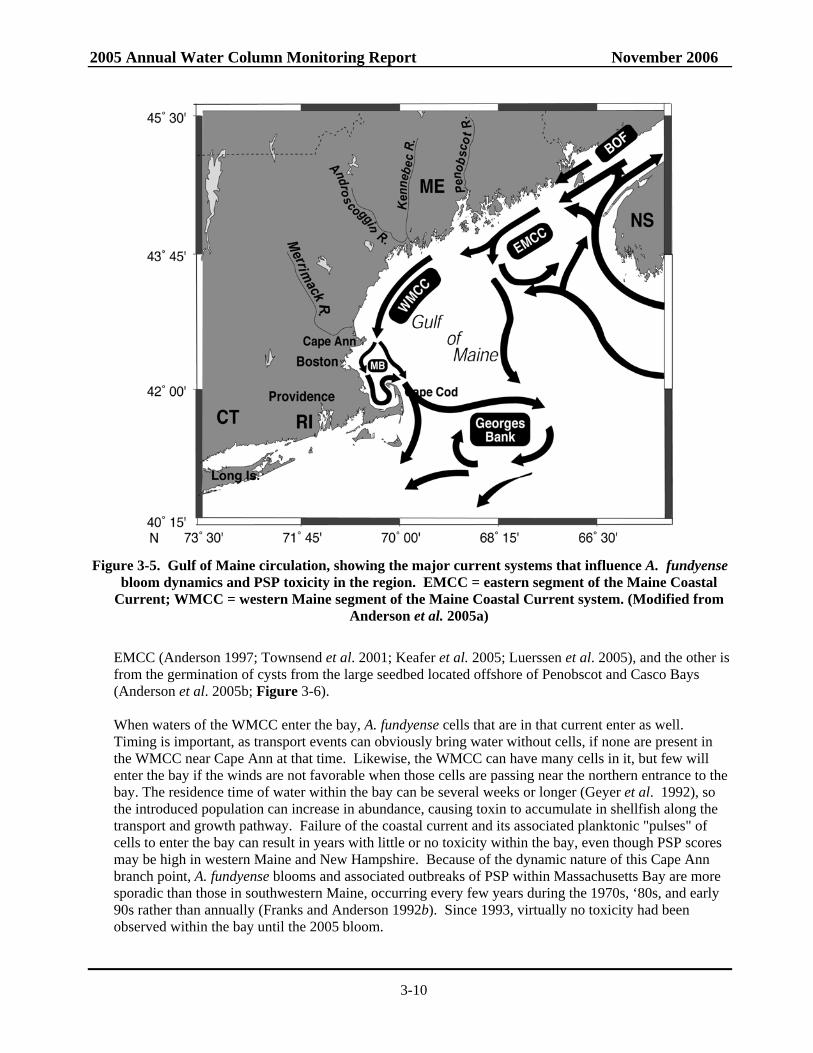
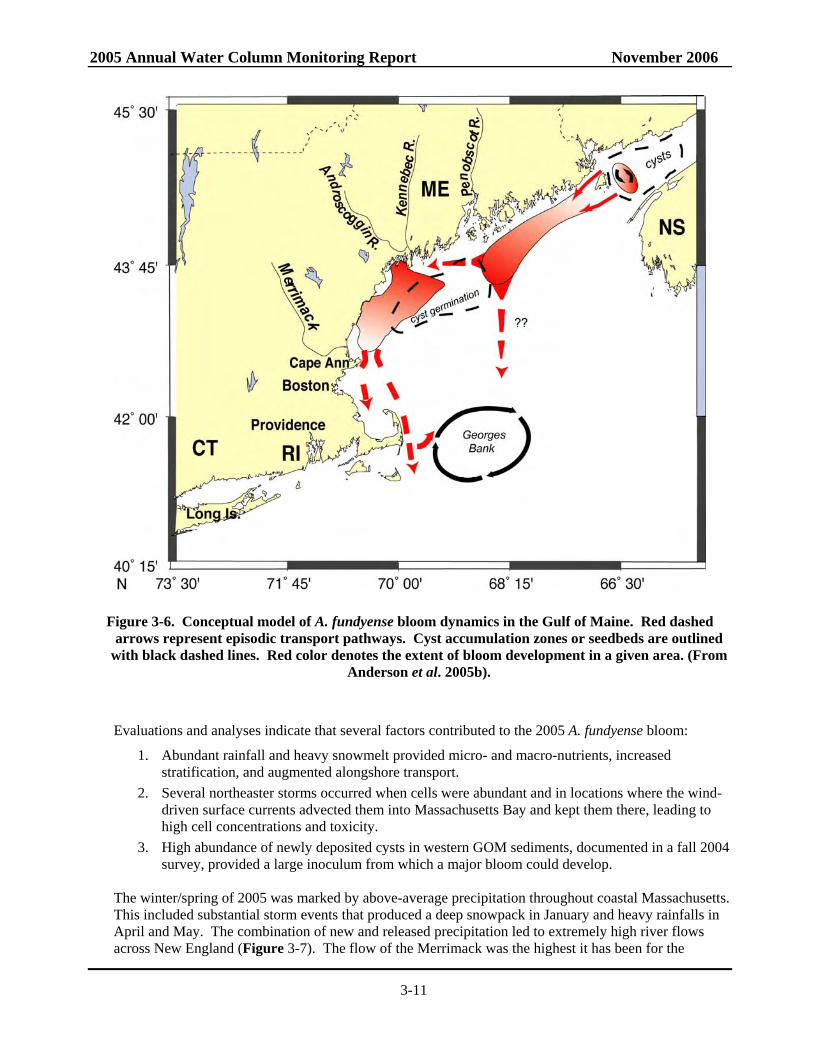
There are several transport pathways involved in A. fundyense dynamics that are related to the regional circulation in the GOM (Figure 3-5). Circulation tends to be counterclockwise (Bigelow 1927; Brooks 1985), with southwestward flow along the coast of Maine driven by freshwater inflows from the Scotian Shelf overlying salty slope water input through the Northeast Channel and filling Jordan Basin. This region is also influenced by several rivers that empty into the western GOM. These riverine influences overlie the general circulation and extend southwestward along the coast and sometimes into Massachusetts Bay (Butman 1975; Franks and Anderson 1992a; Geyer et al. 1992). A key feature of GOM circulation is the Maine Coastal Current System (MCC), described by Lynch et al. (1997) as a composite of seven legs or segments with multiple branch points (Figure 3-5). The branch point of most interest for this discussion is near Cape Ann, Massachusetts, where WMCC water can enter Massachusetts/Cape Cod Bay system or it can predominantly bypass the bay, with water traveling along the eastern flank of Stellwagen Bank. Optimal conditions for input usually occur during the spring when winds out of the northeast bring significant freshwater inflow from the Gulf into the bays and transport generally follows the counterclockwise path along the coast to Cape Cod Bay. The Merrimack River and rivers further north in the Gulf of Maine (including the St. John) provide most of the freshwater inflow to Massachusetts Bay (Manohar-Maharaj and Beardsley 1973; Geyer et al. 2004). Although they do not empty directly into the bay, their flow is much greater than the Charles River and other Massachusetts Bay rivers. A conceptual model was developed during the Ecology of Harmful Algal Blooms (ECOHAB) - Gulf of Maine program that explains many aspects of the blooms of A. fundyense (Anderson et al. 2005b; McGillicuddy et al. 2005). At the foundation of the model are cyst “seedbeds” in the sediments of the Bay of Fundy and the western Gulf of Maine south of the mouth of the Penobscot River (Figure 3-6). These serve as the inoculum for A. fundyense blooms in both the EMCC and WMCC, respectively. Thus, the A. fundyense populations that cause PSP problems in the western Gulf, including Massachusetts Bay, have two possible origins. One is from cells delivered to the WMCC from the
2005 Annual Water Column Monitoring Report November 2006
3-10
Figure 3-5. Gulf of Maine circulation, showing the major current systems that influence A. fundyense
bloom dynamics and PSP toxicity in the region. EMCC = eastern segment of the Maine Coastal Current; WMCC = western Maine segment of the Maine Coastal Current system. (Modified from
Anderson et al. 2005a)
EMCC (Anderson 1997; Townsend et al. 2001; Keafer et al. 2005; Luerssen et al. 2005), and the other is from the germination of cysts from the large seedbed located offshore of Penobscot and Casco Bays (Anderson et al. 2005b; Figure 3-6). When waters of the WMCC enter the bay, A. fundyense cells that are in that current enter as well. Timing is important, as transport events can obviously bring water without cells, if none are present in the WMCC near Cape Ann at that time. Likewise, the WMCC can have many cells in it, but few will enter the bay if the winds are not favorable when those cells are passing near the northern entrance to the bay. The residence time of water within the bay can be several weeks or longer (Geyer et al. 1992), so the introduced population can increase in abundance, causing toxin to accumulate in shellfish along the transport and growth pathway. Failure of the coastal current and its associated planktonic "pulses" of cells to enter the bay can result in years with little or no toxicity within the bay, even though PSP scores may be high in western Maine and New Hampshire. Because of the dynamic nature of this Cape Ann branch point, A. fundyense blooms and associated outbreaks of PSP within Massachusetts Bay are more sporadic than those in southwestern Maine, occurring every few years during the 1970s, ‘80s, and early 90s rather than annually (Franks and Anderson 1992b). Since 1993, virtually no toxicity had been observed within the bay until the 2005 bloom.
2005 Annual Water Column Monitoring Report November 2006
3-11
Figure 3-6. Conceptual model of A. fundyense bloom dynamics in the Gulf of Maine. Red dashed
arrows represent episodic transport pathways. Cyst accumulation zones or seedbeds are outlined with black dashed lines. Red color denotes the extent of bloom development in a given area. (From
Anderson et al. 2005b).
Evaluations and analyses indicate that several factors contributed to the 2005 A. fundyense bloom:
1. Abundant rainfall and heavy snowmelt provided micro- and macro-nutrients, increased stratification, and augmented alongshore transport.
2. Several northeaster storms occurred when cells were abundant and in locations where the wind-driven surface currents advected them into Massachusetts Bay and kept them there, leading to high cell concentrations and toxicity.
3. High abundance of newly deposited cysts in western GOM sediments, documented in a fall 2004 survey, provided a large inoculum from which a major bloom could develop.
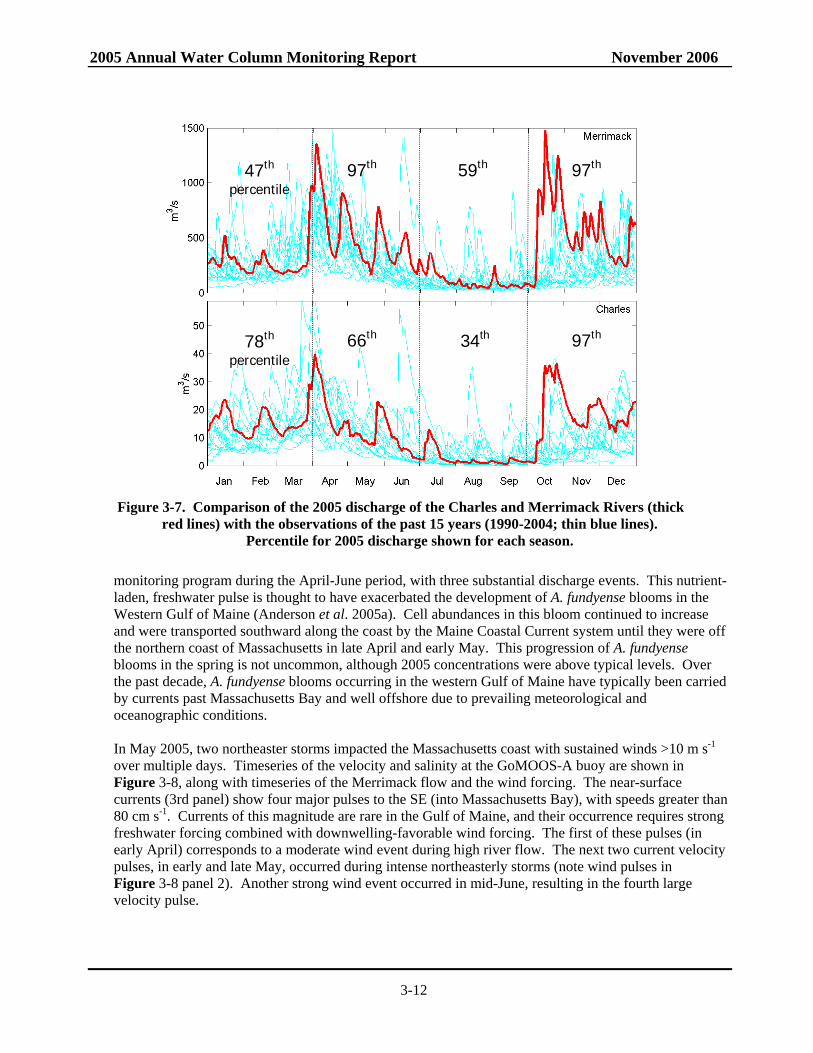
The winter/spring of 2005 was marked by above-average precipitation throughout coastal Massachusetts. This included substantial storm events that produced a deep snowpack in January and heavy rainfalls in April and May. The combination of new and released precipitation led to extremely high river flows across New England (Figure 3-7). The flow of the Merrimack was the highest it has been for the
2005 Annual Water Column Monitoring Report November 2006
3-12
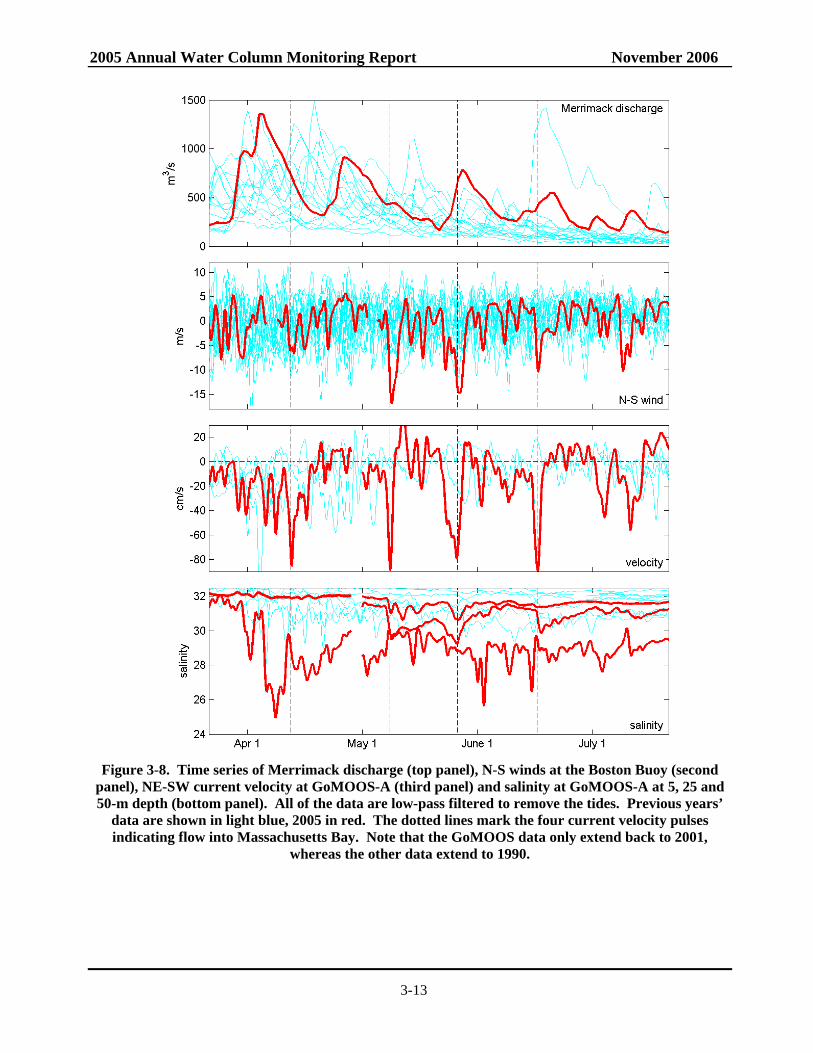
monitoring program during the April-June period, with three substantial discharge events. This nutrient-laden, freshwater pulse is thought to have exacerbated the development of A. fundyense blooms in the Western Gulf of Maine (Anderson et al. 2005a). Cell abundances in this bloom continued to increase and were transported southward along the coast by the Maine Coastal Current system until they were off the northern coast of Massachusetts in late April and early May. This progression of A. fundyense blooms in the spring is not uncommon, although 2005 concentrations were above typical levels. Over the past decade, A. fundyense blooms occurring in the western Gulf of Maine have typically been carried by currents past Massachusetts Bay and well offshore due to prevailing meteorological and oceanographic conditions. In May 2005, two northeaster storms impacted the Massachusetts coast with sustained winds >10 m s-1 over multiple days. Timeseries of the velocity and salinity at the GoMOOS-A buoy are shown in Figure 3-8, along with timeseries of the Merrimack flow and the wind forcing. The near-surface currents (3rd panel) show four major pulses to the SE (into Massachusetts Bay), with speeds greater than 80 cm s-1. Currents of this magnitude are rare in the Gulf of Maine, and their occurrence requires strong freshwater forcing combined with downwelling-favorable wind forcing. The first of these pulses (in early April) corresponds to a moderate wind event during high river flow. The next two current velocity pulses, in early and late May, occurred during intense northeasterly storms (note wind pulses in Figure 3-8 panel 2). Another strong wind event occurred in mid-June, resulting in the fourth large velocity pulse.
97th 47th
percentile 59th 97th
66th 78th
percentile 97th 34th
Figure 3-7. Comparison of the 2005 discharge of the Charles and Merrimack Rivers (thick
red lines) with the observations of the past 15 years (1990-2004; thin blue lines). Percentile for 2005 discharge shown for each season.
2005 Annual Water Column Monitoring Report November 2006
3-13
Figure 3-8. Time series of Merrimack discharge (top panel), N-S winds at the Boston Buoy (second
panel), NE-SW current velocity at GoMOOS-A (third panel) and salinity at GoMOOS-A at 5, 25 and 50-m depth (bottom panel). All of the data are low-pass filtered to remove the tides. Previous years’
data are shown in light blue, 2005 in red. The dotted lines mark the four current velocity pulses indicating flow into Massachusetts Bay. Note that the GoMOOS data only extend back to 2001,
whereas the other data extend to 1990.
2005 Annual Water Column Monitoring Report November 2006
3-14
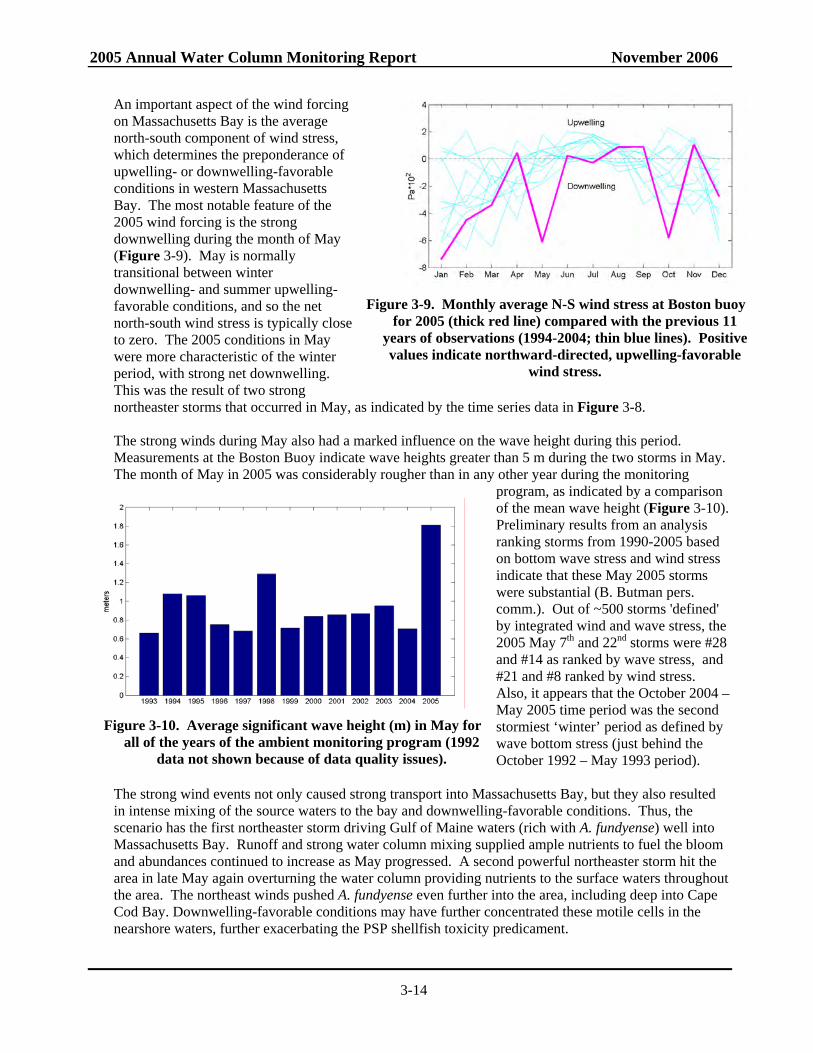
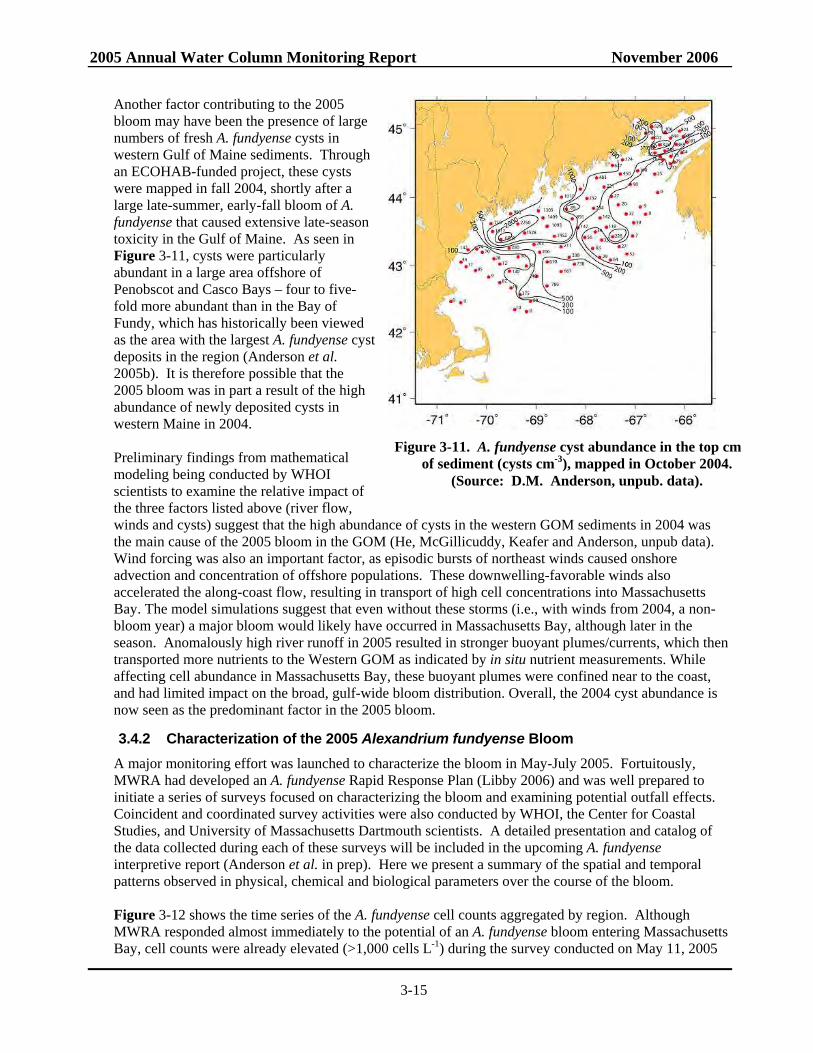
An important aspect of the wind forcing on Massachusetts Bay is the average north-south component of wind stress, which determines the preponderance of upwelling- or downwelling-favorable conditions in western Massachusetts Bay. The most notable feature of the 2005 wind forcing is the strong downwelling during the month of May (Figure 3-9). May is normally transitional between winter downwelling- and summer upwelling- favorable conditions, and so the net north-south wind stress is typically close to zero. The 2005 conditions in May were more characteristic of the winter period, with strong net downwelling. This was the result of two strong northeaster storms that occurred in May, as indicated by the time series data in Figure 3-8. The strong winds during May also had a marked influence on the wave height during this period. Measurements at the Boston Buoy indicate wave heights greater than 5 m during the two storms in May. The month of May in 2005 was considerably rougher than in any other year during the monitoring
program, as indicated by a comparison of the mean wave height (Figure 3-10). Preliminary results from an analysis ranking storms from 1990-2005 based on bottom wave stress and wind stress indicate that these May 2005 storms were substantial (B. Butman pers. comm.). Out of ~500 storms 'defined' by integrated wind and wave stress, the 2005 May 7th and 22nd storms were #28 and #14 as ranked by wave stress, and #21 and #8 ranked by wind stress. Also, it appears that the October 2004 – May 2005 time period was the second stormiest ‘winter’ period as defined by wave bottom stress (just behind the October 1992 – May 1993 period).
The strong wind events not only caused strong transport into Massachusetts Bay, but they also resulted in intense mixing of the source waters to the bay and downwelling-favorable conditions. Thus, the scenario has the first northeaster storm driving Gulf of Maine waters (rich with A. fundyense) well into Massachusetts Bay. Runoff and strong water column mixing supplied ample nutrients to fuel the bloom and abundances continued to increase as May progressed. A second powerful northeaster storm hit the area in late May again overturning the water column providing nutrients to the surface waters throughout the area. The northeast winds pushed A. fundyense even further into the area, including deep into Cape Cod Bay. Downwelling-favorable conditions may have further concentrated these motile cells in the nearshore waters, further exacerbating the PSP shellfish toxicity predicament.
Figure 3-9. Monthly average N-S wind stress at Boston buoy
for 2005 (thick red line) compared with the previous 11 years of observations (1994-2004; thin blue lines). Positive values indicate northward-directed, upwelling-favorable
wind stress.
Figure 3-10. Average significant wave height (m) in May for
all of the years of the ambient monitoring program (1992 data not shown because of data quality issues).
2005 Annual Water Column Monitoring Report November 2006
3-15
Another factor contributing to the 2005 bloom may have been the presence of large numbers of fresh A. fundyense cysts in western Gulf of Maine sediments. Through an ECOHAB-funded project, these cysts were mapped in fall 2004, shortly after a large late-summer, early-fall bloom of A. fundyense that caused extensive late-season toxicity in the Gulf of Maine. As seen in Figure 3-11, cysts were particularly abundant in a large area offshore of Penobscot and Casco Bays – four to five-fold more abundant than in the Bay of Fundy, which has historically been viewed as the area with the largest A. fundyense cyst deposits in the region (Anderson et al. 2005b). It is therefore possible that the 2005 bloom was in part a result of the high abundance of newly deposited cysts in western Maine in 2004. Preliminary findings from mathematical modeling being conducted by WHOI scientists to examine the relative impact of the three factors listed above (river flow, winds and cysts) suggest that the high abundance of cysts in the western GOM sediments in 2004 was the main cause of the 2005 bloom in the GOM (He, McGillicuddy, Keafer and Anderson, unpub data). Wind forcing was also an important factor, as episodic bursts of northeast winds caused onshore advection and concentration of offshore populations. These downwelling-favorable winds also accelerated the along-coast flow, resulting in transport of high cell concentrations into Massachusetts Bay. The model simulations suggest that even without these storms (i.e., with winds from 2004, a non-bloom year) a major bloom would likely have occurred in Massachusetts Bay, although later in the season. Anomalously high river runoff in 2005 resulted in stronger buoyant plumes/currents, which then transported more nutrients to the Western GOM as indicated by in situ nutrient measurements. While affecting cell abundance in Massachusetts Bay, these buoyant plumes were confined near to the coast, and had limited impact on the broad, gulf-wide bloom distribution. Overall, the 2004 cyst abundance is now seen as the predominant factor in the 2005 bloom.
3.4.2 Characterization of the 2005 Alexandrium fundyense Bloom A major monitoring effort was launched to characterize the bloom in May-July 2005. Fortuitously, MWRA had developed an A. fundyense Rapid Response Plan (Libby 2006) and was well prepared to initiate a series of surveys focused on characterizing the bloom and examining potential outfall effects. Coincident and coordinated survey activities were also conducted by WHOI, the Center for Coastal Studies, and University of Massachusetts Dartmouth scientists. A detailed presentation and catalog of the data collected during each of these surveys will be included in the upcoming A. fundyense interpretive report (Anderson et al. in prep). Here we present a summary of the spatial and temporal patterns observed in physical, chemical and biological parameters over the course of the bloom. Figure 3-12 shows the time series of the A. fundyense cell counts aggregated by region. Although MWRA responded almost immediately to the potential of an A. fundyense bloom entering Massachusetts Bay, cell counts were already elevated (>1,000 cells L-1) during the survey conducted on May 11, 2005
Figure 3-11. A. fundyense cyst abundance in the top cm
of sediment (cysts cm-3), mapped in October 2004. (Source: D.M. Anderson, unpub. data).
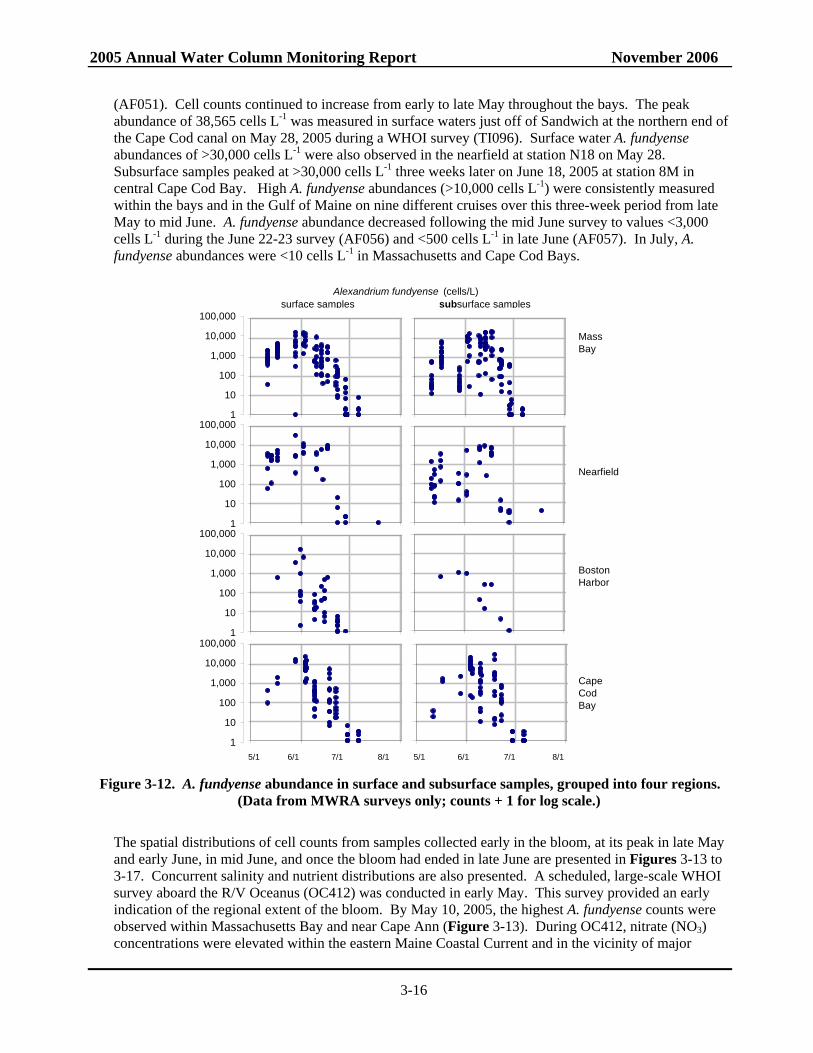
2005 Annual Water Column Monitoring Report November 2006
3-16
(AF051). Cell counts continued to increase from early to late May throughout the bays. The peak abundance of 38,565 cells L-1 was measured in surface waters just off of Sandwich at the northern end of the Cape Cod canal on May 28, 2005 during a WHOI survey (TI096). Surface water A. fundyense abundances of >30,000 cells L-1 were also observed in the nearfield at station N18 on May 28. Subsurface samples peaked at >30,000 cells L-1 three weeks later on June 18, 2005 at station 8M in central Cape Cod Bay. High A. fundyense abundances (>10,000 cells L-1) were consistently measured within the bays and in the Gulf of Maine on nine different cruises over this three-week period from late May to mid June. A. fundyense abundance decreased following the mid June survey to values <3,000 cells L-1 during the June 22-23 survey (AF056) and <500 cells L-1 in late June (AF057). In July, A. fundyense abundances were <10 cells L-1 in Massachusetts and Cape Cod Bays.
MassBay
Nearfield
BostonHarbor
CapeCodBay
Alexandrium fundyense (cells/L)surface samples subsurface samples
1
10
100
1,000
10,000
100,000
1
10
100
1,000
10,000
100,000
1
10
100
1,000
10,000
100,000
1
10
100
1,000
10,000
100,000
5/1 6/1 7/1 8/1 5/1 6/1 7/1 8/1 Figure 3-12. A. fundyense abundance in surface and subsurface samples, grouped into four regions.
(Data from MWRA surveys only; counts + 1 for log scale.)
The spatial distributions of cell counts from samples collected early in the bloom, at its peak in late May and early June, in mid June, and once the bloom had ended in late June are presented in Figures 3-13 to 3-17. Concurrent salinity and nutrient distributions are also presented. A scheduled, large-scale WHOI survey aboard the R/V Oceanus (OC412) was conducted in early May. This survey provided an early indication of the regional extent of the bloom. By May 10, 2005, the highest A. fundyense counts were observed within Massachusetts Bay and near Cape Ann (Figure 3-13). During OC412, nitrate (NO3) concentrations were elevated within the eastern Maine Coastal Current and in the vicinity of major
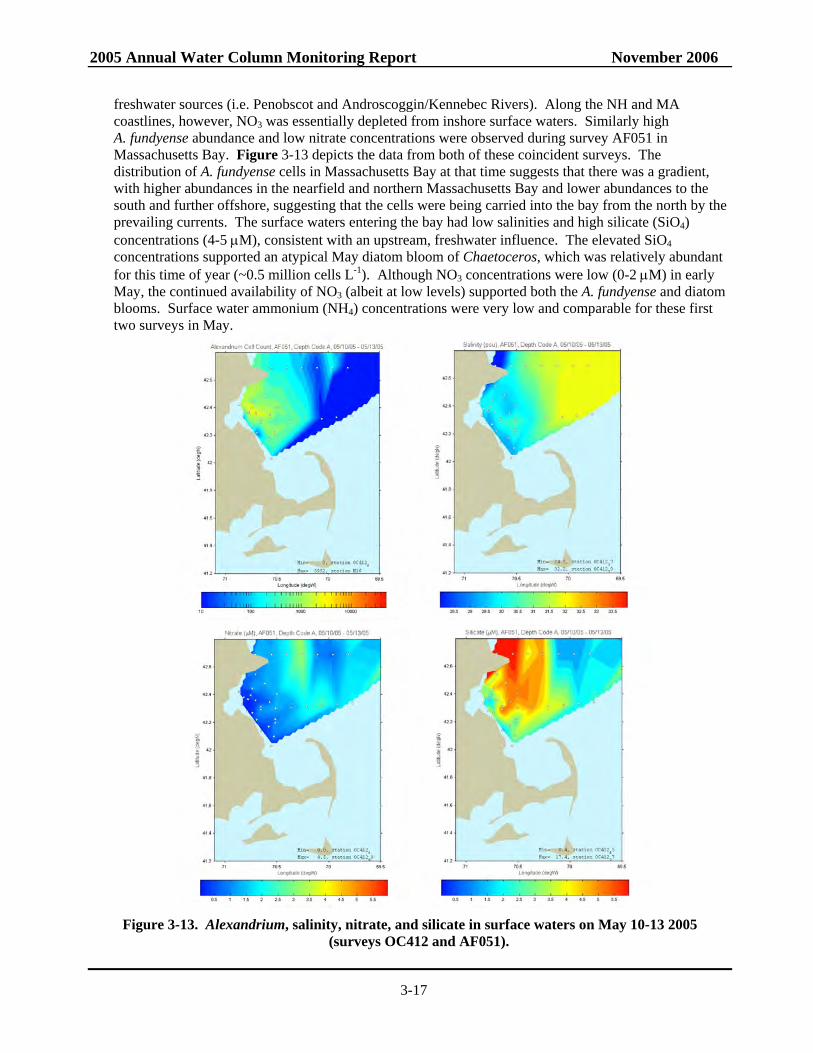
2005 Annual Water Column Monitoring Report November 2006
3-17
freshwater sources (i.e. Penobscot and Androscoggin/Kennebec Rivers). Along the NH and MA coastlines, however, NO3 was essentially depleted from inshore surface waters. Similarly high A. fundyense abundance and low nitrate concentrations were observed during survey AF051 in Massachusetts Bay. Figure 3-13 depicts the data from both of these coincident surveys. The distribution of A. fundyense cells in Massachusetts Bay at that time suggests that there was a gradient, with higher abundances in the nearfield and northern Massachusetts Bay and lower abundances to the south and further offshore, suggesting that the cells were being carried into the bay from the north by the prevailing currents. The surface waters entering the bay had low salinities and high silicate (SiO4) concentrations (4-5 µM), consistent with an upstream, freshwater influence. The elevated SiO4 concentrations supported an atypical May diatom bloom of Chaetoceros, which was relatively abundant for this time of year (~0.5 million cells L-1). Although NO3 concentrations were low (0-2 µM) in early May, the continued availability of NO3 (albeit at low levels) supported both the A. fundyense and diatom blooms. Surface water ammonium (NH4) concentrations were very low and comparable for these first two surveys in May.
Figure 3-13. Alexandrium, salinity, nitrate, and silicate in surface waters on May 10-13 2005
(surveys OC412 and AF051).
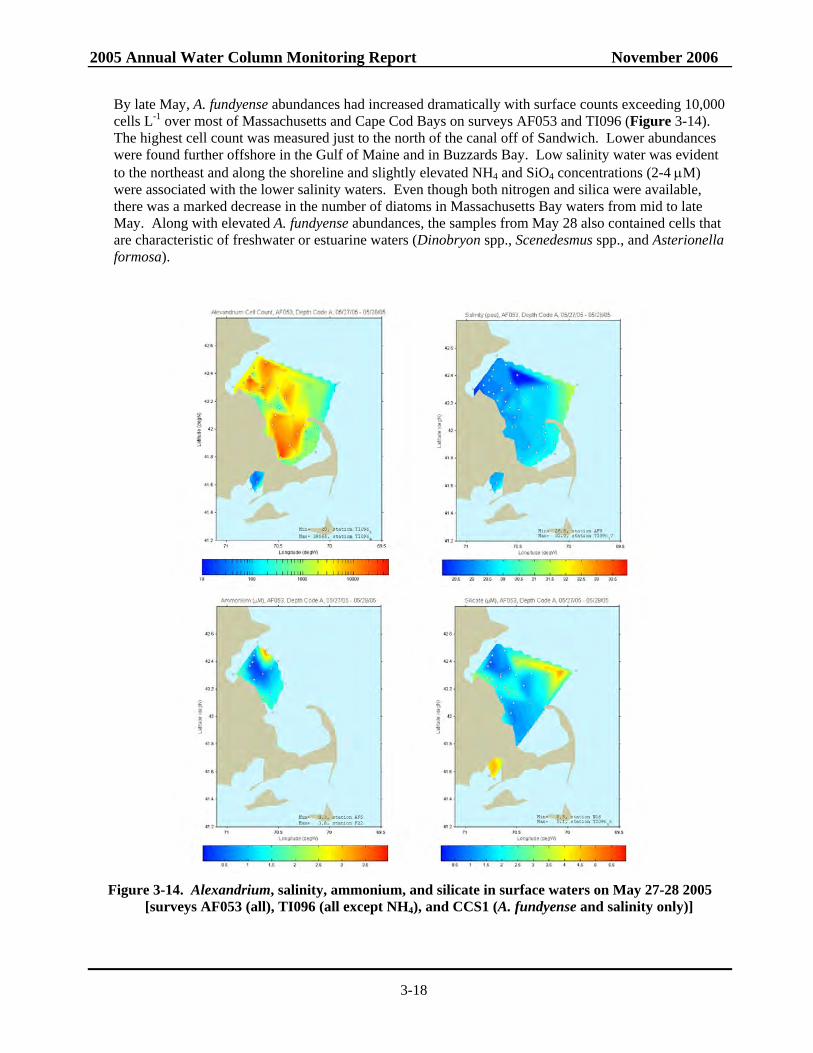
2005 Annual Water Column Monitoring Report November 2006
3-18
By late May, A. fundyense abundances had increased dramatically with surface counts exceeding 10,000 cells L-1 over most of Massachusetts and Cape Cod Bays on surveys AF053 and TI096 (Figure 3-14). The highest cell count was measured just to the north of the canal off of Sandwich. Lower abundances were found further offshore in the Gulf of Maine and in Buzzards Bay. Low salinity water was evident to the northeast and along the shoreline and slightly elevated NH4 and SiO4 concentrations (2-4 µM) were associated with the lower salinity waters. Even though both nitrogen and silica were available, there was a marked decrease in the number of diatoms in Massachusetts Bay waters from mid to late May. Along with elevated A. fundyense abundances, the samples from May 28 also contained cells that are characteristic of freshwater or estuarine waters (Dinobryon spp., Scenedesmus spp., and Asterionella formosa).
Figure 3-14. Alexandrium, salinity, ammonium, and silicate in surface waters on May 27-28 2005
[surveys AF053 (all), TI096 (all except NH4), and CCS1 (A. fundyense and salinity only)]
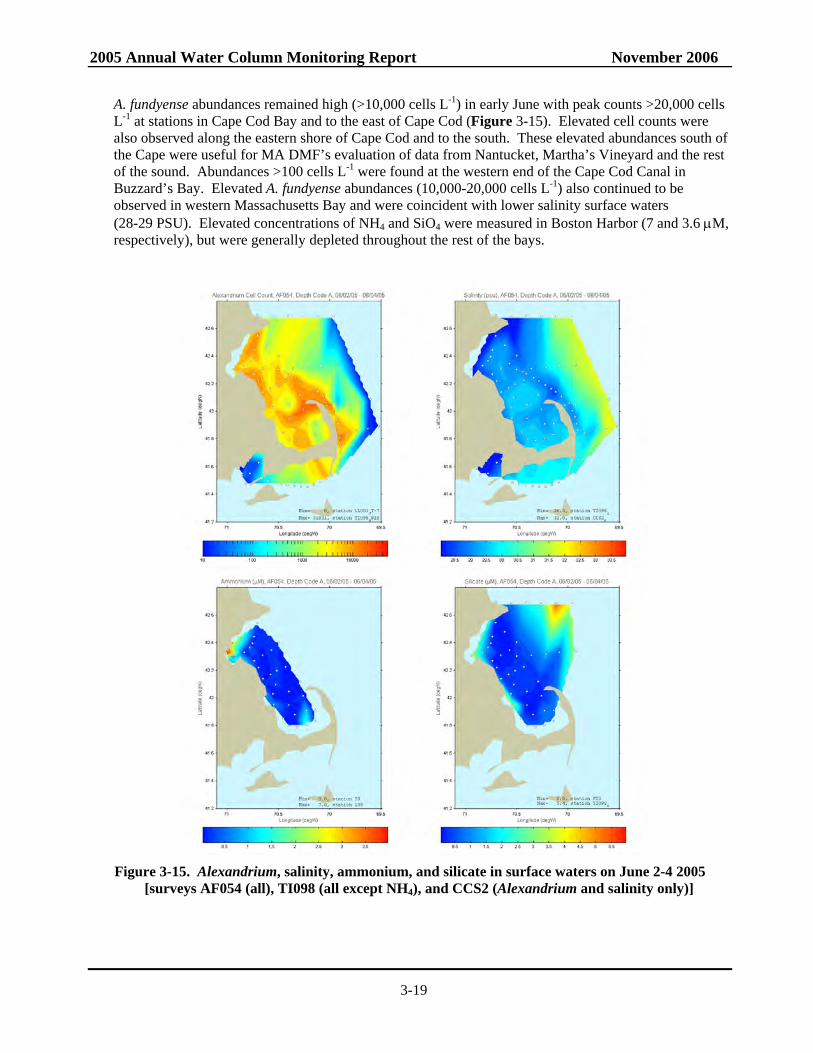
2005 Annual Water Column Monitoring Report November 2006
3-19
A. fundyense abundances remained high (>10,000 cells L-1) in early June with peak counts >20,000 cells L-1 at stations in Cape Cod Bay and to the east of Cape Cod (Figure 3-15). Elevated cell counts were also observed along the eastern shore of Cape Cod and to the south. These elevated abundances south of the Cape were useful for MA DMF’s evaluation of data from Nantucket, Martha’s Vineyard and the rest of the sound. Abundances >100 cells L-1 were found at the western end of the Cape Cod Canal in Buzzard’s Bay. Elevated A. fundyense abundances (10,000-20,000 cells L-1) also continued to be observed in western Massachusetts Bay and were coincident with lower salinity surface waters (28-29 PSU). Elevated concentrations of NH4 and SiO4 were measured in Boston Harbor (7 and 3.6 µM, respectively), but were generally depleted throughout the rest of the bays.
Figure 3-15. Alexandrium, salinity, ammonium, and silicate in surface waters on June 2-4 2005
[surveys AF054 (all), TI098 (all except NH4), and CCS2 (Alexandrium and salinity only)]
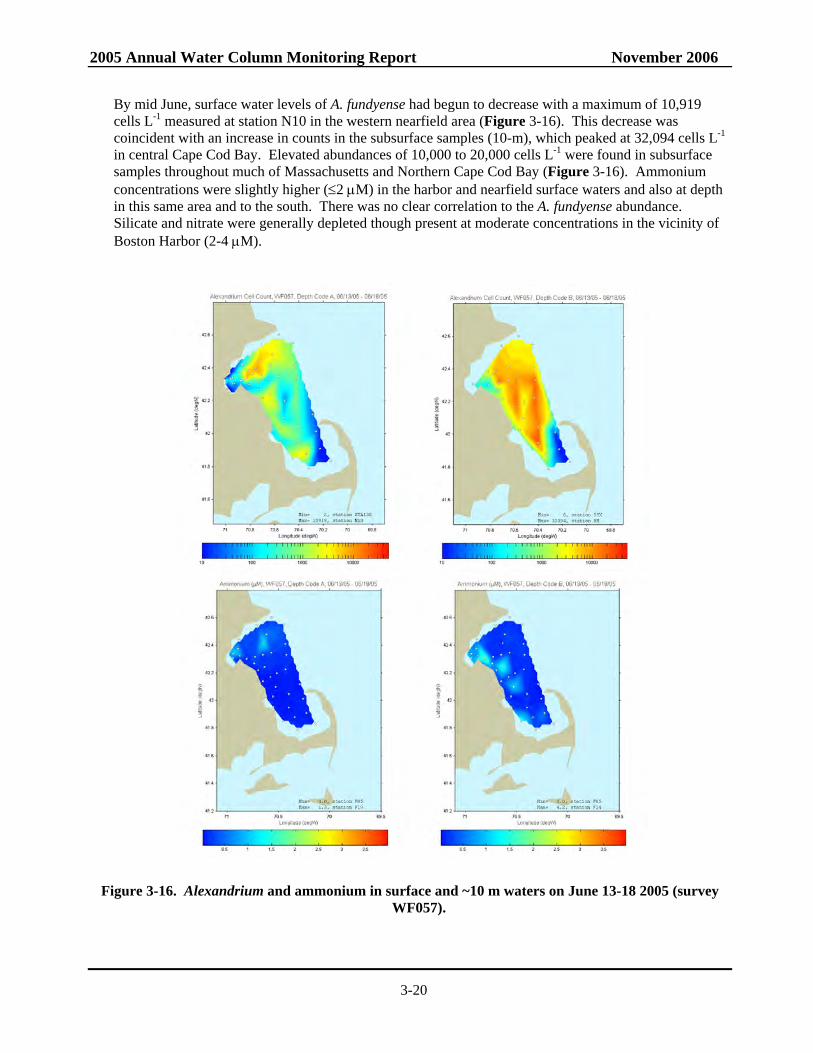
2005 Annual Water Column Monitoring Report November 2006
3-20
By mid June, surface water levels of A. fundyense had begun to decrease with a maximum of 10,919 cells L-1 measured at station N10 in the western nearfield area (Figure 3-16). This decrease was coincident with an increase in counts in the subsurface samples (10-m), which peaked at 32,094 cells L-1 in central Cape Cod Bay. Elevated abundances of 10,000 to 20,000 cells L-1 were found in subsurface samples throughout much of Massachusetts and Northern Cape Cod Bay (Figure 3-16). Ammonium concentrations were slightly higher (≤2 µM) in the harbor and nearfield surface waters and also at depth in this same area and to the south. There was no clear correlation to the A. fundyense abundance. Silicate and nitrate were generally depleted though present at moderate concentrations in the vicinity of Boston Harbor (2-4 µM).
Figure 3-16. Alexandrium and ammonium in surface and ~10 m waters on June 13-18 2005 (survey WF057).
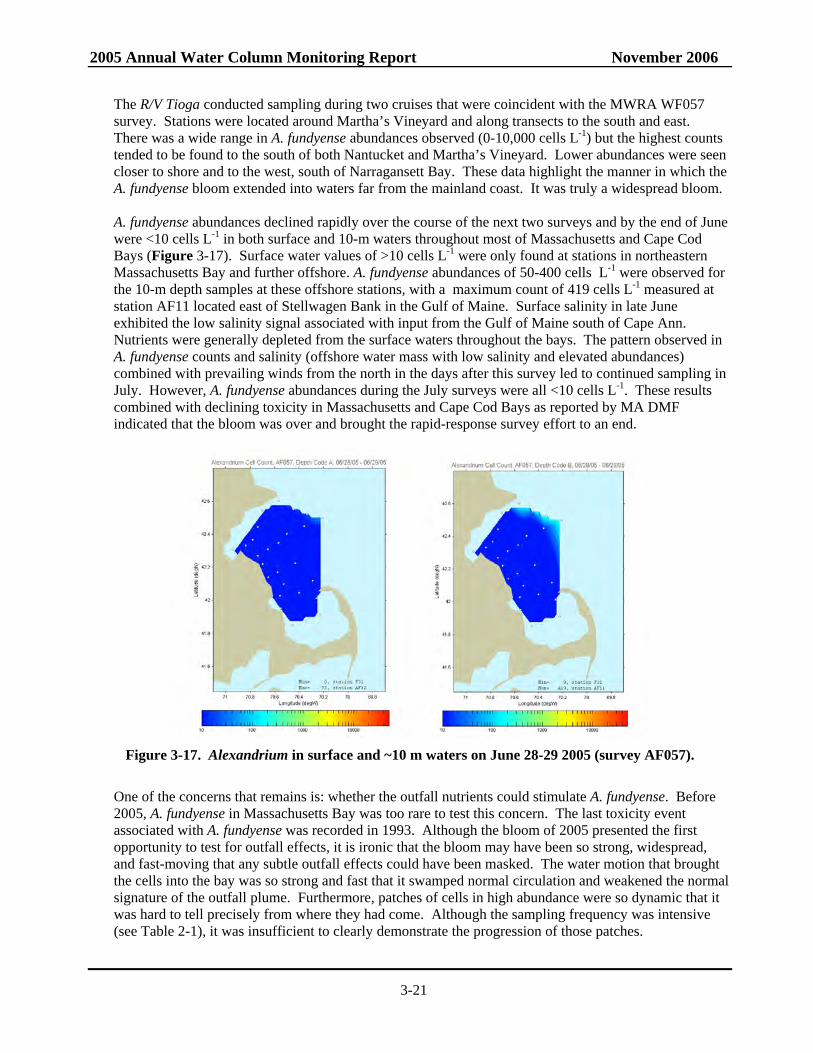
2005 Annual Water Column Monitoring Report November 2006
3-21
The R/V Tioga conducted sampling during two cruises that were coincident with the MWRA WF057 survey. Stations were located around Martha’s Vineyard and along transects to the south and east. There was a wide range in A. fundyense abundances observed (0-10,000 cells L-1) but the highest counts tended to be found to the south of both Nantucket and Martha’s Vineyard. Lower abundances were seen closer to shore and to the west, south of Narragansett Bay. These data highlight the manner in which the A. fundyense bloom extended into waters far from the mainland coast. It was truly a widespread bloom.
A. fundyense abundances declined rapidly over the course of the next two surveys and by the end of June were <10 cells L-1 in both surface and 10-m waters throughout most of Massachusetts and Cape Cod Bays (Figure 3-17). Surface water values of >10 cells L-1 were only found at stations in northeastern Massachusetts Bay and further offshore. A. fundyense abundances of 50-400 cells L-1 were observed for the 10-m depth samples at these offshore stations, with a maximum count of 419 cells L-1 measured at station AF11 located east of Stellwagen Bank in the Gulf of Maine. Surface salinity in late June exhibited the low salinity signal associated with input from the Gulf of Maine south of Cape Ann. Nutrients were generally depleted from the surface waters throughout the bays. The pattern observed in A. fundyense counts and salinity (offshore water mass with low salinity and elevated abundances) combined with prevailing winds from the north in the days after this survey led to continued sampling in July. However, A. fundyense abundances during the July surveys were all <10 cells L-1. These results combined with declining toxicity in Massachusetts and Cape Cod Bays as reported by MA DMF indicated that the bloom was over and brought the rapid-response survey effort to an end.
Figure 3-17. Alexandrium in surface and ~10 m waters on June 28-29 2005 (survey AF057).
One of the concerns that remains is: whether the outfall nutrients could stimulate A. fundyense. Before 2005, A. fundyense in Massachusetts Bay was too rare to test this concern. The last toxicity event associated with A. fundyense was recorded in 1993. Although the bloom of 2005 presented the first opportunity to test for outfall effects, it is ironic that the bloom may have been so strong, widespread, and fast-moving that any subtle outfall effects could have been masked. The water motion that brought the cells into the bay was so strong and fast that it swamped normal circulation and weakened the normal signature of the outfall plume. Furthermore, patches of cells in high abundance were so dynamic that it was hard to tell precisely from where they had come. Although the sampling frequency was intensive (see Table 2-1), it was insufficient to clearly demonstrate the progression of those patches.
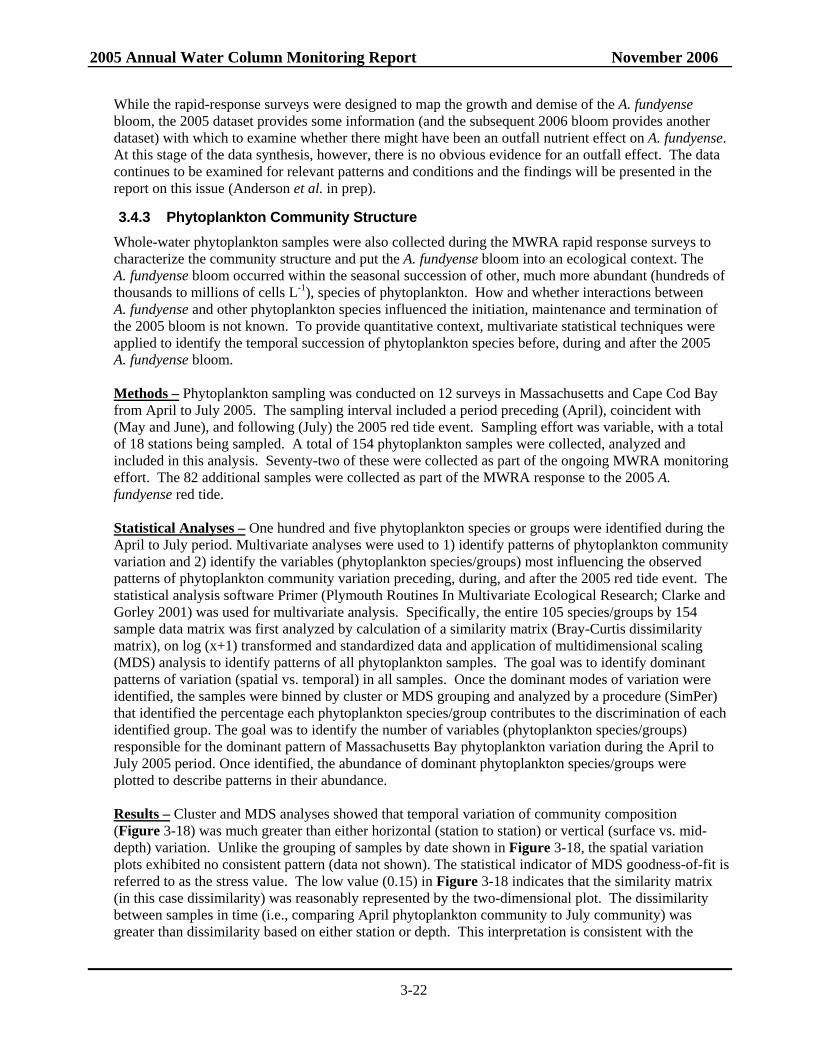
2005 Annual Water Column Monitoring Report November 2006
3-22
While the rapid-response surveys were designed to map the growth and demise of the A. fundyense bloom, the 2005 dataset provides some information (and the subsequent 2006 bloom provides another dataset) with which to examine whether there might have been an outfall nutrient effect on A. fundyense. At this stage of the data synthesis, however, there is no obvious evidence for an outfall effect. The data continues to be examined for relevant patterns and conditions and the findings will be presented in the report on this issue (Anderson et al. in prep).
3.4.3 Phytoplankton Community Structure Whole-water phytoplankton samples were also collected during the MWRA rapid response surveys to characterize the community structure and put the A. fundyense bloom into an ecological context. The A. fundyense bloom occurred within the seasonal succession of other, much more abundant (hundreds of thousands to millions of cells L-1), species of phytoplankton. How and whether interactions between A. fundyense and other phytoplankton species influenced the initiation, maintenance and termination of the 2005 bloom is not known. To provide quantitative context, multivariate statistical techniques were applied to identify the temporal succession of phytoplankton species before, during and after the 2005 A. fundyense bloom. Methods – Phytoplankton sampling was conducted on 12 surveys in Massachusetts and Cape Cod Bay from April to July 2005. The sampling interval included a period preceding (April), coincident with (May and June), and following (July) the 2005 red tide event. Sampling effort was variable, with a total of 18 stations being sampled. A total of 154 phytoplankton samples were collected, analyzed and included in this analysis. Seventy-two of these were collected as part of the ongoing MWRA monitoring effort. The 82 additional samples were collected as part of the MWRA response to the 2005 A. fundyense red tide. Statistical Analyses – One hundred and five phytoplankton species or groups were identified during the April to July period. Multivariate analyses were used to 1) identify patterns of phytoplankton community variation and 2) identify the variables (phytoplankton species/groups) most influencing the observed patterns of phytoplankton community variation preceding, during, and after the 2005 red tide event. The statistical analysis software Primer (Plymouth Routines In Multivariate Ecological Research; Clarke and Gorley 2001) was used for multivariate analysis. Specifically, the entire 105 species/groups by 154 sample data matrix was first analyzed by calculation of a similarity matrix (Bray-Curtis dissimilarity matrix), on log (x+1) transformed and standardized data and application of multidimensional scaling (MDS) analysis to identify patterns of all phytoplankton samples. The goal was to identify dominant patterns of variation (spatial vs. temporal) in all samples. Once the dominant modes of variation were identified, the samples were binned by cluster or MDS grouping and analyzed by a procedure (SimPer) that identified the percentage each phytoplankton species/group contributes to the discrimination of each identified group. The goal was to identify the number of variables (phytoplankton species/groups) responsible for the dominant pattern of Massachusetts Bay phytoplankton variation during the April to July 2005 period. Once identified, the abundance of dominant phytoplankton species/groups were plotted to describe patterns in their abundance. Results – Cluster and MDS analyses showed that temporal variation of community composition (Figure 3-18) was much greater than either horizontal (station to station) or vertical (surface vs. mid-depth) variation. Unlike the grouping of samples by date shown in Figure 3-18, the spatial variation plots exhibited no consistent pattern (data not shown). The statistical indicator of MDS goodness-of-fit is referred to as the stress value. The low value (0.15) in Figure 3-18 indicates that the similarity matrix (in this case dissimilarity) was reasonably represented by the two-dimensional plot. The dissimilarity between samples in time (i.e., comparing April phytoplankton community to July community) was greater than dissimilarity based on either station or depth. This interpretation is consistent with the
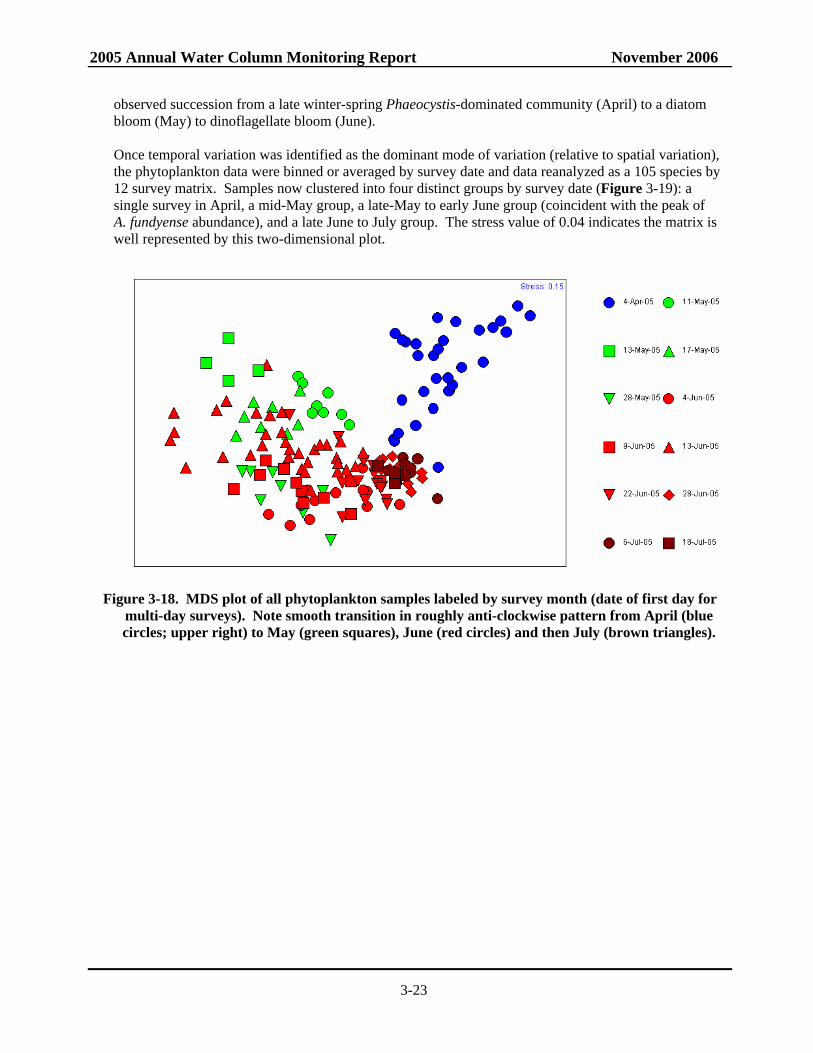
2005 Annual Water Column Monitoring Report November 2006
3-23
observed succession from a late winter-spring Phaeocystis-dominated community (April) to a diatom bloom (May) to dinoflagellate bloom (June). Once temporal variation was identified as the dominant mode of variation (relative to spatial variation), the phytoplankton data were binned or averaged by survey date and data reanalyzed as a 105 species by 12 survey matrix. Samples now clustered into four distinct groups by survey date (Figure 3-19): a single survey in April, a mid-May group, a late-May to early June group (coincident with the peak of A. fundyense abundance), and a late June to July group. The stress value of 0.04 indicates the matrix is well represented by this two-dimensional plot.
Figure 3-18. MDS plot of all phytoplankton samples labeled by survey month (date of first day for
multi-day surveys). Note smooth transition in roughly anti-clockwise pattern from April (blue circles; upper right) to May (green squares), June (red circles) and then July (brown triangles).
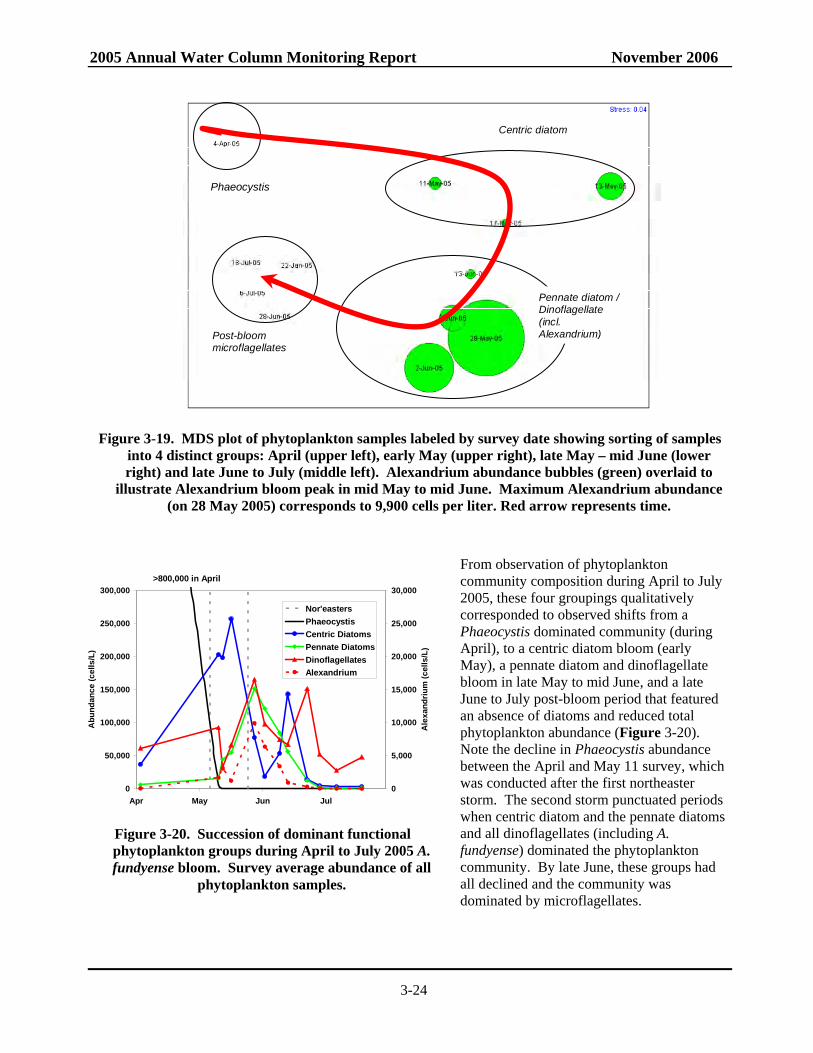
2005 Annual Water Column Monitoring Report November 2006
3-24
Phaeocystis
Centric diatom
Pennate diatom / Dinoflagellate (incl. Alexandrium) Post-bloom
microflagellates
Figure 3-19. MDS plot of phytoplankton samples labeled by survey date showing sorting of samples
into 4 distinct groups: April (upper left), early May (upper right), late May – mid June (lower right) and late June to July (middle left). Alexandrium abundance bubbles (green) overlaid to
illustrate Alexandrium bloom peak in mid May to mid June. Maximum Alexandrium abundance (on 28 May 2005) corresponds to 9,900 cells per liter. Red arrow represents time.
From observation of phytoplankton community composition during April to July 2005, these four groupings qualitatively corresponded to observed shifts from a Phaeocystis dominated community (during April), to a centric diatom bloom (early May), a pennate diatom and dinoflagellate bloom in late May to mid June, and a late June to July post-bloom period that featured an absence of diatoms and reduced total phytoplankton abundance (Figure 3-20). Note the decline in Phaeocystis abundance between the April and May 11 survey, which was conducted after the first northeaster storm. The second storm punctuated periods when centric diatom and the pennate diatoms and all dinoflagellates (including A. fundyense) dominated the phytoplankton community. By late June, these groups had all declined and the community was dominated by microflagellates.
0
50,000
100,000
150,000
200,000
250,000
300,000
Apr May Jun Jul
Abu
ndan
ce (c
ells
/L)
0
5,000
10,000
15,000
20,000
25,000
30,000
Ale
xand
rium
(cel
ls/L
)
Nor'eastersPhaeocystisCentric DiatomsPennate DiatomsDinoflagellatesAlexandrium
>800,000 in April
Figure 3-20. Succession of dominant functional phytoplankton groups during April to July 2005 A. fundyense bloom. Survey average abundance of all
phytoplankton samples.
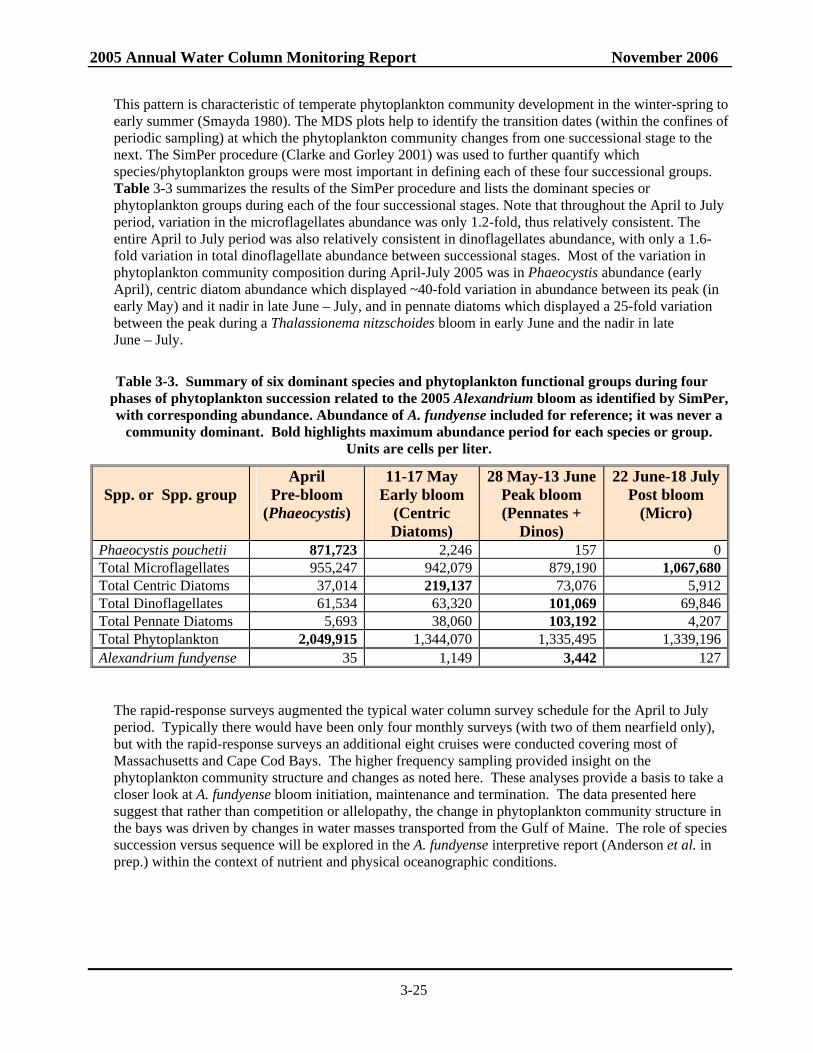
2005 Annual Water Column Monitoring Report November 2006
3-25
This pattern is characteristic of temperate phytoplankton community development in the winter-spring to early summer (Smayda 1980). The MDS plots help to identify the transition dates (within the confines of periodic sampling) at which the phytoplankton community changes from one successional stage to the next. The SimPer procedure (Clarke and Gorley 2001) was used to further quantify which species/phytoplankton groups were most important in defining each of these four successional groups. Table 3-3 summarizes the results of the SimPer procedure and lists the dominant species or phytoplankton groups during each of the four successional stages. Note that throughout the April to July period, variation in the microflagellates abundance was only 1.2-fold, thus relatively consistent. The entire April to July period was also relatively consistent in dinoflagellates abundance, with only a 1.6-fold variation in total dinoflagellate abundance between successional stages. Most of the variation in phytoplankton community composition during April-July 2005 was in Phaeocystis abundance (early April), centric diatom abundance which displayed ~40-fold variation in abundance between its peak (in early May) and it nadir in late June – July, and in pennate diatoms which displayed a 25-fold variation between the peak during a Thalassionema nitzschoides bloom in early June and the nadir in late June – July.
Table 3-3. Summary of six dominant species and phytoplankton functional groups during four phases of phytoplankton succession related to the 2005 Alexandrium bloom as identified by SimPer, with corresponding abundance. Abundance of A. fundyense included for reference; it was never a
community dominant. Bold highlights maximum abundance period for each species or group. Units are cells per liter.
Spp. or Spp. group
April Pre-bloom
(Phaeocystis)
11-17 May Early bloom
(Centric Diatoms)
28 May-13 June Peak bloom (Pennates +
Dinos)
22 June-18 JulyPost bloom
(Micro)
Phaeocystis pouchetii 871,723 2,246 157 0Total Microflagellates 955,247 942,079 879,190 1,067,680Total Centric Diatoms 37,014 219,137 73,076 5,912Total Dinoflagellates 61,534 63,320 101,069 69,846Total Pennate Diatoms 5,693 38,060 103,192 4,207Total Phytoplankton 2,049,915 1,344,070 1,335,495 1,339,196Alexandrium fundyense 35 1,149 3,442 127
The rapid-response surveys augmented the typical water column survey schedule for the April to July period. Typically there would have been only four monthly surveys (with two of them nearfield only), but with the rapid-response surveys an additional eight cruises were conducted covering most of Massachusetts and Cape Cod Bays. The higher frequency sampling provided insight on the phytoplankton community structure and changes as noted here. These analyses provide a basis to take a closer look at A. fundyense bloom initiation, maintenance and termination. The data presented here suggest that rather than competition or allelopathy, the change in phytoplankton community structure in the bays was driven by changes in water masses transported from the Gulf of Maine. The role of species succession versus sequence will be explored in the A. fundyense interpretive report (Anderson et al. in prep.) within the context of nutrient and physical oceanographic conditions.
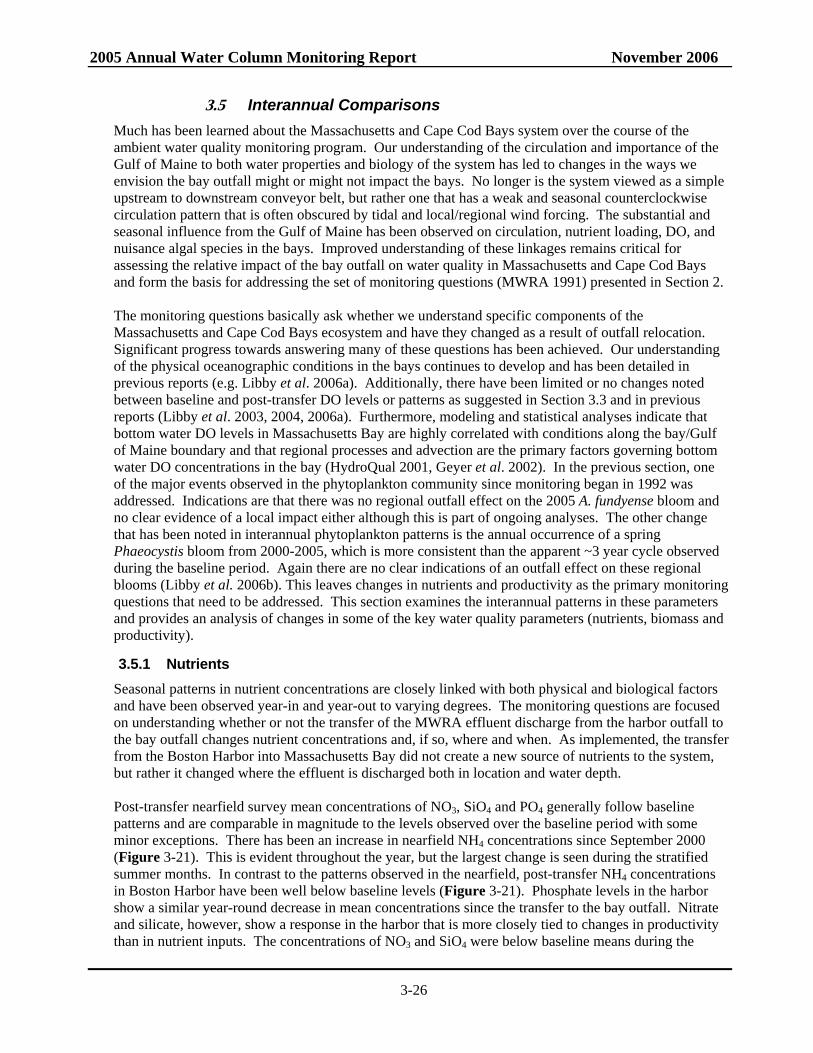
2005 Annual Water Column Monitoring Report November 2006
3-26
3.5 Interannual Comparisons Much has been learned about the Massachusetts and Cape Cod Bays system over the course of the ambient water quality monitoring program. Our understanding of the circulation and importance of the Gulf of Maine to both water properties and biology of the system has led to changes in the ways we envision the bay outfall might or might not impact the bays. No longer is the system viewed as a simple upstream to downstream conveyor belt, but rather one that has a weak and seasonal counterclockwise circulation pattern that is often obscured by tidal and local/regional wind forcing. The substantial and seasonal influence from the Gulf of Maine has been observed on circulation, nutrient loading, DO, and nuisance algal species in the bays. Improved understanding of these linkages remains critical for assessing the relative impact of the bay outfall on water quality in Massachusetts and Cape Cod Bays and form the basis for addressing the set of monitoring questions (MWRA 1991) presented in Section 2. The monitoring questions basically ask whether we understand specific components of the Massachusetts and Cape Cod Bays ecosystem and have they changed as a result of outfall relocation. Significant progress towards answering many of these questions has been achieved. Our understanding of the physical oceanographic conditions in the bays continues to develop and has been detailed in previous reports (e.g. Libby et al. 2006a). Additionally, there have been limited or no changes noted between baseline and post-transfer DO levels or patterns as suggested in Section 3.3 and in previous reports (Libby et al. 2003, 2004, 2006a). Furthermore, modeling and statistical analyses indicate that bottom water DO levels in Massachusetts Bay are highly correlated with conditions along the bay/Gulf of Maine boundary and that regional processes and advection are the primary factors governing bottom water DO concentrations in the bay (HydroQual 2001, Geyer et al. 2002). In the previous section, one of the major events observed in the phytoplankton community since monitoring began in 1992 was addressed. Indications are that there was no regional outfall effect on the 2005 A. fundyense bloom and no clear evidence of a local impact either although this is part of ongoing analyses. The other change that has been noted in interannual phytoplankton patterns is the annual occurrence of a spring Phaeocystis bloom from 2000-2005, which is more consistent than the apparent ~3 year cycle observed during the baseline period. Again there are no clear indications of an outfall effect on these regional blooms (Libby et al. 2006b). This leaves changes in nutrients and productivity as the primary monitoring questions that need to be addressed. This section examines the interannual patterns in these parameters and provides an analysis of changes in some of the key water quality parameters (nutrients, biomass and productivity).
3.5.1 Nutrients Seasonal patterns in nutrient concentrations are closely linked with both physical and biological factors and have been observed year-in and year-out to varying degrees. The monitoring questions are focused on understanding whether or not the transfer of the MWRA effluent discharge from the harbor outfall to the bay outfall changes nutrient concentrations and, if so, where and when. As implemented, the transfer from the Boston Harbor into Massachusetts Bay did not create a new source of nutrients to the system, but rather it changed where the effluent is discharged both in location and water depth.
Post-transfer nearfield survey mean concentrations of NO3, SiO4 and PO4 generally follow baseline patterns and are comparable in magnitude to the levels observed over the baseline period with some minor exceptions. There has been an increase in nearfield NH4 concentrations since September 2000 (Figure 3-21). This is evident throughout the year, but the largest change is seen during the stratified summer months. In contrast to the patterns observed in the nearfield, post-transfer NH4 concentrations in Boston Harbor have been well below baseline levels (Figure 3-21). Phosphate levels in the harbor show a similar year-round decrease in mean concentrations since the transfer to the bay outfall. Nitrate and silicate, however, show a response in the harbor that is more closely tied to changes in productivity than in nutrient inputs. The concentrations of NO3 and SiO4 were below baseline means during the
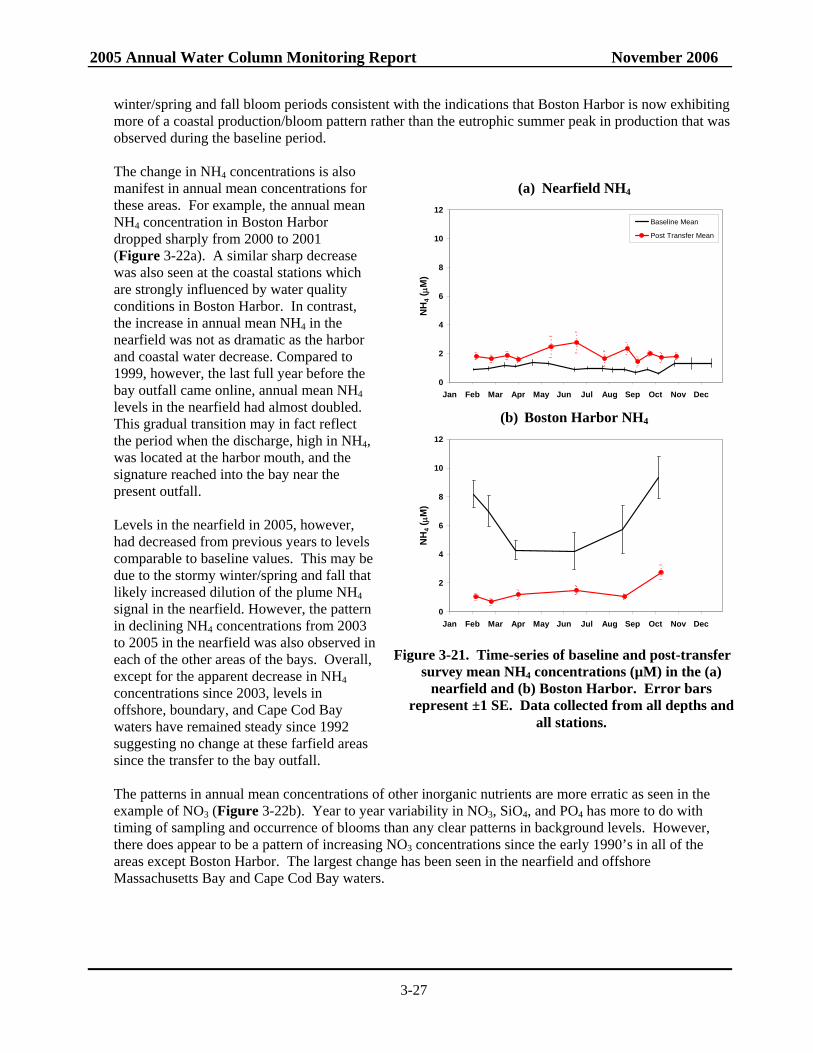
2005 Annual Water Column Monitoring Report November 2006
3-27
winter/spring and fall bloom periods consistent with the indications that Boston Harbor is now exhibiting more of a coastal production/bloom pattern rather than the eutrophic summer peak in production that was observed during the baseline period. The change in NH4 concentrations is also manifest in annual mean concentrations for these areas. For example, the annual mean NH4 concentration in Boston Harbor dropped sharply from 2000 to 2001 (Figure 3-22a). A similar sharp decrease was also seen at the coastal stations which are strongly influenced by water quality conditions in Boston Harbor. In contrast, the increase in annual mean NH4 in the nearfield was not as dramatic as the harbor and coastal water decrease. Compared to 1999, however, the last full year before the bay outfall came online, annual mean NH4 levels in the nearfield had almost doubled. This gradual transition may in fact reflect the period when the discharge, high in NH4, was located at the harbor mouth, and the signature reached into the bay near the present outfall. Levels in the nearfield in 2005, however, had decreased from previous years to levels comparable to baseline values. This may be due to the stormy winter/spring and fall that likely increased dilution of the plume NH4 signal in the nearfield. However, the pattern in declining NH4 concentrations from 2003 to 2005 in the nearfield was also observed in each of the other areas of the bays. Overall, except for the apparent decrease in NH4 concentrations since 2003, levels in offshore, boundary, and Cape Cod Bay waters have remained steady since 1992 suggesting no change at these farfield areas since the transfer to the bay outfall. The patterns in annual mean concentrations of other inorganic nutrients are more erratic as seen in the example of NO3 (Figure 3-22b). Year to year variability in NO3, SiO4, and PO4 has more to do with timing of sampling and occurrence of blooms than any clear patterns in background levels. However, there does appear to be a pattern of increasing NO3 concentrations since the early 1990’s in all of the areas except Boston Harbor. The largest change has been seen in the nearfield and offshore Massachusetts Bay and Cape Cod Bay waters.
(a) Nearfield NH4
0
2
4
6
8
10
12
Jan Feb Mar Apr May Jun Jul Aug Sep Oct Nov Dec
NH
4 (µM
)
Baseline Mean
Post Transfer Mean
(b) Boston Harbor NH4
0
2
4
6
8
10
12
Jan Feb Mar Apr May Jun Jul Aug Sep Oct Nov Dec
NH
4 (µM
)
Figure 3-21. Time-series of baseline and post-transfer
survey mean NH4 concentrations (µM) in the (a) nearfield and (b) Boston Harbor. Error bars
represent ±1 SE. Data collected from all depths and all stations.
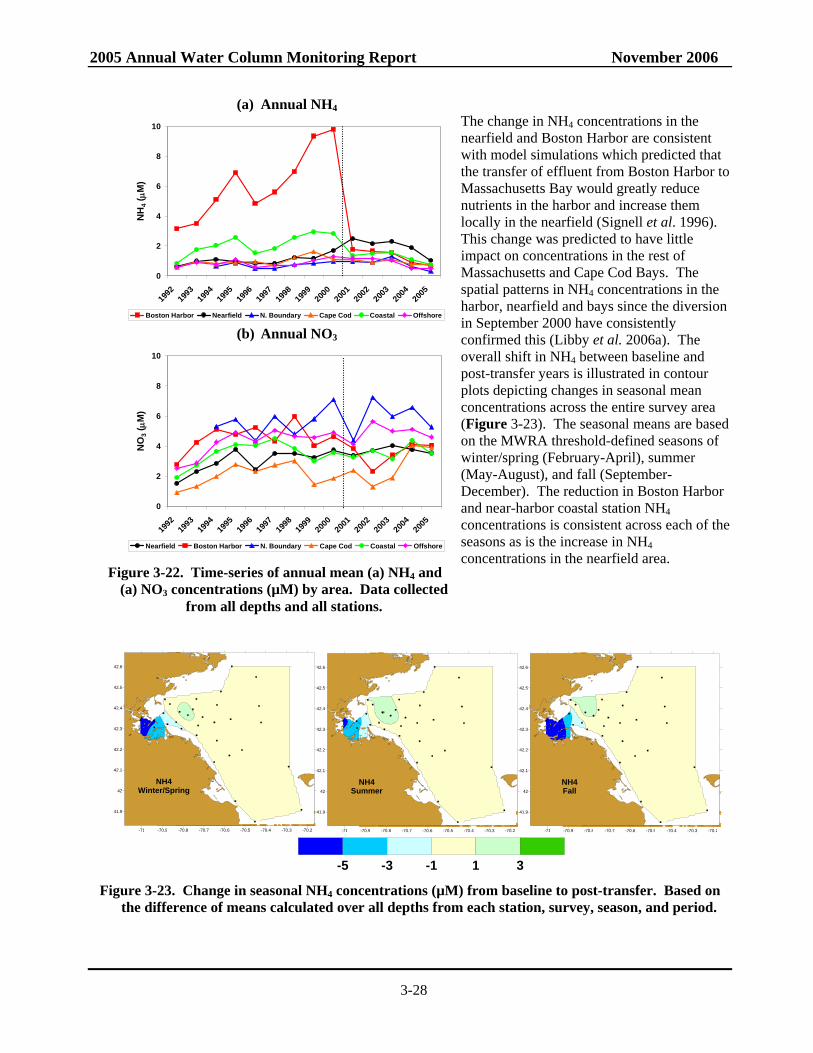
2005 Annual Water Column Monitoring Report November 2006
3-28
The change in NH4 concentrations in the nearfield and Boston Harbor are consistent with model simulations which predicted that the transfer of effluent from Boston Harbor to Massachusetts Bay would greatly reduce nutrients in the harbor and increase them locally in the nearfield (Signell et al. 1996). This change was predicted to have little impact on concentrations in the rest of Massachusetts and Cape Cod Bays. The spatial patterns in NH4 concentrations in the harbor, nearfield and bays since the diversion in September 2000 have consistently confirmed this (Libby et al. 2006a). The overall shift in NH4 between baseline and post-transfer years is illustrated in contour plots depicting changes in seasonal mean concentrations across the entire survey area (Figure 3-23). The seasonal means are based on the MWRA threshold-defined seasons of winter/spring (February-April), summer (May-August), and fall (September-December). The reduction in Boston Harbor and near-harbor coastal station NH4 concentrations is consistent across each of the seasons as is the increase in NH4 concentrations in the nearfield area.
-71 -70.9 -70.8 -70.7 -70.6 -70.5 -70.4 -70.3 -70.2
41.9
42
42.1
42.2
42.3
42.4
42.5
42.6
NH4Winter/Spring
-71 -70.9 -70.8 -70.7 -70.6 -70.5 -70.4 -70.3 -70.2
41.9
42
42.1
42.2
42.3
42.4
42.5
42.6
NH4Summer
-71 -70.9 -70.8 -70.7 -70.6 -70.5 -70.4 -70.3 -70.2
41.9
42
42.1
42.2
42.3
42.4
42.5
42.6
NH4Fall
-5 -3 -1 1 3 Figure 3-23. Change in seasonal NH4 concentrations (µM) from baseline to post-transfer. Based on
the difference of means calculated over all depths from each station, survey, season, and period.
(a) Annual NH4
0
2
4
6
8
10
1992
1993
1994
1995
1996
1997
1998
1999
2000
2001
2002
2003
2004
2005
NH
4 (µM
)
Boston Harbor Nearfield N. Boundary Cape Cod Coastal Offshore (b) Annual NO3
0
2
4
6
8
10
1992
1993
1994
1995
1996
1997
1998
1999
2000
2001
2002
2003
2004
2005
NO
3 (µM
)
Nearfield Boston Harbor N. Boundary Cape Cod Coastal Offshore Figure 3-22. Time-series of annual mean (a) NH4 and
(a) NO3 concentrations (µM) by area. Data collected from all depths and all stations.
2005 Annual Water Column Monitoring Report November 2006
3-29
For the 2004 annual report the baseline to post-transfer differences in NH4 concentrations were examined on a station-by-station basis and the changes were significant (based on t-tests with results of p≤0.05) for many of the stations in Boston Harbor and the nearfield. However, after corrections were made to account for the multiple comparisons that were conducted (Bonferroni correction) a more limited set of stations exhibited significant changes in NH4. This analysis is revisited in this report as well as expanded using regression models in Section 3.5.4. All of the significant results discussed below are based on alpha = 0.05 with Bonferroni correction using the actual number of comparison tests. For example, there were 41 tests in the summer NH4 difference plot. Applying the Bonferroni correction (0.05/41) means a p ≤ 0.0012 would be significant. When examined on a seasonal basis across stations and applying the Bonferroni correction, there were significant or nearly significant decreases in NH4 concentrations at all but three of the possible 39 station/season combinations of Boston Harbor water quality monitoring (BHWQM) and ambient water quality monitoring nearfield/farfield stations (Table 3-4). The magnitude of these decreases ranged from 1 to 9 µM for the 39 season/station grouping (Figure 3-23). Significant decreases in NH4 were also found at coastal stations F14, F24, and F25 during the winter/spring and at nearfield station N10 in the fall (Table 3-4). NH4 concentrations decreased at station N10 during both the winter/spring and fall by more than 1 µM (Figure 3-23). This station has historically exhibited patterns in water quality parameters consistent with harbor and coastal areas and is influenced by tidal flow from the inshore waters. Significant or nearly significant increases in NH4 were found at nearfield station N18 and N20 during each season and at station N16 in winter/spring. Not surprisingly, these three stations are the closest (1-2 km) to the outfall. In the summer, there was also a significant increase in NH4 concentrations at coastal station F18 and a nearly significant increase at this station in the fall. There are several generalizations that can be made based on the results presented in Figure 3-23. First, it is clear that there has been a decrease in NH4 concentrations in Boston Harbor. Nearly all of the comparisons show a decreasing pattern in values and many of them are significant. Some coastal waters and even station N10 in the nearfield have also seen a significant decrease in NH4 concentrations – likely due to continued influence of harbor water quality at these stations. Second, while there has been an increase in NH4 concentrations at most of the nearfield stations and at the Broad Sound station F18, just to the northwest of the nearfield, the only statistically significant increases have been at stations closest to the outfall (N16, N18 and N20) and in the summer at station F18. A significant increase in NO3 was also observed at station F18 in the summer. This was the only statistically significant change in NO3 concentrations even though relatively large (> 1µM) changes were observed at other stations and seasons (Figure 3-24). The largest increase in NO3 concentrations was observed at station F18 (+3.34 µM) in the fall and this change was nearly significant (p=0.0042). Station F18 is located in an area susceptible to upwelling and these significant summertime and nearly significant fall increases in NH4 and NO3 are likely due to a combination of higher bottom water concentrations (outfall or ambient) and upwelling favorable conditions. Station F18 may also be impacted by the effluent plumes from other regional waste water treatment plants (South Essex Sewer District and City of Lynn plants) that discharge >100 MGD of secondary treated effluent into the area. Nitrate concentrations showed an increase at most nearfield stations during the fall. These increases in NO3, however, were mirrored by increases throughout the bays (Figure 3-24) for example, fall NO3 concentration at the Northern Boundary stations F26 and F27. Although the significant changes in NH4 concentrations in the nearfield can be ascribed to the relocation of the outfall, the data suggest that this increase occurred on top of regional changes in nutrient concentrations. It is unknown whether the changes in regional nutrient concentrations are due to different loadings to the system (riverine, offshore Gulf of Maine surface or bottom waters, etc.), changes in seasonal biological patterns (i.e. fewer and less intense fall blooms) or related to more circulation shifts related to larger scale processes (e.g. North Atlantic Oscillation).
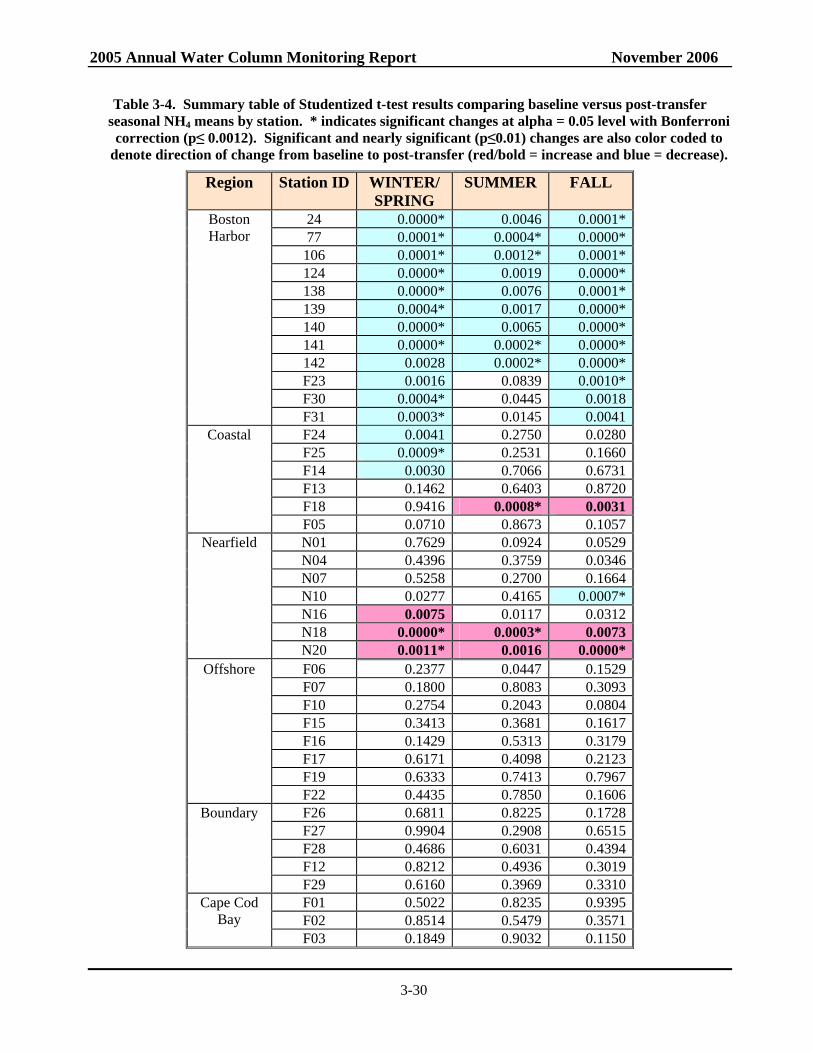
2005 Annual Water Column Monitoring Report November 2006
3-30
Table 3-4. Summary table of Studentized t-test results comparing baseline versus post-transfer seasonal NH4 means by station. * indicates significant changes at alpha = 0.05 level with Bonferroni correction (p≤ 0.0012). Significant and nearly significant (p≤0.01) changes are also color coded to
denote direction of change from baseline to post-transfer (red/bold = increase and blue = decrease).
Region Station ID WINTER/ SPRING
SUMMER FALL
24 0.0000* 0.0046 0.0001* 77 0.0001* 0.0004* 0.0000*
106 0.0001* 0.0012* 0.0001* 124 0.0000* 0.0019 0.0000* 138 0.0000* 0.0076 0.0001* 139 0.0004* 0.0017 0.0000* 140 0.0000* 0.0065 0.0000* 141 0.0000* 0.0002* 0.0000* 142 0.0028 0.0002* 0.0000* F23 0.0016 0.0839 0.0010* F30 0.0004* 0.0445 0.0018
Boston Harbor
F31 0.0003* 0.0145 0.0041 F24 0.0041 0.2750 0.0280 F25 0.0009* 0.2531 0.1660 F14 0.0030 0.7066 0.6731 F13 0.1462 0.6403 0.8720 F18 0.9416 0.0008* 0.0031
Coastal
F05 0.0710 0.8673 0.1057 N01 0.7629 0.0924 0.0529 N04 0.4396 0.3759 0.0346 N07 0.5258 0.2700 0.1664 N10 0.0277 0.4165 0.0007* N16 0.0075 0.0117 0.0312 N18 0.0000* 0.0003* 0.0073
Nearfield
N20 0.0011* 0.0016 0.0000* F06 0.2377 0.0447 0.1529 F07 0.1800 0.8083 0.3093 F10 0.2754 0.2043 0.0804 F15 0.3413 0.3681 0.1617 F16 0.1429 0.5313 0.3179 F17 0.6171 0.4098 0.2123 F19 0.6333 0.7413 0.7967
Offshore
F22 0.4435 0.7850 0.1606 F26 0.6811 0.8225 0.1728 F27 0.9904 0.2908 0.6515 F28 0.4686 0.6031 0.4394 F12 0.8212 0.4936 0.3019
Boundary
F29 0.6160 0.3969 0.3310 F01 0.5022 0.8235 0.9395 F02 0.8514 0.5479 0.3571
Cape Cod Bay
F03 0.1849 0.9032 0.1150
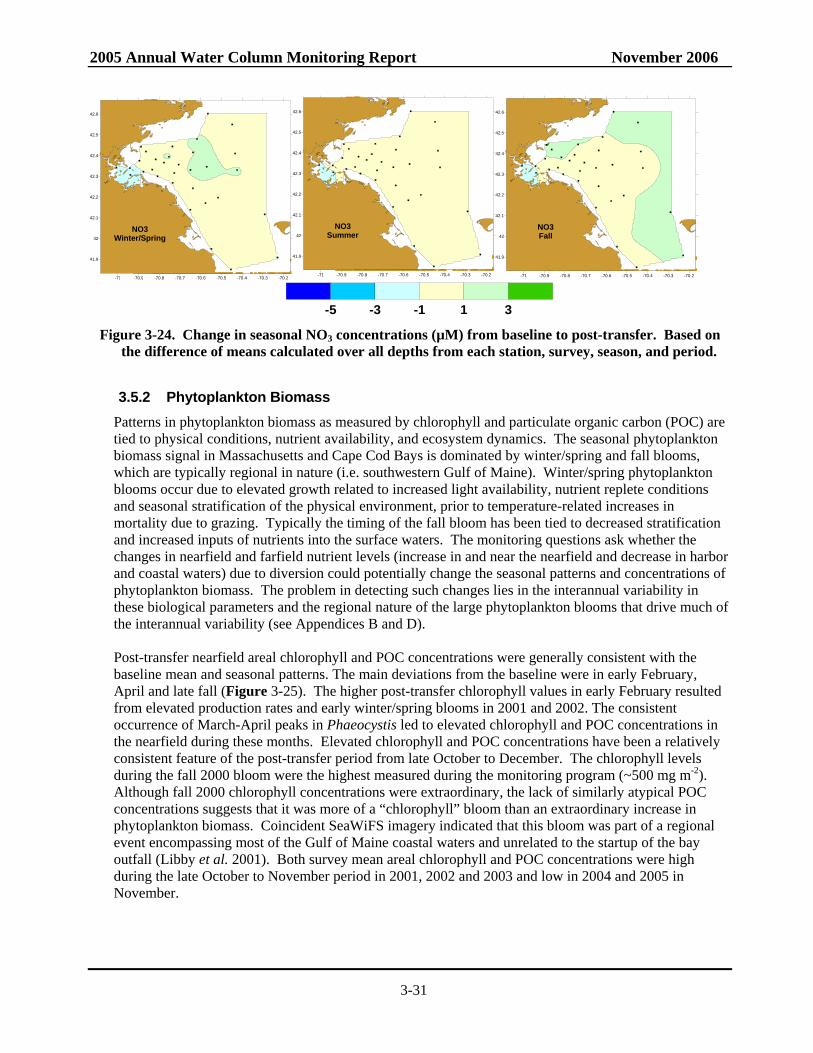
2005 Annual Water Column Monitoring Report November 2006
3-31
-71 -70.9 -70.8 -70.7 -70.6 -70.5 -70.4 -70.3 -70.2
41.9
42
42.1
42.2
42.3
42.4
42.5
42.6
NO3Winter/Spring
-71 -70.9 -70.8 -70.7 -70.6 -70.5 -70.4 -70.3 -70.2
41.9
42
42.1
42.2
42.3
42.4
42.5
42.6
NO3Summer
-71 -70.9 -70.8 -70.7 -70.6 -70.5 -70.4 -70.3 -70.2
41.9
42
42.1
42.2
42.3
42.4
42.5
42.6
NO3Fall
-5 -3 -1 1 3 Figure 3-24. Change in seasonal NO3 concentrations (µM) from baseline to post-transfer. Based on
the difference of means calculated over all depths from each station, survey, season, and period.
3.5.2 Phytoplankton Biomass Patterns in phytoplankton biomass as measured by chlorophyll and particulate organic carbon (POC) are tied to physical conditions, nutrient availability, and ecosystem dynamics. The seasonal phytoplankton biomass signal in Massachusetts and Cape Cod Bays is dominated by winter/spring and fall blooms, which are typically regional in nature (i.e. southwestern Gulf of Maine). Winter/spring phytoplankton blooms occur due to elevated growth related to increased light availability, nutrient replete conditions and seasonal stratification of the physical environment, prior to temperature-related increases in mortality due to grazing. Typically the timing of the fall bloom has been tied to decreased stratification and increased inputs of nutrients into the surface waters. The monitoring questions ask whether the changes in nearfield and farfield nutrient levels (increase in and near the nearfield and decrease in harbor and coastal waters) due to diversion could potentially change the seasonal patterns and concentrations of phytoplankton biomass. The problem in detecting such changes lies in the interannual variability in these biological parameters and the regional nature of the large phytoplankton blooms that drive much of the interannual variability (see Appendices B and D).
Post-transfer nearfield areal chlorophyll and POC concentrations were generally consistent with the baseline mean and seasonal patterns. The main deviations from the baseline were in early February, April and late fall (Figure 3-25). The higher post-transfer chlorophyll values in early February resulted from elevated production rates and early winter/spring blooms in 2001 and 2002. The consistent occurrence of March-April peaks in Phaeocystis led to elevated chlorophyll and POC concentrations in the nearfield during these months. Elevated chlorophyll and POC concentrations have been a relatively consistent feature of the post-transfer period from late October to December. The chlorophyll levels during the fall 2000 bloom were the highest measured during the monitoring program (~500 mg m-2). Although fall 2000 chlorophyll concentrations were extraordinary, the lack of similarly atypical POC concentrations suggests that it was more of a “chlorophyll” bloom than an extraordinary increase in phytoplankton biomass. Coincident SeaWiFS imagery indicated that this bloom was part of a regional event encompassing most of the Gulf of Maine coastal waters and unrelated to the startup of the bay outfall (Libby et al. 2001). Both survey mean areal chlorophyll and POC concentrations were high during the late October to November period in 2001, 2002 and 2003 and low in 2004 and 2005 in November.
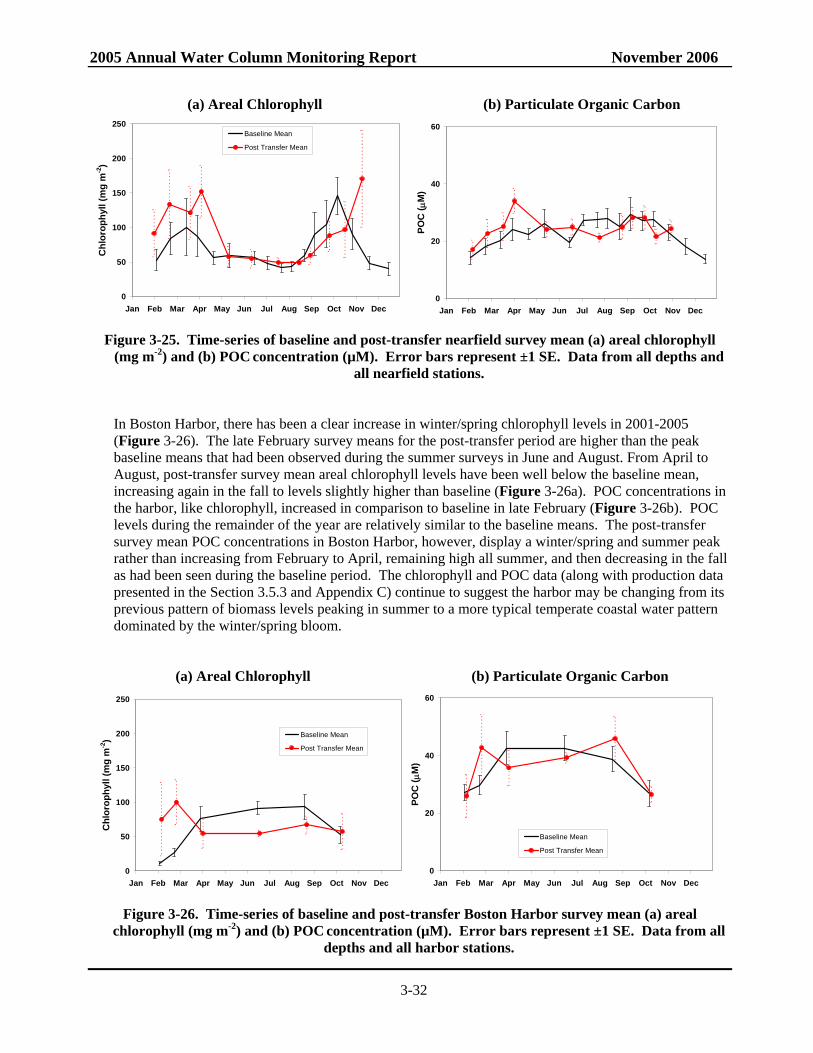
2005 Annual Water Column Monitoring Report November 2006
3-32
(a) Areal Chlorophyll (b) Particulate Organic Carbon
0
50
100
150
200
250
Jan Feb Mar Apr May Jun Jul Aug Sep Oct Nov Dec
Chl
orop
hyll
(mg
m-2
)
Baseline Mean
Post Transfer Mean
0
20
40
60
Jan Feb Mar Apr May Jun Jul Aug Sep Oct Nov Dec
POC
( µM
)
Figure 3-25. Time-series of baseline and post-transfer nearfield survey mean (a) areal chlorophyll
(mg m-2) and (b) POC concentration (µM). Error bars represent ±1 SE. Data from all depths and all nearfield stations.
In Boston Harbor, there has been a clear increase in winter/spring chlorophyll levels in 2001-2005 (Figure 3-26). The late February survey means for the post-transfer period are higher than the peak baseline means that had been observed during the summer surveys in June and August. From April to August, post-transfer survey mean areal chlorophyll levels have been well below the baseline mean, increasing again in the fall to levels slightly higher than baseline (Figure 3-26a). POC concentrations in the harbor, like chlorophyll, increased in comparison to baseline in late February (Figure 3-26b). POC levels during the remainder of the year are relatively similar to the baseline means. The post-transfer survey mean POC concentrations in Boston Harbor, however, display a winter/spring and summer peak rather than increasing from February to April, remaining high all summer, and then decreasing in the fall as had been seen during the baseline period. The chlorophyll and POC data (along with production data presented in the Section 3.5.3 and Appendix C) continue to suggest the harbor may be changing from its previous pattern of biomass levels peaking in summer to a more typical temperate coastal water pattern dominated by the winter/spring bloom.
(a) Areal Chlorophyll (b) Particulate Organic Carbon
0
50
100
150
200
250
Jan Feb Mar Apr May Jun Jul Aug Sep Oct Nov Dec
Chl
orop
hyll
(mg
m-2
) Baseline Mean
Post Transfer Mean
0
20
40
60
Jan Feb Mar Apr May Jun Jul Aug Sep Oct Nov Dec
POC
( µM
)
Baseline Mean
Post Transfer Mean
Figure 3-26. Time-series of baseline and post-transfer Boston Harbor survey mean (a) areal
chlorophyll (mg m-2) and (b) POC concentration (µM). Error bars represent ±1 SE. Data from all depths and all harbor stations.
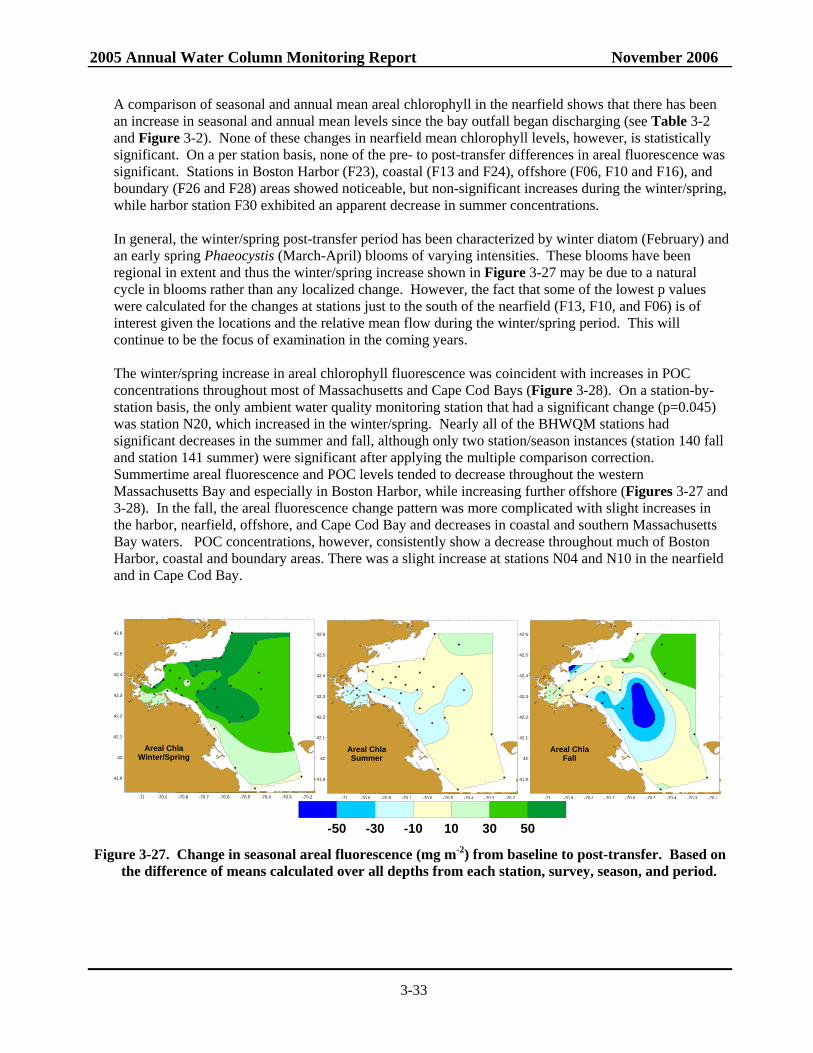
2005 Annual Water Column Monitoring Report November 2006
3-33
A comparison of seasonal and annual mean areal chlorophyll in the nearfield shows that there has been an increase in seasonal and annual mean levels since the bay outfall began discharging (see Table 3-2 and Figure 3-2). None of these changes in nearfield mean chlorophyll levels, however, is statistically significant. On a per station basis, none of the pre- to post-transfer differences in areal fluorescence was significant. Stations in Boston Harbor (F23), coastal (F13 and F24), offshore (F06, F10 and F16), and boundary (F26 and F28) areas showed noticeable, but non-significant increases during the winter/spring, while harbor station F30 exhibited an apparent decrease in summer concentrations. In general, the winter/spring post-transfer period has been characterized by winter diatom (February) and an early spring Phaeocystis (March-April) blooms of varying intensities. These blooms have been regional in extent and thus the winter/spring increase shown in Figure 3-27 may be due to a natural cycle in blooms rather than any localized change. However, the fact that some of the lowest p values were calculated for the changes at stations just to the south of the nearfield (F13, F10, and F06) is of interest given the locations and the relative mean flow during the winter/spring period. This will continue to be the focus of examination in the coming years. The winter/spring increase in areal chlorophyll fluorescence was coincident with increases in POC concentrations throughout most of Massachusetts and Cape Cod Bays (Figure 3-28). On a station-by-station basis, the only ambient water quality monitoring station that had a significant change (p=0.045) was station N20, which increased in the winter/spring. Nearly all of the BHWQM stations had significant decreases in the summer and fall, although only two station/season instances (station 140 fall and station 141 summer) were significant after applying the multiple comparison correction. Summertime areal fluorescence and POC levels tended to decrease throughout the western Massachusetts Bay and especially in Boston Harbor, while increasing further offshore (Figures 3-27 and 3-28). In the fall, the areal fluorescence change pattern was more complicated with slight increases in the harbor, nearfield, offshore, and Cape Cod Bay and decreases in coastal and southern Massachusetts Bay waters. POC concentrations, however, consistently show a decrease throughout much of Boston Harbor, coastal and boundary areas. There was a slight increase at stations N04 and N10 in the nearfield and in Cape Cod Bay.
-71 -70.9 -70.8 -70.7 -70.6 -70.5 -70.4 -70.3 -70.2
41.9
42
42.1
42.2
42.3
42.4
42.5
42.6
Areal ChlaWinter/Spring
-71 -70.9 -70.8 -70.7 -70.6 -70.5 -70.4 -70.3 -70.2
41.9
42
42.1
42.2
42.3
42.4
42.5
42.6
Areal ChlaSummer
-71 -70.9 -70.8 -70.7 -70.6 -70.5 -70.4 -70.3 -70.2
41.9
42
42.1
42.2
42.3
42.4
42.5
42.6
Areal ChlaFall
-50 -30 -10 10 30 50 Figure 3-27. Change in seasonal areal fluorescence (mg m-2) from baseline to post-transfer. Based on
the difference of means calculated over all depths from each station, survey, season, and period.
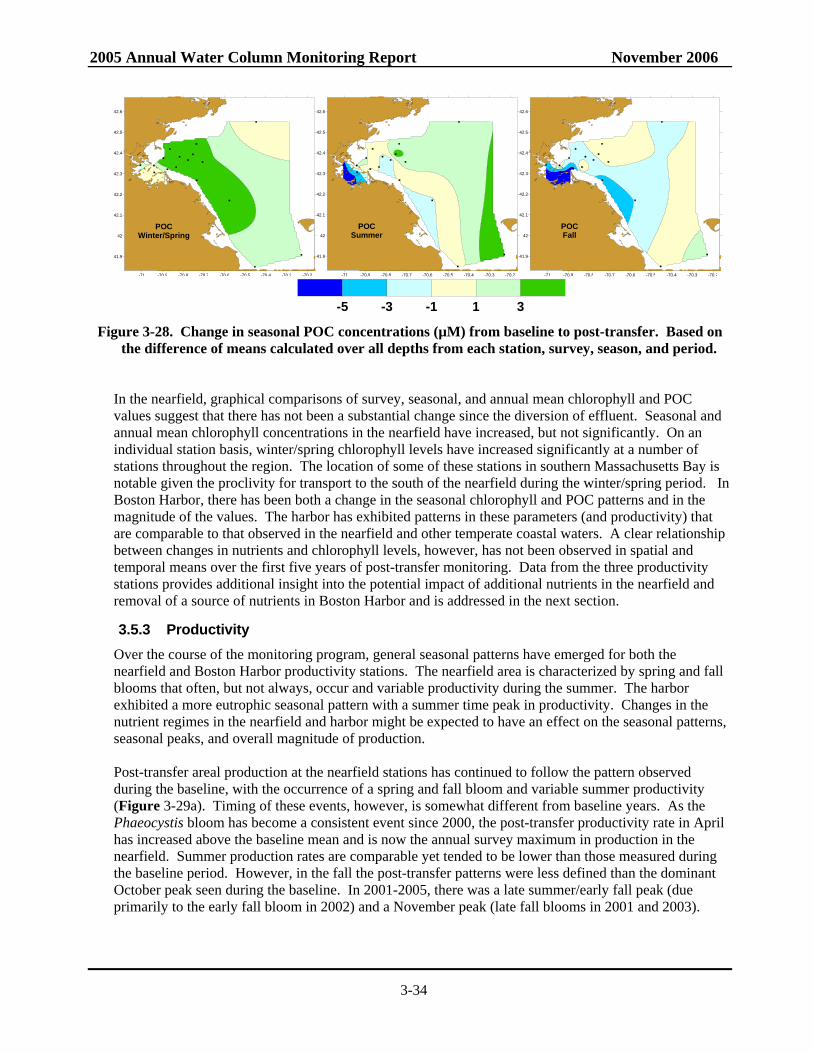
2005 Annual Water Column Monitoring Report November 2006
3-34
-71 -70.9 -70.8 -70.7 -70.6 -70.5 -70.4 -70.3 -70.2
41.9
42
42.1
42.2
42.3
42.4
42.5
42.6
POCWinter/Spring
-71 -70.9 -70.8 -70.7 -70.6 -70.5 -70.4 -70.3 -70.2
41.9
42
42.1
42.2
42.3
42.4
42.5
42.6
POCSummer
-71 -70.9 -70.8 -70.7 -70.6 -70.5 -70.4 -70.3 -70.2
41.9
42
42.1
42.2
42.3
42.4
42.5
42.6
POCFall
-5 -3 -1 1 3 Figure 3-28. Change in seasonal POC concentrations (µM) from baseline to post-transfer. Based on
the difference of means calculated over all depths from each station, survey, season, and period.
In the nearfield, graphical comparisons of survey, seasonal, and annual mean chlorophyll and POC values suggest that there has not been a substantial change since the diversion of effluent. Seasonal and annual mean chlorophyll concentrations in the nearfield have increased, but not significantly. On an individual station basis, winter/spring chlorophyll levels have increased significantly at a number of stations throughout the region. The location of some of these stations in southern Massachusetts Bay is notable given the proclivity for transport to the south of the nearfield during the winter/spring period. In Boston Harbor, there has been both a change in the seasonal chlorophyll and POC patterns and in the magnitude of the values. The harbor has exhibited patterns in these parameters (and productivity) that are comparable to that observed in the nearfield and other temperate coastal waters. A clear relationship between changes in nutrients and chlorophyll levels, however, has not been observed in spatial and temporal means over the first five years of post-transfer monitoring. Data from the three productivity stations provides additional insight into the potential impact of additional nutrients in the nearfield and removal of a source of nutrients in Boston Harbor and is addressed in the next section.
3.5.3 Productivity Over the course of the monitoring program, general seasonal patterns have emerged for both the nearfield and Boston Harbor productivity stations. The nearfield area is characterized by spring and fall blooms that often, but not always, occur and variable productivity during the summer. The harbor exhibited a more eutrophic seasonal pattern with a summer time peak in productivity. Changes in the nutrient regimes in the nearfield and harbor might be expected to have an effect on the seasonal patterns, seasonal peaks, and overall magnitude of production. Post-transfer areal production at the nearfield stations has continued to follow the pattern observed during the baseline, with the occurrence of a spring and fall bloom and variable summer productivity (Figure 3-29a). Timing of these events, however, is somewhat different from baseline years. As the Phaeocystis bloom has become a consistent event since 2000, the post-transfer productivity rate in April has increased above the baseline mean and is now the annual survey maximum in production in the nearfield. Summer production rates are comparable yet tended to be lower than those measured during the baseline period. However, in the fall the post-transfer patterns were less defined than the dominant October peak seen during the baseline. In 2001-2005, there was a late summer/early fall peak (due primarily to the early fall bloom in 2002) and a November peak (late fall blooms in 2001 and 2003).
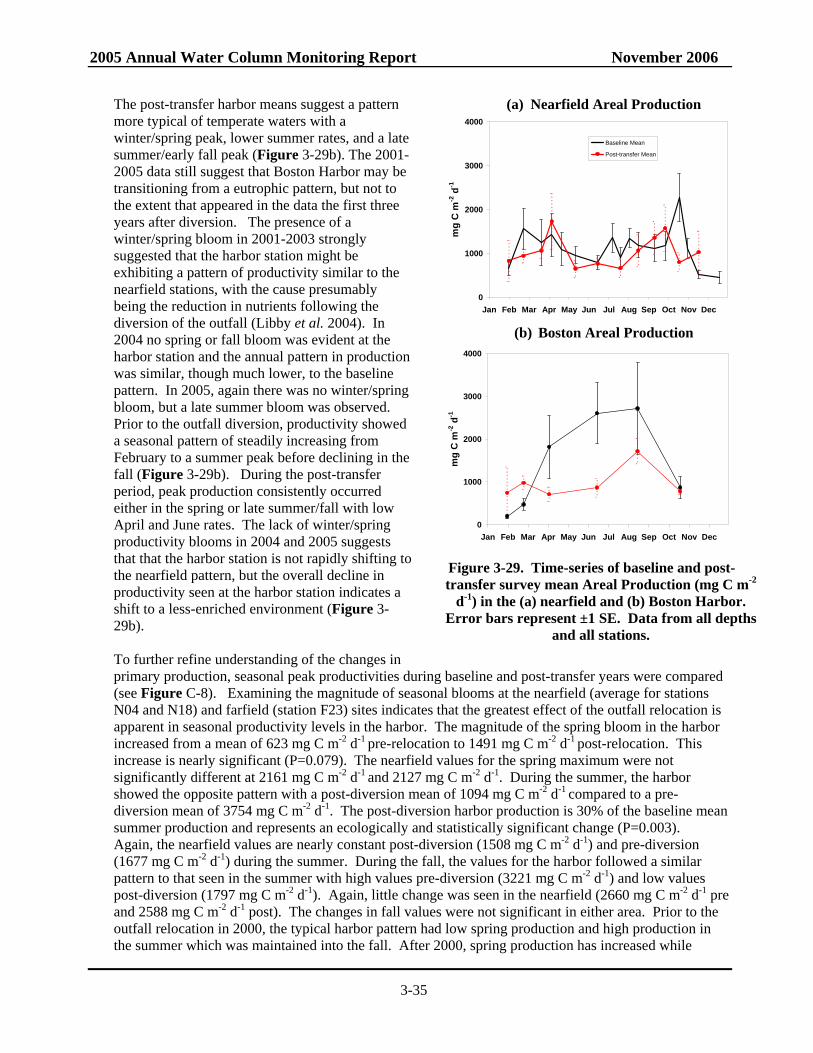
2005 Annual Water Column Monitoring Report November 2006
3-35
The post-transfer harbor means suggest a pattern more typical of temperate waters with a winter/spring peak, lower summer rates, and a late summer/early fall peak (Figure 3-29b). The 2001-2005 data still suggest that Boston Harbor may be transitioning from a eutrophic pattern, but not to the extent that appeared in the data the first three years after diversion. The presence of a winter/spring bloom in 2001-2003 strongly suggested that the harbor station might be exhibiting a pattern of productivity similar to the nearfield stations, with the cause presumably being the reduction in nutrients following the diversion of the outfall (Libby et al. 2004). In 2004 no spring or fall bloom was evident at the harbor station and the annual pattern in production was similar, though much lower, to the baseline pattern. In 2005, again there was no winter/spring bloom, but a late summer bloom was observed. Prior to the outfall diversion, productivity showed a seasonal pattern of steadily increasing from February to a summer peak before declining in the fall (Figure 3-29b). During the post-transfer period, peak production consistently occurred either in the spring or late summer/fall with low April and June rates. The lack of winter/spring productivity blooms in 2004 and 2005 suggests that that the harbor station is not rapidly shifting to the nearfield pattern, but the overall decline in productivity seen at the harbor station indicates a shift to a less-enriched environment (Figure 3-29b). To further refine understanding of the changes in primary production, seasonal peak productivities during baseline and post-transfer years were compared (see Figure C-8). Examining the magnitude of seasonal blooms at the nearfield (average for stations N04 and N18) and farfield (station F23) sites indicates that the greatest effect of the outfall relocation is apparent in seasonal productivity levels in the harbor. The magnitude of the spring bloom in the harbor increased from a mean of 623 mg C m-2 d-1 pre-relocation to 1491 mg C m-2 d-1 post-relocation. This increase is nearly significant (P=0.079). The nearfield values for the spring maximum were not significantly different at 2161 mg C m-2 d-1 and 2127 mg C m-2 d-1. During the summer, the harbor showed the opposite pattern with a post-diversion mean of 1094 mg C m-2 d-1 compared to a pre-diversion mean of 3754 mg C m-2 d-1. The post-diversion harbor production is 30% of the baseline mean summer production and represents an ecologically and statistically significant change (P=0.003). Again, the nearfield values are nearly constant post-diversion (1508 mg C m-2 d-1) and pre-diversion (1677 mg C m-2 d-1) during the summer. During the fall, the values for the harbor followed a similar pattern to that seen in the summer with high values pre-diversion (3221 mg C m-2 d-1) and low values post-diversion (1797 mg C m-2 d-1). Again, little change was seen in the nearfield (2660 mg C m-2 d-1 pre and 2588 mg C m-2 d-1 post). The changes in fall values were not significant in either area. Prior to the outfall relocation in 2000, the typical harbor pattern had low spring production and high production in the summer which was maintained into the fall. After 2000, spring production has increased while
(a) Nearfield Areal Production
0
1000
2000
3000
4000
Jan Feb Mar Apr May Jun Jul Aug Sep Oct Nov Dec
mg
C m
-2 d
-1
Baseline Mean
Post-transfer Mean
(b) Boston Areal Production
0
1000
2000
3000
4000
Jan Feb Mar Apr May Jun Jul Aug Sep Oct Nov Dec
mg
C m
-2 d
-1
Figure 3-29. Time-series of baseline and post-transfer survey mean Areal Production (mg C m-2
d-1) in the (a) nearfield and (b) Boston Harbor. Error bars represent ±1 SE. Data from all depths
and all stations.
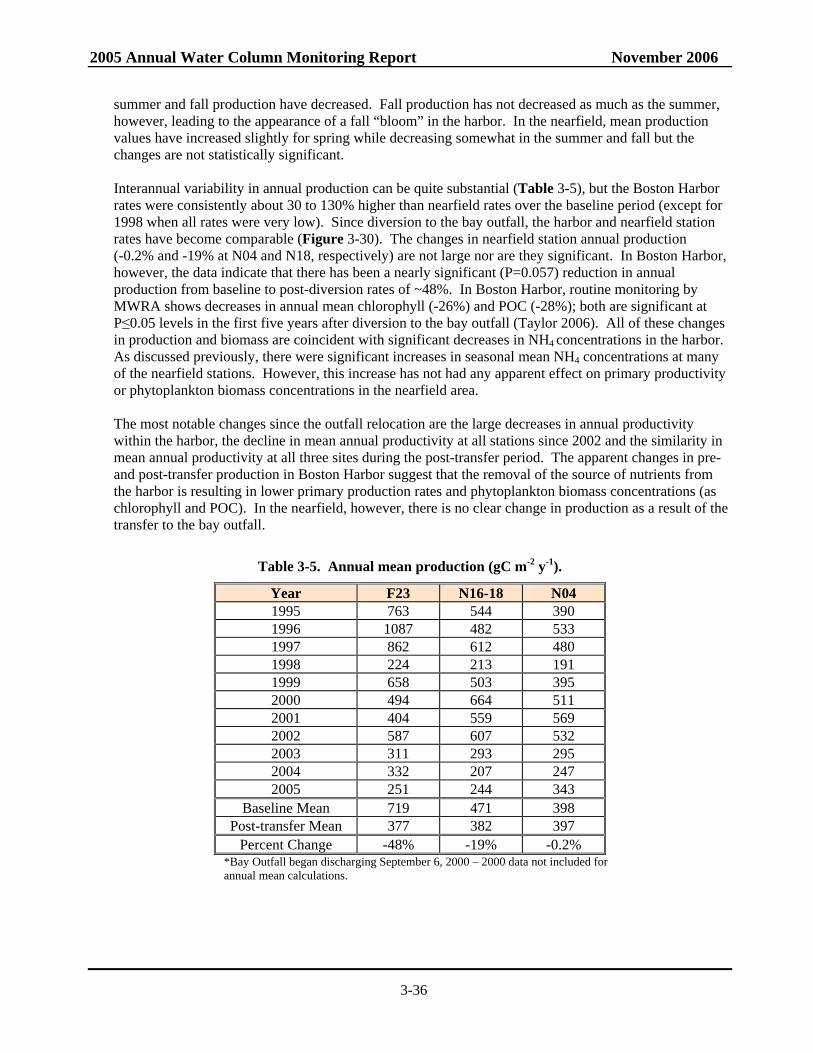
2005 Annual Water Column Monitoring Report November 2006
3-36
summer and fall production have decreased. Fall production has not decreased as much as the summer, however, leading to the appearance of a fall “bloom” in the harbor. In the nearfield, mean production values have increased slightly for spring while decreasing somewhat in the summer and fall but the changes are not statistically significant.
Interannual variability in annual production can be quite substantial (Table 3-5), but the Boston Harbor rates were consistently about 30 to 130% higher than nearfield rates over the baseline period (except for 1998 when all rates were very low). Since diversion to the bay outfall, the harbor and nearfield station rates have become comparable (Figure 3-30). The changes in nearfield station annual production (-0.2% and -19% at N04 and N18, respectively) are not large nor are they significant. In Boston Harbor, however, the data indicate that there has been a nearly significant (P=0.057) reduction in annual production from baseline to post-diversion rates of ~48%. In Boston Harbor, routine monitoring by MWRA shows decreases in annual mean chlorophyll (-26%) and POC (-28%); both are significant at P≤0.05 levels in the first five years after diversion to the bay outfall (Taylor 2006). All of these changes in production and biomass are coincident with significant decreases in NH4 concentrations in the harbor. As discussed previously, there were significant increases in seasonal mean NH4 concentrations at many of the nearfield stations. However, this increase has not had any apparent effect on primary productivity or phytoplankton biomass concentrations in the nearfield area.
The most notable changes since the outfall relocation are the large decreases in annual productivity within the harbor, the decline in mean annual productivity at all stations since 2002 and the similarity in mean annual productivity at all three sites during the post-transfer period. The apparent changes in pre- and post-transfer production in Boston Harbor suggest that the removal of the source of nutrients from the harbor is resulting in lower primary production rates and phytoplankton biomass concentrations (as chlorophyll and POC). In the nearfield, however, there is no clear change in production as a result of the transfer to the bay outfall.
Table 3-5. Annual mean production (gC m-2 y-1).
Year F23 N16-18 N04 1995 763 544 390 1996 1087 482 533 1997 862 612 480 1998 224 213 191 1999 658 503 395 2000 494 664 511 2001 404 559 569 2002 587 607 532 2003 311 293 295 2004 332 207 247 2005 251 244 343
Baseline Mean 719 471 398 Post-transfer Mean 377 382 397
Percent Change -48% -19% -0.2% *Bay Outfall began discharging September 6, 2000 – 2000 data not included for annual mean calculations.
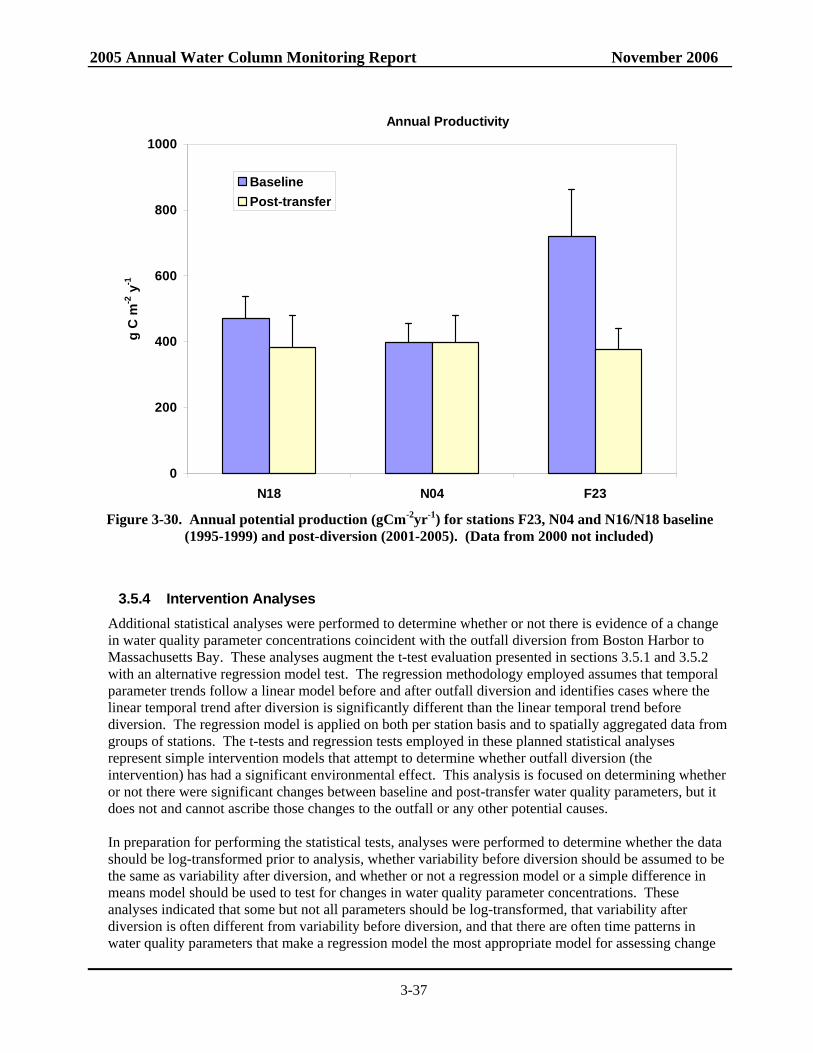
2005 Annual Water Column Monitoring Report November 2006
3-37
Annual Productivity
0
200
400
600
800
1000
N18 N04 F23
g C
m-2
y-1
BaselinePost-transfer
Figure 3-30. Annual potential production (gCm-2yr-1) for stations F23, N04 and N16/N18 baseline
(1995-1999) and post-diversion (2001-2005). (Data from 2000 not included)
3.5.4 Intervention Analyses Additional statistical analyses were performed to determine whether or not there is evidence of a change in water quality parameter concentrations coincident with the outfall diversion from Boston Harbor to Massachusetts Bay. These analyses augment the t-test evaluation presented in sections 3.5.1 and 3.5.2 with an alternative regression model test. The regression methodology employed assumes that temporal parameter trends follow a linear model before and after outfall diversion and identifies cases where the linear temporal trend after diversion is significantly different than the linear temporal trend before diversion. The regression model is applied on both per station basis and to spatially aggregated data from groups of stations. The t-tests and regression tests employed in these planned statistical analyses represent simple intervention models that attempt to determine whether outfall diversion (the intervention) has had a significant environmental effect. This analysis is focused on determining whether or not there were significant changes between baseline and post-transfer water quality parameters, but it does not and cannot ascribe those changes to the outfall or any other potential causes. In preparation for performing the statistical tests, analyses were performed to determine whether the data should be log-transformed prior to analysis, whether variability before diversion should be assumed to be the same as variability after diversion, and whether or not a regression model or a simple difference in means model should be used to test for changes in water quality parameter concentrations. These analyses indicated that some but not all parameters should be log-transformed, that variability after diversion is often different from variability before diversion, and that there are often time patterns in water quality parameters that make a regression model the most appropriate model for assessing change
2005 Annual Water Column Monitoring Report November 2006
3-38
related to outfall diversion. Separate statistical analyses were performed by station and season. It was assumed that parameter concentrations for the same season from different years are stochastically independent. To complement the by-station analyses and in an attempt to attain more power for detecting parameter changes related to outfall diversion, statistical analyses were also performed on average parameter values for naturally defined groups of stations. Multiple comparison corrections were not made for these analyses rather the findings and discussion rely on a weight of evidence in ascribing significant change. By chance at alpha=0.05 one would expect 5% of tests to be significant, in this analysis when the number of significant results is substantially higher than 5% of the tests then the difference is deemed significant relative to the intervention. Methods – The first step was to determine whether or not to log transform the data prior to statistical analysis. Shapiro-Wilk tests for normality were calculated for each individual station by season and parameter. The p-values were graphed and tested against a uniform (0,1) distribution with a Kolmogorov-Smirnov test for each season-parameter pair. Species for which the p-values associated with the log-transformed data more closely matched a uniform (0,1) distribution were flagged as needing log transformation. For each chemical, a one-way ANOVA model with a site effect was performed and the residuals graphed and tested for normality with a Shapiro-Wilk test. Outcomes of the two evaluations of normality indicated that four parameters appear to be more normally distributed in log10-transformed space than in the non-transformed space: Areal Fluor, CHLA, NH4, and POC. The remainder of the evaluation for these four parameters was performed on the log10 transformed values. For each station grouping, the data was divided into pre- and post-intervention datasets. Each set of data was then modeled in a simple linear regression. The p-values from these regression analyses that tested whether the slope parameter was significantly different from zero were tested against a uniform(0,1) distribution with a Kolmogorov-Smirnov test. The results for the Kolmogorov-Smirnov test of uniformity showed that there were significant slope effects for simple linear regressions pre- and post-diversion. When analyzing individual stations, 85% of baseline slopes and 44% of post-diversion slopes were significantly different than zero. 78% and 41% of baseline and post-diversion slopes were significant when grouping the stations. While one would expect 5% of these slopes to be statistically significant by chance, the percentage of significant slopes was great enough to indicate that regression-based tests are more appropriate than t-tests (which assumes slopes of zero and looks only at intercepts) for assessing change. Therefore, a regression model was employed to test whether the intercept and slope of pre-diversion parameter values differed from the intercept and slope of post-diversion parameter values. The results also indicated that it was not appropriate to assume homogeneity of variance when performing the regression analyses. 59% of the parameter-season pairs when analyzing on the station level and 44% percent when analyzing on the station-grouping level showed a significant difference between pre-diversion and post-diversion variance. As such, for each parameter-season-station combination, a regression analysis was performed to determine whether pre-intervention or baseline intercept and slope parameters differed significantly from post-diversion intercept and slope parameters. The following model, assuming non-homogeneous variances, was applied using SAS PROC MIXED (Little et al. 2006):
( )( ) ( ) iPostPostPosteePosti timeItimeIY εββββ +⋅++⋅+−= ,1,0Pr,1Pr,01
were IPost is an indicator variable that is equal to zero for pre-diversion data and one for post-diversion data. A two degree of freedom test that contrasts β0,Pre with β0,Post and β1,Pre with β1,Post was performed to determine whether or not parameter status and trends prior to diversion differed from status (intercepts)
2005 Annual Water Column Monitoring Report November 2006
3-39
and trends (slopes) after diversion. These analyses were performed for all individual stations and, in order to increase power of change detection, for pre-determined geographical station groupings (a modification of existing MWRA area groupings as shown in Figure 2-1). The stations included in the Boston Harbor, Cape Cod Bay and the nearfield groups are the same as listed in Table 3-4. The other Massachusetts Bay stations were grouped as coastal (F14, F18, F24, F25), MB north (F22, F26, F27), MB offshore (F12, F17, F19, F28), and MB south (F05, F06, F07, F10, F13, F15, F16). Results – With the exception of Areal Fluor and NO3, 10% or more of the p-values were are less than 0.05, suggesting that there are differences between parameter status and trends before and after diversion. For the other five parameters, between 10% and 44% of the p-values are less than 0.05. Table 3-6 provides similar p-values by parameter, season and station group. Small p-values are evidence of a difference in parameter value status and trends when post-diversion data is compared with pre-diversion data. The p-values in Table 3-6 are not corrected for multiple comparisons. In Table 3-6, where power for change detection is greater since the analyses are based on aggregated data, a very significant percentage (ranging from 38% to 71%) of the p-values for each parameter are less than 0.05, providing strong evidence of status and trend differences between pre- and post-diversion water quality parameter values. The primary issue being addressed by this statistical analysis is whether or not outfall diversion (the intervention) has resulted in significant changes in the immediate Boston Harbor and Massachusetts Bay environment. The power for detecting such changes, if they exist, is enhanced by employing statistical models for pre- and post-diversion parameter concentrations that validly represent the temporal and spatial patterns and correlations that are present in the data. The results of this intervention analysis corroborate many of the findings discussed in Sections 3.5.1 and 3.5.2 and indicate that statistically significant changes in these nutrient and biomass parameters have occurred. The most obvious changes were observed in Boston Harbor nutrient levels. In this analysis, low P-values (<0.001) were calculated in most instances for dissolved inorganic nutrients in the harbor indicating significant changes in these parameters. Levels of NH4, NO3 and PO4 have all decreased significantly in the harbor which was has been a consistent finding in other analyses (Taylor 2006). However, significant changes in levels and temporal patterns have also occurred for other parameters throughout most areas of the bays. Section 3.5.1 noted many of these changes on a station-by-station basis and also suggested that there were some regional patterns evident in the nutrient data such as the increase in NO3 concentrations in the fall. More sophisticated intervention models may need to be employed to characterize the significance of these patterns. An example of a more sophisticated model would be a model that allows one to analyze the data for all seasons simultaneously while properly taking into consideration the serial autocorrelation among parameter concentrations from season to season. Another example would be a model that allows one to analyze the data from a group of stations simultaneously while properly taking into consideration the spatial correlation patterns in parameter concentrations from stations that are geographically close to each other. The use of these more sophisticated models will be explored in future reports. The primary goal will be to efficiently synthesize information in the monitoring data into knowledge concerning intervention effects on the Massachusetts Bay environment. Thus, a balance will be sought between two competing goals: (A) more complicated models that better represent the physical environment, and (B) less complicated models that translate into easily understood knowledge. Within this context, a number of options for employing more sophisticated intervention models will be explored and the pros and cons associated with future application such models will be documented in the 2006 report.
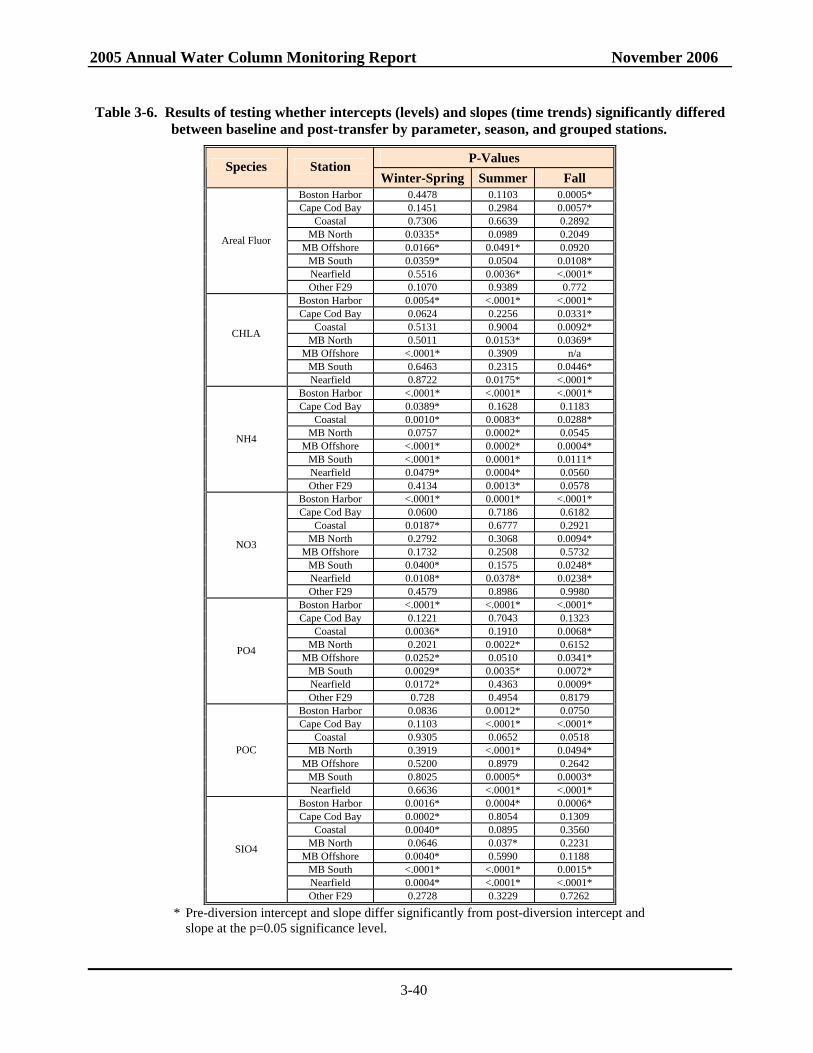
2005 Annual Water Column Monitoring Report November 2006
3-40
Table 3-6. Results of testing whether intercepts (levels) and slopes (time trends) significantly differed between baseline and post-transfer by parameter, season, and grouped stations.
P-Values Species Station Winter-Spring Summer Fall
Boston Harbor 0.4478 0.1103 0.0005* Cape Cod Bay 0.1451 0.2984 0.0057*
Coastal 0.7306 0.6639 0.2892 MB North 0.0335* 0.0989 0.2049
MB Offshore 0.0166* 0.0491* 0.0920 MB South 0.0359* 0.0504 0.0108* Nearfield 0.5516 0.0036* <.0001*
Areal Fluor
Other F29 0.1070 0.9389 0.772 Boston Harbor 0.0054* <.0001* <.0001* Cape Cod Bay 0.0624 0.2256 0.0331*
Coastal 0.5131 0.9004 0.0092* MB North 0.5011 0.0153* 0.0369*
MB Offshore <.0001* 0.3909 n/a MB South 0.6463 0.2315 0.0446*
CHLA
Nearfield 0.8722 0.0175* <.0001* Boston Harbor <.0001* <.0001* <.0001* Cape Cod Bay 0.0389* 0.1628 0.1183
Coastal 0.0010* 0.0083* 0.0288* MB North 0.0757 0.0002* 0.0545
MB Offshore <.0001* 0.0002* 0.0004* MB South <.0001* 0.0001* 0.0111* Nearfield 0.0479* 0.0004* 0.0560
NH4
Other F29 0.4134 0.0013* 0.0578 Boston Harbor <.0001* 0.0001* <.0001* Cape Cod Bay 0.0600 0.7186 0.6182
Coastal 0.0187* 0.6777 0.2921 MB North 0.2792 0.3068 0.0094*
MB Offshore 0.1732 0.2508 0.5732 MB South 0.0400* 0.1575 0.0248* Nearfield 0.0108* 0.0378* 0.0238*
NO3
Other F29 0.4579 0.8986 0.9980 Boston Harbor <.0001* <.0001* <.0001* Cape Cod Bay 0.1221 0.7043 0.1323
Coastal 0.0036* 0.1910 0.0068* MB North 0.2021 0.0022* 0.6152
MB Offshore 0.0252* 0.0510 0.0341* MB South 0.0029* 0.0035* 0.0072* Nearfield 0.0172* 0.4363 0.0009*
PO4
Other F29 0.728 0.4954 0.8179 Boston Harbor 0.0836 0.0012* 0.0750 Cape Cod Bay 0.1103 <.0001* <.0001*
Coastal 0.9305 0.0652 0.0518 MB North 0.3919 <.0001* 0.0494*
MB Offshore 0.5200 0.8979 0.2642 MB South 0.8025 0.0005* 0.0003*
POC
Nearfield 0.6636 <.0001* <.0001* Boston Harbor 0.0016* 0.0004* 0.0006* Cape Cod Bay 0.0002* 0.8054 0.1309
Coastal 0.0040* 0.0895 0.3560 MB North 0.0646 0.037* 0.2231
MB Offshore 0.0040* 0.5990 0.1188 MB South <.0001* <.0001* 0.0015* Nearfield 0.0004* <.0001* <.0001*
SIO4
Other F29 0.2728 0.3229 0.7262
* Pre-diversion intercept and slope differ significantly from post-diversion intercept and slope at the p=0.05 significance level.
2005 Annual Water Column Monitoring Report November 2006
4-1
4.0 CONCLUSIONS Much has been learned about the Massachusetts and Cape Cod Bays system over the course of the ambient water quality monitoring program. Our understanding of the circulation and importance of the Gulf of Maine to both water properties and biology of the system has led to changes in the way we envision the bay outfall might or might not impact the bays. No longer is the system viewed as a simple upstream- to- downstream conveyor belt, but rather one that has a weak and seasonal counterclockwise circulation pattern that is often obscured by tidal and local/regional wind forcing. The influence of the Gulf of Maine has been observed on circulation, nutrient loading, DO, and nuisance species in the bays. Improved understanding of these linkages remains critical for assessing the relative impact of the bay outfall on water quality in Massachusetts and Cape Cod Bays. When the outfall site was chosen and the outfall monitoring plan originally designed, MWRA expected to discharge primary treated effluent through the outfall for a number of years before full secondary treatment was available. As outfall completion was delayed, it became clear that effluent discharged in Massachusetts Bay would receive more thorough treatment. The primary concerns shifted from effects of high-organic-material discharge on DO levels and on the benthic community to the effects of a nutrient-rich discharge into the bottom waters of the bay. Secondary sewage treatment effectively removes organic material, but only removes about 20% of the nitrogen. The biological treatment process also changes the nitrogen in the wastewater from primarily organic nitrogen to dissolved inorganic forms (primarily NH4), which is more readily taken up by marine algae resulting in higher growth rates. Therefore, concern over water column impacts has shifted from those associated with biological oxygen demand to a focus on the potential for eutrophication and for subtle ecosystem shifts in Massachusetts Bay. These concerns were addressed in a set of the monitoring questions (MWRA 1991) that focused on circulation in the system and MWRA effluent’s effect on water quality in the bays with respect to nutrients including eutrophication impacts such as nuisance algal blooms and hypoxia, and ecosystem impacts on plankton communities. A summary of the current understanding (→) and some of the remaining issues to be resolved and recommendations (1, 2, …) is included below. Water Circulation
What are the nearfield and farfield water circulation patterns?
→ Circulation into and within Massachusetts and Cape Cod Bays is complex. → The paradigm that circulation in the bays is counterclockwise was derived from the
winter/spring circulation pattern, which is dominated by the freshet and meteorological conditions that entrain waters into the Massachusetts Bay from the western Maine coastal current. This leads to a predominantly counterclockwise current in the bays for this period, but not consistently over the year.
→ There is essentially no mean flow at the bay outfall location where bottom currents are ~6 cm s-1 and variable in direction.
→ Long-term average, net velocity at the outfall location is small, but considerable random motion causes water parcels to be exchanged from the site to other parts of the bay.
→ System is stratified from April to October. → Effluent is rapidly diluted by oceanographic processes. → Model and field results confirm that the effluent plume is generally confined to within 20
km of the bay outfall.
1) We need to improve our understanding of the system with high resolution data sets such as those currently being collected at the GoMOOS and USGS moorings (Note that MWRA is playing a proactive role in augmenting current mooring instrumentation and planning to replace the USGS mooring in fall 2006)
2005 Annual Water Column Monitoring Report November 2006
4-2
2) We recognize the importance of coupling high-resolution physical oceanographic data with survey data and potentially moored instrument data measuring chemical and biological parameters.
3) Can new technologies (moorings, AUVs, etc.) augment or eventually replace ship-based surveys and provide additional insight into unresolved question?
Aesthetics
Has the clarity and/or color of water around the outfall changed?
Has the amount of floatable debris around the outfall changed?
→ No apparent changes in water clarity have been noted in the nearfield → Anthropogenic debris continues to be collected in the net tows, but there has been neither a
noticeable change in the materials collected nor in the quantity of debris, except for small grease-like balls of material observed during the majority of the post-diversion net tows. This material consists of grease, unidentified algae and a variety of different bacteria.
→ Increase in presence and abundance of Thalassionema nitzschoides in the tows. This phytoplankton species is ubiquitous, but usually at low abundance. The increase is likely related to artificial physical conditions at the outfall site similar to upwelling regimes where this species thrives.
4) The data to date have not shown a substantial increase in outfall related material. The availability of baseline data on floatable debris is limited to 1999/2000 and is not quantitative. Thus, these monitoring questions cannot be definitively addressed. However, further sampling of debris in the vicinity of the outfall will serve to document appearance of any major change in floatable debris and it should continue to be monitored.
Nutrients
Have nutrient concentrations changed in the water near the outfall?
Have nutrient concentrations changed in Massachusetts Bay or Cape Cod Bay and, if so, are they correlated with changes in the nearfield?
→ There has been a statistically significant decrease in NH4, NO3 and PO4 in Boston Harbor. → Dissolved inorganic nutrients (except SiO4) have exhibited increases throughout
Massachusetts and Cape Cod Bays at most stations. Statistically significant increases in NH4 were noted during each season in the nearfield and Broad Sound. Significant increases in NO3 and PO4 concentrations were also noted at nearfield and Broad Sound stations during the summer and fall.
→ These increases are due to both the direct input of nutrients to the nearfield by the bay outfall and by an apparent regional increase in ambient concentrations (as evidenced by the significant increase in NO3 at northern boundary stations F26 and F27).
→ Distribution (extent and direction) of the effluent plume in the nearfield is well characterized by NH4 which is an excellent tracer, albeit a non-conservative one.
→ The effluent plume, as measured during dye studies and characterized by NH4 distribution during each survey, appears to be confined to within 20 km of the bay outfall.
2005 Annual Water Column Monitoring Report November 2006
4-3
5) Although clear changes have been observed and shown to be statistically significant, there is a need to continue to track the distribution of nutrients, but more importantly utilize new technologies to understand how the increase in nutrients may impact the biota in the nearfield and beyond. This highlights the need for more highly resolved data both temporally and spatially (moored instruments, towed systems, etc.) to fully resolve the impact of NH4, in particular on phytoplankton biomass.
6) Need to distinguish between localized and regional contributions and processes to changes in nutrient concentrations.
Biology and Productivity
Has phytoplankton biomass changed and, if so, can changes be correlated with ambient water nutrient concentrations?
Has phytoplankton biomass changed in Massachusetts Bay or Cape Cod Bay and, if so, are the changes correlated with changes in the nearfield or changes in nutrient concentrations in the farfield?
→ There has been a statistically significant decrease in summer chlorophyll levels in Boston Harbor, but not on an annual basis due to the increased concentrations during the winter/spring bloom.
→ A statistically significant decrease in POC has been observed in Boston Harbor on a seasonal and annual basis.
→ Boston harbor appears to be changing from a eutrophic system dominated by summer blooms to a more temperate coastal water system more similar to the nearfield area where phytoplankton biomass is dominated by winter/spring and fall.
→ Seasonal and annual mean chlorophyll levels have increased in the nearfield, but not significantly.
→ Winter/spring phytoplankton biomass concentrations have increased post-diversion throughout most of the monitoring area. This is likely due to the consistent occurrence of Phaeocystis blooms every year since 2000.
→ Station-specific increases in chlorophyll levels have been observed during the winter/spring period in the nearfield and nearby stations in the harbor (F23), coastal (F24 and F13), and offshore (F06 and F10) areas.
→ Major winter/spring and fall blooms consistently appear to be regional phenomena.
7) Given the high variability in phytoplankton biomass seasonally and interannually, additional, and perhaps more focused, monitoring will be required before the extent of the changes can be determined in the nearfield (significant increase vs. changes within the noise).
8) Although there is no clear indication that the winter/spring increases in biomass are related to the outfall, the location of the stations with significant increases is in the nearfield and vicinity – especially the nearby ‘downstream’ stations in southern Massachusetts Bay. This warrants further investigation.
9) The current monitoring scheme is designed to detect large changes in phytoplankton biomass due to the outfall, but more subtle changes plausibly related to the outfall are undersampled – extension in the duration of blooms, localized increases in biomass (in summer, near the pycnocline), etc. Innovative approaches and new technologies may provide a mechanism to address these more subtle impacts.
2005 Annual Water Column Monitoring Report November 2006
4-4
Have production rates changed in the vicinity of the outfall or Boston Harbor and, if so, can these changes be correlated with changes in ambient water nutrient concentrations?
→ Primary production rates have decreased significantly (~48%) in Boston Harbor on an annual basis even though they appear to have increased during the winter/spring bloom.
→ Boston Harbor appears to be changing from a eutrophic system dominated by summer production to a more temperate coastal water system like the nearfield area that is dominated by winter/spring blooms, but this change is not as pronounced as was indicated by the first few years of post-diversion data.
→ There have been no clear changes in primary production in the nearfield.
10) As is the case with the biomass data, the limited dataset precludes any final determination of impact or lack thereof – additional monitoring is needed and it may be fruitful to revisit the application of productivity models in order to leverage the large dataset available from other stations (light, biomass, etc. measured at many more than the three productivity stations).
Has phytoplankton or zooplankton species composition changed in the vicinity of the outfall and, if so, can these changes be correlated with ambient water nutrient concentrations?
Has phytoplankton or zooplankton species composition changed in Massachusetts Bay or Cape Cod Bay and, if so, can the changes be correlated with changes in the nearfield or changes in nutrient concentrations in the farfield?
Has the abundance of nuisance or noxious phytoplankton species changed?
→ Overall species composition of the plankton communities has remained relatively consistent in the taxa present and the variability in the abundance of these taxa from year to year. No dramatic changes have been evident and all changes are well within the envelope-of-variability established during baseline.
→ Unlike the increases that have been observed in seasonal and annual biomass and production in the nearfield, no such increases have been seen in phytoplankton abundance.
→ There has been an increase in the occurrence of Phaeocystis blooms from a 2-3 yr cycle during the baseline to annually since 2000 – the reasons for this change and the extended duration of the blooms in 2002 through 2005 are unknown, but it appears to be part of a regional pattern possibly related to variability in water temperature and unrelated to the outfall.
→ Ecological dynamics appear to change relative to the occurrence of a spring Phaeocystis bloom such as a disconnect between bloom production rates and phytoplankton biomass and a decrease in zooplankton abundance as Phaeocystis biomass increases.
→ The extraordinary 2005 A. fundyense bloom was the first notable appearance of this species in the bays since the 1993 toxicity event and is a clear change in the abundance of this nuisance species in Massachusetts Bay. However, the primary factors contributing to the 2005 bloom development in the Gulf of Maine and transport into Massachusetts Bay are regional in nature and unrelated to the bay outfall.
→ The 2005 bloom is certainly a change for the Massachusetts Bays system, and may signal a change in abundance patterns in the future, with more frequent and higher levels of toxicity in the Bays. This occurred for two decades following a 1972 A. fundyense bloom of similar magnitude.
2005 Annual Water Column Monitoring Report November 2006
4-5
→ Dramatic changes in the zooplankton community have not been seen, nor, upon further examination of the presumptions on which the monitoring questions were based, are dramatic changes expected (subtle changes may occur, but will be much more difficult to both detect or attribute).
→ Although the zooplankton community has not changed, decreases in zooplankton abundance post-diversion have been observed, but no clear reason for this has been noted.
11) The 2005, and now 2006, A. fundyense blooms were the focus of intensive monitoring efforts. The data collected are still being analyzed. The findings will be presented in an upcoming interpretive report.
12) The primary factors contributing to the development of the A. fundyense blooms are regional in nature. However, it is unclear at this time whether or not the outfall has any localized effects on bloom magnitude or duration. Our initial findings indicate that there is no smoking gun, but data analyses and modeling studies are examining this issue more closely.
13) The occurrence and duration of the Phaeocystis blooms continue to be the focus of study and are examined in detail in the 2005 Nutrient Issues Review (Libby et al. 2006b). The changes in these blooms that have occurred are coincident with the transfer of effluent to the bay outfall and will continue to have the potential to be associated with the outfall until a clearer explanation can be given.
14) Data need to be evaluated in light of long-term temperature data for the region and comparative studies undertaken using data from other water bodies in the greater Gulf of Maine system.
15) There is a need for continued information on plankton community structure to assess subtle changes in the system – long-term impact?
Dissolved Oxygen
Has dissolved oxygen in the nearfield changed relative to baseline and, if so, can changes be correlated with effluent or ambient water nutrient concentrations?
Has dissolved oxygen changed in Massachusetts Bay or Cape Cod Bay and, if so, are the changes correlated with changes in the nearfield or changes in nutrient concentrations in the farfield?
Does dissolved oxygen in the water column meet the State Water Quality Standard in the nearfield and farfield?
→ No change has been observed in the relative level of DO minima in the nearfield or farfield or in the seasonal rate of decline from April-June to October when annual minima are typically measured.
→ DO minima (concentration and percent saturation) in the nearfield and Stellwagen Basin are often below established numeric thresholds and standards, but this has consistently been the case since 1992.
→ Modeling and statistical analyses indicate that there is a strong correlation between nearfield and farfield (boundary) bottom water DO, which suggests DO levels are controlled by large scale regional processes.
→ Advection has been shown to be one of the primary factors governing bottom water DO concentrations (likely due to residence time rather than movement of higher or lower DO waters).
2005 Annual Water Column Monitoring Report November 2006
4-6
16) Data resolution on the scale of weeks or months is not conducive to understanding the shorter term variability – the availability of in situ DO sensors on the GoMOOS and USGS moorings should provide additional insight on short term changes and could serve as the basis for in-depth analysis of the mechanisms influencing the variability of DO (horizontal advection, vertical exchange or local biological processes).
In summary, the changes in the nutrient regimes following diversion are unambiguous – NH4 has dramatically decreased in Boston Harbor and nearby coastal waters while increasing in the nearfield. In Boston Harbor, the dramatic decrease in NH4 has been concomitant with significant decreases in chlorophyll and POC, lower production, and an ongoing change in the seasonal productivity from a eutrophic to more normal temperate coastal pattern. Although the effluent plume is consistently observed in the nearfield, detectable levels are confined to an area within about 20 km of the outfall. There are no indications that the higher nearfield NH4 concentrations have translated into significant changes in biomass, whether measured as chlorophyll, POC, or phytoplankton abundance, although there appear to have been increases in winter/spring and fall bloom biomass in the nearfield and subtle plankton community changes. The MWRA ambient water quality monitoring program may be at a nexus in which the focus of the program needs to be reevaluated. Substantial changes in the ecosystem have not resulted from the transfer of the effluent discharge from Boston Harbor to Massachusetts Bay. However, there have been a number of minor or more subtle changes that have been observed. To understand if and how the bay outfall may be contributing to these subtle changes will likely require a new measurement focus to address key ecological and biological process factors. However, motivation for pursuing this should be balanced by the lack of substantive adverse impact from the outfall relocation.
2005 Annual Water Column Monitoring Report November 2006
5-1
5.0 REFERENCES Anderson DM, Kulis DM, Doucette GJ, Gallager JC, and Balech E. 1994. Biogeography of toxic dinoflagellates in the genus Alexandrium from the northeast United States and Canada as determined by morphology, bioluminescence, toxin composition, and mating compatibility. Marine Biology 120, 467–478. Anderson DM. 1997. Bloom dynamics of toxic Alexandrium species in the northeastern U.S. Limnology and Oceanography 42:1009-1022. Anderson DM, Keafer BA, Churchill JH, and Loder TC. 2002. Post-outfall surveys of toxic Alexandrium fundyense populations in Massachusetts Bay, 2001. Boston: Massachusetts Water Resources Authority. Report 2002-08. 36 p. Anderson DM, Keafer BA, McGillicuddy DJ, Mickelson MJ, Keay KE, Libby PS, Manning JP, Mayo CA, Whittaker DK, Hickey JM, He R, Lynch DR, and Smith KW. 2005a. Initial observations of the 2005 Alexandrium fundyense bloom in southern New England: General patterns and mechanisms. Deep-Sea Research II 52 (19-21), 2856-2876.
Anderson DM, Stock CA, Keafer BA, Bronzino Nelson A, Thompson B, McGillicuddy DJ, Keller M, Matrai PA, and Martin J. 2005b. Alexandrium fundyense cyst dynamics in the Gulf of Maine. Deep-Sea Res. II 52(19-21): 2522-2542. Beardsley RC, Butman B, Geyer WR, and Smith P. 1997. Physical oceanography of the Gulf of Maine: An update. In: Proceedings of the Gulf of Maine Ecosystem Dynamics: A Scientific symposium and Workshop. Editors: G. Wallace and E. Braasch. RARGOM, RARGOM Report 97-1, 352 pp.
Beare DJ and McKenzie E. 1999. Connecting ecological and physical time-series: the potential role of changing seasonality. Mar. Ecol. Prog. Ser. 178: 307-309. Behrenfeld MJ and Falkowski PG. 1997. Photosynthetic rates derived from satellite-based chlorophyll concentration. Limnology and Oceanography 42(1):1-20.
Bigelow HB. 1926. Plankton of the offshore waters of the Gulf of Maine. Bull. U. S. Bur. Fish. 40: 1-509. Bigelow HB. 1927. Physical oceanography of the Gulf of Maine. Bull. U. S. Bur. Fish. 969: 1-519.
Broekhuizen N and McKenzie E. 1995. Patterns of abundance for Calanus and smaller copepods in the North Sea: time series decomposition of two CPR data sets. Mar. Ecol. Prog. Ser. 118:103-120.
Brooks DA. 1985. Vernal circulation in the Gulf of Maine. J. Geophys. Res. 90: 4687-4705.
Butman B. 1975. On the dynamics of shallow water currents in Massachusetts Bay and on the New England Continental Shelf. Ph.D. Dissertation, Massachusetts Institute of Technology and Woods Hole Oceanographic Institution, Woods Hole Oceanographic Institution Technical Report 77-15.
Clarke KR and Gorley RN. 2001. PRIMER v5.2.9 Software for Windows. Plymouth Marine Laboratory, Plymouth, England.
2005 Annual Water Column Monitoring Report November 2006
5-2
Cushing DH. 1989. A difference in structure between ecosystems in strongly stratified waters and in those that are only weakly stratified. J. Plankt. Res. 11: 1-13. Dickson RR, Colebrook JM, and Svendsen E. 1992. Recent changes in the summer plankton of the North Sea. ICES Mar. Res. Symnp. 195: 232-242.
EPA. 1988. Boston Harbor Wastewater Conveyance System. Supplemental Environmental Impact Statement (SEIS). Boston: Environmental Protection Agency Region 1. Franks PJS and Anderson DM. 1992a. Alongshore transport of a toxic phytoplankton bloom in a buoyancy current: Alexandrium tamarensis in the Gulf of Maine. Marine Biology 112, 153–164. Franks PJS and Anderson DM. 1992b. Toxic phytoplankton blooms in the southwestern Gulf of Maine: testing hypotheses of physical control using historical data. Marine Biology 112, 165–174.
Geyer W, Gardner GB, Brown W, Irish J, Butman B, Loder T, and Signell RP. 1992. Physical Oceanographic Investigation of Massachusetts and Cape Cod Bays, Technical Report MBP-92-03, Massachusetts Bays Program, U.S. EPA Region I/Massachusetts Coastal Zone Management Office, Boston, Massachusetts. 497 pp. Geyer WR, Libby PS, and Giblin A. 2002. Influence of physical controls on dissolved oxygen variation at the outfall site. Boston: Massachusetts Water Resources Authority. Letter Report. 20 p. Geyer WR, Signell RP, Fong DA, Wang J, Anderson DM and Keafer BP. 2004. The freshwater transport and dynamics of the Western Maine Coastal Current. Continental Shelf Research, 24 (12): 1339-1357 Havskum H, Hansen PJ, and Berdalet E. 2005. Effect of turbulence on sedimentation and net population growth of the dinoflagellate Ceratium tripos and interactions with its predator Fragilidium subglobosum. Limnol. Oceanogr. 50: 1543-1551. Holligan PM. 1987. The physical environment of exceptional phytoplankton blooms in the Northeast Atlantic. Rapp. P-v. Reun. Cons. Int. Explor. Mer. 187: 9-18.
Huntley M, Tande K, and Eilertsen HC. 1987. On the trophic fate of Phaeocystis pouchetii (Hariot). II. Grazing rates of Calanus hyperboreus (Kroyer) on diatoms and different size categories of Phaeocystis pouchetii. J. Exp. Mar. Biol. Ecol. 110: 197-212. Hyde KJW. 2006. Interannual and seasonal phytoplankton variability in Massachusetts Bay from remote and in situ measurements. Narragansett, RI. University of Rhode Island, Graduate School of Oceanography. Ph.D. Dissertation
HydroQual. 2001. Boundary sensitivity for the Bays Eutrophication Model (BEM). Boston: Massachusetts Water Resources Authority. Report 2001-14. 90 p.
Keafer BA, Churchill JH, McGillicuddy DJ, Anderson DM. 2005. Bloom development and transport of toxic Alexandrium fundyense populations within a coastal plume in the Gulf of Maine. Deep-Sea Research II 52 (19–21), 2674–2697.
Keller AA, Taylor C, Oviatt C, Dorrington T, Holcombe G, and Reed L. 2001. Phytoplankton production patterns in Massachusetts Bay and the absence of the 1998 winter-spring bloom. Mar. Biol. 138: 1051-1062.
2005 Annual Water Column Monitoring Report November 2006
5-3
Libby PS. 2006. Standing survey plan: rapid response Alexandrium survey. Boston: Massachusetts Water Resources Authority. Report 2006-05. 19 p. Libby PS, Hunt CD, McLeod LA, Geyer WR, Keller AA, Oviatt CA, Borkman D, and Turner JT. 2001. 2000 annual water column monitoring report. Boston: Massachusetts Water Resources Authority. Report 2001-17. 196 p.
Libby PS, Geyer WR, Keller AA, Turner JT, Borkman D, Oviatt CA, and Hunt CD. 2003. 2002 annual water column monitoring report. Boston: Massachusetts Water Resources Authority. Report 2003-09. 111 p Libby PS, Geyer WR, Keller AA, Turner JT, Borkman D, and Oviatt CA. 2004. 2003 annual water column monitoring report. Boston: Massachusetts Water Resources Authority. Report 2004-07. 154p. Libby PS, Mansfield AD, Keller AA, Turner JT, Borkman DG, and Oviatt CA. 2005a. Semiannual water column monitoring report: February – June 2005. Boston: Massachusetts Water Resources Authority. Report 2005-19. 325 p. Libby PS, Gagnon C, Albro C, Mickelson M, Keller A, Borkman D, Turner J, and Oviatt CA. 2005b. Combined work/quality assurance plan for baseline water quality monitoring: 2004-2005. Boston: Massachusetts Water Resources Authority. Report ms-074 Version 1. 76 pp + apps. Libby PS, Geyer WR, Keller AA, Mansfield AD, Turner JT, Borkman D, and Oviatt CA. 2006a. 2004 annual water column monitoring report. Boston: Massachusetts Water Resources Authority. Report 2006-15. 177 p. Libby PS, Brawley JW, Borkman D, and Hunt CD. 2006b. 2005 nutrient issues review. Boston: Massachusetts Water Resources Authority. Report 2006-02. Little RC, Milliken GA, Stroup WW, Wolfinger RD, and Schabenberger O. 2006. SAS for Mixed Models, Second Edition. Cary, NC: SAS Institute, Inc. Luerssen RM, Thomas AC, and Hurst J. 2005. Relationships between satellite-measured thermal features and Alexandrium imposed toxicity in the Gulf of Maine. Deep-Sea Research II 52 (19–21), 2656–2673. Lynch DR, Holboke MJ, and Naimie CE. 1997. The Maine coastal current: spring climatological circulation. Continental Shelf Research 17, 605–634. Manohar-Maharaj V and Beardsley RC. 1973. Spring run-off in Massachusetts Bay. Sea Grant Report No. MITSG 74-9, 108pp. McGillicuddy DJ, Anderson DM, Lynch DR, and Townsend DW. 2005. Mechanisms regulating large-scale seasonal fluctuations in Alexandrium fundyense populations in the Gulf of Maine: results from a physical-biological model. Deep-Sea Research II 52 (19–21), 2698–2714. MWRA. 1991. Massachusetts Water Resources Authority effluent outfall monitoring plan: Phase I baseline studies. Boston: Massachusetts Water Resources Authority. Report ms-02. 95p. MWRA. 1997. Massachusetts Water Resources Authority effluent outfall monitoring plan: Phase II post discharge monitoring. Boston: Massachusetts Water Resources Authority. Report ms-044. 61 p.
2005 Annual Water Column Monitoring Report November 2006
5-4
MWRA. 2001. Massachusetts Water Resources Authority Contingency Plan Revision 1. Boston: Massachusetts Water Resources Authority. Report ms-071. 47 p. MWRA. 2003. Briefing for OMSAP workshop on ambient monitoring revisions: June 18-19, 2003. Boston: Massachusetts Water Resources Authority. Report ms-085. 250 p. MWRA. 2004. Massachusetts Water Resources Authority Effluent Outfall Ambient Monitoring Plan Revision 1. Boston: Massachusetts Water Resources Authority. Report ms-092. Rex A, Taylor DI. 2000. Combined Work/Quality Assurance Project Plan (CW/QAPP) for water quality monitoring and combined sewer overflow receiving water monitoring in Boston Harbor and its tributary rivers. Boston: Massachusetts Water Resources Authority. Report 1-ms-067. 48 p.
Schoemann V, Becquevort S, Stefels J, Rousseau V, and Lancelot C. 2005. Phaeocystis blooms in the global ocean and their controlling mechanisms: a review. J. Sea. Res. 53: 43-66. Scholin CA, Hallegraeff GM, and Anderson DM. 1995. Molecular evolution and global dispersal of toxic dinoflagellates of the Alexandrium tamarense (Dinophyceae) ‘‘species complex’’. Phycologia 34 (6), 472–485.2.
Signell RP, Jenter HL, and Blumberg AF. 1996. Circulation and effluent dilution modeling in Massachusetts Bay: Model implementation, verification and results. US Geological Survey Open File Report 96-015, Woods Hole MA. Smayda TJ. 1980. Phytoplankton Species Succession. In: I. Morris (ed.), The Physiological Ecology of Phytoplankton. University of California Press, Los Angeles, p.493-569.
Taylor DI. 2006. 5 years after transfer of Deer Island flows offshore: an update of water-quality improvements in Boston Harbor. Boston: Massachusetts Water Resources Authority. Report 2006-16. Townsend DW, Pettigrew NR, and Thomas AC, 2001. Offshore blooms of the red tide dinoflagellate, Alexandrium sp., in the Gulf of Maine. Continental Shelf Research 21, 347–369. Turner, J. T., A. Ianora, F. Esposito, Y. Carotenuto, and A. Miralto. 2002. Zooplankton feeding ecology: does a diet of Phaeocystis support good copepod grazing, survival, egg production and egg hatching success? J. Plankton Res. 24: 1185-1195.

APPENDICES
2005 Annual Water Column Monitoring Report November 2006
i
TABLE OF CONTENTS
A. Physical Characterization................................................................................................................... A-1 A.1 Forcing conditions.................................................................................................................... A-1
A.1.a Freshwater run-off....................................................................................................... A-1 A.1.b Wind Forcing............................................................................................................... A-1 A.1.c Air Temperature .......................................................................................................... A-1
A.2 Water Temperature................................................................................................................... A-4 A.3 Salinity A-4 A.4 Offshore Conditions: GoMOOS Moored Observations ........................................................... A-4 A.5 Dissolved Oxygen .................................................................................................................... A-5 A.6 Summary of 2005 Physical Conditions .................................................................................... A-5
B. Water Quality ..................................................................................................................................... B-1 B.1 Summary of 2005 Results ........................................................................................................ B-1
B.1.a Nutrients: ..................................................................................................................... B-2 B.1.b Phytoplankton Biomass:.............................................................................................. B-3 B.1.c Dissolved Oxygen: ...................................................................................................... B-5
B.2 Interannual Comparisons.......................................................................................................... B-6 B.2.a Nutrients: ..................................................................................................................... B-6 B.2.b Phytoplankton Biomass:.............................................................................................. B-8 B.2.c Dissolved Oxygen: .................................................................................................... B-10
B.3 Water Quality Summary......................................................................................................... B-10
C. Productivity ........................................................................................................................................ C-1 C.1 Productivity Overview ............................................................................................................. C-1
C.1.a Nearfield Description .................................................................................................. C-2 C.1.b Boston Harbor Description.......................................................................................... C-3
C.2 Interannual Comparisons.......................................................................................................... C-3 C.2.a Areal Productivity ....................................................................................................... C-3 C.2.b Depth Averaged Chlorophyll-Specific Production ..................................................... C-3 C.2.c Regional Changes in Bloom Magnitude ..................................................................... C-4 C.2.d Annual Productivity .................................................................................................... C-5 C.2.e Modeled Production Approach ................................................................................... C-5 C.2.f Alterations in Sampling Scheme ................................................................................. C-7
C.3 Summary .................................................................................................................................. C-7
D. Plankton ............................................................................................................................................. D-1 D.1 Summary of 2005 Results ........................................................................................................ D-1 D.2 Interannual Comparisons.......................................................................................................... D-1
D.2.a Phytoplankton Community Composition .................................................................... D-1 D.2.b Interannual Phytoplankton Comparisons .................................................................... D-2 D.2.c Zooplankton Communities .......................................................................................... D-8
D.3 Plankton Summary ................................................................................................................. D-10
2005 Annual Water Column Monitoring Report November 2006
ii
LIST OF TABLES
Table A-1. Seasonal river discharge summary for Charles and Merrimack Rivers. ................. A-2 Table A-2. Southerly wind stress............................................................................................... A-3 Table A-3. Seasonally averaged wind speed in m/s at the Boston buoy. .................................. A-3 Table A-4. Average winter air temperature at the Boston buoy, 1992-2005............................. A-4 Table C-1. Comparison of potential annual productivity calculated using the original
approach and the alternate approach........................................................................ C-5 Table C-2. SeaWiFS VGMB modeled estimates of mean annual primary production and
areal production in Massachusetts Bay.................................................................... C-7 Table D-1. 2005 Monthly mean nearfield Ceratium abundance levels compared to the
corresponding long-term monthly mean nearfield Ceratium levels. ....................... D-6 Table D-2. Results of t-tests comparing monthly, quarterly and mean annual Ceratium
abundance during two time periods: 1992-2001 and 2002-2005............................. D-7
LIST OF FIGURES
Figure A-1. River discharge at the Merrimack River and the Charles River, from 1992 through 2005 .......................................................................................................... A-6
Figure A-2. Comparison of the 2005 discharge of the Charles and Merrimack Rivers with the observations of the past 15 years.............................................................. A-7
Figure A-3. Monthly average N-S wind stress at Boston buoy for 2005compared with the previous 11 years of observations .................................................................... A-7
Figure A-4. N-S component of wind stress and significant wave height at the Boston Buoy during April to July of 2005. ........................................................................ A-8
Figure A-5. Average significant wave height in May for all of the years of the HOM Program. ................................................................................................................. A-8
Figure A-6. Hourly air temperature for 2005 at the Boston buoy superimposed on the data from the previous 16 years ............................................................................. A-9
Figure A-7. Hourly near-surface temperature for 2005 at the Boston buoy superimposed on the data from the previous 16 years .................................................................. A-9
Figure A-8. Timeseries of near-surface and near-bottom temperature in the vicinity of the outfall.............................................................................................................. A-10
Figure A-9. Timeseries of near-surface and near-bottom salinity in the vicinity of the outfall. .................................................................................................................. A-10
Figure A-10. Timeseries of Merrimack discharge, N-S winds at the Boston Buoy, NE-SW velocity at GoMOOS-A and salinity at GoMOOS-A at 5, 25 and 50-m depth................................................................................................... A-11
Figure A-11. Timeseries of near-surface and near-bottom dissolved oxygen in the vicinity of the outfall ....................................................................................................... A-12
Figure A-12. Upper panel: Average near-bottom dissolved oxygen during September- October, compared with linear regression model based on temperature and salinity variation. Lower panel: The bar plot shows the individual contributions due to temperature and salinity for each of the years................... A-12
2005 Annual Water Column Monitoring Report November 2006
iii
Figure A-13. Data from the GoMOOS “A” mooring at the mouth of Massachusetts Bay ..... A-13 Figure B-1. Time-series of survey mean DIN concentration in Massachusetts and Cape
Cod Bays. ............................................................................................................. B-13 Figure B-2. Time-series of survey mean (a) NO3 and (b) NH4 concentration in
Massachusetts and Cape Cod Bays ...................................................................... B-14 Figure B-3. Time-series of survey mean (a) SiO4 and (b) PO4 concentration in
Massachusetts and Cape Cod Bays. ..................................................................... B-15 Figure B-4. Time-series of survey mean chlorophyll in Massachusetts and Cape Cod
Bays. ..................................................................................................................... B-16 Figure B-5. MWRA and Battelle In Situ Wetstar fluorescence data. ...................................... B-17 Figure B-6. Selected MODIS chlorophyll image for southwestern Gulf of Maine for
February through June, 2005. .............................................................................. B-18 Figure B-7. MWRA and Battelle In Situ Wetstar salinity data................................................ B-19 Figure B-8. Surface salinity contour plots from four Alexandrium rapid response surveys.... B-20 Figure B-9. Time-series of survey mean areal chlorophyll in Massachusetts and Cape
Cod Bays. ........................................................................................................... B-21 Figure B-10. Horizontal contours at mid depth during survey WF057. .................................. B-22 Figure B-11. MODIS Satellite Imagery from June 20, 2005................................................... B-23 Figure B-12. Time-series of average bottom dissolved oxygen (a) concentration and
(b) percent saturation in Massachusetts and Cape Cod Bays............................. B-24 Figure B-13. Time series plots of respiration at nearfield stations N18 and N04 in 2005. ..... B-25 Figure B-14. Time-series of survey mean (a) NO3 and (b) SiO4 concentration in the
nearfield in 2005 compared against the baseline range and mean ..................... B-26 Figure B-15. Time-series of survey mean (a) PO4 and (b) NH4 concentration in the
nearfield in 2005 compared against the baseline range and mean ..................... B-27 Figure B-16. Nearfield mean SiO4 and DIN concentrations from February through
June 2005. .......................................................................................................... B-28 Figure B-17. Time-series of survey mean (a) NH4 and (b) PO4 concentration in Boston
Harbor in 2005 compared against the baseline range and mean........................ B-29 Figure B-18. Time-series of survey mean NO3 and SiO4 concentration in Boston
Harbor in 2005 compared against the baseline range and mean........................ B-30 Figure B-19. Annual mean (a) NH4 and (b) NO3 concentration in Massachusetts and
Cape Cod Bays................................................................................................... B-31 Figure B-20. Change in winter DIN concentration from pre- to post-transfer of the
outfall location. .................................................................................................. B-32 Figure B-21. Time-series of survey mean (a) areal chlorophyll and (b) POC
concentration in the nearfield (2005) compared against the baseline range and mean ............................................................................................................ B-33
Figure B-22. Time-series of survey mean (a) areal chlorophyll and (b) POC concentration in Boston Harbor post-transfer (2005) compared against the baseline range and mean .................................................................................... B-34
Figure B-23. Time-series of survey mean (a) areal chlorophyll and (b) POC concentration in Boston Harbor post-transfer vs. baseline. ............................... B-35
Figure B-24. Annual mean (a) areal chlorophyll and (b) POC concentration in Massachusetts and Cape Cod Bays. ................................................................... B-36
2005 Annual Water Column Monitoring Report November 2006
iv
Figure B-25. Annual mean chlorophyll concentration in Massachusetts and Cape Cod Bays. .......................................................................................................... B-37
Figure B-26. Time-series of nearfield survey mean bottom water (a) DO concentrations and (b) DO %saturation in 2005 compared against the baseline range and mean. .................................................................................................................. B-38
Figure B-27. Time-series of Stellwagen Basin survey mean bottom water (a) DO concentrations and (b) DO %saturation in 2005 compared against the baseline range and mean .................................................................................... B-39
Figure B-28. Survey mean bottom water dissolved oxygen (a) concentration and (b) percent saturation in the nearfield compared to contingency threshold levels. ................................................................................................. B-40
Figure B-29. Survey mean bottom water dissolved oxygen (a) concentration and (b) percent saturation in Stellwagen Basin compared to contingency threshold levels .................................................................................................. B-41
Figure C-1. Measured and potential areal production in 2005 at stations F23, N04 and N18. ........................................................................................................................ C-9
Figure C-2. Time-series of areal production at stations N04, N18 and F23 for 2005 compared against baseline range and mean.......................................................... C-10
Figure C-3. Spring bloom peak potential areal productivity at nearfield stations N04 and N16/N18. ....................................................................................................... C-11
Figure C-4. Fall bloom peak potential areal productivity at nearfield stations N04 and N16/N18. .............................................................................................................. C-11
Figure C-5. Time-series of pre- and post-transfer areal production at station F23.................. C-12 Figure C-6. Time-series of chlorophyll-specific areal production at stations N04, N18
and F23 for 2005 compared against baseline range and mean............................. C-13 Figure C-7. Time-series of chlorophyll-specific areal production at stations (a) N04
and (b) N18 in 2005 compared against baseline range and mean using 1998-2000 data ..................................................................................................... C-14
Figure C-8. Spring, summer, and fall bloom peak production at nearfield and Boston Harbor stations...................................................................................................... C-15
Figure C-9. Nearfield mean chlorophyll vs. temperature during March for 1995-2005 ......... C-16 Figure C-10. Annual potential production for stations F23, N04 and N16/N18 pre-
and post- outfall diversion – (a) original and (b) alternative approaches. .......... C-17 Figure C-11. Time series comparison of productivity calculated based on 14C
measurements and VGMB model results at nearfield stations N04 and N18. ... C-18 Figure C-12. Annual production calculated using the VGMB model. .................................... C-18 Figure C-13. Examination of alternative sampling schemes and impact on productivity
calculations during all 2005 surveys at stations (a) N04 and (b) N18. ............... C-19 Figure D-1. Phytoplankton abundance by major taxonomic group in the nearfield and
offshore areas for 2005. ........................................................................................ D-11 Figure D-2. Phytoplankton abundance by major taxonomic group in the Boston Harbor
and coastal areas for 2005. ................................................................................... D-12 Figure D-3. Phytoplankton abundance by major taxonomic group in the boundary and
Cape Cod Bay areas for 2005. .............................................................................. D-13 Figure D-4. Zooplankton abundance by major taxonomic group in the nearfield and
offshore areas for 2005. ........................................................................................ D-14
2005 Annual Water Column Monitoring Report November 2006
v
Figure D-5. Zooplankton abundance by major taxonomic group in the Boston Harbor and coastal areas for 2005. ................................................................................... D-15
Figure D-6. Zooplankton abundance by major taxonomic group in the boundary and Cape Cod Bay areas for 2005. .............................................................................. D-16
Figure D-7. Total phytoplankton abundance by area, 1992-2005. .......................................... D-17 Figure D-8. Time-series of survey mean (a) total phytoplankton and (b) total
microflagellate abundance in the nearfield in 2005 compared against the baseline range and mean....................................................................................... D-18
Figure D-9. Time-series of survey mean (a) total diatom and (b) total dinoflagellate abundance in the nearfield in 2005 compared against the baseline range and mean............................................................................................................... D-19
Figure D-10. Time-series of survey mean (a) total phytoplankton and (b) total diatom abundance in the nearfield during baseline and post-transfer............................ D-20
Figure D-11. Time-series of survey mean (a) total microflagellate and (b) total dinoflagellate abundance in the nearfield during baseline and post-transfer..... D-21
Figure D-12. Time series of nearfield survey mean abundance Phaeocystis, 1992-2005. ...... D-22 Figure D-13. Time series of nearfield non-null sample abundance of Alexandrium,
1992-2005. ......................................................................................................... D-22 Figure D-14. Time-series of survey mean Ceratium abundance in the nearfield in 2005
compared against the baseline range and mean ................................................. D-23 Figure D-15. Monthly nearfield Ceratium abundance levels during 2002-2005 and the
long-term mean abundance levels...................................................................... D-23 Figure D-16. (a) Monthly nearfield Ceratium abundance observations during 168
months, 1992-2005. (b) Ceratium trend, 1992-2005, based on anomalies from seasonal pattern ......................................................................................... D-24
Figure D-17. One month time lagged Ceratium abundance compared to stratification during March and during May ........................................................................... D-25
Figure D-18. 2005 stratification pattern compared to long-term meanpattern.. ...................... D-26 Figure D-19. Total zooplankton abundance by area, 1992-2005............................................. D-26 Figure D-20. Time-series of survey mean total zooplankton abundance in the nearfield
in (a) 2001-2005 mean compared against the baseline mean and (b) 2005 compared against the baseline range and mean ................................................. D-27
Figure D-21. Time-series of survey mean (a) total copepod and (b) total copepod nauplii abundance in the nearfield during baseline and post transfer. ............... D-28
Figure D-22. Time-series of survey mean (a) total Oithona and (b) total Calanus abundance in the nearfield during baseline and post transfer ............................ D-29
Figure D-23. Nearfield survey mean abundance of Phaeocystis and copepod nauplii from 1992 to 2005.............................................................................................. D-30
Figure D-24. Time-series of survey mean (a) total copepods and (b) total Oithona in 2005 compared against the baseline range and mean ........................................ D-31
Figure D-25. Nearfield survey mean abundance of Calanus versus (a) copepod nauplii and (b) Oithona from 1992 to 2005. .................................................................. D-32

APPENDIX A
Physical Characterization
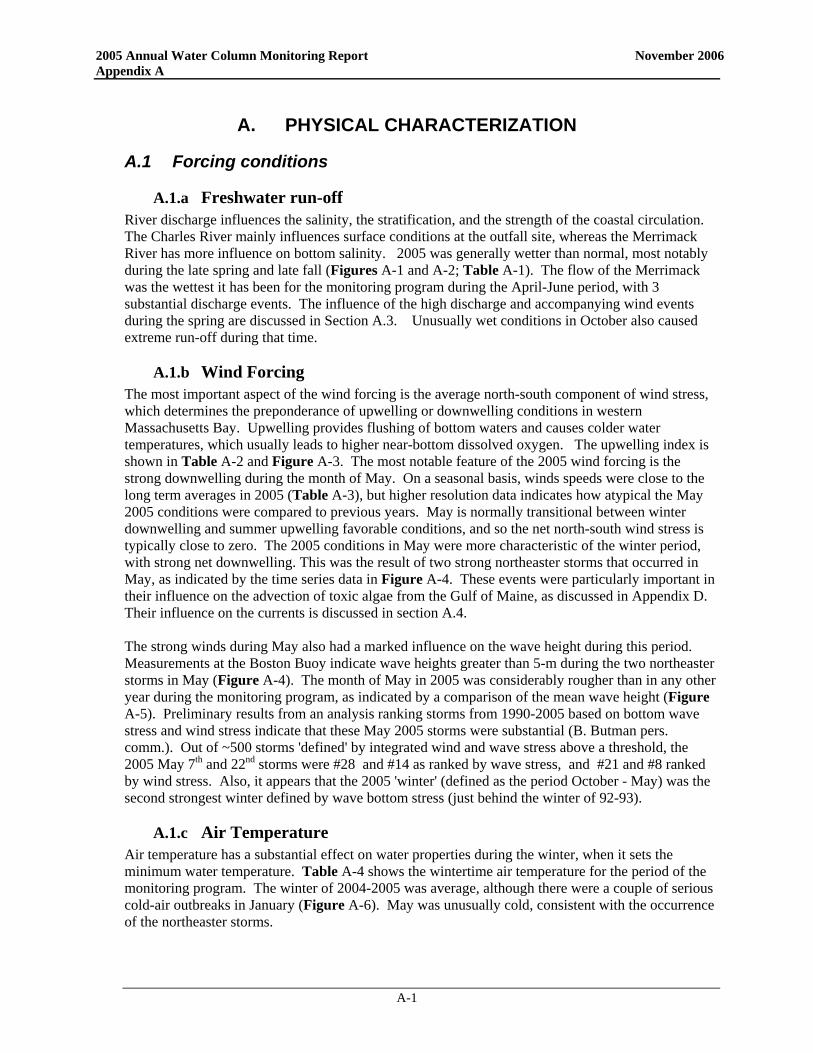
2005 Annual Water Column Monitoring Report November 2006 Appendix A
A-1
A. PHYSICAL CHARACTERIZATION
A.1 Forcing conditions
A.1.a Freshwater run-off River discharge influences the salinity, the stratification, and the strength of the coastal circulation. The Charles River mainly influences surface conditions at the outfall site, whereas the Merrimack River has more influence on bottom salinity. 2005 was generally wetter than normal, most notably during the late spring and late fall (Figures A-1 and A-2; Table A-1). The flow of the Merrimack was the wettest it has been for the monitoring program during the April-June period, with 3 substantial discharge events. The influence of the high discharge and accompanying wind events during the spring are discussed in Section A.3. Unusually wet conditions in October also caused extreme run-off during that time.
A.1.b Wind Forcing The most important aspect of the wind forcing is the average north-south component of wind stress, which determines the preponderance of upwelling or downwelling conditions in western Massachusetts Bay. Upwelling provides flushing of bottom waters and causes colder water temperatures, which usually leads to higher near-bottom dissolved oxygen. The upwelling index is shown in Table A-2 and Figure A-3. The most notable feature of the 2005 wind forcing is the strong downwelling during the month of May. On a seasonal basis, winds speeds were close to the long term averages in 2005 (Table A-3), but higher resolution data indicates how atypical the May 2005 conditions were compared to previous years. May is normally transitional between winter downwelling and summer upwelling favorable conditions, and so the net north-south wind stress is typically close to zero. The 2005 conditions in May were more characteristic of the winter period, with strong net downwelling. This was the result of two strong northeaster storms that occurred in May, as indicated by the time series data in Figure A-4. These events were particularly important in their influence on the advection of toxic algae from the Gulf of Maine, as discussed in Appendix D. Their influence on the currents is discussed in section A.4. The strong winds during May also had a marked influence on the wave height during this period. Measurements at the Boston Buoy indicate wave heights greater than 5-m during the two northeaster storms in May (Figure A-4). The month of May in 2005 was considerably rougher than in any other year during the monitoring program, as indicated by a comparison of the mean wave height (Figure A-5). Preliminary results from an analysis ranking storms from 1990-2005 based on bottom wave stress and wind stress indicate that these May 2005 storms were substantial (B. Butman pers. comm.). Out of ~500 storms 'defined' by integrated wind and wave stress above a threshold, the 2005 May 7th and 22nd storms were #28 and #14 as ranked by wave stress, and #21 and #8 ranked by wind stress. Also, it appears that the 2005 'winter' (defined as the period October - May) was the second strongest winter defined by wave bottom stress (just behind the winter of 92-93).
A.1.c Air Temperature Air temperature has a substantial effect on water properties during the winter, when it sets the minimum water temperature. Table A-4 shows the wintertime air temperature for the period of the monitoring program. The winter of 2004-2005 was average, although there were a couple of serious cold-air outbreaks in January (Figure A-6). May was unusually cold, consistent with the occurrence of the northeaster storms.
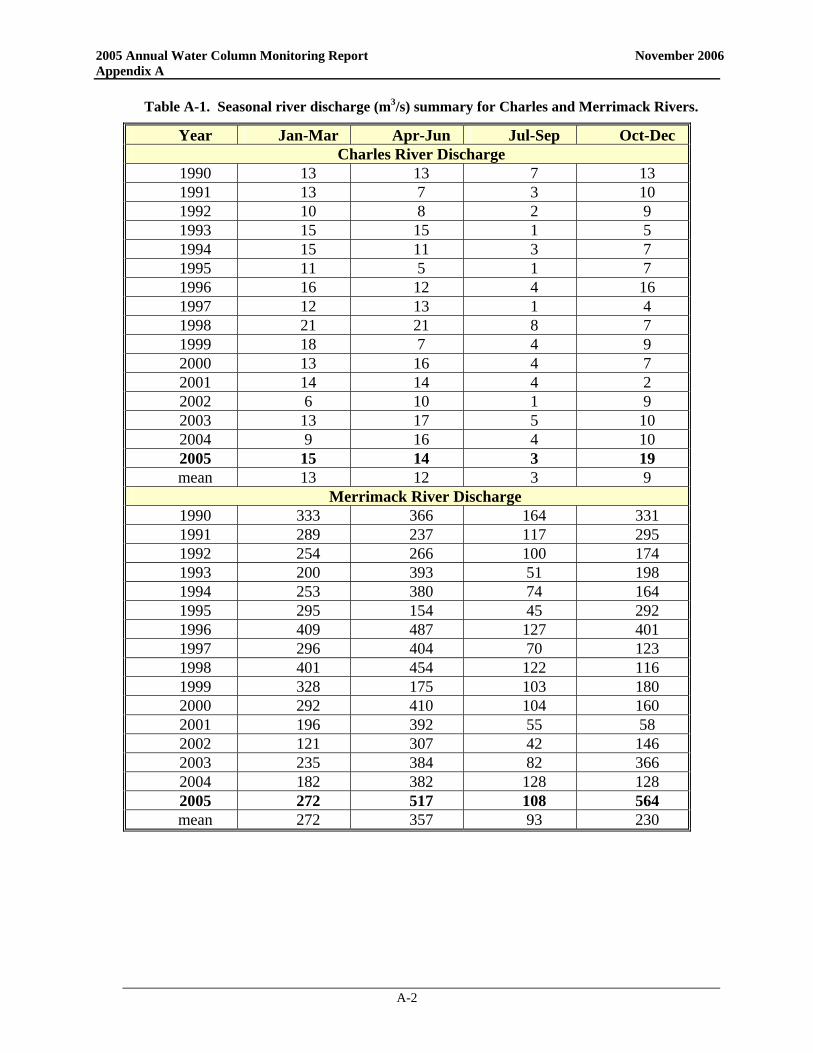
2005 Annual Water Column Monitoring Report November 2006 Appendix A
A-2
Table A-1. Seasonal river discharge (m3/s) summary for Charles and Merrimack Rivers.
Year Jan-Mar Apr-Jun Jul-Sep Oct-Dec Charles River Discharge
1990 13 13 7 13 1991 13 7 3 10 1992 10 8 2 9 1993 15 15 1 5 1994 15 11 3 7 1995 11 5 1 7 1996 16 12 4 16 1997 12 13 1 4 1998 21 21 8 7 1999 18 7 4 9 2000 13 16 4 7 2001 14 14 4 2 2002 6 10 1 9 2003 13 17 5 10 2004 9 16 4 10 2005 15 14 3 19 mean 13 12 3 9
Merrimack River Discharge 1990 333 366 164 331 1991 289 237 117 295 1992 254 266 100 174 1993 200 393 51 198 1994 253 380 74 164 1995 295 154 45 292 1996 409 487 127 401 1997 296 404 70 123 1998 401 454 122 116 1999 328 175 103 180 2000 292 410 104 160 2001 196 392 55 58 2002 121 307 42 146 2003 235 384 82 366 2004 182 382 128 128 2005 272 517 108 564 mean 272 357 93 230
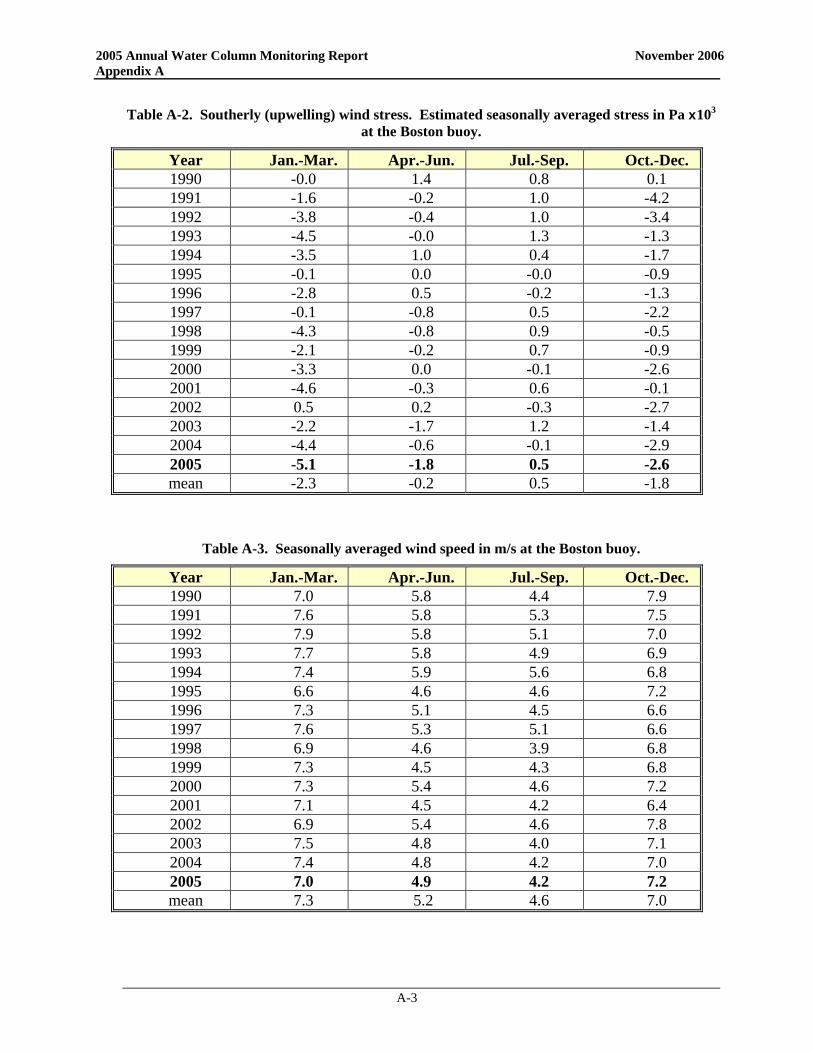
2005 Annual Water Column Monitoring Report November 2006 Appendix A
A-3
Table A-2. Southerly (upwelling) wind stress. Estimated seasonally averaged stress in Pa x103 at the Boston buoy.
Year Jan.-Mar. Apr.-Jun. Jul.-Sep. Oct.-Dec. 1990 -0.0 1.4 0.8 0.1 1991 -1.6 -0.2 1.0 -4.2 1992 -3.8 -0.4 1.0 -3.4 1993 -4.5 -0.0 1.3 -1.3 1994 -3.5 1.0 0.4 -1.7 1995 -0.1 0.0 -0.0 -0.9 1996 -2.8 0.5 -0.2 -1.3 1997 -0.1 -0.8 0.5 -2.2 1998 -4.3 -0.8 0.9 -0.5 1999 -2.1 -0.2 0.7 -0.9 2000 -3.3 0.0 -0.1 -2.6 2001 -4.6 -0.3 0.6 -0.1 2002 0.5 0.2 -0.3 -2.7 2003 -2.2 -1.7 1.2 -1.4 2004 -4.4 -0.6 -0.1 -2.9 2005 -5.1 -1.8 0.5 -2.6 mean -2.3 -0.2 0.5 -1.8
Table A-3. Seasonally averaged wind speed in m/s at the Boston buoy.
Year Jan.-Mar. Apr.-Jun. Jul.-Sep. Oct.-Dec. 1990 7.0 5.8 4.4 7.9 1991 7.6 5.8 5.3 7.5 1992 7.9 5.8 5.1 7.0 1993 7.7 5.8 4.9 6.9 1994 7.4 5.9 5.6 6.8 1995 6.6 4.6 4.6 7.2 1996 7.3 5.1 4.5 6.6 1997 7.6 5.3 5.1 6.6 1998 6.9 4.6 3.9 6.8 1999 7.3 4.5 4.3 6.8 2000 7.3 5.4 4.6 7.2 2001 7.1 4.5 4.2 6.4 2002 6.9 5.4 4.6 7.8 2003 7.5 4.8 4.0 7.1 2004 7.4 4.8 4.2 7.0 2005 7.0 4.9 4.2 7.2 mean 7.3 5.2 4.6 7.0
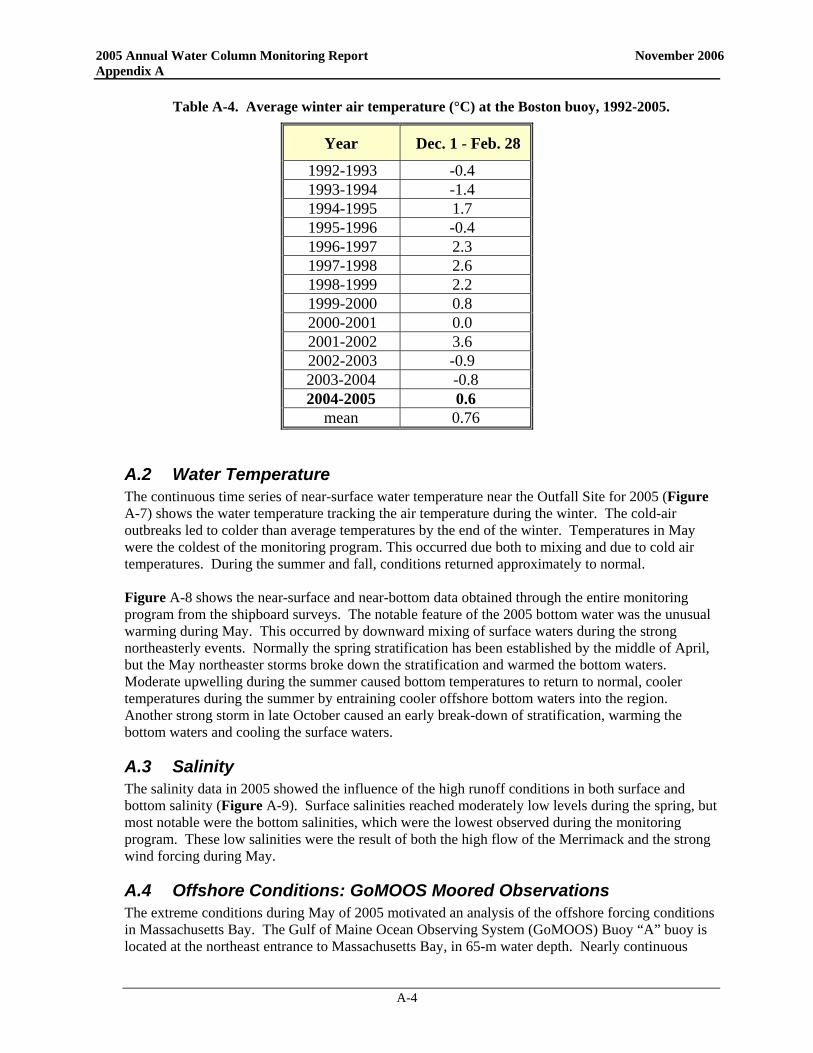
2005 Annual Water Column Monitoring Report November 2006 Appendix A
A-4
Table A-4. Average winter air temperature (°C) at the Boston buoy, 1992-2005.
Year Dec. 1 - Feb. 28
1992-1993 -0.4 1993-1994 -1.4 1994-1995 1.7 1995-1996 -0.4 1996-1997 2.3 1997-1998 2.6 1998-1999 2.2 1999-2000 0.8 2000-2001 0.0 2001-2002 3.6 2002-2003 -0.9 2003-2004 -0.8 2004-2005 0.6
mean 0.76
A.2 Water Temperature The continuous time series of near-surface water temperature near the Outfall Site for 2005 (Figure A-7) shows the water temperature tracking the air temperature during the winter. The cold-air outbreaks led to colder than average temperatures by the end of the winter. Temperatures in May were the coldest of the monitoring program. This occurred due both to mixing and due to cold air temperatures. During the summer and fall, conditions returned approximately to normal. Figure A-8 shows the near-surface and near-bottom data obtained through the entire monitoring program from the shipboard surveys. The notable feature of the 2005 bottom water was the unusual warming during May. This occurred by downward mixing of surface waters during the strong northeasterly events. Normally the spring stratification has been established by the middle of April, but the May northeaster storms broke down the stratification and warmed the bottom waters. Moderate upwelling during the summer caused bottom temperatures to return to normal, cooler temperatures during the summer by entraining cooler offshore bottom waters into the region. Another strong storm in late October caused an early break-down of stratification, warming the bottom waters and cooling the surface waters.
A.3 Salinity The salinity data in 2005 showed the influence of the high runoff conditions in both surface and bottom salinity (Figure A-9). Surface salinities reached moderately low levels during the spring, but most notable were the bottom salinities, which were the lowest observed during the monitoring program. These low salinities were the result of both the high flow of the Merrimack and the strong wind forcing during May.
A.4 Offshore Conditions: GoMOOS Moored Observations The extreme conditions during May of 2005 motivated an analysis of the offshore forcing conditions in Massachusetts Bay. The Gulf of Maine Ocean Observing System (GoMOOS) Buoy “A” buoy is located at the northeast entrance to Massachusetts Bay, in 65-m water depth. Nearly continuous
2005 Annual Water Column Monitoring Report November 2006 Appendix A
A-5
measurements of velocity, temperature, salinity and near-bottom dissolved oxygen have been conducted since 2001. Timeseries of the velocity and salinity at the GoMOOS-A buoy are shown in Figure A-10, along with timeseries of the Merrimack flow and the wind forcing. The near-surface currents (3rd panel) show four major pulses to the SE (into Massachusetts Bay), with speeds greater than 80 cm/s. Currents of this magnitude are rare in the Gulf of Maine, and their occurrence requires strong freshwater forcing combined with downwelling-favorable wind forcing. The first of these pulses (in early April) corresponds to a moderate wind event during high river flow. This velocity maximum appears to be associated with the pulse of freshwater that came from the Merrimack River following the early April freshet (note low surface salinities in early April; Figure A-10 panel 4). The next two freshwater pulses, in early and late May, occurred during intense northeaster storms (note wind pulses in Figure A-10 panel 2). Another strong wind event occurred in mid-June, resulting in the fourth large velocity pulse. The strong wind events not only caused strong transport into Massachusetts Bay; they also resulted in intense mixing of the source waters to the bay. The salinity at 20- and even 50-m depth showed a freshening during the 3 major wind events, due to downward mixing of the low-salinity plume. The combination of high flow of the Merrimack and deep mixing explains the anomalously low near-bottom salinities observed during the spring and summer of 2005.
A.5 Dissolved Oxygen The near-bottom dissolved oxygen was relatively high in 2005 (Figure A-11). This was in part the result of the strong mixing during May and in part because of the upwelling-favorable conditions in August and September (Figure A-3). The regression model based on bottom temperature and salinity (Figure A-12) indicated that high dissolved oxygen should occur, consistent with (in fact slightly higher than) the observations. The GoMOOS timeseries dissolved oxygen data were compared to the nearfield dissolved oxygen, to examine how good a predictor the farfield dissolved oxygen is for the nearfield conditions. The GoMOOS-A mooring dissolved oxygen at 50-m depth is compared to the nearfield, near-bottom dissolved oxygen in Figure A-13 (upper panel). The two timeseries track each other fairly closely, with some differences at certain time periods. Some of those differences might be due to calibration problems with the GoMOOS dissolved oxygen sensor, which is deployed for many months at a time and might be affected by fouling. A comparison of the density in the nearfield with the measured density at the GoMOOS mooring (Figure A-13, lower panel) indicates that the nearfield bottom water originates close to 25-m depth in the farfield. This is roughly the depth of the nearfield, and generally the water would be expected to remain at the same vertical position, particularly during the stratified part of the year. Some of the differences between dissolved oxygen at these two locations may be related to the depth difference between the GoMOOS DO sensor and the depth of the nearfield bottom waters.
A.6 Summary of 2005 Physical Conditions The most notable characteristic of the physical properties in 2005 was the intensity of wind forcing during the month of May. The occurrence of strong northeaster storms in combination with high river outflow caused deep mixing of the low-salinity waters, causing lower salinities and higher near-bottom dissolved oxygen levels than usual. The strong winds also produced much larger waves than usual for the month of May.
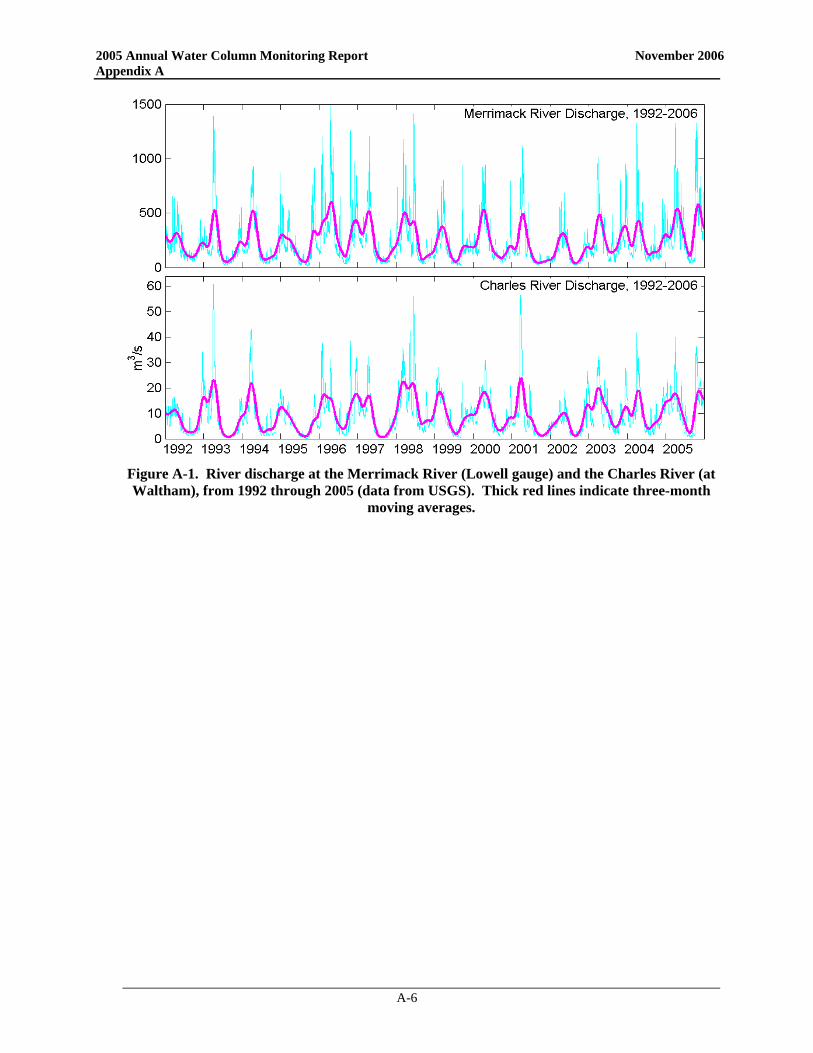
2005 Annual Water Column Monitoring Report November 2006 Appendix A
A-6
Figure A-1. River discharge at the Merrimack River (Lowell gauge) and the Charles River (at Waltham), from 1992 through 2005 (data from USGS). Thick red lines indicate three-month
moving averages.
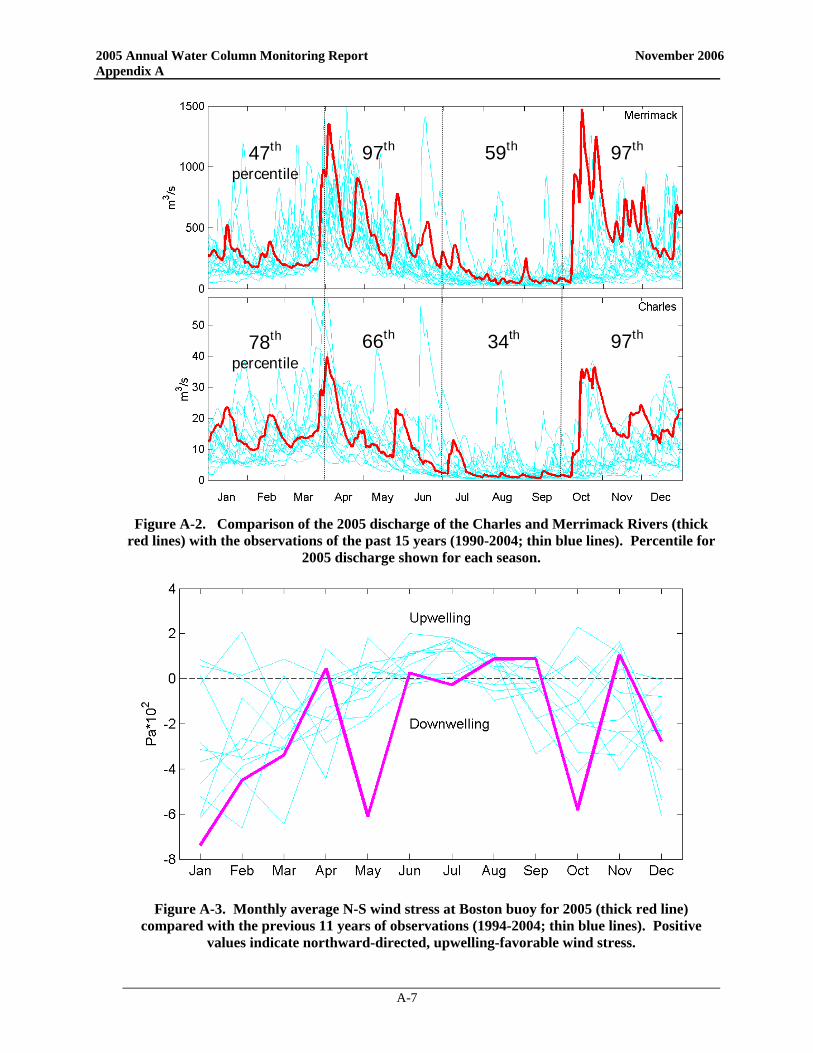
2005 Annual Water Column Monitoring Report November 2006 Appendix A
A-7
97th 47th
percentile 59th 97th
66th 78th
percentile 97th 34th
Figure A-2. Comparison of the 2005 discharge of the Charles and Merrimack Rivers (thick
red lines) with the observations of the past 15 years (1990-2004; thin blue lines). Percentile for 2005 discharge shown for each season.
Figure A-3. Monthly average N-S wind stress at Boston buoy for 2005 (thick red line)
compared with the previous 11 years of observations (1994-2004; thin blue lines). Positive values indicate northward-directed, upwelling-favorable wind stress.
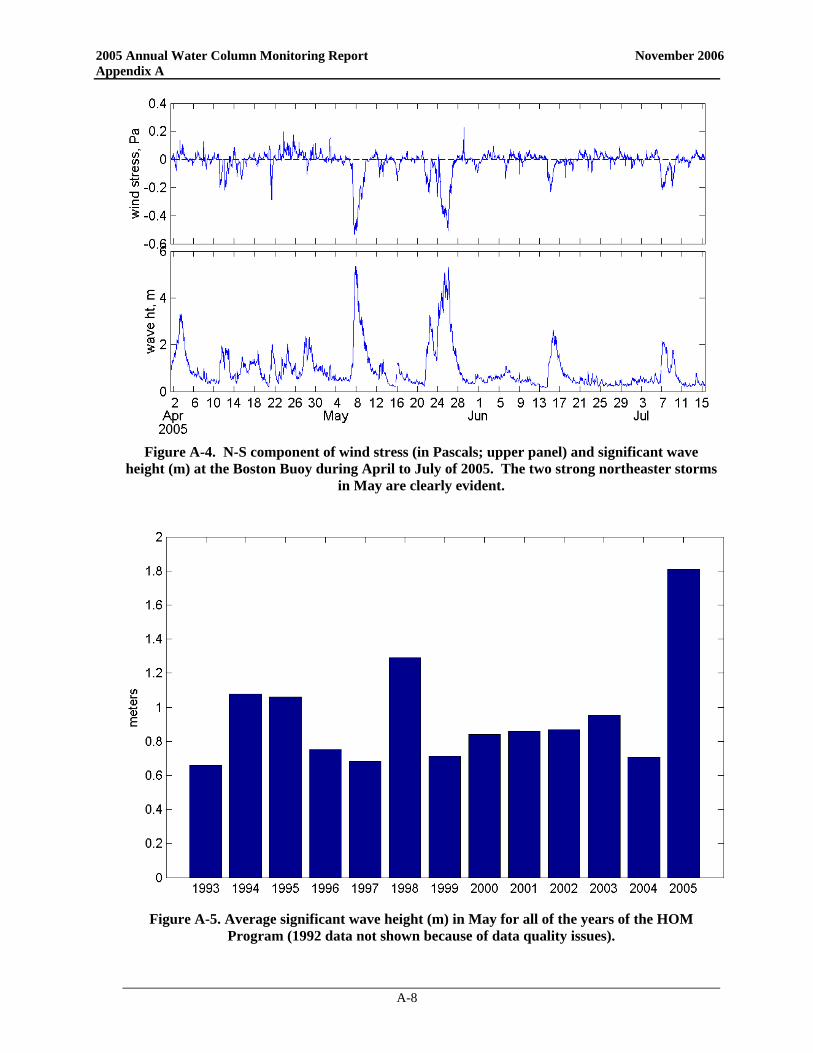
2005 Annual Water Column Monitoring Report November 2006 Appendix A
A-8
Figure A-4. N-S component of wind stress (in Pascals; upper panel) and significant wave
height (m) at the Boston Buoy during April to July of 2005. The two strong northeaster storms in May are clearly evident.
Figure A-5. Average significant wave height (m) in May for all of the years of the HOM
Program (1992 data not shown because of data quality issues).
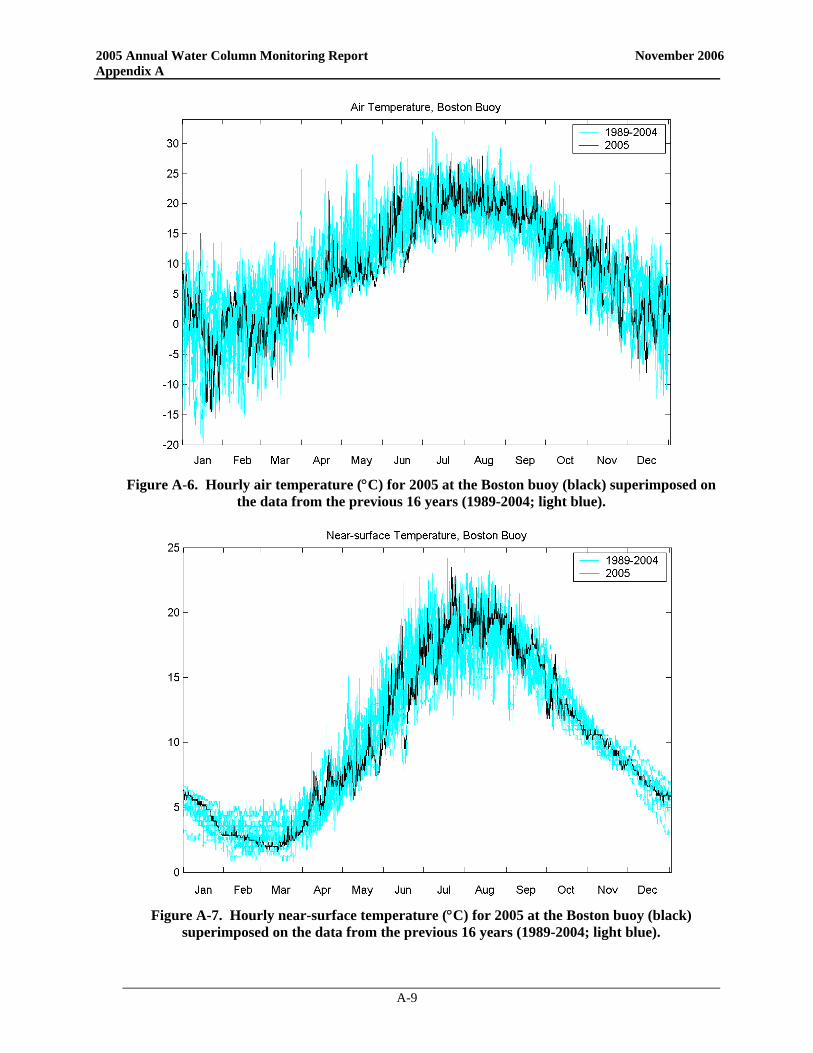
2005 Annual Water Column Monitoring Report November 2006 Appendix A
A-9
Figure A-6. Hourly air temperature (°C) for 2005 at the Boston buoy (black) superimposed on
the data from the previous 16 years (1989-2004; light blue).
Figure A-7. Hourly near-surface temperature (°C) for 2005 at the Boston buoy (black)
superimposed on the data from the previous 16 years (1989-2004; light blue).
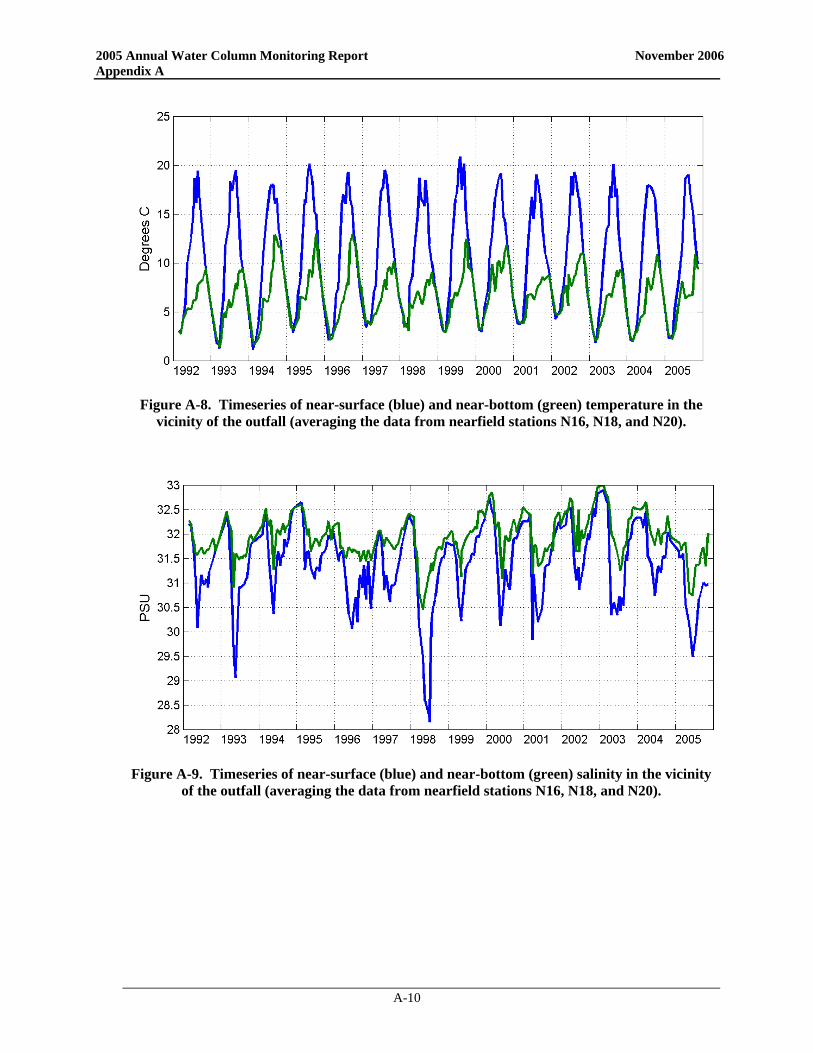
2005 Annual Water Column Monitoring Report November 2006 Appendix A
A-10
Figure A-8. Timeseries of near-surface (blue) and near-bottom (green) temperature in the
vicinity of the outfall (averaging the data from nearfield stations N16, N18, and N20).
Figure A-9. Timeseries of near-surface (blue) and near-bottom (green) salinity in the vicinity
of the outfall (averaging the data from nearfield stations N16, N18, and N20).
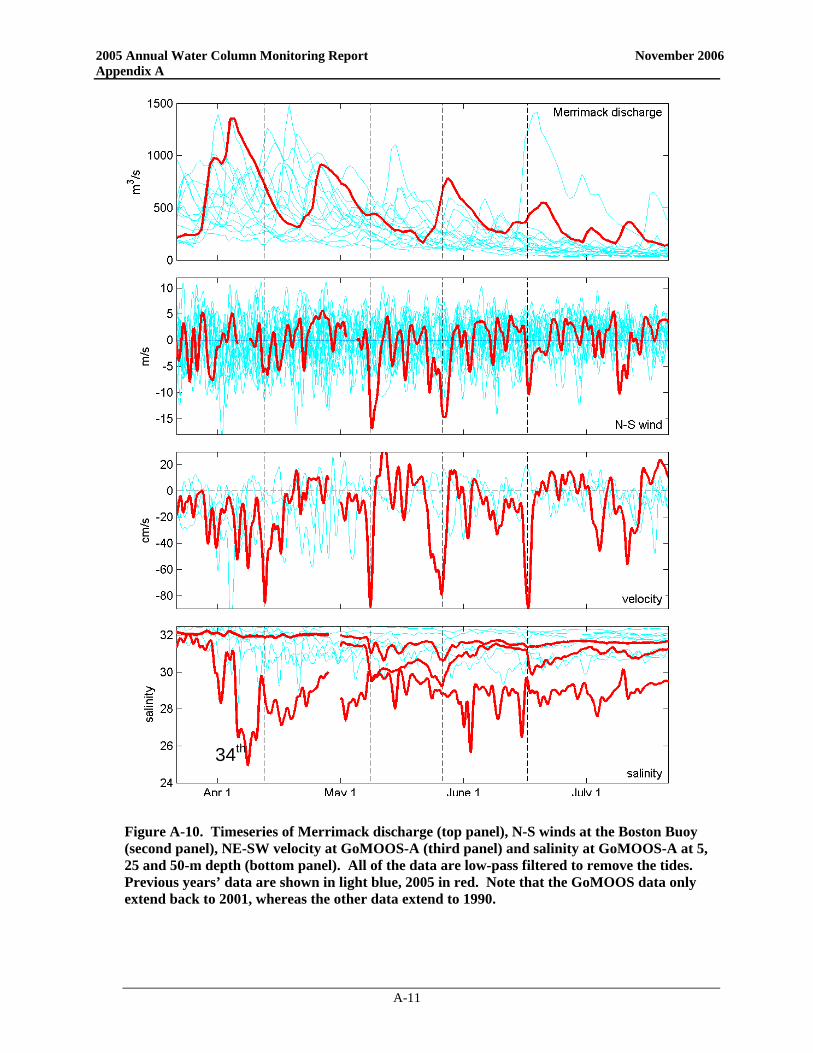
2005 Annual Water Column Monitoring Report November 2006 Appendix A
A-11
Figure A-10. Timeseries of Merrimack discharge (top panel), N-S winds at the Boston Buoy (second panel), NE-SW velocity at GoMOOS-A (third panel) and salinity at GoMOOS-A at 5, 25 and 50-m depth (bottom panel). All of the data are low-pass filtered to remove the tides. Previous years’ data are shown in light blue, 2005 in red. Note that the GoMOOS data only extend back to 2001, whereas the other data extend to 1990.
34th
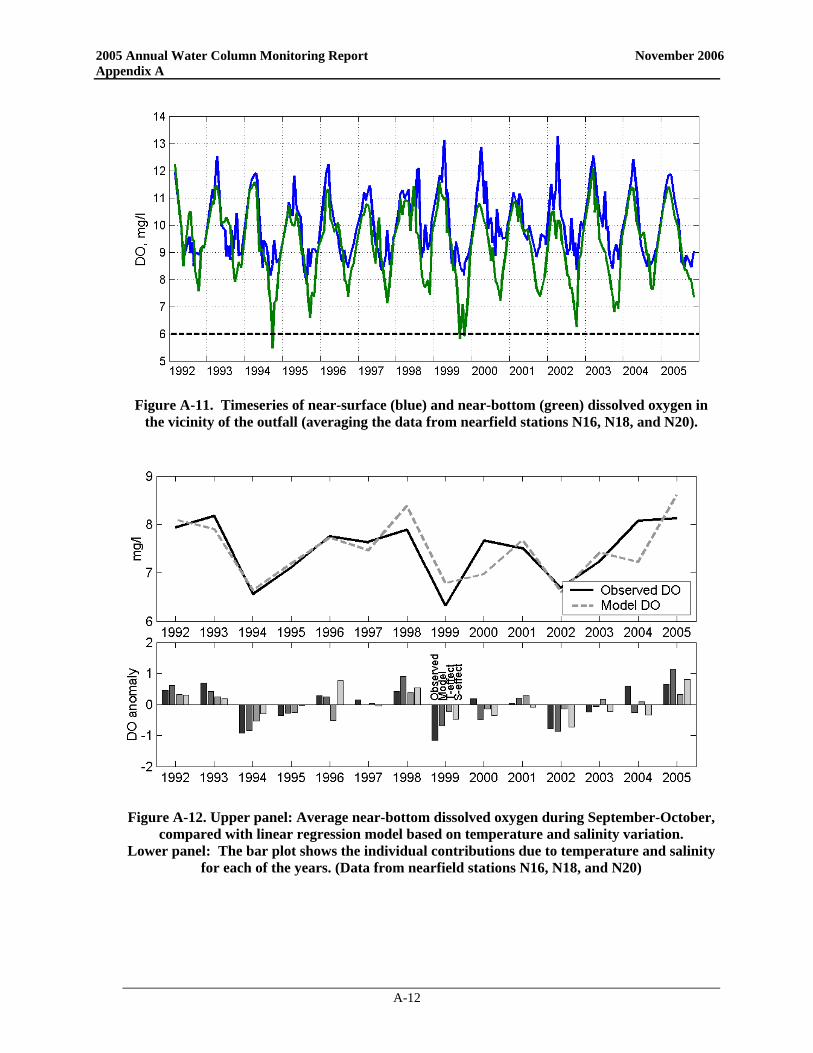
2005 Annual Water Column Monitoring Report November 2006 Appendix A
A-12
Figure A-11. Timeseries of near-surface (blue) and near-bottom (green) dissolved oxygen in
the vicinity of the outfall (averaging the data from nearfield stations N16, N18, and N20).
Figure A-12. Upper panel: Average near-bottom dissolved oxygen during September-October,
compared with linear regression model based on temperature and salinity variation. Lower panel: The bar plot shows the individual contributions due to temperature and salinity
for each of the years. (Data from nearfield stations N16, N18, and N20)
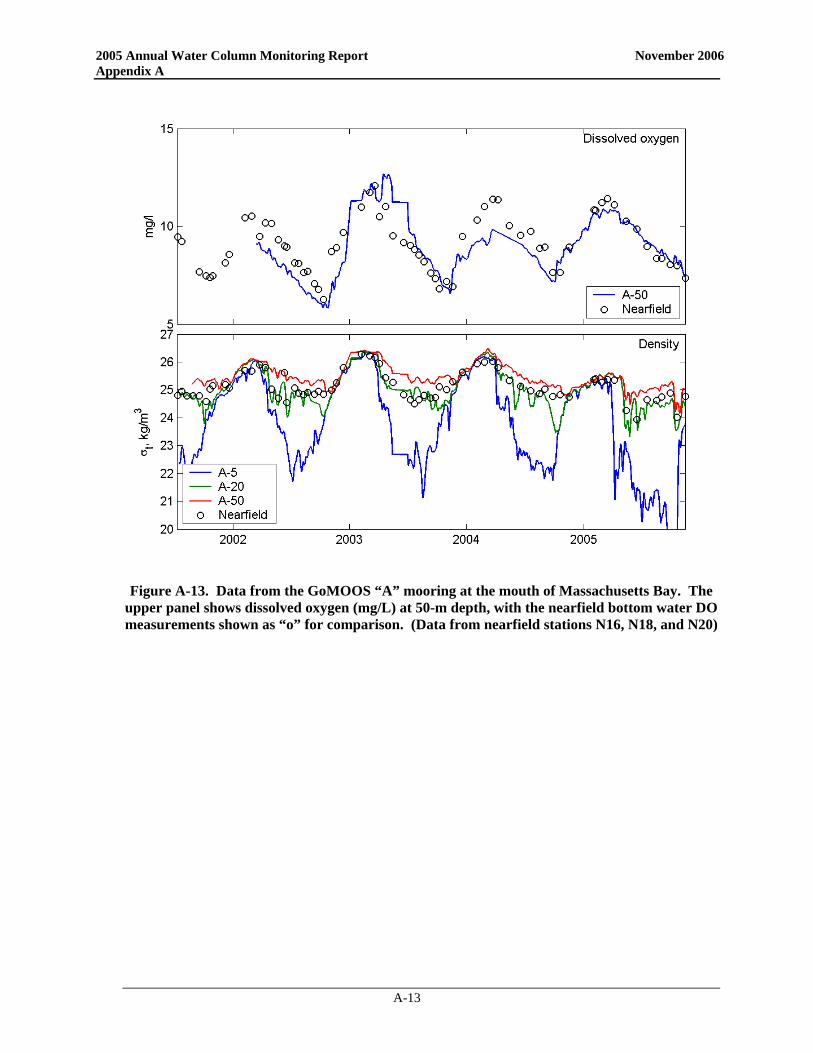
2005 Annual Water Column Monitoring Report November 2006 Appendix A
A-13
Figure A-13. Data from the GoMOOS “A” mooring at the mouth of Massachusetts Bay. The
upper panel shows dissolved oxygen (mg/L) at 50-m depth, with the nearfield bottom water DO measurements shown as “o” for comparison. (Data from nearfield stations N16, N18, and N20)

APPENDIX B
Water Quality
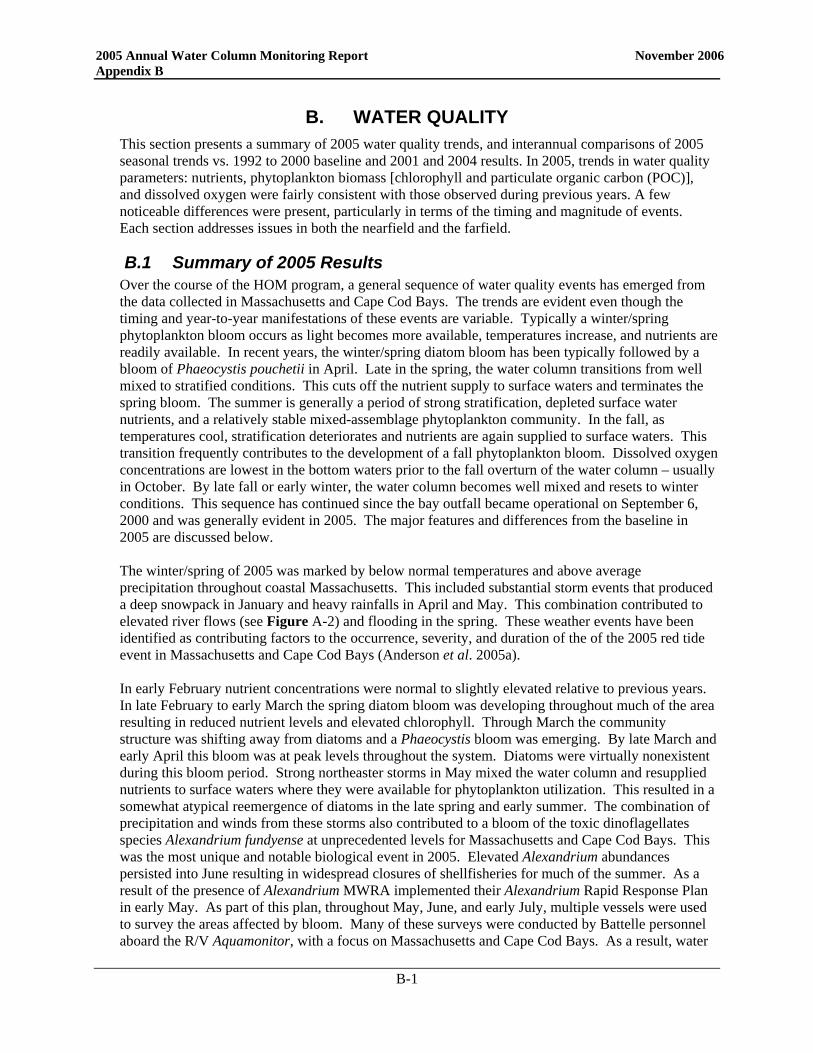
2005 Annual Water Column Monitoring Report November 2006 Appendix B
B-1
B. WATER QUALITY This section presents a summary of 2005 water quality trends, and interannual comparisons of 2005 seasonal trends vs. 1992 to 2000 baseline and 2001 and 2004 results. In 2005, trends in water quality parameters: nutrients, phytoplankton biomass [chlorophyll and particulate organic carbon (POC)], and dissolved oxygen were fairly consistent with those observed during previous years. A few noticeable differences were present, particularly in terms of the timing and magnitude of events. Each section addresses issues in both the nearfield and the farfield.
B.1 Summary of 2005 Results Over the course of the HOM program, a general sequence of water quality events has emerged from the data collected in Massachusetts and Cape Cod Bays. The trends are evident even though the timing and year-to-year manifestations of these events are variable. Typically a winter/spring phytoplankton bloom occurs as light becomes more available, temperatures increase, and nutrients are readily available. In recent years, the winter/spring diatom bloom has been typically followed by a bloom of Phaeocystis pouchetii in April. Late in the spring, the water column transitions from well mixed to stratified conditions. This cuts off the nutrient supply to surface waters and terminates the spring bloom. The summer is generally a period of strong stratification, depleted surface water nutrients, and a relatively stable mixed-assemblage phytoplankton community. In the fall, as temperatures cool, stratification deteriorates and nutrients are again supplied to surface waters. This transition frequently contributes to the development of a fall phytoplankton bloom. Dissolved oxygen concentrations are lowest in the bottom waters prior to the fall overturn of the water column – usually in October. By late fall or early winter, the water column becomes well mixed and resets to winter conditions. This sequence has continued since the bay outfall became operational on September 6, 2000 and was generally evident in 2005. The major features and differences from the baseline in 2005 are discussed below. The winter/spring of 2005 was marked by below normal temperatures and above average precipitation throughout coastal Massachusetts. This included substantial storm events that produced a deep snowpack in January and heavy rainfalls in April and May. This combination contributed to elevated river flows (see Figure A-2) and flooding in the spring. These weather events have been identified as contributing factors to the occurrence, severity, and duration of the of the 2005 red tide event in Massachusetts and Cape Cod Bays (Anderson et al. 2005a). In early February nutrient concentrations were normal to slightly elevated relative to previous years. In late February to early March the spring diatom bloom was developing throughout much of the area resulting in reduced nutrient levels and elevated chlorophyll. Through March the community structure was shifting away from diatoms and a Phaeocystis bloom was emerging. By late March and early April this bloom was at peak levels throughout the system. Diatoms were virtually nonexistent during this bloom period. Strong northeaster storms in May mixed the water column and resupplied nutrients to surface waters where they were available for phytoplankton utilization. This resulted in a somewhat atypical reemergence of diatoms in the late spring and early summer. The combination of precipitation and winds from these storms also contributed to a bloom of the toxic dinoflagellates species Alexandrium fundyense at unprecedented levels for Massachusetts and Cape Cod Bays. This was the most unique and notable biological event in 2005. Elevated Alexandrium abundances persisted into June resulting in widespread closures of shellfisheries for much of the summer. As a result of the presence of Alexandrium MWRA implemented their Alexandrium Rapid Response Plan in early May. As part of this plan, throughout May, June, and early July, multiple vessels were used to survey the areas affected by bloom. Many of these surveys were conducted by Battelle personnel aboard the R/V Aquamonitor, with a focus on Massachusetts and Cape Cod Bays. As a result, water
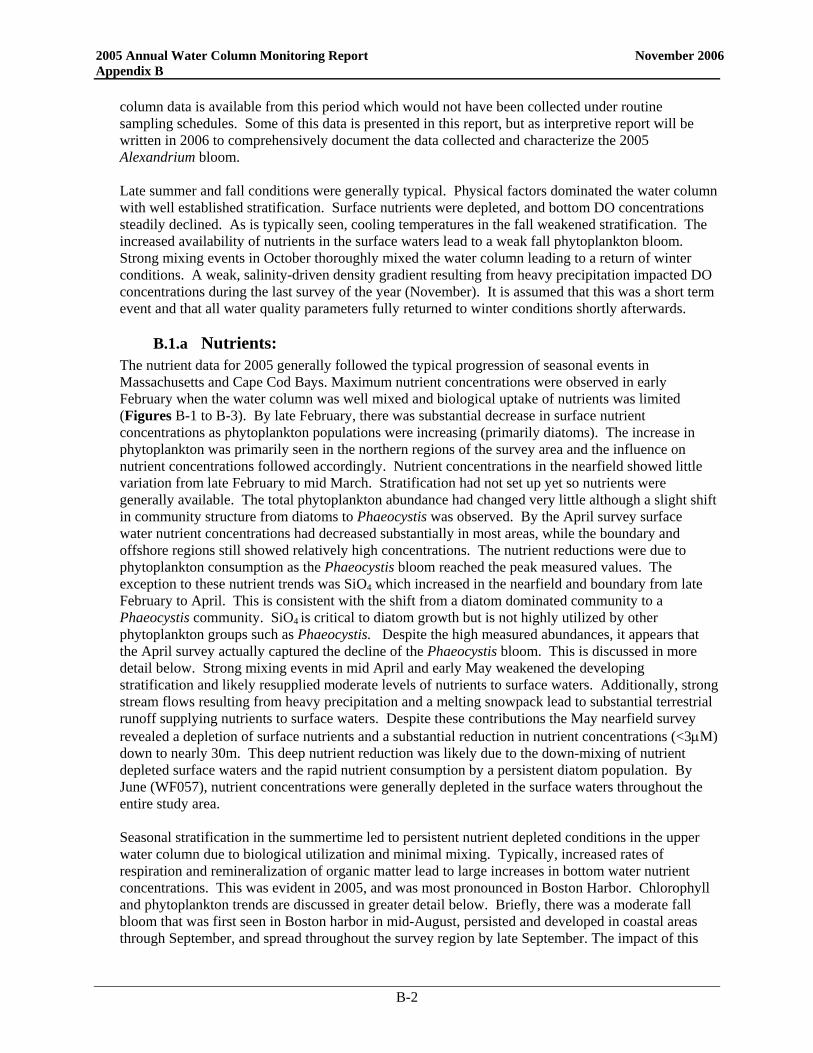
2005 Annual Water Column Monitoring Report November 2006 Appendix B
B-2
column data is available from this period which would not have been collected under routine sampling schedules. Some of this data is presented in this report, but as interpretive report will be written in 2006 to comprehensively document the data collected and characterize the 2005 Alexandrium bloom. Late summer and fall conditions were generally typical. Physical factors dominated the water column with well established stratification. Surface nutrients were depleted, and bottom DO concentrations steadily declined. As is typically seen, cooling temperatures in the fall weakened stratification. The increased availability of nutrients in the surface waters lead to a weak fall phytoplankton bloom. Strong mixing events in October thoroughly mixed the water column leading to a return of winter conditions. A weak, salinity-driven density gradient resulting from heavy precipitation impacted DO concentrations during the last survey of the year (November). It is assumed that this was a short term event and that all water quality parameters fully returned to winter conditions shortly afterwards.
B.1.a Nutrients: The nutrient data for 2005 generally followed the typical progression of seasonal events in Massachusetts and Cape Cod Bays. Maximum nutrient concentrations were observed in early February when the water column was well mixed and biological uptake of nutrients was limited (Figures B-1 to B-3). By late February, there was substantial decrease in surface nutrient concentrations as phytoplankton populations were increasing (primarily diatoms). The increase in phytoplankton was primarily seen in the northern regions of the survey area and the influence on nutrient concentrations followed accordingly. Nutrient concentrations in the nearfield showed little variation from late February to mid March. Stratification had not set up yet so nutrients were generally available. The total phytoplankton abundance had changed very little although a slight shift in community structure from diatoms to Phaeocystis was observed. By the April survey surface water nutrient concentrations had decreased substantially in most areas, while the boundary and offshore regions still showed relatively high concentrations. The nutrient reductions were due to phytoplankton consumption as the Phaeocystis bloom reached the peak measured values. The exception to these nutrient trends was SiO4 which increased in the nearfield and boundary from late February to April. This is consistent with the shift from a diatom dominated community to a Phaeocystis community. SiO4 is critical to diatom growth but is not highly utilized by other phytoplankton groups such as Phaeocystis. Despite the high measured abundances, it appears that the April survey actually captured the decline of the Phaeocystis bloom. This is discussed in more detail below. Strong mixing events in mid April and early May weakened the developing stratification and likely resupplied moderate levels of nutrients to surface waters. Additionally, strong stream flows resulting from heavy precipitation and a melting snowpack lead to substantial terrestrial runoff supplying nutrients to surface waters. Despite these contributions the May nearfield survey revealed a depletion of surface nutrients and a substantial reduction in nutrient concentrations (<3µM) down to nearly 30m. This deep nutrient reduction was likely due to the down-mixing of nutrient depleted surface waters and the rapid nutrient consumption by a persistent diatom population. By June (WF057), nutrient concentrations were generally depleted in the surface waters throughout the entire study area. Seasonal stratification in the summertime led to persistent nutrient depleted conditions in the upper water column due to biological utilization and minimal mixing. Typically, increased rates of respiration and remineralization of organic matter lead to large increases in bottom water nutrient concentrations. This was evident in 2005, and was most pronounced in Boston Harbor. Chlorophyll and phytoplankton trends are discussed in greater detail below. Briefly, there was a moderate fall bloom that was first seen in Boston harbor in mid-August, persisted and developed in coastal areas through September, and spread throughout the survey region by late September. The impact of this
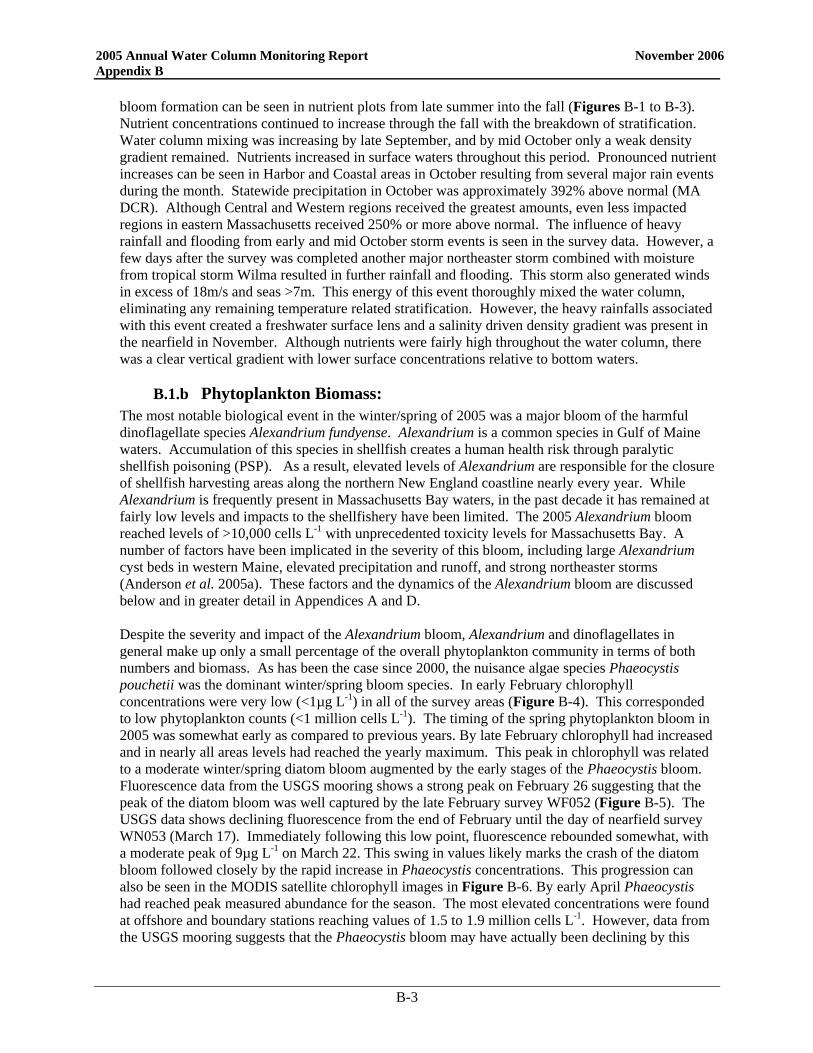
2005 Annual Water Column Monitoring Report November 2006 Appendix B
B-3
bloom formation can be seen in nutrient plots from late summer into the fall (Figures B-1 to B-3). Nutrient concentrations continued to increase through the fall with the breakdown of stratification. Water column mixing was increasing by late September, and by mid October only a weak density gradient remained. Nutrients increased in surface waters throughout this period. Pronounced nutrient increases can be seen in Harbor and Coastal areas in October resulting from several major rain events during the month. Statewide precipitation in October was approximately 392% above normal (MA DCR). Although Central and Western regions received the greatest amounts, even less impacted regions in eastern Massachusetts received 250% or more above normal. The influence of heavy rainfall and flooding from early and mid October storm events is seen in the survey data. However, a few days after the survey was completed another major northeaster storm combined with moisture from tropical storm Wilma resulted in further rainfall and flooding. This storm also generated winds in excess of 18m/s and seas >7m. This energy of this event thoroughly mixed the water column, eliminating any remaining temperature related stratification. However, the heavy rainfalls associated with this event created a freshwater surface lens and a salinity driven density gradient was present in the nearfield in November. Although nutrients were fairly high throughout the water column, there was a clear vertical gradient with lower surface concentrations relative to bottom waters.
B.1.b Phytoplankton Biomass: The most notable biological event in the winter/spring of 2005 was a major bloom of the harmful dinoflagellate species Alexandrium fundyense. Alexandrium is a common species in Gulf of Maine waters. Accumulation of this species in shellfish creates a human health risk through paralytic shellfish poisoning (PSP). As a result, elevated levels of Alexandrium are responsible for the closure of shellfish harvesting areas along the northern New England coastline nearly every year. While Alexandrium is frequently present in Massachusetts Bay waters, in the past decade it has remained at fairly low levels and impacts to the shellfishery have been limited. The 2005 Alexandrium bloom reached levels of >10,000 cells L-1 with unprecedented toxicity levels for Massachusetts Bay. A number of factors have been implicated in the severity of this bloom, including large Alexandrium cyst beds in western Maine, elevated precipitation and runoff, and strong northeaster storms (Anderson et al. 2005a). These factors and the dynamics of the Alexandrium bloom are discussed below and in greater detail in Appendices A and D. Despite the severity and impact of the Alexandrium bloom, Alexandrium and dinoflagellates in general make up only a small percentage of the overall phytoplankton community in terms of both numbers and biomass. As has been the case since 2000, the nuisance algae species Phaeocystis pouchetii was the dominant winter/spring bloom species. In early February chlorophyll concentrations were very low (<1µg L-1) in all of the survey areas (Figure B-4). This corresponded to low phytoplankton counts (<1 million cells L-1). The timing of the spring phytoplankton bloom in 2005 was somewhat early as compared to previous years. By late February chlorophyll had increased and in nearly all areas levels had reached the yearly maximum. This peak in chlorophyll was related to a moderate winter/spring diatom bloom augmented by the early stages of the Phaeocystis bloom. Fluorescence data from the USGS mooring shows a strong peak on February 26 suggesting that the peak of the diatom bloom was well captured by the late February survey WF052 (Figure B-5). The USGS data shows declining fluorescence from the end of February until the day of nearfield survey WN053 (March 17). Immediately following this low point, fluorescence rebounded somewhat, with a moderate peak of 9µg L-1 on March 22. This swing in values likely marks the crash of the diatom bloom followed closely by the rapid increase in Phaeocystis concentrations. This progression can also be seen in the MODIS satellite chlorophyll images in Figure B-6. By early April Phaeocystis had reached peak measured abundance for the season. The most elevated concentrations were found at offshore and boundary stations reaching values of 1.5 to 1.9 million cells L-1. However, data from the USGS mooring suggests that the Phaeocystis bloom may have actually been declining by this
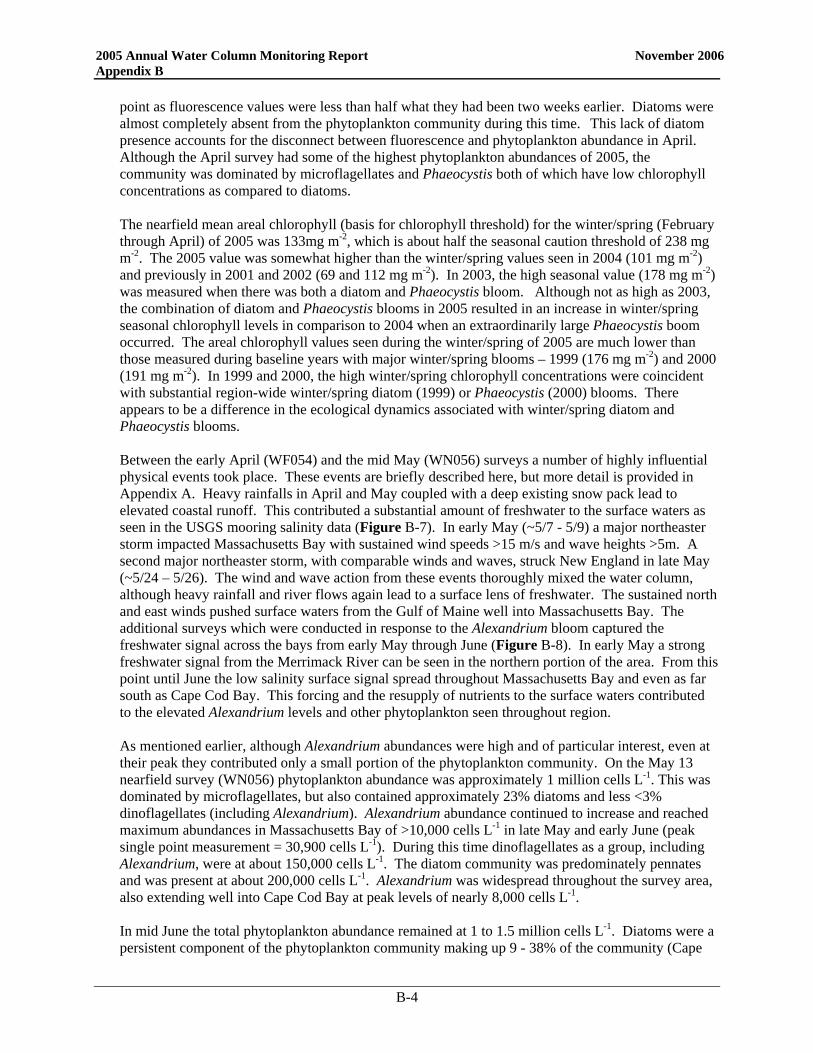
2005 Annual Water Column Monitoring Report November 2006 Appendix B
B-4
point as fluorescence values were less than half what they had been two weeks earlier. Diatoms were almost completely absent from the phytoplankton community during this time. This lack of diatom presence accounts for the disconnect between fluorescence and phytoplankton abundance in April. Although the April survey had some of the highest phytoplankton abundances of 2005, the community was dominated by microflagellates and Phaeocystis both of which have low chlorophyll concentrations as compared to diatoms. The nearfield mean areal chlorophyll (basis for chlorophyll threshold) for the winter/spring (February through April) of 2005 was 133mg m-2, which is about half the seasonal caution threshold of 238 mg m-2. The 2005 value was somewhat higher than the winter/spring values seen in 2004 (101 mg m-2) and previously in 2001 and 2002 (69 and 112 mg m-2). In 2003, the high seasonal value (178 mg m-2) was measured when there was both a diatom and Phaeocystis bloom. Although not as high as 2003, the combination of diatom and Phaeocystis blooms in 2005 resulted in an increase in winter/spring seasonal chlorophyll levels in comparison to 2004 when an extraordinarily large Phaeocystis boom occurred. The areal chlorophyll values seen during the winter/spring of 2005 are much lower than those measured during baseline years with major winter/spring blooms – 1999 (176 mg m-2) and 2000 (191 mg m-2). In 1999 and 2000, the high winter/spring chlorophyll concentrations were coincident with substantial region-wide winter/spring diatom (1999) or Phaeocystis (2000) blooms. There appears to be a difference in the ecological dynamics associated with winter/spring diatom and Phaeocystis blooms. Between the early April (WF054) and the mid May (WN056) surveys a number of highly influential physical events took place. These events are briefly described here, but more detail is provided in Appendix A. Heavy rainfalls in April and May coupled with a deep existing snow pack lead to elevated coastal runoff. This contributed a substantial amount of freshwater to the surface waters as seen in the USGS mooring salinity data (Figure B-7). In early May (~5/7 - 5/9) a major northeaster storm impacted Massachusetts Bay with sustained wind speeds >15 m/s and wave heights >5m. A second major northeaster storm, with comparable winds and waves, struck New England in late May (~5/24 – 5/26). The wind and wave action from these events thoroughly mixed the water column, although heavy rainfall and river flows again lead to a surface lens of freshwater. The sustained north and east winds pushed surface waters from the Gulf of Maine well into Massachusetts Bay. The additional surveys which were conducted in response to the Alexandrium bloom captured the freshwater signal across the bays from early May through June (Figure B-8). In early May a strong freshwater signal from the Merrimack River can be seen in the northern portion of the area. From this point until June the low salinity surface signal spread throughout Massachusetts Bay and even as far south as Cape Cod Bay. This forcing and the resupply of nutrients to the surface waters contributed to the elevated Alexandrium levels and other phytoplankton seen throughout region. As mentioned earlier, although Alexandrium abundances were high and of particular interest, even at their peak they contributed only a small portion of the phytoplankton community. On the May 13 nearfield survey (WN056) phytoplankton abundance was approximately 1 million cells L-1. This was dominated by microflagellates, but also contained approximately 23% diatoms and less <3% dinoflagellates (including Alexandrium). Alexandrium abundance continued to increase and reached maximum abundances in Massachusetts Bay of >10,000 cells L-1 in late May and early June (peak single point measurement = 30,900 cells L-1). During this time dinoflagellates as a group, including Alexandrium, were at about 150,000 cells L-1. The diatom community was predominately pennates and was present at about 200,000 cells L-1. Alexandrium was widespread throughout the survey area, also extending well into Cape Cod Bay at peak levels of nearly 8,000 cells L-1. In mid June the total phytoplankton abundance remained at 1 to 1.5 million cells L-1. Diatoms were a persistent component of the phytoplankton community making up 9 - 38% of the community (Cape
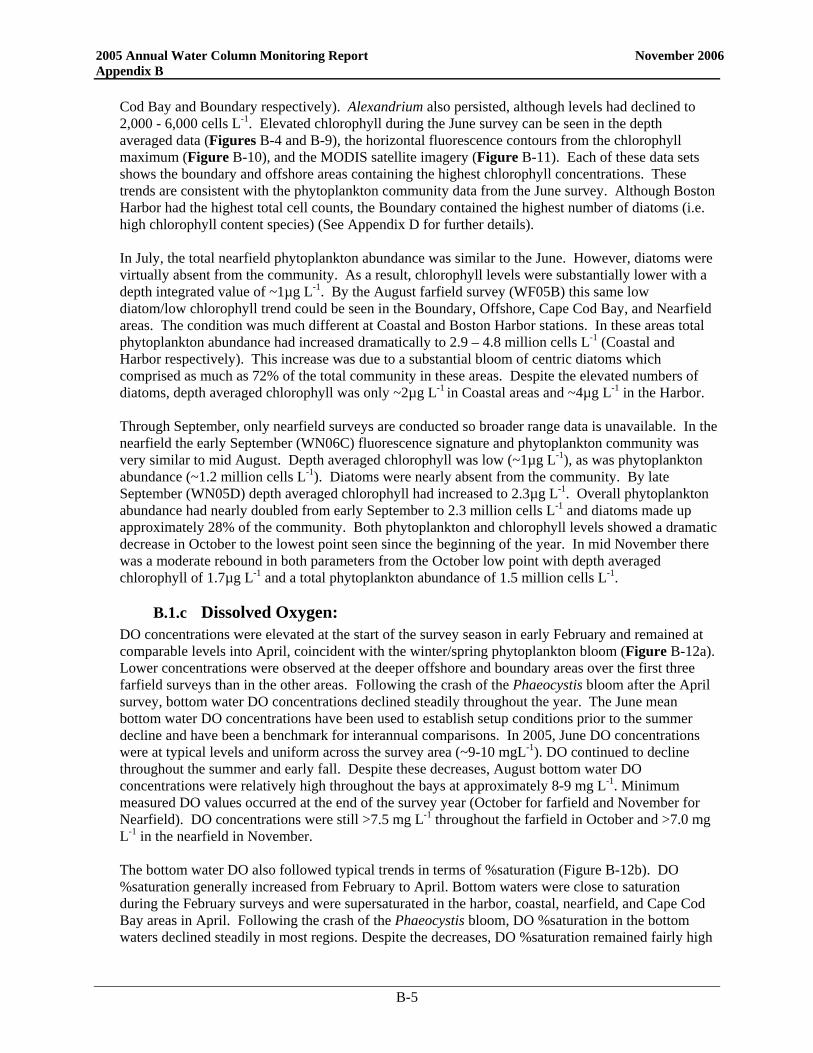
2005 Annual Water Column Monitoring Report November 2006 Appendix B
B-5
Cod Bay and Boundary respectively). Alexandrium also persisted, although levels had declined to 2,000 - 6,000 cells L-1. Elevated chlorophyll during the June survey can be seen in the depth averaged data (Figures B-4 and B-9), the horizontal fluorescence contours from the chlorophyll maximum (Figure B-10), and the MODIS satellite imagery (Figure B-11). Each of these data sets shows the boundary and offshore areas containing the highest chlorophyll concentrations. These trends are consistent with the phytoplankton community data from the June survey. Although Boston Harbor had the highest total cell counts, the Boundary contained the highest number of diatoms (i.e. high chlorophyll content species) (See Appendix D for further details). In July, the total nearfield phytoplankton abundance was similar to the June. However, diatoms were virtually absent from the community. As a result, chlorophyll levels were substantially lower with a depth integrated value of ~1µg L-1. By the August farfield survey (WF05B) this same low diatom/low chlorophyll trend could be seen in the Boundary, Offshore, Cape Cod Bay, and Nearfield areas. The condition was much different at Coastal and Boston Harbor stations. In these areas total phytoplankton abundance had increased dramatically to 2.9 – 4.8 million cells L-1 (Coastal and Harbor respectively). This increase was due to a substantial bloom of centric diatoms which comprised as much as 72% of the total community in these areas. Despite the elevated numbers of diatoms, depth averaged chlorophyll was only ~2µg L-1 in Coastal areas and ~4µg L-1 in the Harbor. Through September, only nearfield surveys are conducted so broader range data is unavailable. In the nearfield the early September (WN06C) fluorescence signature and phytoplankton community was very similar to mid August. Depth averaged chlorophyll was low (~1µg L-1), as was phytoplankton abundance (~1.2 million cells L-1). Diatoms were nearly absent from the community. By late September (WN05D) depth averaged chlorophyll had increased to 2.3µg L-1. Overall phytoplankton abundance had nearly doubled from early September to 2.3 million cells L-1 and diatoms made up approximately 28% of the community. Both phytoplankton and chlorophyll levels showed a dramatic decrease in October to the lowest point seen since the beginning of the year. In mid November there was a moderate rebound in both parameters from the October low point with depth averaged chlorophyll of 1.7µg L-1 and a total phytoplankton abundance of 1.5 million cells L-1.
B.1.c Dissolved Oxygen: DO concentrations were elevated at the start of the survey season in early February and remained at comparable levels into April, coincident with the winter/spring phytoplankton bloom (Figure B-12a). Lower concentrations were observed at the deeper offshore and boundary areas over the first three farfield surveys than in the other areas. Following the crash of the Phaeocystis bloom after the April survey, bottom water DO concentrations declined steadily throughout the year. The June mean bottom water DO concentrations have been used to establish setup conditions prior to the summer decline and have been a benchmark for interannual comparisons. In 2005, June DO concentrations were at typical levels and uniform across the survey area (~9-10 mgL-1). DO continued to decline throughout the summer and early fall. Despite these decreases, August bottom water DO concentrations were relatively high throughout the bays at approximately 8-9 mg L-1. Minimum measured DO values occurred at the end of the survey year (October for farfield and November for Nearfield). DO concentrations were still >7.5 mg L-1 throughout the farfield in October and >7.0 mg L-1 in the nearfield in November. The bottom water DO also followed typical trends in terms of %saturation (Figure B-12b). DO %saturation generally increased from February to April. Bottom waters were close to saturation during the February surveys and were supersaturated in the harbor, coastal, nearfield, and Cape Cod Bay areas in April. Following the crash of the Phaeocystis bloom, DO %saturation in the bottom waters declined steadily in most regions. Despite the decreases, DO %saturation remained fairly high
2005 Annual Water Column Monitoring Report November 2006 Appendix B
B-6
even in June with all areas > 90%. Percent saturation continued to decline in most regions into August. Boston Harbor was the major exception with a considerable increase to 109%. This marked the highest level of the year for any region. This elevated DO %saturation was a product of the centric diatom bloom occurring in the warm, well-mixed waters of the Harbor at this point in the year. Across the other regions, percent saturation was generally between 80 and 90%. In October percent saturation was generally related to DO concentration, although more variation existed in the saturation values than the concentrations. The highest bottom values (>90%) were found in Cape Cod Bay, along the coast, and into Boston Harbor. It was these areas where the stratification had weakened the most and water column mixing was occurring. In other regions a moderate density gradient remained, cutting bottom waters off from the surface. Percent saturation generally declined away from the coast and were at a minimum of <85% in the northern Offshore and Boundary areas. As nearfield sampling continued in November, percent saturation in the bottom waters reached a yearly nearfield regional low of 79.4%. The somewhat elevated DO concentrations and %saturation throughout the year were the result of a number of factors. Low bottom water temperatures in early 2005 led to relatively low respiration rates (Figure B-13). The findings of Geyer et al. (2002) indicated that there is an inverse relationship between winter/spring salinity and bottom water DO concentrations. The underlying hypothesis is that during years with high runoff and low salinity waters there is higher flow through the system and less of a decrease in DO concentrations. The delayed return to well-mixed winter conditions in most areas prevented the typical rebound of bottom water DO concentrations in the fall and concentrations continued to decline throughout the report period, but the minimum remained relatively high in comparison to previous years.
B.2 Interannual Comparisons
B.2.a Nutrients: The nutrient data for 2005 generally followed the typical progression of seasonal events in Massachusetts and Cape Cod Bays. The seasonal trends in nutrient concentrations are closely linked with both physical and biological factors. Physical mixing or stratification combined with biological utilization and remineralization act to increase or decrease the concentrations of nutrients over the course of each year. Nutrient concentrations are high in the winter when consumption is low and mixing is thorough; concentrations decrease in the surface waters during the winter/spring bloom due to consumption by phytoplankton, while the onset of stratification cuts off the supply of nutrients from deeper waters; as stratification strengthens nutrients are generally depleted in surface waters and increase at depth in the summer; nutrients then return to elevated levels in the surface waters following the fall bloom and mixing of the water column. These cycles have been observed year-in and year-out to varying degrees. The monitoring questions are focused on understanding whether or not the transfer of the MWRA effluent discharge from the harbor outfall to the bay outfall has any impact on nutrient concentrations. Note that this transfer did not create a new source of nutrients to the system, rather changed where the effluent is discharged both in location and water depth. Nearfield survey mean concentrations in 2005 generally followed baseline trends and are comparable in magnitude to the levels observed over the baseline period with some exceptions (Figures B-14 and B-15). As was observed in early 2004, early 2005 had somewhat elevated PO4 concentrations relative to the baseline. This changed rapidly as a fairly early winter/spring diatom bloom consumed PO4, NO3, and SiO4 down to the low end of the baseline range by late February. In mid March through May nearfield nutrient concentrations tracked well with the baseline mean. The transition from a diatom to Phaeocystis bloom which occurred in March to April resulted in a change in nutrient ratios and their consumption. Nearfield NO3 and PO4 concentrations declined into April as production
2005 Annual Water Column Monitoring Report November 2006 Appendix B
B-7
peaked during the Phaeocystis bloom. Silicate concentrations increased during this period. The well mixed water column continued to provide a deep water supply of nutrients, however while other nutrients are rapidly depleted by Phaeocystis SiO4 is not utilized by this species and thus remained elevated. The ratio of SiO4 uptake to other nutrients (particularly DIN) is typically a strong indicator of the presence or absence of diatoms in the phytoplankton community. Over the course of February both SiO4 and DIN declined substantially in a 1:1 relationship suggesting a diatom contribution to the nutrient uptake (Figure B-16). There was a minor rebound in both nutrients in March as the supply of nutrients was still strong but consumption had decreased. By April, SiO4 had increased while DIN declined, further confirming the dominance of non-diatom species (Phaeocystis) in the bloom. As diatoms reemerged in the late spring/early summer there was another considerable draw-down of SiO4. For the past several years Phaeocystis has dominated the winter/spring bloom. It appears that in many cases this has come at the expense of diatom populations. Early season diatom presence draws down SiO4 to levels which inhibit growth. Phaeocystis, which does not require SiO4, is able to utilize the remaining nutrients and dominate the community. Once stratification begins to set up in the late spring, surface waters become depleted of all nutrients, the Phaeocystis bloom crashes, and the summer is characterized by low phytoplankton presence. In 2005 the strong mixing events in April, May, and to a lesser extent in June resupplied nutrients to surface waters at a time when stratification was just beginning to develop. As a result SiO4, and other nutrients, were again available to support diatom growth. This led to a somewhat atypical reemergence and persistence of diatoms into mid June. Nearfield nutrients were drawn down to a yearly low by mid June. NO3 and PO4 were consistent with baseline mean values, but as a result of diatom presence SiO4 was depleted down to levels below the baseline range. The northeaster storms that occurred in May and June 2005 not only mixed the water column and supplied nutrients to the surface waters, but also diluted the effluent plume NH4 signature in the nearfield (Figure B-15a). Increased uptake by diatoms and dinoflagellate blooms in May and June may have contributed to the lower 2005 nearfield survey mean NH4 concentrations, but it is likely that the storms and associated mixing were the primary factors leading to reduced NH4 levels in the nearfield. Nearfield nutrient trends and concentrations from the late summer into the winter were generally consistent with baseline measurements and the post-transfer values of 2001-2004 (Figures B-14 and B-15). Remineralization of nutrients in the bottom waters leads to an overall increase in mean water column concentrations during strong stratification. As stratification breaks down in the fall nutrients are mixed throughout the water column, further increasing overall nutrient concentrations. From July through late September NO3, PO4, and SiO4 continued to increase, staying generally within the baseline range although at the high end. A moderate fall bloom of centric diatoms in late September lead to a decline in all nutrients by mid October, dropping concentrations from the high end of the baseline range down to the baseline mean. As winter conditions became reestablished in November nearfield nutrients concentrations increased, tracking well with the baseline mean. The continued supply of NH4 to the nearfield from the bay outfall has caused nearfield NH4 concentrations to be higher than the maximum values observed during the baseline period for the majority of the 2001-2004 surveys. In 2005 this was not generally the case (Figure B-15b). Like most post-transfer years nearfield NH4 was well above the baseline range in early February. By late February concentrations had dropped below the baseline mean as a result of utilization by the early winter/spring diatom bloom. NH4 followed the trends of the other nutrients in the late spring with a rebound in mid March between the peaks of the diatom and Phaeocystis blooms, followed by a decline through April and May. By mid May nearfield NH4 was below the baseline range. Concentrations increased throughout the summer as stratification set up and phytoplankton abundance declined. However, unlike other post-transfer years which showed highly elevated nearfield NH4 in
2005 Annual Water Column Monitoring Report November 2006 Appendix B
B-8
summer, the 2005 concentrations stayed within the baseline range through early September. Nearfield NH4 did exceed the baseline range in late September and October, but was again below the baseline mean at the end of the survey year. System-wide, the annual average of NH4 in 2005 was low. Concentrations in all regions were at the lowest levels seen in nearly ten years. A four year system-wide decline in NH4 has been coincident with a trend of increasing bottom water DO. These trends suggest changes in large scale processes which may be influencing the way NH4 is regenerated in the bottom waters. The discussion of physical forcing parameters as related to DO is discussed in more detail in Appendix A. In contrast to the trends observed in the nearfield, NH4 concentrations in Boston Harbor were below or near baseline minima for the entire year (Figure B-17a). This has been consistently observed since the outfall came on line in late 2000. Harbor averages in 2005 were <1µM NH4 for most of the year, only reaching concentrations close to 4µM in the fall. This is in contrast to the baseline mean that ranges from about 4 - 9µM throughout the seasons. In the Harbor NO3, PO4, and SiO4 followed similar trends to the baseline period (Figures B-17 and B-18). Concentrations were elevated in the early part of the year, declined through the spring and summer with stratification and consumption, and then increased again with a return to winter conditions. NO3 and SiO4 started the year close to the baseline mean then were at the lower end of the baseline range from spring through fall. PO4 followed similar temporal patterns decrease and increase, but throughout the entire year concentrations were at or just below the minimum baseline range. The change in NH4 concentrations in the nearfield and Boston Harbor are consistent with model simulations which predicted that the transfer of effluent from Boston Harbor to Massachusetts Bay would greatly reduce nutrients in the harbor and increase them locally in the nearfield (Signell et al. 1996). This change was predicted to have little impact on concentrations in the rest of Massachusetts and Cape Cod Bays. The spatial patterns in NH4 concentrations in the harbor, nearfield and bays since the diversion in September 2000 have consistently confirmed this. These spatial changes in NH4 are also manifested in annual mean concentrations for these areas. For example, the annual mean NH4 concentration in Boston Harbor dropped sharply from 2000 to 2001 (Figure B-19a). A similar sharp decrease was also seen at the coastal stations which are strongly influenced by water quality conditions in Boston Harbor. In contrast, the increase in annual mean NH4 in the nearfield was not as dramatic as the harbor and coastal water decrease. Compared to 1999, the last full year before the bay outfall came online, annual mean NH4 levels in the nearfield almost doubled in 2001. However, since that time NH4 has shown a system-wide decrease and even in the nearfield concentrations are comparable to the 1999 levels. This decline in NH4 over the past several years can be seen in all of the survey regions and current annual concentrations are near a ten year low. The overall shift in DIN from pre- to post-transfer years can be seen in the contour plot of the entire survey area (Figure B-20). In this plot the reduction in Boston Harbor nitrogen can be clearly seen, as well as a less pronounced increase in DIN (primarily NH4) at the new outfall location. The trends in annual mean concentration for other inorganic nutrients are more erratic as seen in the example of NO3 (Figure B-19b). Year to year variability in NO3, SiO4, and PO4 has more to do with timing of sampling and occurrence of blooms than any clear trends in background levels.
B.2.b Phytoplankton Biomass: Trends in chlorophyll and POC in 2005 were comparable to those observed during previous years. Seasonal trends in phytoplankton biomass as measured by chlorophyll and POC are tied to physical conditions, nutrient availability, and ecosystem dynamics. The phytoplankton biomass seasonal signal in Massachusetts and Cape Cod Bays is dominated by winter/spring and fall blooms. Winter/spring phytoplankton blooms occur due to elevated growth related to increased light availability, nutrient replete conditions and seasonal stratification of the physical environment, prior
2005 Annual Water Column Monitoring Report November 2006 Appendix B
B-9
to temperature-related increases in mortality due to grazing. Typically the timing of the fall bloom has been tied to decreased stratification and increased inputs of nutrients into the surface waters. In 2005 there was a typical, although slightly early, winter/spring diatom bloom followed by moderate Phaeocystis bloom later in the spring. Late spring and summer showed a low to moderate reemergence and persistence of diatoms in the phytoplankton community. An early (August) fall diatom bloom occurred in Harbor and Coastal areas but not in other regions.
In 2005 nearfield areal chlorophyll values were generally consistent with the baseline mean and seasonal patterns (Figure B-21). The winter spring/bloom appears to have occurred slightly early, although timing of the survey schedule is likely responsible for some of this effect. Otherwise, winter/spring values were in the upper range of the baseline range. In spite of the elevated Phaeocystis concentrations, late spring through summer areal chlorophyll was close to the nearfield mean. Like 2004, the 2005 nearfield areal chlorophyll was at the low end of the baseline range due to the lack of a substantial fall bloom in this region. Particulate organic carbon concentrations 2005 generally followed the baseline means and trends although the winter/spring bloom again appears to be slightly early (Figure B-21). Like 2004, by summertime POC concentrations had dropped below the baseline mean, and stayed there for the remainder of the year including excursions below the baseline minimum in July. These values were generally low as compared to other post-transfer years.
In Boston Harbor, 2005 areal chlorophyll was generally within the baseline range (Figure B-22a). Values were slightly above the baseline maxima in late February at the height of the diatom bloom. Values were close to baseline minima for the remainder of the year except for a peak in August that coincided with the early fall bloom in the Harbor and brought chlorophyll levels up near the baseline mean. Harbor POC concentrations were within the baseline range (and near the mean) throughout 2005 (Figure B-22b). POC concentrations peaked in August coincident with the late summer/early fall centric diatom bloom which occurred in the Harbor and Coastal areas. The chlorophyll data (along with production data presented in Appendix C) suggest the harbor may be changing from its previous pattern of biomass levels peaking in summer to a more typical temperate coastal water trend dominated by the winter/spring bloom. While this general trend appears to be emerging, the continuation of post-transfer monitoring is also revealing the wide year to year variability. Figure B-23 shows post-transfer (2001-2005) mean and range compared the baseline (1992-2000) mean and range for areal chlorophyll and POC in the harbor. Except for June, the ranges show substantial overlap. The wide range of post-transfer values in winter and spring highlight the year to year variability. 2001, 2004, and 2005 all started the year similarly (and close to baseline values), while 2002 and 2003 had extremely high chlorophyll early in the year as a result of early onset of the winter/spring bloom. Four out of five post-transfer years showed late spring values at the low end of the baseline range, but 2004 was near the high end of the range due to the large scale Phaeocystis bloom. Timing and extent of the fall bloom resulted in similar year to year variability. Like areal chlorophyll, the harbor POC data shows the same broad range of values resulting year to year variability (Figure B-23b). Overall, the POC data does not suggest productivity cycles in the harbor have changed substantially since the transfer to the offshore outfall. Variations in the strength of the spring and fall blooms are the major factors affecting the annual average chlorophyll (Figure B-24). The highest annual mean values occurred in 1999 and 2000 when major blooms were observed in both spring and fall. In 2003, the very high chlorophyll levels associated with the substantial Phaeocystis bloom at many of the offshore and boundary stations led to comparably high annual mean areal chlorophyll values for these areas. The 2005 annual chlorophyll was within the variation seen from year to year over this fourteen year monitoring program. System wide there was a fair amount of variability in the annual areal means. However, this was largely a product of water depths throughout the various regions. Boston Harbor and coastal
2005 Annual Water Column Monitoring Report November 2006 Appendix B
B-10
areas tend to have lower areal averaged chlorophyll because of shallower depths although actual chlorophyll concentrations are generally higher in those regions (Figure B-25). In 2005 average annual chlorophyll concentration was actually very consistent across all regions. This is interesting given the variable timing of biological events across the regions in 2005 (i.e. winter/spring blooms in Nearfield, Boundary, and offshore versus summer/fall bloom in Harbor and Coastal areas). Annual POC was moderate and comparable over nearly all of the regions (Figure B-24b). Cape Cod Bay was the most notable exception in 2005 in term of annual areal chlorophyll, annual chlorophyll concentration, and annual POC. Since the start of the monitoring program in 1992 Cape Cod Bay has consistently had some of the highest annual values for all of these parameters. In 2005 Cape Cod Bay was lower than the other regions and the lowest seen for this region in nearly ten years.
B.2.c Dissolved Oxygen: DO concentrations in 2005 followed trends that have been observed consistently since 1992. Bottom water DO levels are typically at a maximum in the winter, decrease over the course of the summer during seasonal stratification, and reach annual minimum levels just prior to stratification breaking down in the fall – usually October. The monitoring program is focused on assessing whether or not the transfer to the bay outfall has an impact on dissolved oxygen levels in the bays. The primary areas of interest with respect to DO levels are the bottom water minima in the nearfield and Stellwagen Basin. An adverse impact due to the transfer would be expected to result in decreased DO levels and DO bottom water minima well below those observed during the baseline. Since the bay outfall came on line, there has been little change in the DO cycle in the nearfield and Stellwagen Basin. 2005 was no exception (Figures B-26 and B-27). In the nearfield, DO concentrations were within the baseline range, and tracked fairly well with the baseline mean throughout the year. The only divergence from typical seasonal trends was near the end of the year. Instead of reaching a yearly low in September to October, 2005 DO values were still fairly high at this point and continued to decline into November. Despite the strong mixing events in October a weak density gradient was present as a result of low salinities in the surface waters. This physical structure continued to influence DO values and bottom concentrations did not reach a yearly low until mid November. In Stellwagen Basin, DO levels were within the baseline range throughout the year. Values were at the lower end of the range in late February and at the higher end in summer, but no major excursions were seen. DO %saturation generally followed all of the DO concentration trends. The yearly trends and fluctuations in bottom water DO over the past twelve years in the nearfield and at Stellwagen Basin can be seen in Figures B-28 and B-29. Like 2004, the 2005 bottom water minima in the nearfield were among the highest seen over the monitoring program, but were within the range of year to year fluctuations. Only the mid November survey had a mean %saturation value in the nearfield and Stellwagen areas that dropped below the 80% caution threshold (79.4% and 76.5% respectively). The 2005 DO concentration minima in both the nearfield and Stellwagen areas were well above the caution levels.
B.3 Water Quality Summary Water quality conditions in the bays in 2005 generally followed those observed previously, with some notable differences. There were two important features that standout in 2005: 1) extreme precipitation, river flows, and winds in the spring and fall, including several atypical northeaster storms in May and 2) an unprecedented Alexandrium bloom with abundances reaching 1,000’s of cells L-1 throughout Massachusetts and Cape Cod Bays in May and June. The physical and biological events in the spring are linked in a number of ways. Early 2005 was characterized by elevated precipitation in the form of snowfall. A well developed snowpack was present in the spring which became important to coastal processes as the year
2005 Annual Water Column Monitoring Report November 2006 Appendix B
B-11
progressed. In April rainfall across northern New England accelerated melting of the snowpack. The combination of new and released precipitation lead to extremely high river flows across New England. This nutrient-laden, freshwater pulse is thought to have exacerbated the development of Alexandrium fundyense blooms in the Western Gulf of Maine (Anderson et al. 2005a). Cell abundances in this bloom continued to increase and were transported southward along the coast by local currents until they were off the northern coast of Massachusetts in late April and early May. This progression of Alexandrium blooms in the spring is not uncommon, although 2005 concentrations were above typical levels. In typical years the bloom is carried on the Gulf of Maine current past Massachusetts Bay well offshore, approaching the Massachusetts coastline only near Cape Ann and Cape Cod. In early May 2005, a strong northeaster storm impacted the Massachusetts coast with sustained winds >10m/s for two days. These strong winds from the North and East drove Gulf of Maine waters (rich with Alexandrium) well into Massachusetts Bay. Runoff and strong water column mixing supplied ample nutrients to continue fueling the bloom and concentrations continued to increase as May progressed. A second powerful northeaster storm hit the area in late May (~5/24 – 5/26). This storm again overturned the water column providing nutrients throughout the area. The Northeast winds pushed Alexandrium even further into the area, including deep into Cape Cod Bay. Elevated Alexandrium cell counts were seen throughout the region into June 2005. The Alexandrium bloom in 2005 received widespread media, public, and scientific attention due to the threat of Paralytic Shellfish Poisoning (PSP). PSP toxins accumulate in shellfish and pose a human health risk through the ingestion of contaminated animals. As a result of the unprecedented Alexandrium bloom and associated PSP toxicity, extensive shellfishery closures were activated from Eastern Maine to Southern Massachusetts for a large portion of the summer. Despite the economic impact and attention, the Alexandrium bloom abundances were only a minor portion of the overall phytoplankton assemblage and had little impact on trends observed in other water quality parameters such as chlorophyll and nutrient concentrations, production, and overall phytoplankton abundance. By these measures, 2005 was a fairly typical year as compared to both pre- and post-transfer years. Winter/spring phytoplankton abundance was once again dominated by Phaeocystis pouchetii, as it has been for the past six years. However, unlike 2004 a clear diatom bloom preceded the emergence of Phaeocystis and contributed to the seasonal and yearly productivity. These two blooms were distinct, with diatoms peaking in late February and declining in mid March just as Phaeocystis began to emerge. Phaeocystis peaked in late March to early April. As observed during the previous blooms, the 2005 Phaeocystis bloom was a regional event with elevated abundances measured throughout the bays. Aided by the resupply of nutrients (especially SiO4) through the strong storms in May, a secondary diatom bloom emerged and persisted at low levels into June. Nutrient trends generally followed typical seasonal progressions. Surface water nutrients were depleted through phytoplankton consumption in the spring. Stratification kept surface nutrients low throughout the summer. And surface nutrient concentrations rebounded as cooler temperatures and fall storms returned the water column to well-mixed conditions in the fall. Although averaged nutrient data from 2005 was within established ranges and trends, the unique precipitation and wind events in the summer and fall impacted nutrient dynamics in subtle ways not well captured by the averages. The influence of these events on the Alexandrium is discussed above, but the rest of the phytoplankton community structure was impacted as well. The decline of diatom populations in March was primarily driven by the depletion of SiO4 in the surface waters. This provided a competitive advantage for Phaeocystis (which does not rely on SiO4). This transition from diatom to Phaeocystis dominance following the depletion of SiO4 has been observed for the past several years. In previous years Phaeocystis continued to bloom until nutrients were depleted in the surface waters. Once nutrients were depleted the Phaeocystis population would crash. This would be coincident with the onset of stratification and surface nutrients would then remain low throughout the summer. In
2005 Annual Water Column Monitoring Report November 2006 Appendix B
B-12
2005 the strong mixing events in May resupplied nutrients (including SiO4) to surface waters and diatom populations were able to rebound in the late spring and early summer.
Summertime conditions for all parameters were fairly typical. There was a moderate diatom bloom in Harbor and Coastal areas in August that contributed most of the yearly productivity for these regions. In most years it is typical to have strong storms in the fall which fully break down any remaining stratification and the return the water column to well-mixed winter conditions. In October 2005 just such a storm occurred and temperature-driven stratification was fully eliminated. However, the heavy precipitation associated with the storm created a freshwater surface lens which set up a weak late season stratification. It is likely that this was a short term physical event, but the November nearfield survey clearly captured this water column structure. Nutrients and DO appear to have been somewhat impacted by this condition. Nutrients were low in the surface waters relative to the bottom. DO continued to decline from October values rather than displaying the typical increase following breakdown of stratification. Despite this anomaly DO concentrations were average to high throughout the year including November. In fact, bottom water minima in the nearfield were among the highest seen in the HOM program. 2005 was consistent with post-transfer trends, in that the primary change in comparison to the baseline is that NH4 has dramatically decreased in Boston Harbor and nearby coastal waters while increasing in the nearfield. Although the effluent plume is consistently observed in the nearfield, detectable levels appear to be confined to an area within 20 km of the outfall. Although statistically significant differences have not been measured, it appears that there may be a trend towards a general increase in DIN in the offshore regions and a decrease at inshore areas. The higher nearfield NH4 concentrations have not translated into an obvious increase in biomass, whether measured as chlorophyll or POC. In Boston Harbor, a dramatic decrease in NH4 has been concomitant with decreases in chlorophyll and POC, and a change in the seasonal productivity from eutrophic to a more normal temperate coastal pattern. As the post-transfer monitoring period continues, seasonal variability and system-wide trends are also revealed.
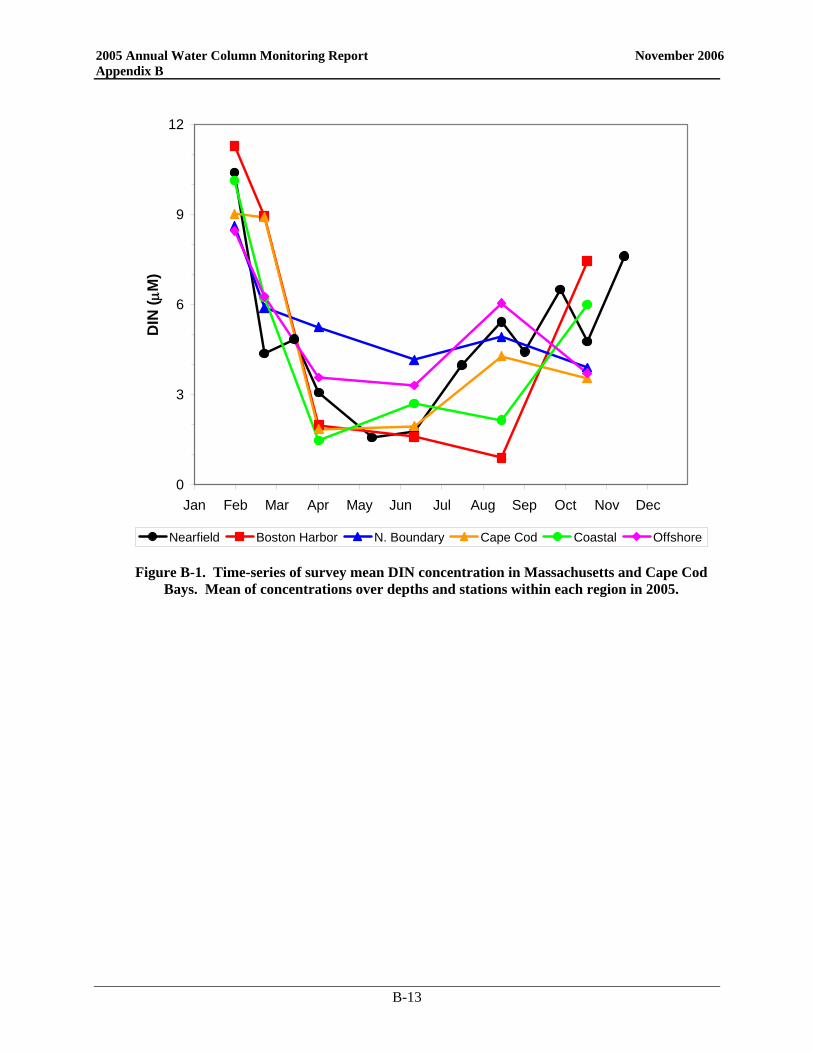
2005 Annual Water Column Monitoring Report November 2006 Appendix B
B-13
0
3
6
9
12
Jan Feb Mar Apr May Jun Jul Aug Sep Oct Nov Dec
DIN
( µM
)
Nearfield Boston Harbor N. Boundary Cape Cod Coastal Offshore
Figure B-1. Time-series of survey mean DIN concentration in Massachusetts and Cape Cod Bays. Mean of concentrations over depths and stations within each region in 2005.
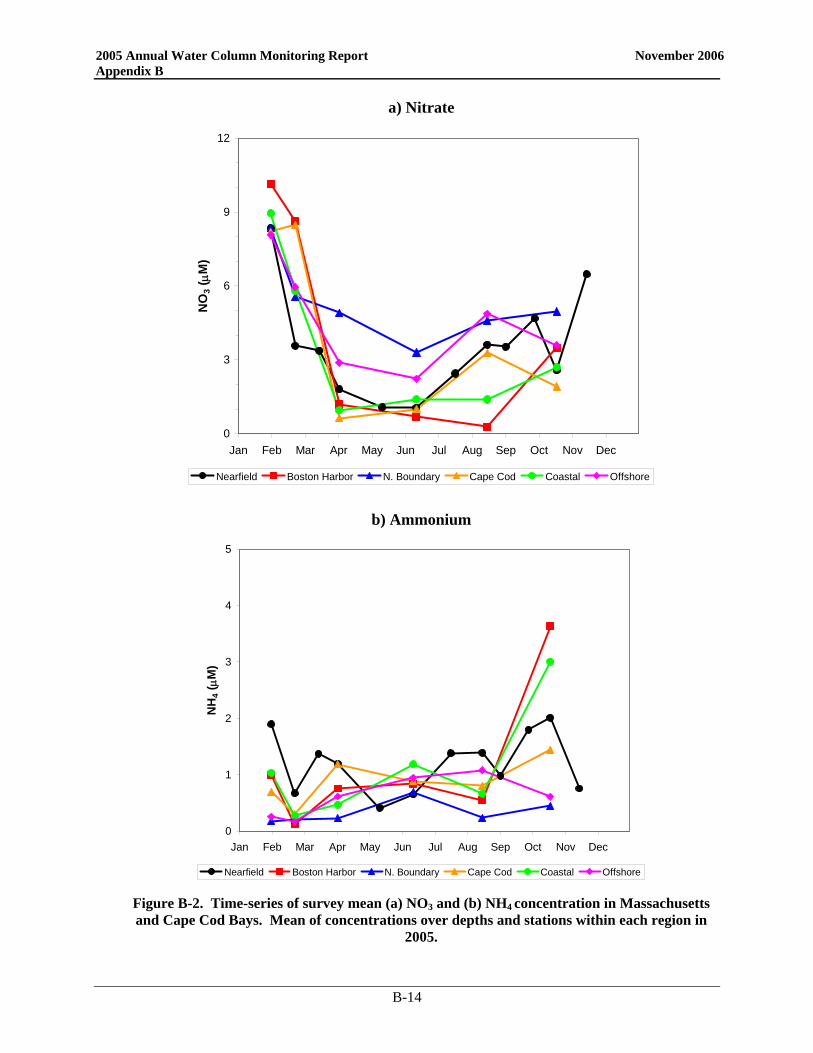
2005 Annual Water Column Monitoring Report November 2006 Appendix B
B-14
a) Nitrate
0
3
6
9
12
Jan Feb Mar Apr May Jun Jul Aug Sep Oct Nov Dec
NO
3 (µM
)
Nearfield Boston Harbor N. Boundary Cape Cod Coastal Offshore
b) Ammonium
0
1
2
3
4
5
Jan Feb Mar Apr May Jun Jul Aug Sep Oct Nov Dec
NH
4 (µM
)
Nearfield Boston Harbor N. Boundary Cape Cod Coastal Offshore
Figure B-2. Time-series of survey mean (a) NO3 and (b) NH4 concentration in Massachusetts and Cape Cod Bays. Mean of concentrations over depths and stations within each region in
2005.
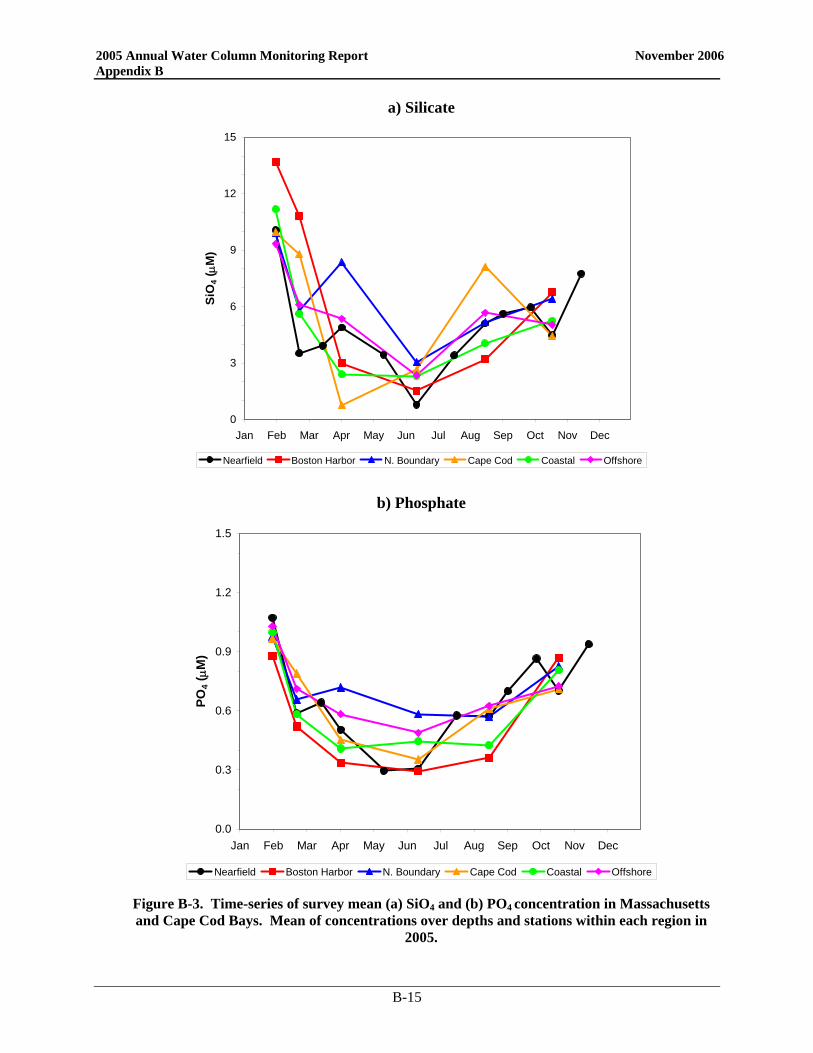
2005 Annual Water Column Monitoring Report November 2006 Appendix B
B-15
a) Silicate
0
3
6
9
12
15
Jan Feb Mar Apr May Jun Jul Aug Sep Oct Nov Dec
SiO
4 (µM
)
Nearfield Boston Harbor N. Boundary Cape Cod Coastal Offshore
b) Phosphate
0.0
0.3
0.6
0.9
1.2
1.5
Jan Feb Mar Apr May Jun Jul Aug Sep Oct Nov Dec
PO4 (µM
)
Nearfield Boston Harbor N. Boundary Cape Cod Coastal Offshore
Figure B-3. Time-series of survey mean (a) SiO4 and (b) PO4 concentration in Massachusetts and Cape Cod Bays. Mean of concentrations over depths and stations within each region in
2005.
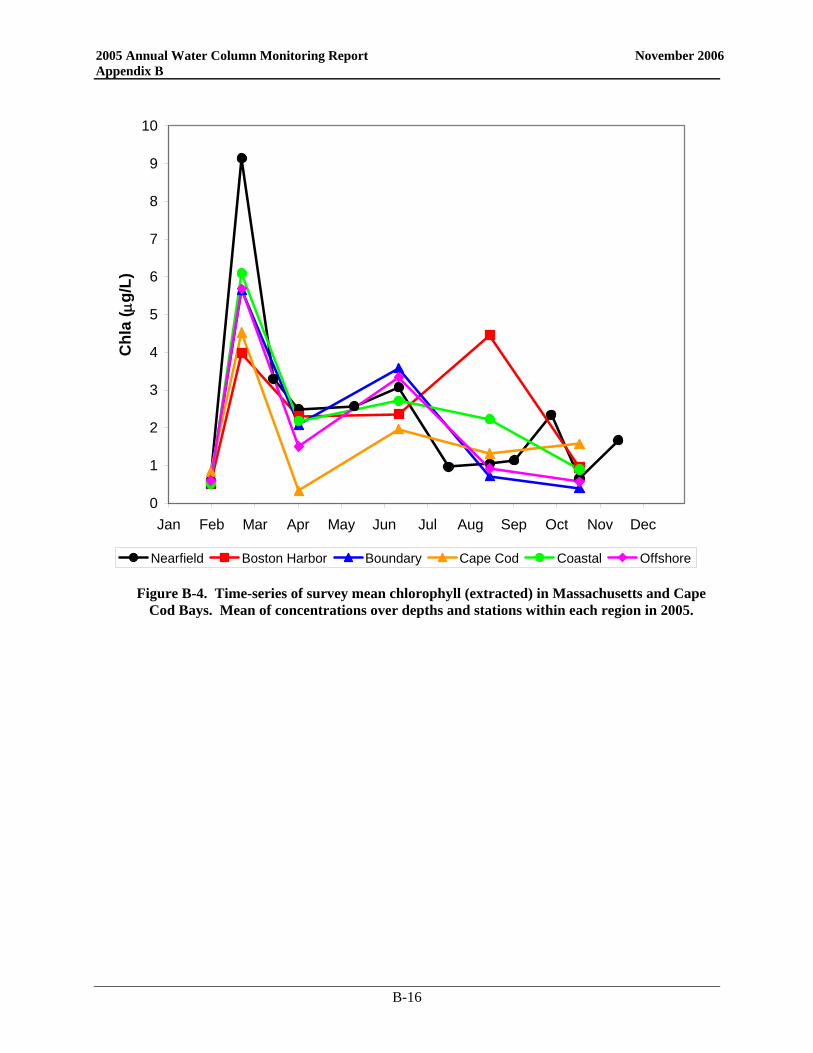
2005 Annual Water Column Monitoring Report November 2006 Appendix B
B-16
0
1
2
3
4
5
6
7
8
9
10
Jan Feb Mar Apr May Jun Jul Aug Sep Oct Nov Dec
Chl
a ( µ
g/L)
Nearfield Boston Harbor Boundary Cape Cod Coastal Offshore
Figure B-4. Time-series of survey mean chlorophyll (extracted) in Massachusetts and Cape Cod Bays. Mean of concentrations over depths and stations within each region in 2005.
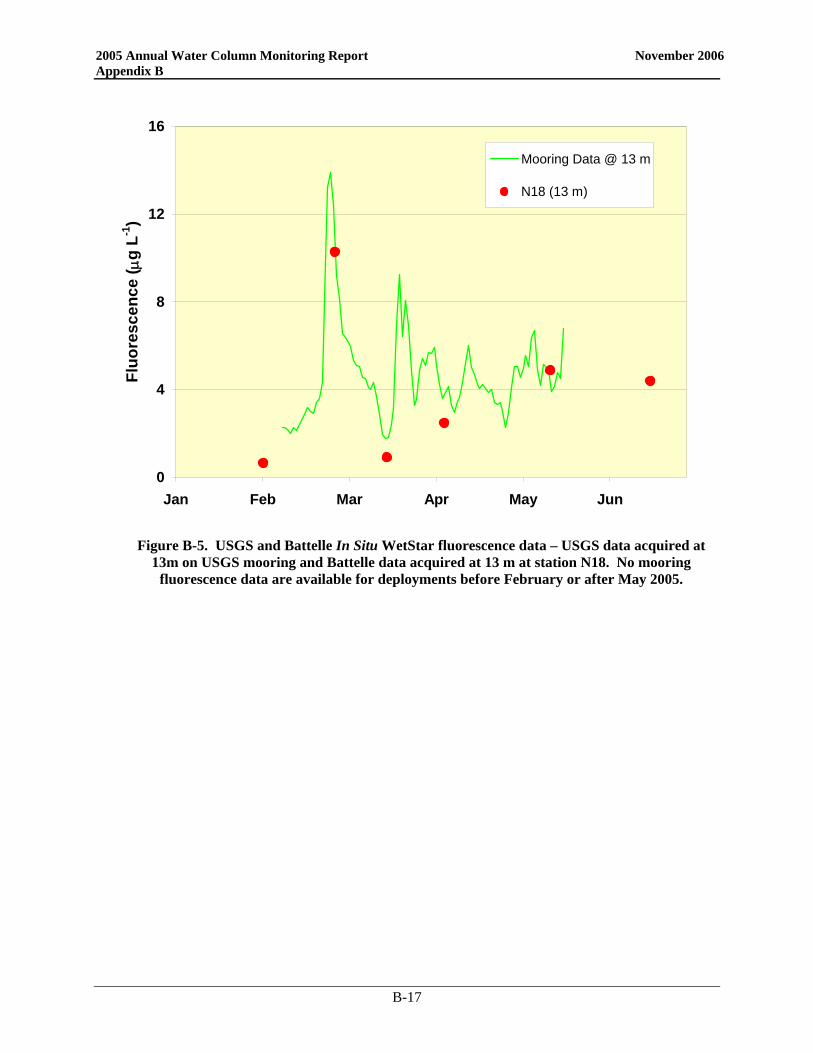
2005 Annual Water Column Monitoring Report November 2006 Appendix B
B-17
0
4
8
12
16
Jan Feb Mar Apr May Jun
Fluo
resc
ence
( µg
L-1)
Mooring Data @ 13 m
N18 (13 m)
Figure B-5. USGS and Battelle In Situ WetStar fluorescence data – USGS data acquired at
13m on USGS mooring and Battelle data acquired at 13 m at station N18. No mooring fluorescence data are available for deployments before February or after May 2005.
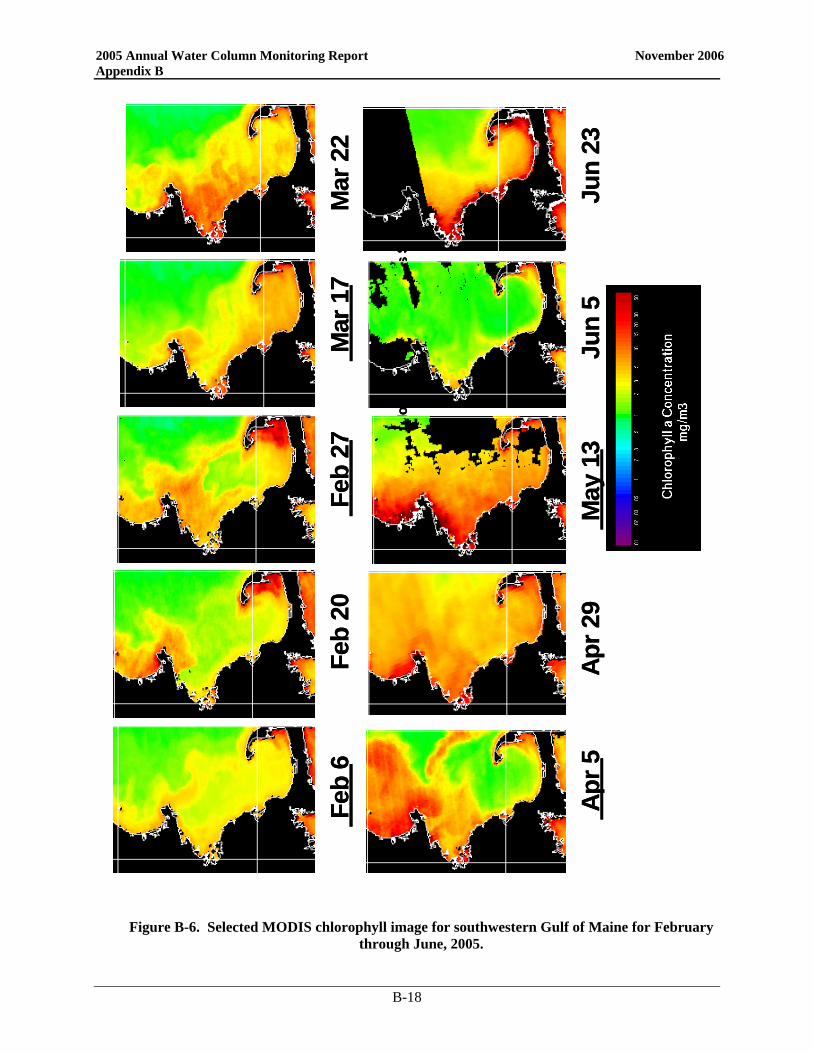
2005 Annual Water Column Monitoring Report November 2006 Appendix B
B-18
Figure B-6. Selected MODIS chlorophyll image for southwestern Gulf of Maine for February through June, 2005.
USG
S M
oorin
g –
MW
RA
Wet
Labs
Sens
or
Feb
6Fe
b 20
Feb
27M
ar 1
7M
ar 2
2
Apr 5
Apr 2
9M
ay 1
3Ju
n 5
Jun
23
USG
S M
oorin
g –
MW
RA
Wet
Labs
Sens
or
Feb
6Fe
b 20
Feb
27M
ar 1
7M
ar 2
2
Apr 5
Apr 2
9M
ay 1
3Ju
n 5
Jun
23
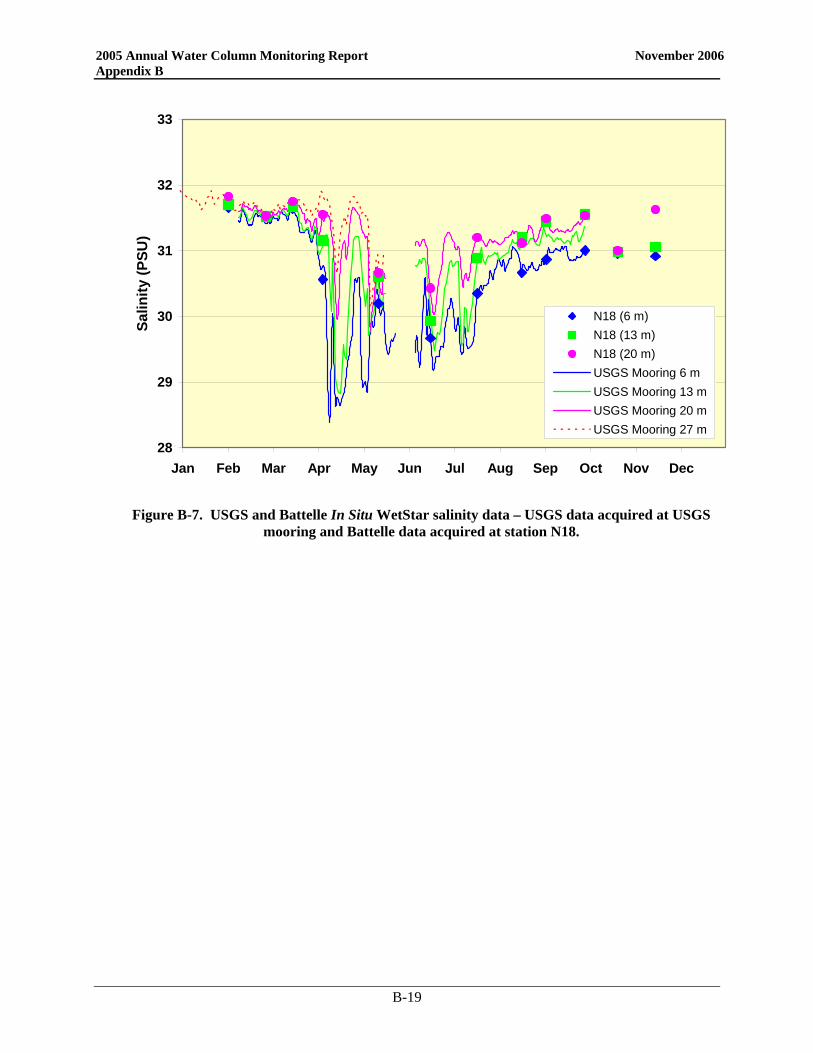
2005 Annual Water Column Monitoring Report November 2006 Appendix B
B-19
28
29
30
31
32
33
Jan Feb Mar Apr May Jun Jul Aug Sep Oct Nov Dec
Salin
ity (P
SU)
N18 (6 m)N18 (13 m)N18 (20 m)USGS Mooring 6 mUSGS Mooring 13 mUSGS Mooring 20 mUSGS Mooring 27 m
Figure B-7. USGS and Battelle In Situ WetStar salinity data – USGS data acquired at USGS
mooring and Battelle data acquired at station N18.
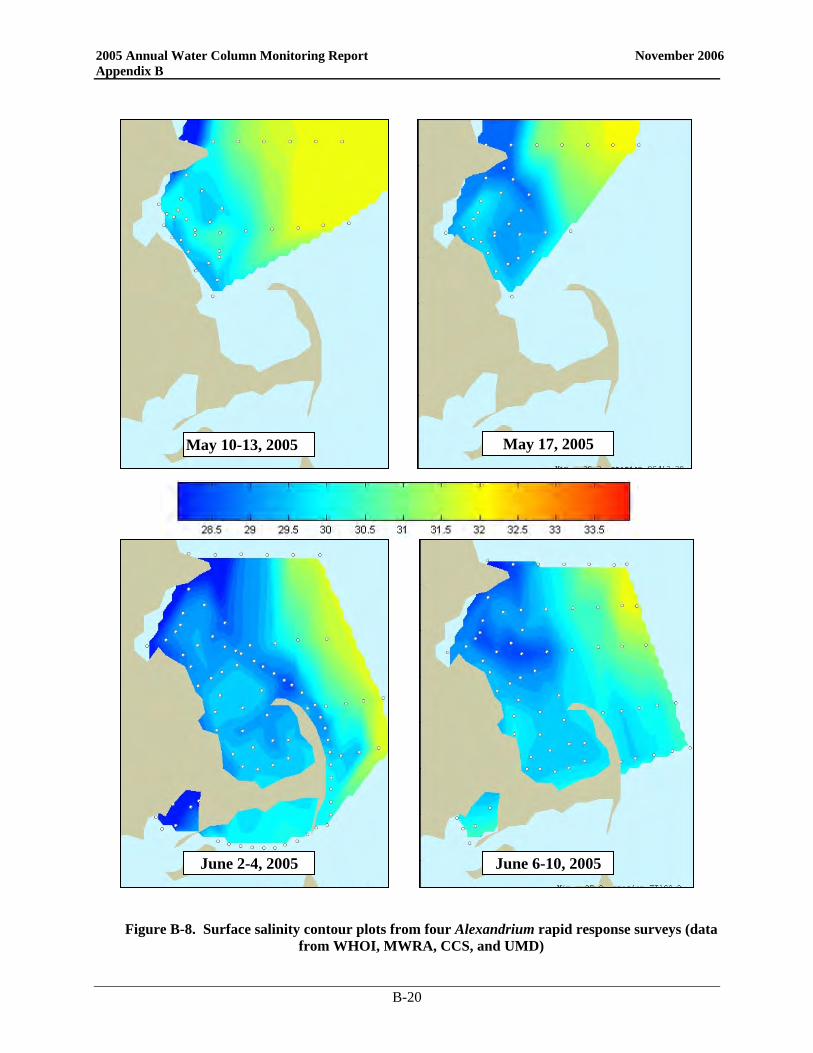
2005 Annual Water Column Monitoring Report November 2006 Appendix B
B-20
Figure B-8. Surface salinity contour plots from four Alexandrium rapid response surveys (data from WHOI, MWRA, CCS, and UMD)
May 10-13, 2005 May 17, 2005
June 2-4, 2005 June 6-10, 2005
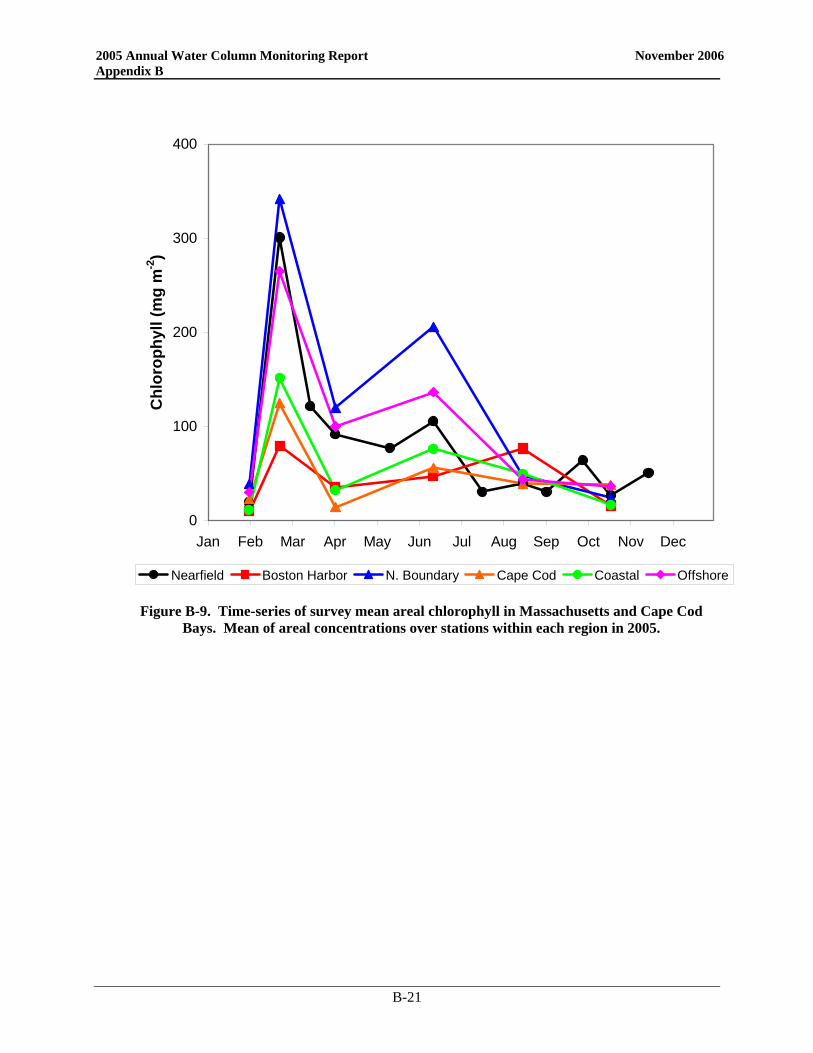
2005 Annual Water Column Monitoring Report November 2006 Appendix B
B-21
0
100
200
300
400
Jan Feb Mar Apr May Jun Jul Aug Sep Oct Nov Dec
Chl
orop
hyll
(mg
m-2
)
Nearfield Boston Harbor N. Boundary Cape Cod Coastal Offshore
Figure B-9. Time-series of survey mean areal chlorophyll in Massachusetts and Cape Cod Bays. Mean of areal concentrations over stations within each region in 2005.
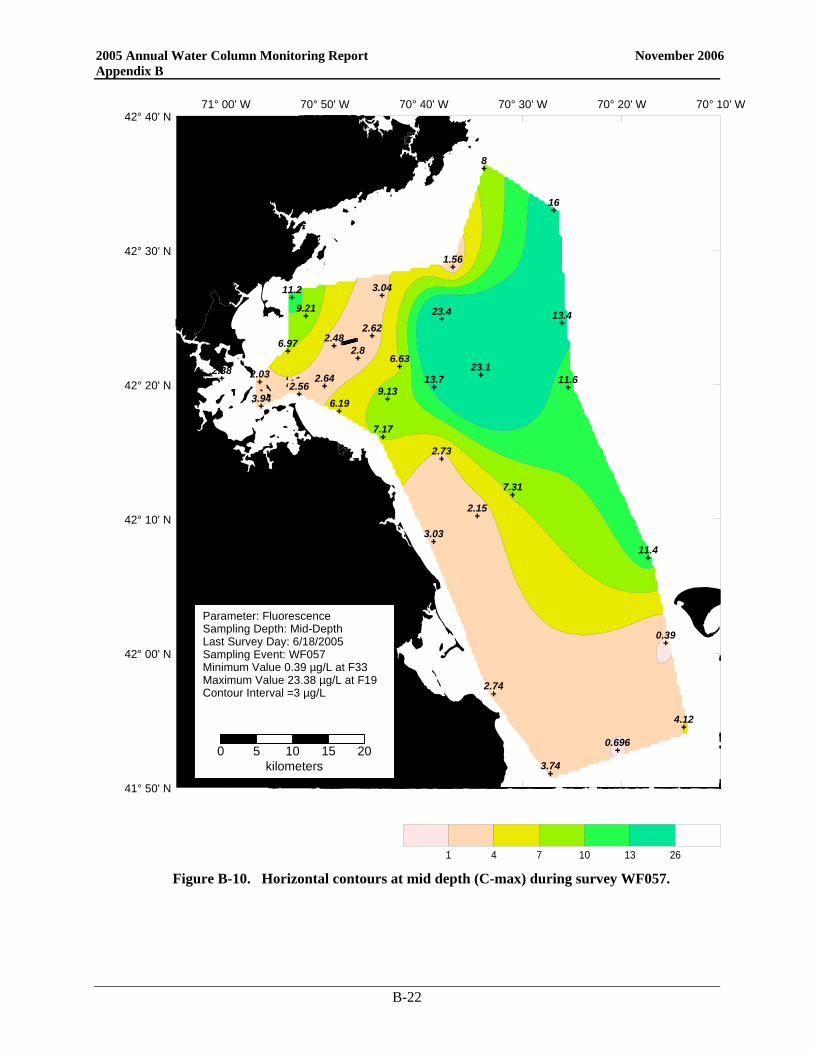
2005 Annual Water Column Monitoring Report November 2006 Appendix B
B-22
3.74
4.12
2.74
3.03
2.15
7.31
2.73
11.6
7.17
6.199.13
13.723.1
11.2
23.4
1.56
2.03
6.97
2.56
8
16
13.4
11.4
2.38
3.94
0.696
0.39
9.21
3.04
6.63
2.64
2.62
2.82.48
1 4 7 10 13 26
71° 00' W 70° 50' W 70° 40' W 70° 30' W 70° 20' W 70° 10' W
41° 50' N
42° 00' N
42° 10' N
42° 20' N
42° 30' N
42° 40' N
0 5 10 15 20kilometers
Parameter: FluorescenceSampling Depth: Mid-DepthLast Survey Day: 6/18/2005Sampling Event: WF057Minimum Value 0.39 µg/L at F33Maximum Value 23.38 µg/L at F19Contour Interval =3 µg/L
Figure B-10. Horizontal contours at mid depth (C-max) during survey WF057.
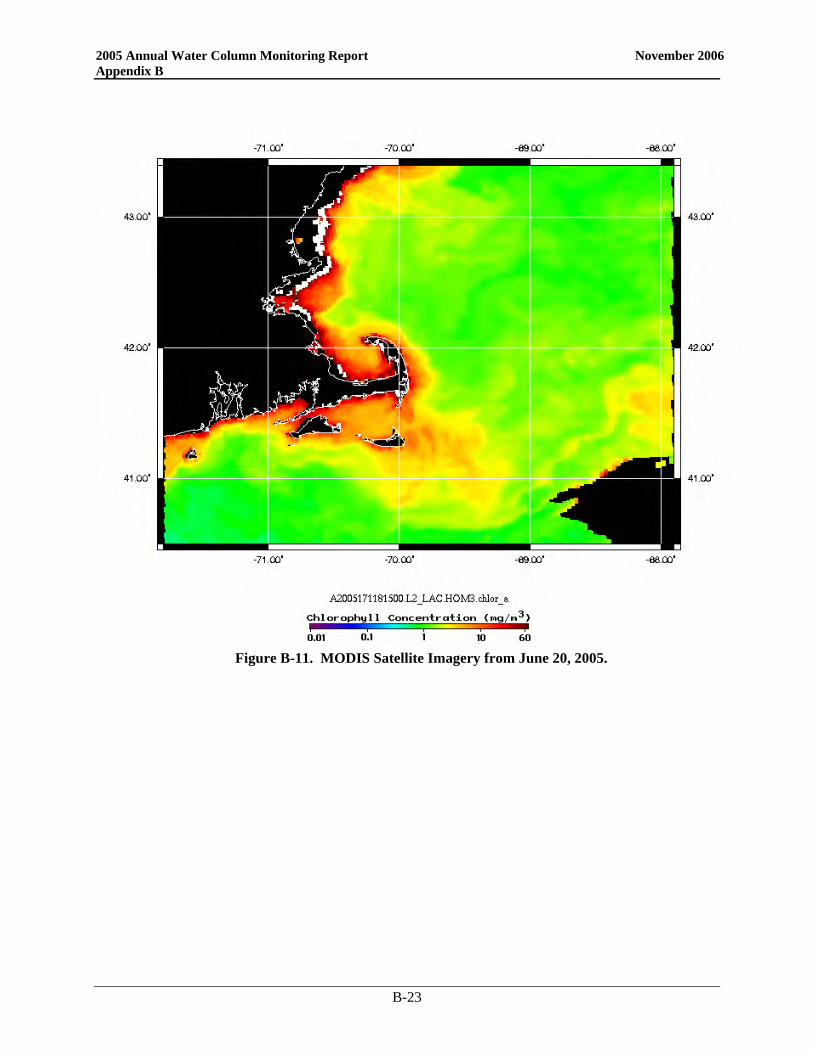
2005 Annual Water Column Monitoring Report November 2006 Appendix B
B-23
Figure B-11. MODIS Satellite Imagery from June 20, 2005.
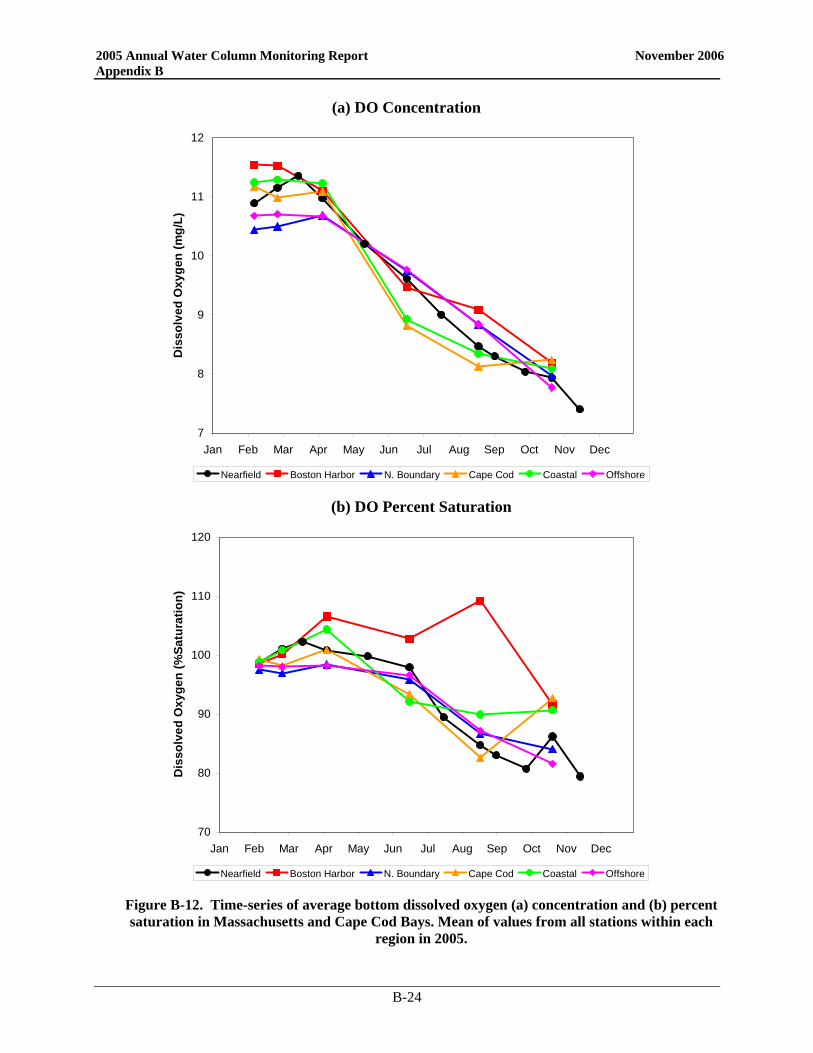
2005 Annual Water Column Monitoring Report November 2006 Appendix B
B-24
(a) DO Concentration
(b) DO Percent Saturation
Figure B-12. Time-series of average bottom dissolved oxygen (a) concentration and (b) percent saturation in Massachusetts and Cape Cod Bays. Mean of values from all stations within each
region in 2005.
Nearfield Boston Harbor N. Boundary Cape Cod Coastal Offshore
Nearfield Boston Harbor N. Boundary Cape Cod Coastal Offshore
7
8
9
10
11
12
Jan Feb Mar Apr May Jun Jul Aug Sep Oct Nov Dec
Dis
solv
ed O
xyge
n (m
g/L)
70
80
90
100
110
120
Jan Feb Mar Apr May Jun Jul Aug Sep Oct Nov Dec
Dis
solv
ed O
xyge
n (%
Satu
ratio
n)
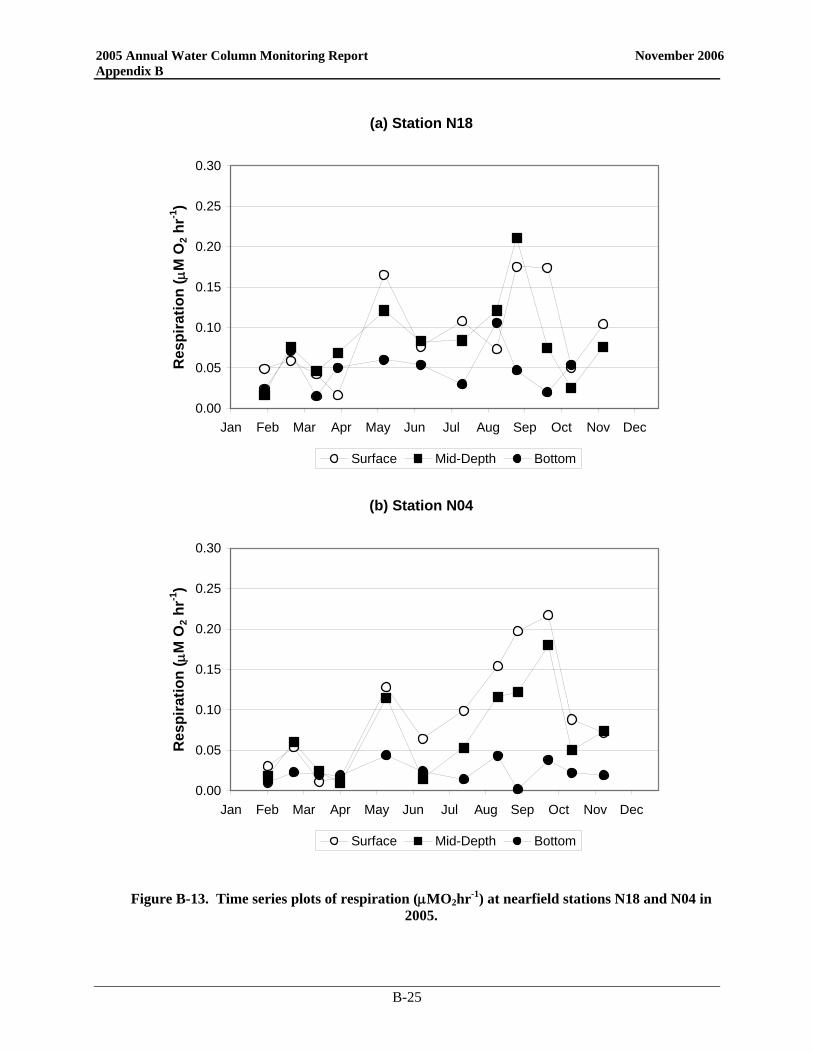
2005 Annual Water Column Monitoring Report November 2006 Appendix B
B-25
(a) Station N18
0.00
0.05
0.10
0.15
0.20
0.25
0.30
Jan Feb Mar Apr May Jun Jul Aug Sep Oct Nov Dec
Res
pira
tion
( µM
O2 h
r-1)
Surface Mid-Depth Bottom
(b) Station N04
0.00
0.05
0.10
0.15
0.20
0.25
0.30
Jan Feb Mar Apr May Jun Jul Aug Sep Oct Nov Dec
Res
pira
tion
( µM
O2 h
r-1)
Surface Mid-Depth Bottom
Figure B-13. Time series plots of respiration (µMO2hr-1) at nearfield stations N18 and N04 in 2005.
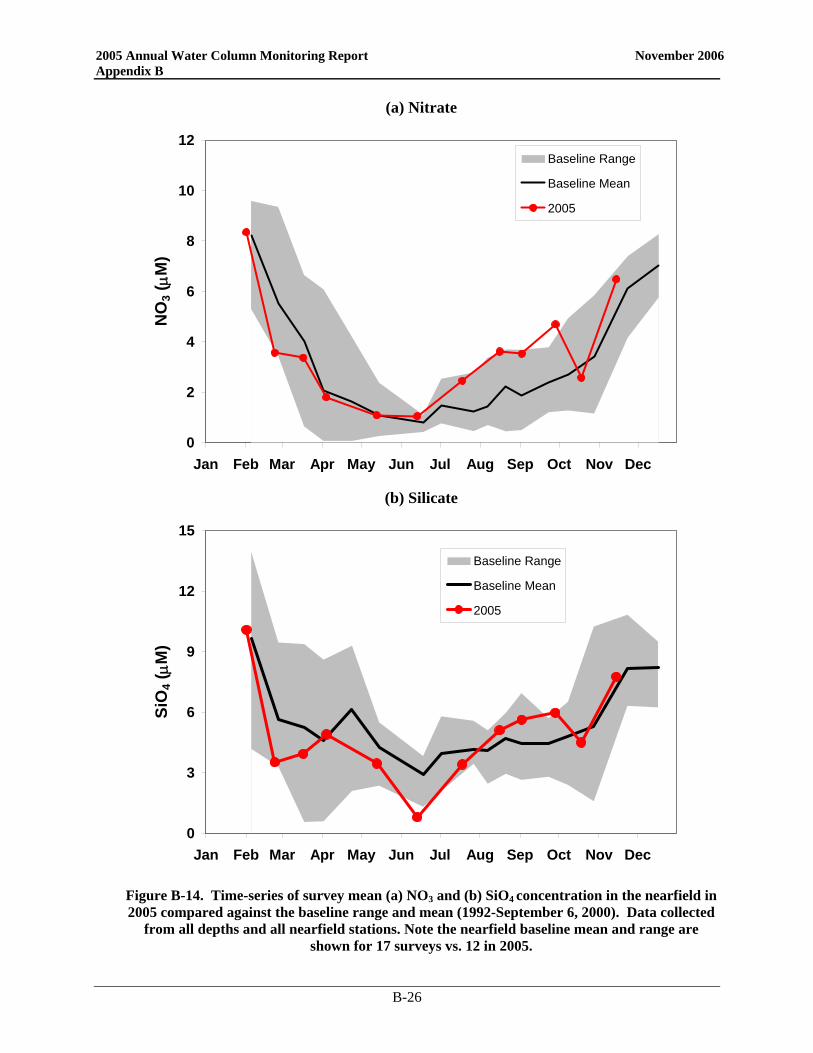
2005 Annual Water Column Monitoring Report November 2006 Appendix B
B-26
(a) Nitrate
0
2
4
6
8
10
12
Jan Feb Mar Apr May Jun Jul Aug Sep Oct Nov Dec
NO
3 (µM
)Baseline Range
Baseline Mean
2005
(b) Silicate
0
3
6
9
12
15
Jan Feb Mar Apr May Jun Jul Aug Sep Oct Nov Dec
SiO
4 (µM
)
Baseline Range
Baseline Mean
2005
Figure B-14. Time-series of survey mean (a) NO3 and (b) SiO4 concentration in the nearfield in 2005 compared against the baseline range and mean (1992-September 6, 2000). Data collected
from all depths and all nearfield stations. Note the nearfield baseline mean and range are shown for 17 surveys vs. 12 in 2005.
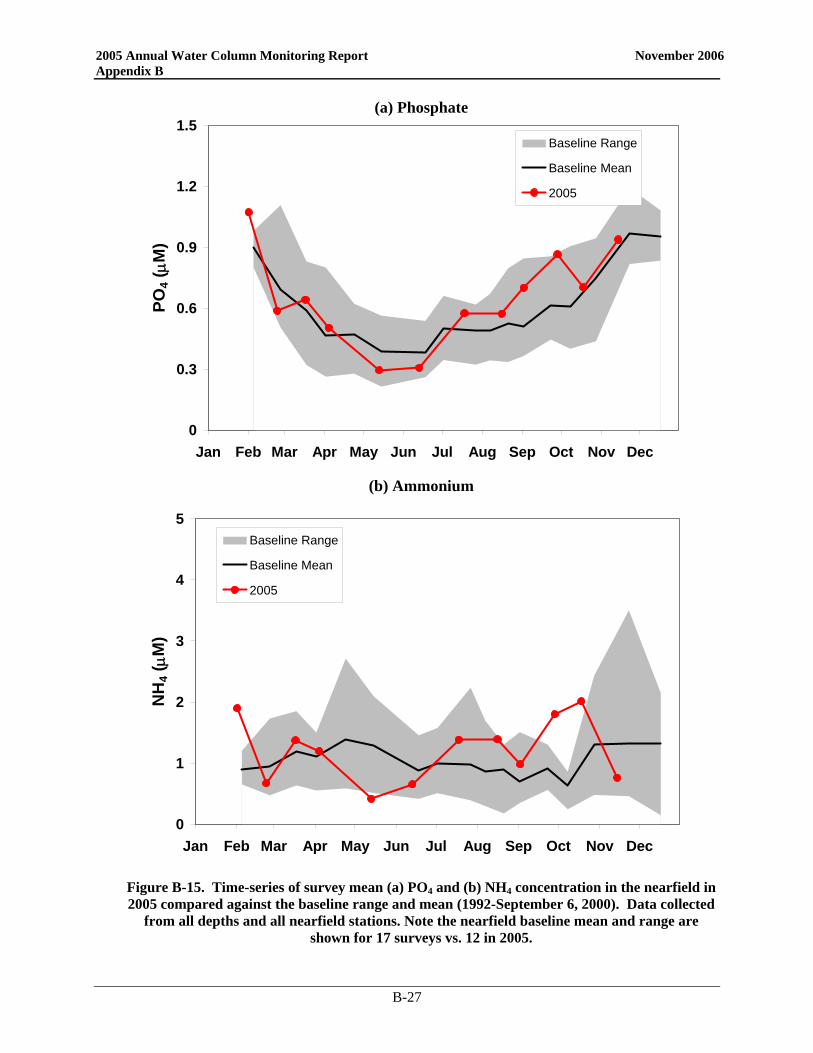
2005 Annual Water Column Monitoring Report November 2006 Appendix B
B-27
(a) Phosphate
0
0.3
0.6
0.9
1.2
1.5
Jan Feb Mar Apr May Jun Jul Aug Sep Oct Nov Dec
PO4 (µM
)Baseline Range
Baseline Mean
2005
(b) Ammonium
0
1
2
3
4
5
Jan Feb Mar Apr May Jun Jul Aug Sep Oct Nov Dec
NH
4 (µM
)
Baseline Range
Baseline Mean
2005
Figure B-15. Time-series of survey mean (a) PO4 and (b) NH4 concentration in the nearfield in 2005 compared against the baseline range and mean (1992-September 6, 2000). Data collected
from all depths and all nearfield stations. Note the nearfield baseline mean and range are shown for 17 surveys vs. 12 in 2005.
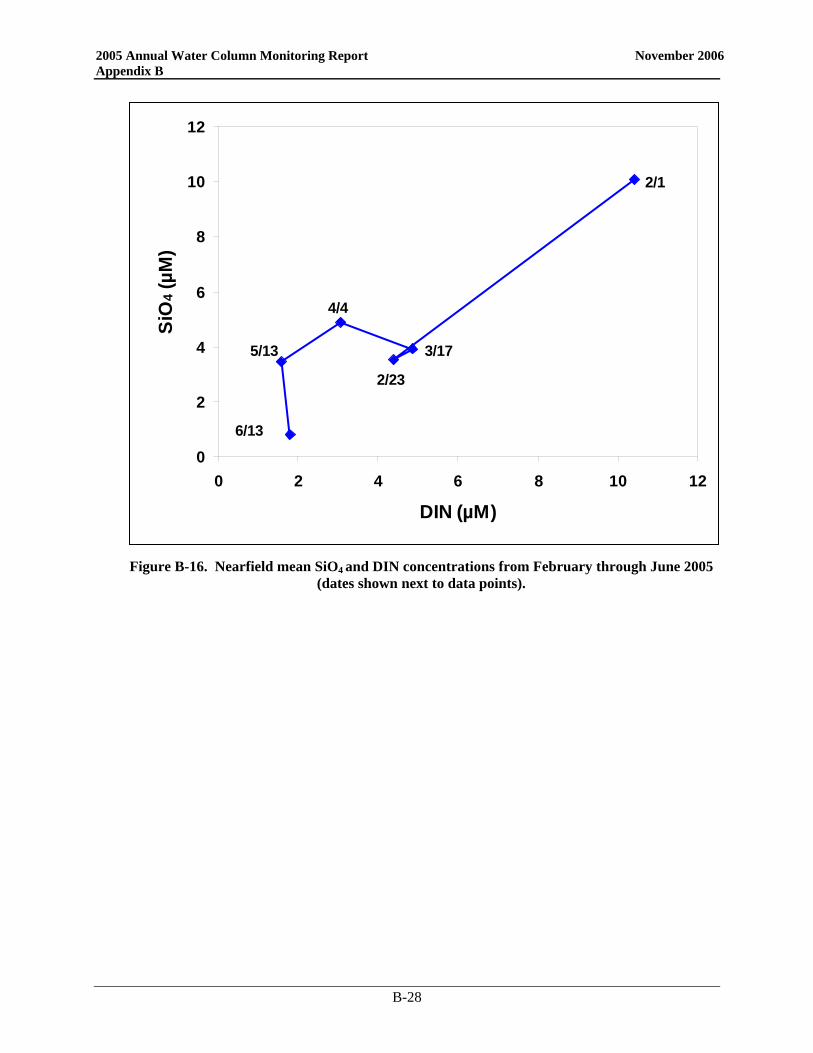
2005 Annual Water Column Monitoring Report November 2006 Appendix B
B-28
0
2
4
6
8
10
12
0 2 4 6 8 10 12
DIN (µM)
SiO
4 (µM
)2/1
2/23
4/4
3/175/13
6/13
Figure B-16. Nearfield mean SiO4 and DIN concentrations from February through June 2005
(dates shown next to data points).
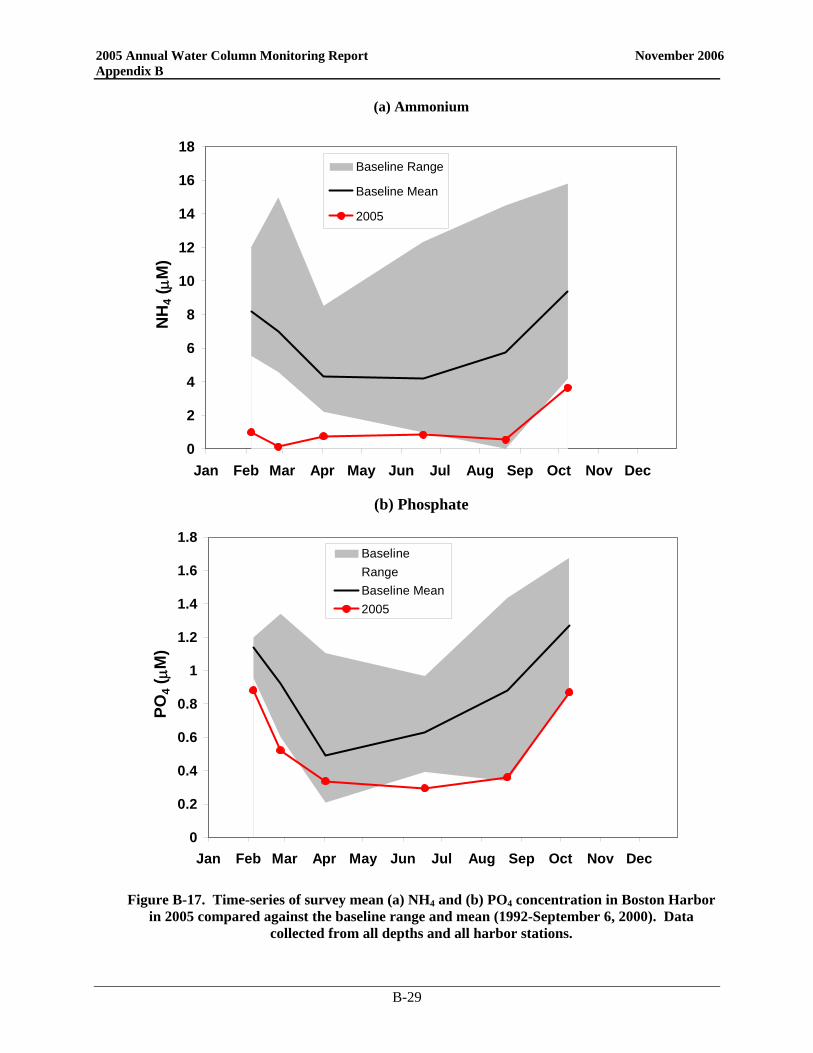
2005 Annual Water Column Monitoring Report November 2006 Appendix B
B-29
(a) Ammonium
0
2
4
6
8
10
12
14
16
18
Jan Feb Mar Apr May Jun Jul Aug Sep Oct Nov Dec
NH
4 (µM
)Baseline Range
Baseline Mean
2005
(b) Phosphate
0
0.2
0.4
0.6
0.8
1
1.2
1.4
1.6
1.8
Jan Feb Mar Apr May Jun Jul Aug Sep Oct Nov Dec
PO4 (µM
)
BaselineRangeBaseline Mean2005
Figure B-17. Time-series of survey mean (a) NH4 and (b) PO4 concentration in Boston Harbor
in 2005 compared against the baseline range and mean (1992-September 6, 2000). Data collected from all depths and all harbor stations.
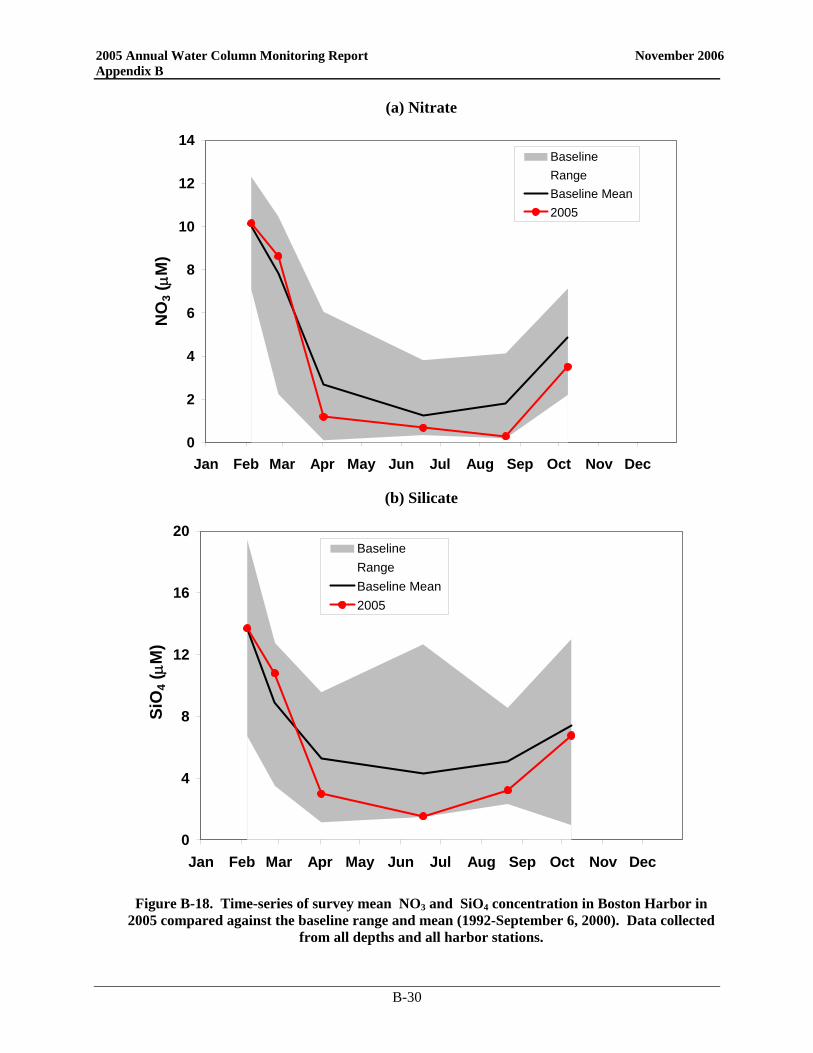
2005 Annual Water Column Monitoring Report November 2006 Appendix B
B-30
(a) Nitrate
0
2
4
6
8
10
12
14
Jan Feb Mar Apr May Jun Jul Aug Sep Oct Nov Dec
NO
3 (µM
)BaselineRangeBaseline Mean2005
(b) Silicate
0
4
8
12
16
20
Jan Feb Mar Apr May Jun Jul Aug Sep Oct Nov Dec
SiO
4 (µM
)
BaselineRangeBaseline Mean2005
Figure B-18. Time-series of survey mean NO3 and SiO4 concentration in Boston Harbor in
2005 compared against the baseline range and mean (1992-September 6, 2000). Data collected from all depths and all harbor stations.
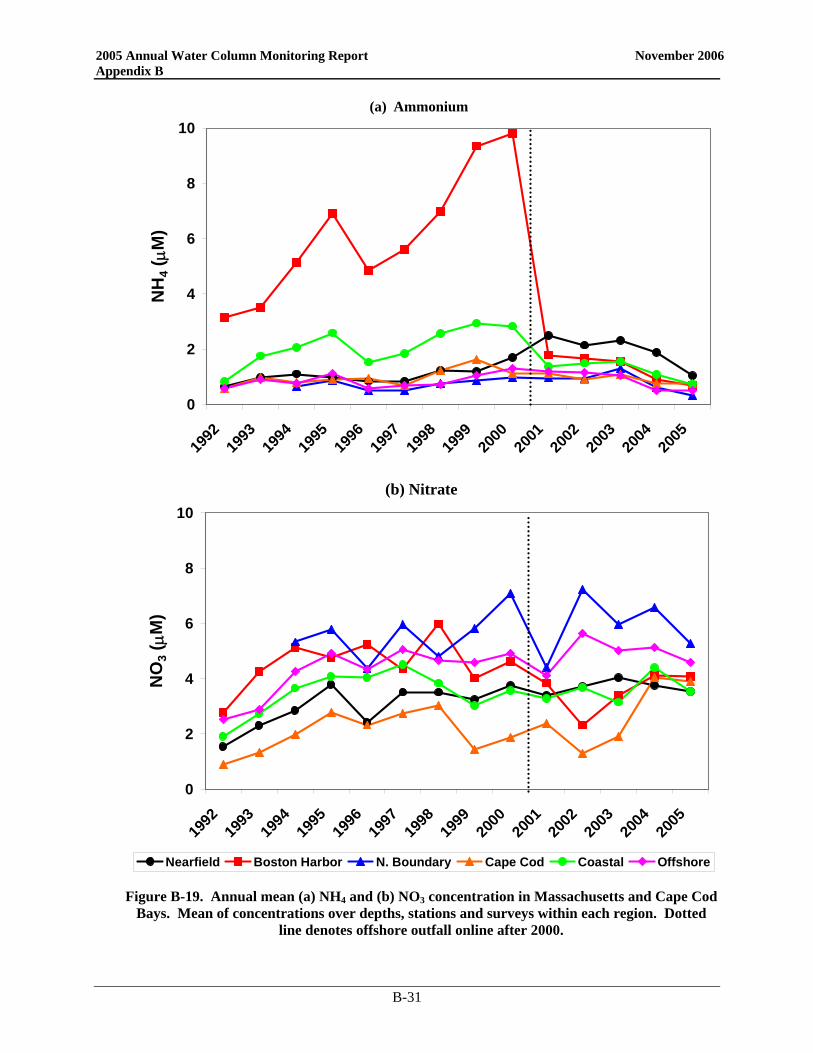
2005 Annual Water Column Monitoring Report November 2006 Appendix B
B-31
(a) Ammonium
0
2
4
6
8
10
1992
1993
1994
1995
1996
1997
1998
1999
2000
2001
2002
2003
2004
2005
NH
4 (µM
)
(b) Nitrate
0
2
4
6
8
10
1992
1993
1994
1995
1996
1997
1998
1999
2000
2001
2002
2003
2004
2005
NO
3 (µM
)
Nearfield Boston Harbor N. Boundary Cape Cod Coastal Offshore
Figure B-19. Annual mean (a) NH4 and (b) NO3 concentration in Massachusetts and Cape Cod Bays. Mean of concentrations over depths, stations and surveys within each region. Dotted
line denotes offshore outfall online after 2000.
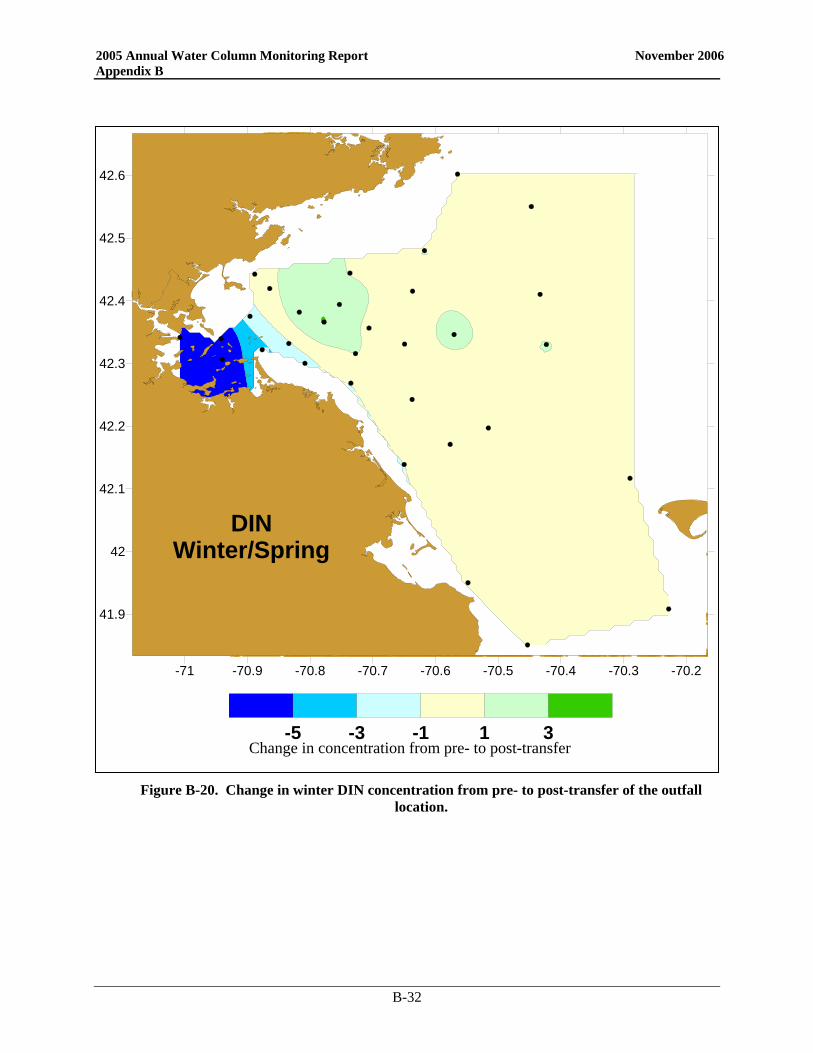
2005 Annual Water Column Monitoring Report November 2006 Appendix B
B-32
Figure B-20. Change in winter DIN concentration from pre- to post-transfer of the outfall location.
-71 -70.9 -70.8 -70.7 -70.6 -70.5 -70.4 -70.3 -70.2
41.9
42
42.1
42.2
42.3
42.4
42.5
42.6
DINWinter/Spring
-5 -3 -1 1 3Change in concentration from pre- to post-transfer
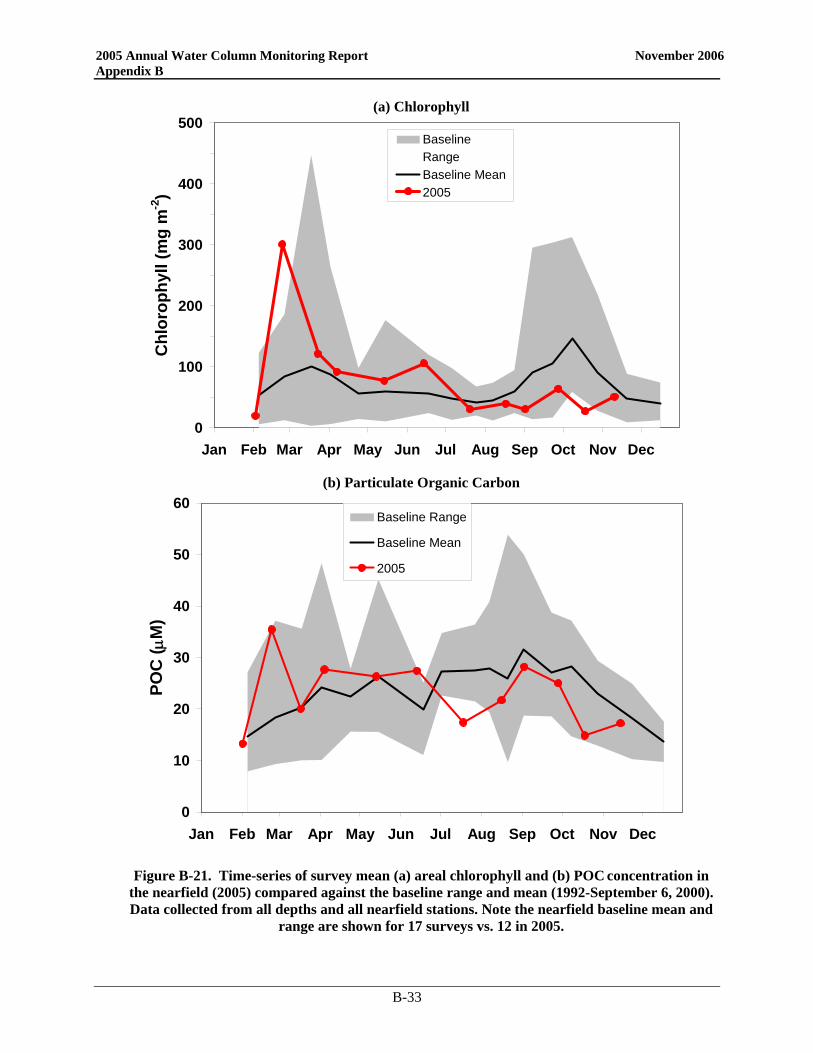
2005 Annual Water Column Monitoring Report November 2006 Appendix B
B-33
(a) Chlorophyll
0
100
200
300
400
500
Jan Feb Mar Apr May Jun Jul Aug Sep Oct Nov Dec
Chl
orop
hyll
(mg
m-2
)BaselineRangeBaseline Mean2005
(b) Particulate Organic Carbon
0
10
20
30
40
50
60
Jan Feb Mar Apr May Jun Jul Aug Sep Oct Nov Dec
POC
( µM
)
Baseline Range
Baseline Mean
2005
Figure B-21. Time-series of survey mean (a) areal chlorophyll and (b) POC concentration in
the nearfield (2005) compared against the baseline range and mean (1992-September 6, 2000). Data collected from all depths and all nearfield stations. Note the nearfield baseline mean and
range are shown for 17 surveys vs. 12 in 2005.
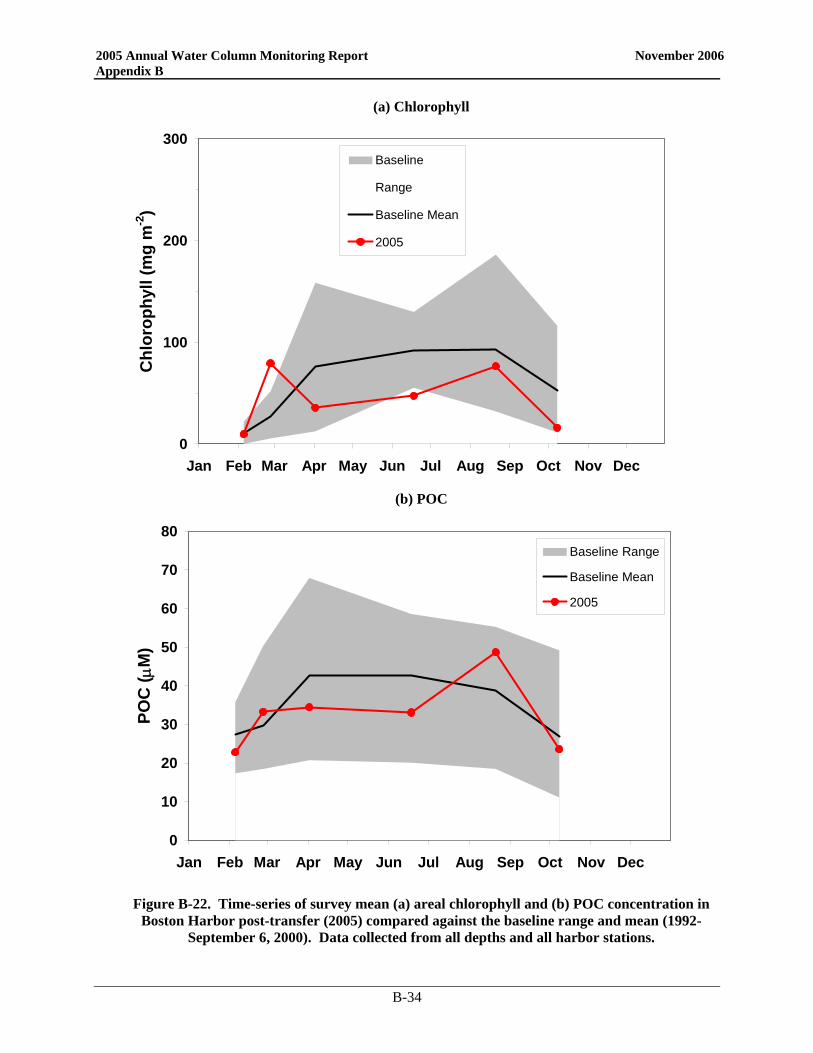
2005 Annual Water Column Monitoring Report November 2006 Appendix B
B-34
(a) Chlorophyll
0
100
200
300
Jan Feb Mar Apr May Jun Jul Aug Sep Oct Nov Dec
Chl
orop
hyll
(mg
m-2
)Baseline
Range
Baseline Mean
2005
(b) POC
0
10
20
30
40
50
60
70
80
Jan Feb Mar Apr May Jun Jul Aug Sep Oct Nov Dec
POC
( µM
)
Baseline Range
Baseline Mean
2005
Figure B-22. Time-series of survey mean (a) areal chlorophyll and (b) POC concentration in
Boston Harbor post-transfer (2005) compared against the baseline range and mean (1992-September 6, 2000). Data collected from all depths and all harbor stations.
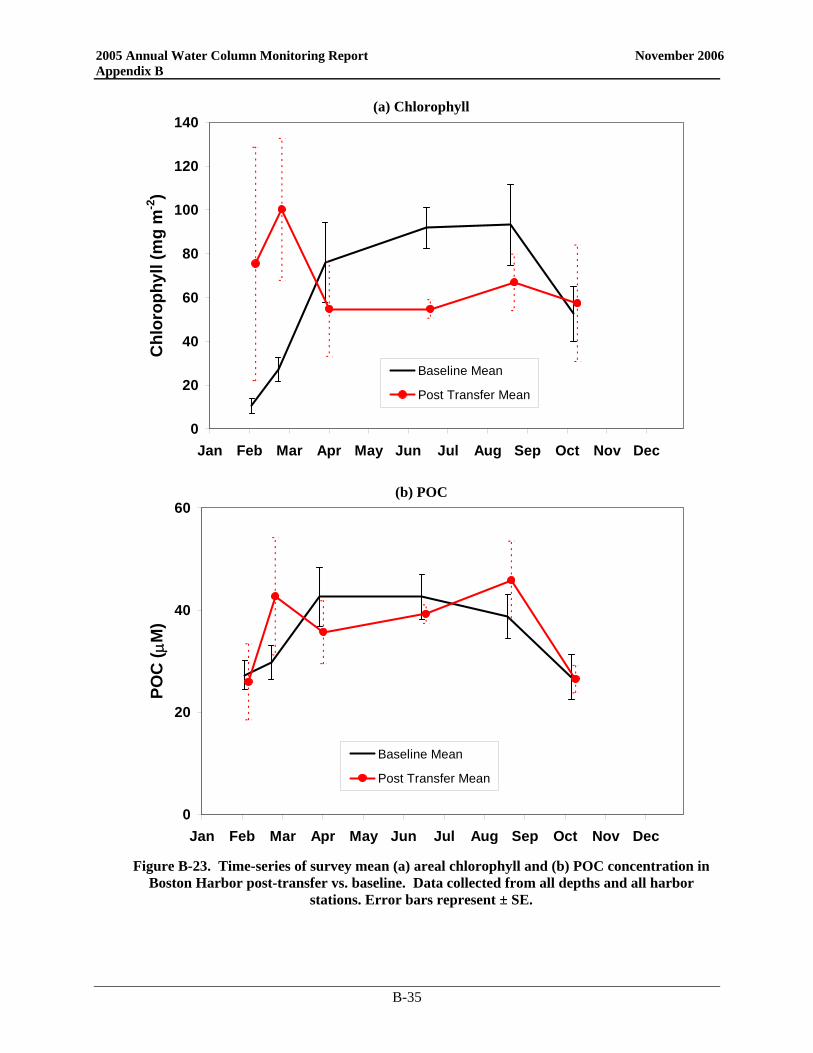
2005 Annual Water Column Monitoring Report November 2006 Appendix B
B-35
(a) Chlorophyll
0
20
40
60
80
100
120
140
Jan Feb Mar Apr May Jun Jul Aug Sep Oct Nov Dec
Chl
orop
hyll
(mg
m-2
)
Baseline Mean
Post Transfer Mean
(b) POC
0
20
40
60
Jan Feb Mar Apr May Jun Jul Aug Sep Oct Nov Dec
POC
( µM
)
Baseline Mean
Post Transfer Mean
Figure B-23. Time-series of survey mean (a) areal chlorophyll and (b) POC concentration in
Boston Harbor post-transfer vs. baseline. Data collected from all depths and all harbor stations. Error bars represent ± SE.
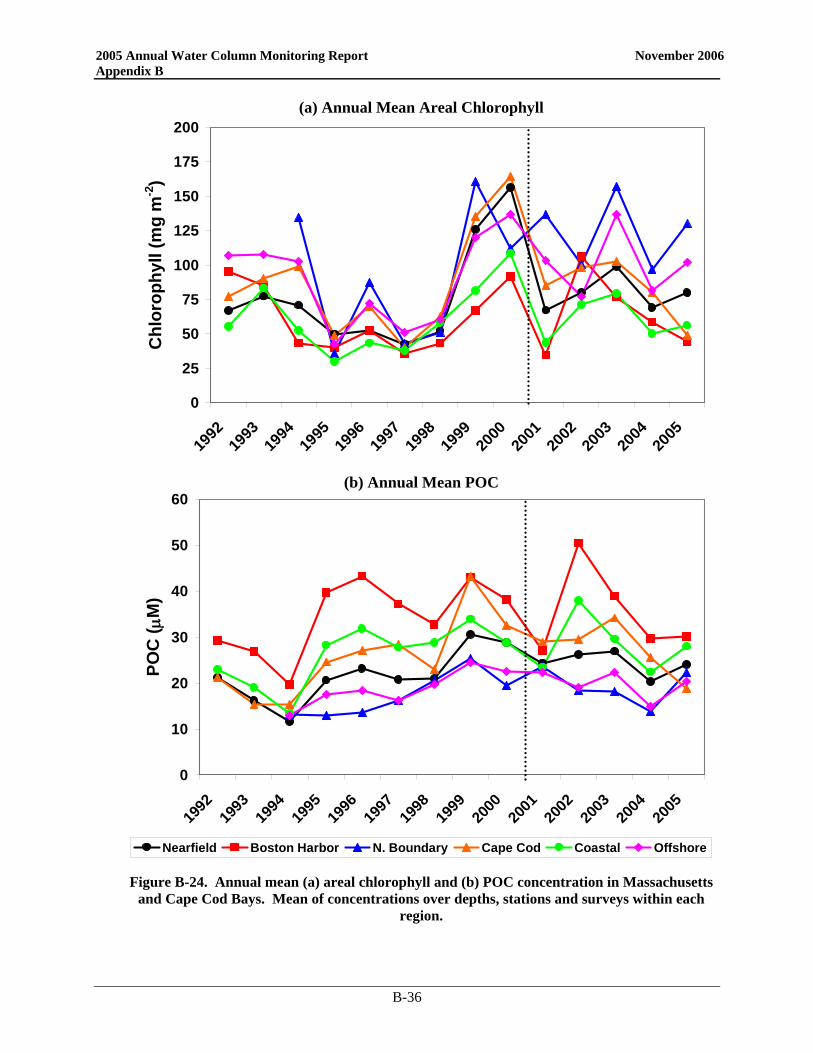
2005 Annual Water Column Monitoring Report November 2006 Appendix B
B-36
(a) Annual Mean Areal Chlorophyll
0
25
50
75
100
125
150
175
200
1992
1993
1994
1995
1996
1997
1998
1999
2000
2001
2002
2003
2004
2005
Chl
orop
hyll
(mg
m-2
)
(b) Annual Mean POC
0
10
20
30
40
50
60
1992
1993
1994
1995
1996
1997
1998
1999
2000
2001
2002
2003
2004
2005
POC
( µM
)
Nearfield Boston Harbor N. Boundary Cape Cod Coastal Offshore
Figure B-24. Annual mean (a) areal chlorophyll and (b) POC concentration in Massachusetts and Cape Cod Bays. Mean of concentrations over depths, stations and surveys within each
region.
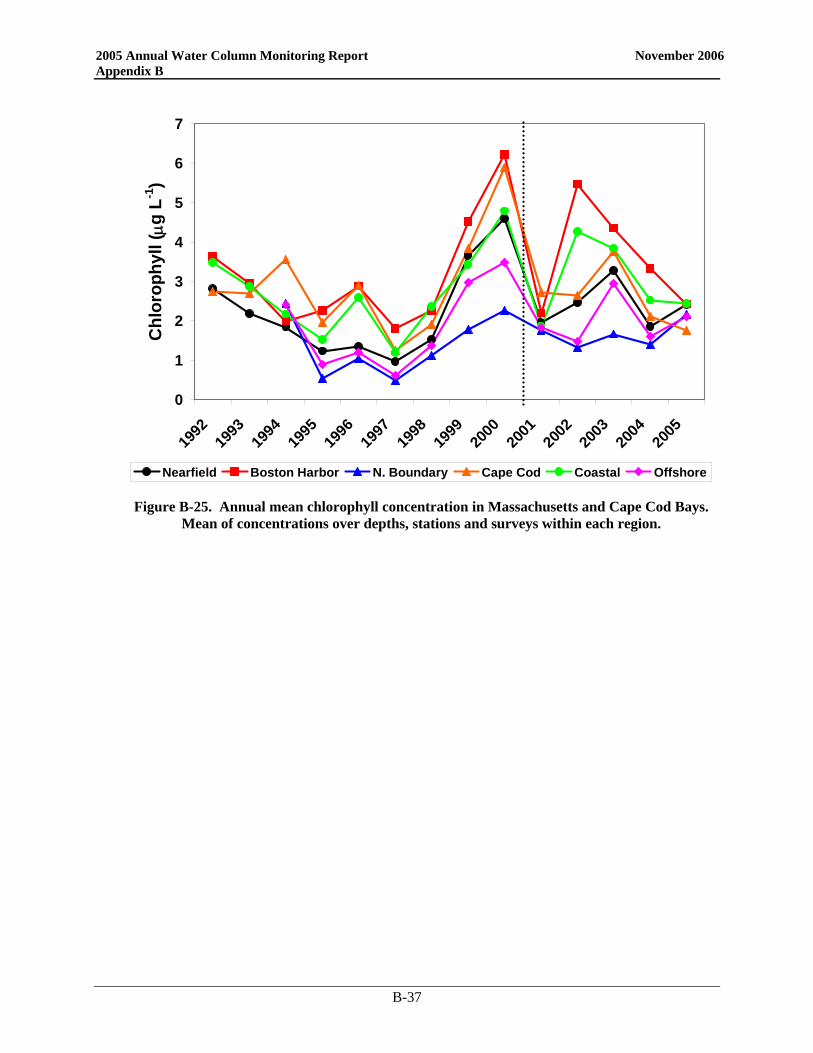
2005 Annual Water Column Monitoring Report November 2006 Appendix B
B-37
0
1
2
3
4
5
6
7
1992
1993
1994
1995
1996
1997
1998
1999
2000
2001
2002
2003
2004
2005
Chl
orop
hyll
( µg
L-1)
Nearfield Boston Harbor N. Boundary Cape Cod Coastal Offshore
Figure B-25. Annual mean chlorophyll concentration in Massachusetts and Cape Cod Bays. Mean of concentrations over depths, stations and surveys within each region.
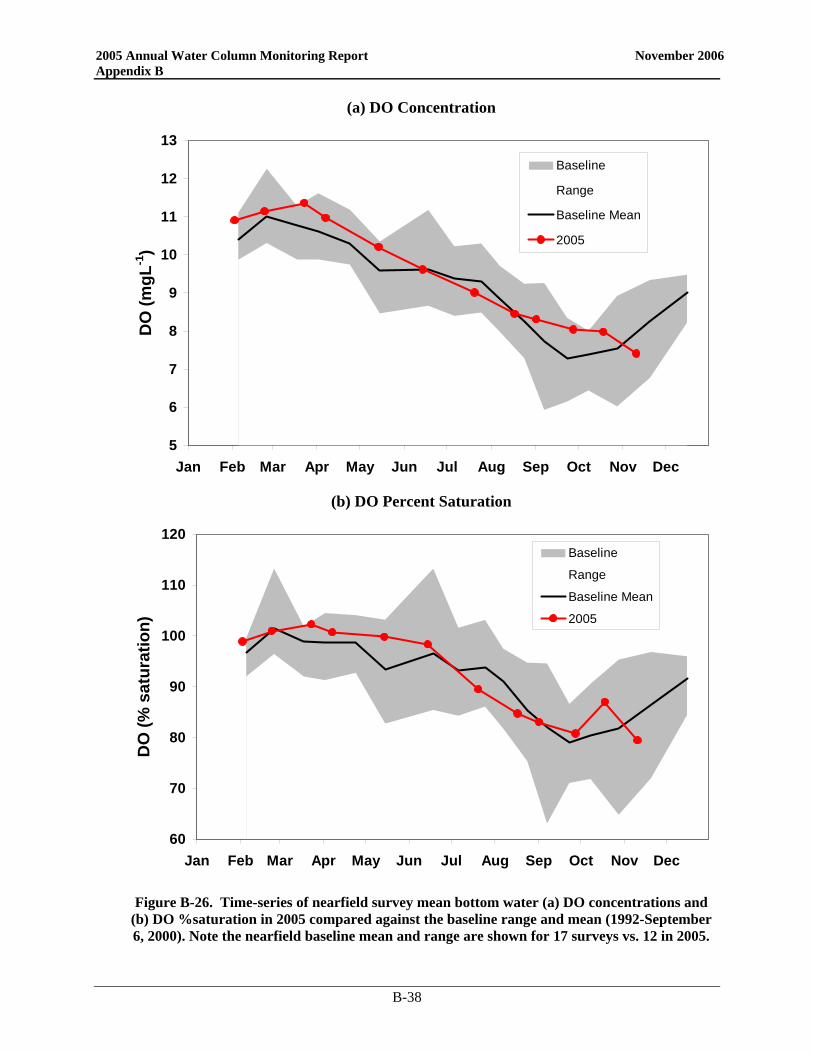
2005 Annual Water Column Monitoring Report November 2006 Appendix B
B-38
(a) DO Concentration
5
6
7
8
9
10
11
12
13
Jan Feb Mar Apr May Jun Jul Aug Sep Oct Nov Dec
DO
(mgL
-1)
Baseline
Range
Baseline Mean
2005
(b) DO Percent Saturation
60
70
80
90
100
110
120
Jan Feb Mar Apr May Jun Jul Aug Sep Oct Nov Dec
DO
(% s
atur
atio
n)
Baseline
Range
Baseline Mean
2005
Figure B-26. Time-series of nearfield survey mean bottom water (a) DO concentrations and
(b) DO %saturation in 2005 compared against the baseline range and mean (1992-September 6, 2000). Note the nearfield baseline mean and range are shown for 17 surveys vs. 12 in 2005.
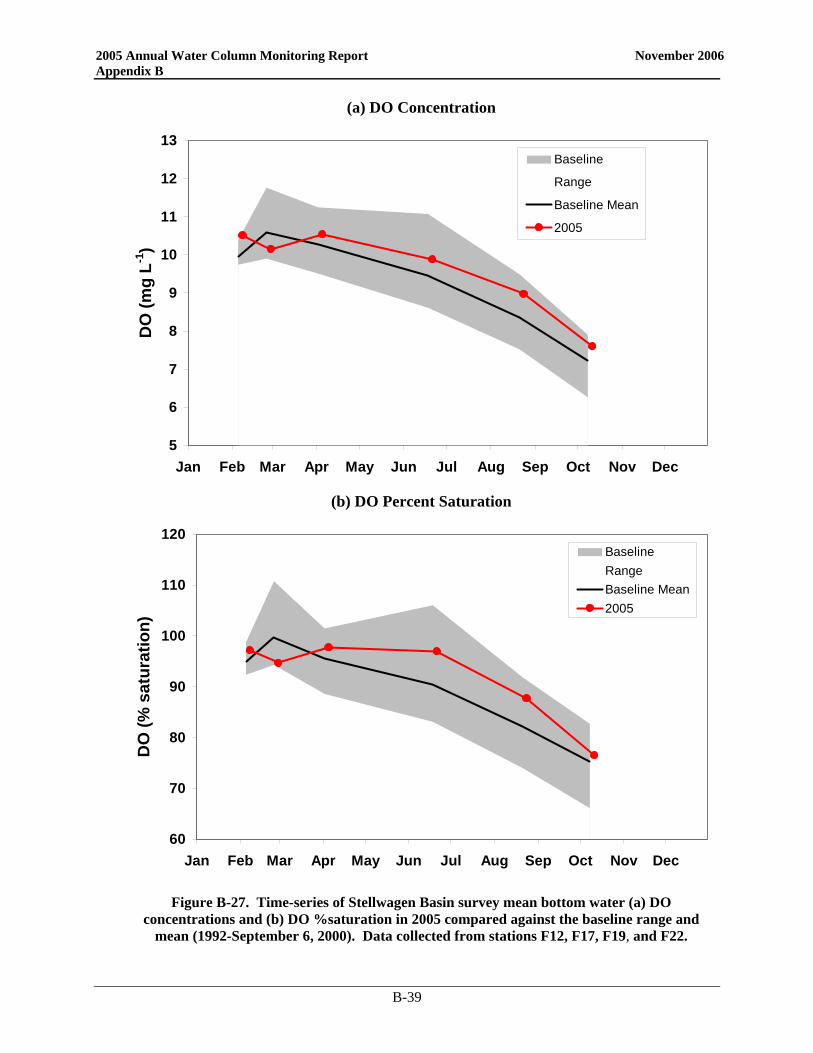
2005 Annual Water Column Monitoring Report November 2006 Appendix B
B-39
(a) DO Concentration
5
6
7
8
9
10
11
12
13
Jan Feb Mar Apr May Jun Jul Aug Sep Oct Nov Dec
DO
(mg
L-1)
Baseline
Range
Baseline Mean
2005
(b) DO Percent Saturation
60
70
80
90
100
110
120
Jan Feb Mar Apr May Jun Jul Aug Sep Oct Nov Dec
DO
(% s
atur
atio
n)
BaselineRangeBaseline Mean2005
Figure B-27. Time-series of Stellwagen Basin survey mean bottom water (a) DO
concentrations and (b) DO %saturation in 2005 compared against the baseline range and mean (1992-September 6, 2000). Data collected from stations F12, F17, F19, and F22.
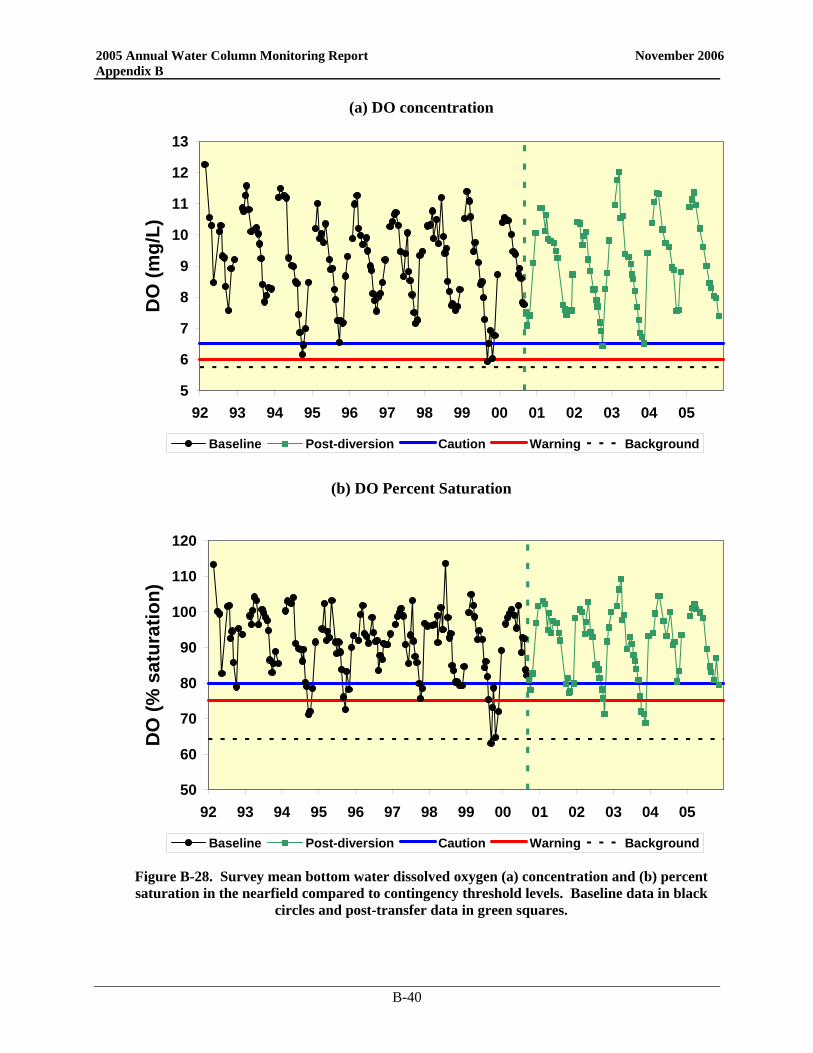
2005 Annual Water Column Monitoring Report November 2006 Appendix B
B-40
(a) DO concentration
5
6
7
8
9
10
11
12
13
92 93 94 95 96 97 98 99 00 01 02 03 04 05
DO
(mg/
L)
Baseline Post-diversion Caution Warning Background
(b) DO Percent Saturation
50
60
70
80
90
100
110
120
92 93 94 95 96 97 98 99 00 01 02 03 04 05
DO
(% s
atur
atio
n)
Baseline Post-diversion Caution Warning Background
Figure B-28. Survey mean bottom water dissolved oxygen (a) concentration and (b) percent saturation in the nearfield compared to contingency threshold levels. Baseline data in black
circles and post-transfer data in green squares.
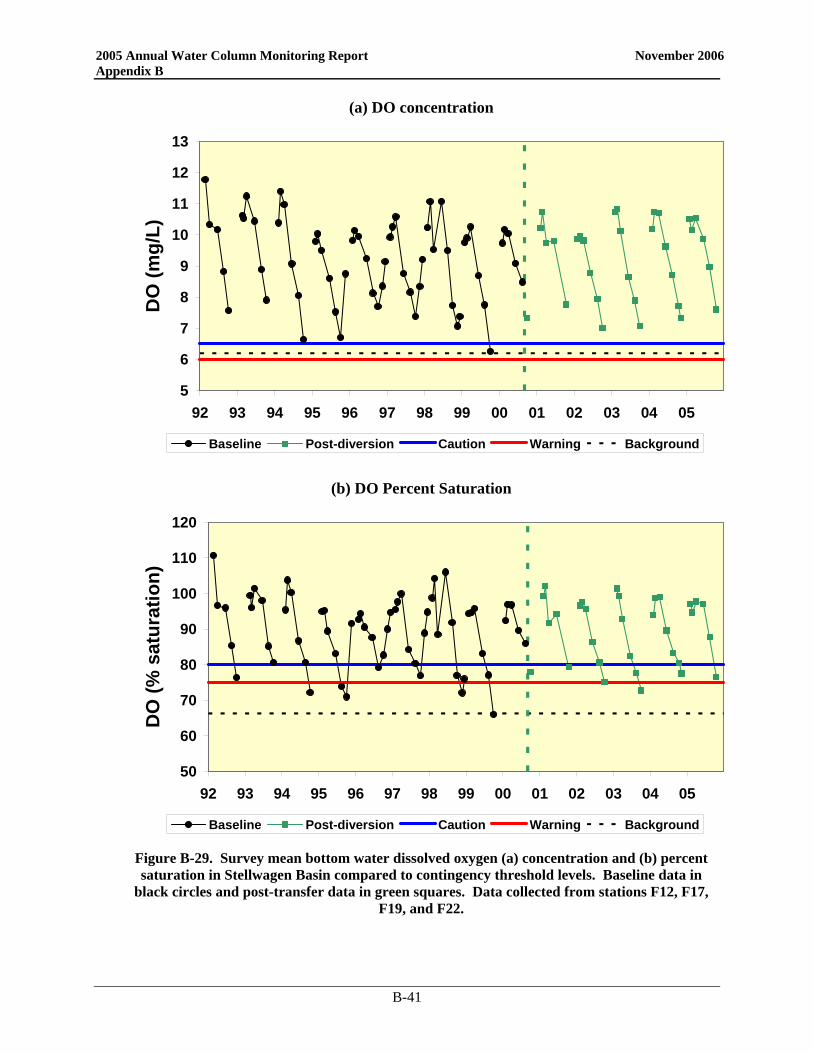
2005 Annual Water Column Monitoring Report November 2006 Appendix B
B-41
(a) DO concentration
5
6
7
8
9
10
11
12
13
92 93 94 95 96 97 98 99 00 01 02 03 04 05
DO
(mg/
L)
Baseline Post-diversion Caution Warning Background
(b) DO Percent Saturation
50
60
70
80
90
100
110
120
92 93 94 95 96 97 98 99 00 01 02 03 04 05
DO
(% s
atur
atio
n)
Baseline Post-diversion Caution Warning Background
Figure B-29. Survey mean bottom water dissolved oxygen (a) concentration and (b) percent saturation in Stellwagen Basin compared to contingency threshold levels. Baseline data in
black circles and post-transfer data in green squares. Data collected from stations F12, F17, F19, and F22.

APPENDIX C
Productivity
2005 Annual Water Column Monitoring Report November 2006 Appendix C
C-1
C. PRODUCTIVITY
C.1 Productivity Overview This section provides an overview of the trends and magnitude of productivity in Massachusetts Bay in 2005 with particular focus on the nearfield sites (station N04 and N18). The higher frequency sampling in the nearfield permits a more detailed examination of temporal trends and interannual differences in productivity in Massachusetts Bay relative to Boston Harbor. A detailed presentation of the February – June productivity data was undertaken in the semi-annual report for 2005 (Libby et al. 2005a). The current discussion focuses on the major themes described in the earlier report and updates these findings by incorporating data collected throughout the annual cycle. In 2005, the patterns of productivity seen at both the nearfield and farfield (Boston Harbor) stations were somewhat different from the long-term patterns (1995 – 2002) but similar to the patterns seen in recent years (2003 -2004). The major differences with long term trends were the low magnitudes of the spring and fall bloom peaks at the nearfield stations and reduced annual productivity at all three sites. At both the nearfield stations, the timing of the spring bloom onset was similar to that seen in previous years but earlier than observed in 2004. Productivity decreased by early April in the nearfield region signifying the termination of the spring bloom. In the harbor, the spring bloom seen in 2003 was not repeated, and the seasonal productivity maximum occurred during the fall. However, production throughout much of the annual cycle was below the long-term mean. Interannual patterns show that production in Boston Harbor has decreased post-relocation of the outfall. This decrease is both ecologically and statistically significant. In the nearfield production has declined slightly since the outfall relocation but the change is not significant. Compared to previous years the reduced magnitude of the spring bloom at both nearfield sites and the reduced fall bloom peak at station N18 are the most notable events in the nearfield in 2005. A model has been developed for Massachusetts Bay that estimates productivity based on satellite imagery. The objective for the model is to expand the productivity measurements beyond the two nearfield stations and to more accurately and comprehensively assess the monthly, seasonal and interannual variability. The increased temporal resolution of the satellite measurements allows for more accurate estimates of annual production by increasing the number of observations from 12 to approximately 100 per year. Mean annual production and areal production calculated using the model for the Massachusetts and Cape Cod Bays region were comparable to nearfield measured values and revealed similar annual trends observed by the in situ productivity measurements with peaks in 1999 and 2000 and generally decreasing rates from 2000 to 2004 with a slight increase in 2005. Using a subset of the currently measured depths over the annual cycle produced results similar to those calculated based on all five depths. Values calculated using P-I curve parameters only from the surface or mid-surface depths were generally within 20% of the value calculated using five depths. Averaging these values resulted in overall differences less than 10% but occasional differences were as high as 28% suggesting that productivity should continue to be measured at more than a single depth. Previously we reported that productivity values calculated using only surface, mid-water and bottom depths were generally within 2% of the value calculated using five depths for select periods throughout the year (Libby et al. 2006a).
2005 Annual Water Column Monitoring Report November 2006 Appendix C
C-2
C.1.a Nearfield Description The timing and magnitude of areal production at the nearfield stations in 2005 was similar between the two stations but differed somewhat from both the long-term pattern and from the 2004 data. In 2005, the spring bloom peaked during February and March, somewhat earlier than the April peak observed in 2004, but similar to most prior years. At both sites the bloom extended over two consecutive sampling periods (late-February to mid-March) followed by a decline. In general, patterns observed at the nearfield sites throughout the spring and summer were consistent with those observed from 1995 – 2004. Both nearfield stations were characterized by spring and fall blooms and variable productivity during the summer. However, timing of events was somewhat different from earlier years, with peak summer productivity occurring in May rather than later in the season. Additionally, some differences in the magnitude of productivity were noted, with low productivity peaks particularly during the spring period relative to most years at both nearfield sites and during the fall at station N18. The major differences in the productivity pattern at the nearfield stations in 2005 were the low magnitude of the fall bloom at N18, a switch in the station at which maximum bloom magnitude was observed during the fall period, and the relatively low magnitude of the spring bloom peaks. Also unusual in 2005 was the occurrence of the peak annual value at station N18 in May coincident with the atypical May diatom bloom, rather than during the early spring or fall bloom periods as in all prior years. Potential and measured productivity were similar throughout the seasonal cycle in 2005 (Figure C-1). At the nearfield stations, areal production was low during the initial cruise in February. Values increased to winter-spring bloom levels at both sites by late February and remained elevated through mid-March. These peak production values were coincident with peak diatom bloom abundances in late February and continued diatom presence and initiation of the Phaeocystis bloom in March (see Appendix D). Unlike 2004, the timing of the end of the bloom at both stations is clear since the decline started in March and was complete by the next sample period after an interval of about 3 weeks. As suggested in Appendix B, the Phaeocystis bloom likely peaked during this three week period in late March and early April. At both stations productivity increased by mid- May coincident with an atypical late spring diatom bloom. The late February peak in productivity at the nearfield stations occurred earlier than the spring bloom peak in 2004. However the 2005 spring peak coincided with the timing of peak spring production observed frequently throughout the baseline period (1995 – 2000). The magnitude of the secondary peak in March was greater than the baseline average at N04, but lower than the long-term average in February (Figure C-2a). The magnitudes of both springtime peaks were lower than the baseline average at N18 (Figure C-2b). The bloom magnitude at N04 (1,386 mg C m-2 d-1) was greater than at N18 (1,220 mg C m-2 d-1), which is similar to the pattern seen in 2004 (Figure C-3). The magnitude of fall bloom at N18 was low and similar to 2004, but lower than the peak observed at N04 (Figure C-4). In 2005 and for the second time during the post-diversion period, both the spring and the fall bloom maxima were greater at N04 relative to N18, a pattern never observed prior to the outfall diversion (Figures C-3 and C-4). The winter-spring blooms observed at nearfield stations in 1995-2004 generally reached values of 2,000 to 4,500 mg C m-2 d-1, with bimodal peaks often occurring in February - April. The bloom in 2005 reached maximum measured values at the nearfield sites of ~1,200 – 1,400 mg C m-2 d-1 with bimodal peaks observed in February - March. Unlike many years, an early February peak was not observed. The winter-spring bloom peaks at both nearfield sites in 2005 were low compared to values observed during the winter-spring period since 1998 (Figure C-3). The 2003 -2005 period has been characterized by low magnitude winter spring blooms with the higher productivity occurring at N04 versus N18 in the most recent two years.
2005 Annual Water Column Monitoring Report November 2006 Appendix C
C-3
The timing and duration of the 2005 spring bloom were similar to those observed in prior years. From 1995 to 2000 initiation of the spring bloom generally occurred during late February – early March. In both 2001 and 2002, the bloom was underway when sampling was initiated in early February, while in 2003, the onset of the bloom was observed in mid-March at both sites. In 2004 the spring bloom appeared even later in April. The cessation of the bloom in 2005 followed the typical timing observed in prior years. The onset of stratification and depletion of nitrogen in the surface waters coincided with the cessation of the spring bloom as in prior years.
C.1.b Boston Harbor Description The productivity pattern at the Boston Harbor station (F23) in 2005 differed somewhat from the patterns observed in 2001 – 2004 (Figure C-1). At the harbor station (F23), areal productivity (potential and measured) increased over the spring period, declined in early summer and peaked in late summer. The pattern is unlike that observed prior to the outfall diversion, when productivity generally increased from winter to summer then declined in the fall. No evidence of a spring bloom was seen in the farfield in 2005, which is consistent with the pattern observed in pre-outfall years. However in 2005, unlike the previous year and the pre-outfall years, a late summer bloom was evident in the harbor. The maximum production seen at F23 was 1,366 mg C m-2 d-1 and occurred in mid-August. Although no spring bloom was present, productivity in the harbor during late February was slightly greater than the baseline mean for that time period but less than the baseline maximum (Figure C-2c). Production values were very low relative to the long-term mean during the summer and always less than the baseline mean for the remainder of the annual cycle (Figure C-2c). In 2003, the presence of a spring bloom continued to suggest that the harbor station might be exhibiting a pattern of productivity similar to the nearfield stations, with the cause presumably the reduction in nutrients following the diversion of the outfall. In 2004 no spring or fall bloom was evident at the Harbor station. In 2005, a late summer bloom occurred. Prior to the outfall diversion, peak productivity most frequently occurred in the early summer while during the post-diversion period peak production consistently occurred either in the spring or late summer/fall. With only one year since 2000 showing a spring bloom it does not seem likely that the harbor station is rapidly shifting to the nearfield pattern, but the overall decline in productivity seen at the station does indicate a shift to a less-enriched environment (Figure C-5).
C.2 Interannual Comparisons
C.2.a Areal Productivity To assess the potential effects of the September 2000 relocation of effluent discharge from Boston Harbor to Massachusetts Bay on areal productivity, we compared production measurements at the nearfield and the Boston Harbor stations in 2005 to the baseline productivity data collected from February 1995 to August 2000 (Figure C-2). At nearfield station N18 and in the harbor, areal production for 2005 was less than the long-term average for almost all data points. The exceptions were in late-February at F23, which was only slightly higher than the long term mean and mid-May at N18, which was during the late spring diatom bloom. All other data points for the year were lower than the long-term average at these two stations. Productivity at N04 exceeded the baseline mean during both the summer and the fall, reaching near baseline maxima in May and June and exceeding the baseline maximum in September.
C.2.b Depth Averaged Chlorophyll-Specific Production The current and long-term results for chlorophyll-specific areal production at stations N04, N18 and F23 are presented in Figure C-6 in a similar fashion. However, the baseline period is shorter (1997 –
2005 Annual Water Column Monitoring Report November 2006 Appendix C
C-4
2000) since areal chlorophyll-specific productivity measurements were unavailable before 1997. For the nearfield sites, the chlorophyll-specific areal production in 2005 was frequently below the baseline mean and occasionally lower than the baseline minima. For the Boston Harbor station, the chlorophyll-specific areal production was greater than the baseline mean during late fall and below the baseline mean for the remainder of the annual cycle. Chlorophyll-specific areal productivity in 1997 was elevated compared to 1998 through 2001. For station N04, all of the points in the upper range of the baseline data in Figure C-6 are from 1997; for station N18, 15 of the 17 values in the upper range are from 1997. Differences in techniques (i.e. chlorophyll measurement and integration depth) between HOM2 and HOM3 most likely contributed to the high values observed in 1997. To assess the impact of the 1997 data on the baseline period, chlorophyll-specific productivity for the nearfield stations was replotted without the 1997 data (Figure C-7). Throughout much of the annual cycle, chlorophyll-specific productivity now appears closer to the baseline mean, although occasionally still lower than the minima and on one occasion greater than the maximum. The shortened baseline period may be more useful for comparisons. Based on these findings, the differences in techniques between HOM2 and HOM3 need to be further examined before including the 1997 chlorophyll-specific production data in the baseline period.
C.2.c Regional Changes in Bloom Magnitude Examining the magnitude of seasonal blooms at the nearfield (average for stations N04 and N18) and farfield (station F23) sites indicates that the greatest effect of the outfall relocation is apparent in seasonal productivity levels in the harbor (Figure C-8). The magnitude of the spring bloom in the harbor increased from a mean of 623 mg C m-2 d-1 pre-relocation to 1491 mg C m-2 d-1 post-relocation (Figure C-8a). This increase is nearly significant (P=0.079). The nearfield values for the spring maximum were not significantly different at 2161 mg C m-2 d-1 and 2127 mg C m-2 d-1 respectively. During the summer, the harbor showed the opposite pattern with a post-diversion mean of 1094 mg C m-2 d-1 compared to a pre-diversion mean of 3754 mg C m-2 d-1 (Figure C-8b). The post-diversion harbor production is 30% of the baseline mean annual production and represents an ecologically and statistically significant change (P=0.003). Again, the nearfield values are nearly constant post-diversion (1508 mg C m-2 d-1) and pre-diversion (1677 mg C m-2 d-1) during the summer. During the fall, the values for the harbor followed a similar pattern to that seen in the summer with high values pre-diversion (3221 mg C m-2 d-1) and low values post-diversion (1797 mg C m-2 d-1) (Figure C-8c). Again, little change was seen in the nearfield (2660 mg C m-2 d-1 pre and 2588 mg C m-2 d-1 post). The changes in fall values were not significant in either area. Prior to the outfall relocation in 2000, the typical harbor pattern had low spring production and high production in the summer which was maintained into the fall. After 2000, spring production has increased while summer and fall production have decreased. Fall production has not decreased as much as the summer, however, leading to the appearance of a fall “bloom” in the harbor. In the nearfield, mean production values have increased slightly for spring while decreasing somewhat in the summer and fall but the changes are not statistically significant. The timing and magnitude of the spring bloom is a function of numerous ecological and physical factors. An evaluation of the relationships between these factors suggests that the magnitude of the winter spring bloom is correlated with the temperature during the bloom period (Figure C-9). The warmer the winter temperature the more reduced the biomass of phytoplankton during the bloom period. This relationship was initially hypothesized to be associated with increased grazing pressure due to higher zooplankton abundance at higher temperatures (Keller et al. 2001). As data availability increased, however, the zooplankton vs. temperature relationship appeared less important. It was noted, however, that from 2000 to 2005 blooms of Phaeocystis pouchetii occurred during the winter spring period and may have interfered with the earlier relationship (Libby et al.
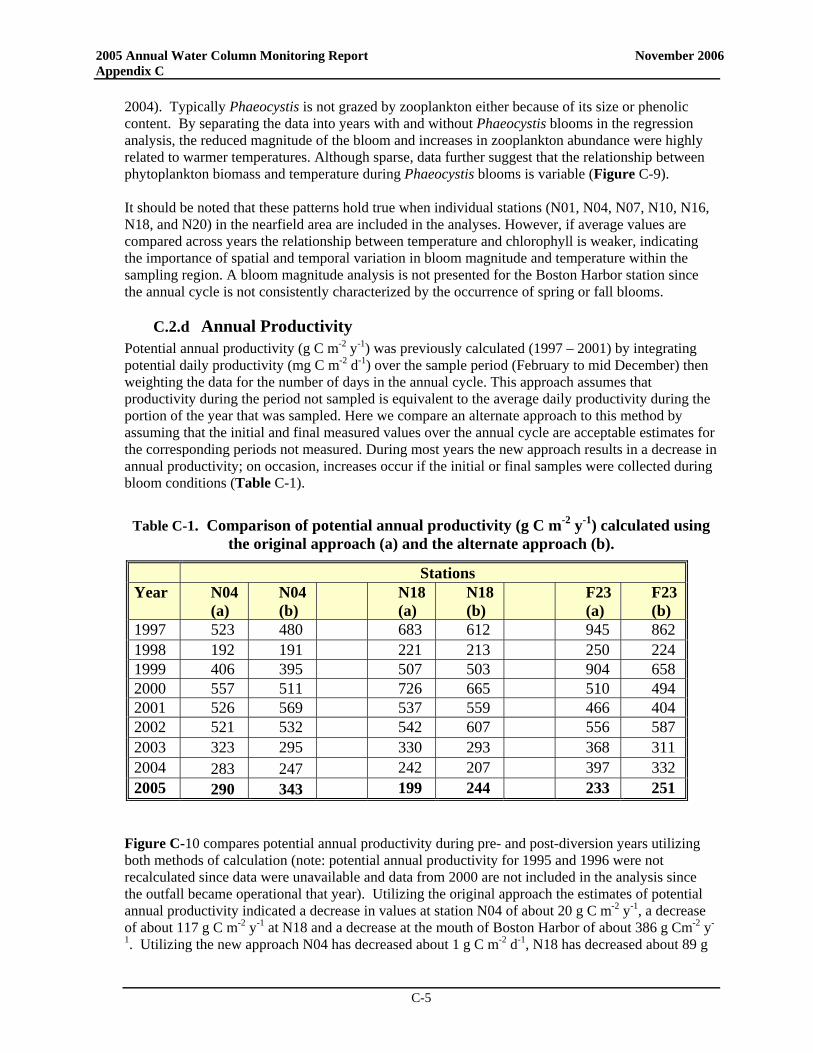
2005 Annual Water Column Monitoring Report November 2006 Appendix C
C-5
2004). Typically Phaeocystis is not grazed by zooplankton either because of its size or phenolic content. By separating the data into years with and without Phaeocystis blooms in the regression analysis, the reduced magnitude of the bloom and increases in zooplankton abundance were highly related to warmer temperatures. Although sparse, data further suggest that the relationship between phytoplankton biomass and temperature during Phaeocystis blooms is variable (Figure C-9). It should be noted that these patterns hold true when individual stations (N01, N04, N07, N10, N16, N18, and N20) in the nearfield area are included in the analyses. However, if average values are compared across years the relationship between temperature and chlorophyll is weaker, indicating the importance of spatial and temporal variation in bloom magnitude and temperature within the sampling region. A bloom magnitude analysis is not presented for the Boston Harbor station since the annual cycle is not consistently characterized by the occurrence of spring or fall blooms.
C.2.d Annual Productivity Potential annual productivity (g C m-2 y-1) was previously calculated (1997 – 2001) by integrating potential daily productivity (mg C m-2 d-1) over the sample period (February to mid December) then weighting the data for the number of days in the annual cycle. This approach assumes that productivity during the period not sampled is equivalent to the average daily productivity during the portion of the year that was sampled. Here we compare an alternate approach to this method by assuming that the initial and final measured values over the annual cycle are acceptable estimates for the corresponding periods not measured. During most years the new approach results in a decrease in annual productivity; on occasion, increases occur if the initial or final samples were collected during bloom conditions (Table C-1).
Table C-1. Comparison of potential annual productivity (g C m-2 y-1) calculated using the original approach (a) and the alternate approach (b).
Stations Year N04
(a) N04 (b)
N18 (a)
N18 (b)
F23 (a)
F23 (b)
1997 523 480 683 612 945 862 1998 192 191 221 213 250 224 1999 406 395 507 503 904 658 2000 557 511 726 665 510 494 2001 526 569 537 559 466 404 2002 521 532 542 607 556 587 2003 323 295 330 293 368 311 2004 283 247 242 207 397 332 2005 290 343 199 244 233 251
Figure C-10 compares potential annual productivity during pre- and post-diversion years utilizing both methods of calculation (note: potential annual productivity for 1995 and 1996 were not recalculated since data were unavailable and data from 2000 are not included in the analysis since the outfall became operational that year). Utilizing the original approach the estimates of potential annual productivity indicated a decrease in values at station N04 of about 20 g C m-2 y-1, a decrease of about 117 g C m-2 y-1 at N18 and a decrease at the mouth of Boston Harbor of about 386 g Cm-2 y-
1. Utilizing the new approach N04 has decreased about 1 g C m-2 d-1, N18 has decreased about 89 g
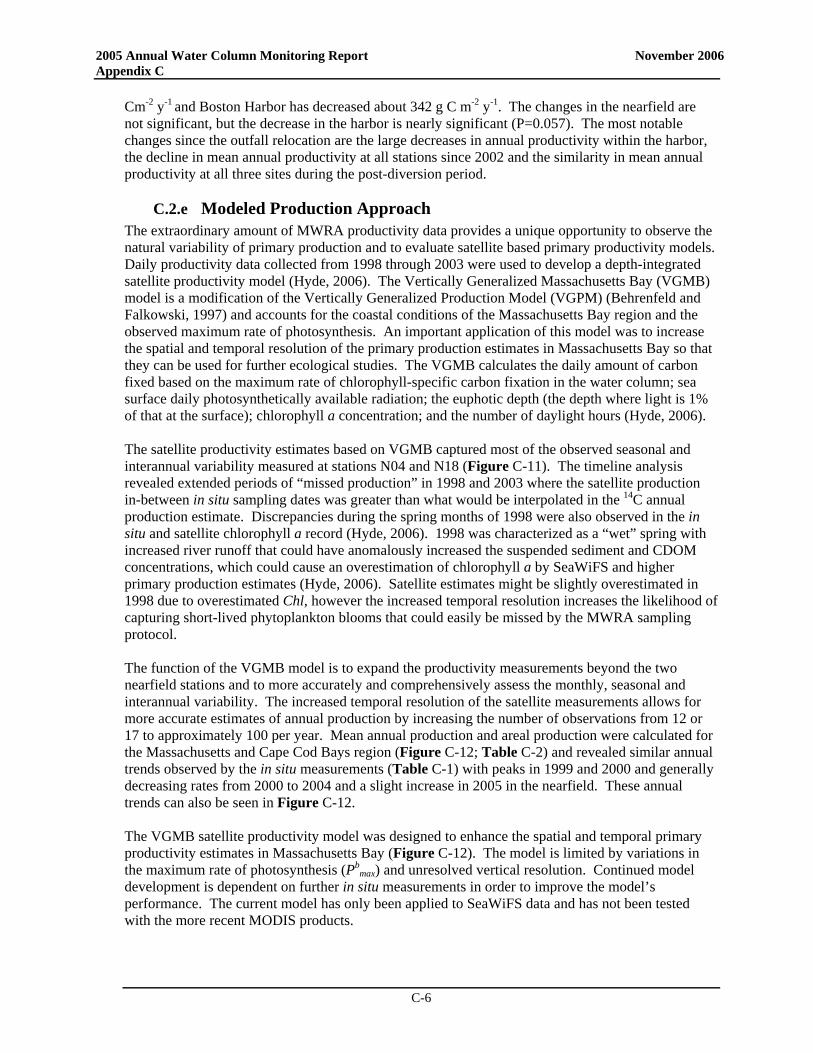
2005 Annual Water Column Monitoring Report November 2006 Appendix C
C-6
Cm-2 y-1 and Boston Harbor has decreased about 342 g C m-2 y-1. The changes in the nearfield are not significant, but the decrease in the harbor is nearly significant (P=0.057). The most notable changes since the outfall relocation are the large decreases in annual productivity within the harbor, the decline in mean annual productivity at all stations since 2002 and the similarity in mean annual productivity at all three sites during the post-diversion period.
C.2.e Modeled Production Approach The extraordinary amount of MWRA productivity data provides a unique opportunity to observe the natural variability of primary production and to evaluate satellite based primary productivity models. Daily productivity data collected from 1998 through 2003 were used to develop a depth-integrated satellite productivity model (Hyde, 2006). The Vertically Generalized Massachusetts Bay (VGMB) model is a modification of the Vertically Generalized Production Model (VGPM) (Behrenfeld and Falkowski, 1997) and accounts for the coastal conditions of the Massachusetts Bay region and the observed maximum rate of photosynthesis. An important application of this model was to increase the spatial and temporal resolution of the primary production estimates in Massachusetts Bay so that they can be used for further ecological studies. The VGMB calculates the daily amount of carbon fixed based on the maximum rate of chlorophyll-specific carbon fixation in the water column; sea surface daily photosynthetically available radiation; the euphotic depth (the depth where light is 1% of that at the surface); chlorophyll a concentration; and the number of daylight hours (Hyde, 2006). The satellite productivity estimates based on VGMB captured most of the observed seasonal and interannual variability measured at stations N04 and N18 (Figure C-11). The timeline analysis revealed extended periods of “missed production” in 1998 and 2003 where the satellite production in-between in situ sampling dates was greater than what would be interpolated in the 14C annual production estimate. Discrepancies during the spring months of 1998 were also observed in the in situ and satellite chlorophyll a record (Hyde, 2006). 1998 was characterized as a “wet” spring with increased river runoff that could have anomalously increased the suspended sediment and CDOM concentrations, which could cause an overestimation of chlorophyll a by SeaWiFS and higher primary production estimates (Hyde, 2006). Satellite estimates might be slightly overestimated in 1998 due to overestimated Chl, however the increased temporal resolution increases the likelihood of capturing short-lived phytoplankton blooms that could easily be missed by the MWRA sampling protocol.
The function of the VGMB model is to expand the productivity measurements beyond the two nearfield stations and to more accurately and comprehensively assess the monthly, seasonal and interannual variability. The increased temporal resolution of the satellite measurements allows for more accurate estimates of annual production by increasing the number of observations from 12 or 17 to approximately 100 per year. Mean annual production and areal production were calculated for the Massachusetts and Cape Cod Bays region (Figure C-12; Table C-2) and revealed similar annual trends observed by the in situ measurements (Table C-1) with peaks in 1999 and 2000 and generally decreasing rates from 2000 to 2004 and a slight increase in 2005 in the nearfield. These annual trends can also be seen in Figure C-12. The VGMB satellite productivity model was designed to enhance the spatial and temporal primary productivity estimates in Massachusetts Bay (Figure C-12). The model is limited by variations in the maximum rate of photosynthesis (Pb
max) and unresolved vertical resolution. Continued model development is dependent on further in situ measurements in order to improve the model’s performance. The current model has only been applied to SeaWiFS data and has not been tested with the more recent MODIS products.
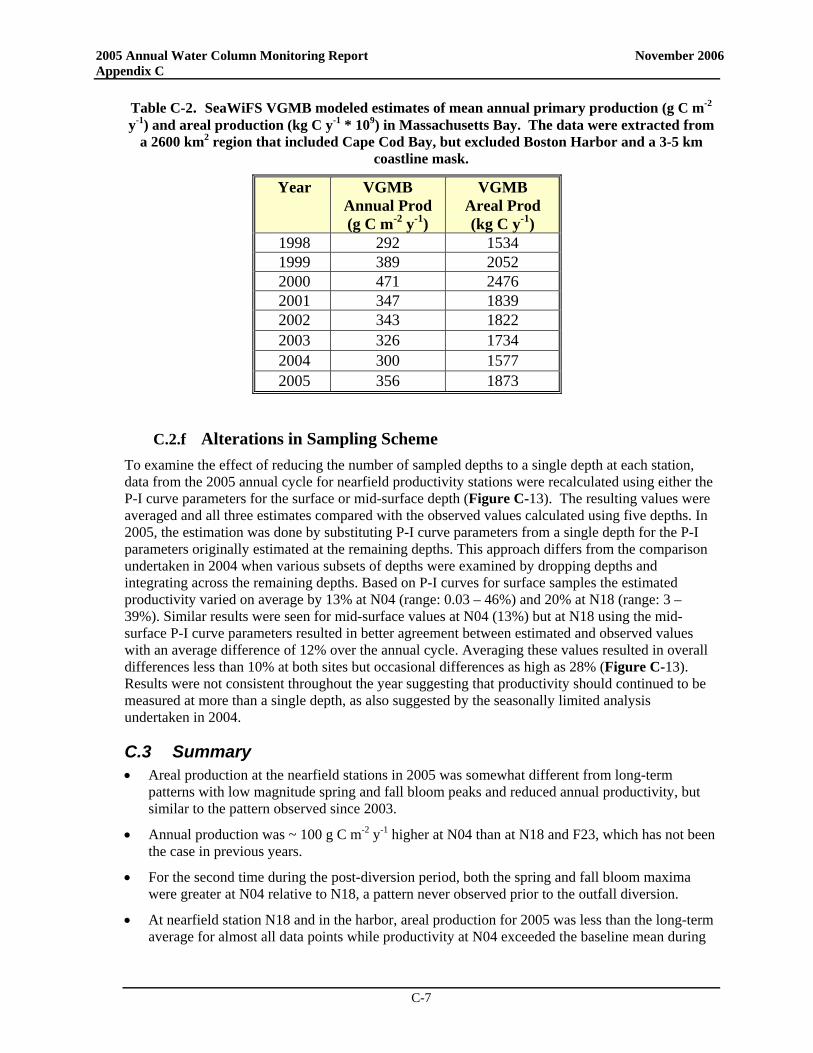
2005 Annual Water Column Monitoring Report November 2006 Appendix C
C-7
Table C-2. SeaWiFS VGMB modeled estimates of mean annual primary production (g C m-2 y-1) and areal production (kg C y-1 * 109) in Massachusetts Bay. The data were extracted from
a 2600 km2 region that included Cape Cod Bay, but excluded Boston Harbor and a 3-5 km coastline mask.
Year VGMB Annual Prod (g C m-2 y-1)
VGMB Areal Prod (kg C y-1)
1998 292 1534 1999 389 2052 2000 471 2476 2001 347 1839 2002 343 1822 2003 326 1734 2004 300 1577 2005 356 1873
C.2.f Alterations in Sampling Scheme To examine the effect of reducing the number of sampled depths to a single depth at each station, data from the 2005 annual cycle for nearfield productivity stations were recalculated using either the P-I curve parameters for the surface or mid-surface depth (Figure C-13). The resulting values were averaged and all three estimates compared with the observed values calculated using five depths. In 2005, the estimation was done by substituting P-I curve parameters from a single depth for the P-I parameters originally estimated at the remaining depths. This approach differs from the comparison undertaken in 2004 when various subsets of depths were examined by dropping depths and integrating across the remaining depths. Based on P-I curves for surface samples the estimated productivity varied on average by 13% at N04 (range: 0.03 – 46%) and 20% at N18 (range: 3 – 39%). Similar results were seen for mid-surface values at N04 (13%) but at N18 using the mid-surface P-I curve parameters resulted in better agreement between estimated and observed values with an average difference of 12% over the annual cycle. Averaging these values resulted in overall differences less than 10% at both sites but occasional differences as high as 28% (Figure C-13). Results were not consistent throughout the year suggesting that productivity should continued to be measured at more than a single depth, as also suggested by the seasonally limited analysis undertaken in 2004.
C.3 Summary • Areal production at the nearfield stations in 2005 was somewhat different from long-term
patterns with low magnitude spring and fall bloom peaks and reduced annual productivity, but similar to the pattern observed since 2003.
• Annual production was ~ 100 g C m-2 y-1 higher at N04 than at N18 and F23, which has not been the case in previous years.
• For the second time during the post-diversion period, both the spring and fall bloom maxima were greater at N04 relative to N18, a pattern never observed prior to the outfall diversion.
• At nearfield station N18 and in the harbor, areal production for 2005 was less than the long-term average for almost all data points while productivity at N04 exceeded the baseline mean during
2005 Annual Water Column Monitoring Report November 2006 Appendix C
C-8
both the summer and the fall, reaching near baseline maxima in May and June and exceeding the baseline maximum in September.
• At the Boston Harbor station, productivity in 2005 generally fell well below the baseline mean with no spring bloom but a distinct peak in late summer productivity.
• Productivity in the Harbor has decreased during the post-transfer period. There has been a statistically significant decrease in summer production and nearly significant decrease in annual production in the harbor.
• The apparent change in the seasonal productivity pattern first seen in 2001 was partially present in 2005 with the occurrence of a late summer bloom but the absence of a spring productivity peak. There has been a nearly significant increase in post-transfer spring production in the harbor compared to baseline.
• Using P-I curves from a single depth (surface or mid-surface) can produce results similar to those using all five depths. However estimates were inconsistent over the annual cycle and suggest that productivity should continue to be measured at multiple depths.
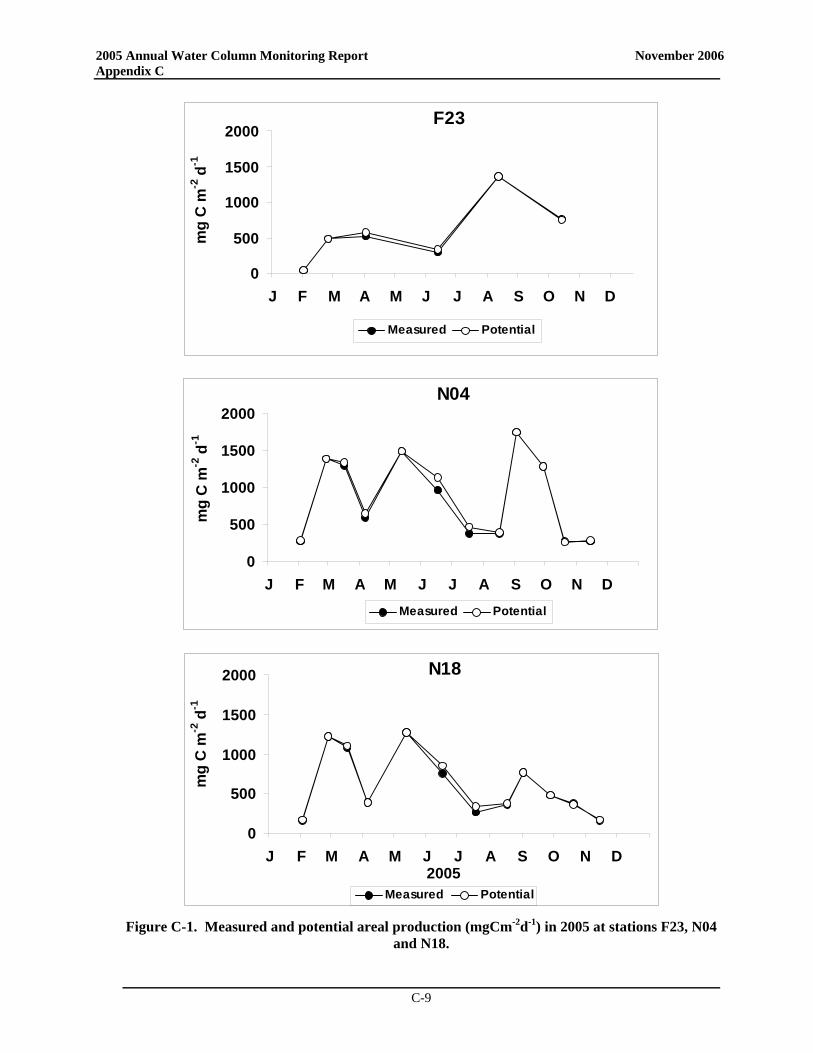
2005 Annual Water Column Monitoring Report November 2006 Appendix C
C-9
F23
0
500
1000
1500
2000
J F M A M J J A S O N D
mg
C m
-2 d
-1
Measured Potential
N04
0
500
1000
1500
2000
J F M A M J J A S O N D
mg
C m
-2 d
-1
Measured Potential
N18
0
500
1000
1500
2000
J F M A M J J A S O N D2005
mg
C m
-2 d
-1
Measured Potential
Figure C-1. Measured and potential areal production (mgCm-2d-1) in 2005 at stations F23, N04 and N18.
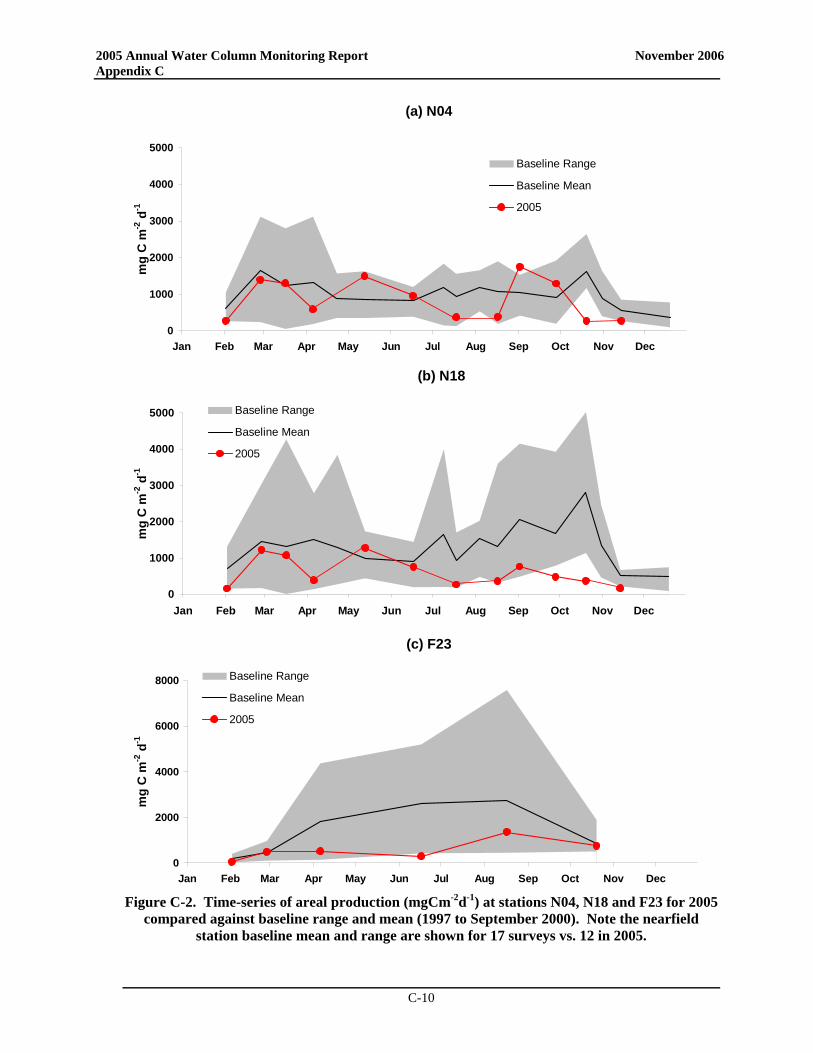
2005 Annual Water Column Monitoring Report November 2006 Appendix C
C-10
(a) N04
0
1000
2000
3000
4000
5000
Jan Feb Mar Apr May Jun Jul Aug Sep Oct Nov Dec
mg
C m
-2 d
-1
Baseline Range
Baseline Mean
2005
(b) N18
0
1000
2000
3000
4000
5000
Jan Feb Mar Apr May Jun Jul Aug Sep Oct Nov Dec
mg
C m
-2 d
-1
Baseline Range
Baseline Mean
2005
(c) F23
0
2000
4000
6000
8000
Jan Feb Mar Apr May Jun Jul Aug Sep Oct Nov Dec
mg
C m
-2 d
-1
Baseline Range
Baseline Mean
2005
Figure C-2. Time-series of areal production (mgCm-2d-1) at stations N04, N18 and F23 for 2005
compared against baseline range and mean (1997 to September 2000). Note the nearfield station baseline mean and range are shown for 17 surveys vs. 12 in 2005.
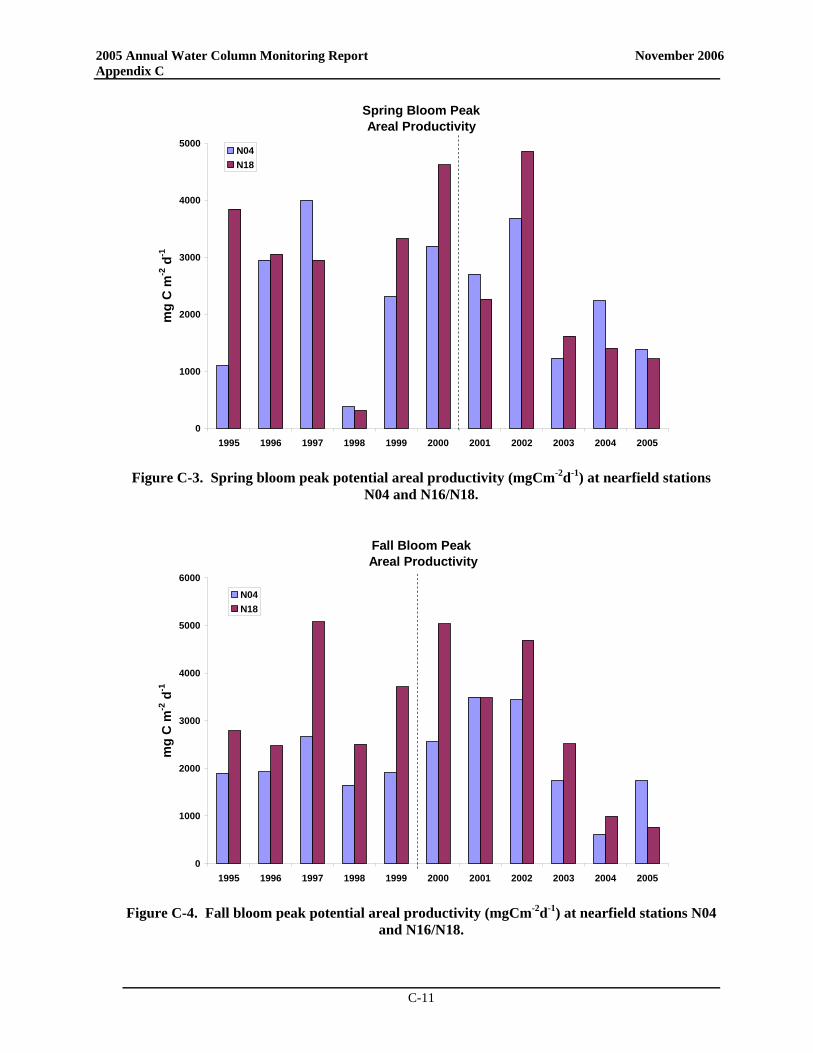
2005 Annual Water Column Monitoring Report November 2006 Appendix C
C-11
Spring Bloom PeakAreal Productivity
0
1000
2000
3000
4000
5000
1995 1996 1997 1998 1999 2000 2001 2002 2003 2004 2005
mg
C m
-2 d
-1N04N18
Figure C-3. Spring bloom peak potential areal productivity (mgCm-2d-1) at nearfield stations
N04 and N16/N18.
Fall Bloom Peak
Areal Productivity
0
1000
2000
3000
4000
5000
6000
1995 1996 1997 1998 1999 2000 2001 2002 2003 2004 2005
mg
C m
-2 d
-1
N04N18
Figure C-4. Fall bloom peak potential areal productivity (mgCm-2d-1) at nearfield stations N04
and N16/N18.
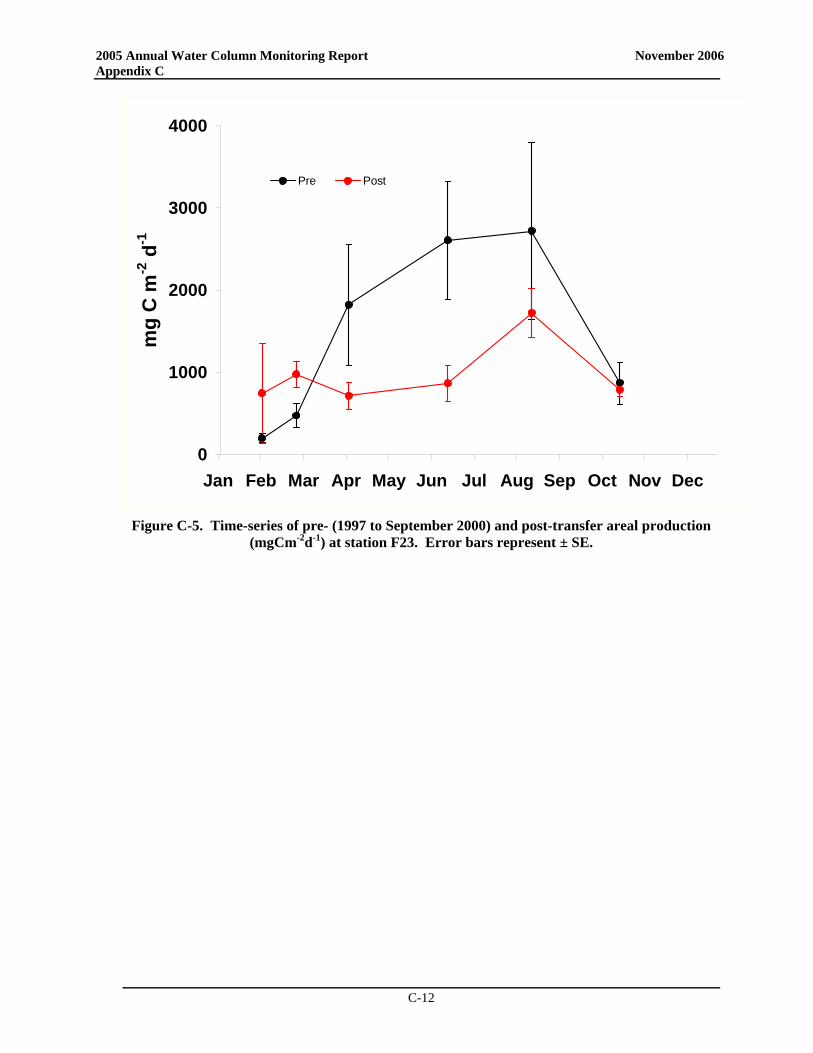
2005 Annual Water Column Monitoring Report November 2006 Appendix C
C-12
0
1000
2000
3000
4000
Jan Feb Mar Apr May Jun Jul Aug Sep Oct Nov Dec
mg
C m
-2 d
-1
Pre Post
Figure C-5. Time-series of pre- (1997 to September 2000) and post-transfer areal production
(mgCm-2d-1) at station F23. Error bars represent ± SE.
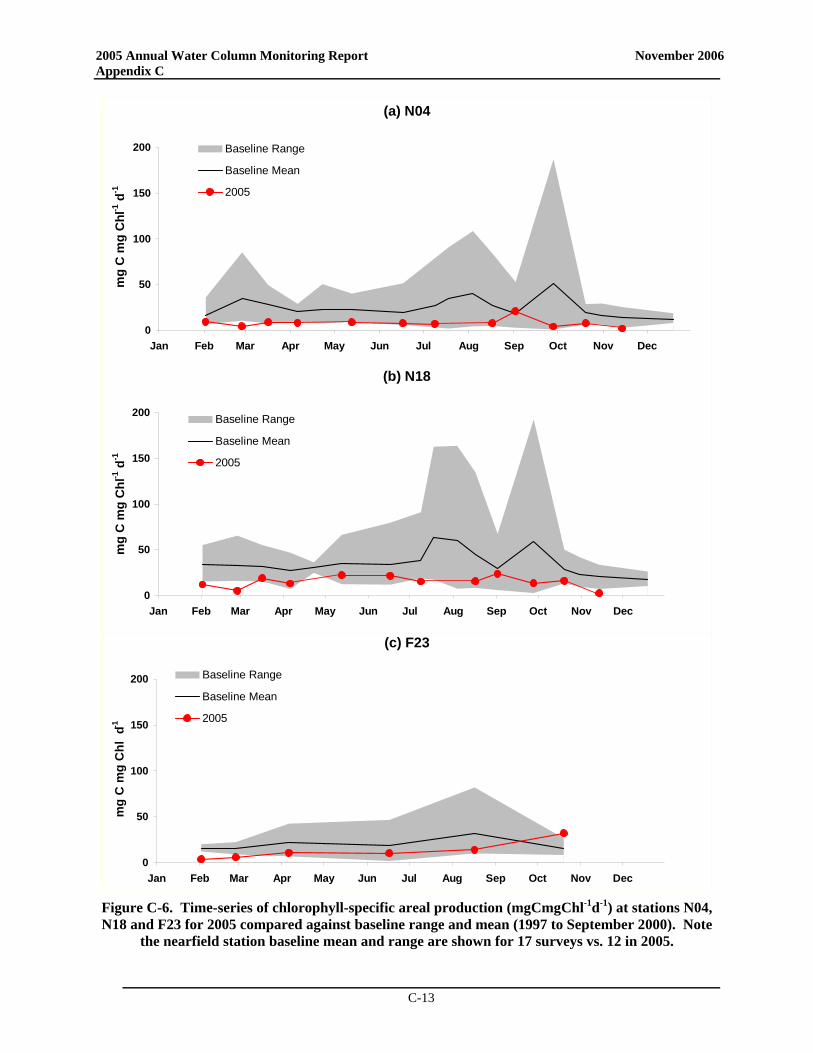
2005 Annual Water Column Monitoring Report November 2006 Appendix C
C-13
(a) N04
0
50
100
150
200
Jan Feb Mar Apr May Jun Jul Aug Sep Oct Nov Dec
mg
C m
g C
hl-1
d-1
Baseline Range
Baseline Mean
2005
(b) N18
0
50
100
150
200
Jan Feb Mar Apr May Jun Jul Aug Sep Oct Nov Dec
mg
C m
g C
hl-1
d-1
Baseline Range
Baseline Mean
2005
(c) F23
0
50
100
150
200
Jan Feb Mar Apr May Jun Jul Aug Sep Oct Nov Dec
mg
C m
g C
hl d
-1
Baseline Range
Baseline Mean
2005
Figure C-6. Time-series of chlorophyll-specific areal production (mgCmgChl-1d-1) at stations N04, N18 and F23 for 2005 compared against baseline range and mean (1997 to September 2000). Note
the nearfield station baseline mean and range are shown for 17 surveys vs. 12 in 2005.

2005 Annual Water Column Monitoring Report November 2006 Appendix C
C-14
(a) N04
0
25
50
75
Jan Feb Mar Apr May Jun Jul Aug Sep Oct Nov Dec
mg
C m
g C
hl-1
d-1
Baseline Range
Baseline Mean
2005
(b) N18
0
25
50
75
Jan Feb Mar Apr May Jun Jul Aug Sep Oct Nov Dec
mg
C m
g C
hl-1
d-1
Base 1998-2000
Baseline Mean
2005
Figure C-7. Time-series of chlorophyll-specific areal production (mgCmgChl-1d-1) at stations (a)
N04 and (b) N18 in 2005 compared against baseline range and mean using 1998-2000 data (no 1997). Note the nearfield station baseline mean and range are shown for 17 surveys vs. 12 in 2005.
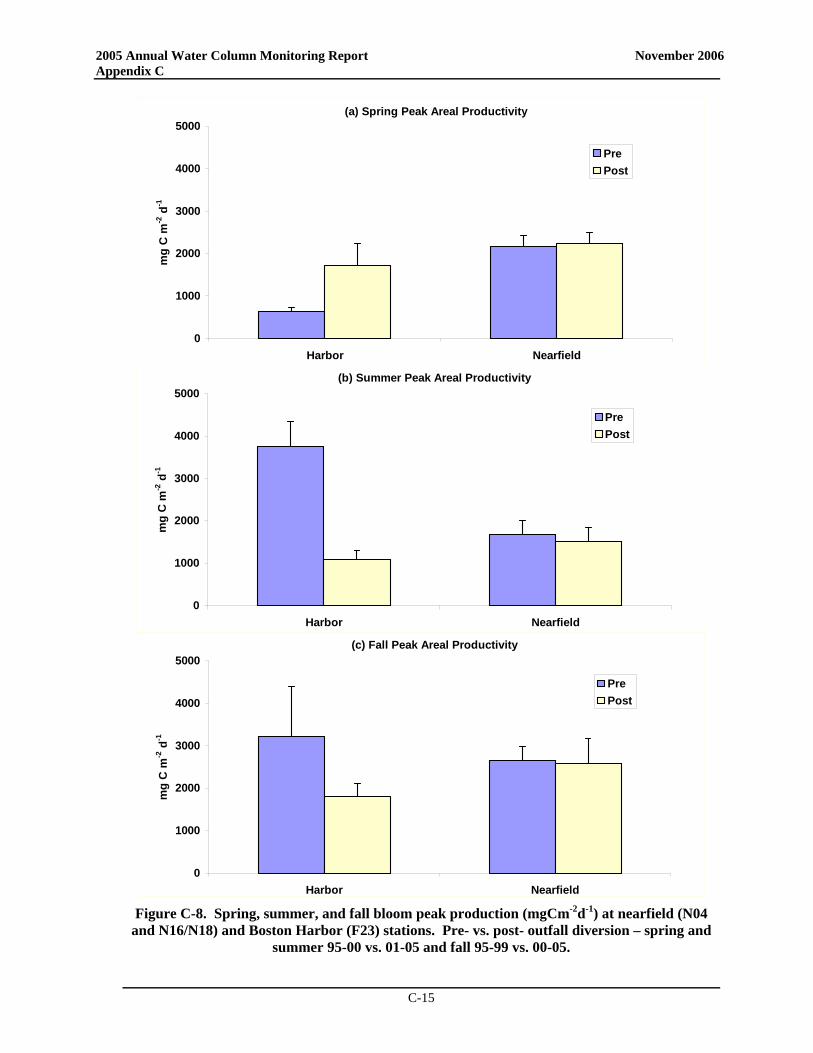
2005 Annual Water Column Monitoring Report November 2006 Appendix C
C-15
(a) Spring Peak Areal Productivity
0
1000
2000
3000
4000
5000
Harbor Nearfield
mg
C m
-2 d
-1PrePost
(b) Summer Peak Areal Productivity
0
1000
2000
3000
4000
5000
Harbor Nearfield
mg
C m
-2 d
-1
PrePost
(c) Fall Peak Areal Productivity
0
1000
2000
3000
4000
5000
Harbor Nearfield
mg
C m
-2 d
-1
PrePost
Figure C-8. Spring, summer, and fall bloom peak production (mgCm-2d-1) at nearfield (N04
and N16/N18) and Boston Harbor (F23) stations. Pre- vs. post- outfall diversion – spring and summer 95-00 vs. 01-05 and fall 95-99 vs. 00-05.
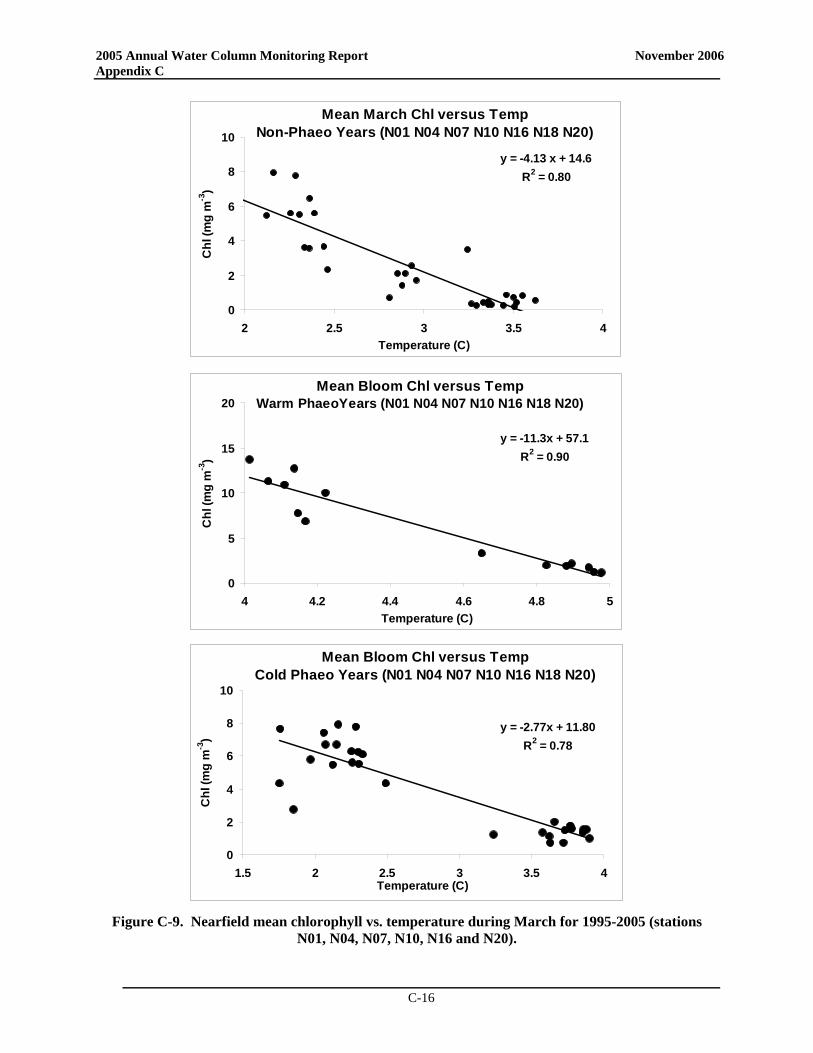
2005 Annual Water Column Monitoring Report November 2006 Appendix C
C-16
Mean March Chl versus TempNon-Phaeo Years (N01 N04 N07 N10 N16 N18 N20)
y = -4.13 x + 14.6R2 = 0.80
0
2
4
6
8
10
2 2.5 3 3.5 4Temperature (C)
Chl
(mg
m-3
)
Mean Bloom Chl versus Temp Warm PhaeoYears (N01 N04 N07 N10 N16 N18 N20)
y = -11.3x + 57.1R2 = 0.90
0
5
10
15
20
4 4.2 4.4 4.6 4.8 5Temperature (C)
Chl
(mg
m-3
)
Mean Bloom Chl versus TempCold Phaeo Years (N01 N04 N07 N10 N16 N18 N20)
y = -2.77x + 11.80R2 = 0.78
0
2
4
6
8
10
1.5 2 2.5 3 3.5 4Temperature (C)
Chl
(mg
m-3
)
Figure C-9. Nearfield mean chlorophyll vs. temperature during March for 1995-2005 (stations
N01, N04, N07, N10, N16 and N20).
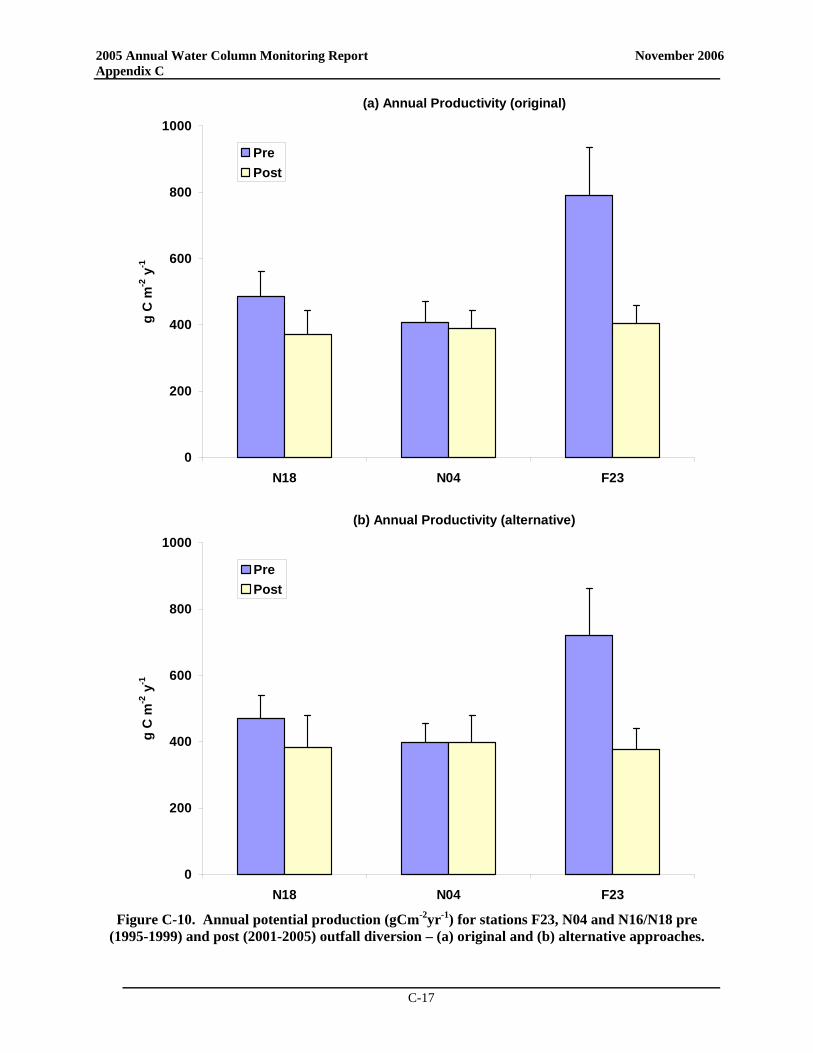
2005 Annual Water Column Monitoring Report November 2006 Appendix C
C-17
(a) Annual Productivity (original)
0
200
400
600
800
1000
N18 N04 F23
g C
m-2
y-1
PrePost
(b) Annual Productivity (alternative)
0
200
400
600
800
1000
N18 N04 F23
g C
m-2
y-1
PrePost
Figure C-10. Annual potential production (gCm-2yr-1) for stations F23, N04 and N16/N18 pre
(1995-1999) and post (2001-2005) outfall diversion – (a) original and (b) alternative approaches.
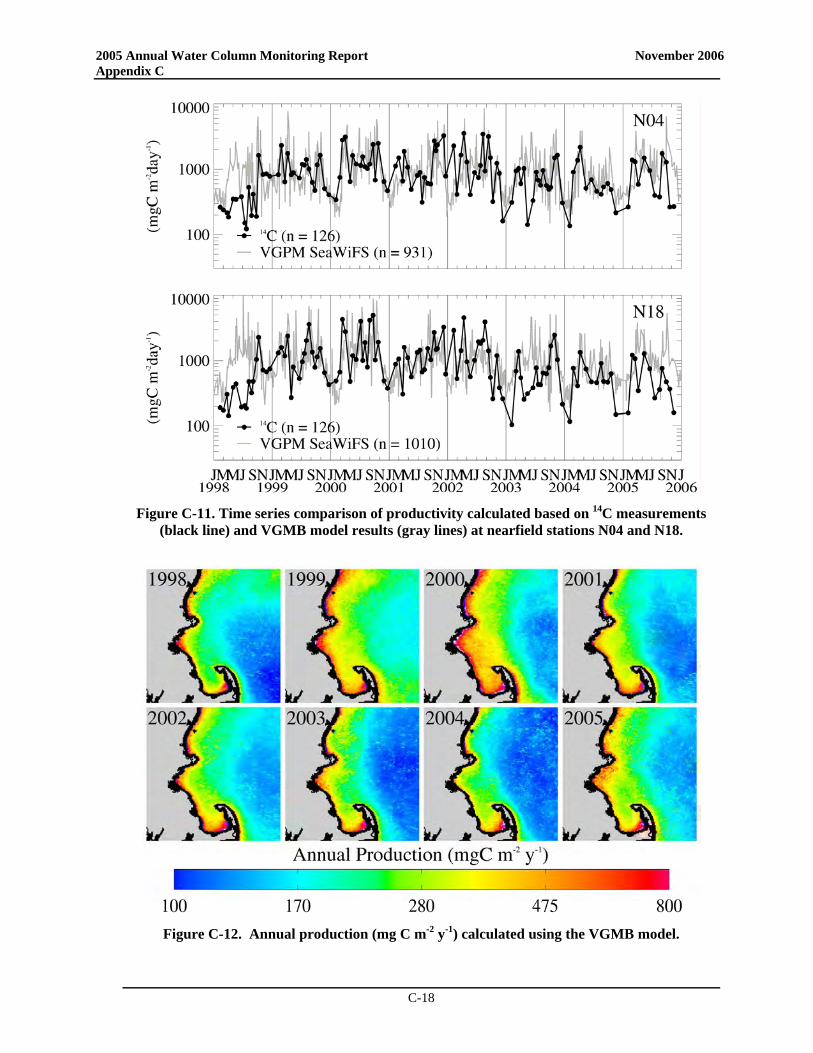
2005 Annual Water Column Monitoring Report November 2006 Appendix C
C-18
Figure C-11. Time series comparison of productivity calculated based on 14C measurements
(black line) and VGMB model results (gray lines) at nearfield stations N04 and N18.
Figure C-12. Annual production (mg C m-2 y-1) calculated using the VGMB model.
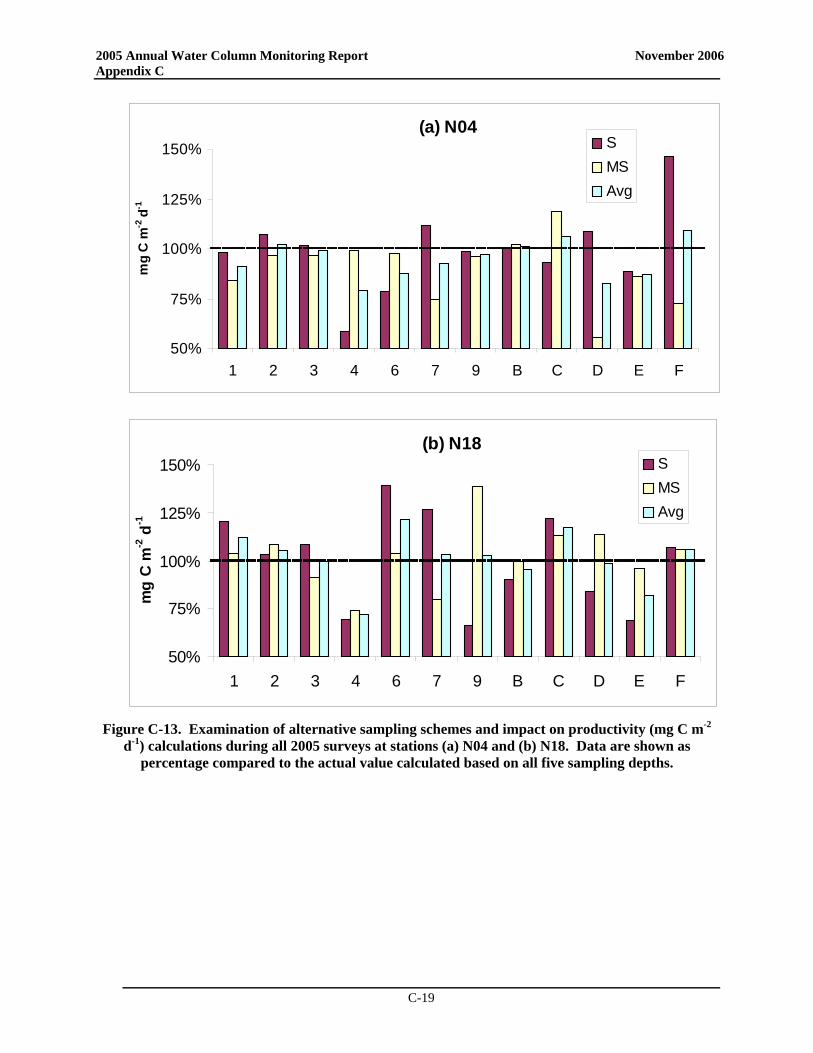
2005 Annual Water Column Monitoring Report November 2006 Appendix C
C-19
(a) N04
50%
75%
100%
125%
150%
1 2 3 4 6 7 9 B C D E F
mg
C m
-2 d
-1SMSAvg
(b) N18
50%
75%
100%
125%
150%
1 2 3 4 6 7 9 B C D E F
mg
C m
-2 d
-1
SMSAvg
Figure C-13. Examination of alternative sampling schemes and impact on productivity (mg C m-2
d-1) calculations during all 2005 surveys at stations (a) N04 and (b) N18. Data are shown as percentage compared to the actual value calculated based on all five sampling depths.

APPENDIX D
2005 Annual Water Column Monitoring Report November 2006 Appendix D
D-1
D. PLANKTON In this section a summary of 2005 plankton trends is presented, based on information contained in the first 2005 semiannual report for February-June, 2005 (Libby et al. 2005a) and subsequent data reports for July-November 2005. In 2005, most trends in phytoplankton and zooplankton abundance, species composition and bloom cycles were generally consistent with those observed in previous years, although timing and magnitude of events were sometimes different. In addition to comparing 2005 to previous years, this appendix is structured in such a manner as to address the monitoring questions developed in the 1991 Monitoring Plan. Each section addresses issues in both the nearfield and farfield.
D.1 Summary of 2005 Results Whole-water phytoplankton assemblages were dominated throughout most of the year by unidentified microflagellates, cryptomonads and several species of centric diatoms except during the April Phaeocystis pouchetii bloom (Figures D-1 to D-3). Assemblages during different periods were seasonally typical in terms of taxonomic composition. Diatom blooms included nearfield blooms in late February of Thalassiosira nordenskioldii and another unidentified species of Thalassiosira, a mid-May and June bloom of Chaetoceros debilis, and a late September bloom of Dactyliosolen fragilissimus (Figure D-1). In Boston Harbor and Coastal locations, the seasonal cycle was dominated by a mid-August bloom of D. fragilissimus (Figure D-2). Elements of all of the aforementioned blooms were observed in Boundary and Cape Cod Bay locations (Figure D-3). The major bloom of harmful or nuisance phytoplankton species in Massachusetts and Cape Cod Bays during 2005, other than the spring bloom of Phaeocystis, was the major red tide event of Alexandrium fundyense, which will be discussed in detail below. This was the largest red tide in New England since 1972. The diatoms Pseudo-nitzschia pungens and members of the P. delicatissima complex were recorded throughout the year at many locations, but they were present in low abundance. Nuisance algae caution thresholds that were exceeded during 2005 were for summer Phaeocystis abundance and Alexandrium abundance during the May/June bloom event (more information on the exceedances available at http://www.mwra.state.ma.us/harbor/html/exceed.htm). As has been typically observed, total zooplankton abundance generally increased from February through August/September, and thereafter declined through November (Figure D-4). Zooplankton assemblages were comprised of taxa recorded for the same time of year in previous years. Dominant taxa throughout the year included copepod nauplii, adults and copepodites of Oithona similis, other copepods, and sporadic pulses of various meroplankters such as bivalve veligers and barnacle nauplii (Figures D-4 to D-6). Unlike previous years, ctenophores do not appear to have been numerous during the survey periods in 2005.
D.2 Interannual Comparisons
D.2.a Phytoplankton Community Composition Phytoplankton communities are mixtures of many species, with the abundance and composition of the community changing due to each species’ responses to changing environmental influences on the habitat (e.g. annual changes in irradiance, temperature, nutrient, grazer abundance). A “normal” seasonal succession in Massachusetts and Cape Cod Bay has been observed in the 1992-2000 baseline monitoring data, and in the post-baseline years since 2001. In whole-water phytoplankton samples, microflagellates and cryptomonads are usual numerical-dominants throughout the year, and their abundance generally tracks water temperature, being most abundant in summer and least
2005 Annual Water Column Monitoring Report November 2006 Appendix D
D-2
abundant in winter. In addition to microflagellates, the following taxa are also dominant in Massachusetts and Cape Cod Bays during the periods identified below:
Winter (primarily February) and Spring (March, April, May) – diatoms are usually abundant, including species of the genera Chaetoceros and Thalassiosira, with spring blooms of Phaeocystis pouchetii (mainly in April);
Summer (June, July, August) – microflagellates are at peak abundance, with cryptomonads and the diatoms Skeletonema costatum, Leptocylindrus danicus, Guinardia delicatula, and various species of Chaetoceros;
Fall (September through December) – diatoms are usually abundant, including Asterionellopsis glacialis, Guinardia delicatula, Skeletonema costatum, Dactyliosolen fragilissimus, Leptocylindrus minimus, L. danicus, as well as cryptomonads, and assorted gymnodinoid dinoflagellates.
Superimposed over the background dominance of microflagellates and common diatoms, in some years, there are major blooms of a single species such as Asterionellopsis glacialis in fall of 1993 or Phaeocystis pouchetii in spring of 1992, 1994, 1997, and every year since 2000. The interannual variability associated with both magnitude and occurrence of various blooms as represented by total phytoplankton abundance is shown in Figure D-7. Although such blooms may be intermittent, they tend to occur regionally and are usually observed throughout Massachusetts and Cape Cod Bay and beyond. Why such species bloom in some years but not others remains unclear. In 2005, total nearfield phytoplankton abundance was generally within the baseline range and close to the baseline mean, with the exception of the relatively low summer and October abundances (Figure D-8).
D.2.b Interannual Phytoplankton Comparisons Phytoplankton assemblages in 2005 were generally similar to those found during other monitoring years. Total phytoplankton abundances were similar to, or lower than most previous years (generally <2x10⁶ cells/l; Figure D-7). Survey means for various species groups were generally within the baseline range and often close to the baseline mean such as seen for total phytoplankton and microflagellates (Figure D-8). Total nearfield diatom abundances tended to be near the baseline mean for the first half of 2005 and near the minima of the baseline range for the second half (Figure D-9a). Total nearfield dinoflagellate abundance was quite variable, but generally remained above the baseline mean during the first half of the year, often close to the baseline maxima, and close to the baseline minima from July to November (Figure D-9b). Interannual comparisons of nearfield phytoplankton abundances for baseline and post-transfer survey means indicate that there has been little change in the general seasonal trends, overall magnitude of abundances, or interannual variability in abundances. A couple of clear differences are apparent in Figures D-10 to D-12. Total phytoplankton abundance has seen an increase in the winter/spring bloom period and a decrease in the fall during the post-transfer years (Figure D-10). The increase in the winter/spring is most striking in March and April and results from the consistent occurrence of Phaeocystis blooms during these months since 2000. The decrease in the fall is likely due to the lack of any major fall blooms since 1997. Total diatom abundances have been relatively low during the post-transfer period especially during the October survey. The October peak in both total and total diatoms in Figure D-10 is primarily due to large diatom blooms in 1993 and 1997. There is some indication that elevated phytoplankton abundances are observed later in the fall (November) during the post-transfer period (Figure D-10). Microflagellates show less of a change in trends and magnitude, but again there are slightly higher abundances in the winter/spring and in November in
2005 Annual Water Column Monitoring Report November 2006 Appendix D
D-3
comparison to the baseline means (Figure D-11a). As observed in 2005, dinoflagellates during the post-transfer period have been close to the baseline mean during the first half of the year, but much lower than the baseline mean from July to November (Figure D-11b). The variability of the survey means is much lower during the post-transfer period for the second half of the year. It is unclear what this might mean, but suggests that the low values that are currently being observed in late summer and fall are within the range of values measured during the baseline. The main stories in 2005 phytoplankton annual cycle relative to previous years were the relatively minor Phaeocystis bloom (compared to the previous year) and the Alexandrium red tide which was the largest of the last third century. This section examines the 2005 Phaeocystis bloom in context with baseline and other post-transfer years and presents a preliminary evaluation of the unprecedented 2005 red tide bloom of Alexandrium. The bloom will be characterized and examined in more detail in a forthcoming interpretive report focused on the red tide event.
D.2.b.1 Phaeocystis Blooms Although there have not been major changes noted in the taxonomic composition of the phytoplankton community over the last 14 years, there have been several variations in the timing and magnitude of various events in the seasonal succession. The most pronounced variations have been associated with the spring blooms of Phaeocystis pouchetii (Figure D-12). After recording spring Phaeocystis blooms in 1992, 1994 (farfield), and 1997, there have been blooms during consecutive years from 2000 to 2005. Thus, the pattern has changed from spring Phaeocystis blooms occurring at ~3-year intervals to blooms occurring annually. Although it is clear that the periodicity of spring Phaeocystis blooms has changed, the reason(s) for this change remain elusive. Similarly, it is not clear why, unlike previous blooms which occurred primarily in late March and April, the blooms since 2002 began earlier, and lasted until early May, thereby causing exceedances of the “summer” Phaeocystis threshold by the presence of low abundances of this alga in May.
The 2005 Phaeocystis bloom was first recorded in late February in whole water phytoplankton samples from 11 of 15 stations throughout the study area except in Boston Harbor (< 5% of cells counted; see “other” in Figures D-1 to D-3). Phaeocystis abundance was at levels of ≤0.3 x 10⁶ cells L-1. In March, nearfield abundance of Phaeocystis increased to 0.25-0.5 x 10⁶ cells L-1 (28-44% of cells counted). By April, Phaeocystis was observed at all stations in the survey area at abundance levels from as low as 300 cells L-1 up to 4 x 10⁶ cells L-1 (<5% - 80% of cells counted). The bloom had ended by May, but a single sample collected from station N18 (mid-depth) during the June survey contained Phaeocystis (~10,000 cells/L). The cells in this sample appeared to be degraded and likely the remnants of the April or an offshore bloom. Regardless, their presence resulted in an exceedance of the summer Phaeocystis threshold of 357 cells/L. This exceedance should be considered a technical/statistical phenomenon and not an ecologically significant one. In April 2005, maximum Phaeocystis abundance was 4 x 10⁶ cells L-1 with all but 5 samples < 1.0 x 10⁶ cells L-1. These levels were much lower than those of the previous year of >10 x 106 cells L-1 at most stations in Massachusetts Bay, with a 2004 maximum of 15.5 x 10⁶ cells L-1. The 2005 Phaeocystis bloom was more typical of previous blooms during 2001, 2002 and 2003 (maxima of 3.1, 1.6, and 10.2 x 10⁶ cells L-1, respectively). In fact, the only previous bloom of this species that even approached the height of the 2004 bloom was during the previous maximum level for the program observed during the 2000 bloom (12.3 x 10⁶ cells L-1). As observed during the previous blooms, the 2005 bloom was a regional event with elevated abundances measured throughout the bays.
2005 Annual Water Column Monitoring Report November 2006 Appendix D
D-4
It has been noted that Phaeocystis blooms are a regular component of the spring phytoplankton assemblage in north temperate coastal seas (Schoemann et al. 2005), including the Gulf of Maine (Bigelow 1926). Direct as well as anecdotal evidence indicates that the blooms observed in Massachusetts Bay are regional in nature and have been coincident with the presence of Phaeocystis in waters from Buzzards Bay to the western Gulf of Maine. There is no obvious spatial association with the MWRA’s outfall—Phaeocystis has consistently been as or more abundant far to the north and south of the outfall. Why Phaeocystis occurs in relatively high abundances in some years and not in others is not well understood and continues to be the focus of researchers. Algal growth and abundance are influenced by many environmental factors including the availability of light, nutrients, water temperature, water movement, competition from other algal species for nutrients and light, and by grazing. A detailed evaluation of Phaeocystis blooms in Massachusetts Bay is presented in the 2005 Nutrient Issues Review (Libby et al. 2006b).
D.2.b.2 The 2005 Alexandrium bloom In May and June of 2005, there was a red tide of toxic dinoflagellates of the genus Alexandrium, producing the largest red tide in New England since 1972. The bloom extended from Maine to south of Martha’s Vineyard, and prompted shellfish closures throughout the region. Typical concentrations of Alexandrium spp. in most years are < 100 cells L-1, but in 2005, many samples had counts of > 1,000 cells L-1, with some maxima in Cape Cod Bay of > 40,000 cells L-1 (Anderson et al. 2005a). Most levels in the nearfield in 2005 were orders-of-magnitude higher than in previous years (Figure D-13). Within the last year, a consensus has emerged among researchers investigating red tides in the Gulf of Maine region during the ECOHAB program, that there are two species of PSP-producing dinoflagellates of the genus Alexandrium in the Gulf of Maine, A. tamarense and A. fundyense. These are now considered to be varieties of the same species, since neither antibody nor oligonucleotide probes can distinguish between them (Anderson et al. 1994; Scholin et al. 1995). There is an additional Alexandrium species in the Gulf of Maine, A. ostenfeldii, which does not produce PSP toxins, and has larger cells than A. fundyense. Thus, for Alexandrium cells recorded for screened samples during the main red tide bloom in June of 2005 (Survey WF057), the preferred designation of A. fundyense was used for cells that would have previously been called Alexandrium tamarense during the MWRA monitoring program. Cells of A. ostenfeldii, though rare, were distinguishable by their larger size (>60 µm) than cells of A. fundyense (diameter approximately 40-50 µm). During WN056 in May, cells designated as Alexandrium spp. comprised 10-61% of dinoflagellate cells recorded for nearfield screened-water samples. In June (WF057), A. fundyense comprised 16-54% of cells recorded for nearfield screened-water samples. During the MWRA sampling in May (WN056), Alexandrium spp. were present in 20-µm screened-water samples at concentrations of 2,059-3,078 cells L-1 in both surface nearfield samples, but only at levels of 51-156 cells L-1 in both chlorophyll maximum samples. Alexandrium fundyense in June (WF057) were present in nearfield screened-water samples at levels of 2,060-5,162 cells L-1 at the three surface samples, and at levels of 376-1,758 cells L-1 in the three samples from chlorophyll maximum depths. Thus, red tide cells were more abundant in the nearfield screened-water samples at the surface than at depth. This was not as clearly the case at several farfield locations. Abundances of A. fundyense in 10 of 12 screened-water samples where this species was recorded were 49-2,050 cells L-1 at the surface, and 97-1,512 cells L-1 in 7 of 12 chlorophyll maximum depth screened-water samples where this species was recorded.
2005 Annual Water Column Monitoring Report November 2006 Appendix D
D-5
The ranges of tens to hundreds to low thousands of Alexandrium cells L-1 recorded for screened-water samples agrees with a similar range of hundreds to low thousands of cells L-1 recorded for whole-water samples where red tide cells were recorded. During WN056, Alexandrium spp. cells were present in both nearfield whole-water surface samples at levels of 4,800-6,300 cells L-1, and in both chlorophyll maximum depth samples at levels of 600-800 cells L-1. During WF057, Alexandrium fundyense cells were recorded at levels of 500-4,600 cells L-1 in the 2 nearfield and 4 farfield surface samples where this species was recorded, and at levels of 1,000-2,000 cells L-1 in the two nearfield and five farfield chlorophyll maximum depth samples where this species was recorded. Alexandrium spp. cells were recorded at levels of 400-1,100 cells L-1 in the three surface and one chlorophyll maximum depth samples where this taxon was recorded. Both screened-water and whole-water samples were analyzed by the same analyst (David Borkman). Records for screened-water samples were in the range of tens to thousands of cells L-1, whereas those for whole-water samples were only in the range of hundreds to thousands of cells L-1. This confirms that, as expected, screened-water samples are better than whole-water samples for quantifying extremely low levels of red tide cells, such as those typically seen in all previous years of MWRA monitoring. A few A. fundyense cells were recorded for samples from August through November, but usually at levels of <10, and never at levels > 25 cells L-1. The extraordinary 2005 Alexandrium fundyense bloom was due to an unusual and unprecedented confluence of factors (Anderson et al. 2005a). Heavy rainfall and snowmelt increased runoff of freshwater into the Gulf of Maine in early spring. This runoff enriched the water with nutrients, stratified the nearshore water column, and in combination with several storms with winds from the northeast, set up downwelling conditions that transported red tide cells that were recently hatched from cysts off the coast of central Maine to the southwest into Massachusetts and Cape Cod Bays, and as far south as Nantucket and Martha’s Vineyard and beyond. It is not yet known whether this bloom deposited cysts in sediments of waters of southern New England, which could initiate future blooms in southern New England without transport of cells from the north. The 2005 red tide event will be the focus of an upcoming interpretive report.
D.2.b.3 Ceratium Abundance and Seasonal Pattern In 2005, although the abundance of other dinoflagellates was quite high, the nearfield abundance of Ceratium was lower than the baseline mean and often below the baseline minimum (Figure D-14). Similarly low Ceratium spp. abundances were observed in 2002, 2003 and 2004. Previous annual reports have suggested that the reduced Ceratium abundance might be due to a delay in the onset of spring stratification (Libby et al. 2003, 2006a). The hypothesis was being that the establishment of a density gradient in the spring may favor Ceratium in competition with faster-growing diatom species. The speculated mechanism was that the vertical migratory capabilities of Ceratium might allow them to exploit solar radiation above, and nutrients below a pycnocline, when other competing phytoplankters could not. The storms in May/June 2005 were a factor in bringing the toxic dinoflagellate Alexandrium into the bays, but associated mixing and disruption in the development of seasonal stratification may have been a factor in the low Ceratium abundance in 2005. In light of these storms, the Ceratium-stratification hypothesis was once again revisited. Ceratium are a common component of the spring, summer and autumn phytoplankton in Massachusetts and Cape Cod Bays. Based on baseline observations, during March through October Ceratium spp. (mainly C. longipes, C. tripos and C. fusus) typically comprised >60% (numerically) of the 20-µm screened dinoflagellates, with an August peak of ~85% observed in the nearfield area. Mean nearfield Ceratium abundance levels typically ranged from 100-500 per liter during February-March, rising to an annual peak of 1,000-2,000 per liter during June-October, with levels then declining to 500 per liter in November and December. However, during the last four post-transfer
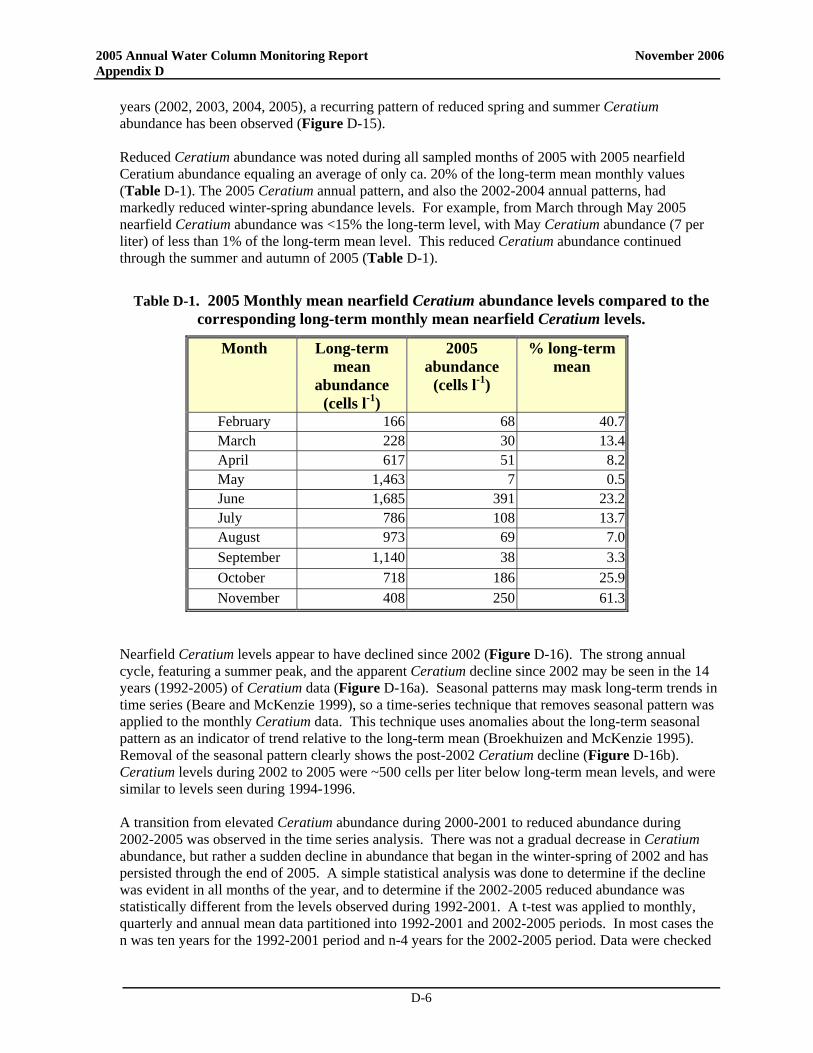
2005 Annual Water Column Monitoring Report November 2006 Appendix D
D-6
years (2002, 2003, 2004, 2005), a recurring pattern of reduced spring and summer Ceratium abundance has been observed (Figure D-15). Reduced Ceratium abundance was noted during all sampled months of 2005 with 2005 nearfield Ceratium abundance equaling an average of only ca. 20% of the long-term mean monthly values (Table D-1). The 2005 Ceratium annual pattern, and also the 2002-2004 annual patterns, had markedly reduced winter-spring abundance levels. For example, from March through May 2005 nearfield Ceratium abundance was <15% the long-term level, with May Ceratium abundance (7 per liter) of less than 1% of the long-term mean level. This reduced Ceratium abundance continued through the summer and autumn of 2005 (Table D-1).
Table D-1. 2005 Monthly mean nearfield Ceratium abundance levels compared to the corresponding long-term monthly mean nearfield Ceratium levels.
Month Long-term mean
abundance (cells l-1)
2005 abundance
(cells l-1)
% long-term mean
February 166 68 40.7 March 228 30 13.4 April 617 51 8.2 May 1,463 7 0.5 June 1,685 391 23.2 July 786 108 13.7 August 973 69 7.0 September 1,140 38 3.3 October 718 186 25.9 November 408 250 61.3
Nearfield Ceratium levels appear to have declined since 2002 (Figure D-16). The strong annual cycle, featuring a summer peak, and the apparent Ceratium decline since 2002 may be seen in the 14 years (1992-2005) of Ceratium data (Figure D-16a). Seasonal patterns may mask long-term trends in time series (Beare and McKenzie 1999), so a time-series technique that removes seasonal pattern was applied to the monthly Ceratium data. This technique uses anomalies about the long-term seasonal pattern as an indicator of trend relative to the long-term mean (Broekhuizen and McKenzie 1995). Removal of the seasonal pattern clearly shows the post-2002 Ceratium decline (Figure D-16b). Ceratium levels during 2002 to 2005 were ~500 cells per liter below long-term mean levels, and were similar to levels seen during 1994-1996. A transition from elevated Ceratium abundance during 2000-2001 to reduced abundance during 2002-2005 was observed in the time series analysis. There was not a gradual decrease in Ceratium abundance, but rather a sudden decline in abundance that began in the winter-spring of 2002 and has persisted through the end of 2005. A simple statistical analysis was done to determine if the decline was evident in all months of the year, and to determine if the 2002-2005 reduced abundance was statistically different from the levels observed during 1992-2001. A t-test was applied to monthly, quarterly and annual mean data partitioned into 1992-2001 and 2002-2005 periods. In most cases the n was ten years for the 1992-2001 period and n-4 years for the 2002-2005 period. Data were checked
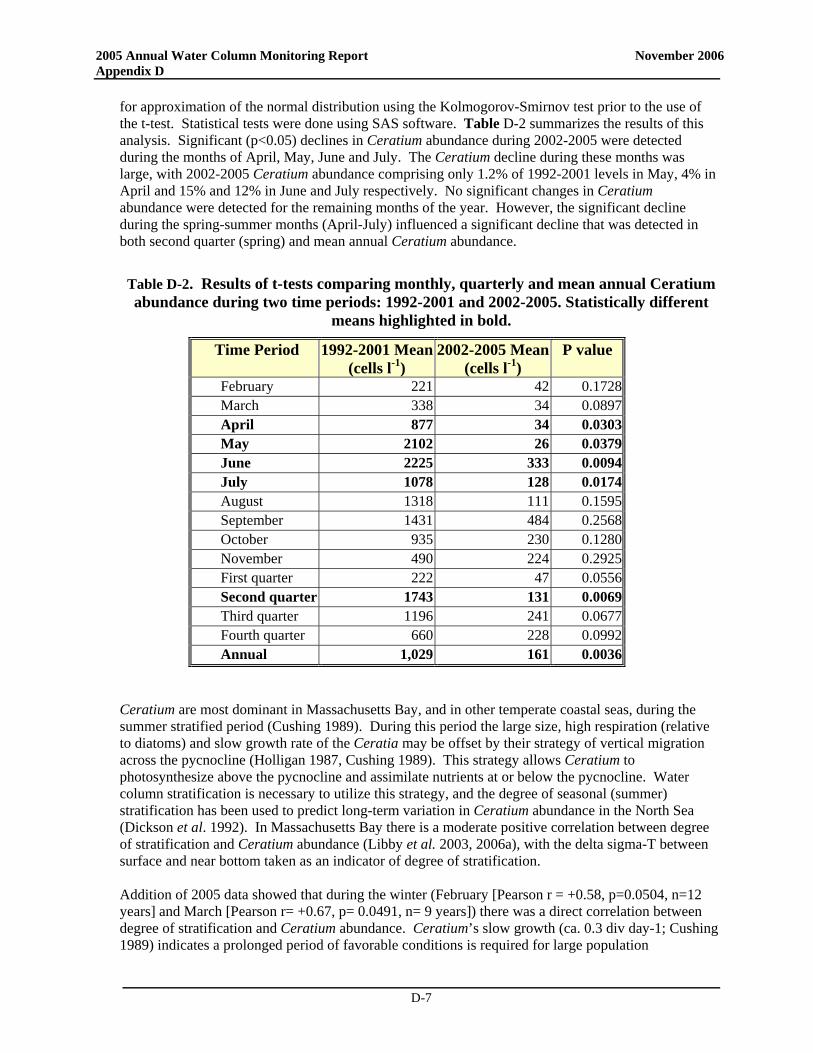
2005 Annual Water Column Monitoring Report November 2006 Appendix D
D-7
for approximation of the normal distribution using the Kolmogorov-Smirnov test prior to the use of the t-test. Statistical tests were done using SAS software. Table D-2 summarizes the results of this analysis. Significant (p<0.05) declines in Ceratium abundance during 2002-2005 were detected during the months of April, May, June and July. The Ceratium decline during these months was large, with 2002-2005 Ceratium abundance comprising only 1.2% of 1992-2001 levels in May, 4% in April and 15% and 12% in June and July respectively. No significant changes in Ceratium abundance were detected for the remaining months of the year. However, the significant decline during the spring-summer months (April-July) influenced a significant decline that was detected in both second quarter (spring) and mean annual Ceratium abundance.
Table D-2. Results of t-tests comparing monthly, quarterly and mean annual Ceratium abundance during two time periods: 1992-2001 and 2002-2005. Statistically different
means highlighted in bold.
Time Period 1992-2001 Mean(cells l-1)
2002-2005 Mean(cells l-1)
P value
February 221 42 0.1728 March 338 34 0.0897 April 877 34 0.0303 May 2102 26 0.0379 June 2225 333 0.0094 July 1078 128 0.0174 August 1318 111 0.1595 September 1431 484 0.2568 October 935 230 0.1280 November 490 224 0.2925 First quarter 222 47 0.0556 Second quarter 1743 131 0.0069 Third quarter 1196 241 0.0677 Fourth quarter 660 228 0.0992 Annual 1,029 161 0.0036
Ceratium are most dominant in Massachusetts Bay, and in other temperate coastal seas, during the summer stratified period (Cushing 1989). During this period the large size, high respiration (relative to diatoms) and slow growth rate of the Ceratia may be offset by their strategy of vertical migration across the pycnocline (Holligan 1987, Cushing 1989). This strategy allows Ceratium to photosynthesize above the pycnocline and assimilate nutrients at or below the pycnocline. Water column stratification is necessary to utilize this strategy, and the degree of seasonal (summer) stratification has been used to predict long-term variation in Ceratium abundance in the North Sea (Dickson et al. 1992). In Massachusetts Bay there is a moderate positive correlation between degree of stratification and Ceratium abundance (Libby et al. 2003, 2006a), with the delta sigma-T between surface and near bottom taken as an indicator of degree of stratification. Addition of 2005 data showed that during the winter (February [Pearson r = +0.58, p=0.0504, n=12 years] and March [Pearson r= +0.67, p= 0.0491, n= 9 years]) there was a direct correlation between degree of stratification and Ceratium abundance. Ceratium’s slow growth (ca. 0.3 div day-1; Cushing 1989) indicates a prolonged period of favorable conditions is required for large population
2005 Annual Water Column Monitoring Report November 2006 Appendix D
D-8
accumulation to occur, so a one month time lag between stratification and Ceratium abundance was also examined. A positive correlation between stratification and Ceratium one month later was found in the late spring/early summer (Figure D-17). March stratification was positively correlated with April Ceratium abundance (Pearson r= +0.73, p= 0.0075, n=12 years) and May stratification was positively correlated with June Ceratium abundance (Pearson r = +0.72, p= 0.0035, n= 14 years). No significant stratification-Ceratium correlation was found in other months of the year. This may be indicative of a dependence of the establishment of stratification in the late winter/early spring for achievement of Ceratium population development in the spring/early summer. In 2005 stratification was markedly reduced during May, but achieved greater than mean levels by July (Figure D-18). In contrast, during the last abundant Ceratium year, 2001, there was elevated stratification early in the year that persisted into the summer. Although stratification reached greater than long-term mean levels later in the summer of 2005, it appears that the early (March-May) establishment of stratification that may be needed for establishment of large Ceratium populations did not occur in 2005. Recent laboratory studies have also illustrated the physiological necessity of partially stratified water columns for Ceratium growth. For C. tripos (common in Massachusetts Bay) grown in a laboratory simulation, turbulence of > 0.05 cm2 sec-3 (equivalent to that generated by a moderate gale in the upper 10m of the sea) reduced Ceratium growth rate, and stopped Ceratium swimming (Havskum et al. 2005). Further, the same turbulence level did not reduce predation on C. tripos by a co-occurring mixotrophic dinoflagellate (Fragilidinium spp.). Thus, turbulence may not only destroy the stratified water column necessary for Ceratium’s vertical migration mode of nutrient and light acquisition, it also appears to have a detrimental effect on Ceratium growth at the cellular level. In 2005, spring storms of unprecedented strength and persistence (for that time of year) occurred in Massachusetts Bay. The effects of these storms on the transport of Alexandrium cells into Massachusetts Bay is well documented (Anderson et al. 2005a). These same spring storms appear to have also negatively impacted the annual establishment of water column stratification and subsequent seasonal development of the Ceratium population in Massachusetts Bay.
D.2.c Zooplankton Communities The variability in abundance and structure of the zooplankton community in 2005 in Massachusetts and Cape Cod Bays appear similar to patterns recorded since the beginning of sampling in 1992 (Figure D-19). Assemblages have been dominated throughout by copepod nauplii, Oithona similis, and Pseudocalanus spp. copepodites, throughout the year, with subdominant appearances of other copepods such as Calanus finmarchicus, Paracalanus parvus, Centropages typicus and C. hamatus, and sporadic pulses of various meroplankters such as bivalve and gastropod veligers, barnacle nauplii, and polychaete larvae. Zooplankton abundance generally increased from February through mid- to late summer, and then progressively declined through the fall and into winter.
Comparison of baseline and post-transfer zooplankton abundance in the nearfield suggests that there has been a decrease in abundance in 2001-2005 vs. 1992-2000 (Figure D-20a). In 2005, nearfield means for total zooplankton were at or below the baseline minima for all but the August and early September surveys (Figure D-20b). A similar pattern was observed for copepods, copepod nauplii and the most abundant copepod taxa Oithona similis. This has generally been the case during the post-transfer period with low values for copepod adults/copepodites and nauplii (Figure D-21). Oithona similis, consistently the most abundant of the copepod taxa in the bays, has shown the most dramatic decrease for the February to August time period (Figure D-22a). However, not all copepod taxa have exhibited this decrease. Calanus finmarchicus, a relatively large zooplankter, has been present in abundances approximating the baseline mean during most of the year and well above the baseline range for the May surveys during the post-transfer period (Figure D-22b).
2005 Annual Water Column Monitoring Report November 2006 Appendix D
D-9
It is unclear why zooplankton abundances in spring and fall have been lower in recent years than previously. However, discussion of possible reasons as to why this might be the case is presented below. The late spring and early summer nearfield zooplankton abundance means for 2005 and the post-transfer period are low and often below the baseline minimum in May through August (Figure D-20). It is tempting to speculate that consecutive Phaeocystis blooms from 2000-2005 may have contributed to reduced abundances of zooplankton in the spring and summer. Phaeocystis blooms might be noxious or inimical to certain animals such as right whales, and these blooms might be largely ungrazed by zooplankters. However, such speculation is complicated by considerable documented variability, at least in the case of zooplankton grazing (Turner et al. 2002). Impacts of Phaeocystis blooms on zooplankton are poorly understood. Perhaps because of its gelatinous and/or toxic nature, there has been the development of what Huntley et al. (1987) called the “legend of Phaeocystis unpalatability to zooplankton.” Such speculation is complicated by observations that numerous various zooplankters appear to feed and survive well upon diets of Phaeocystis, but may have reduced fecundity (see Turner et al. 2002 and references therein). Also, while time-series plots of Phaeocystis versus copepod nauplii abundance (Figure D-23) reveal that copepod nauplii are less abundant in the spring when Phaeocystis blooms than in summer when nauplii reach their annual peak, this pattern for nauplii persists through years both with, and without Phaeocystis blooms. In general, observations of total zooplankton, total copepod, and copepod nauplii abundance in April, the month of peak Phaeocystis abundance, during the bloom years from 2001 to 2005 are within the 1992-2000 baseline range (Figures D-20a and D-21). In 2005, copepod abundance approximated the baseline minima (Figure D-24a). Much of the spring and early summer 2005 difference in total copepod abundance was due to the very low abundance of Oithona in 2005 (Figure D-24b). Whether or not Phaeocystis is inimical to Oithona appears not to have been investigated. In conclusion, there is no clear explanation as to why spring zooplankton abundances in recent years are lower than previously.
It might be tempting to speculate that the lower summer and fall zooplankton abundances might be due to ctenophore predation. However, there is no data for this, beyond anecdotal observations of elevated ctenophore abundances during a very limited set of surveys. Blooms of the ctenophore Mnemiopsis leidyi were not apparent from the beginning of sampling in 1992 until October 2000. Since then, however, this ctenophore has been present in varying degrees. The fall 2000 appearance of ctenophores was primarily in October, and primarily in Boston Harbor. Subsequent blooms in 2002 and 2003 were observed in October over a larger area and in 2002 persisted to November in the nearfield. However, in this sampling program, ctenophores are screened out of samples prior to formalin preservation (to prevent ctenophore tissue from turning into something akin to glue which complicates sorting of other zooplankton). In 2002, the screened ctenophores began to be measured for volume displacement and revealed their presence in fall 2002 and 2003. In more recent years (2004-2005) ctenophores have not been abundant enough to be noticed in the field or require screening, and thus cannot be used to explain the declines in other zooplankton during these years. Nearfield post-transfer means were generally lower than baseline means (especially in the summer) for total zooplankton, total copepods, copepod adults plus copepodites and nauplii, and for total Oithona similis copepodites plus adults. The only zooplankter with a substantially higher post-transfer nearfield mean was C. finmarchicus in mid-May (Figure D-22). It is unclear why this was the case. The possibility that declines in zooplankton were due to elevated abundances of Calanus preying carnivorously on copepod nauplii and/or Oithona is not substantiated due to inconsistent patterns of abundance of Calanus versus copepod nauplii and Calanus versus Oithona (Figure D-25).
2005 Annual Water Column Monitoring Report November 2006 Appendix D
D-10
These patterns reveal that Calanus, a cold-water copepod, was generally most abundant during spring, possibly going into deeper-water diapause during later summer, whereas copepod nauplii and Oithona were most abundant near the surface during late summer, the warmest period of the year. Thus, whether these patterns were due to different optimum temperature ranges or predation are impossible to sort out.
D.3 Plankton Summary Patterns in plankton in 2005 were similar or in some cases dissimilar to those recorded for previous years. The phytoplankton was numerically dominated by microflagellates throughout most of the year, as usual, and there were the usual diatom blooms in winter-spring and fall (though minor). There was the now-typical bloom of Phaeocystis pouchetii in the spring. The Phaeocystis bloom in 2005 began in late February, and lasted through April, like most previous blooms which were primarily April events. Abundance of the nuisance alga Phaeocystis in the nearfield exceeded the summer seasonal thresholds in 2005, but only due to a single sample containing degraded cells that was observed in June – not ecologically important. The 2005 Phaeocystis bloom was much reduced compared to the previous year when the largest Phaeocystis bloom was observed during the MWRA monitoring program with a nearfield survey maximum of 8 million cells l-1 in April 2004. As in past years, the 2005 Phaeocystis bloom was a regional event. There is no obvious association between the magnitude or duration of the 2005 Phaeocystis bloom and the MWRA outfall. The 2005 red tide of Alexandrium fundyense was the largest of the last third-century, and appeared to be due to a unique sequence of meteorological, hydrographic and biological events that conspired to produce this extraordinary event. Heavy rainfall and snowmelt increased runoff of freshwater into the Gulf of Maine in early spring. This runoff enriched the water with nutrients and stratified the nearshore water column. The combination of several storms with winds from the northeast set up downwelling conditions that transported red tide cells from the coastal western Gulf of Maine current to the southwest into Massachusetts and Cape Cod Bays. The 2005 Alexandrium bloom will be the focus of an upcoming interpretive report. Thus, in answer to management questions such as “Has phytoplankton community composition changed with special attention to frequency and abundance of nuisance species?,” the community composition has not changed, but the frequency has in terms of the now annual spring Phaeocystis blooms, and magnitude of blooms of nuisance species clearly has changed, considering the massive 2005 Alexandrium red tide. Have the zooplankton changed? Zooplankton community structure and seasonal abundance patterns were similar to previous years. Zooplankton abundance was dominated by copepod nauplii, and adults and copepodites of Oithona similis and Pseudocalanus spp., with subdominant contributions by other copepods and sporadic pulses of meroplankters. Zooplankton abundance increased from winter through spring to summer, and declined through the fall. However, zooplankton abundance was lower than typically observed over the baseline during much of 2005. The low abundance in spring and summer may have been influenced by the occurrence of Phaeocystis blooms since 2000. The low zooplankton abundances in the fall could conceivably be related to either bottom-up (comparatively minimal fall bloom – reduced food) or top-down controls (continued presence of ctenophores). Process and rate studies would be necessary to elevate such speculation to the status of explanation.
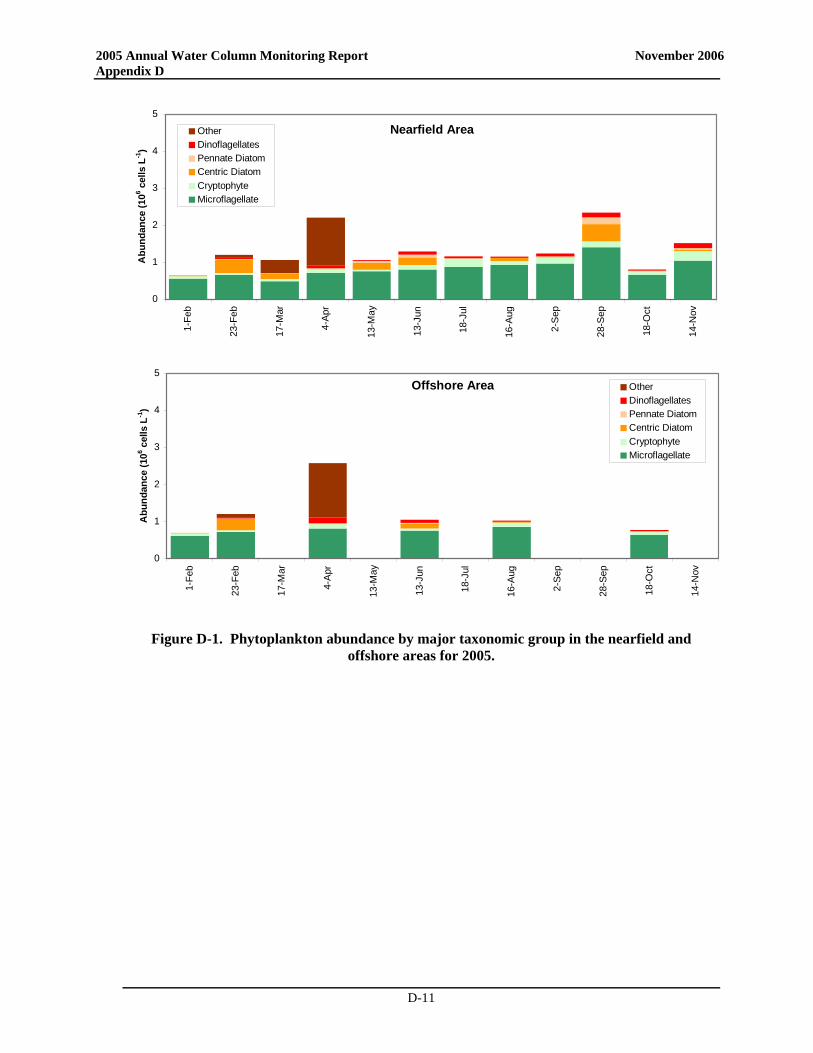
2005 Annual Water Column Monitoring Report November 2006 Appendix D
D-11
Nearfield Area
0
1
2
3
4
5
1-Fe
b
23-F
eb
17-M
ar
4-Ap
r
13-M
ay
13-J
un
18-J
ul
16-A
ug
2-S
ep
28-S
ep
18-O
ct
14-N
ov
Abu
ndan
ce (1
06 cel
ls L
-1)
OtherDinoflagellatesPennate DiatomCentric DiatomCryptophyteMicroflagellate
Offshore Area
0
1
2
3
4
5
1-Fe
b
23-F
eb
17-M
ar
4-A
pr
13-M
ay
13-J
un
18-J
ul
16-A
ug
2-Se
p
28-S
ep
18-O
ct
14-N
ov
Abu
ndan
ce (1
06 cel
ls L
-1)
OtherDinoflagellatesPennate DiatomCentric DiatomCryptophyteMicroflagellate
Figure D-1. Phytoplankton abundance by major taxonomic group in the nearfield and
offshore areas for 2005.
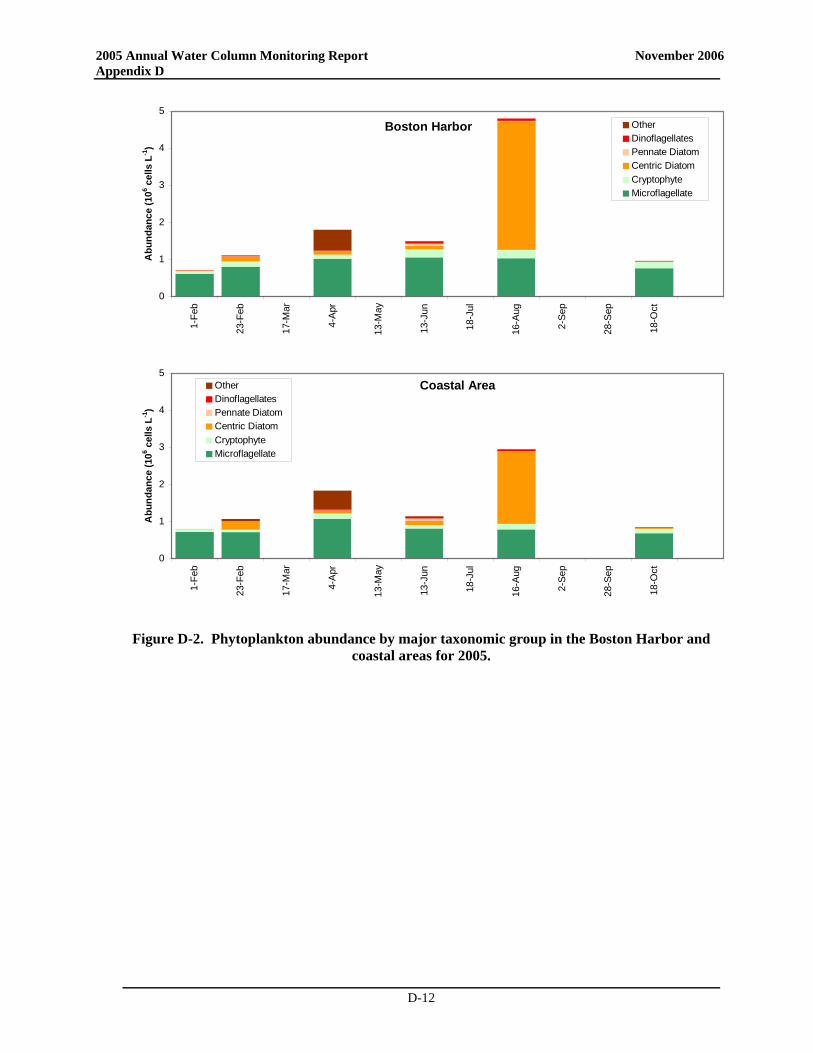
2005 Annual Water Column Monitoring Report November 2006 Appendix D
D-12
Boston Harbor
0
1
2
3
4
5
1-Fe
b
23-F
eb
17-M
ar
4-A
pr
13-M
ay
13-J
un
18-J
ul
16-A
ug
2-Se
p
28-S
ep
18-O
ct
Abu
ndan
ce (1
06 cel
ls L
-1)
OtherDinoflagellatesPennate DiatomCentric DiatomCryptophyteMicroflagellate
Coastal Area
0
1
2
3
4
5
1-Fe
b
23-F
eb
17-M
ar
4-A
pr
13-M
ay
13-J
un
18-J
ul
16-A
ug
2-Se
p
28-S
ep
18-O
ct
Abu
ndan
ce (1
06 cel
ls L
-1)
OtherDinoflagellatesPennate DiatomCentric DiatomCryptophyteMicroflagellate
Figure D-2. Phytoplankton abundance by major taxonomic group in the Boston Harbor and
coastal areas for 2005.
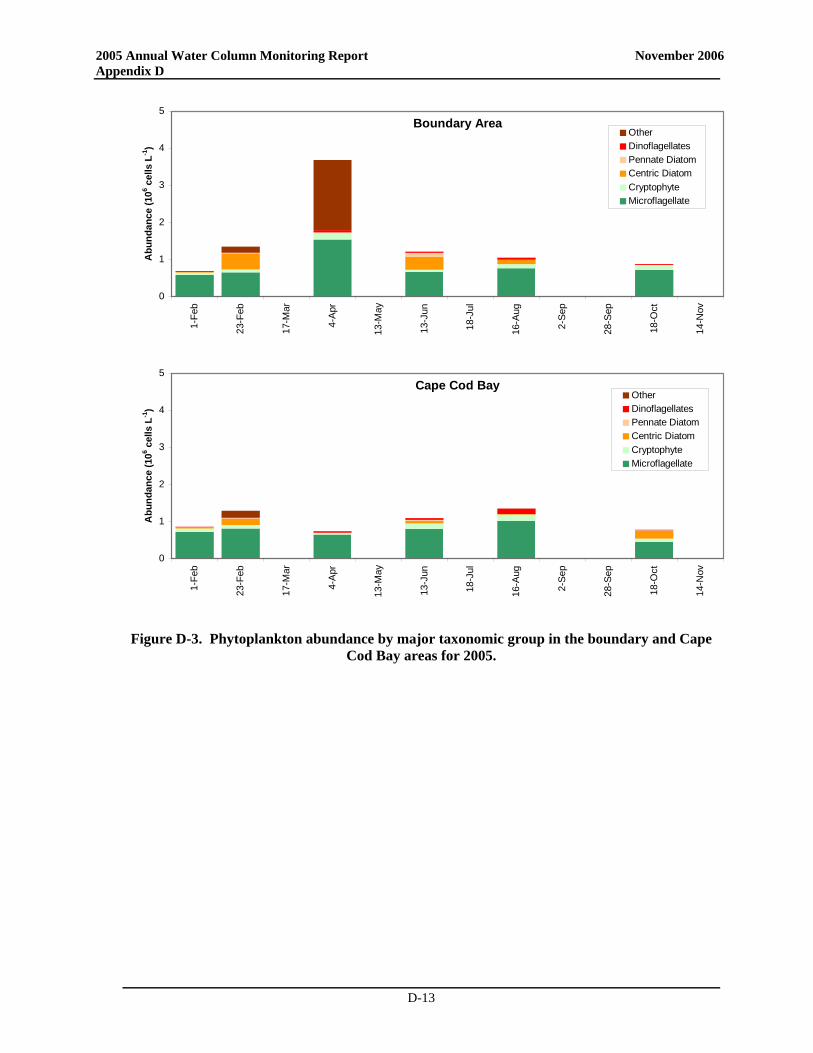
2005 Annual Water Column Monitoring Report November 2006 Appendix D
D-13
Boundary Area
0
1
2
3
4
5
1-Fe
b
23-F
eb
17-M
ar
4-A
pr
13-M
ay
13-J
un
18-J
ul
16-A
ug
2-Se
p
28-S
ep
18-O
ct
14-N
ov
Abu
ndan
ce (1
06 cel
ls L
-1)
OtherDinoflagellatesPennate DiatomCentric DiatomCryptophyteMicroflagellate
Cape Cod Bay
0
1
2
3
4
5
1-Fe
b
23-F
eb
17-M
ar
4-A
pr
13-M
ay
13-J
un
18-J
ul
16-A
ug
2-Se
p
28-S
ep
18-O
ct
14-N
ov
Abu
ndan
ce (1
06 cel
ls L
-1)
OtherDinoflagellatesPennate DiatomCentric DiatomCryptophyteMicroflagellate
Figure D-3. Phytoplankton abundance by major taxonomic group in the boundary and Cape
Cod Bay areas for 2005.
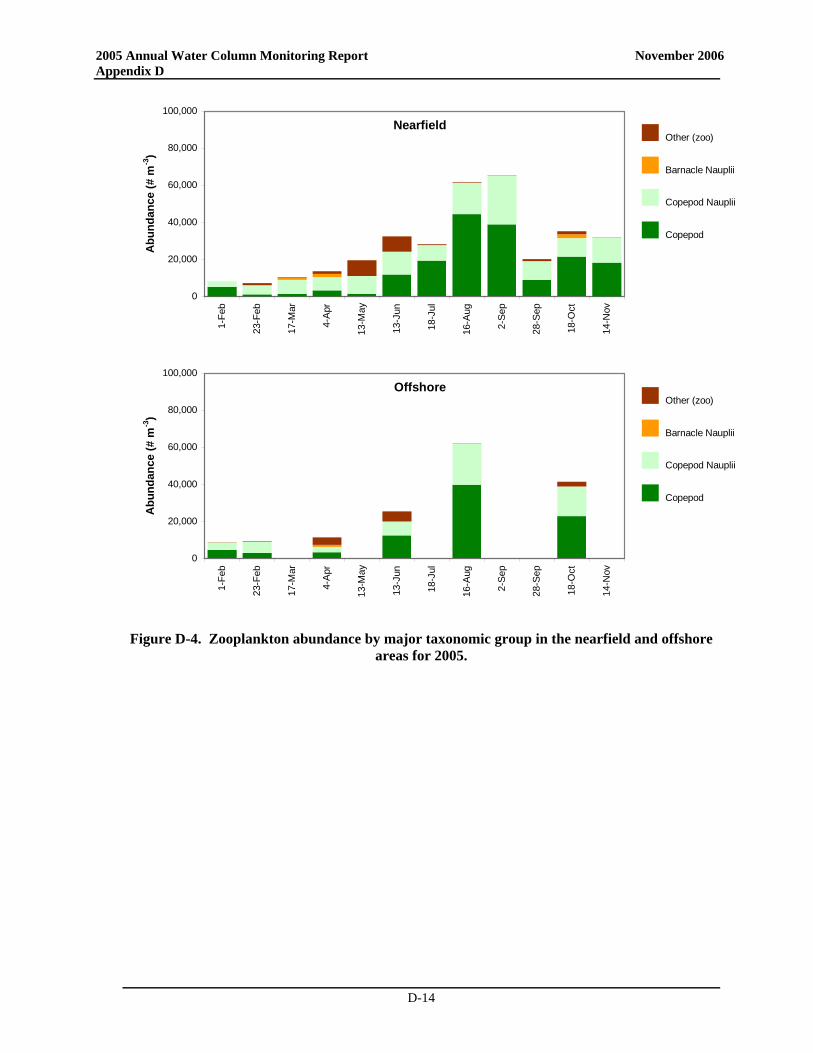
2005 Annual Water Column Monitoring Report November 2006 Appendix D
D-14
Nearfield
0
20,000
40,000
60,000
80,000
100,000
1-Fe
b
23-F
eb
17-M
ar
4-A
pr
13-M
ay
13-J
un
18-J
ul
16-A
ug
2-Se
p
28-S
ep
18-O
ct
14-N
ov
Abu
ndan
ce (#
m-3
)Other (zoo)
Barnacle Nauplii
Copepod Nauplii
Copepod
Offshore
0
20,000
40,000
60,000
80,000
100,000
1-Fe
b
23-F
eb
17-M
ar
4-A
pr
13-M
ay
13-J
un
18-J
ul
16-A
ug
2-Se
p
28-S
ep
18-O
ct
14-N
ov
Abu
ndan
ce (#
m-3
)
Other (zoo)
Barnacle Nauplii
Copepod Nauplii
Copepod
Figure D-4. Zooplankton abundance by major taxonomic group in the nearfield and offshore
areas for 2005.
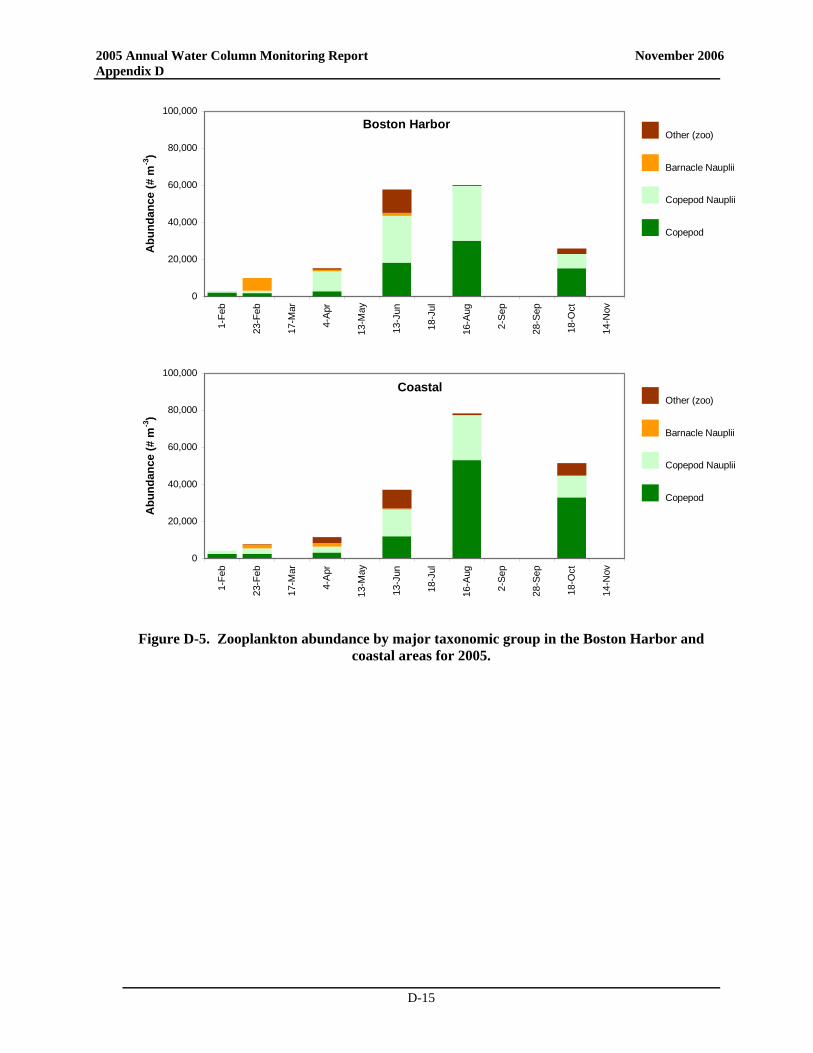
2005 Annual Water Column Monitoring Report November 2006 Appendix D
D-15
Boston Harbor
0
20,000
40,000
60,000
80,000
100,000
1-Fe
b
23-F
eb
17-M
ar
4-A
pr
13-M
ay
13-J
un
18-J
ul
16-A
ug
2-Se
p
28-S
ep
18-O
ct
14-N
ov
Abu
ndan
ce (#
m-3
)Other (zoo)
Barnacle Nauplii
Copepod Nauplii
Copepod
Coastal
0
20,000
40,000
60,000
80,000
100,000
1-Fe
b
23-F
eb
17-M
ar
4-A
pr
13-M
ay
13-J
un
18-J
ul
16-A
ug
2-Se
p
28-S
ep
18-O
ct
14-N
ov
Abu
ndan
ce (#
m-3
)
Other (zoo)
Barnacle Nauplii
Copepod Nauplii
Copepod
Figure D-5. Zooplankton abundance by major taxonomic group in the Boston Harbor and
coastal areas for 2005.
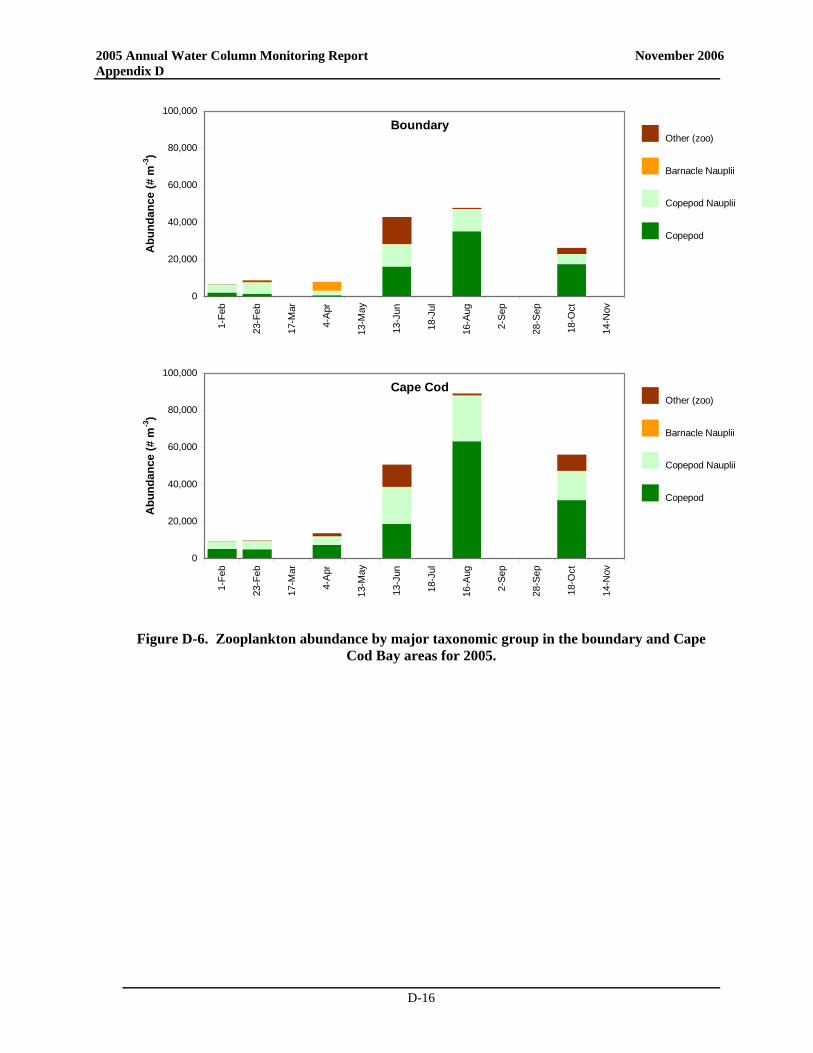
2005 Annual Water Column Monitoring Report November 2006 Appendix D
D-16
Boundary
0
20,000
40,000
60,000
80,000
100,000
1-Fe
b
23-F
eb
17-M
ar
4-A
pr
13-M
ay
13-J
un
18-J
ul
16-A
ug
2-Se
p
28-S
ep
18-O
ct
14-N
ov
Abu
ndan
ce (#
m-3
)Other (zoo)
Barnacle Nauplii
Copepod Nauplii
Copepod
Cape Cod
0
20,000
40,000
60,000
80,000
100,000
1-Fe
b
23-F
eb
17-M
ar
4-A
pr
13-M
ay
13-J
un
18-J
ul
16-A
ug
2-Se
p
28-S
ep
18-O
ct
14-N
ov
Abu
ndan
ce (#
m-3
)
Other (zoo)
Barnacle Nauplii
Copepod Nauplii
Copepod
Figure D-6. Zooplankton abundance by major taxonomic group in the boundary and Cape
Cod Bay areas for 2005.
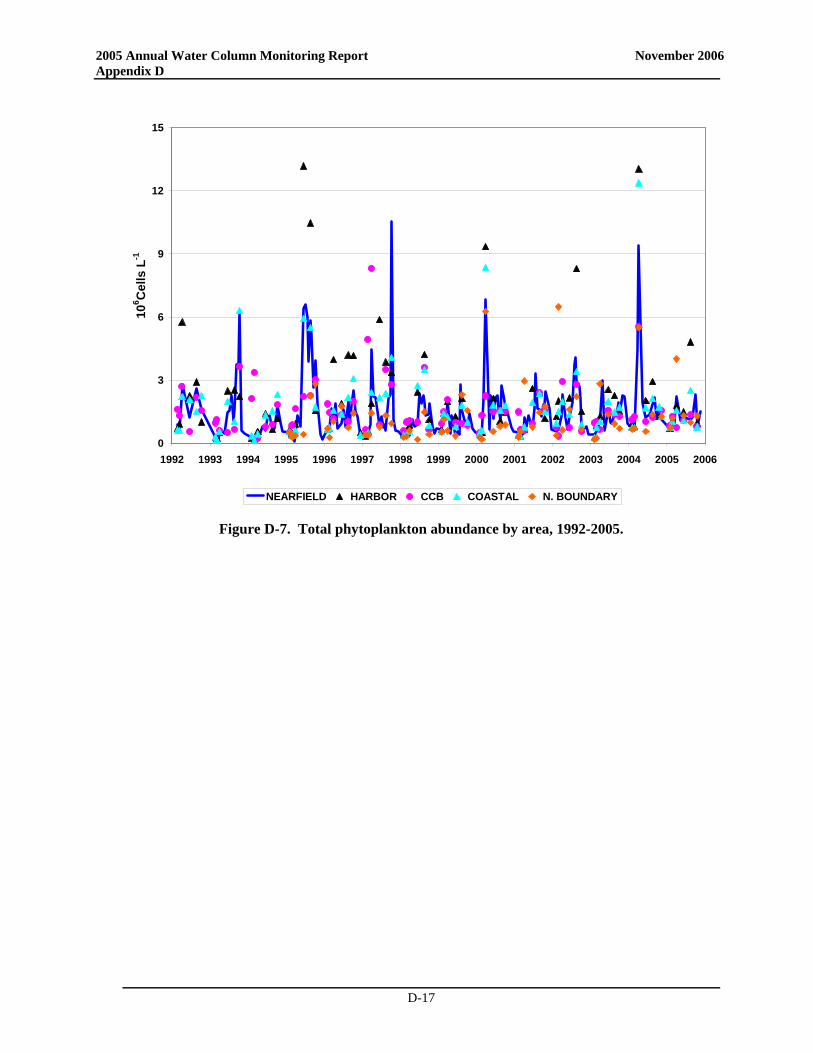
2005 Annual Water Column Monitoring Report November 2006 Appendix D
D-17
0
3
6
9
12
15
1992 1993 1994 1995 1996 1997 1998 1999 2000 2001 2002 2003 2004 2005 2006
106 C
ells
L-1
NEARFIELD HARBOR CCB COASTAL N. BOUNDARY
Figure D-7. Total phytoplankton abundance by area, 1992-2005.
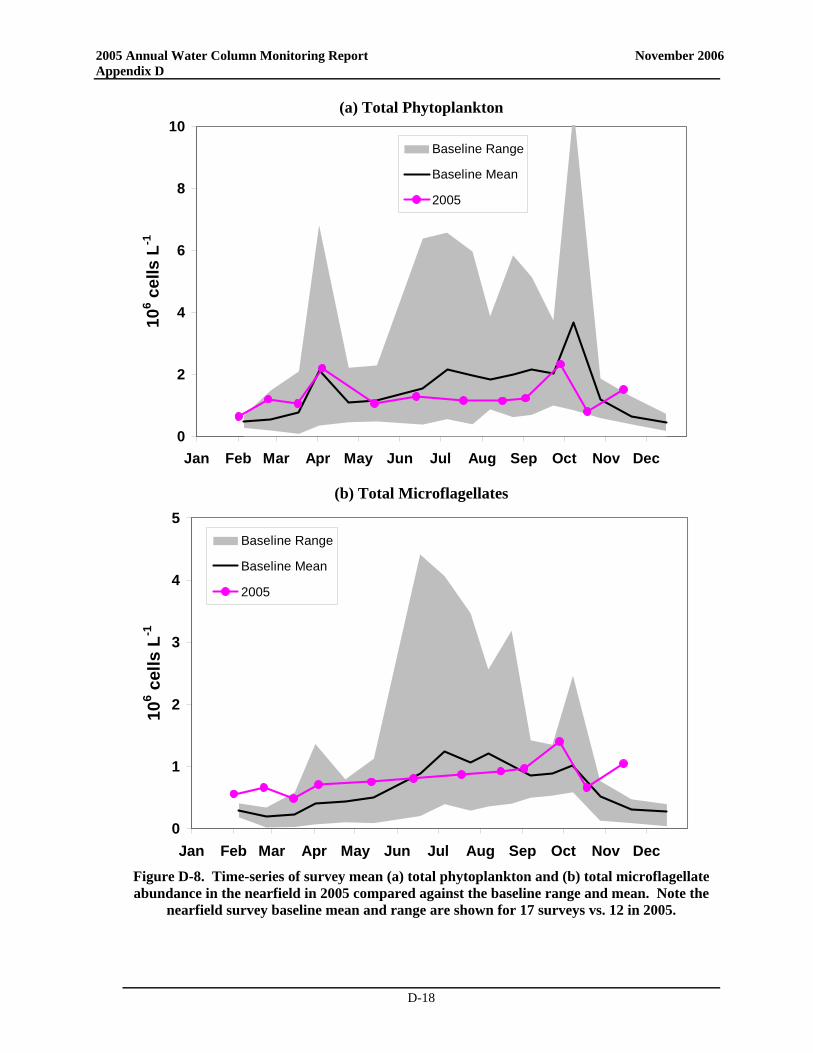
2005 Annual Water Column Monitoring Report November 2006 Appendix D
D-18
(a) Total Phytoplankton
0
2
4
6
8
10
Jan Feb Mar Apr May Jun Jul Aug Sep Oct Nov Dec
106 c
ells
L-1
Baseline Range
Baseline Mean
2005
(b) Total Microflagellates
0
1
2
3
4
5
Jan Feb Mar Apr May Jun Jul Aug Sep Oct Nov Dec
106 c
ells
L-1
Baseline Range
Baseline Mean
2005
Figure D-8. Time-series of survey mean (a) total phytoplankton and (b) total microflagellate abundance in the nearfield in 2005 compared against the baseline range and mean. Note the
nearfield survey baseline mean and range are shown for 17 surveys vs. 12 in 2005.
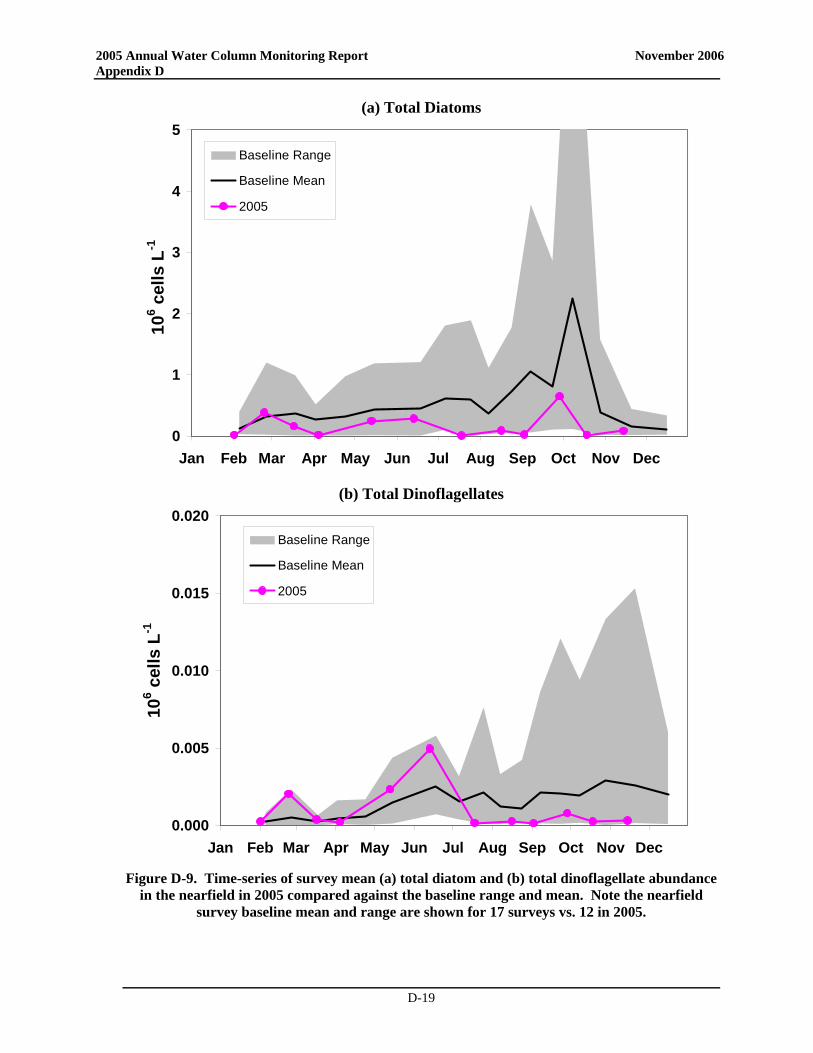
2005 Annual Water Column Monitoring Report November 2006 Appendix D
D-19
(a) Total Diatoms
0
1
2
3
4
5
Jan Feb Mar Apr May Jun Jul Aug Sep Oct Nov Dec
106 c
ells
L-1
Baseline Range
Baseline Mean
2005
(b) Total Dinoflagellates
0.000
0.005
0.010
0.015
0.020
Jan Feb Mar Apr May Jun Jul Aug Sep Oct Nov Dec
106 c
ells
L-1
Baseline Range
Baseline Mean
2005
Figure D-9. Time-series of survey mean (a) total diatom and (b) total dinoflagellate abundance
in the nearfield in 2005 compared against the baseline range and mean. Note the nearfield survey baseline mean and range are shown for 17 surveys vs. 12 in 2005.
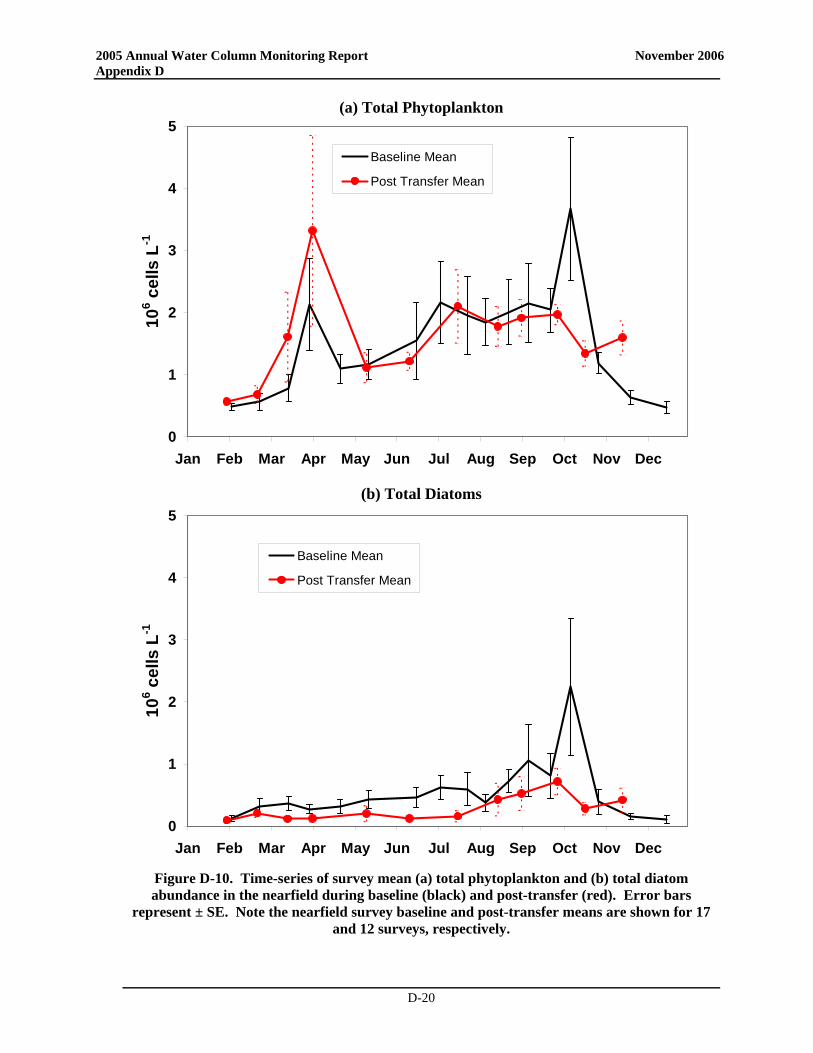
2005 Annual Water Column Monitoring Report November 2006 Appendix D
D-20
(a) Total Phytoplankton
0
1
2
3
4
5
Jan Feb Mar Apr May Jun Jul Aug Sep Oct Nov Dec
106 c
ells
L-1
Baseline Mean
Post Transfer Mean
(b) Total Diatoms
0
1
2
3
4
5
Jan Feb Mar Apr May Jun Jul Aug Sep Oct Nov Dec
106 c
ells
L-1
Baseline Mean
Post Transfer Mean
Figure D-10. Time-series of survey mean (a) total phytoplankton and (b) total diatom abundance in the nearfield during baseline (black) and post-transfer (red). Error bars
represent ± SE. Note the nearfield survey baseline and post-transfer means are shown for 17 and 12 surveys, respectively.
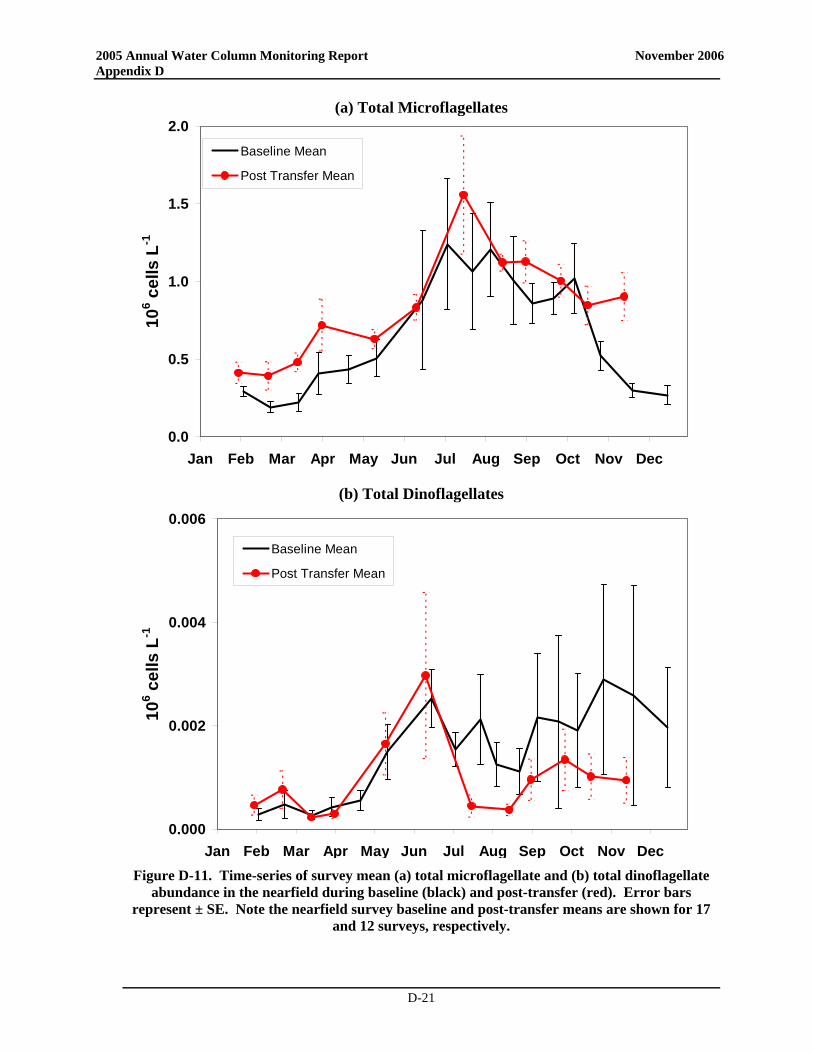
2005 Annual Water Column Monitoring Report November 2006 Appendix D
D-21
(a) Total Microflagellates
0.0
0.5
1.0
1.5
2.0
Jan Feb Mar Apr May Jun Jul Aug Sep Oct Nov Dec
106 c
ells
L-1
Baseline Mean
Post Transfer Mean
(b) Total Dinoflagellates
0.000
0.002
0.004
0.006
Jan Feb Mar Apr May Jun Jul Aug Sep Oct Nov Dec
106 c
ells
L-1
Baseline Mean
Post Transfer Mean
Figure D-11. Time-series of survey mean (a) total microflagellate and (b) total dinoflagellate
abundance in the nearfield during baseline (black) and post-transfer (red). Error bars represent ± SE. Note the nearfield survey baseline and post-transfer means are shown for 17
and 12 surveys, respectively.
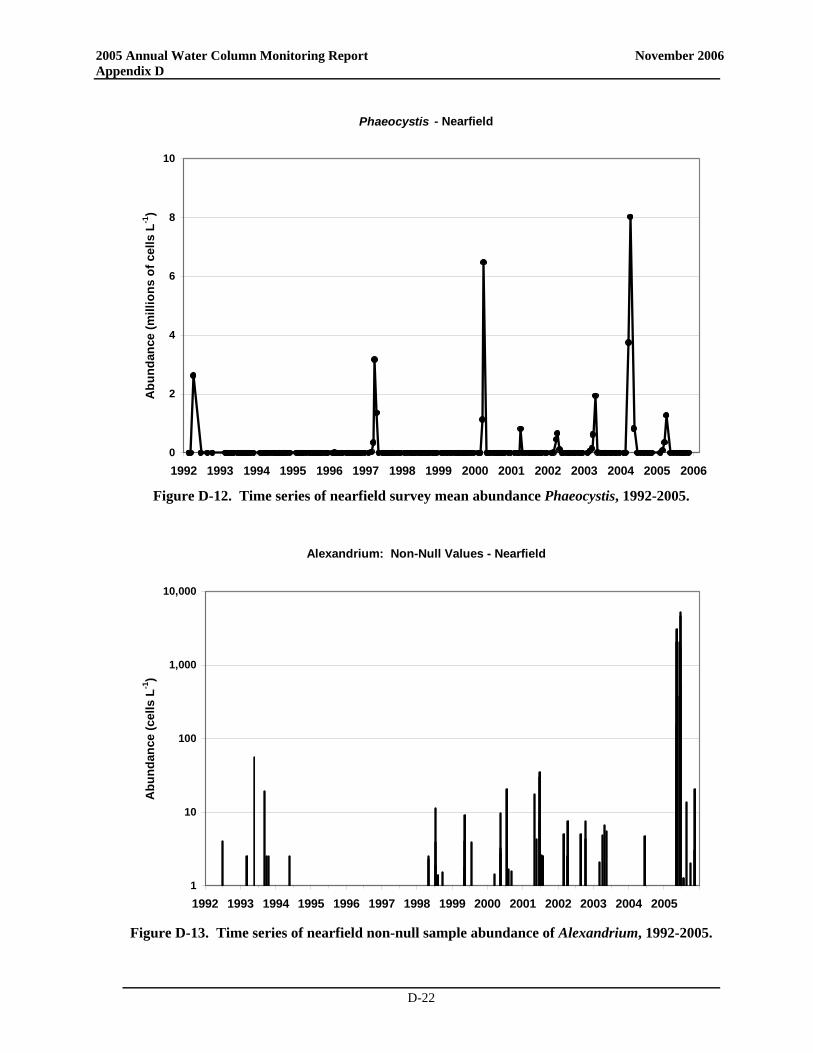
2005 Annual Water Column Monitoring Report November 2006 Appendix D
D-22
Phaeocystis - Nearfield
0
2
4
6
8
10
1992 1993 1994 1995 1996 1997 1998 1999 2000 2001 2002 2003 2004 2005 2006
Abu
ndan
ce (m
illio
ns o
f cel
ls L
-1)
Figure D-12. Time series of nearfield survey mean abundance Phaeocystis, 1992-2005.
Alexandrium: Non-Null Values - Nearfield
1
10
100
1,000
10,000
1992 1993 1994 1995 1996 1997 1998 1999 2000 2001 2002 2003 2004 2005
Abu
ndan
ce (c
ells
L-1
)
Figure D-13. Time series of nearfield non-null sample abundance of Alexandrium, 1992-2005.
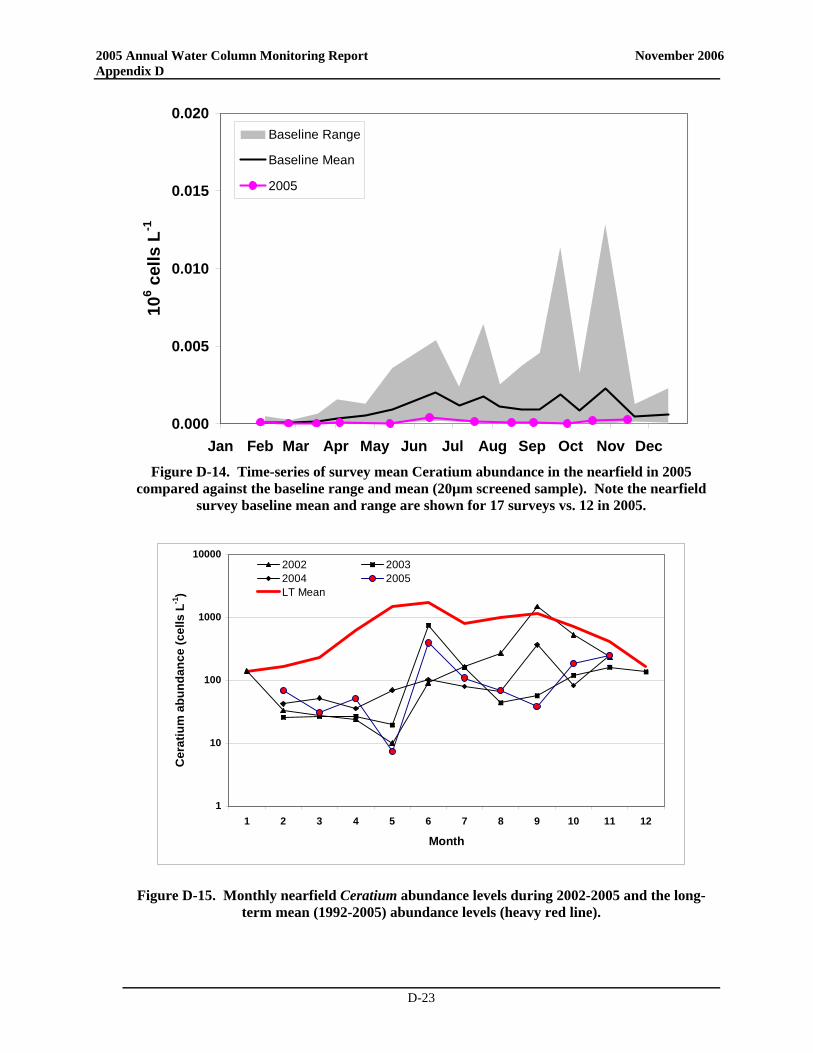
2005 Annual Water Column Monitoring Report November 2006 Appendix D
D-23
0.000
0.005
0.010
0.015
0.020
Jan Feb Mar Apr May Jun Jul Aug Sep Oct Nov Dec
106 c
ells
L-1
Baseline Range
Baseline Mean
2005
Figure D-14. Time-series of survey mean Ceratium abundance in the nearfield in 2005
compared against the baseline range and mean (20µm screened sample). Note the nearfield survey baseline mean and range are shown for 17 surveys vs. 12 in 2005.
1
10
100
1000
10000
1 2 3 4 5 6 7 8 9 10 11 12
Month
Cer
atiu
m a
bund
ance
(cel
ls L
-1)
2002 20032004 2005LT Mean
Figure D-15. Monthly nearfield Ceratium abundance levels during 2002-2005 and the long-term mean (1992-2005) abundance levels (heavy red line).
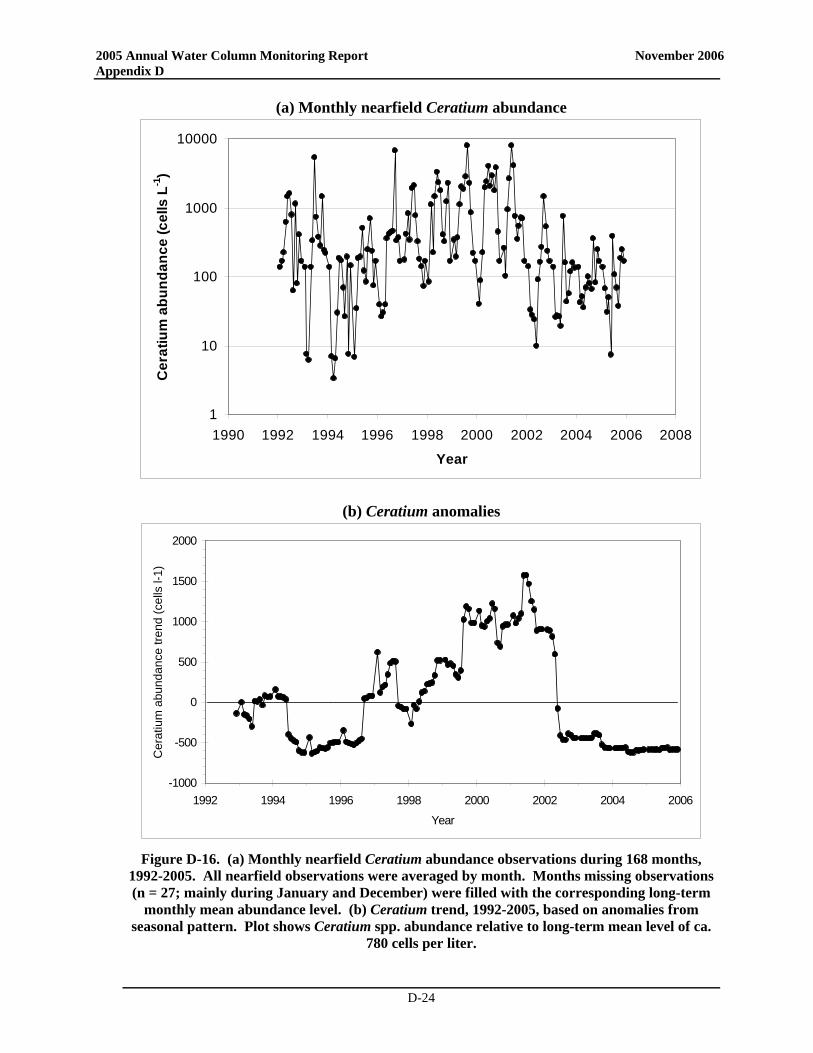
2005 Annual Water Column Monitoring Report November 2006 Appendix D
D-24
(a) Monthly nearfield Ceratium abundance
1
10
100
1000
10000
1990 1992 1994 1996 1998 2000 2002 2004 2006 2008
Year
Cer
atiu
m a
bund
ance
(cel
ls L
-1)
(b) Ceratium anomalies
-1000
-500
0
500
1000
1500
2000
1992 1994 1996 1998 2000 2002 2004 2006
Year
Cer
atiu
m a
bund
ance
tren
d (c
ells
l-1)
Figure D-16. (a) Monthly nearfield Ceratium abundance observations during 168 months,
1992-2005. All nearfield observations were averaged by month. Months missing observations (n = 27; mainly during January and December) were filled with the corresponding long-term
monthly mean abundance level. (b) Ceratium trend, 1992-2005, based on anomalies from seasonal pattern. Plot shows Ceratium spp. abundance relative to long-term mean level of ca.
780 cells per liter.
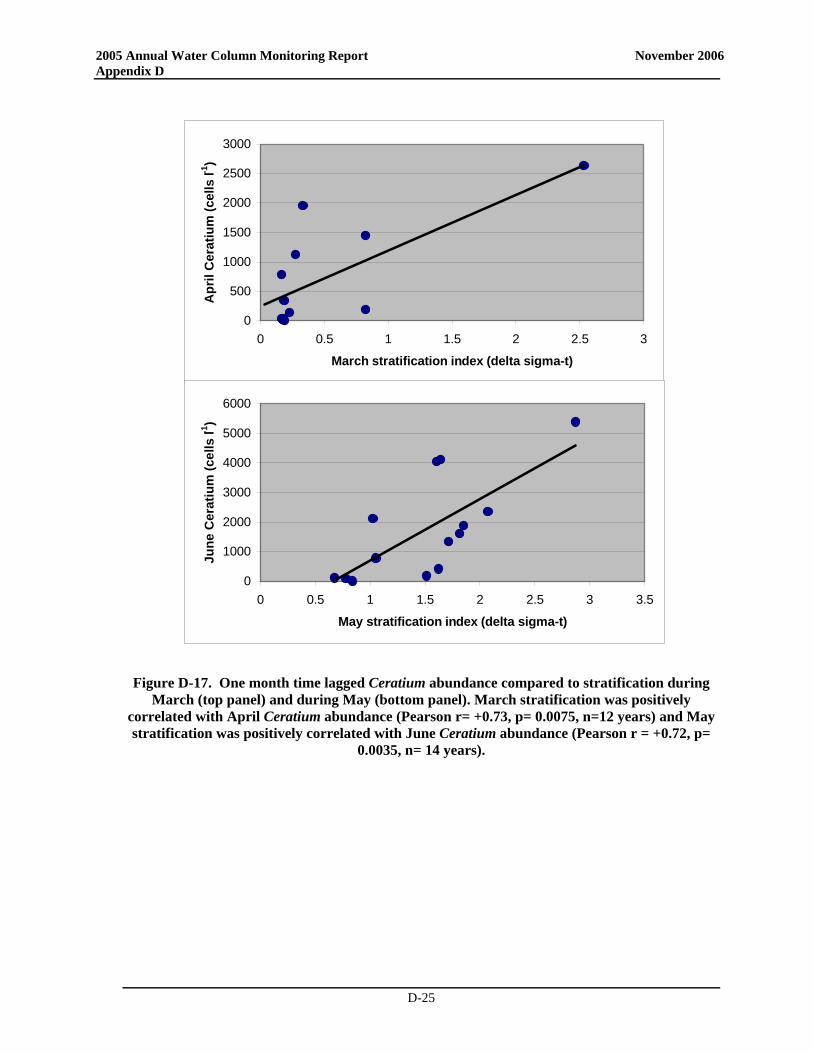
2005 Annual Water Column Monitoring Report November 2006 Appendix D
D-25
Figure D-17. One month time lagged Ceratium abundance compared to stratification during March (top panel) and during May (bottom panel). March stratification was positively
correlated with April Ceratium abundance (Pearson r= +0.73, p= 0.0075, n=12 years) and May stratification was positively correlated with June Ceratium abundance (Pearson r = +0.72, p=
0.0035, n= 14 years).
0
500
1000
1500
2000
2500
3000
0 0.5 1 1.5 2 2.5 3
March stratification index (delta sigma-t)
Apr
il C
erat
ium
(cel
ls l-1
)
0
1000
2000
3000
4000
5000
6000
0 0.5 1 1.5 2 2.5 3 3.5
May stratification index (delta sigma-t)
June
Cer
atiu
m (c
ells
l-1)
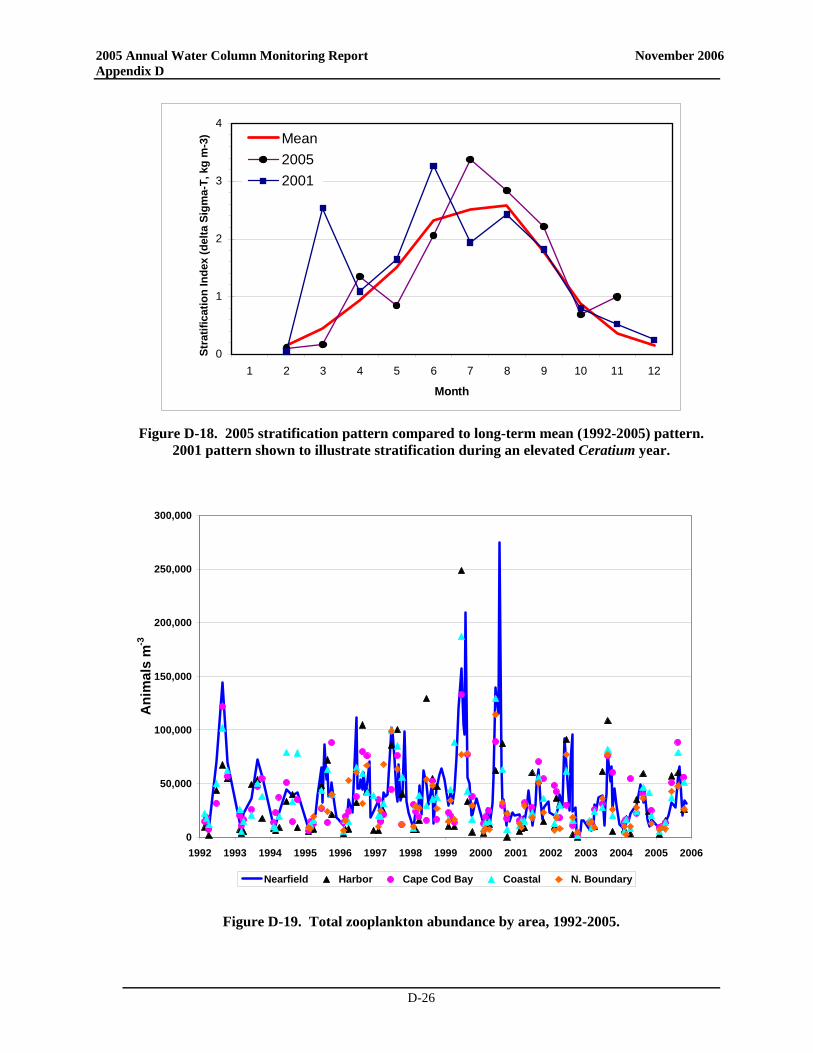
2005 Annual Water Column Monitoring Report November 2006 Appendix D
D-26
0
1
2
3
4
1 2 3 4 5 6 7 8 9 10 11 12
Month
Stra
tific
atio
n In
dex
(del
ta S
igm
a-T,
kg
m-3
) Mean20052001
Figure D-18. 2005 stratification pattern compared to long-term mean (1992-2005) pattern.
2001 pattern shown to illustrate stratification during an elevated Ceratium year.
0
50,000
100,000
150,000
200,000
250,000
300,000
1992 1993 1994 1995 1996 1997 1998 1999 2000 2001 2002 2003 2004 2005 2006
Ani
mal
s m
-3
Nearfield Harbor Cape Cod Bay Coastal N. Boundary
Figure D-19. Total zooplankton abundance by area, 1992-2005.
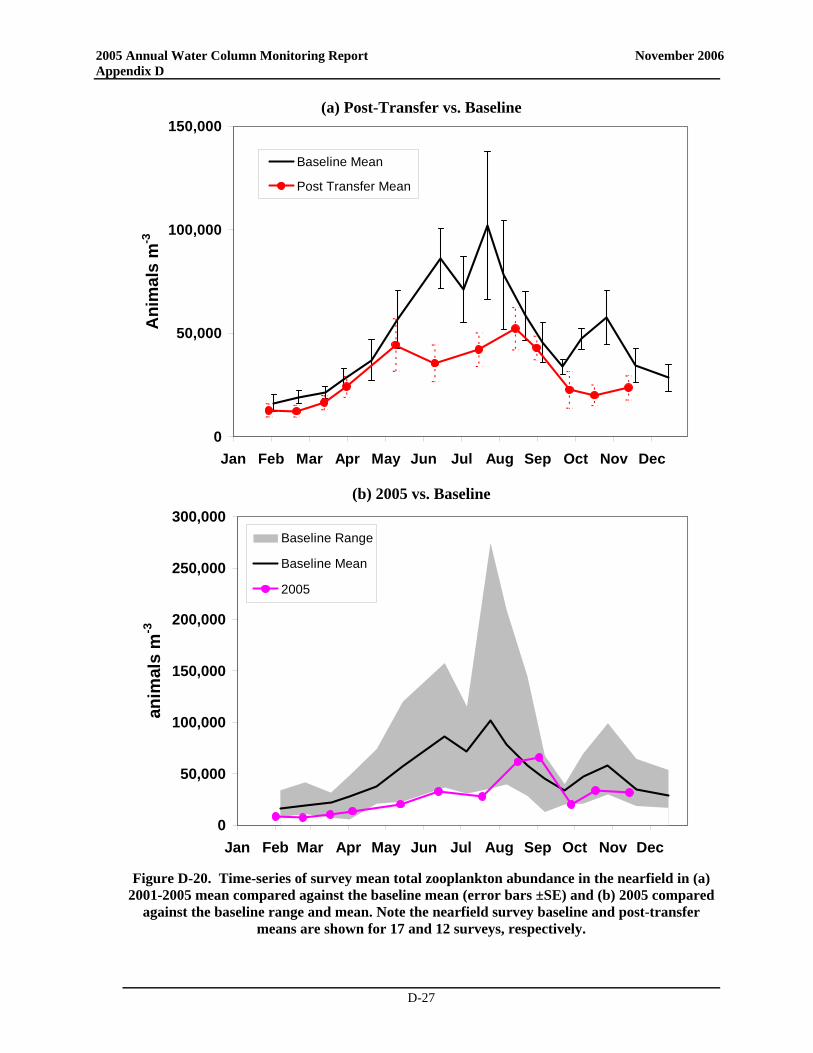
2005 Annual Water Column Monitoring Report November 2006 Appendix D
D-27
(a) Post-Transfer vs. Baseline
0
50,000
100,000
150,000
Jan Feb Mar Apr May Jun Jul Aug Sep Oct Nov Dec
Ani
mal
s m
-3Baseline Mean
Post Transfer Mean
(b) 2005 vs. Baseline
0
50,000
100,000
150,000
200,000
250,000
300,000
Jan Feb Mar Apr May Jun Jul Aug Sep Oct Nov Dec
anim
als
m-3
Baseline Range
Baseline Mean
2005
Figure D-20. Time-series of survey mean total zooplankton abundance in the nearfield in (a)
2001-2005 mean compared against the baseline mean (error bars ±SE) and (b) 2005 compared against the baseline range and mean. Note the nearfield survey baseline and post-transfer
means are shown for 17 and 12 surveys, respectively.
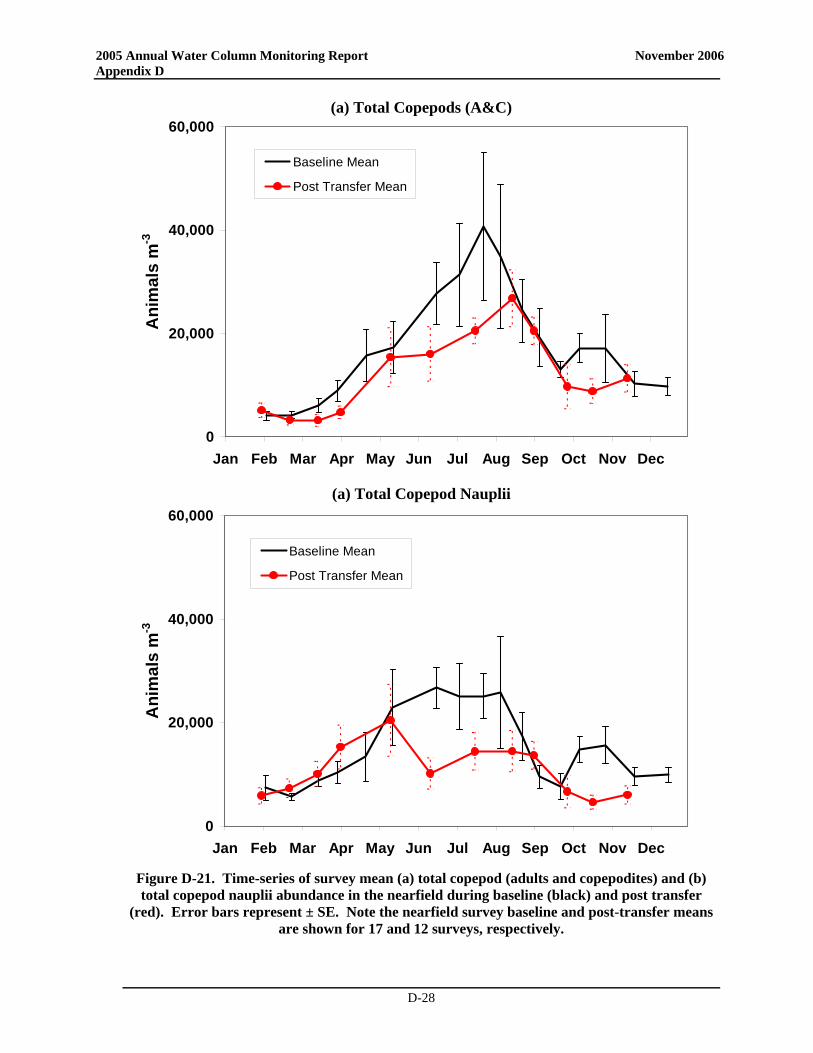
2005 Annual Water Column Monitoring Report November 2006 Appendix D
D-28
(a) Total Copepods (A&C)
0
20,000
40,000
60,000
Jan Feb Mar Apr May Jun Jul Aug Sep Oct Nov Dec
Ani
mal
s m
-3Baseline Mean
Post Transfer Mean
(a) Total Copepod Nauplii
0
20,000
40,000
60,000
Jan Feb Mar Apr May Jun Jul Aug Sep Oct Nov Dec
Ani
mal
s m
-3
Baseline Mean
Post Transfer Mean
Figure D-21. Time-series of survey mean (a) total copepod (adults and copepodites) and (b) total copepod nauplii abundance in the nearfield during baseline (black) and post transfer
(red). Error bars represent ± SE. Note the nearfield survey baseline and post-transfer means are shown for 17 and 12 surveys, respectively.
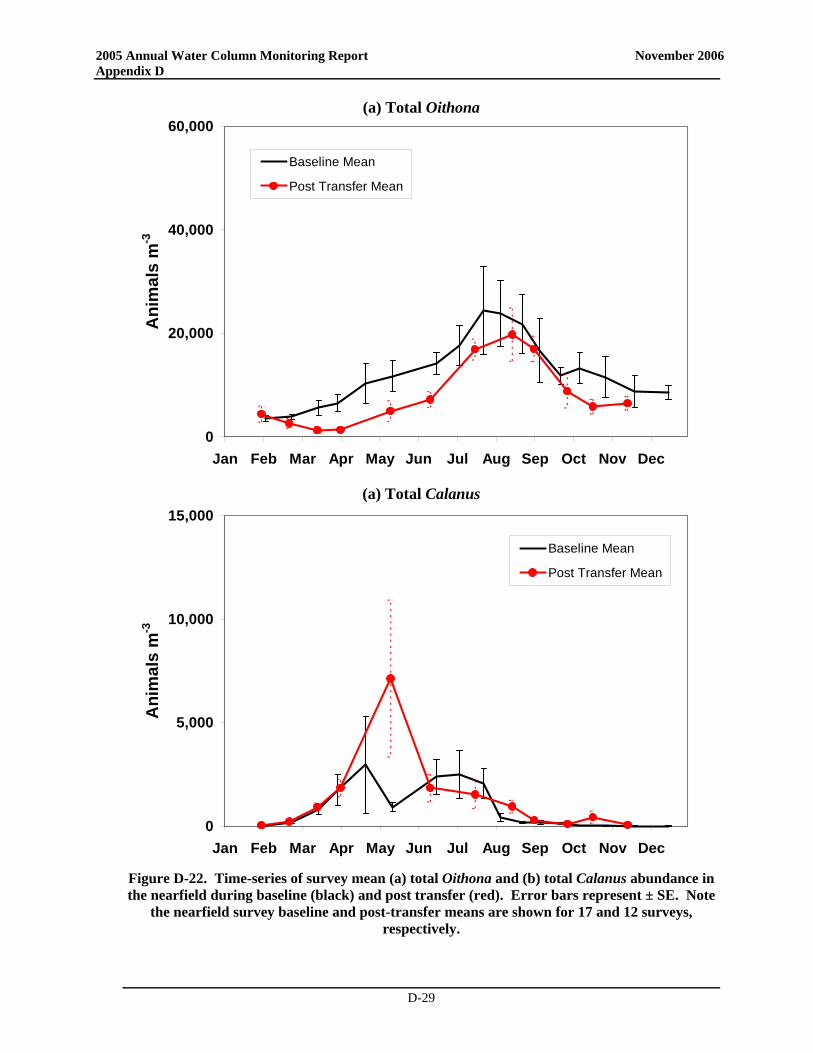
2005 Annual Water Column Monitoring Report November 2006 Appendix D
D-29
(a) Total Oithona
0
20,000
40,000
60,000
Jan Feb Mar Apr May Jun Jul Aug Sep Oct Nov Dec
Ani
mal
s m
-3Baseline Mean
Post Transfer Mean
(a) Total Calanus
0
5,000
10,000
15,000
Jan Feb Mar Apr May Jun Jul Aug Sep Oct Nov Dec
Ani
mal
s m
-3
Baseline Mean
Post Transfer Mean
Figure D-22. Time-series of survey mean (a) total Oithona and (b) total Calanus abundance in the nearfield during baseline (black) and post transfer (red). Error bars represent ± SE. Note
the nearfield survey baseline and post-transfer means are shown for 17 and 12 surveys, respectively.
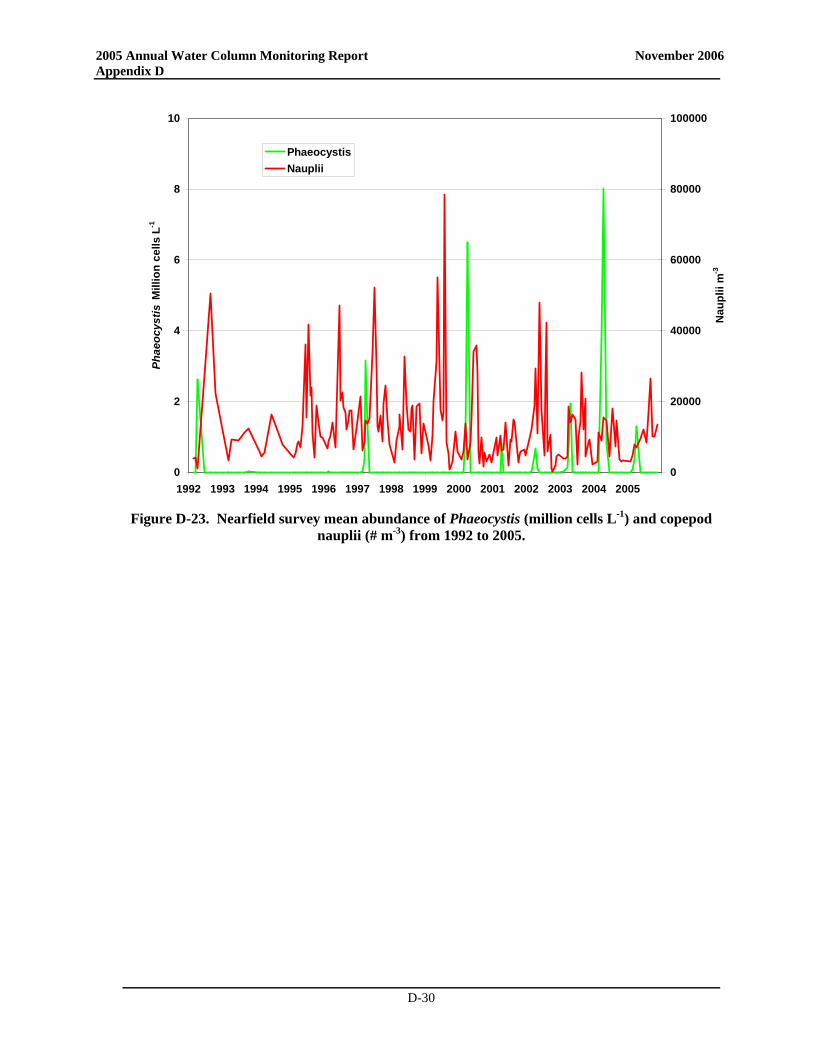
2005 Annual Water Column Monitoring Report November 2006 Appendix D
D-30
0
2
4
6
8
10
1992 1993 1994 1995 1996 1997 1998 1999 2000 2001 2002 2003 2004 2005
Phae
ocys
tis M
illio
n ce
lls L
-1
0
20000
40000
60000
80000
100000
Nau
plii
m-3
PhaeocystisNauplii
Figure D-23. Nearfield survey mean abundance of Phaeocystis (million cells L-1) and copepod
nauplii (# m-3) from 1992 to 2005.
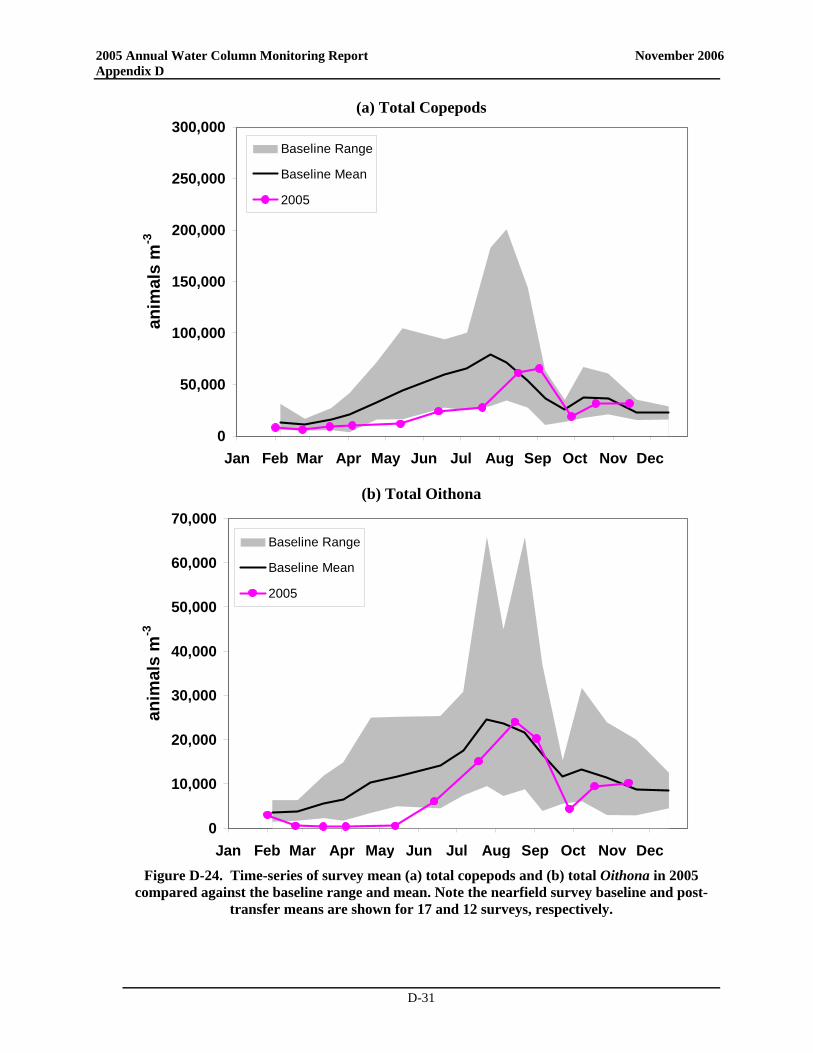
2005 Annual Water Column Monitoring Report November 2006 Appendix D
D-31
(a) Total Copepods
0
50,000
100,000
150,000
200,000
250,000
300,000
Jan Feb Mar Apr May Jun Jul Aug Sep Oct Nov Dec
anim
als
m-3
Baseline Range
Baseline Mean
2005
(b) Total Oithona
0
10,000
20,000
30,000
40,000
50,000
60,000
70,000
Jan Feb Mar Apr May Jun Jul Aug Sep Oct Nov Dec
anim
als
m-3
Baseline Range
Baseline Mean
2005
Figure D-24. Time-series of survey mean (a) total copepods and (b) total Oithona in 2005
compared against the baseline range and mean. Note the nearfield survey baseline and post-transfer means are shown for 17 and 12 surveys, respectively.
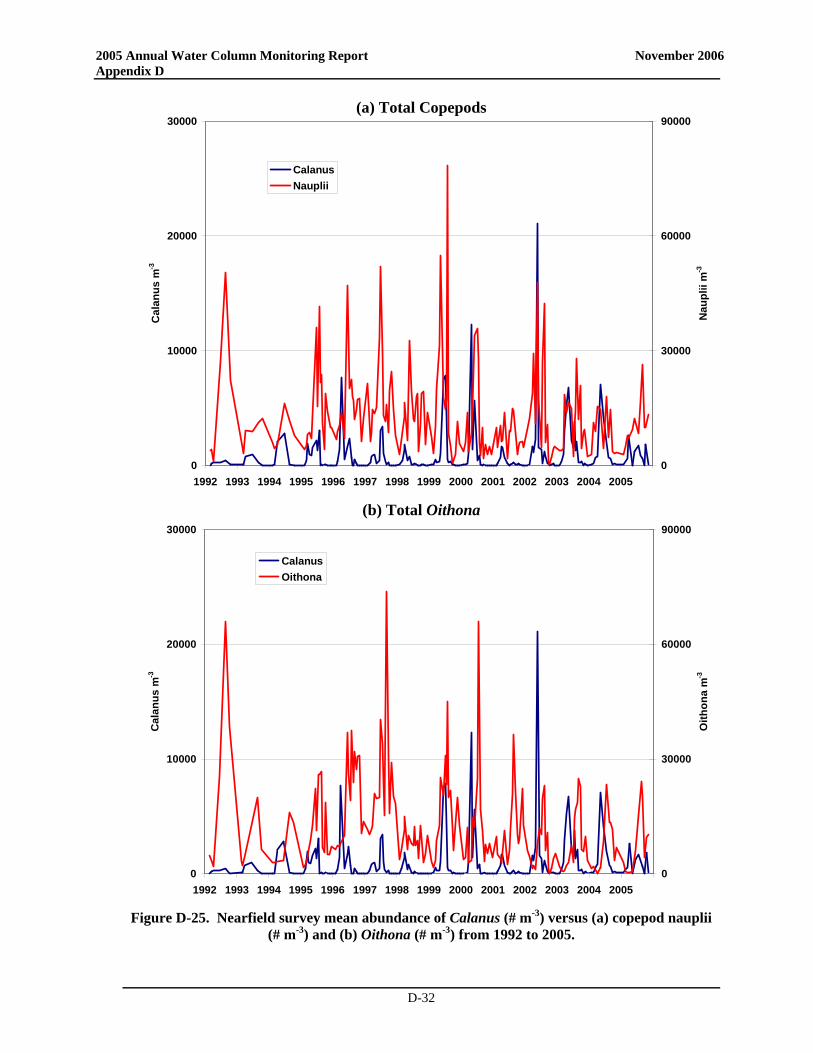
2005 Annual Water Column Monitoring Report November 2006 Appendix D
D-32
(a) Total Copepods
0
10000
20000
30000
1992 1993 1994 1995 1996 1997 1998 1999 2000 2001 2002 2003 2004 2005
Cal
anus
m-3
0
30000
60000
90000
Nau
plii
m-3
CalanusNauplii
(b) Total Oithona
0
10000
20000
30000
1992 1993 1994 1995 1996 1997 1998 1999 2000 2001 2002 2003 2004 2005
Cal
anus
m-3
0
30000
60000
90000
Oith
ona
m-3
CalanusOithona
Figure D-25. Nearfield survey mean abundance of Calanus (# m-3) versus (a) copepod nauplii
(# m-3) and (b) Oithona (# m-3) from 1992 to 2005.

Massachusetts Water Resources AuthorityCharlestown Navy Yard
100 First AvenueBoston, MA 02129
(617) 242-6000http://www.mwra.state.ma.us