2.0050916 239 - apps.dtic.mil
TRANSCRIPT

.......... EC Category: HEALTH AND SAFETY
W.
EXPERIMENTAL EVALUATION OF THERADIATION PROTECTION AFFORDED BYRESIDENTIAL STRUCTURES AGAINSTDISTRIBUTED SOURCES
J. A. Auxier, J. 0. Buchanan,
C. Eisenhauer, and H. E. Menker
2.0050916 239Issuance date: Jan. 19, 1959
CIVIL EFFECTS TEST OPERATIONS....... ....

NOTICE
This report is published in the interest of providing information which may prove ofvalue to the reader in his study of effects data derived principally from nuclear weaponstests.
This document is based on information available at the time of preparation whichmay have subsequently been expanded and re-evaluated. Also, in preparing this reportfor publication, some classified material may have been removed. Users are cautionedto avoid interpretations and conclusions based on unknown or incomplete data.
PRINTED IN USAPrice $ 2.75. Available from the Office of
Technical Services, Department of Commerce,Washington 25. D. C.
AEC Technical Infomation Service ExtensionOak Ridge. Tennessee

EXPERIMENTAL EVALUATIONOF THE RADIATION PROTECTION
AFFORDED BY RESIDENTIAL STRUCTURESAGAINST DISTRIBUTED SOURCES
By
J. A. Auxier, J. 0. Buchanan,C. Eisenhauer, and H. E. Menker
Approved by: R. L. CORSBIE
DirectorCivil Effects Test Operations
Oak Ridge National Laboratory
and
Division of Biology and Medicine, USAEC
September 1958

TECHNICAL PARTICIPANTS
J. A. Auxier, Health Physics Division, Oak Ridge National LaboratoryA. Broido, Project Civil, University of CaliforniaJ. 0. Buchanan, Physical Sciences Office, Federal Civil Defense AdministrationC. Eisenhauer, Radiation Physics Laboratory, National Bureau of StandardsF. N. FitzSimons, Federal Civil Defense AdministrationH. E. Menker, Chemistry Development, Tracerlab, Inc.W. W. Ogg, Health Physics Division, Oak Ridge National LaboratoryR. Putz, Project Civil, University of CaliforniaR. H. Smith, Tracerlab, Inc.R. L. Corsbie, Director, Civil Effects Test Operations, Division of Biology and MedicineL. J. Deal, Civil Effects Test Operations, Division of Biology and MedicineN. A. Meador, Civil Effects Test Operations, Division of Biology and Medicine

ABSTRACT
A study was made to obtain information that could be used to evaluate the protection af-forded by residences against radiation due to fallout. The sources used were Co 60 and Cs 137,and the radiation dosimeters used were pocket type ionization chambers. Measurements weremade for distributed sources (400 Co60 and 20 Cs 137) and for single sources located inside thestructures (one each, 2-curie Co 60 and Cs1 3W).
Attenuation measurements were made for five houses of typical domestic design and con-struction. Several modifications were made to the houses, and the attenuation measurementswere repeated. The houses, located at the Nevada Test Site, included single- and two-storyhouses with and without basements and with light and heavy walls. For comparison with thehouse data the dose-rate distribution above an extended plane source was measured in a"phantom" house, i.e., air measurements with the instrument fixed on a framework of thin-walled aluminum tubing. Although the complete analysis of the data is not yet available, sometypical analyses are presented, and the effectiveness of some of the modifications is illustrated.
5

ACKNOWLEDGMENTS
The authors wish to express their appreciation to the several participants whose boundlessefforts brought the experiment to fruition. Also, the authors gratefully acknowledge the manyvaluable contributions made to the project by each of the following:
R. L. Corsbie, Director, Civil Effects Test Operations, Atomic Energy Commission, andhis staff, particularly N. A. Meador and L. J. Deal, for their over-all support.
G. S. Hurst and R. H. Ritchie, Oak Ridge National Laboratory, Health Physics Division,
who contributed to the planning and direction of the program.
J. S. Cheka and F. W. Sanders, ORNL, Health Physics Division, who did many calcu-
lations and helped edit the manuscript.
L. V. Spencer, Ottawa College, for his valuable suggestions both during the prepara-tions and in the field.
The Radioisotopes Sales Department, ORNL, for the extra efforts made to provide thecobalt and cesium sources.
Finally, the authors are indebted to the many persons from the participants' organizationswho helped in many ways to make the experiment a success.
6
CONTENTS
ABSTRACT . . . . . . . .
ACKNOWLEDGMENTS . . . . . . . . . . . 6
CHAPTER 1 INTRODUCTION . . . . . . . . . . 15
1.1 Background . . . . . . . . . . . . 15
1.2 Objective 15
CHAPTER 2 EXPERIMENTAL MATERIALS AND TECHNIQUES 17
2.1 Instrumentation 172.1.1 Pocket Ion Chambers 172.1.2 Use of Personnel Monitoring Instruments 172.1.3 Field-laboratory Facility 17
2.2 Sources 192.2.1 Production, Encapsulation, and Calibration 192.2.2 Calibration 19
2.3 Description of Structures 212.3.1 Phantom House 212.3.2 Two-story Wood Frame (2SWF) House 212.3.3 One-story Precast Concrete (PCC) House 242.3.4 One-story Wood Frame Rambler (WR) 242.3.5 Two-story Brick (2SB) House . 302.3.6 Reinforced-masonry-block(RMB) House 322.3.7 Elevation Relative to Average Ground Level 33
2.4 Operational Procedures 332.4.1 Radiation Background 332.4.2 Source Handling and Personnel Exposures 332.4.3 Ground-plane Distributions 332.4.4 Roof and Gutter Exposures 332.4.5 Reciprocity Placement 342.4.6 Energy Dependence and Angular Response 362.4.7 Monitoring Instrument Survey 362.4.8 Skyshine Exposure . 362.4.9 Relative Emphasis Placed on the Various Houses 362.4.10 Modifications . 44
CHAPTER 3 PRESENTATION OF DATA . . . . . . . 45
3.1 General 453.1.1 Phantom House Dose-rate Distributions
(Distributed Co 6° Sources) 45
7
CONTENTS (Continued)
3.1.2 Two-story Wood Frame (2SWF) House Dose-rateDistributions . 45
3.1.3 Precast Concrete (PCC) House Dose-rate Distributions . 463.1.4 Wood Rambler (WR) House Dose-rate Distributions 473.1.5 Two-story Brick (2SB) House Dose-rate Distributions 473.1.6 Reinforced-concrete-block (RCB) House
Attenuation Study 473.2 Reciprocity 47
3.2.1 Two-story Wood Frame (2SWF) House 473.2.2 Precast Concrete (PCC) House 483.2.3 Air Scatter 48
3.3 Energy Dependence 483.3.1 Two-story Wood Frame (2SWF) House 483.3.2 Precast Concrete (PCC) House 48
CHAPTER 4 PRELIMINARY ANALYSIS . . . . . . . . . 125
4.1 Finite Rectangular Source 1254.2 Calculation of Integrated Values from Ground Sources 126
4.3 Calculation of Shielding Factors 1294.4 Example 1304.5 General Conclusions . 132
APPENDIX A FILM BADGES . . . . . . . . . . . 133
ILLUSTRATIONS
CHAPTER 2 EXPERIMENTAL MATERIALS AND TECHNIQUES
2.1 Mobile-laboratory Installation 182.2 Partial View of Inside of Mobile Laboratory 182.3 Apparatus for Putting Wire "Spine" on Source Tubes 192.4 Phantom House Installation 202.5 Close-up of Phantom House, Showing PIC Placement 202.6 The 2SWF House 212.7 Inside View of the 2SWF House, Indicating Materials and
Relative Thickness (Prerepair) 222.8 Inside View of the 2SWF House, Indicating Materials and
Relative Thickness (Prerepair) 232.9 Partial View of the Basement of the 2SWF House, Showing
Exterior Areaway and Debris Shelter 242.10 PCC House Front and Rear Views 252.11 PCC House Living-room Interior 262.12 Rambler House Front and East-end Views 272.13 Rambler House Rear View 282.14 The 2SB House Front-quarter and Rear Views 292.15 The 2SB House Basement 302.16 Plasterboard-Plaster Arrangement in the 2SB House Before
Repairs 302.17 Exterior of Reinforced-concrete-block House . 312.18 Interior of Reinforced-concrete-block House . 322.19 Source Ring Placement at the 2SWF House for p = 25.5 Ft 342.20 Phantom House with Pulley Boards in Place 352.21 Basement Window Well Before Sandbagging 372.22 Sandbagged Basement Window Well . 37
8

ILLUSTRATIONS (Continued)
2.23 Interior View of Basement Window Well with Sandbags in Place 382.24 Basement Interior (2SWF) with Sandbags in Windows and Concrete
Blocks on Tables 382.25 Corner Debris Shelter in the 2SWF House with Concrete Blocks
(7%/4 In. High) on Top 392.26 PCC House with Living-room Openings (Exterior) Filled with
Concrete Blocks 40
2.27 Interior of the 2SWF House with Some Furniture 412.28 Interior of the 2SWF House with Some Furniture and Supplies . 422.29 Interior of the 2SWF House 43
2.30 Interior of the Rambler House with 24-in.-high Concrete-blockWall. 43
CHAPTER 3 PRESENTATION OF DATA
3.1 General Vertical Traverse Codes for All Houses 503.2 Phantom House, 3-ft Level, Sources Distributed on Floor 513.3 Phantom House, 5-ft Level, Sources Distributed on Floor 513.4 Phantom House, 11.5-ft Level, Sources Distributed on Floor 523.5 Phantom House, 3-ft Level, p = 25.5 Ft 533.6 Phantom House, 5-ft Level, p = 25.5 Ft 533.7 Phantom House, 11.5-ft Level, p = 25.5 Ft 543.8 Phantom House, 3-ft Level, p = 31.8 Ft 55
3.9 Phantom House, 5-ft Level, p = 31.8 Ft 553.10 Phantom House, 11.5-ft Level, p = 31.8 Ft 563.11 Phantom House, 3-ft Level, p = 42.5 Ft 573.12 Phantom House, 5-ft Level, p = 42.5 Ft 573.13 Phantom House, 11.5-ft Level, p = 42.5 Ft 583.14 Phantom House, 5-ft Level, p = 63.7 Ft 593.15 Phantom House, 3-ft Level, p = 127 Ft 603.16 Phantom House, 5-ft Level, p = 127 Ft 603.17 2SWF House, 3-ft Level, Basement, p = 21.2 Ft 613.18 2SWF House, 1-ft Level, First Floor, p = 21.2 Ft 623.19 2SWF House, 3-ft Level, First Floor, p = 21.2 Ft 623.20 2SWF House, 5-ft Level, First Floor, p = 21.2 Ft 633.21 2SWF House, 3-ft Level, Second Floor, p = 21.2 Ft 643.22 2SWF House, 3-ft Level, Basement, p = 25.5 Ft 653.23 2SWF House, 3-ft Level, First Floor, p = 25.5 Ft 663.24 2SWF House, 3-ft Level, Second Floor, p = 25.5 Ft 673.25 2SWF House, 3-ft Level, Basement, p = 31.8 Ft 683.26 2SWF House, 3-ft Level, First Floor, p = 31.8 Ft 693.27 2SWF House, 3-ft Level, Second Floor, p = 31.8 Ft 703.28 2SWF House, 3-ft Level, Basement, Furniture in House,
p = 31.8 Ft 71
3.29 2SWF House, 6.5-ft Level, Basement, Furniture inHouse, p = 31.8 Ft 71
3.30 2SWF House, 3-ft Level, First Floor, Furniture in House,p = 31.8 Ft 72
3.31 2SWF House, 3-ft Level, Second Floor, Furniture in House,p = 31.8 Ft 73
3.32 2SWF House, 3-ft Level, Basement, p = 42.5 Ft 743.33 2SWF House, 3-ft Level, First Floor, p = 42.5 Ft 753.34 2SWF House, 3-ft Level, Second Floor, p = 42.5 Ft 763.35 2SWF House, 3-ft Level, Basement, p = 63.7 Ft 773.36 2SWF House, 3-ft Level, First Floor, p = 63.7 Ft 78
9

ILLUSTRATIONS (Continued)
3.37 2SWF House, 3-ft Level, Second Floor, p = 63.7 Ft . 793.38 2SWF House, 3-ft Level, Basement, Fill-in Sources 803.39 2SWF House, 3-ft Level, First Floor, Fill-in Sources 813.40 2SWF House, 3-ft Level, Second Floor, Fill-in Sources 823.41 2SWF House, 3-ft Level, Basement, Sources on West Half of
Roof 833.42 2SWF House, 3-ft Level, First Floor, Sources on West Half of
Roof 843.43 2SWF House, 3-ft Level, Second Floor, Sources on West Half of
Roof 853.44 2SWF House, 3-ft Level, Basement, Sources on Entire Roof
Area 863.45 2SWF House, 3-ft Level, First Floor, Sources on Entire Roof
Area 873.46 2SWF House, 3-ft Level, Second Floor, Sources on Entire
Roof Area 883.47 2SWF House, 3-ft Level, Basement, Sources on Entire
Roof Area, Furniture in House 893.48 2SWF House, 6.5-ft Level, Basement, Sources on Entire
Roof Area, Furniture in House 893.49 2SWF House, 3-ft Level, First Floor, Sources on Entire
Roof Area, Furniture in House 903.50 2SWF House, 3-ft Level, Second Floor, Sources on Entire
Roof Area, Furniture in House 913.51 2SWF House, 5-ft Level, Basement, Sources in Roof Gutter
(East) 923.52 2SWF House, 5-ft Level, First Floor, Sources in Roof Gutter
(East) 923.53 2SWF House, 5-ft Level, Second Floor, Sources in Roof Gutter
(East) 93
3.54 PCC House, 3-ft Level, p = 25.5 Ft . 933.55 PCC House, 5-ft Level, p = 25.5 Ft . 943.56 PCC House, 3-ft Level, p = 42.5 Ft . 953.57 PCC House, 5-ft Level, p = 42.5 Ft . 953.58 PCC House, 7-ft Level, p =42.5 Ft . 963.59 PCC House, 3-ft Level, p = 42.5 Ft, Concrete Blocks in Exterior
Openings of Living Room 963.60 PCC House, 5-ft Level, p = 42.5 Ft, Concrete Blocks in Exterior
Openings of Living Room 973.61 PCC House, 3-ft Level, Sources on Roof . 983.62 PCC House, 5-ft Level, Sources on Roof . 983.63 PCC House, 1-ft Level, Sources on Roof over Northwest
Bedroom . 993.64 PCC House, 3-ft Level, Sources on Roof over Northwest
Bedroom . 993.65 PCC House, 5-ft Level, Sources on Roof over Northwest
Bedroom . 1003.66 Rambler House, 3-ft Level, p = 25.5 Ft 1003.67 Rambler House, 5-ft Level, p = 25.5 Ft 1013.68 Rambler House, 3-ft Level, p = 42.5 Ft, Concrete Blocks 24 In.
High Along Exterior Walls of Living-Dining Area 1023.69 Rambler House, 5-ft Level, p = 42.5 Ft, Concrete Blocks 24 In.
High Along Exterior Walls of Living-Dining Area 1023.70 Rambler House, 3-ft Level, Sources on Roof 1033.71 Rambler House, 5-ft Level, Sources on Roof 103
10

ILLUSTRATIONS (Continued)
3.72 2SB House, 3-ft Level, Basement, p =25.5 Ft, Sandbags in
Four Southernmost Windows 1043.73 2SB House, 5-ft Level, Basement, p = 25.5 Ft, Sandbags in
Four Southernmost Windows 1043.74 2SB House, 3-ft Level, First Floor, p = 25.5 Ft, Sandbags in
Four Southernmost Basement Windows 1053.75 2SB House, 5-ft Level, First Floor, p = 25.5 Ft, Sandbags in
Four Southernmost Basement Windows 1063.76 2SB House, 3-ft Level, Basement, p = 42.5 Ft, Sandbags in
Four Southernmost Basement Windows 1073.77 2SB House, 5-ft Level, Basement, p = 42.5 Ft, Sandbags in
Four Southernmost Basement Windows 1073.78 2SB House, 3-ft Level, First Floor, p = 42.5 Ft, Sandbags in
Four Southernmost Basement Windows 1083.79 2SB House, 5-ft Level, First Floor, p = 42.5 Ft, Sandbags in
Four Southernmost Basement Windows 1083.80 RMB House, Relative Dose Rate as a Function of Horizontal
Position and Height Above the Floor; Source Height = 47 In. 1093.81 2SWF House, Reciprocity Exposure, Co6° Source 3 Ft Above
First Floor, Center of House . . 1103.82 2SWF House, Reciprocity Exposure, Co 60 Source 3 Ft Above
Second Floor, Center of House . • 1113.83 2SWF House, Reciprocity Exposure, Co 6° Source 3 Ft Above
Floor at Center of North Area of Basement 1123.84 2SWF House, Reciprocity Exposure, Co 60 Source 3 Ft Above
First Floor, 1 Ft from North End at Center of House 1133.85 2SWF House, Survey Instrument Readings, 3 Ft Above Basement
Floor, 8.4-millicurie Co 60 Source 3 Ft Above Center ofFirst Floor 114
3.86 2SWF House, Survey Instrument Readings, 3 Ft AboveFirst Floor and I In. Above Ground, 8.4-millicurie Co 60
Source 3 Ft Above Center of First Floor. 114
3.87 2SWF House, Survey Instrument Readings, 3 Ft Above SecondFloor, 8.4-millicurie Co 60 Source 3 Ft Above Center of FirstFloor 114
3.88 2SWF House, Survey Instrument Readings, 3 Ft Above BasementFloor, 8.4-millicurie Co 6° Source 3 Ft Above Center of SecondFloor 115
3.89 2SWF House, Survey Instrument Readings, 3 Ft Above First Floorand 1 In. Above Ground, 8.4-millicurie Co 6° Source 3 Ft AboveCenter of Second Floor 115
3.90 2SWF House, Survey Instrument Readings, 3 Ft Above Second Floor,8.4-millicurie Co 60 Source 3 Ft Above Center of Second Floor 116
3.91 2SWF House, Survey Instrument Readings, I In. Above Roof, 8.4-millicurie Co 60 Source 3 Ft Above Center of Second Floor 116
3.92 PCC House, Reciprocity Exposure, Source 3 Ft Above Floor atPoint near Center of House 117
3.93 PCC House, Reciprocity Exposure, 2.1-curie Source 3 FtAbove Center of Northwest Bedroom Floor _ . 118
3.94 PCC House, Reciprocity Exposure, 2.1-curie Co 60 Source, DoseRates at Center of Northwest Bedroom 3 Ft Above Floor. 119
3.95 Skyshine Exposure, 2.1-curie Co 60 Source 3 Ft Below GroundLevel 120
3.96 2SWF House, Cs137 Source 3 Ft Above Center of First Floor 1213.97 2SWF House, Cs137 Source 3 Ft Above Center of Second Floor . 122
11

ILLUSTRATIONS (Continued)
3.98 PCC House, 3-ft Level, 19 Cs137 Sources on Roof in UniformArray_ 123
3.99 PCC House, 3-ft Level, Cs 137 Sources Distributed over NorthwestBedroom. 123
3.100 PCC House, 5-ft Level, Cs 137 Sources Distributed over NorthwestBedroom 124
CHAPTER 4 PRELIMINARY ANALYSIS
4.1 Relation of Variables p, 0, and h 1264.2 Dose Rate as a Function of Height Above the Plane . 127
4.3 Dose Rate vs. Distance from Center for a RectangularSource Distribution 128
4.4 Dose Rate vs. Distance p for Phantom and 2SWF Houses,Ring Sources . 128
TABLES
CHAPTER 2 EXPERIMENTAL MATERIALS AND TECHNIQUES
2.1 Relative Elevations 33
2.2 Ground Ring Radii 34
CHAPTER 3 PRESENTATION OF DATA
3.1 Exposure Parameters 49
3.2 Vertical Traverses for the Phantom House for SourcesDistributed on the Floor 52
3.3 Vertical Traverses for the Phantom House for p = 25.5 Ft 543.4 Vertical Traverses for the Phantom House for p = 31.8 Ft 563.5 Vertical Traverses for the Phantom House for p = 42.5 Ft 583.6 Vertical Traverses for the Phantom House for p = 63.7 Ft 593.7 Vertical Traverses for the Phantom House for p = 127 Ft 603.8 Vertical Traverses for the Basement of the 2SWF House for
p = 21.2 Ft . 61
3.9 Vertical Traverses for the First Floor of the 2SWF House forp = 21.2 Ft 63
3.10 Vertical Traverses for the Basement of the 2SWF House forp = 25.5 Ft 65
3.11 Vertical Traverses for the First Floor of the 2SWF House forp = 25.5 Ft 66
3.12 Vertical Traverses for the Second Floor of the 2SWF House forp = 25.5 Ft 67
3.13 Vertical Traverses for the Basement of the 2SWF House forp = 31.8 Ft 68
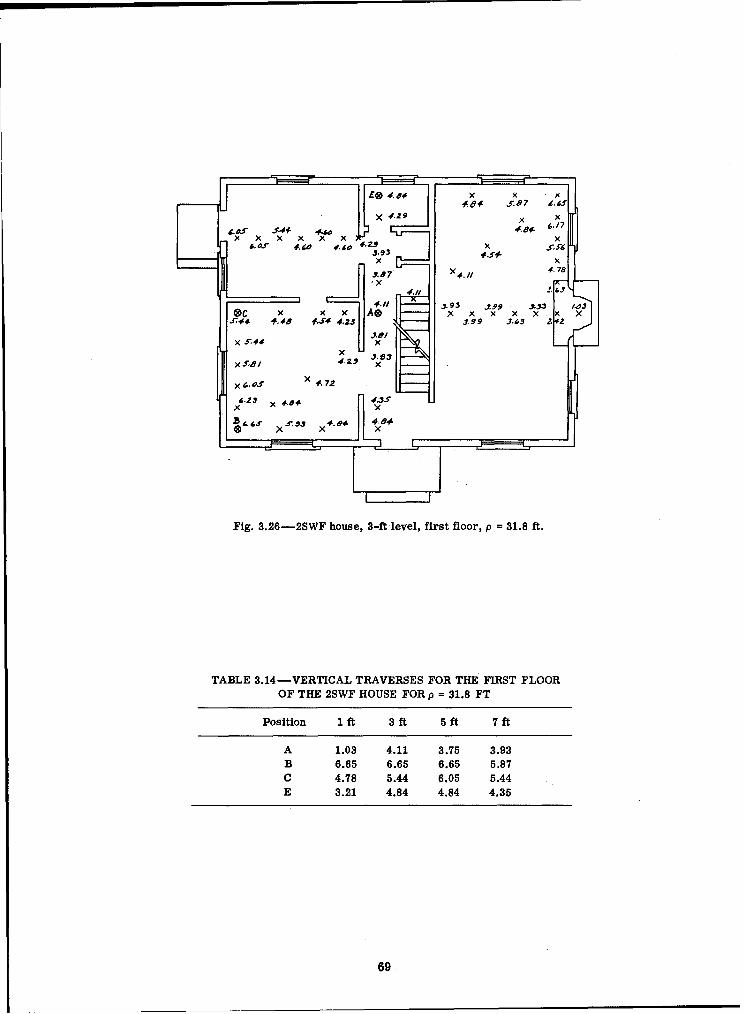
3.14 Vertical Traverses for the First Floor of the 2SWF House forp = 31.8 Ft 69
3.15 Vertical Traverses for the Second Floor of the 2SWF House forp = 31.8 Ft 70
3.16 Vertical Traverses for the Basement of the 2SWF House(Containing Furniture) for p = 31.8 Ft 71
3.17 Vertical Traverses for the First Floor of the 2SWF House(Containing Furniture) for p = 31.8 Ft 72
3.18 Vertical Traverses for the Second Floor of the 2SWF House(Containing Furniture) for p = 31.8 Ft 73
12

TABLES (Continued)
3.19 Vertical Traverses for the Basement of the 2SWF House forp = 42.5 Ft 74
3.20 Vertical Traverses for the First Floor of the 2SWF House forp = 42.5 Ft 75
3.21 Vertical Traverses for the Second Floor of the 2SWF House for
p = 42.5 Ft 763.22 Vertical Traverses for the Basement of the 2SWF House for
p = 63.7 Ft 773.23 Vertical Traverses for the First Floor of the 2SWF House for
p = 63.7 Ft 783.24 Vertical Traverses for the Second Floor of the 2SWF House for
p = 63.7 Ft 793.25 Vertical Traverses for the Basement of the 2SWF House for
Fill-in Sources 803.26 Vertical Traverses for the First Floor of the 2SWF House for
Fill-in Sources 813.27 Vertical Traverses for the Second Floor of the 2SWF House for
Fill-in Sources 823.28 Vertical Traverses for the Basement of the 2SWF House for
Sources on West Half of Roof 833.29 Vertical Traverses for the First Floor of the 2SWF House for
Sources on West Half of Roof 843.30 Vertical Traverses for the Second Floor of the 2SWF House for
Sources on West Half of Roof 853.31 Vertical Traverses for the Basement of the 2SWF House for
Sources on Entire Roof Area 863.32 Vertical Traverses for the First Floor of the 2SWF House for
Sources on Entire Roof Area 873.33 Vertical Traverses for the Second Floor of the 2SWF House for
Sources on Entire Roof Area 6883.34 Vertical Traverses for the Basement of the 2SWF House
(Containing Furniture) for Sources on Entire Roof Area 893.35 Vertical Traverses for the First Floor of the 2SWF House
(Containing Furniture) for Sources on Entire Roof Area 903.36 Vertical Traverses for the Second Floor of the 2SWF House
(Containing Furniture) for Sources on Entire Roof Area 913.37 Vertical Traverses for the PCC House for p = 25.5 Ft 943.38 Vertical Traverses for the PCC House (with Concrete Blocks in
Exterior Openings of Living Room) for p = 42.5 Ft 973.39 Vertical Traverses for the PCC House for Roof Sources 983.40 Vertical Traverses for the Rambler House for p = 25.5 Ft 1013.41 Vertical Traverses for the Rambler House for p = 42.5 Ft 1023.42 Vertical Traverses for the Rambler House for Sources on the
Roof .1033.43 Vertical Traverses for the Basement of the 2SB House for
p = 25.5 Ft. 1053.44 Vertical Traverses for the First Floor of the 2SB House for
p =- 25.5 Ft. 1063.45 Vertical Traverses for the Basement of the 2SB House for
p = 42.5 Ft. 1073.46 Vertical Traverses for the First Floor of the 2SB House for
p = 42.5 Ft. 1083.47 Vertical Traverses for the PCC House for Csi137 Sources on
the Roof 123
13

TABLES (Continued)
3.48 Vertical Traverses for the PCC House for Cs 1 37 Sources overthe Northwest Bedroom .. .- .<.-.< ..... . .... - . 124
CHAPTER 4 PRELIMINARY ANALYSIS
4.1 A' Log Cos 0 as a Function of Height (h) 1274.2 Experimental Radiation Reduction Factors Due to Modifications in
Test Structures . 131
APPENDIX A FILM BADGES
A. 1 Comparison of Film and PIC Readings Normalized to theSame Calibration 133
14

Chapter 1
INTRODUCTION
1.1 BACKGROUND
There has been a need for specific experimental data concerning the protection affordedoccupants of typical homes against radiation from fallout which could result from any enemyattack. Previous work in this field has been limited largely to theoretical calculation of pro-tection factors for simple geometric configurations. 1- 8 Some work has been done in GreatBritain and Canada with distributed sources but on residences not necessarily typical of thosein the United States.9-11 Because of the urgent need for better data, the present project wasestablished.
To minimize the precautions necessary to protect personnel not connected with the pro-gram and to make optimum use of the time available, it was decided to utilize certain of theresidential structures constructed at the Nevada Test Site (NTS) for use in the Teapot seriesof 1955. These structures required minimum modification for the present use. In addition,since they were isolated from each other, certain of the operations could proceed simultane-ously because sources could be used at one or more houses without increasing the radiationbackground at the other houses.
1.2 OBJECTIVE
The over-all objective of the exercise was to provide specific experimental informationon the degree of protection afforded by several residential structures, differing in design andtype of construction material, against radiation from distributed sources.
Specific objectives include the following:1. Determination of the shielding provided by houses against radiation from a contaminated
ground plane2. Determination of the shielding factors for houses against radiation from sources uni-
formly deposited on the roofs3. Determination of the effectiveness of various permanent or emergency modifications in
improving the shielding factors of the houses4. Determination of the energy dependence of the shielding factors for gamma radiations
from Co6c and Cs 137
5. Determination of the range of validity of interchanging source and detector (reciprocity)for evaluating shielding factors
A less specific objective was the procurement of information concerning the feasibility ofdevelopment of a test vehicle for use in radiation measurements on residential structures.This part of the study was the responsibility of personnel of Tracerlab, Inc., and will be re-ported by them.
This information is made available in its present form to provide results as promptly aspossible to those concerned with theoretical and planning studies on radiation protection forthe general population.
15

REFERENCES
1. C. W. Malich and L. A. Beach, Fallout Protection Afforded by Standard Enlisted Men'sBarracks, Report NRL-4886, March 1957.
2. C. W. Malich and L. A. Beach, Radiation Protection Afforded by Barracks and Under-ground Shelters, Report NRL-5017, September 1957.
3. Bureau of Yards and Docks, Studies in Atomic Defense Engineering, Report NAVDOCKS-P-290, January 1957.
4. J. E. Hill, Effects of Environment in Reducing Dose Rates Produced by Radioactive Falloutfrom Nuclear Explosions, Report RM-1285-1, Sept. 28, 1954.
5. Home Office, Scottish Home Dept., Assessment of the Protection Afforded by BuildingsAgainst Gamma Radiation from Fallout, May 1957. (Official Use Only)
6. M. J. Berger and J. C. Lamkin, Sample Calculations of Gamma-ray Penetration intoShelters: Contributions of Skyshine and Roof Contamination, Report NBS-2827, February1958.
7. J. H. Hubbell, Dose Due to Distributed Gamma-ray Sources, Report NBS-4928, November1956.
8. R. T. Graveson, Radiation Protection Within a Standard Housing Structure, Report NYO-4714, November 1956.
9. N. G. Stewart et al., The Shielding Provided by a Brick House Against the Gamma Radiationfrom a Uniformly Deposited Source. Experiments with Co06, Report FWE-104, October1955. (Official Use Only)
10. J. R. Cunningham et al., Protection Factors for Houses Using Radioactive Sources, ReportDRCL-260, November 1957.
11. A. G. McDonald, The Penetration of Gamma Radiation from a Uniform Contamination intoHouses-A First Report on Some Field Trials, Report CD/SA-69 (Home Office), January1956.
16

Chapter 2
EXPERIMENTAL MATERIALS AND TECHNIQUES
2.1 INSTRUMENTATION
2.1.1 Pocket Ion Chambers
Pocket ionization chambers (PIC's), Victoreen model 362, were used because of theirimmediate availability in sufficient quantity, reproducibility and accuracy of response, andconvenience of use and readability. Victoreen model 240 projection minometers were usedfor charging and reading the PIC's. Prior to the experiment the energy response and angularresponse as a function of X and gamma radiation energy were reevaluated. Day' had reportedthe results of such an evaluation of energy response in 1950, and his results were verified.The adverse response (increased reading per unit dose at effective energy* values of less than300 key) was readily corrected to within ±10 per cent for effective energies as low as 20 keyby covering the cap end (to one-fourth the over-all instrument length) with 0.040 in. of tin. Inaddition, the tin greatly improved the angular response. The results of these studies will bepublished in detail at a later date.
The instruments were calibrated with a radium standard that had been calibrated by theNational Bureau of Standards (NBS). A secondary Co6 0 standard was compared to the radium
source and taken to NTS for use in checking calibration.
2.1.2 Use of Personnel Monitoring Instruments
Portable survey meters of several types were used for preliminary measurements toestimate exposure times for the PIC's. One set of exposures was made in which the small(8.4-millicurie) Co 60 standard source was placed at each of two locations in a house, and the
area in and about the house (including the roof) was surveyed with a Geiger-Mueller (G-M)type instrument. An ionization-chamber survey instrument was used in another exposure at ahouse having walls that varied considerably in density from point to point (reinforced-masonry-
block house).
2.1.3 Field-laboratory Facility
A 28-ft van type trailer provided with voltage-regulating transformers and air conditioning
was used as a field laboratory; it is shown in Fig. 2.1, positioned on blocks for stability andleveling. A partial view of the interior is shown in Fig. 2.2. The boxlike structure on the flooris the source shipping container (4 in. of lead plus 3/4 in. of iron), which was bolted to theframework of the trailer. The projection type minometers can also be seen in the figure.
Shortly after arrival of the trailer at NTS, the sources were removed from the trailer and
stored elsewhere to eliminate possible interference with PIC readings.
-*The effective energy of a heterochromatic X-ray beam is the energy of a monochromatic
beam that has the same absorption coefficient as the given beam in an incremental thickness of
standard filter material.
17

Fig. 2.1-• Mobile-laboratory installation.
Fig. 2.2-Partial view of inside of mobile laboratory.
18
T ' , i ,

2.2 SOURCES
2.2.1 Production, Encapsulation, and Calibration
The following sources were procured for the experiment:1. Four hundred 4.15-millicurie Cos0 sources2. One 2.10-curie Co 60 source3. Twenty 23-millicurie Cs 13 sources4. One 1.82-curie Cs 1 3 7 source5. One 8.40-millicurie Co 60 source (secondary standard)
To obtain the 400 Co 6° sources of the desired uniformity of activity of :L5 per cent in thetime available, 500 pieces of cobalt (five cans containing 100 sources each) were placed in theOak Ridge National Laboratory (ORNL) X-10 graphite reactor for three weeks. Based on a 10per cent random sample, sources from four of the cans were within -5 per cent of the meanvalue of 4.15 millicuries.
Fig. 2.3-Apparatus for putting wire "spine" on source tubes.
The sources were gold plated prior to activation. After activation the sources werecemented with Tygobond at 2-ft intervals into Flexite standard extended plastic tubing of 0.133in. inside diameter and 0.030 in. wall thickness. One hundred sources were put into tubing oneach of four spools. Exposure to temperatures encountered in the desert allowed the tubing tostretch during placement. This stretching was prevented by fastening a flexible wire (strandedand covered field signal wire) with plastic electrical tape midway between sources, i.e., at 2-ftintervals. The lead shields and a source spool used for this operation are shown in Fig. 2.3.
Each of the Cs 07 sources was sealed in two concentric stainless-steel capsules (1A4 in.diameter by I%/4 in. long, outside dimensions). These sources were kept in a small lead con-tainer and were not placed in plastic tubing.
The 2.10-curie Co 60 source was in an aluminum capsule (14 in. diameter by 5/8 in. long).
2.2.2 Calibration
Source calibrations and intercomparisons were made at the Test Site. Each large sourcewas compared to the secondary standard source. The small cesium sources had been checkedfor uniformity before delivery and were compared as a group; they were placed in pockets in a
19

[ L; i-
Fig. 2.4-Phantom house installation.
Fig. 2.5 -Close-up of phantom house, showing PIC placement.
20

4- by 5-in. array on a cardboard holder for comparison. Comparisons were accomplished at asource-detector separation of 10.0 ft and a height of 6 ft 3 in. The tubes containing 100 Co60
sources were each wound onto an aluminum spool '/8 in. in width for calibration. This spoolwas assumed to be a monolayer coil of sources 2 ft in diameter with negligible self-absorption.
2.3 DESCRIPTION OF STRUCTURES
2.3.1 Phantom House
A series of measurements with no attenuating material between the source and the detec-tor was required to serve as a basis for evaluation of attenuation. A "phantom house" was de-fined, comprising an area equivalent to that of the two-story wood frame house, on the dry lakebed of Yucca Flat, a large unobstructed level plain. A framework of thin-walled (1/2 in. diame-ter) aluminum tubing fastened with standard laboratory clamps was erected to hold the PIC's
Fig. 2.6 -The 2SWF house.
(Fig. 2.4). The one-quarter house was 16 by 12 ft. The frame included horizontal tubes at the3-, 5-, and 11-ft levels and vertical members at the corners extending to 15 ft. The PIC'swere taped to the support tubing at appropriate intervals (Fig. 2.5). The axes of the PIC'swere placed horizontally for the "floor" exposures and vertically for the circular ring expo-sures.
2.3.2 Two-story Wood Frame (2SWF) House
This house was a two-story frame house having a center hall and a basement with a re-inforced-concrete foundation (Fig. 2.6). The exterior dimensions of the house were 24 ft 8 in.
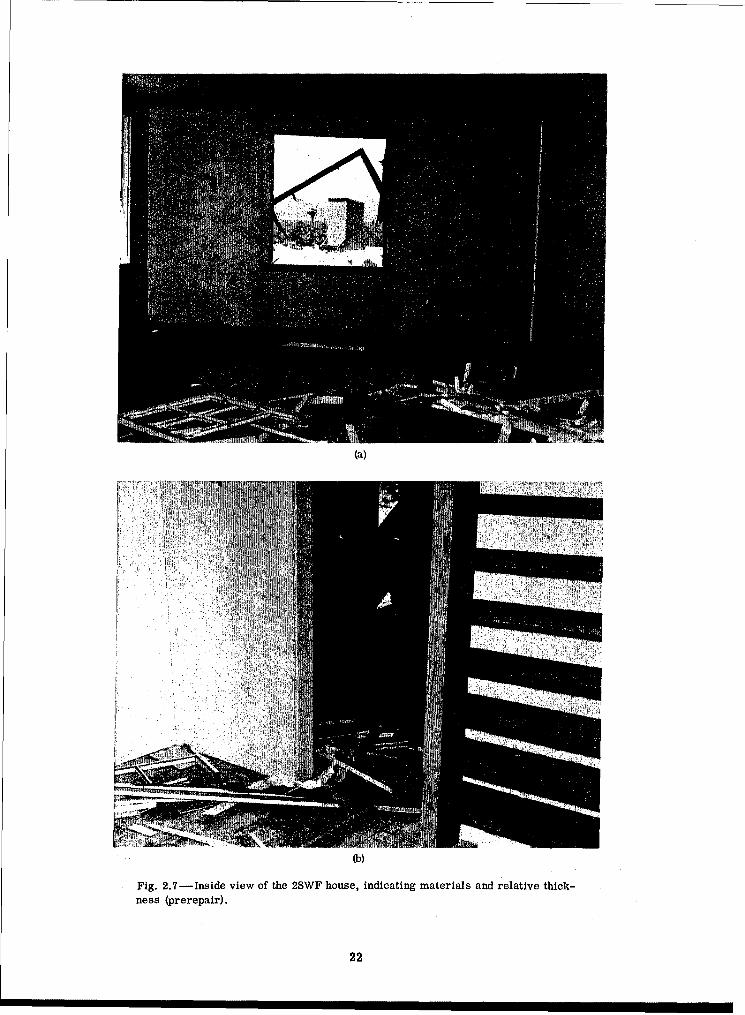
by 33 ft 4 in. The house is similar in layout to houses that suffered blast damage in the 1953test series; however, some design changes were made, based on the results of that test pro-gram, to strengthen the structure as much as possible within an increase of approximately 10per cent in the building cost. A brief description of this house and also of the others used inthis exercise with additional pictures are included in Report ITR-1194, Operation Teapot. Allframing was of 2- by 4-in. studs placed 16 in. apart. Exterior walls contained about 2 in. ofwood siding, and interior walls were faced with %/8-in. plywood (Figs. 2.7 and 2.8). The first
21
(a)
Fig. 2.7 -Inside view of the 2SWF house, indicating materials and relative thick-ness (prerepair).
22

NA)
Cd
cc
0
A)
23

floor was supported by 2- by 10-in. joists; the second floor, by 2- by 8-in. joists; the atticfloor, by 2- by 8-in. joists; and the roofing, by 2- by 10-in. rafters, all spaced on 16-in.centers. The basement was made of 8-in. reinforced-concrete exterior walls and three 8-in.interior walls, two of which served as the walls of a concrete basement shelter. In addition,
Fig. 2.9 -Partial view of the basement of the 2SWF house, showing exteriorareaway and debris shelter.
there was a wood-frame basement shelter in one corner (Fig. 2.9). The area surrounding thehouse was cleared and leveled out to a distance of 65 ft from the center of the house. Thevariation in elevation was less than 1 in. within this cleared area. A similar area was clearedaround each house used in this exercise.
2.3.3 One-story Precast Concrete (PCC) House
This single-story house was constructed on a concrete floor slab. It consisted of precastlightweight (98 lb/cu ft) expanded shale-aggregate concrete walls and partition panels, whichwere joined by welding matching steel lugs, and similar flat-roof panels anchored to the wallsby special countersunk and grouted connectors to the wall steel. Figure 2.10 shows two ex-terior views of this house, and Fig. 2.11 shows an interior view. All panels were 6 in. thick.The outside dimensions were 40 by 271/, ft, exclusive of a 2-ft overhang on all sides. The thickwooden window coverings shown in Fig. 2.11 were removed, but for exposures 28 and 29 theliving-room (northeast) window and door were filled with 31 h-in.-thick concrete blocks (151lb/cu ft). It was not expected that the thin-walled steel pipe previously installed in certainrooms of this house would produce anomalies in the measurements.
2.3.4 One-story Wood Frame Rambler (WR)
This house was of conventional design except that it contained an aboveground shelter con-sisting of bathroom walls, floor, and ceiling of 8-in. reinforced concrete, with a blast doorand window shutter. The outside dimensions were 40 ft by 25 ft 4 in. (Figs. 2.12 and 2.13). Theinterior walls were faced with '/,-in. plasterboard.
24

(a)•I i-• i~~~~~~i!..... • -- .: :i -.-......•... •
t.X.
(b)
Fig. 2.10-PCC house (a) front and (b) rear views.
25
00
26

-IN
A-A
Fig. 2.12-Rambler house (a) front and (b) east-end views.
27

14
2I
28

~~~~~~~ME ........... • • . . i!i•• ,••
(a)
(b)
Fig. 2.14-The 2SB house (a) front-quarter and (b) rear views.
29

Fig. 2.15 -The 2SB house basement.
Fig. 2.16-Plasterboard-plaster arrangement in the 2SB house before repairs.
2.3.5 Two-story Brick (2SB) House
This house was a two-story and basement, center hall, wall-bearing house of 4-in. brickand 4-in. cinder block, with floors, partitions, and roof of wood framing and basement founda-tion walls of cinder block (Figs. 2.14 and 2.15). It is similar in design and layout to the two-story frame house described in Sec. 2.3.2, but the construction generally was conventional, noattempt having been made to strengthen the house through special design. The roof had been soseverely damaged that it was judged to be inexpedient to repair it for use during this exercise.Interior wall construction in this house was of sheet rock (Fig. 2.16).
30

(a)
(b3)
Fig. 2.17-Exterior of reinforced-concrete-block house.
31

(a)
(b)
Fig. 2.18-Interior of reinforced-concrete-block house.
2.3.6 Reinforced-masonry-block (RMB) House
This was a one-story house built of reinforced expanded shale-aggregate masonry blocks(Fig. 2.17). The 8-in. walls and partitions were reinforced with steel rods, which wereanchored into the floor slab and the precast lightweight concrete roof slabs (Fig. 2.18). Thewalls were also reinforced with horizontal steel at two levels, and openings were spanned byreinforced lintel courses. The outside dimensions were 29 ft 4 in. by 27 ft 4 in., exclusive of a2-ft roof overhang. Owing to the presence of hollow and filled cores, the density and hence theattenuation for gamma radiation was expected to vary widely from point to point.
32

2.3.7 Elevation Relative to Average Ground Level
The elevations of the various components of the test houses relative to the average groundlevel are shown in Table 2.1.
TABLE 2.1-RELATIVE ELEVATIONS
Basement First Second Roof RoofHouse floor Foundation floor floor peak slope
2SWF 6 ft 6 in. 63/4 in. 1 ft 8 in. 9 ft 10 in. 24 ft 21 /2 in. 5:12PCC 2 ft 1/2 in. 10 ft 61/2 in. FlatWR 1 ft 75/8 in. 14 ft 6 in. 4:122SB 6 ft 7/ 2 in. 3 in. 1 ft 61/2 in. 9 ft 81/2 in. 24 ft 3/4 in. 5:12RMB 1 ft 9 ft 6 in. Flat
2.4 OPERATIONAL PROCEDURES
2.4.1 Radiation Background
Radiation background surveys were made at each of the locations to be used. Although thegeneral area had a detectable low-level contamination, readings taken after grading and level-ing had been completed indicated that, in general, no background corrections to the PIC read-ings would be necessary for this exercise. The background immediately surrounding the two-story wood frame house, however, was approximately 0.04 mr/hr, as measured with theportable G-M survey instrument; this limited the extent of the area in which instruments wereplaced in exposure 41.
2.4.2 Source Handling and Personnel Exposures
Since the amount of activity to be handled was relatively large and the number of personnelwas limited, it was important that an efficient means of source manipulation be used. It wassufficient to use source-handling tongs 7 ft long for all sources except the 400 Coco sources.The 200-ft lengths of tubing containing 100 sources were each unreeled and placed in longditches when not in use. Each length could be grasped at the end by tongs and dragged intoposition quite easily. The personnel exposures were within the limits recommended in NBSHandbook 59.
2.4.3 Ground-plane Distributions
For ground ring exposures the tubes containing the sources were guided into position byaccurately placed stakes, as shown in Fig. 2.19. The stakes were placed in concentric circles,the radii of which were determined by the requirement that the circumferences times an inte-gral number of turns equal the total length of the tubing. The range of the radii was deter-mined by the outer dimensions of the house and the minimum measurable dose rates. Table 2.2gives the ground ring radii..
To fill in the areas between the innermost circle and the edge of the 2SWF house, thestrips were arranged in such a manner that each source represented an area of 4 sq ft.
For the finite rectangular source distribution at the phantom house, pulleys attached at 2-ft intervals to boards were used to position the sources. This produced an array of sourcesspaced 2 ft apart over an area 24 by 32 ft (Fig. 2.20).
2.4.4 Roof and Gutter Exposures
The same apparatus was used to position the sources on the roof of the two-story woodframe house. However, owing to mechanical difficulties its use was discontinued, and for theremaining 2SWF house roof exposures the source strips were laced around large nails. Thesource strips were also laced around masonry nails for roof exposures on the flat roof of the
33

precast concrete house. The Cs 137 sources were positioned on masking tape as a precautionagainst subsequent movement.
For the exposure in which the Cos0 source tubes were placed on the rear gutter of the2SWF house (exposure 38), two 200-ft lengths were individually folded into 33-ft lengths andtaped together with cords attached to each end. These could then be carried into position bypersonnel on ladders at the ends of the house.
Fig. 2.19-Source ring placement at the 2SWF house for p = 25.5 ft.
TABLE 2.2-GROUND RING RADII
No. turns, n Radius
1 127 ft 4 in.2 63ft8 in.3 42 ft 4%/e in.4 31ft 10 in.5 25 ft 5%/e in.6 21 ft 2%s In.
2.4.5 Reciprocity Placement
The experimental procedures could have been simplified and the measurements could havebeen made more generally useful if it had been established prior to the experiment that meas-urements utilizing reciprocity could be made with sufficient accuracy. However, since therewas insufficient data available concerning reciprocity, it was important that measurements bemade with both single- and multiple-source axrays. Since sufficient time was not available fora comprehensive study of the limits of applicability of reciprocity, an abbreviated series ofmeasurements was made. The 2.1-curie Cos0 source (or the 1.82-curie Cs 137 source) wasplaced at a point of interest in a house, and PIC's were placed at points on the roof and groundcorresponding to points in the ring or roof source-distribution patterns used for the smallsources. Instruments used outside after dawn or before dusk were wrapped in aluminum foil.In general, all measurements requiring outside placement of PIC's were conducted from duskto shortly after dawn. As a check on the temperature effect, the electrode was removed from
34

(a)
(b)
Fig. 2 . 20-.Phantom house with Pulley boards In place.
35

one instrument, and a thermometer was inserted. When this PIC, wrapped in aluminum foil,was placed in the sun, the thermometer inside registered essentially the "in-the-shade"temperature.
2.4.6 Energy Dependence and Angular Response
On the first exposures made, the tin foils discussed in Sec. 2.1.1 were used on several ofthe PIC's. Both bare and tin-covered PIC's were placed in orthogonal arrays at each of severalpoints of measurement. There was never a significant difference in the various readings, andon subsequent exposures only a few check points were used.
2.4.7 Monitoring Instrument Survey
An abbreviated study was made of the feasibility of using survey instruments (G-M type)and small sources (8.4-millicurie Co 6c) for house attenuation measurements. The energy de-pendence and poor reproducibility of the instrument were borne in mind. The source was posi-tioned in the 2SWF house at points previously occupied by the larger source, and readings weremade with the survey meter at points where the PIC's had been used.
2.4.8 Skyshine Exposure
As a means of checking the skyshine contribution, it was desirable to measure the doserate in a hole in the ground due to extended sources on the surface. However, owing to timerestrictions the assumption was made that reciprocity would hold for this study, and the 2.1-curie Coco source was placed in the hole, PIC's being placed at points on lines extendingdirectly away from the hole. Except for ground penetration to the nearest PIC, the dose ratewas too low for accurate measurement in the time available.
2.4.9 Relative Emphasis Placed on the Various Houses
Throughout the experiment special emphasis was placed on the two-story frame house.Time limitations precluded a complete study of all the houses, and this house presented severalaspects in common with some of the other houses. This permitted certain intercomparisonsand checks to be made. Some of the advantages of using the two-story frame structure were asfollows:
1. The basement measurements in this house could be compared with those of the two-story brick house to establish the effect of superstructure wall thickness on the radiationscattered into basements.
2. In a manner similar to item 1, the dose-rate distribution on the first floor from groundradiation could be compared with that of the wood rambler.
3. The second-floor dose-rate distribution due to sources on the roof could be comparedto that of the wood rambler.
4. The 2SWF house had three debris type shelters already constructed in the basement: athick-walled concrete structure (8 in. thick), a wooden corner shelter, and a wooden lean-toshelter. It appeared that the first two of these shelters offered potential fallout protection andshould be studied.
The emphasis on this structure prescribed a certain deemphasis on other houses. Thereinforced-masonry-block house was deemphasized the most. This house had a roof of thesame thickness and material (6-in.-thick concrete) as the precast concrete house. In addition,certain of the concrete blocks from which the reinforced-masonry-block house was constructedhad standard-weight concrete poured into them, but others did not. This increased considerablythe variation in attenuation at adjacent points. Since it could not be ascertained which blockscontained the added concrete, interpretation of any extended-source data would have beenfurther complicated. Therefore only measurements utilizing a single source and an ionizationsurvey instrument were made for this house.
(Text continues on page 44.)
36
, >1
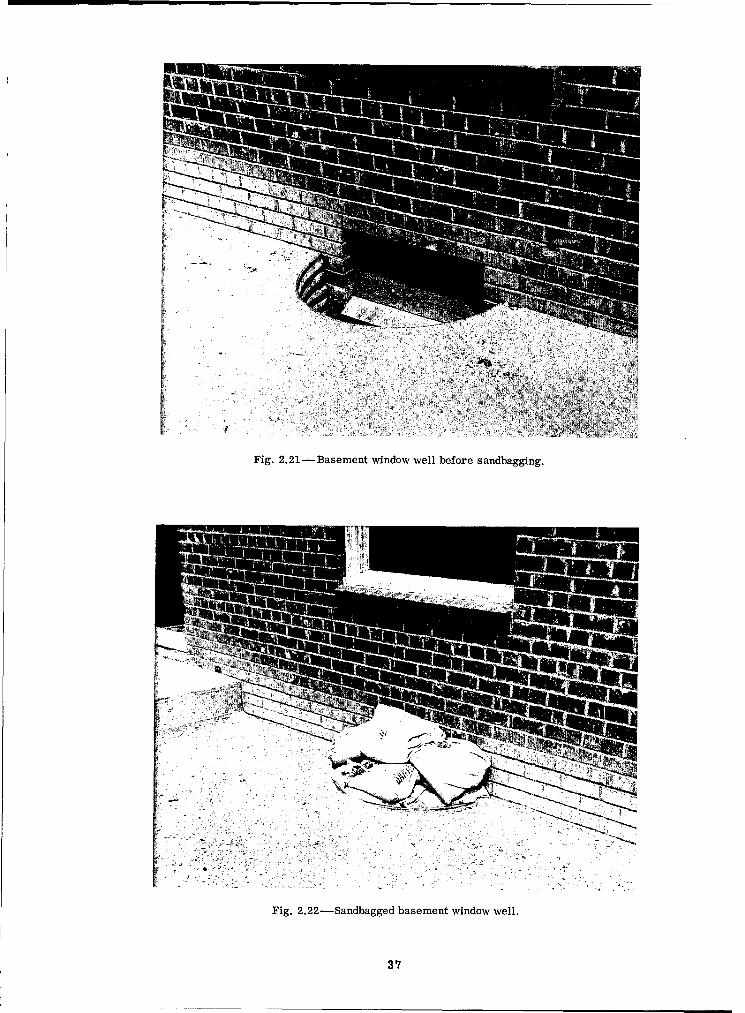
Fig. 2.21-Basement window well before sandbagging.
'Ul
Fig. 2.22-Sandbagged basement window well.
37

Fig. 2.23-Interior view of basement window well with sandbags in place.
Fig. 2.24- Basement interior (2SWF) with sandbags in windows and concreteblocks on tables.
38

C/I
0
44
40
04.0
-10)
39

(a)
(b)
Fig. 2.26 -PCC house with living-room openings (exterior) filled with co4areteblocks.
40

Fig. 2, 2 7 -interior of the 2sWF house with some furniture.
41

Y~ii
(a)
(b)
Fig. 2.28 -Interior of the 2SWF house with some furniture and supplies.
42

!:' ~~~~ ~N i•;i:•?!!•
Fig. 2.29-Interior of the 2SWF house.
Fig. 2.30- Interior of the rambler house with 24-in.-high concrete-block wall.
43

2.4.10 Modifications
The modifications that a home owner could make to his home to increase the protectionagainst radioactive fallout which it would afford could be of the utmost importance to the sur-vival of his family. Some of these modifications made to the structures studied were as follows:
1. Basement window wells were filled with sandbags, and sandbags were stacked in frontof these windows. Figure 2.21 shows a window well prior to the experiment; Fig. 2.22 shows asimilar well with sandbags in place; and Fig. 2.23 is an inside view of the same window withthe bags in place.
2. Tables were placed in the basements and covered with two layers (71/4 in. high) concreteblocks, as shown in Fig. 2.24. The concrete blocks used were solid concrete (density, 150lb/cu ft), measuring 15%/2 by 7/2 by 3%// in.
3. The wooden shelter in the basement of the two-story frame house was covered with twolayers of concrete blocks (71/4 in. high), as shown in Fig. 2.25.
4. Concrete blocks (one layer, 3%8 in. thick) were placed over the window and door of theliving room of the precast concrete house, as shown in Fig. 2.26. Modification of one room wassufficient since the inner walls were all of poured concrete.
5. Since the measurements were made in nonfurnished houses, furniture was placed in thetwo-story frame house to determine the shielding such furniture affords. Furniture effectswould, in general, be negligible in heavy-walled houses. The arrangement of furniture, supplies,and fixtures is depicted in Figs. 2.27 to 2.29.
6. Concrete blocks were placed around the inside of the exterior walls of the dining-living area of the wood rambler. The thickness of concrete was 3%8 in. This arrangement isshown in Fig. 2.30.
REFERENCE
1. F. H. Day, X-ray Calibration of Radiation Survey Meters, Pocket Chambers and Dosimeters,Report RA-DET-3-4, April 1950.
44

Chapter 3
PRESENTATION OF DATA
3.1 GENERAL
A brief description of the experiments and some of the exposure parameters are given inTable 3.1.
The usual levels for horizontal traverses were 3 and 5 ft above the floor. At key points thenumber of levels was increased to establish vertical traverses. The bulk of the data are pre-sented on house floor plans, with the positions of the vertical traverses indicated by letters.The dose rates for the vertical traverses are given in tables; the table for a given exposureimmediately follows the horizontal traverse data. Figure 3.1 shows the code for the key posi-tions at which vertical traverses were most often made. The dose rates reported are normal-ized as follows: for ring sources, mr/hr/4-millicurie source/2 ft; for other distributed
sources, mr/hr/millicurie/sq ft; and for point sources, mr/hr/curie.
3.1.1 Phantom House Dose-rate Distributions (Distributed Co 6" Sources)
The horizontal dose-rate distributions in the phantom house for the 3-, 5-, and 11.5-ftlevels for sources distributed on the floor on 2- by 2-ft centers are given in Figs. 3.2, 3.3, and3.4, respectively. The vertical traverse dose rates are given in Table 3.2.
The horizontal dose-rate distributions for the 3-, 5-, and 11.5-ft levels for a ring ofsources of 25.5 ft radius about the center of the house (p = 25.5 ft) are given in Figs. 3.5, 3.6,and 3.7, respectively. The vertical traverse dose rates are given in Table 3.3.
The horizontal dose-rate distributions for the 3-, 5-, and 11.5-ft levels for p = 31.8 ft aregiven in Figs. 3.8, 3.9, and 3.10, respectively. The vertical traverse dose rates are given inTable 3.4.
The horizontal dose-rate distributions for the 3-, 5-, and 11.5-ft levels for p = 42.5 ft aregiven in Figs. 3.11, 3.12, and 3.13, respectively. The vertical traverse dose rates are given inTable 3.5.
The horizontal dose-rate distribution for the 5-ft level for p = 63.7 ft is given in Fig. 3.14.The vertical traverse dose rates are given in Table 3.6.
The horizontal dose-rate distributions for the 3- and 5-ft levels for p = 127 ft are given inFigs. 3.15 and 3.16, respectively. The vertical traverse dose rates are given in Table 3.7.
3.1.2 Two-story Wood Frame (2SWF) House Dose-rate Distributions
The horizontal dose-rate distributions in the 2SWF house at 3 ft in the basement, at 1, 3,and 5 ft on the first floor, and at 3 ft on the second floor for p = 21.2 ft are given in Figs. 3.17,3.18, 3.19, 3.20, and 3.21, respectively. The vertical traverse dose rates are given in Tables3.8 and 3.9 for the basement and the first floor, respectively.
The horizontal dose-rate distributions for the 3-ft level in the basement, on the first floor,and on the second floor for p = 25.5 ft are given in Figs. 3.22, 3.23, and 3.24, respectively. Thevertical traverse dose rates are given in Tables 3.10, 3.11, and 3.12, respectively.
45

The horizontal dose-rate distributions for the 3-ft level in the basement, on the first floor,and on the second floor for p = 31.8 ft are given in Figs. 3.25, 3.26, and 3.27, respectively. Thevertical traverse dose rates are given in Tables 3.13 to 3.15.
The preceding exposure, p = 31.8 ft, was repeated with some furniture in the house (seeSec. 2.4.10). The horizontal dose-rate distributions for this exposure for levels at 3 and 6.5 ftin the basement and for the 3-ft level on the first and second floors are given in Figs. 3.28,3.29, 3.30, and 3.31, respectively. The vertical traverse dose rates are given in Tables 3.16 to3.18.
The horizontal dose-rate distributions for the 3-ft level in the basement on the first floor,and on the second floor for p = 42.5 ft are given in Figs. 3.32, 3.33, and 3.34, respectively.The vertical traverse dose rates are given in Tables 3.19 to 3.21.
The horizontal dose-rate distributions for the 3-ft level in the basement, on the first floor,and on the second floor for p = 63.7 ft are given in Figs. 3.35, 3.36, and 3.37, respectively. Thevertical traverse dose rates are given in Tables 3.22 to 3.24.
Sources were distributed uniformly in the area between the house and the innermost sourcering (p = 21.2 ft). The horizontal dose-rate distributions for the 3-ft level in the basement, onthe first floor, and on the second floor for this source arrangement are given in Figs. 3.38,3.39, and 3.40, respectively. The vertical traverse dose rates are given in Tables 3.25 to 3.27for this fill-in exposure.
With sources distributed uniformly over the west half of the roof, the dose rates weremeasured throughout the house. The horizontal dose-rate distributions for the 3-ft levels inthe basement, on the first floor, and on the second floor for this source array are given in Figs.3.41, 3.42, and 3.43, respectively. The vertical traverse dose rates are given in Tables 3.28 to3.30.
The horizontal dose-rate distributions for the 3-ft level in the basement, on the first floor,and on the second floor for sources distributed over the entire roof area are shown in Figs.3.44, 3.45, and 3.46, respectively. The vertical traverse dose rates are given in Tables 3.31 to3.33. These measurements were for a house devoid of furniture.
A second full-roof exposure was made with some furniture and supplies in the house (seeSec. 2.4.10). The horizontal dose-rate distributions for the 3- and 6.5-ft levels in the basementand for the 3-ft level on the first and second floors are given in Figs. 3.47, 3.48, 3.49, and 3.50,respectively. The vertical traverse dose rates are given in Tables 3.34 to 3.36.
One exposure was made with strings of sources in the roof gutter on the east side of thehouse. The horizontal dose-rate distributions at the 5-ft level in the basement, on the firstfloor, and on the second floor are given in Figs. 3.51, 3.52, and 3.53, respectively. The sand-bags were removed from the four southernmost basement windows before this exposure.
3.1.3 Precast Concrete (PCC) House Dose-rate Distributions
The horizontal dose-rate distributions for the PCC house for the 3- and 5-ft levels arepresented in Figs. 3.54 and 3.55, respectively, for p = 25.5 ft. The vertical traverse dose ratesare given in Table 3.37.
The horizontal dose-rate distributions for the 3-, 5-, and 7-ft levels for p = 42.5 ft aregiven in Figs. 3.56, 3.57, and 3.58, respectively. The exterior openings in the living room wereclosed with concrete blocks (see Sec. 2.4.10). The horizontal dose-rate distributions for the3- and 5-ft levels for p = 42.5 ft with this modification are given in Figs. 3.59 and 3.60, re-spectively. The vertical traverse dose rates are given in Table 3.38.
Sources were distributed uniformly on the roof on 2-ft centers. The horizontal dose-ratedistributions at the 3- and 5-ft levels are given in Figs. 3.61 and 3.62, respectively. The verti-cal traverse dose rates are given in Table 3.39.
Sources were placed on the roof over the northwest bedroom only for one exposure. Theywere on 2-ft centers in a 6- by 8-ft array, the longer dimension being aligned with the longerdimension of the room and the geometrical center of the array being over that of the room.The horizontal dose-rate distributions for the 1-, 3-, and 5-ft levels are shown in Figs. 3.63,3.64, and 3.65, respectively. The 5-ft level has a traverse extending through the north windowover the lawn for a distance of 10 ft.
46

3.1.4 Wood Rambler (WR) House Dose-rate Distributions
The horizontal dose-rate distributions for the rambler house for the 3- and 5-ft levels aregiven in Figs. 3.66 and 3.67, respectively, for p = 25.5 ft. The vertical traverse dose rates aregiven in Table 3.40.
The horizontal dose-rate distributions for the 3- and 5-ft levels for p = 42.5 ft are givenin Figs. 3.68 and 3.69, respectively. The vertical traverse dose rates are given in Table 3.41.
A uniform distribution of sources on 2-ft centers was placed over the entire roof area.The horizontal dose-rate distributions for the 3- and 5-ft levels are given in Figs. 3.70 and3.71. The vertical traverse dose rates are given in Table 3.42.
3.1.5 Two-story Brick (2SB) House Dose-rate Distributions
The horizontal dose-rate distributions for the 2SB house for the 3- and 5-ft levels in thebasement and for the 3- and 5-ft levels on the first floor are given in Figs. 3.72, 3.73, 3.74,and 3.75, respectively, for p = 25.5 ft. There were sandbags in the four southernmost basementwindow wells and over the associated windows. A table covered with 7/ 4-in. thickness of con-crete blocks was in the southeast corner of the basement. The vertical traverse dose rates aregiven in Tables 3.43 and 3.44.
The horizontal dose-rate distributions for the 3- and 5-ft levels in the basement and the 3-and 5-ft levels on the first floor for p = 42.5 ft are given in Figs. 3.76, 3.77, 3.78, and 3.79,respectively. The position of the sandbags and concrete blocks was the same as that for the ex-posure at p = 25.5 ft. The vertical traverse dose rates are given in Tables 3.45 and 3.46.
3.1.6 Reinforced-concrete-block (RCB) House Attenuation Study
Attenuation measurements were made with a single Co60 source and a survey type ioniza-tion chamber. The large and abrupt changes in transmission are indicated in Fig. 3.80, whichis a diagram of the geometrical arrangement and relative readings. The source was placed 4ft from the north wall, 3 ft from the east wall, and 47 in. above the floor. The other positionsare drawn to the same scale.
3.2 RECIPROCITY
Point-source measurements were made with Co6c and Cs13M sources. Only the Coco expo-
sures are reported here, but it is evident that the Cs 1 37 data in Sec. 3.3 can be analyzed forreciprocity applicability. All readings, except those made with the survey instrument, havebeen normalized to milliroentgens per hour per curie. PIC's were placed at points on theground rings of various radii used for the extended sources and at points on the roof surface.
3.2.1 Two-story Wood Frame (2SWF) House
With the 2.1-curie Coco source positioned 3 ft above the center of the first floor, the dose-rate distribution was measured and is shown in Fig. 3.81.
An exposure was also made with the Coco source 3 ft above the center of the second floor.The dose-rate distribution on the ground and on the roof is given in Fig. 3.82.
The 2.1-curie Coco source was also placed in the north area of the basement of the 2SWFhouse. It was 3 ft above the floor, centered under the peak of the roof, and on a line connectingthe centers of the northernmost east and west basement windows. Figure 3.83 shows the dose-rate distribution for this placement.
A source placement was also made on the first floor at a point 1 ft from the north end atthe north-south center line of the house. The Co6 source was 3 ft above the floor. Dose ratesas a function of position on the ground and roof are shown in Fig. 3.84.
Two exposures were made at the 2SWF house with the small standard calibration source(8.4-millicurie Co 6c). A G-M survey instrument was used for the measurements that weremade with the intent of exploring the feasibility of sensitive-energy-dependent detectors. Theresponse of the instrument as a function of position is given in Figs. 3.85, 3.86, and 3.87 forthe basement, first floor, and second floor, respectively, for a source location 3 ft above the
47

first floor at the center of the house. Figures 3.88, 3.89, 3.90, and 3.91 show the response forthe basement, first floor, second floor, and roof, respectively, for a source location 3 ft abovethe second floor. All measurements inside the house were made 3 ft above the floor, and thosemade outside were made at approximately 1 in. above the ground or roof.
3.2.2 Precast Concrete (PCC) House
The 2.1-curie Co8c source was placed 3 ft above the floor at a point near the center of thehouse. The dose-rate distribution on the ground and roof for this source position is shown inFig. 3.92.
A source placement was made in the center of the northwest bedroom at a height of 3 ftabove the floor. The dose-rate distribution for this exposure is shown in Fig. 3.93.
The 2.1-curie source was also placed on the roof of the PCC house at a point 2 ft east and4 ft south of the center of the northwest bedroom. The position of the source and the dose rateat the point occupied by the source in Fig. 3.93 are shown in Fig. 3.94.
3.2.3 Air Scatter
The only data obtained for the skyshine exposure described in Sec. 2.4.8 are presented inFig. 3.95 for a source position 3 ft below ground level and on the vertical axis of the hole.
3.3 ENERGY DEPENDENCE
The Cs 1 37 sources were used for a limited number of exposures for checking energy de-pendence. The PIC's were placed outside as they were in Sec. 3.2.
3.3.1 Two-story Wood Frame (2SWF) House
The 1.82-curie Cs 137 source was placed 3 ft above the center of the first floor of the house,and measurements were made on the ground and roof. The dose-rate distribution is shown inFig. 3.96.
An exposure was also made with the Cs 137 source positioned 3 ft above the center of thesecond floor. Figure 3.97 shows the dose-rate distribution for this placement.
3.3.2 Precast Concrete (PCC) House
Nineteen of the small (23-millicurie) Cs 1 37 sources were distributed uniformly on theroof, and the dose-rate distribution was measured inside the house (Fig. 3.98). The array con-sisted of four east-west columns of five sources each (except for the front column, whichterminated near the offset in the roof and contained only four sources). This array was centeredon the roof with the columns 8 ft apart and a separation along the column of 8.5 ft. The verticaltraverse dose rates are given in Table 3.47.
The 20 Cs 137 sources of 23 millicuries each were placed in a 4- by 5-source array on2-ft centers, and the array was centered over the northwest bedroom of the PCC house in thesame manner as the Coco sources that were used for the data in Figs. 3.63 to 3.65 (see Sec.3.1.3). The horizontal dose-rate distributions for the cesium exposure are given in Figs. 3.99and 3.100 for the 3- and 5-ft levels, respectively. The vertical traverse dose rates are givenin Table 3.48.
48

TABLE 3.1-EXPOSURE PARAMETERS
ExposureNo. House p, ft n* Description Sources Remarks
1 2SWF 21.2 6 Ground 400 Coc0
2 2SWF 63.7 2 Ground 400 Co6c
3 2SWF 25.5 5 Ground 400 Co60
4 Phant. Floor 172 Co60 Deposited uniformly on area the
size of 2SWF and 2SB houses5 Phant. ,-42.5 3 Ground 120 Co
6c
6 2SWF Fill-in Fill-in 112 Coco Sixteen at each end; 40 at each side7 Phant. 25.5 5 Ground 160 Co
60
8 Phant. 31.8 4 Ground 200 Co60
9 2SWFt 31.8 4 Ground 200 Co60
10 2SWFt 42.5 3 Ground 399 Coco11 2SWFt Half-roof 100 Co
60
12 2SWFt Full-roof 200 Co60
13 PCC Full-roof 19 Cs 137
14 2SWFt Full-roof 197 Co60 Furniture
15 2SWFt 31.8 4 Ground 399 Co60 Furniture
16 2SWFt Reciprocity 2-curie Co60 Furniture; 3 ft, second floor center
17 Phant. 63.7 2 Ground 399 Co 60
18 PCC 25.5 5 Ground 380 Co 60
19 2SWFt Reciprocity 2-curie Co60 3 ft above first floor, center of house
20 PCC 42.5 3 Ground 380 Co60
21 PCC Roof 40 Co6l NW bedroom only; 2-ft centers
22 2SWFt Reciprocity 2-curie Co 0o Center of N half of basement,
3 ft above floor23 PCC Full-roof 310 Co 60
24 2SWFt Reciprocity 2-curie Cs13 7 3 ft above first floor, center of house
25 PCC Roof 20 each 23-millicurie NW bedroom only; 2-ft centers
Cs137
26 2SWFt Reciprocity 2-curie Cs 137 3 ft above second floor, center of
house27 WR 25.5 5 Ground 389 Co66
28 PCC Reciprocity 2-curie Co60
3 ft high, center of house29 PCC 42.5 3 Ground 399 Co6
c Exterior door and window filled with35/%-in.-thick concrete blocks
30 2SWFt Reciprocity 2-curie Coco Center of N end, 1 ft from wall31 WR 42.5 3 Ground 380 Coc0
Concrete blocks around outside wallof living-dining area
32 WR Full-roof 293 Co 60 Concrete blocks around outside wall
of living-dining area33 PCC Reciprocity 2-curie Co 60
3 ft high, center; NW bedroom34 PCC Reciprocity 2-curie Co60
2 ft E and 4 ft S of center; NW bed-
room35 2SB 25.5 5 Ground 379 Coc0
Sandbags In four southernmost base-
ment windows; tables with concreteblocks in SW corner
36 Hole Skyshine 2-curie Co60 3 ft down hole, 2 ft wide by 6 ft deep
37 2SB 42.5 3 Ground 380 Co 6c Sandbags in four southernmost base-
ment windows38 2SWF Gutter 200 Co
60 Folded to 32-ft lengths
39 RMB Poor slab geometry40 Phant. 127 1 Ground 399 Coco41 2SWFt 21.2 6 Co60
calib. Survey meter used inside and out-source side house
*n, number of turns (see Table 2.2).
tTwo tables and the NW shelter in the basement were covered with concrete Moccks, and there weresandbags in the four southernmost basement windows.
49

All
lei
LIII
0
Al -A
II1s
', - - -- 0
on
Hi 50
- ----. (4
- -
50x

/ 119 /33 136 /18 138 /18W
/5:•8 8 '8OC - N- 1I4Z
,o•X /,-1" 1*9 1
x TS180
Fi.3.-hatm os, 3-tlvlIore itiue nfor
' 1 2 "! IP x / o<
3
91 95 /0 1/1/0
7 4 - . -*-- -
S.3 74- 84 8' -
Fig. 3.2-Phantom house, 3-ft level, sources distributed on floor.
56{ 7 8,4 9/ 95 19 119 109 A
1
6 _ 107_T
109 10
x 91 99
x94
$6 x 94 191
Sx6797
56 62 5.9a
Fig. 3.3--Phantom house, 5-ft level, sources distributed on floor.
51

38 41 44 43 ~43 -49 46 A
47
47
X46
37 417
3T 33
X
Fig. 3.4-Phantom house, 11.5-ft level, sources distributed on floor.
TABLE 3.2-VERTICAL TRAVERSES FOR THE PHANTOM HOUSE
FOR SOURCES DISTRIBUTED ON THE FLOOR
Position 3 ft 5 ft 7 ft 9 ft 11.5 ft 13 ft 15 ft
A 142 103 78 62 49 37 30B 53 43 37 28 20 19 16
C 84 56 46 40 28 25 31
1 80 63 49 41 32 25 25
52

9.2 _ _77 7/ A-- X-X------X---- -ý6.5
x7.3
/2. xx 73I1 x
9.2 x 8.0
I .9
•9- ... x - •----- - •-
I&P3 2 o.' .• 8.6
Fig. 3.5-Phantom house, 3-ft level, p = 25.5 ft.
8o9-. .. SX 7.7 z• A
I ~x i
77X11 6.1
7.8
XIx
i. X ------ 7 7
14.1 117 59 -9.5- 66
Fig. 3.6-Phantom house, 5-ft level, p =25.5 ft.
53

6.4
76x 6(~.3xI
x I
6. I
78 CIS
I x•,
B-. . -x -. x - -4---- -.- . __
7.8 9 74 6.9 6.6
Fig. 3.7-Phantom house, 11.5-ft level, p = 25.5 ft.
TABLE 3.3 -VERTICAL TRAVERSES FOR THE PHANTOM HOUSE FOR p 25.5 FT
Position 3 ft 5 ft 7 ft 9 ft 11.5 ft 13 ft 15 ft
A 6.5 6.5 6.6 6.1 6.1 5.5 5.016.2 14.1 12.0 10.2 7.8 7.4 6.311.0 10.9 9.9 8.8 7.7 7.1 6.58.6 8.6 7.8 7.4 6.6 5.8 5.8
54

c. .. .. 64_..• - ---.- -- A .
7.31
I /65.9
x.56.0
Fig. 3.8-Phantom house, 3-ft level, p = 31.8 ft.
A
)f.5.
x6.5 '(.
x
i 7.3 7.0 6.6 6.o
Fig. 3.9-Phantomn house, 5-ft level, p =31.8 ft.
55

IC1
4.9
5* 7 5.3
x
,B 6.0 5.9 5.7 5.4
Fig. 3.10 -Phantom house, 11.5-ft level, p 31.8 ft.
TABLE 3.4-VERTICAL TRAVERSES FOR THE PHANTOM HOUSE FOR p =31.8 FT
Position 3 ft 5 ft 7 ft 9 ft 11.5 ft 13 ft 15 ft
A 5.1 5.2 5.2 4.8 4.9 4.6 4.5B 8.5 8.4 8.0 7.4 6.4 6.0 5.6C 6.9 7.2 6.9 6.6 6.2 5.8 5.4I 6.0 6.0 6.0 5.8 5.4 5.0 4.6
56

4.8 C 4.1 4.2 4.5 A3.
x
4.5 x ,x.02
S.24.6 X 4.2
4.8 418 4.2 4.
Fig. 3.11-Phantom house, 3-ft level, p =42.5 ft.
-f 7 .14
x-. x x ÷.
c Al
x
I / I
f.8x X, *2
- - - .---
4.8 4 A 4.2
Fig. 3.12-Phantom house, 5-ft level, p 42.5 ft.
5,7

-x A
4.2
1.5 X, x 3.9
I .I-,4-.
•,.• -X, 4. .1
itsIa ll
+8 5.2 f. 2 f.
Fig. 3.13-Phantom house, 11.5-ft level, p = 42.5 ft.
TABLE 3.5-VERTICAL TRAVERSES FOR THE PHANTOM HOUSE FOR p = 42.5 FT
Position 3 ft 5 ft 7 ft 9 ft 11.5 ft 13 ft 15 ft
A 3.9 4.0 4.2 4.2 3.6 3.6 3.6B 4.8 4.8 4.8 4.8 4.8 4.8 4.5C 4.8 4.7 4.8 4.6 4.0 4.7 4.5I 3.6 4.2 4.2 4.4 3.9 4.2 3.8
58

I--I
I 0 A
2.43 2.37
3.02 X X 2..0
-- - -- --- -- -- ------
?.63 ~ ~ ~ 2' 2.--53 --X---- 4.-
Fig. 3.14-Phantom house, 5-ft level, p = 63.7 ft.
TABLE 3.6-VERTICAL TRAVERSES FOR THE PHANTOM HOUSE FOR p =63.7 FT
Position 3 ft 5 ft 7 ft 9 ft 11.5 ft 13 ft 15 ft
A 2.30 2.30 2.37 2.30 2.30 2.30 2.23B 2.67 2.63 2.83 2.67 2.56 2.63 2.50C 2.37 2.50 2.50 2.76 2.63 2.631 2.37 2.56 2.43 2.50 2.37 2.63 2.63
59

1.22 . /4
t06
x
I.1 B
Fig. 3.15-Phantom house, 3-ft level, p = 127 ft ...
IR~.- - - --- --4/./8
Ax/
x
Am~
.B
Fig. 3.16-Phantom house, 5-ft level, p =127 ft.
TABLE 3.7-VERTICAL TRAVERSES FOR THE PHANTOM HOUSE FOR p = 127 FT
Position 1 ft 2 ft 3 ft 4 ft 5 ft 7 ft 9 ft 11.5 ft 13 ft 15 ft
A 1.14 1.14 1.14 1.10 1.18 1.14 1.14 1.18 1.14B 1.14 1.18 1.18 1.14 1.18 1.30 1.18
60

x~ ®0.308
®0.769
®80.46/
x da461
( 05
Fig. 3.17-2SWF house, 3-ft level, basement, p = 21.2 ft.
TABLE 3.8-VERTICAL TRAVERSES FOR THE BASEMENT OF THE 2SWF HOUSE FOR p = 21.2 FT
Position 0.5 ft 1 ft 1.5 ft 2 ft 3 ft 3.5 ft 4.5 ft 5.5 ft 6.5 ft
A <0.05 <0.05 <0.05 <0.05 <0.4B 0.46 0.31 0.31 0.54 12.8 1.08K 0.308 6.38
K + 2 ft W 0.538 3.92K + 6 ft W 0.769 2.61K + 8 ft W 0.461 2.15
J 0.31 0.31 0.461 0.54 1.08 1.92J + 4 ft W 0.385 2.00J + 6 ft W 0.538 2.00J + 8 ft W 0.308 3.92J + 10 ft W 0.231 5.84
61

Fig. 8 W hue 1-f lv, fr , p // 21.2X X X I X4.23 x X X I
M6. ado 6.308 4S9 .o 4
/0.11 7.654.3
x x-×11.5.9 1.77 11.2 1
x x x / x x xlFi.7 s.23 Sh / -f lR /= 21.r ft.44
e x ® I Ix
A® -
,o.2 .3 2.1s ,•.,4,•Ix x x x -- I
x x x Hx Il/4.& 716/ 5.5,4 aP ., 01o.2 1_•,
Fig. 3.18-2SWF house, 1-ft level, first floor, p =21.2 ft.
D0 x K ®0t' x FO17.6 117 ~6 a.d0 707 9. 77 1.
17.2 AO.6 200 4g.38 • 7.00 9.5f4 It.7
X x<14•.3 104
x x x Y./P 8.d .61 43 .31 6,.6 9, .00
0. x (9 (9 ,x y, X,1.2 Z54 6.08 4.2 4-9.,•6L 4
10./ 74-6 f•..F4 .3 8
x x X x
.x• .• ..,,"..,g _
x x x n
Fig. 3.19-2SWF house, 3-ft level, first floor, p 21.2 ft.
62

95 D 8.00 6.30 F
A?.2 8.00 8.46 775.d;6-5t*0
I x
Fig. 3.20--2SWF house, 5-ft level, first floor, p -- 21.2 ft.
TABLE 3.9--VERTICAL TRAVERSES FOR THE FIRST FLOOR OF THE 2SWF HOUSE FOR p = 21.2 FT
Position 1lft 3 ft 5 ft 7.5 ft
A 1.61 4.23 5.08B 20.1 12.8 10.6 7.46
D 27.1 17.8 12.2 9.54E 6.61 8.00 7.77 6.77F 21.2 14.2 10.1I 6.08 6.92 7.23 6.77K 8.00 7.07 7.61
B + 8 ft E 10.1 10.1 9.54 8.00B + 8 ft S 10.2 8.00 8.00 7.23
B + 8ft5S+ 8ft E 2.15 5.54 6.38 6.08D + 8 ft W 10.1 11.2 8.84 8.46D + 8 ft 5 8.31 8.46 8.46 7.54
D+8 ft S+8 ft W 2.54 6.08 6.92 6.77E+8ftW 1.61 4.23 5.84I+8 ft E 1.61 3.38 5.31
63

x -Tx4.46 " z 3
x
x 5o08 x3.54
Fig. 3.21-2SWF house, 3-ft level, second floor, p = 21.2 ft.
64

~o~e * @o.3i
AM&0.33X -- 0. .13
40,05
Fig. 3.22-2SWF house, 3-ft level, basement, p 25.5 ft.
TABLE 3.10-VERTICAL TRAVERSES FOR THE BASEMENT OF THE 2SWF HOUSE FOR p = 25.5 FT
Position 3 ft 4 ft 5 ft 5.5 ft 6.5 ft
B 0.33C 0.73E 0.49K 0.23 0.21 0.31 0.98
K+2ftW 0.21 0.75K+4ftW 0.24 0.49K + 6 ft W 0.28 0.54
J 0.31 0.49J + 2 ft W 0.33 1.10
J+4ftW 0.26 1.50J + 8 ft W 0.33 1.70
J + 10 ft W 0.33 3.40
65

x
&a• 8,0 M02
3.57.4.4•7,
&9 8.0 6.9 5.8 5.3 4. 2 xx Z"-.-7/ xS.9
A 1. 3* 40 48 5
C4 . .1x 8.0 A.4 X
x ed. iX 7.9
X 4.4 X 6.96.26.2
9.7 8.x0~ x 6. 6
Fig. 3.23--2SWF house, 3-ft level, first floor, p =25.5 ft.
TABLE 3.11-VERTICAL TRAVERSES FOR THE FIRST FLOOROF THE 2SWF HOUSE FOR p = 25.5 FT
Position 1 ft 3 ft 5 ft 7 ft
A 1.3 4.0 4.8 5.2B 10.6 9.7 9.3 7.4C 5.4 7.1 7.1 6.6E 4.4 5.6 6.2 6.2
66

x x E94.0 x 5. x5.2 4.4 U4.0 4.9.
X 3.6 a5 )< .
L::ý X 3..
IrX~~~ 4.3.7 35
- X 3.4-
x4.0 X 3.4 30 x
XC .( x x xx < ×
-x) 3.534+ ?.a 3.5 3.3 3.4 3.5
x 4.9 x 32X3.3
x4.3 B x .2
x 3.5
x4.2 4.0 XI5
X X X3.5P.OP 6 4.1 11 =• L
Fig. 3.24--2SWF house, 3-ft level, second floor, p = 25.5 ft.
TABLE 3.12-VERTICAL TRAVERSES FOR THE SECOND FLOOROF THE 2SWF HOUSE FOR p = 25.5 FT
Position I ft 3 ft 5 ft 7 ft
A 3.1 3.2 2.7 2.7
B 5.3 5.0 4.3 3.5C 4.0 3.5 3.1E 3.8 4.0 3.5 3.4
67

S D 0 CP 5 O.-/• KOol"
e®0.66
Positio 1 ft 2/ ft3ft5ft65f
K 0.12 0.4
K+8ftW 0.12 .0.3
J+2-t 0..3
•- o.o• -
Fig +.5 W hose 3-f leel baseent p0.3.8ft
Poito +f 6f ftt S 0.060.4
E <0.05S+ f 0.12 0. 30
K f + 2 ft W 0.12 0.48K f + 81 ft W 0.12 0. 30
J 006 0.0 0.30-0.3-0.3
D f + 2 ft W 0.12 0.3
J +1 ft 0.0 0.3
Fig.f3.5 0.06 0os,3f eebsmnp=3 .42ft
B+6<t.2f5W0.125 0.97D CfS+fW0.18 0.48
KD+6ft1ft W 0.18 0.42
D + 6 ft S +1/2fW<05 <0.050.18
*One in. above blocks that were on the table top.
68
EO4.i j.93 x y 33 10
X.4.20 x X
OF& THEf 2SWF HOUSE FO.p= 1.7F
A.3 4.11 3.5".9
C 4 54 x x x x
E 4.2- 48 44 3
3.93
3-8 4,O. 4.78. ,
A .3 4.11 3.753 3.993 3
X X.44 4.4 484 43
4.2.

x~#~0£ 3.27 x x3.45 h57 J.63 U .1
X7 2.72 xc®.•77 x 6
X 2 . X
3*-f X 2.4 64 2.30x X X AO X x x )17-72 3.27 2.#2 2.30 2.4 Z.72 2..r# .1
X x
3.~ x 2.60
_%j87 X 2.72 2.42
x 4 .2 3 )(3.39 x13 .3.02
S4.*/ X 3.7T X 3--1 X~ 3.63
Fig. 3.27-2SWF house, 3-ft level, second floor, p 31.8 ft.
TABLE 3.15-VERTICAL TRAVERSES FOR THE SECOND FLOOROF THE 2SWF HOUSE FOR p = 31.8 FT
Position 1 ft 3 ft 5 ft 7 ft
A 2.42 2.30 2.42 2.42B 4.41 4.41 4.05 3.75C 3.02 3.57 3.33 3.27E 3.14 3.27 2.96 3.02
70

mx
__ K oK I
045 a/0 03SS
x x0.10 0./5
x0./4'0°'x
Fig. 3.28-2SWF house, 3-ft level, basement, furniture in house, p = 31.8 ft.
0.~s as 50.
- x
0./. 0.40
0s0 ".05
6 X, 0 -o5'LV,.
Fig. 3.29-2SWF house, 6.5-ft level, basement, furniture in house, p = 31.8 ft.
TABLE 3.16-VERTICAL TRAVERSES FOR THE BASEMENT OF THE 2SWF HOUSE
(CONTAINING FURNITURE) FOR p = 31.8 FT
Position 1 ft 2 ft 3 ft 4.5 ft 5 ft 6.5 ft
A <0.05 <0.05 <0.05F <0.05 <0.05 0.15* 0.20 0.60J <0.05 0.15* 0.25 0.25
*•One in. above concrete blocks on table top.
71

x x
Fig. 3.30-2SWF house, 3-ft level, first floor, furniture in house, p = 31.8 ft.
TABLE 3.17-VERTICAL TRAVERSES FOR THE FIRST FLOOR OF THE 2SWF HOUSE(CONTAINING FURNITURE) FOR p = 31.8 FT
Position 1ift 3fit 5 ft 7 ft
A 0.90 3.64 3.99B 6.38 6.48 6.38 5.98C 4.38 5.18 5.18 5.38E 3.24 4.48 4.38 4.48
72

x )( £f® Xt= : ' x_
x x
2 ,9 X X x 4..3
2.492.59 x
.COTAI1N F NITURE FO3193.8F
2.49 2.74 2.24A) 2.79 2.9B. 8.22 A 49 2.9 2.4.9 /.9
S 2.49 3a 2.149 3X8 [1.7.9x 2.93 IIx
3.93 28
A743
13(8498 X3.33 x .73 X J.1
Fig. 3.31-2SWF house, 3-ft level, second floor, furniture in house, p =31.8 ft.
TABLE 3.18-VERTICAL TRAVERSES FOR THE SECOND FLOOR OF THE 2SWF HOUSE(CONTAINING FURNITURE) FOR p = 31.8 FT
Position I ft 3 ft 5 ft 7 ft
A 2.69 2.69B 4.38 4.98 3.99 3.99C 3.49 3.69 3.39E 2.19 3.39 3.39 3.19
73

Positin= f 2t 3f==t 6.f
-K
C 0.11 00.3
E 0015 .2
K 0.0. 09030.11 011.
<1 0.2
D S 01 /3
Fig. 3.32-2SWF house, 3-ft level, basement, p =42.5 ft.
TABLE 3.19--VERTICAL TRAVERSES FOR THE BASEMENT OF THE 2SWF HOUSEFOR p = 42.5 FT
Position 1 ft 2 ft 3 ft 5 ft 6.5 ft
D +C 0.11 0.37E , 0.15 0.26K 0.09 0.32
K+52tftW 0.13 0.43K+58tftW 0.11 0.26
J <0.05 0.06 0.17" 0.22 0.22J + 2 ft W <0.05 0.11 0.32J + 10 ft W 0.09 0.37
F 0.09 <0.05 0.13" 0.17 0.32D + 5 ft S 0.11 0.32
*D+5 ft S+ 2ft W 0.11 0.30*D+5 ftS + 6ft W 0.11 0.39
D+5 ftS+110 ftW 0.15 0.30D + 5 ft S + 14.5 ft W 0.06 0.11
*One in. above concrete blocks on table top.
74

X 3.24 3.57 X ".15 x
'a3
x x x x.xo x,3. 9.9F.28 42 WF houe 3t ll f.4irs35 f.20 x
OT. HU F p .4 F.T7x3.14 3.04
7 75
(84.00 x,-46 axs • - x x x x xC 3 . A O ý & W __14 14 . 3.14 8.77 ' .60o 0
9 .89
X4.07 x 19.Z4- _
9 .53X 4.26 •
Fig. 3.33--28WF house, 3-ft level, first floor, p =42.5 ft.
TABLE 3.20--VERTICAL TRAVERSES FOR THE FIRST FLOOROF THE 2SWF HOUSE FOR p = 42.5 FT
Position 1 ft 3 ft 5 ft 7 ft
A 1.47 3.14 3.03 3.24B 4.20 4.46 >4.54 4.43C 3.59 4.00 4.33 4.11E 2.27 3.57 3.63 3.24
75

x X E0a.60 P.~60 Xae 181324X
3.a o.70 U
X 1,/ 5 q.03 X--.24 X
x ~~~ 8.25 .2
rX 2.16 eal xX 2.16
Xg 3.03 4 2F .ou 1Zt 2.16 Xt
j1.62
OF7 THE 2SFRUEFR . 25
AS1. .73 h90 1.77 469 1.73 4184 /./
x 1198 X1.86
X 324 [1 /.* 3.335. 5 3* 27 2 3.23 X&36
>(33 X.24 Xe.el _X2A9
Fig. 3.34-2SWF house, 3-ft level, second floor, p =42.5 ft.
Table 3.21-VERTICAL TRAVERSES FOR THE SECOND FLOOROF THE 2SWF HOUSE FOR p = 42.5 FT
Position I ft 3 ft 5 ft 7ift
A 1.77 1.73 1.99 2.51B 3.50 3.63 3.55 3.35C 2.70 2.85 3.03 3.24E 2.47 2.60 2.38 2.60
76

K®O.27
(S)222
__ @(0.27--
®o• • J®o.27C x 00
i 0.I7
®80. 27
Fig. 3.35-2SWF house, 3-ft level, basement, p= 63.7 ft. (All values should be
multiplied by 0.337.)
TABLE 3.22-VERTICAL TRAVERSES FOR THE BASEMENT OF THE 2SWF HOUSE FOR p = 63.7 FT*
Position 0.5 ft I ft 2 ft 3 ft 4 ft 5 ft 6 ft 6.5 ft 7 ft
A <0.05 0.16 <0.05 0.16 0.16B <0.05 0.05 0.22 0.22 0.22C 0.16 0.27 0.27 0.38 0.48 0.86E 0.16 0.16 0.22 0.27 0.27 0.38 0.65K 0.27 1.60
K + 2 ft W 0.22 1.9K +6 ft W 0.86 1.3K+8 ftW 0.27 1.9
J 0.16 0.27 0.27 0.27 0.32 0.59 1.0J + 2 ft W 0.27 1.1J + 4 ft W 0.27 1.1J + 8 ft W 0.27 1.6J + 10 ft W 0.22 1.5
*All values should be multiplied by 0.337.
77

* 6.7 x 6.5 6.0, G,x 5 .8 X 6. xH
* 6.9 6.7 X r67
®6.4 ~ ~ ~ ~ ~ ~ ~ .x. II@ x x X I
c . . 9A . 4 x 4. ,3 .
OF~~~~~~~ý TH5SFHUEFRp=6.7FT
A . .4. 5A 5.9 5 5.9 . . . .
B 6.9 7.0 7.7 7.5
C , 5.7 6 .4 6. 67
X .4 •. _
E 5.4 X66.7 -- 3 5
Fig. 3.36--28WF house, 3-ft level, first floor, p= 63.7 ft. (All values should be
multiplied by 0.337.)
TABLE 3.23-VERTICAL TRAVERSES FOR THE FIRST FLOOROF THE 2SWF HOUSE FOR p = 63.7 FT*
Position I ft 3 ft 5 ft 7 ft
A 4.8 5.7 5.9 5.9B 6.9 7.0 7.7 7.5C 5.7 6.4 6.8 6.7E 5.4 6.0 6.3 5.8
*All values should be multiplied by 0.337.
78

x x Are x7.0 7.3 5.2 .9 L
5x
xx 5.3.'t
O T4.7
B. 1!4 .9 74 .
4.2x x x AO1ý x x x x x x x
9 5.7 S3 418 1. A2 A8 -1/ 48 3.8
EC'5 4.5~ I;.1
mulipie by ue sou0.337.)lid y .37
Af 29 44
B. 6. x . . .
C"- 4. 5.9. 6. 6.9
mulipie vaue shul.b3ulipie7y..37
TABE 324-ERTCALTRAERES OR HE ECOD FOO

•1 •..N--
@0.73
@2.2
@3.72.
01.2 1.9
Fig. 3.38-2SWF house, 3-ft level, basement, fill-in sources.
TABLE 3.25-VERTICAL TRAVERSES FOR THE BASEMENT
OF THE 2SWF HOUSE FOR FILL-IN SOURCES
Position 3 ft 5 ft 6.5 ft
B 1.2 2.9
C 0.73 12.3
E 1.5 7.9
K 1.5 10.8
K+2ftW 5.8 11.0
K+6ftW 1.5 2.9
K+8 ftW 1.8 3.4
J 2.2 2.9
J+2ftW 2.2 3.2
J+4ftW 2.2 5.1
J+8 ftW 2.2 5.4
J + 10 ft W 1.5 10.5
D+5ftS 2.2 33
D+ 5 ftS + 2 ftW 3.4 16.1
D+5ftS+6ftW 2.9 8.8
D+5ftS+8ftW 3.8
D+5 ftS+10ftW 7.3
D+5 ftS+14 ftW 3.7 7.3
B+5 ft S 1.9 37*
B+5ftS+2ftE 2.9 11.7*
*Top of shelter.
80

1 I/.7× 1
A 51 9.9 132 4.
B l. 1 9,.0 17.5 15.5 12.4
C O. 217 23 1.5 1.
E 9. 37 26.0"21.
•17,5 ,x 23 X 3 81

X /0.2
X 9/
X944
886 9.5 6.8 9.5 x 9. 69 99 8.8 6.6
S Xx )( I~ I--.-.X IX
&C x x x A(& 9.6 x x x
X 0.
X to.2
Fig. 3.40-2SWF house, 3-ft level, second floor, fill-in sources.
TABLE 3.27-VERTICAL TRAVERSES FOR THE SECOND FLOOROF THE 2SWF HOUSE FOR FILL-IN SOURCES
Position 1 ft 3 ft 5 ft 7 ft
A 10.2 9.6 9.4 8.0B 8.0 7.3 5.6 5.0C 8.8 8.8 7.3 6.1
E 12.4 9.6 8.8 7.3
82

Fig. 3.41-2SWF house, 3-ft level, basement, sources on west half of roof.
TABLE 3.28 -VERTICAL TRAVERSES FOR THE BASEMENT OF THE
2SWF HOUSE FOR SOURCES ON WEST HALF OF ROOF
Position 1ft 2ft 3ft 5ft 6.5ft
J <0.05 <0.05 34* 3.4 4.2J+ 2ftW 2.5 2.5 2.5 4.2
*One in. above top of concrete blocks on table top.
83

FX 3,4 f fr co s fo
TBX 33O
x 6S.5 A(& •85 2 1X
B 64 .17.6 8.5
x 5 •.5 . LANTED 8 10.2 10COL-UMNl I
X 61+o 1-
x 6.6 , ~ .
*MaXre alon slant.~
Fig. 3.42-24WF house, 3-ft level, first floor, sources on west half of roof.
TABLE 3.29-VERTICAL TRAVERSES FOR THE FIRST FLOOR OF THE2SWF HOUSE FOR SOURCES ON WEST HALF OF ROOF
Position Floor I ft 2 ft 3 ft 4 ft 5 ft 6 ft 7 ft Ceiling
A 6.4 8.5 21.2B 6.4 8.1 7.6 8.5
Slantedcolumn* 5.5 6.4 7.6 8.5 8.9 8.5 10.2 10.6 10.6
*Measured along slant.
84

0647.6 x E® . x F ®ýx .18E 8. 76.4II •"' II × 7.6X I
x // 9 /012,o., ,2. ,,x,. / #Sx. x x x x X x
Z / ,. 9 .x
/9.1 1 8 .7 1 7 .8 1 /4 .
12.78 18.7I
/p /61/o , /7.0
x /9,/ x ®orrom 0 ]T . T R F5EANMD CLOOOTN
* /S.7 23.8 X
X 25.4 23.: 23.3* /7.6 .2
1124.6)< 18.2 y
21.
2 X, 5TO Apr
B 7 0 20.4 2 2 r4 CO8U.V
Fig. 3.43-2SWF house, 3-ft level, second floor, sources on west half of roof.
TABLE 3.30-VERTICAL TRAVERSES FOR THE SECOND FLOOR OF THE2SWF HOUSE FOR SOURCES ON WEST HALF OF ROOF
Position 1ift 2 ft 3 ft 4 ft 5 ft 6 ft 7 ft 8 ft Ceiling
A 15.3 19.1 23.3 27.6B 14.4 17.0 21.2 27.6C 11.9 12.7 14.4 21.2D 5.1 6.4 7.6 5.1E 6.8 7.6 7.6 8.5F 5.1 6.4 8.5 5.1H 12.7 16.1 17.0 16.11 20.4 25.4 32.2 48.4
Slantedcolumn* 19.1 18.2 23.3 25.4 31.4 33.9 40.3 46.7 59.4
*Measured along slant.
85

x 6.3 C EG •xX7.7 @65 6.3 (F
x 6.7 Z8.8 @ 6.5' L l
6.3 @ ', . ( z--
C 9.8 @ .5, 1/-4.6xx
6.3 % /7./
v CA' op or SHELrZR 1900F
Fig. 3.44-2SWF house, 3-ft level, basement, sources on entire roof area.
TABLE 3.31-VERTICAL TRAVERSES FOR THE BASEMENT OF THE2SWF HOUSE FOR SOURCES ON ENTIRE ROOF AREA
Position I ft 2 ft 3 ft 4 ft 5 ft 6.5 ft
A 2.9 4.6 6.9B 1.1 0.8C 5.9 6.3 7.1E 6.3 7.5K 6.2 7.6F 1.8 0.8 7,1* 7.8
*B+ 3ft SE 2.5 1.0*B+6 ft S 2.8 2.9 8.6 f*B+ 7ft SE 4.2 4.6 10.8tK+2ftW 7.1 8.0K + 8ft W 5.7 7.6 8.5
J 1.1 1.1 8.6* 9.4 10.8J + 2ft W 5.7 7.6 9.6J +l10ft W 4.6 6.9
*One in. above concrete blocks on table top.
fOn top of blocks atop shelter.
86

(2)El• x x F(S12.4 /3 ,.8 18.6 10.3
.:1 x• 1.
X x< X X x x x ix•12.6 /U• A44 1-%2 14.7 15.4 X 13.8 /1
16.1 67x14.9 /M
/. , 16.5 /814 /8.4 /7 8 /2 /6.7116J61.7A7
X 13.7 17.
X
/x6.1 x
/4 X /4.9 x N -1 .
012.6 X13,1 X • 1. 11.5
Fig. 3.45-2SWF house, 3-ft level, first floor, sources on entire roof area.
TABLE 3.32-VERTICAL TRAVERSES FOR THE FIRST FLOOR OF THE2SWF HOUSE FOR SOURCES ON ENTIRE ROOF AREA
Position 1 ft 3 ft 5 ft 7 ft
A 14.4 17.2 20.7 25.3B 10.9 12.6 12.6 15.8D 10.3 12.4 12.6 15.4E 11.5 13.6 16.7 18.9F 9.8 10.3 11.5 12.1H 10.9 11.5 13.6 15.5I 13.0 14.5 17.2 17.9
87

&D0
E39
Fig. 3.46-2SWF house, 3-ft level, second floor, sources on entire roof area.
TABLE 3.33-VERTICAL TRAVERSES FOR THE SECOND FLOOR OF THE2SWF HOUSE FOR SOURCES ON ENTIRE ROOF AREA
Position 1 ft 3 ft 5 ft 7 ft
A >28.7 >28.7 >28.7 >28.7B 20.9 28.7 28.7D 20.7 23.9 27.6 >28.7E 26.4 >28.7 >28.7F 17.8 20.7 24.1 >28.7H 20.9 25.0 28.7 >28.7I 27.6 >28.7 >28.7
88
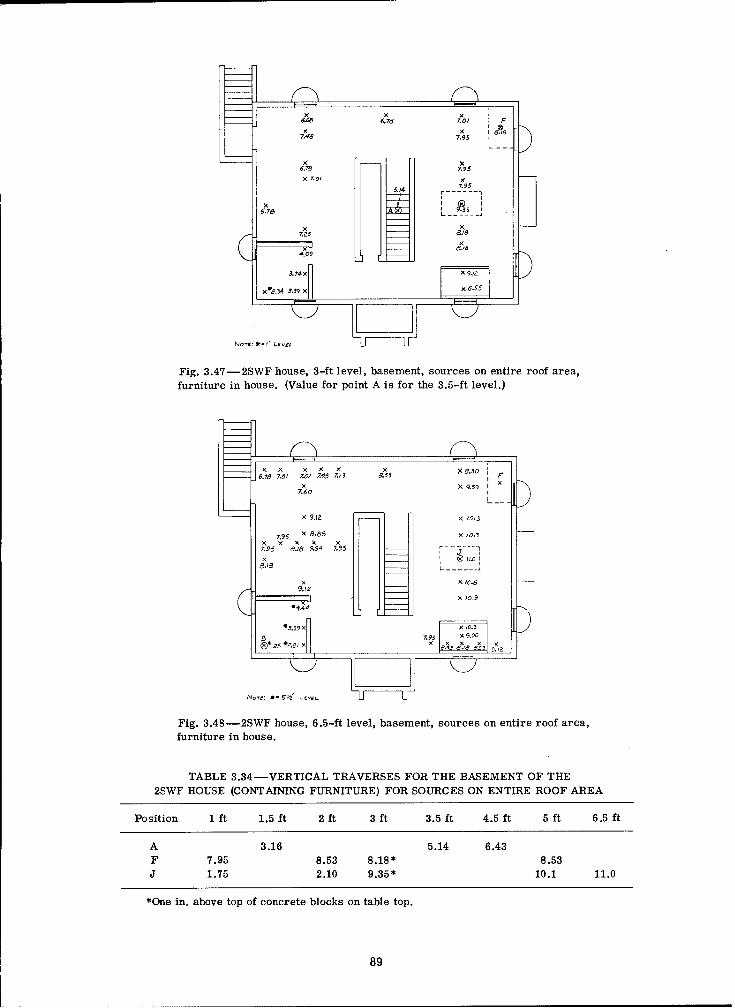
648 6.78 701 I
6.-M 7.95
i x
Not '7 L e? _5 _a
x .0 ; I x-
6 .76 2X--xI K
Fig. 3.47--2SWF house, 3-ft level, basement, sources on entire roof area,furniture in house. (Value for point A is for the 3.5-ft level.)
P.f3 3 f 4.59
A 3.16 3 6 x 8.3
7F95 X 8.88 X 8.18*8.5Sx x x W
7J95 1.18 9.94 71195.0
19.89
EJ jx 10.9
Fig. 3.48--2SWF house, 6.5-ft level, basement, sources on entire roof area,furniture in house.
TABLE 3.34--VERTICAL TRAVERSES FOR THE BASEMENT OF THE2SWF HOUSE (CONTAINING FURNITURE) FOR SOURCES ON ENTIRE ROOF AREA
Position 1 ft 1.5 ft 2 ft 3 ft 3.5 ft 4.5 ft 5 ft 6°5 ft
A 3.16 5.14 6.43F 7.95 8.53 8.18" 8.531 1.75 2.10 9.35* 10.1 11.0
*One in. above top of concrete blocks on table top.
89

ngq x X /$0x I
x, x x "x x J • X 4.
S1 78.1 1. - X
Fig. 3.49--2SWF house, 3-ft level, first floor, sources on entire roof area,furniture in house.
TABLE 3.35--VERTICAL TRAVERSES FOR THE FIRST FLOOR OF THE2SWF HOUSE (CONTAINING FURNITURE) FOR SOURCES ON ENTIRE ROOF AREA
Position 1ift 3 ft 5 ft 7 ft
A 16.0 18.7 24.0
B 14.1 12.9 17.5 17.5C 10.8 12.9 15.4 18.1E 11.3 13.1 14.8 16.1
E + 3 ft 6 10.9 13.1 14.6 15.8
H 11.6 12.9 12.9 17.2I 13.4 15.2 17.5 20.2
90

/07onoe/or o)
'CAA
41.2
7/.7 &/ •elle/ (AL,,. -f 3)
Fig. 3.50-2SWF house, 3-ft level, second floor, sources on entire roof area,furniture in house.
TABLE 3.36-VERTICAL TRAVERSES FOR THE SECOND FLOOR OF THE2SWF HOUSE (CONTAINING FURNITURE) FOR SOURCES ON ENTIRE ROOF AREA
Position 1 ft 3 ft 5 ft 7 ft
A 36.9 44.2 59.0 73.7B 22.1 25.8 36.9 29.5E 28.0 31.7 42.8 51.6
91

r -,
0156 0.2,O .1
x x x 0 ,0.2 0.0 0.2/
x x
Fig. 3.51-2SWF house, 5-ft level, basement, sources in roof gutter (east).
0.7 86 .9 V. V73 -0,83 o.6 IL
x
0..32
0.4 .2 030 a33 0.29 0.27 ape
Fig. 3.52-2SWF house, 5-ft level, first floor, sources in roof gutter (east).
92

.Saurces Lcd // G;,1qe,-
(i
x x x x x2V 2.97 3.09 2.94 2.7 .67 R5
o.o.93 o7'
0x3 0o, 56 0.3 x Ol x 0.39 x.1 x x0.3¢ 0..5 0.37 10.37 0.39 0.43 0.36
Fig. 3.53--2SWvF house, 5-ft level, second floor, sources in roof gutter (east).
S/.0 ./3
x N/ L xo.x
k3 Z13.5F?-#
03 0.1 0.72 7.'
ria
0.-8
x ®
0.5 + 0 57,3.33 0./7
13 .( .8 03 .28 9 1 0 .. M 3.3
=.1 3 4 .
4.29 2.43 U9R2 2F .43
JOD 0 G O
Fig. 3.54--PCC house, 3-ft level, p = 25.5 ft.
93

C x Q
/.•o /.719 -Y.•f F '" 9
N A~,//20
A&
17.77x
K po 432
2.9 4277 ," 1.70 Xx xx xx x x x . --//2o1J 2.81 Zf• 3 Z01 x
Fig. 3.55-PCC house, 5-ft level, p = 25.5 ft.
TABLE 3.37 -VERTICAL TRAVERSES FOR THE PCC HOUSE FOR p = 25.5 FT
Position 1 ft 3 ft 5 ft 7 ft
A 0.43 0.98 1.70 1.91C 1.15 3.40 3.62 3.15D 0.85 1.11 1.02F 2.98 4.68 5.11G 2.34 2.04 2.34H 7.23 4.43 3.19 2.38I 1.91 5.74 5.06 5.11
I + 5 ft S + I ft E 1.49 2.77 2.681 + 5 ft S + 3 ft E 1.62 2.81 2.77I+5ftS+5ftE 1.70 2.94 2.64I + 5 ft S + 7 ft E 1.45 2.13 2.00I + 5 ft S + 1 ft W 1.28 2.43 2.55I + 5 ft S + 3 ft W 1.28 2.55 2.30I + 5 ft S + 5 ft W 1.15 2.04 1.96
I + 5 ft S + 7 ft W 1.06 1.70 1.70J 1.45 2.43 3.23K 0.51 1.28 1.49M 0.98 2.43 2.30P 0.43 0.72 0.64 0.60
94

0.35 A 13 I .7x x x x x x x x x477 0,.19 ogs /I/ /.,/
XO69 X A/
X 47 XO-r7 x A/
XO.6/ X 0,88
xx 0.76
0.4 o0C 4S7 44C9x x x x xxx
0.34 J38 053 .1 /ix - .
6
x0. 416 /"0.84 099 1.2
XX"0
043 /-I 1.3
W /..x.. x xx X x x x 1 x / .X X9 X X01° X 9 X
XI .7
xz'7 .4 1.. X2. 1.20..8 6
x 2.3 xS. /i 0.-9x 1-7
Fig. 3.56--PCC house, 3-ft level, p 42.5 ft.
Is ,1.1.1x x
XX X 9 x 1 .72.2
I -- x l
x/.o 0.9230
1.7 1,2M, , x x
x x x x Z. 7
Z22
2.1 Ad 2.0X 2.& x x
Fig. 3.57-PCC house, 5-ft level, p = 42.5 ft.
95

X2.7
xa99
Xa57
XI.,
x x X X x X x/.1 4 1.4 A .S /-# 4. A4 /./ O0.9.
Fig. 3.58-PCC house, 7-ft level, p = 42.5 ft.
X Ex x x x x (9 x
/ 83 4.0 / .o f A. 9 F .1 S /. O OL /. 3/ k / .7 5
5V F
4477
S X X 'X XO.35 AS -g"(.2 A.06
A
2.2/ 0.3,30/'•• -. ,@/09a L a V1.25
~ 0 .4 6 9 1 , /~/ I HA I
Fig. 3.59-POC house, 3-ft level, p = 42.5 ft, concrete blocks in exterior open-
ings of living room.
96

J E X X X X P .O0.00 z 0 2
F
SIxAS 1.93 "
A®0.69
0.079@7 0 .•9 46 2.7S
oz7 ' @7'1 77P7 X
0 069 o-0759~7' 0.62@7 8) x-06 7" 07' 1.94 2.60
11,38 ..91
Fig. 3.60-PCC house, 5-ft level, p = 42.5 ft, concrete blocks in exterior open-
ings of living room.
TABLE 3.38 -VERTICAL TRAVERSES FOR THE PCC HOUSE (WITH CONCRETE BLOCKSIN EXTERIOR OPENINGS OF LIVING ROOM) FOR p = 42.5 FT
Position 1 ft 2 ft 3 ft 4 ft 5 ft 6 ft 7 ft 8 ft
A 0.33 0.52 0.69 0.62C 1.35 1.67 1.67 2.29
E + 4 ft N 0.69 0.75 1.25F 1.31 3.04 3.04
F + 4 ft N 1.15 1.33 1.98H 1.62 1.62 1.87 1.83
H + 4 ft E 1.33 1.29 2.71I 0.46 1.17 1.04 1.04J 1.04 1.08 1.98K 0.65 0.75 0.79M 0.94 1.04 1.04 1.06 1.94 2.29 2.29 2.290 0.37 0.52 0.75 0.75 0.79 0.79 0.79 0.79
O + I ft E 0.75 0.75 0.770 + 3 ft E 0.69 0.77 0.870 + 5 ft E 0.69 0.75 0.75O + 7 ft E 0.69 0.69 0.69
P 0.31 0.52 0.48
97

xx x x
Aa,1/1.23 1.3 I, x x
A%
131 / 1.3 MY
x x \ X X X/M P V.8 / ..143A xx
x x X x
M m1 18 /Joy, IA ,'.
/4..343 82/1
Fig. 3.61--PCC house, 3-ft level, sources on roof. (All values should be multipliedby 1.12.)
S137 M&2 V-5.x x x x x x
19.7 2o.? 26-ý# 'Z
/7.7 /5.2 Be
Z..118 7.
/ ,101'Y 1)'7. ' 17"7,'.? "j x x
/8.7 PIP.
-x , x x *771L I'm. x x , /7.2
/LIe'. 7' W777 /7.797'
T E 3 V9T E FOR TE HUEO O
x N N
by 1.12.)
Position 1 ft 2 ft 3 ft 4 ft 5 ft 6 ft 7 ft 8 ft
A 14.3 18.2 17.7 20.2H 8.2 10.6 13.8 20.7
M 13.8 15.7 16.7 19.2 21.1 20.7 22.2 38.4P 10.3 11.6 16.2 20.2
•*All values should be multiplied by 1.12.
98
, N

3.39 8 3.6I45X 'A~O5 V.5 L.5
x x4 6Z 619 6,5 6.79 5.5/
6.78436, x X x
J ./S 6.73 //7X) x X x A3
Fig. 3.63-PCC house, 1-ft level, sources on roof over northwest bedroom.
x0-/#
0.02 0.44 0.18 01~ 0.09
6609 0.9 /.k4 0.73 0.44xX x
~ ~ 0.05 x
x 0.14
x xo. o a "0,14 • O.O.O
"90 HXO./4 ixJ 6,15
Fig. 3.64-PCC house, 3-ft level, sources on roof over northwest bedroom.
99

-Co 05607o x
:'•_T_..-..-S "L • 7-07 8,26; Lý
x0.0.5 0,8307- 'f, x X 37
xo.ox o *> I-x\ x x x
x 0.04 2.#>115
X0.0 10X X X x57@7
x o.O- •" ,• 2.x
S X 0,0911 ' l.I$
X 0.05 X X>117 10. 7.57@7'
x
069 2 O.C.
0.46
x
0. x2&
Fig. 3.65--PC house, 5-ft level, sources on roof over northwest bedroom.
x -. x x F 0
I14.8 0.47o 4.71/
..o I 042 . 9 5 /
X x x. ® ® 0
7.,07 2.,81B •D7 9#
- X , /
Fig, 3.66--Rambler house, 3-ft level, p = 25.5 ft.
100

4 .22 5.716 7.1- 9.13
9.84 2 943
Fig. 3.67-Rambler house, 5-ft level, p = 25.5 ft.
TABLE 3.40 -VERTICAL TRAVERSES FOR THE RAMBLER HOUSE FOR p = 25.5 FT
Position 1 ft 3 ft 5 ft 7 ft
A 0.42 1.97 2.46 3.02B 14.1 11.9 9.84 7.03F 14.8 13.4 10.4H 14.8 10.2 13.1 7.73
H + 4 ft E 4.08 9.56 9.13H + 4 ft S 10.5 10.5 9.28
H + 4 ft S + 4 ft E 2.46 6.68 7.73J 4.22 4.92 5.62
J + 4 ft W 4.64 5.97 6.82J + 4 ft S 1.55 3.16 4.71
J+4ftS +4 ftW 1.76 4.50 5.83K 0.35 2.60 3.72
K + 4 ft N 0.56 2.53 4.22K + 4 ft W 0.70 5.06 4.22
K + 4 ft N + 4 ft W 0.70 3.86 5.06L 8.93 9.13 8.43
L + 4 ft N 17.2 9.49 9.13L + 4 ft E 0.84 6.46 7.03
L + 4 ft E + 4 ft N 0.70 5.97 6.75P 0.49 1.41 4.78 4.57Q 0.14 <0.05 1.05 1.05
101

X XF
/.4430
.5 /14 5.15 /R.0
- 0 o9 5,71 - P62@1' tX X )X X X X X~x ,
W1.2 6399 M.? 4.37 6og 4.9s4 Ole 4 ý.•,/o/
'0.5 5,43
,34741'4,9 4.P'6 ,
X; X ZI X × X
/2.9 7 97
x 218
/48 /2.4 1/.2 9.8. 9.09 3.83 11.2 /3.9x x x >x/,o - . / .@'•• '
Fig. 3.68-Rambler house, 3-ft level, p= 42.5 ft, concrete blocks 24 in. high alongexterior walls of living-dining area. (All values should be multiplied by 0.333.)
Fig. 3.69--Rambler house, 5-ft level, p= 42.5 ft, concrete blocks 24 in. high along
exterior walls of living-dining area. (All values should be multiplied by 0.333.)
TABLE 3.41--VERTICAL TRAVERSES FOR THE RAMBLER HOUSE FOR p =42.5 FT*
Position ft 2ft 3ft 4ft 5ft 6ft 7ft 8 ft
A 2.44 4.21 5.06 5.34 6.28 7.21 7.12 7.02
F 5.43 12.6 13.6 13.7
H 13.9 14.5 13.6L 3.75 10.1 13.1 12.6t
M 3.47 4.21 7.49 10.5 10.8 11.2 11.4 12.0
P 3.75 5.62 8.90 9.37Q 0.56 1.40 2.53 2.25
• All values should be multiplied by 0.333.
tone foot south of other instruments in this traverse.
102

X2. x x rJ J. 3 4 . 7 3V . 7
x
xx x36.0 7.1 7.1 2.1 149.42
4W .0 4.9 0x x IW x x lx 4.4 x • x IT0
3S. 31 4* 2.3 4.1.4 4ý 70.S537.9 55 42.3V -2"•1 46,6@ 1 42.3 @ 1
X JI.4 X &o X d. '. .X12. / 5ý, 3 "-. 0 4 .
x '0--T 49.49j 8/ 5 48.091
S9.3 45,9@1 "x38.1 X. 6O.
7 x x x x,
4C9.1 6. " 3 "7.9 452x 62.3 51.54f 49O.* /4* o÷ IIZ3 4e.0 42.1
4 •4.461 " 4.1301' 4P,301' 4 9 l4
L x X J X 5-4- 1 'x x .7 X- . '
Fig. 3.70 -Rambler house, 3-ft level, sources on roof.
Fe449
49.4
M077.6
Fig. 3.71-Rambler house, 5-ft level, sources on roof.
TABLE 3.42-VERTICAL TRAVERSES FOR THE RAMBLER HOUSE FOR SOURCES ON THE ROOF
Position 1 ft 2 ft 3 ft 4 ft 5 ft 6 ft 7 ft 8 ft
A 42.3 42.3 49.4 54.3 60 67 74.8 86.1F 26.8 31.7 40.9 62.8H 41.6 49.4 64.9 88.9L 38.1 42.3 49.4 55.0M 50.8 58.6 59.3 67.0 77.6 84.7 97.4 109P 42.3 53.6 60.7 81.1
Q 4.2 7.1 7.1 4.2
103

x xO.,' 0.1 xW IAA-Vr. hx X . .S0.2. .30 x 0.21
0 .23 0 x
x 0?J .2 /
0.2xsa.• A .
o.x x .x S0.24 o D ~z
0.09 •O./S" O,09
X X X
Fig. 3.72-2SB house, 3-ft level, basement, p =25.5 ft, sandbags in four
southernmost windows.
x LK
0- 6 7' 0.0v -I 3. C.1 6610
xO.•3B@ 7" 0. 3 40• 7'
0. ~ ~ ~ O #3tP 7'7"eva
Fig. 3.3 - o s, 5-f. le eXbs m np =2 .5fs nb g nf usou-er8os 0-indows.7
104
;~ ~ ~ ~ ~ ~~~.TO 7' I IIII I I I I

TABLE 3.43-VERTICAL TRAVERSES FOR THE BASEMENT OF THE 2SB HOUSE FOR p = 25.5 FT
Position 1 ft I ft 3 ft 4 ft 5 ft 6 ft 7 ft
A 0.21 0.21 0.23 0.28 0.19 0.30 0.26F 0.06 0.09 0.19* 0.26t 0.51
*Two inches above table top.
tSeventeen inches above table top.
11.45 4,7//3..2
0.I r
X l.
x c x x x x
xI1 z .rs
II
xI .
Z,7927
Fig. 3.74-2SB house, 3-ft level, first floor, p 25.5 ft, sandbags in four
southernmost basement windows.
105
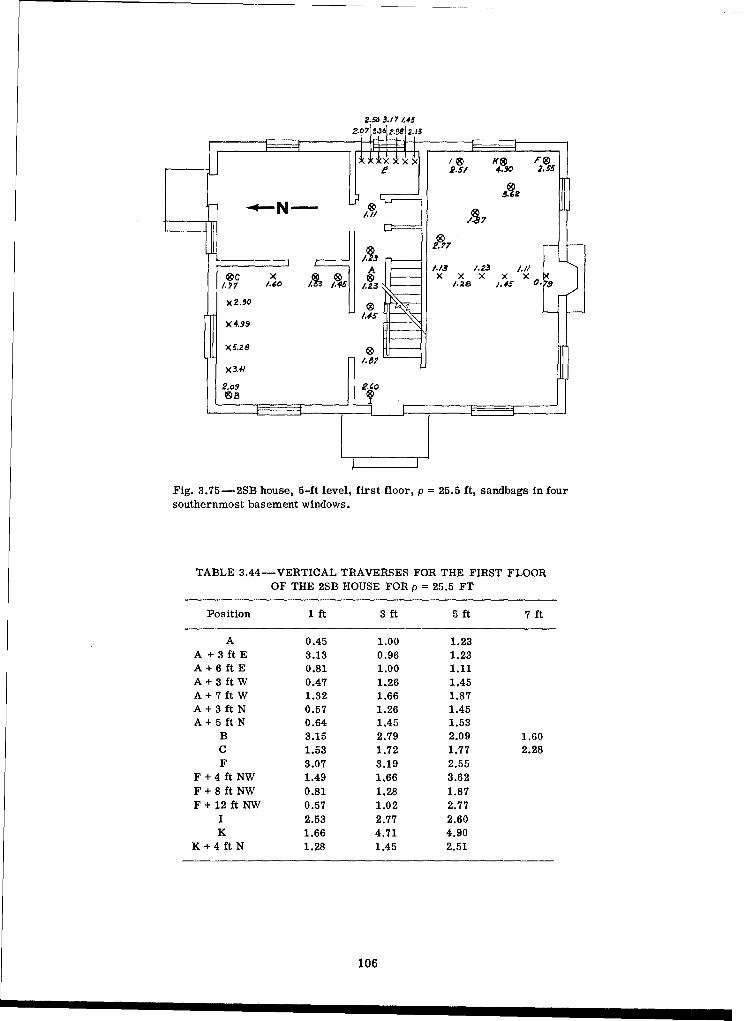
2.5M 3.17 1.452.07 -36 2.-8 2.13
I. 5-' , .3 2. 55
2.77
A AM.5 1.23I
0 c x 0x .x xX 2.90
X4.99
Fig. 3.75-2SB house, 5-ft level, first floor, p = 25.5 ft, sandbags in foursouthernmost basement windows.
TABLE 3.44-VERTICAL TRAVERSES FOR THE FIRST FLOOROF THE 2SB HOUSE FOR p = 25.5 FT
Position 1 ft 3 ft 5 ft 7 ft
A 0.45 1.00 1.23A + 3 ft E 3.13 0.96 1.23A + 6 ft E 0.81 1.00 1.11A + 3 ft W 0.47 1.26 1.45A+ 7 ft W 1.32 1.66 1.87A + 3 ft N 0.57 1.26 1.45A + 5 ft N 0.64 1.45 1.53
B 3.15 2.79 2.09 1.60
C 1.53 1.72 1.77 2.28F 3.07 3.19 2.55
F + 4 ft NW 1.49 1.66 3.62F + 8 ft NW 0.81 1.28 1.87F + 12 ft NW 0.57 1.02 2.77
I 2.53 2.77 2.60K 1.66 4.71 4.90
K + 4 ft N 1.28 1.45 2.51
106

;0.08 XO.05
0.13 XO.08 X635
045 X0.05 x ×o j x __W_ x0x05 xo.o a3 xx -7.7Ir"=
O.3 X0.05
i 0~o 1 xo-, xo.oa
Fig. 3.76-2SB house, 3-ft level, basement, p = 42.5 ft, sandbags in foursouthernmost basement windows.
oo09ý 7"
0 .0 3 X 0.01 x X
x x• o-• 030/ 7 O0.0/'.
I o.,x7 °x °x o.,I C .•LO 7 "1 .2 l ' 0.13@7
x0.13 7"
Fig. 3.77-28B house, 5-ft level, basement, p = 42.5 ft, sandbags in foursouthernmost basement windows.
TABLE 3.45 -VERTICAL TRAVERSES FOR THE BASEMENT OF THE 2SB HOUSE FOR p = 42.5 FT
Position 1 ft 2 ft 3 ft 4 ft 5 ft 6 ft 7 ft
A 0.11 0.11 0.13 0.11 0.08 0.11 0.16F <0.03 <0.03 0.13* 0.11 0.21
Entrance 0.05 0.05 0.03 0.13 0.42
*Two inches above concrete blocks on table top.
107

[~~~~25 [ ; 1.45 IZ • 10•
x ×®x E
0.68 /.26
II 1 X0.7ýCX'
x x x x x X
XA X 0.7/@/ .
09 0c 5.79
X2,•2 X .•50.97
®c x ,(M/ 0.7
AIC 92 x A
x 1.7/ x
X2.1s.5 0.97p
xZ.23 X09 I•÷ X
Fig. 3.79-2SB house, 5-ft level, first floor, p = 42.5 ft, sandbags in foursouthernmost basement windows.
TABLE 3.46--VERTICAL TRAVERSES FOR THE FIRST FLOOR OF THE 2SB HOUSE FOR p = 42.5 FT
Position 1 ft 3 ft 5Sft 7 ft
A 0.34 0.66 1.00 0.79B 0.95 1.10 1.24 1.31C 0.79 0.79 1.31 0.79
E 0.74 1.97 1.97
108
Or , x n X X X X X ix1

I __ 5 1
7503•47"
5"00eC 47"5-7535 O •' Q30urc•
100,! Z03'/4o(C 47")
1/ 00 C 23'
24041047" 32091D 47"
Soo P 35' J70 35 "
4oo 2ý.3' (- OO.923"
Fig. 3.80-RMB house, relative dose rate as a function of horizontal positionand height above the floor; source height = 47 in.
109

1705
1.91 . 70 4
.91.9/
.109 9.1
.9/. Zx-.'0271
_x U. 9 z 9.7
XX X M4 /\X 1.9 &2
x X 1 X
X X X/ X4.0 33.3 4 9.3X
Sx X X X
14. 33. 0 A4 9-f3. 53 1\9 5a A2 n-6 n S "4 -3X 9,Sj X.U.A X 1 0'6 X ,2
I,1 X X X ,,/ )4
77 2 / - 0.f, 0.29 /'S 9 0
11.8 14.9 24
"2-2 41.3 • • 0.2
6. 3X X X / 14.0
. 7.94 Z3.2
2.14/0.
Fig. 3.81--2SWF house, reciprocity exposure, Cog0 source 3 ft above first floor,
center of house.
110

750 11.00
,, o ,.;---777-Z \ \83 h
xxx x x•, ,,•275 40"6. - 1 .6.2
$.50 22.9 .o 300 3.19 633
F3ig8 X 48 s 3 # a 0econd40.4 '0 S0. * 290 /1.1 91/6 89.3La 32.0
23.7 1105 46.5 /.X 2 9- 7 X 7 9.3, X 7 2 .5 ,'4
4 ; - AI0.83 1 0.83 a6ý7 0. 7
X X X216.7 /04 78.2
45T8 93.2 .36.19R/7 /3.3
,17X - X - X7.8334".3 64.9 412
8.33 5.,0725145 8.58 / 20
Z.9
Fig. 3.82-2SWF house, reciprocity exposure, 0060 source 3 ft above secondfloor, center of house.

.- N-N
0X7/ X
3.5 .0. 5,.% .e M O. 5 ..$057
6214
0. 77.3
0.7+A
8.:r*~0 /d 7-Z e
/S. 3 17-B o.7 320
a."0
Fig. 3.83--2SWF house, reciprocity exposure, Co0 source 3 ft above floor atcenter of north area of basement.
112

iF.X22.?j x ...
5.,4 , o /6WO ,/8.0 (A•2C Co'0
... r 0.A .3 0.,35 0.3, 0.!3
27J a.37 1~= .31 • ?z,,
XX
29.8 /i;.÷ /.
Xc 1 . .. X. 09
13.4j
3.96
Fig. 3.84-2SWF house, r'ecipr'ocity exposure, Co6 0 source 3 ft above fir'st floor',
1 ft from north end at center of house.
113

05 0.3
Fig. 3.85-2SWF house, survey instrumentreadings, 3 ft above basement floor, 8.4-
0.4 millicurle Co8 0 source 3 ft above center of025 first floor.
0.2_
O.SO dC5 0.#]S
oAs 0.40
Fig. 3.86-2SWF house, survey in-?strument readings, 3 ft above firstfloor and 1 in. above ground, 8.4- . 0.30
millicurie Co8 0 source 3 ft above .J.center of first floor.
2 0&0 0SO 0SS .
0.25.s oo o ,----
0.40.
0.35S.-/.40 oý oc Fig. 3.87-2SWF house, survey instrument read-
ings, 3 ft above second floor, 8.4-millicurie Coo0
source 3 ft above center of first floor.0.3S
0.40• Ilo.•l.as"0.SS 0.40 0.10
114

0.2050.2
00.04
a/I
Fig. 3.88-2SWF house, survey instrument readings, 3 ft above basement floor,
8.4-millicurie Co ° source 3 ft above center of second floor.
0.2
Fig. 3.89--2SWF house, survey instrument readings, 3 ft above first floor and
1 in. above ground, 8.4-millicurie Co6 0 source 3 ft above center of second floor.
115

0,&0 1.1 0.dO 0.50 0.35
0.07 .c, 3',
r 2.0 /.0
0. ?O
r ~0.19Sooo ~~iio• ooI
.I e .0 O .1 I0
Fig. 3.90-2SWF house, survey instrument readings, 3 ft above second floor,
8.4-millicurie Cos° source 3 ft above center of second floor.
--; r24"o3 a,$5 O.LIS a16•
S0.2 0 1 -0 5 a m5 0 , 5 0. 2
O.L5 avs 0.0 .1
6. 0o,35 0175 ors o.Ir
oIL 0,35 oa6 0.4 0,
Fig. 3.91-2SWF house, survey instrument readings, 1 in. above roof, 8.4-
millicurie Coso source 3 ft above center of second floor.
116

Xo.5
0.0 ~ ~ ~ p~r - w O3a
0.43 4 ( ) X X9 .4/ I o.,S. 03 21 .7 u // U .3
a26 '. 08
S0.0 _j 0.1x7 0.4,3 • _ /7/ _5 _ 7 /,• _., 2 1.1 *0 .1 °'.0z x C x x Cx x
7.09
.94'N0.43
1°a,./ /1',? ' 0 a' .I '•" 3 "' ' X l' I 0.43
•- 0 .I 04f O .2M . S1 S.315 1/4/ .0 8 AP 0-#3 a;,0, X X X X X X X X X X •
0.4.0 1R 0,2 . " o . .4 7 1 7 / .9 3 / Y ..t , / .0,0 3 8 o oS a l '
O Z 0.1), 0.43 IM , ., $7. t.0 4-62 , o, K O,
------- I - •--- -- < -• -'- 775 71- "
.5 0 0 . / 03 0 0.
1.1I
Fig. 3.92--PCC house, reciprocity exposure, source 3 ft above floor at point
near center of house.
117

S 0.24
0.10..
/./
0.~CO 0..38.0~0
-C./\ 0..
0.j
0 z.6 a ./ <a/ .0.1 .1 J. A
X I
0d&/ o /4. q2 410. 0 .4
0.7.3 .A 48 7 3 A
X X X K x X X X X X/ -
Fig. 3.93--CC house, reciprocity exposure, 2.1-curie source 3 ft above center
of northwest bedroom floor.
118

b 3
RooF
"z.X109107
Fig. 3.94-PCC house. reciprocity exposure, 2.1-curie Co 6 source, dose rates at center of northwestbearoom 3 ft above floor.
119

b.g.
120/

0,35•\: "\ 0.3
,•X 2.6f
X23 2..4. .11 x .23 .,•
4.1 l 4 ,7 J, Z" 46 1
• \x x x.#
I 4.23 A./7 V
t71
~~ /1.I 2.06
0.47
S0,9
Fig. 3.96 -2SWF house, CsI37 source 3 ft above center of first floor.
121

404
~.07 .9 7.S /?1./74
/0
x X
";' r A' + ASJ?
" X Xx
.3l 10.4 "L1.
xI xx
R. 3 IAS, 7,//4D 12 0
l4& + . 0 IN?- - n4 73
'0.7 x.x
122.
Ko ,5
Fi -73. 7-2 W house Cs10or e .1ta o e et ro ec n l o . lvl e
on crcle n =2 t n =6 sh uld e m ltipied y 0..5.
• ' 'I l 1

0.49 0.x06
A-r 0.8 06x.505
H 0.6 0.8 1.5 3.0P5 0.0 0.14/ 0.18 0.11 0.2
x0.94r, 0.53
P x
0.x x 71 .6 0.70$2/ 0.77
7<0.77 X /.a/0,87 X
0.75 0.63 0.&3x o-84- x X dvo
Fig. 3.98- PCC house, 3-ft level, 19 C s 13o sources on roof in uniform array.
TABLE 3.47--VERTICAL TRAVERSES FOR THE PCC HOUSE FOR Cs1 W SOURCES ON THE ROOF
Position 1 ft 3 ft 5 ft 7 ft
A 0.18 0.63 1.05 0.53H 0.67 0.83 1.54 3.05P 0.07 0.14 0.18 0.11
•: 0.05/
x -Coo-0 0.6./o o. 4 o
x
x oo x x x 3" x
0.0.5 ý€0-05 05 O/ Y"Il F--
,•oil x X
2.41 ,376fl,
Fig. 3.99--PCC house, 3-ft level, Cs 13 sources distributed over northwest bedroom.
(All values should be multiplied by 0.08.)
123

x x x
X4.43# x
.31 6.08 4658
K
-0-05 -<o5.o.0 5 0.1.9M
6 x
Fig. 3.100-PCC house, 5-ft level, Cs 137 sources distributed over northwest bedroom.(All values should be multiplied by 0.08.)
TABLE 3.48-VERTICAL TRAVERSES FOR THE PCC HOUSE FOR CsO
SOURCES OVER THE NORTHWEST BEDROOM*
Position I ft 2 ft 3 ft 4 ft 5 ft 6 ft 7 ft 8 ft
H 2.84 3.42 4.19 4.58J 1.93 1.98 1.69 0.58K 1.83 1.83 1.54 0.63L 2.41 2.51 2.80 2.27M 4.34 4.82 5.93 7.23 9.45 9.16 10.6 10.5P 0.92 0.82 0.29
*All values should be multiplied by 0.08.
124

Chapter 4
PRELIMINARY ANALYSIS
A complete analysis of the data presented in this report would probably take severalmonths. In view of the interest of many planning groups in experimental shielding information,it was decided to present these data as quickly as possible with only a minimum of analysisand to follow with a more complete analysis after the data have been studied thoroughly. It isexpected that the National Bureau of Standards will be primarily responsible for this analysis.A preliminary aiialysis is given to indicate the agreement between experiment and theory andto illustrate the type of information which can be obtained from these data.
4.1 FINITE RECTANGULAR SOURCE
Measurements made on the phantom structure can be compared directly with calculatedvalues. When the dose rate is calculated from a uniformly distributed rectangular source, itis convenient to replace the rectangle with a circle of equal area. The effective radius, Po, ofthe equivalent circular source is then defined by
7pO2 =1w
where 1 and w are the length and width of the rectangular source. Neglecting attenuation andscattering, the dose rate at a height h above the center of the circle is given by
R =A p = A fcosodcos - A' log cos 00"0 p+h 1 Cos 0
where 0 is the polar angle between the vertical and a line to the annulus of radius p (Fig. 4.1)and
tan 00 =-•O
The constant A' is determined from
A' = 2irSoC In 10
where So is the source strength per unit area and C is the dose rate at unit distance from asource of unit strength. For a source strength of 1 millicurie/sq ft and a conversion factorof 14.4 mr/hr at 1 ft from a 1-millicurie point Co60 source, A' = 208.
In Fig. 4.2, the experimental dose rates listed in Table 4.1 are compared with the function
R =-208 log cos 0
125

The experimental values are slightly lower than the calculated values. Since dose-rate build-updue to scattered radiation was neglected in the calculations, the experimental results shouldactually lie somewhat higher than the calculated line.
A possible reason for low readings on the dosimeters at the 3- and 5-ft levels is that theywere placed at the intersection of several aluminum tubes fastened with solid aluminum clamps.
DETECTOR
e
SOURCE RING
Fig. 4.1-Relation of variables p, 0, and h.
Thus a rather large portion of the solid angle seen by the detector contained attenuating mate-rial. A more accurate value for these two positions can be estimated by examining the hori-zontal dose-rate distribution along the diagonal. Figure 4.3 shows that the central points arelower than is consistent with the points away from the center. The two circles in Fig. 4.2represent the values at these two heights extrapolated from two curves in Fig. 4.3. They areconsidered to be more reliable than the uncorrected values. A more detailed analysis of theseresults will be included in the later report.
The experimental results show that dose rates above rectangular sources can be calcu-lated with an accuracy of better than 10 per cent by replacing them with circles of equal areas.This method is expected to yield results good to 10 per cent for rectangles of other dimensions,provided the ratio of w/l satisfies
0.8 Z T< I1
For calculations of dose rates above rectangular sources where w/l Z 0.8 and where the detec-tor is not over the center of the rectangle, see Ref. 1.
4.2 CALCULATION OF INTEGRATED VALUES FROM GROUND SOURCES
The experimental values presented in this report give the dose rates from concentricrings of sources. The normalization is such that the linear source density along the circum-ference is 2 millicuries/ft.
The results must be integrated over the radial variable in order to obtain the dose ratefrom a plane source. In converting the results for discrete rings to equivalent results for acontinuous source distribution, the number of rings per unit radial length will be determinedby the desired source strength per unit area. The integrated dose rate from all sources beyonda radius Po is given by
R0 f kRr (mr/hr\ (number of rings x
\ ring / x uni radial length) Xdp
If p is expressed in feet, then the number, k, of rings per unit radial length required to produce
a uniform plane source distribution of 1 millicurie/sq ft is k = 2 ring per unit radial lengthsince the linear source density along the circumference of a ring is 2 millicuries/ft. Therefore
f 2r dp
126

HEIGHT (FT)15 13 11 9 7 5 3
- 208 log cos 8X EXPERIMENTALo EXTRAPOLATED FROM DIAGONAL TRAVERSES
200
E
100-
0.1 0.2 0.4 0.6 0.8 1.0-log cos 8
Fig. 4.2--Dose rate as a function of height above the plane.
TABLE 4.1-A' LOG COS 0 AS A FUNCTION OF HEIGHT (h)
Height (h), ft Tan 0 6 Log cos 0 A' log cos 0
1 15.6 86* 201 1.104 2303 5.20 79' 7' 0.724 1515 3.12 72°141 0.516 1077 2.23 65°511 0.388 819 1.73 59°591 0.301 63
11 1.42 540 51' 0.240 5013 1.20 50°121 0.194 4015 1.040 4608' 0.159 33
17 0.918 42*34' 0.133 2819 0.821 390 24I 0.112 2321 0.743 360371 0.095 2024 0.650 330 21 0.077 16 (basement)
127

00
150-"
0 2 4 6 8 10 12 14 16 18 20DISTANCE, p, FROM CENTER OF SOURCE DISTRIBUTION
Fig. 4.3-Dose rate vs. distance from center for a rectangular source distribution.
7.0 I
RING SOURCES, ONE SOURCE/2' of CIRCUMFERENCE
6.0-
* THEORETICAL* EXPER. PHANFOM HOUSE 4.7S
5.0- 0 EXPER. WOOD FRAME, h- 3.0'daboveui
4.0-
E 3.0-
2.0-
-S.F. -.7
1.0 -
20 40 60 80 100
P (FT)
Fig. 4.4-Dose rate vs. distance p for phantom and 2SWF houses, ring sources.
128

and all dose rates must be divided by 2 to obtain the dose rate per unit radial foot of sourcedistribution. Since this factor is introduced only in the integration process, it was not includedin the normalization of the experimental results.
The dose rate 4.7 ft above the ground, at the center of the phantom house, is plotted as afunction of the radius of the ring sources in Fig. 4.4. It should be noted that the experimentalvalues have all been reduced by a factor of 2 in accordance with the discussion in the precedingparagraph. Although a more detailed analytical treatment of these data is planned, a pre-liminary analysis can be made by considering only unscattered radiation in the case of thephantom structure. The theoretical expression for the dose rate at a distance h above a pointP on a plane from an annular source about P of radius p and thickness dp is
R p-2iCS° e-A (° + h2) V2 p dpR dp = p2 + h2
where C is the dose rate at unit distance from a source of unit strength, S0 is the sourcestrength per unit area, and A is the linear absorption coefficient for air. It can be seen thatthe experimental values for the phantom house agree very closely with the theoretical curvefor direct radiation above. The scattered radiation is expected to contribute from 5 to 10 percent additional dose rate. The experimental points are therefore lower than the theoreticalpoints but are within the estimated error of 10 per cent owing to absolute calibration.
The experimental values agree well enough with the calculated curve to justify extrapolatingit in order to obtain the integrated dose rate for an infinite plane. Then
r- eL(P2 + h2)/ p dp r' e-" r drR0 2C 0 J2h -2irCS 0 j i-- =-iCS 0E 1 (-ph)
0 P2 +h 2 rh
where -Ei(-x) is the exponential integral function. The value obtained then for unit sourcedensity is
mr/hrRo = 2r x 14.4 x Ei(0.002 x 4.7) = 375 millicuries/sq ft (unscattered radiation only)
This value is undoubtedly low since radiation scattering was neglected in the extrapolation.Unfortunately, evaluation of the scattered component can be made only at source-detector dis-tances that were too great to allow measurements in this experiment. NBS calculations ofbuild-up factors at the ground-air interface indicate that this value should be about 20 per centhigher. The integrated dose rate from the ground, excluding a finite rectangle equal in area tothat occupied by the wood frame house, can be obtained by subtracting the corrected experi-mental dose rate for the rectangular source (Fig. 4.3) from the infinite plane dose. This cal-culation yields (375- 125) = 250 mr/hr.
4.3 CALCULATION OF SHIELDING FACTORS
The shielding factor afforded by any structure against radiation from a uniformly con-taminated plane can be defined as the ratio of the dose rate in the open at a given height abovethe plane to the dose rate at the same height inside the structure. It is convenient to separatetwo factors that contribute to the over-all shielding. The first factor is the redistribution ofsource material due to the presence of the structure. In the simple case of a rectangular build-ing with a flat roof, this consists in removing a rectangular area of source distribution fromground level and replacing it by a similar distribution at roof level. The second factor is theattenuation due to structural materials and contents of the building.
The phantom house was constructed in order to separate these two effects experimentally.This permitted measurement of the dose-rate distribution from a finite rectangular source andfrom concentric source rings. The first measurement can be used to obtain the dose rate froma rectangular roof of infinitesimally thin material. Although the source distribution wasactually at ground level rather than at the height of a typical roof, the difference in back-scattering from the ground for the two cases is expected to introduce an error of less than 10per cent in dose rate. The results for ring sources by suitable extrapolation and integrationcan be used to obtain the dose rate from a contaminated area surrounding a house with infin-
129

itesimally thin walls. In addition, the dose rate above an infinite plane was obtained by inte-grating over all radii.
Partial shielding factors, due only to attenuation, for roof sources and ground sourcesaround actual structures can be obtained in the following manner. The shielding factor fromsources distributed on the roof of a building is given by the ratio of dose rate above the finiterectangular source (phantom structure) to that at an equal distance below the roof of the build-ing. Shielding factors for the ring sources used in this experiment can be obtained simply asthe ratio of the dose rate in the phantom structure to that at the corresponding position in theactual building. Shielding factors for a plane-distributed source around a structure can beestimated by studying the shielding factor as a function of the source radius and calculatingan integrated shielding factor. The type of calculation will depend on the detector positionbeing examined. An example is given in Sec. 4.4.
The relative contributions from the roof and ground contamination can be obtained by com-paring the measured dose rate from the roof with the integrated value obtained for groundsources. Finally, the total shielding factor can be obtained by comparing the sum of the doserates from roof and ground sources with the dose rate from the infinite plane source.
4.4 EXAMPLE
To illustrate this procedure, we shall study the shielding factor 3 ft above the first floor(4.7 ft above ground) at the center of the two-story wood frame house. Since this house wasstudied in the most detail, it is the most amenable to this procedure. In Fig. 4.4, the dose rateat 3 ft above the first floor is plotted together with the dose rate at the center of the phantomhouse at the same distance above ground. For a distributed source on the ground around thishouse, we combine the results of exposure 6 with an integrated dose rate obtained from Fig. 4.4.Exposure 6 gives the dose rate from sources distributed on the four ground segments lyingbetween the walls of the house and a circle of 20 ft radius. The latter rate, obtained from Fig.3.5, is 7.6 mr/hr. The shielding factor for ring sources has two distinct values. For radii330 ft, only the walls of the first floor lie between the sources and the detector. For radiiZ30 ft, the first-floor structure and the concrete foundation also lie between the sources andthe detector. Assuming that the transmission due to the walls alone is 0.8 (see Fig. 4.4) andthat due to the walls plus the floor is 0.6, the integrated dose rate was calculated from
R 0.8Ei(ýtr1 ) + 0.6 [Ejipr 0 ) - Ei(LLr 1)]Ei (jih)
where
S= (20)2 + (4.7)2
and
r' = (30)2 + (4.7)'
The integrated dose rate from p = 20 ft to p = co, using the curve in Fig. 4.4, is 192 mr/hr.The sum of this result and that of exposure 6 yields 200 mr/hr as the dose rate from theground.
The dose rate at h feet below a finite plane source representing the roof is obtained fromTable 4.1. The detector position 3 ft above the first floor in the two-story wood frame housecorresponds to a distance of 17.0 ft below the mean level of the roof, or a dose rate of 25mr/hr. This is the dose rate in the absence of any attenuating material between the sourceand the detector.
For a distributed source on the roof of the two-story frame house, the dose rate 3 ft abovethe first floor, center, from Fig. 3.45, is 17.2 mr/hr. The transmission of the intervening roofand ceilings is therefore 17.2/25 = 0.69. At this detector position the ground radiation con-tributes about 10 times as much to the dose rate as does the roof, the total dose being 219mr/hr. Comparing this with the infinite plane value yields a total shielding factor of 1.7.
130

TABLE 4.2-EXPERIMENTAL RADIATION REDUCTION FACTORS*
DUE TO MODIFICATIONS IN TEST STRUCTURES
Modification Reduction factor Remarks
Debris shelter in basement with 8-in. 0.050 ± 0.025 Large spread due to poor statistics ofconcrete walls and ceiling low readings in basement; factor
applies to radiation sources on roof
Corner shelter with 7-in. concrete 0.20 (minimum) Protection decreases away fromcover; detector directly beneath - 0.09 corner; large spread due to poor
shelter statistics of low readings in base-
ment; factor applies to radiationsources on roof
Table covered with 7 in. of concrete; 0.20 ± 0.08. Large spread due to poor statistics ofdetector directly beneath table low readings in basement; factor
applies to radiation sources on roof
Stair well with 8-in. concrete walls 0.70 ± 0.07 Very sensitive to heightand no ceiling; detector height = 3 ft
Heavy kitchen furniture between source 0.75 (minimum) Same factor for both roof and groundand detector (see Fig. 2.28) ± 0.10 radiation
Bathroom fixtures between source and 0.89 ± 0.03 Shielding would be somewhat moredetector (see Fig. 2.29) effective if tub contained water;
same factor for both roof and groundradiation
Living-room furniture 1.0 No measurable reductionWalled-up picture window in PCC; 0.4 -0.7 Extreme values from 1 ft in front of
detector height = 3 ft window - other side of roomLow wall in rambler; detector height 0.68 ± 0.05 Wall around entire house would reduce
lower than top of wall factor to about 0.5Sandbagged windows in basement -0.75 ± 0.25 Factor may be as low as 0.25 but only
for sources within a few feet fromhouse and with detector in front ofwindow
*Reduction factor is defined as the ratio of dose rate at a given point with the modification to that without
the modification.
4.5 GENERAL CONCLUSIONS
In many cases conclusions to be drawn from the data of this experiment will depend on a
more detailed analysis. There are certain general conclusions, however, which can be reached
either from a cursory examination of the data or from a preliminary analysis of the type illus-
trated in Sec. 4.4. It is worthwhile to list these results.1. As expected, the best-shielded region in a residential structure is in the basement.
The two-story wood frame house effectively has two half-basements owing to the concrete walls
in the center. The dose rate (from both roof and ground sources) at a point 3 ft above the
center of either half-basement floor is reduced by a factor of 30. Here the reference dose rate
is that at 3 ft above an infinite contaminated plane.
2. In a two-story house with light frame construction, the radiation sources on the ground
contribute the major part of the dose rate at points on the first and second floors. The relative
dose-rate contributions from ground and roof sources at various locations are as follows:
Detector position Ground sources : roof sources
3 ft above center of second floor 4: 1
3 ft above center of first floor 10: 1
3 ft above center of half-basement -1 : 1
Although the basement offers much greater shielding against ground radiation sources than
against roof sources, the ground source is much larger in area, with the result that the net
contributions to the dose rate are about equal.
131
3. In a house with light-frame construction, the attenuation of ground radiation by certainstructures is sufficient to cast radiation "shadows." Next to a brick chimney, where the detec-tor is hidden from half the ground sources, the dose rate was found to be reduced by a factorof 2. It was found that wooden floors of the type found in the two-story wood frame house re-duce dose rates by a factor of 2 for slant radiation from the ground. Another factor of 2 isgained if the detector is in the shadow of the concrete foundation.
4. For points in the two-story wood frame house which are shielded from the groundradiation by wooden walls alone, the dose-rate reduction factor is only about 1.25.
5. Measurements with a point source in the two-story wood frame house and detectorsoutside show that for equal source-detector distances the dose rates may vary by a factor of 4.This variation is due to the inhomogeneous nature of the walls and floors.
6. Measurements on the precast concrete house show that shielding factors for a groundring source of 42.5 ft radius vary from 1.6 to 12.0, depending on the average number of wallsbetween the detector and the ring source.
7. Dose rates on the first floor of the two-story brick house from ground sources aresmaller by a factor of 4 than those for comparable positions in the two-story wood framehouse. This applies only to points that receive no direct radiation through windows.
8. Dose rates in the wood rambler from roof sources are about the same as those on thesecond floor of the two-story wood frame house (attenuation by roof about 25 per cent). Doserates from ground sources are somewhat lower (10 to 20 per cent) than those on the first floorof the two-story wood frame house because of the plastered walls in the rambler.
9. Although the wood frame structures in this test offer little radiation protection exceptin basements, modifications such as those listed in Table 4.2 will increase shielding capabili-ties. The total shielding factor in a corner of the basement of a brick home under a shieldedtable with sandbags covering the external openings is of the order of 1/1000 as compared to3 ft above an unshielded plane.
REFERENCE
1. M. J. Berger and J. C. Lamkin, Sample Calculations of Gamma-ray Penetration intoShelters: Contributions of Skyshine and Roof Contamination, Report NBS-2827, February1958.
132

Appendix A
FILM BADGES
On four of the exposures some bare film packets of Eastman Kodak personnel monitoringfilm, type 2, were placed on or very near the PIC's. No precautions were observed to minimizeheat fogging. The film exposures were made in this simplest and crudest manner only as acheck of the reproducibility and range of usefulness under field conditions. In some cases threefilms were placed at the same point, with the planes of the film mutually perpendicular. Thefilms were processed and read by the Film Badge Department of the University of California,Berkeley. Film densities were corrected to dosage and normalized by calibration of the filmbatch with the 8.40-millicurie Cog0 reference standard. A comparison of the dose rates meas-ured with film to those measured with the PIC's at corresponding positions is given in TableA.1. Each set of data is similar to that given; there was no detectable difference in the ratiosof film to PIC from house to house. The film values were relatively consistent, internally, andgenerally indicated a higher reading than the PIC's.
TABLE A.1-COMPARISON OF FILM AND PIC READINGS NORMALIZED TO THE SAME CALIBRATION
Film, PIC (corrected), Film, PIC (corrected), Film, PIC (corrected),mr mr mr mr mr mr
235 167 121 69 159 95279 214 93 40 203 131324 242 86 61 228 161
80 52 228 178 203 138108 63 71 33 140 72194 138 70 29 169 72206 150 92 49 64 6186 115 78 40 71 17145 115 70 32 59 2129 98 92 46 135 242107 83 108 57 214 126
133