2006 semi-annual report - ci investments · ci investments is pleased to present your 2006...
TRANSCRIPT
2006 Semi-Annual Report
as at September 30, 2006
{ A new road to superior investments. }
Overview ...................................................................................................................................1
Equity Funds
Select Canadian Equity Managed Corporate Class ......................................................................2
Select International Equity Managed Corporate Class.................................................................7
Select US Equity Managed Corporate Class...............................................................................12
Income Funds
Select Income Managed Corporate Class...................................................................................17
Select Staging Fund .....................................................................................................................23
Notes to the Financial Statements (CI Mutual Funds) ....................................................27
Notes to the Financial Statements (CI Corporate Class) ................................................31
About the CI Funds Board of Governors and
Letter from the CI Funds Board of Governors ...................................................................35
Legal Notice............................................................................................................................36
A look inside
CI Investments Inc., the Manager of the Funds, appoints independent auditors toaudit the Fund's Annual Financial Statements. Under Canadian securities laws(National Instrument 81-106), if an auditor has not reviewed the Semi-AnnualFinancial Statements, this must be disclosed in an accompanying notice.
The Funds' independent auditors have not performed a review of these Semi-Annual Financial Statements in accordance with standards established by theCanadian Institute of Chartered Accountants.
– 1 –
CI Investments is pleased to present your 2006 Semi-Annual Report
for your mutual fund holdings. Inside is important information about
each fund, including financial statements and a complete list of portfolio
holdings as at September 30, 2006.
If you would prefer to receive future annual and semi-annual reports
and other important documents electronically, you may sign up at the
CI e-Service Centre at www.ci.com. This service gives you easy online
access to up-to-date information about your account, and allows you to
view and print documents such as this report and your statements, trade
confirmations and tax receipts.
If you have any questions about this report or your account, please contact
your advisor or CI Client Services at 1-800-563-5181 or [email protected].
Thank you for investing with us.
ABOUT CI INVESTMENTS
Experience. Strength. Diversity.
CI Investments has been investing on behalf of Canadians since 1965
and has grown to become one of Canada’s largest fund companies,
managing about $50 billion in assets. CI is a corporation controlled by
CI Financial Income Fund, a diversified wealth management firm
listed on the Toronto Stock Exchange. CI Financial had $75.8 billion
in fee-earning assets at September 30, 2006.
CI Investments is known for providing the industry’s widest
selection of investment products and leading portfolio managers.
Our portfolio management expertise is available through several
different platforms – including mutual and segregated funds, asset
allocation programs and alternative investments. Our products are
supported by a complete suite of investment services.
CI is proud to partner with financial advisors across Canada who offer
our funds to their clients. We believe investors are most successful
when they follow a sound financial plan developed with the assistance
of a qualified advisor.
For more information on CI, please visit us online at www.ci.com.
2 Queen Street East, Twentieth FloorToronto, Ontario M5C 3G7www.ci.com
Telephone: 416-364-1145Toll Free: 1-800-268-9374Facsimile: 416-364-6299
– 2 –
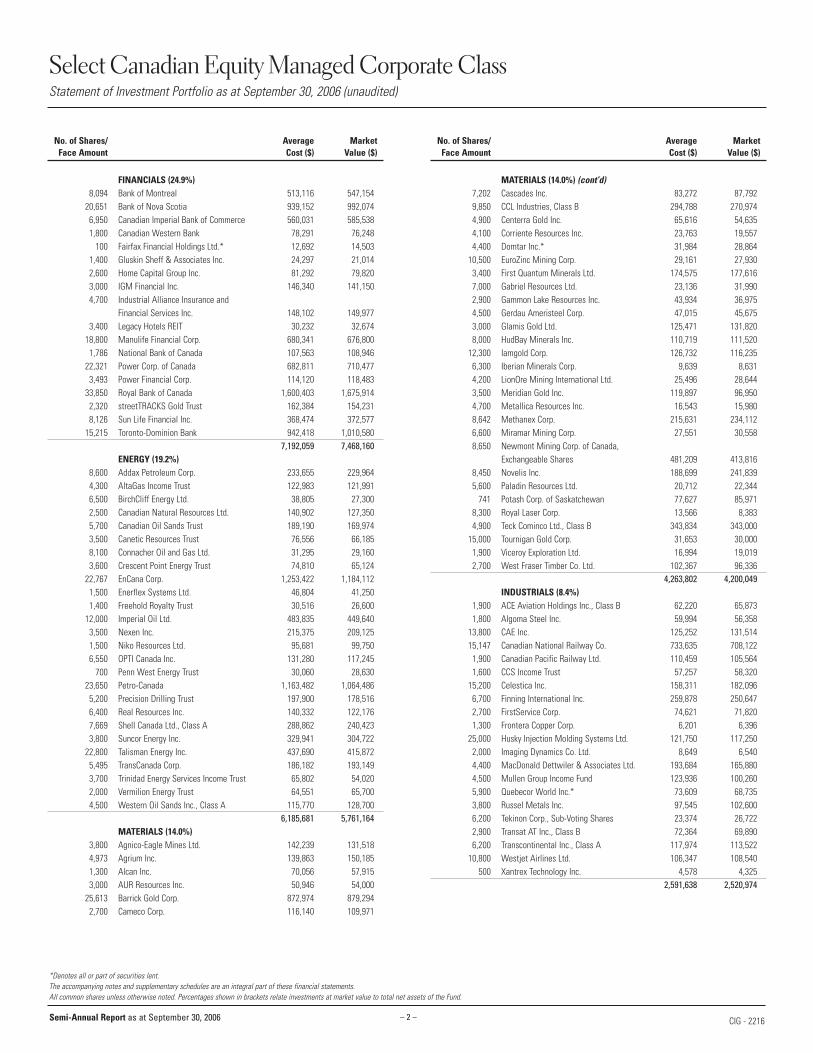
Select Canadian Equity Managed Corporate ClassStatement of Investment Portfolio as at September 30, 2006 (unaudited)
No. of Shares/ Average MarketFace Amount Cost ($) Value ($)
No. of Shares/ Average MarketFace Amount Cost ($) Value ($)
FINANCIALS (24.9%) 8,094 Bank of Montreal 513,116 547,154
20,651 Bank of Nova Scotia 939,152 992,074 6,950 Canadian Imperial Bank of Commerce 560,031 585,538 1,800 Canadian Western Bank 78,291 76,248
100 Fairfax Financial Holdings Ltd.* 12,692 14,503 1,400 Gluskin Sheff & Associates Inc. 24,297 21,014 2,600 Home Capital Group Inc. 81,292 79,820 3,000 IGM Financial Inc. 146,340 141,150 4,700 Industrial Alliance Insurance and
Financial Services Inc. 148,102 149,977 3,400 Legacy Hotels REIT 30,232 32,674
18,800 Manulife Financial Corp. 680,341 676,800 1,786 National Bank of Canada 107,563 108,946
22,321 Power Corp. of Canada 682,811 710,477 3,493 Power Financial Corp. 114,120 118,483
33,850 Royal Bank of Canada 1,600,403 1,675,914 2,320 streetTRACKS Gold Trust 162,384 154,231 8,126 Sun Life Financial Inc. 368,474 372,577
15,215 Toronto-Dominion Bank 942,418 1,010,580 7,192,059 7,468,160
ENERGY (19.2%) 8,600 Addax Petroleum Corp. 233,655 229,964 4,300 AltaGas Income Trust 122,983 121,991 6,500 BirchCliff Energy Ltd. 38,805 27,300 2,500 Canadian Natural Resources Ltd. 140,902 127,350 5,700 Canadian Oil Sands Trust 189,190 169,974 3,500 Canetic Resources Trust 76,556 66,185 8,100 Connacher Oil and Gas Ltd. 31,295 29,160 3,600 Crescent Point Energy Trust 74,810 65,124
22,767 EnCana Corp. 1,253,422 1,184,112 1,500 Enerflex Systems Ltd. 46,804 41,250 1,400 Freehold Royalty Trust 30,516 26,600
12,000 Imperial Oil Ltd. 483,835 449,640 3,500 Nexen Inc. 215,375 209,125 1,500 Niko Resources Ltd. 95,681 99,750 6,550 OPTI Canada Inc. 131,280 117,245
700 Penn West Energy Trust 30,060 28,630 23,650 Petro-Canada 1,163,482 1,064,486 5,200 Precision Drilling Trust 197,900 178,516 6,400 Real Resources Inc. 140,332 122,176 7,669 Shell Canada Ltd., Class A 288,862 240,423 3,800 Suncor Energy Inc. 329,941 304,722
22,800 Talisman Energy Inc. 437,690 415,872 5,495 TransCanada Corp. 186,182 193,149 3,700 Trinidad Energy Services Income Trust 65,802 54,020 2,000 Vermilion Energy Trust 64,551 65,700 4,500 Western Oil Sands Inc., Class A 115,770 128,700
6,185,681 5,761,164MATERIALS (14.0%)
3,800 Agnico-Eagle Mines Ltd. 142,239 131,518 4,973 Agrium Inc. 139,863 150,185 1,300 Alcan Inc. 70,056 57,915 3,000 AUR Resources Inc. 50,946 54,000
25,613 Barrick Gold Corp. 872,974 879,294 2,700 Cameco Corp. 116,140 109,971
MATERIALS (14.0%) (cont’d)7,202 Cascades Inc. 83,272 87,792 9,850 CCL Industries, Class B 294,788 270,974 4,900 Centerra Gold Inc. 65,616 54,635 4,100 Corriente Resources Inc. 23,763 19,557 4,400 Domtar Inc.* 31,984 28,864
10,500 EuroZinc Mining Corp. 29,161 27,930 3,400 First Quantum Minerals Ltd. 174,575 177,616 7,000 Gabriel Resources Ltd. 23,136 31,990 2,900 Gammon Lake Resources Inc. 43,934 36,975 4,500 Gerdau Ameristeel Corp. 47,015 45,675 3,000 Glamis Gold Ltd. 125,471 131,820 8,000 HudBay Minerals Inc. 110,719 111,520
12,300 Iamgold Corp. 126,732 116,235 6,300 Iberian Minerals Corp. 9,639 8,631 4,200 LionOre Mining International Ltd. 25,496 28,644 3,500 Meridian Gold Inc. 119,897 96,950 4,700 Metallica Resources Inc. 16,543 15,980 8,642 Methanex Corp. 215,631 234,112 6,600 Miramar Mining Corp. 27,551 30,558 8,650 Newmont Mining Corp. of Canada,
Exchangeable Shares 481,209 413,816 8,450 Novelis Inc. 188,699 241,839 5,600 Paladin Resources Ltd. 20,712 22,344
741 Potash Corp. of Saskatchewan 77,627 85,971 8,300 Royal Laser Corp. 13,566 8,383 4,900 Teck Cominco Ltd., Class B 343,834 343,000
15,000 Tournigan Gold Corp. 31,653 30,000 1,900 Viceroy Exploration Ltd. 16,994 19,019 2,700 West Fraser Timber Co. Ltd. 102,367 96,336
4,263,802 4,200,049INDUSTRIALS (8.4%)
1,900 ACE Aviation Holdings Inc., Class B 62,220 65,873 1,800 Algoma Steel Inc. 59,994 56,358
13,800 CAE Inc. 125,252 131,514 15,147 Canadian National Railway Co. 733,635 708,122
1,900 Canadian Pacific Railway Ltd. 110,459 105,564 1,600 CCS Income Trust 57,257 58,320
15,200 Celestica Inc. 158,311 182,096 6,700 Finning International Inc. 259,878 250,647 2,700 FirstService Corp. 74,621 71,820 1,300 Frontera Copper Corp. 6,201 6,396
25,000 Husky Injection Molding Systems Ltd. 121,750 117,250 2,000 Imaging Dynamics Co. Ltd. 8,649 6,540 4,400 MacDonald Dettwiler & Associates Ltd. 193,684 165,880 4,500 Mullen Group Income Fund 123,936 100,260 5,900 Quebecor World Inc.* 73,609 68,735 3,800 Russel Metals Inc. 97,545 102,600 6,200 Tekinon Corp., Sub-Voting Shares 23,374 26,722 2,900 Transat AT Inc., Class B 72,364 69,890 6,200 Transcontinental Inc., Class A 117,974 113,522
10,800 Westjet Airlines Ltd. 106,347 108,540 500 Xantrex Technology Inc. 4,578 4,325
2,591,638 2,520,974
*Denotes all or part of securities lent.The accompanying notes and supplementary schedules are an integral part of these financial statements. All common shares unless otherwise noted. Percentages shown in brackets relate investments at market value to total net assets of the Fund.
Semi-Annual Report as at September 30, 2006 CIG - 2216
– 3 –
Select Canadian Equity Managed Corporate ClassStatement of Investment Portfolio as at September 30, 2006 (unaudited)
No. of Shares/ Average MarketFace Amount Cost ($) Value ($)
No. of Shares/ Average MarketFace Amount Cost ($) Value ($)
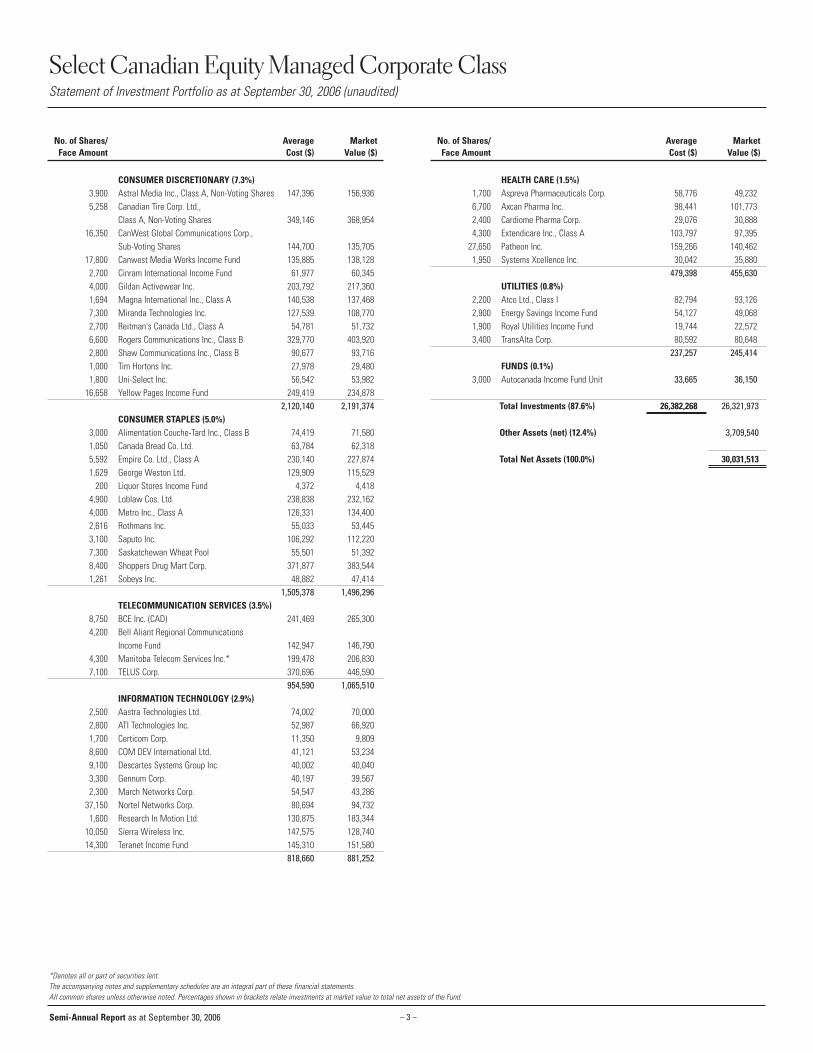
CONSUMER DISCRETIONARY (7.3%) 3,900 Astral Media Inc., Class A, Non-Voting Shares 147,396 156,936 5,258 Canadian Tire Corp. Ltd.,
Class A, Non-Voting Shares 349,146 368,954 16,350 CanWest Global Communications Corp.,
Sub-Voting Shares 144,700 135,705 17,800 Canwest Media Works Income Fund 135,885 138,128
2,700 Cinram International Income Fund 61,977 60,345 4,000 Gildan Activewear Inc. 203,792 217,360 1,694 Magna International Inc., Class A 140,538 137,468 7,300 Miranda Technologies Inc. 127,539 108,770 2,700 Reitman's Canada Ltd., Class A 54,781 51,732 6,600 Rogers Communications Inc., Class B 329,770 403,920 2,800 Shaw Communications Inc., Class B 90,677 93,716 1,000 Tim Hortons Inc. 27,978 29,480 1,800 Uni-Select Inc. 56,542 53,982
16,658 Yellow Pages Income Fund 249,419 234,878 2,120,140 2,191,374
CONSUMER STAPLES (5.0%) 3,000 Alimentation Couche-Tard Inc., Class B 74,419 71,580 1,050 Canada Bread Co. Ltd. 63,784 62,318 5,592 Empire Co. Ltd., Class A 230,140 227,874 1,629 George Weston Ltd. 129,909 115,529
200 Liquor Stores Income Fund 4,372 4,418 4,900 Loblaw Cos. Ltd. 238,838 232,162 4,000 Metro Inc., Class A 126,331 134,400 2,616 Rothmans Inc. 55,033 53,445 3,100 Saputo Inc. 106,292 112,220 7,300 Saskatchewan Wheat Pool 55,501 51,392 8,400 Shoppers Drug Mart Corp. 371,877 383,544 1,261 Sobeys Inc. 48,882 47,414
1,505,378 1,496,296TELECOMMUNICATION SERVICES (3.5%)
8,750 BCE Inc. (CAD) 241,469 265,300 4,200 Bell Aliant Regional Communications
Income Fund 142,947 146,790 4,300 Manitoba Telecom Services Inc.* 199,478 206,830 7,100 TELUS Corp. 370,696 446,590
954,590 1,065,510INFORMATION TECHNOLOGY (2.9%)
2,500 Aastra Technologies Ltd. 74,002 70,000 2,800 ATI Technologies Inc. 52,987 66,920 1,700 Certicom Corp. 11,350 9,809 8,600 COM DEV International Ltd. 41,121 53,234 9,100 Descartes Systems Group Inc. 40,002 40,040 3,300 Gennum Corp. 40,197 39,567 2,300 March Networks Corp. 54,547 43,286
37,150 Nortel Networks Corp. 80,694 94,732 1,600 Research In Motion Ltd. 130,875 183,344
10,050 Sierra Wireless Inc. 147,575 128,740 14,300 Teranet Income Fund 145,310 151,580
818,660 881,252
HEALTH CARE (1.5%) 1,700 Aspreva Pharmaceuticals Corp. 58,776 49,232 6,700 Axcan Pharma Inc. 98,441 101,773 2,400 Cardiome Pharma Corp. 29,076 30,888 4,300 Extendicare Inc., Class A 103,797 97,395
27,650 Patheon Inc. 159,266 140,462 1,950 Systems Xcellence Inc. 30,042 35,880
479,398 455,630 UTILITIES (0.8%)
2,200 Atco Ltd., Class I 82,794 93,126 2,900 Energy Savings Income Fund 54,127 49,068 1,900 Royal Utilities Income Fund 19,744 22,572 3,400 TransAlta Corp. 80,592 80,648
237,257 245,414 FUNDS (0.1%)
3,000 Autocanada Income Fund Unit 33,665 36,150
Total Investments (87.6%) 26,382,268 26,321,973
Other Assets (net) (12.4%) 3,709,540
Total Net Assets (100.0%) 30,031,513
*Denotes all or part of securities lent.The accompanying notes and supplementary schedules are an integral part of these financial statements. All common shares unless otherwise noted. Percentages shown in brackets relate investments at market value to total net assets of the Fund.
Semi-Annual Report as at September 30, 2006

– 4 –
Select Canadian Equity Managed Corporate ClassFinancial Statements
Semi-Annual Report as at September 30, 2006
AssetsInvestments at market valueCash and short term investmentsMargin for short salesIncome taxes recoverableDaily variation margin on derivative investmentsUnrealized gain on derivative investmentsReceivable for share subscriptionsReceivable for securities soldDividends and accrued interest receivable
LiabilitiesBank overdraftManagement fees payableAccrued expensesUnrealized loss on derivative investmentsPremium received from options contractPayable for securities purchasedPayable for share redemptionsInvestments sold short at market valueDividends payableCapital taxes payable
Net assets and shareholders' equity
Net assets per classA SharesF SharesI SharesW Shares
Net asset value per shareA SharesF SharesI SharesW Shares
Number of shares outstanding(see Schedule of Fund Share Transactions)
A SharesF SharesI SharesW Shares
IncomeDividendsInterest Securities lendingDerivative income (loss)Income distribution from investmentsLess: Foreign withholding taxes
ExpensesManagement fees Administrative fees Capital taxesGoods and services tax
Income (loss) before taxesProvision for income taxesNet income (loss) for the period
Realized and unrealized gain (loss) on investments(see Schedule of Commissions)
Realized gain (loss) on investmentsForeign exchange gain (loss)Capital gain distribution from investmentsChange in unrealized appreciation (depreciation) of investmentsNet gain (loss) on investmentsIncrease (decrease) in net assets from operations
Increase (decrease) in net assets from operations per classA SharesF SharesI SharesW Shares
Increase (decrease) in net assets from operationsper share
A SharesF SharesI SharesW Shares
as at as atSept. 30, 2006 Mar. 31, 2006
(unaudited) (audited)
26,322 6,1683,558 309
- -- -- -- -
558 39460 -66 1
30,564 6,872
- -38 6
4 1- -- -
479 4254 -- -- -7 3
532 43530,032 6,437
22,699 4,3771,036 7181,770 -4,527 1,342
10.85 11.0010.32 10.4110.06 -10.45 10.54
2,092,319 397,755100,421 68,930175,869 -433,367 127,426
2006
12782
----
209
139164
1016940
-40
147(2)-
(268)(123)(83)
(49)(8)
(14)(12)
(0.08)(0.02)0.04
(0.02)
Statement of Operations for the six months ended September 30 (in $000’s except for per share amounts) (unaudited)
Statements of Net Assets(in $000’s except for per share amounts and shares outstanding)
– 5 –
Select Canadian Equity Managed Corporate ClassFinancial Statements
Semi-Annual Report as at September 30, 2006
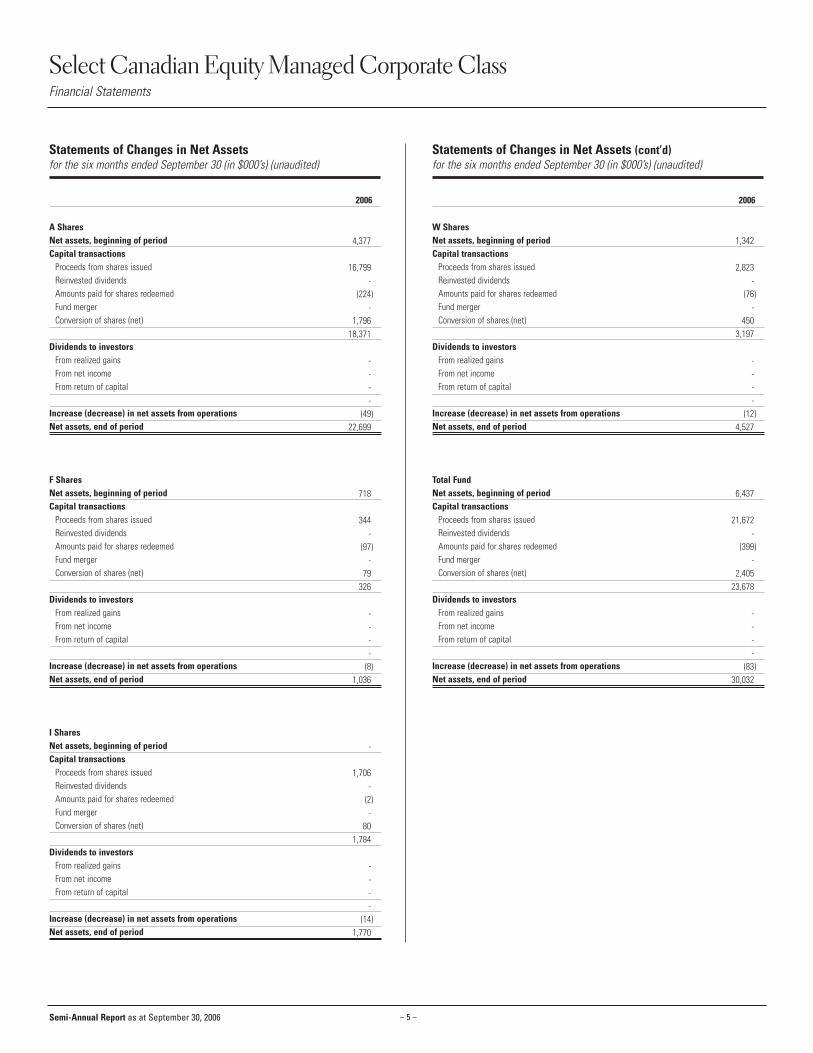
A SharesNet assets, beginning of periodCapital transactions
Proceeds from shares issued Reinvested dividends Amounts paid for shares redeemedFund merger Conversion of shares (net)
Dividends to investorsFrom realized gainsFrom net incomeFrom return of capital
Increase (decrease) in net assets from operationsNet assets, end of period
F SharesNet assets, beginning of periodCapital transactions
Proceeds from shares issued Reinvested dividends Amounts paid for shares redeemedFund merger Conversion of shares (net)
Dividends to investorsFrom realized gainsFrom net incomeFrom return of capital
Increase (decrease) in net assets from operationsNet assets, end of period
I SharesNet assets, beginning of periodCapital transactions
Proceeds from shares issued Reinvested dividends Amounts paid for shares redeemedFund merger Conversion of shares (net)
Dividends to investorsFrom realized gainsFrom net incomeFrom return of capital
Increase (decrease) in net assets from operationsNet assets, end of period
W SharesNet assets, beginning of periodCapital transactions
Proceeds from shares issued Reinvested dividends Amounts paid for shares redeemedFund merger Conversion of shares (net)
Dividends to investorsFrom realized gainsFrom net incomeFrom return of capital
Increase (decrease) in net assets from operationsNet assets, end of period
Total FundNet assets, beginning of periodCapital transactions
Proceeds from shares issued Reinvested dividends Amounts paid for shares redeemedFund merger Conversion of shares (net)
Dividends to investorsFrom realized gainsFrom net incomeFrom return of capital
Increase (decrease) in net assets from operationsNet assets, end of period
1,342
2,823-
(76)-
4503,197
----
(12)4,527
6,437
21,672-
(399)-
2,40523,678
----
(83)30,032
4,377
16,799-
(224)-
1,79618,371
----
(49)22,699
718
344-
(97)-
79326
----
(8)1,036
-
1,706-
(2)-
801,784
----
(14)1,770
Statements of Changes in Net Assets for the six months ended September 30 (in $000’s) (unaudited)
2006
Statements of Changes in Net Assets (cont’d)for the six months ended September 30 (in $000’s) (unaudited)
2006
– 6 –
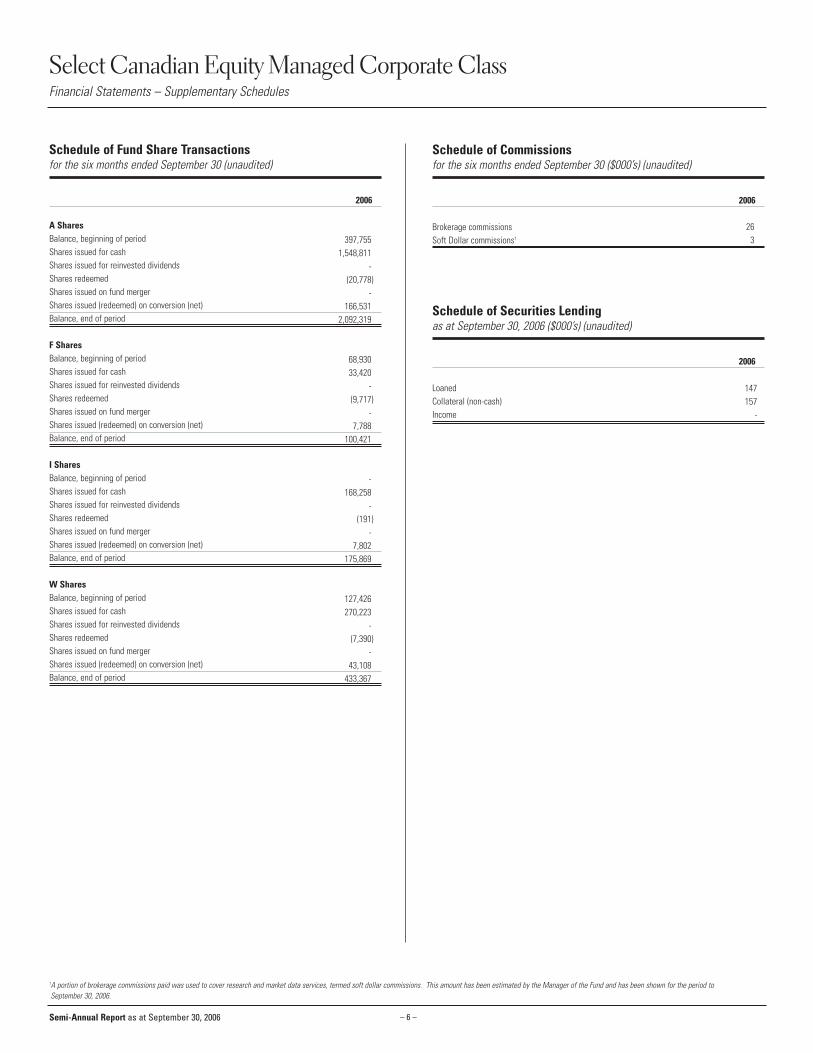
Select Canadian Equity Managed Corporate ClassFinancial Statements – Supplementary Schedules
Semi-Annual Report as at September 30, 2006
†A portion of brokerage commissions paid was used to cover research and market data services, termed soft dollar commissions. This amount has been estimated by the Manager of the Fund and has been shown for the period to September 30, 2006.
A SharesBalance, beginning of periodShares issued for cash Shares issued for reinvested dividends Shares redeemedShares issued on fund merger Shares issued (redeemed) on conversion (net)Balance, end of period
F SharesBalance, beginning of periodShares issued for cash Shares issued for reinvested dividends Shares redeemedShares issued on fund merger Shares issued (redeemed) on conversion (net)Balance, end of period
I SharesBalance, beginning of periodShares issued for cash Shares issued for reinvested dividends Shares redeemedShares issued on fund merger Shares issued (redeemed) on conversion (net)Balance, end of period
W SharesBalance, beginning of periodShares issued for cash Shares issued for reinvested dividends Shares redeemedShares issued on fund merger Shares issued (redeemed) on conversion (net)Balance, end of period
Schedule of Securities Lendingas at September 30, 2006 ($000’s) (unaudited)
2006
LoanedCollateral (non-cash)Income
147157
-
Schedule of Commissionsfor the six months ended September 30 ($000’s) (unaudited)
2006
Brokerage commissionsSoft Dollar commissions†
263
Schedule of Fund Share Transactions for the six months ended September 30 (unaudited)
2006
397,7551,548,811
-(20,778)
-166,531
2,092,319
68,93033,420
-(9,717)
-7,788
100,421
-168,258
-(191)
-7,802
175,869
127,426270,223
-(7,390)
-43,108
433,367
– 7 –
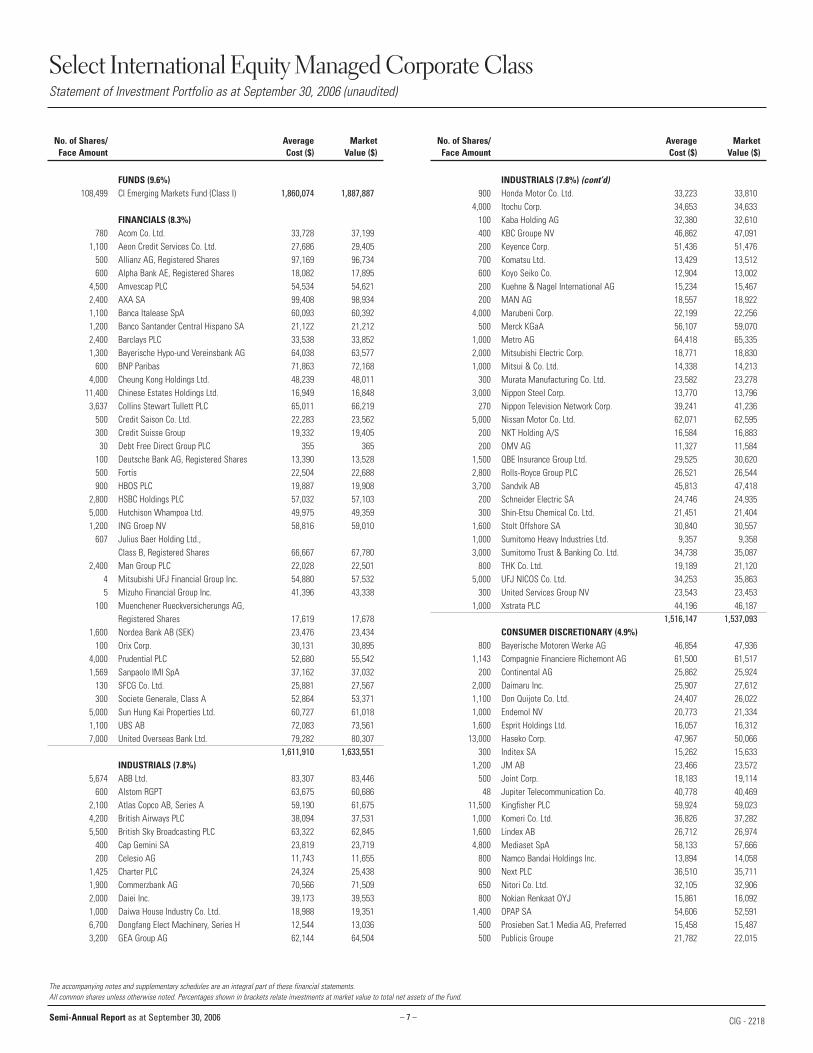
Select International Equity Managed Corporate ClassStatement of Investment Portfolio as at September 30, 2006 (unaudited)
No. of Shares/ Average MarketFace Amount Cost ($) Value ($)
No. of Shares/ Average MarketFace Amount Cost ($) Value ($)
FUNDS (9.6%) 108,499 CI Emerging Markets Fund (Class I) 1,860,074 1,887,887
FINANCIALS (8.3%) 780 Acom Co. Ltd. 33,728 37,199
1,100 Aeon Credit Services Co. Ltd. 27,686 29,405 500 Allianz AG, Registered Shares 97,169 96,734 600 Alpha Bank AE, Registered Shares 18,082 17,895
4,500 Amvescap PLC 54,534 54,621 2,400 AXA SA 99,408 98,934 1,100 Banca Italease SpA 60,093 60,392 1,200 Banco Santander Central Hispano SA 21,122 21,212 2,400 Barclays PLC 33,538 33,852 1,300 Bayerische Hypo-und Vereinsbank AG 64,038 63,577
600 BNP Paribas 71,863 72,168 4,000 Cheung Kong Holdings Ltd. 48,239 48,011
11,400 Chinese Estates Holdings Ltd. 16,949 16,848 3,637 Collins Stewart Tullett PLC 65,011 66,219
500 Credit Saison Co. Ltd. 22,283 23,562 300 Credit Suisse Group 19,332 19,405 30 Debt Free Direct Group PLC 355 365
100 Deutsche Bank AG, Registered Shares 13,390 13,528 500 Fortis 22,504 22,688 900 HBOS PLC 19,887 19,908
2,800 HSBC Holdings PLC 57,032 57,103 5,000 Hutchison Whampoa Ltd. 49,975 49,359 1,200 ING Groep NV 58,816 59,010
607 Julius Baer Holding Ltd., Class B, Registered Shares 66,667 67,780
2,400 Man Group PLC 22,028 22,501 4 Mitsubishi UFJ Financial Group Inc. 54,880 57,532 5 Mizuho Financial Group Inc. 41,396 43,338
100 Muenchener Rueckversicherungs AG, Registered Shares 17,619 17,678
1,600 Nordea Bank AB (SEK) 23,476 23,434 100 Orix Corp. 30,131 30,895
4,000 Prudential PLC 52,680 55,542 1,569 Sanpaolo IMI SpA 37,162 37,032
130 SFCG Co. Ltd. 25,881 27,567 300 Societe Generale, Class A 52,864 53,371
5,000 Sun Hung Kai Properties Ltd. 60,727 61,018 1,100 UBS AB 72,083 73,561 7,000 United Overseas Bank Ltd. 79,282 80,307
1,611,910 1,633,551 INDUSTRIALS (7.8%)
5,674 ABB Ltd. 83,307 83,446 600 Alstom RGPT 63,675 60,686
2,100 Atlas Copco AB, Series A 59,190 61,675 4,200 British Airways PLC 38,094 37,531 5,500 British Sky Broadcasting PLC 63,322 62,845
400 Cap Gemini SA 23,819 23,719 200 Celesio AG 11,743 11,655
1,425 Charter PLC 24,324 25,438 1,900 Commerzbank AG 70,566 71,509 2,000 Daiei Inc. 39,173 39,553 1,000 Daiwa House Industry Co. Ltd. 18,988 19,351 6,700 Dongfang Elect Machinery, Series H 12,544 13,036 3,200 GEA Group AG 62,144 64,504
INDUSTRIALS (7.8%) (cont’d) 900 Honda Motor Co. Ltd. 33,223 33,810
4,000 Itochu Corp. 34,653 34,633 100 Kaba Holding AG 32,380 32,610 400 KBC Groupe NV 46,862 47,091 200 Keyence Corp. 51,436 51,476 700 Komatsu Ltd. 13,429 13,512 600 Koyo Seiko Co. 12,904 13,002 200 Kuehne & Nagel International AG 15,234 15,467 200 MAN AG 18,557 18,922
4,000 Marubeni Corp. 22,199 22,256 500 Merck KGaA 56,107 59,070
1,000 Metro AG 64,418 65,335 2,000 Mitsubishi Electric Corp. 18,771 18,830 1,000 Mitsui & Co. Ltd. 14,338 14,213
300 Murata Manufacturing Co. Ltd. 23,582 23,278 3,000 Nippon Steel Corp. 13,770 13,796
270 Nippon Television Network Corp. 39,241 41,236 5,000 Nissan Motor Co. Ltd. 62,071 62,595
200 NKT Holding A/S 16,584 16,883 200 OMV AG 11,327 11,584
1,500 QBE Insurance Group Ltd. 29,525 30,620 2,800 Rolls-Royce Group PLC 26,521 26,544 3,700 Sandvik AB 45,813 47,418
200 Schneider Electric SA 24,746 24,935 300 Shin-Etsu Chemical Co. Ltd. 21,451 21,404
1,600 Stolt Offshore SA 30,840 30,557 1,000 Sumitomo Heavy Industries Ltd. 9,357 9,358 3,000 Sumitomo Trust & Banking Co. Ltd. 34,738 35,087
800 THK Co. Ltd. 19,189 21,120 5,000 UFJ NICOS Co. Ltd. 34,253 35,863
300 United Services Group NV 23,543 23,453 1,000 Xstrata PLC 44,196 46,187
1,516,147 1,537,093 CONSUMER DISCRETIONARY (4.9%)
800 Bayerische Motoren Werke AG 46,854 47,936 1,143 Compagnie Financiere Richemont AG 61,500 61,517
200 Continental AG 25,862 25,924 2,000 Daimaru Inc. 25,907 27,612 1,100 Don Quijote Co. Ltd. 24,407 26,022 1,000 Endemol NV 20,773 21,334 1,600 Esprit Holdings Ltd. 16,057 16,312
13,000 Haseko Corp. 47,967 50,066 300 Inditex SA 15,262 15,633
1,200 JM AB 23,466 23,572 500 Joint Corp. 18,183 19,114 48 Jupiter Telecommunication Co. 40,778 40,469
11,500 Kingfisher PLC 59,924 59,023 1,000 Komeri Co. Ltd. 36,826 37,282 1,600 Lindex AB 26,712 26,974 4,800 Mediaset SpA 58,133 57,666
800 Namco Bandai Holdings Inc. 13,894 14,058 900 Next PLC 36,510 35,711 650 Nitori Co. Ltd. 32,105 32,906 800 Nokian Renkaat OYJ 15,861 16,092
1,400 OPAP SA 54,606 52,591 500 Prosieben Sat.1 Media AG, Preferred 15,458 15,487 500 Publicis Groupe 21,782 22,015
The accompanying notes and supplementary schedules are an integral part of these financial statements. All common shares unless otherwise noted. Percentages shown in brackets relate investments at market value to total net assets of the Fund.
Semi-Annual Report as at September 30, 2006 CIG - 2218
– 8 –
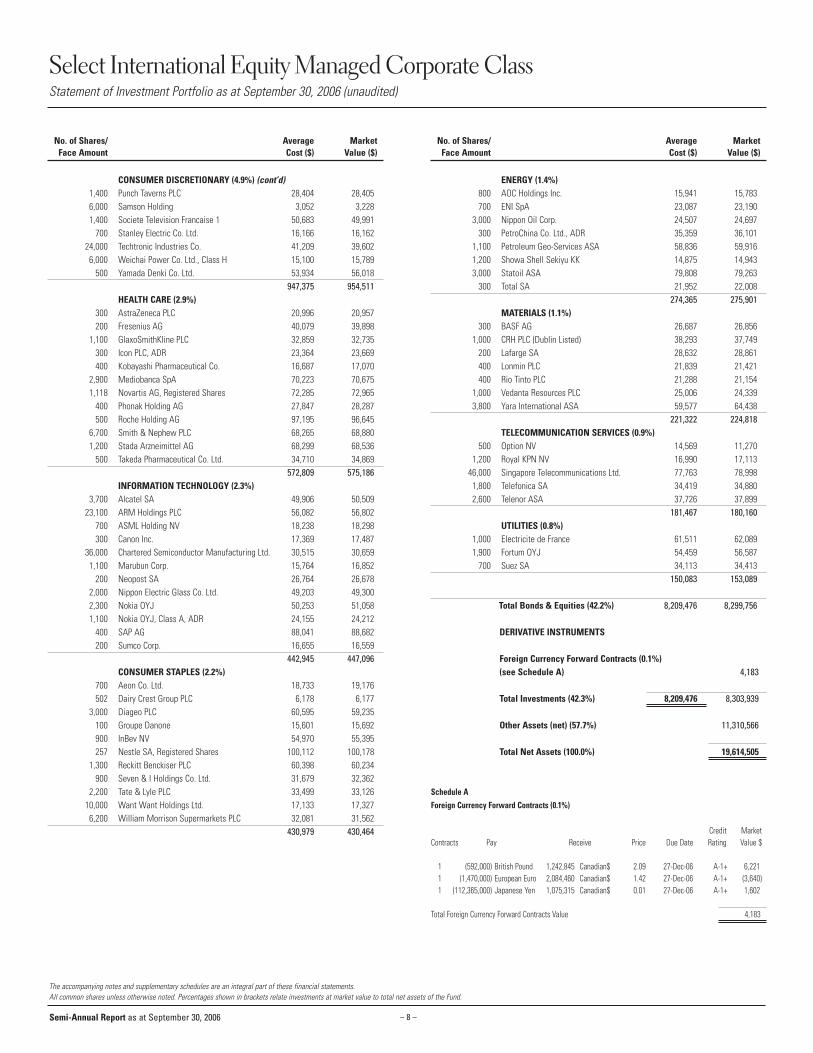
Select International Equity Managed Corporate ClassStatement of Investment Portfolio as at September 30, 2006 (unaudited)
No. of Shares/ Average MarketFace Amount Cost ($) Value ($)
No. of Shares/ Average MarketFace Amount Cost ($) Value ($)
CONSUMER DISCRETIONARY (4.9%) (cont’d) 1,400 Punch Taverns PLC 28,404 28,405 6,000 Samson Holding 3,052 3,228 1,400 Societe Television Francaise 1 50,683 49,991
700 Stanley Electric Co. Ltd. 16,166 16,162 24,000 Techtronic Industries Co. 41,209 39,602 6,000 Weichai Power Co. Ltd., Class H 15,100 15,789
500 Yamada Denki Co. Ltd. 53,934 56,018 947,375 954,511
HEALTH CARE (2.9%) 300 AstraZeneca PLC 20,996 20,957 200 Fresenius AG 40,079 39,898
1,100 GlaxoSmithKline PLC 32,859 32,735 300 Icon PLC, ADR 23,364 23,669 400 Kobayashi Pharmaceutical Co. 16,687 17,070
2,900 Mediobanca SpA 70,223 70,675 1,118 Novartis AG, Registered Shares 72,285 72,965
400 Phonak Holding AG 27,847 28,287 500 Roche Holding AG 97,195 96,645
6,700 Smith & Nephew PLC 68,265 68,880 1,200 Stada Arzneimittel AG 68,299 68,536
500 Takeda Pharmaceutical Co. Ltd. 34,710 34,869 572,809 575,186
INFORMATION TECHNOLOGY (2.3%) 3,700 Alcatel SA 49,906 50,509
23,100 ARM Holdings PLC 56,082 56,802 700 ASML Holding NV 18,238 18,298 300 Canon Inc. 17,369 17,487
36,000 Chartered Semiconductor Manufacturing Ltd. 30,515 30,659 1,100 Marubun Corp. 15,764 16,852
200 Neopost SA 26,764 26,678 2,000 Nippon Electric Glass Co. Ltd. 49,203 49,300 2,300 Nokia OYJ 50,253 51,058 1,100 Nokia OYJ, Class A, ADR 24,155 24,212
400 SAP AG 88,041 88,682 200 Sumco Corp. 16,655 16,559
442,945 447,096 CONSUMER STAPLES (2.2%)
700 Aeon Co. Ltd. 18,733 19,176 502 Dairy Crest Group PLC 6,178 6,177
3,000 Diageo PLC 60,595 59,235 100 Groupe Danone 15,601 15,692 900 InBev NV 54,970 55,395 257 Nestle SA, Registered Shares 100,112 100,178
1,300 Reckitt Benckiser PLC 60,398 60,234 900 Seven & I Holdings Co. Ltd. 31,679 32,362
2,200 Tate & Lyle PLC 33,499 33,126 10,000 Want Want Holdings Ltd. 17,133 17,327
6,200 William Morrison Supermarkets PLC 32,081 31,562 430,979 430,464
ENERGY (1.4%) 800 AOC Holdings Inc. 15,941 15,783 700 ENI SpA 23,087 23,190
3,000 Nippon Oil Corp. 24,507 24,697 300 PetroChina Co. Ltd., ADR 35,359 36,101
1,100 Petroleum Geo-Services ASA 58,836 59,916 1,200 Showa Shell Sekiyu KK 14,875 14,943 3,000 Statoil ASA 79,808 79,263
300 Total SA 21,952 22,008 274,365 275,901
MATERIALS (1.1%) 300 BASF AG 26,687 26,856
1,000 CRH PLC (Dublin Listed) 38,293 37,749 200 Lafarge SA 28,632 28,861 400 Lonmin PLC 21,839 21,421 400 Rio Tinto PLC 21,288 21,154
1,000 Vedanta Resources PLC 25,006 24,339 3,800 Yara International ASA 59,577 64,438
221,322 224,818 TELECOMMUNICATION SERVICES (0.9%)
500 Option NV 14,569 11,270 1,200 Royal KPN NV 16,990 17,113
46,000 Singapore Telecommunications Ltd. 77,763 78,998 1,800 Telefonica SA 34,419 34,880 2,600 Telenor ASA 37,726 37,899
181,467 180,160 UTILITIES (0.8%)
1,000 Electricite de France 61,511 62,089 1,900 Fortum OYJ 54,459 56,587
700 Suez SA 34,113 34,413 150,083 153,089
Total Bonds & Equities (42.2%) 8,209,476 8,299,756
DERIVATIVE INSTRUMENTS
Foreign Currency Forward Contracts (0.1%)(see Schedule A) 4,183
Total Investments (42.3%) 8,209,476 8,303,939
Other Assets (net) (57.7%) 11,310,566
Total Net Assets (100.0%) 19,614,505
Schedule AForeign Currency Forward Contracts (0.1%)
Credit MarketContracts Pay Receive Price Due Date Rating Value $
1 (592,000) British Pound 1,242,845 Canadian$ 2.09 27-Dec-06 A-1+ 6,221 1 (1,470,000) European Euro 2,084,460 Canadian$ 1.42 27-Dec-06 A-1+ (3,640)1 (112,365,000) Japanese Yen 1,075,315 Canadian$ 0.01 27-Dec-06 A-1+ 1,602
Total Foreign Currency Forward Contracts Value 4,183
The accompanying notes and supplementary schedules are an integral part of these financial statements. All common shares unless otherwise noted. Percentages shown in brackets relate investments at market value to total net assets of the Fund.
Semi-Annual Report as at September 30, 2006
– 9 –
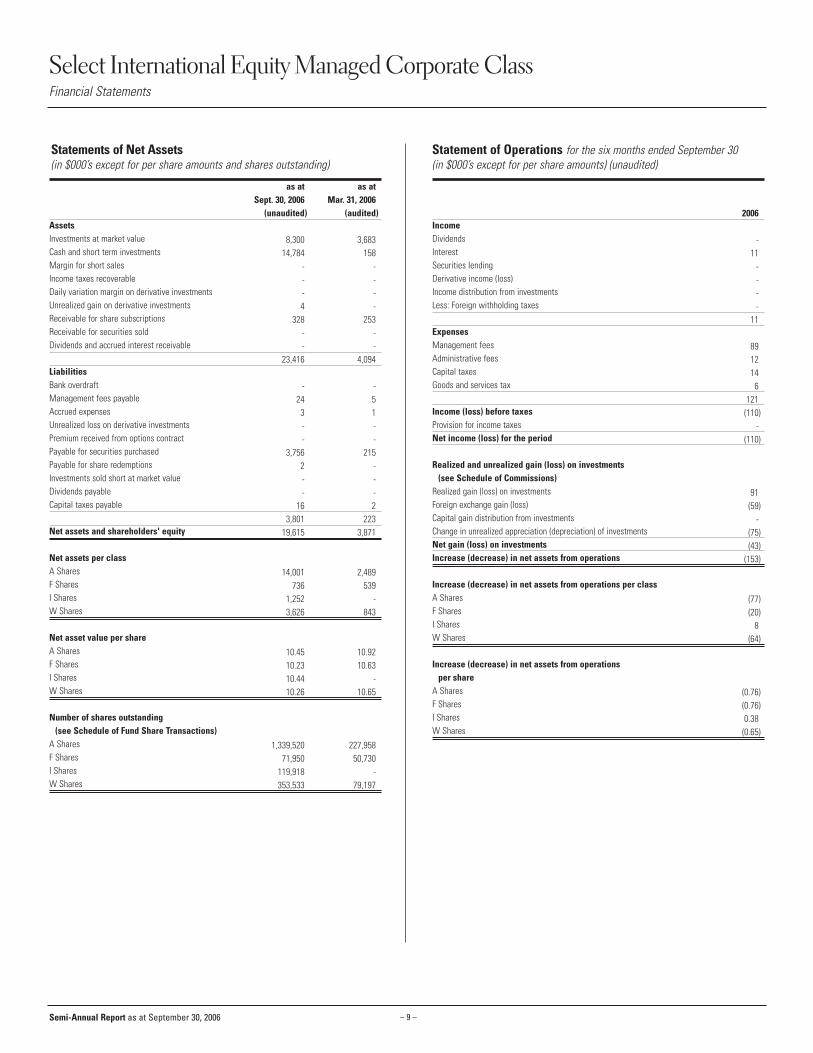
Select International Equity Managed Corporate ClassFinancial Statements
Semi-Annual Report as at September 30, 2006
AssetsInvestments at market valueCash and short term investmentsMargin for short salesIncome taxes recoverableDaily variation margin on derivative investmentsUnrealized gain on derivative investmentsReceivable for share subscriptionsReceivable for securities soldDividends and accrued interest receivable
LiabilitiesBank overdraftManagement fees payableAccrued expensesUnrealized loss on derivative investmentsPremium received from options contractPayable for securities purchasedPayable for share redemptionsInvestments sold short at market valueDividends payableCapital taxes payable
Net assets and shareholders' equity
Net assets per classA SharesF SharesI SharesW Shares
Net asset value per shareA SharesF SharesI SharesW Shares
Number of shares outstanding(see Schedule of Fund Share Transactions)
A SharesF SharesI SharesW Shares
IncomeDividendsInterest Securities lendingDerivative income (loss)Income distribution from investmentsLess: Foreign withholding taxes
ExpensesManagement fees Administrative fees Capital taxesGoods and services tax
Income (loss) before taxesProvision for income taxesNet income (loss) for the period
Realized and unrealized gain (loss) on investments(see Schedule of Commissions)
Realized gain (loss) on investmentsForeign exchange gain (loss)Capital gain distribution from investmentsChange in unrealized appreciation (depreciation) of investmentsNet gain (loss) on investmentsIncrease (decrease) in net assets from operations
Increase (decrease) in net assets from operations per classA SharesF SharesI SharesW Shares
Increase (decrease) in net assets from operationsper share
A SharesF SharesI SharesW Shares
as at as atSept. 30, 2006 Mar. 31, 2006
(unaudited) (audited)
8,300 3,68314,784 158
- -- -- -4 -
328 253- -- -
23,416 4,094
- -24 53 1- -- -
3,756 2152 -- -- -
16 23,801 223
19,615 3,871
14,001 2,489736 539
1,252 -3,626 843
10.45 10.9210.23 10.6310.44 -10.26 10.65
1,339,520 227,95871,950 50,730
119,918 -353,533 79,197
2006
-11
----
11
8912146
121(110)
-(110)
91(59)
-(75)(43)
(153)
(77)(20)
8(64)
(0.76)(0.76)0.38
(0.65)
Statement of Operations for the six months ended September 30 (in $000’s except for per share amounts) (unaudited)
Statements of Net Assets(in $000’s except for per share amounts and shares outstanding)

– 10 –
A SharesNet assets, beginning of periodCapital transactions
Proceeds from shares issued Reinvested dividends Amounts paid for shares redeemedFund merger Conversion of shares (net)
Dividends to investorsFrom realized gainsFrom net incomeFrom return of capital
Increase (decrease) in net assets from operationsNet assets, end of period
F SharesNet assets, beginning of periodCapital transactions
Proceeds from shares issued Reinvested dividends Amounts paid for shares redeemedFund merger Conversion of shares (net)
Dividends to investorsFrom realized gainsFrom net incomeFrom return of capital
Increase (decrease) in net assets from operationsNet assets, end of period
I SharesNet assets, beginning of periodCapital transactions
Proceeds from shares issued Reinvested dividends Amounts paid for shares redeemedFund merger Conversion of shares (net)
Dividends to investorsFrom realized gainsFrom net incomeFrom return of capital
Increase (decrease) in net assets from operationsNet assets, end of period
W SharesNet assets, beginning of periodCapital transactions
Proceeds from shares issued Reinvested dividends Amounts paid for shares redeemedFund merger Conversion of shares (net)
Dividends to investorsFrom realized gainsFrom net incomeFrom return of capital
Increase (decrease) in net assets from operationsNet assets, end of period
Total FundNet assets, beginning of periodCapital transactions
Proceeds from shares issued Reinvested dividends Amounts paid for shares redeemedFund merger Conversion of shares (net)
Dividends to investorsFrom realized gainsFrom net incomeFrom return of capital
Increase (decrease) in net assets from operationsNet assets, end of period
843
2,270-
(59)-
6362,847
----
(64)3,626
3,871
14,293-
(440)-
2,04415,897
----
(153)19,615
2,489
10,520-
(214)-
1,28311,589
----
(77)14,001
539
317-
(165)-
65217
----
(20)736
-
1,186-
(2)-
601,244
----8
1,252
Select International Equity Managed Corporate ClassFinancial Statements
Semi-Annual Report as at September 30, 2006
Statements of Changes in Net Assets for the six months ended September 30 (in $000’s) (unaudited)
2006
Statements of Changes in Net Assets (cont’d)for the six months ended September 30 (in $000’s) (unaudited)
2006

– 11 –
A SharesBalance, beginning of periodShares issued for cash Shares issued for reinvested dividends Shares redeemedShares issued on fund merger Shares issued (redeemed) on conversion (net)Balance, end of period
F SharesBalance, beginning of periodShares issued for cash Shares issued for reinvested dividends Shares redeemedShares issued on fund merger Shares issued (redeemed) on conversion (net)Balance, end of period
I SharesBalance, beginning of periodShares issued for cash Shares issued for reinvested dividends Shares redeemedShares issued on fund merger Shares issued (redeemed) on conversion (net)Balance, end of period
W SharesBalance, beginning of periodShares issued for cash Shares issued for reinvested dividends Shares redeemedShares issued on fund merger Shares issued (redeemed) on conversion (net)Balance, end of period
Select International Equity Managed Corporate ClassFinancial Statements – Supplementary Schedules
Schedule of Securities Lendingas at September 30, 2006 ($000’s) (unaudited)
2006
LoanedCollateral (non-cash)Income
---
Schedule of Commissionsfor the six months ended September 30 ($000’s) (unaudited)
2006
Brokerage commissionsSoft Dollar commissions†
51
Schedule of Fund Share Transactions for the six months ended September 30 (unaudited)
2006
227,9581,008,851
-(20,692)
-123,403
1,339,520
50,73031,196
-(16,506)
-6,530
71,950
-114,253
-(152)
-5,817
119,918
79,197219,622
-(5,908)
-60,622
353,533
Semi-Annual Report as at September 30, 2006
†A portion of brokerage commissions paid was used to cover research and market data services, termed soft dollar commissions. This amount has been estimated by the Manager of the Fund and has been shown for the period to September 30, 2006.
– 12 –
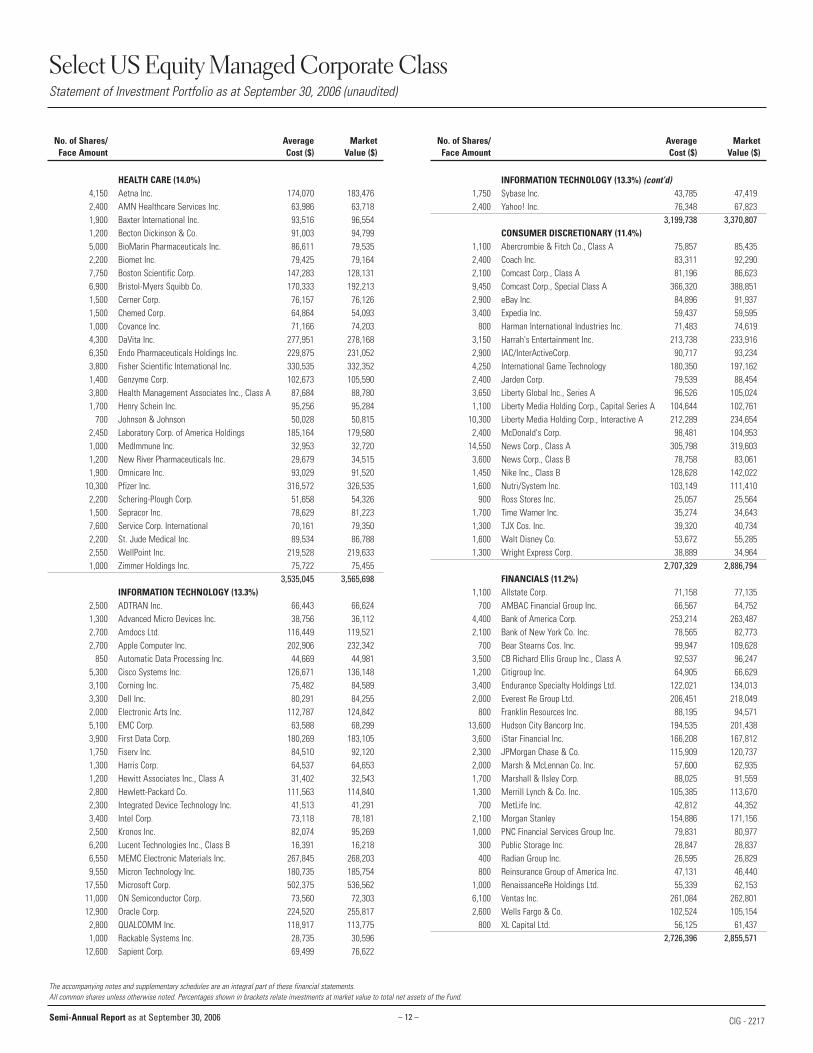
Select US Equity Managed Corporate ClassStatement of Investment Portfolio as at September 30, 2006 (unaudited)
No. of Shares/ Average MarketFace Amount Cost ($) Value ($)
No. of Shares/ Average MarketFace Amount Cost ($) Value ($)
HEALTH CARE (14.0%) 4,150 Aetna Inc. 174,070 183,476 2,400 AMN Healthcare Services Inc. 63,986 63,718 1,900 Baxter International Inc. 93,516 96,554 1,200 Becton Dickinson & Co. 91,003 94,799 5,000 BioMarin Pharmaceuticals Inc. 86,611 79,535 2,200 Biomet Inc. 79,425 79,164 7,750 Boston Scientific Corp. 147,283 128,131 6,900 Bristol-Myers Squibb Co. 170,333 192,213 1,500 Cerner Corp. 76,157 76,126 1,500 Chemed Corp. 64,864 54,093 1,000 Covance Inc. 71,166 74,203 4,300 DaVita Inc. 277,951 278,168 6,350 Endo Pharmaceuticals Holdings Inc. 229,875 231,052 3,800 Fisher Scientific International Inc. 330,535 332,352 1,400 Genzyme Corp. 102,673 105,590 3,800 Health Management Associates Inc., Class A 87,684 88,780 1,700 Henry Schein Inc. 95,256 95,284
700 Johnson & Johnson 50,028 50,815 2,450 Laboratory Corp. of America Holdings 185,164 179,580 1,000 MedImmune Inc. 32,953 32,720 1,200 New River Pharmaceuticals Inc. 29,679 34,515 1,900 Omnicare Inc. 93,029 91,520
10,300 Pfizer Inc. 316,572 326,535 2,200 Schering-Plough Corp. 51,658 54,326 1,500 Sepracor Inc. 78,629 81,223 7,600 Service Corp. International 70,161 79,350 2,200 St. Jude Medical Inc. 89,534 86,788 2,550 WellPoint Inc. 219,528 219,633 1,000 Zimmer Holdings Inc. 75,722 75,455
3,535,045 3,565,698 INFORMATION TECHNOLOGY (13.3%)
2,500 ADTRAN Inc. 66,443 66,624 1,300 Advanced Micro Devices Inc. 38,756 36,112 2,700 Amdocs Ltd. 116,449 119,521 2,700 Apple Computer Inc. 202,906 232,342
850 Automatic Data Processing Inc. 44,669 44,981 5,300 Cisco Systems Inc. 126,671 136,148 3,100 Corning Inc. 75,482 84,589 3,300 Dell Inc. 80,291 84,255 2,000 Electronic Arts Inc. 112,787 124,842 5,100 EMC Corp. 63,588 68,299 3,900 First Data Corp. 180,269 183,105 1,750 Fiserv Inc. 84,510 92,120 1,300 Harris Corp. 64,537 64,653 1,200 Hewitt Associates Inc., Class A 31,402 32,543 2,800 Hewlett-Packard Co. 111,563 114,840 2,300 Integrated Device Technology Inc. 41,513 41,291 3,400 Intel Corp. 73,118 78,181 2,500 Kronos Inc. 82,074 95,269 6,200 Lucent Technologies Inc., Class B 16,391 16,218 6,550 MEMC Electronic Materials Inc. 267,845 268,203 9,550 Micron Technology Inc. 180,735 185,754
17,550 Microsoft Corp. 502,375 536,562 11,000 ON Semiconductor Corp. 73,560 72,303 12,900 Oracle Corp. 224,520 255,817
2,800 QUALCOMM Inc. 118,917 113,775 1,000 Rackable Systems Inc. 28,735 30,596
12,600 Sapient Corp. 69,499 76,622
INFORMATION TECHNOLOGY (13.3%) (cont’d) 1,750 Sybase Inc. 43,785 47,419 2,400 Yahoo! Inc. 76,348 67,823
3,199,738 3,370,807 CONSUMER DISCRETIONARY (11.4%)
1,100 Abercrombie & Fitch Co., Class A 75,857 85,435 2,400 Coach Inc. 83,311 92,290 2,100 Comcast Corp., Class A 81,196 86,623 9,450 Comcast Corp., Special Class A 366,320 388,851 2,900 eBay Inc. 84,896 91,937 3,400 Expedia Inc. 59,437 59,595
800 Harman International Industries Inc. 71,483 74,619 3,150 Harrah's Entertainment Inc. 213,738 233,916 2,900 IAC/InterActiveCorp. 90,717 93,234 4,250 International Game Technology 180,350 197,162 2,400 Jarden Corp. 79,539 88,454 3,650 Liberty Global Inc., Series A 96,526 105,024 1,100 Liberty Media Holding Corp., Capital Series A 104,644 102,761
10,300 Liberty Media Holding Corp., Interactive A 212,289 234,654 2,400 McDonald's Corp. 98,481 104,953
14,550 News Corp., Class A 305,798 319,603 3,600 News Corp., Class B 78,758 83,061 1,450 Nike Inc., Class B 128,628 142,022 1,600 Nutri/System Inc. 103,149 111,410
900 Ross Stores Inc. 25,057 25,564 1,700 Time Warner Inc. 35,274 34,643 1,300 TJX Cos. Inc. 39,320 40,734 1,600 Walt Disney Co. 53,672 55,285 1,300 Wright Express Corp. 38,889 34,964
2,707,329 2,886,794 FINANCIALS (11.2%)
1,100 Allstate Corp. 71,158 77,135 700 AMBAC Financial Group Inc. 66,567 64,752
4,400 Bank of America Corp. 253,214 263,487 2,100 Bank of New York Co. Inc. 78,565 82,773
700 Bear Stearns Cos. Inc. 99,947 109,628 3,500 CB Richard Ellis Group Inc., Class A 92,537 96,247 1,200 Citigroup Inc. 64,905 66,629 3,400 Endurance Specialty Holdings Ltd. 122,021 134,013 2,000 Everest Re Group Ltd. 206,451 218,049
800 Franklin Resources Inc. 88,195 94,571 13,600 Hudson City Bancorp Inc. 194,535 201,438
3,600 iStar Financial Inc. 166,208 167,812 2,300 JPMorgan Chase & Co. 115,909 120,737 2,000 Marsh & McLennan Co. Inc. 57,600 62,935 1,700 Marshall & Ilsley Corp. 88,025 91,559 1,300 Merrill Lynch & Co. Inc. 105,385 113,670
700 MetLife Inc. 42,812 44,352 2,100 Morgan Stanley 154,886 171,156 1,000 PNC Financial Services Group Inc. 79,831 80,977
300 Public Storage Inc. 28,847 28,837 400 Radian Group Inc. 26,595 26,829 800 Reinsurance Group of America Inc. 47,131 46,440
1,000 RenaissanceRe Holdings Ltd. 55,339 62,153 6,100 Ventas Inc. 261,084 262,801 2,600 Wells Fargo & Co. 102,524 105,154
800 XL Capital Ltd. 56,125 61,437 2,726,396 2,855,571
The accompanying notes and supplementary schedules are an integral part of these financial statements. All common shares unless otherwise noted. Percentages shown in brackets relate investments at market value to total net assets of the Fund.
Semi-Annual Report as at September 30, 2006 CIG - 2217
– 13 –
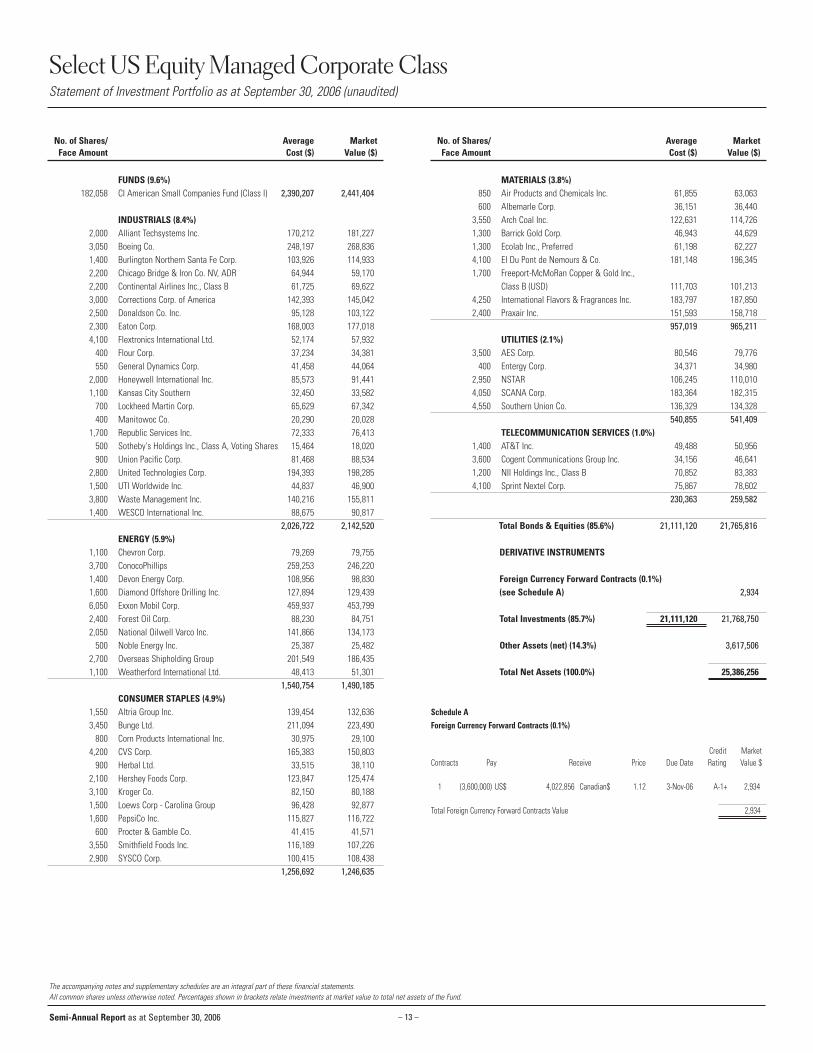
Select US Equity Managed Corporate ClassStatement of Investment Portfolio as at September 30, 2006 (unaudited)
No. of Shares/ Average MarketFace Amount Cost ($) Value ($)
No. of Shares/ Average MarketFace Amount Cost ($) Value ($)
FUNDS (9.6%) 182,058 CI American Small Companies Fund (Class I) 2,390,207 2,441,404
INDUSTRIALS (8.4%) 2,000 Alliant Techsystems Inc. 170,212 181,227 3,050 Boeing Co. 248,197 268,836 1,400 Burlington Northern Santa Fe Corp. 103,926 114,933 2,200 Chicago Bridge & Iron Co. NV, ADR 64,944 59,170 2,200 Continental Airlines Inc., Class B 61,725 69,622 3,000 Corrections Corp. of America 142,393 145,042 2,500 Donaldson Co. Inc. 95,128 103,122 2,300 Eaton Corp. 168,003 177,018 4,100 Flextronics International Ltd. 52,174 57,932
400 Flour Corp. 37,234 34,381 550 General Dynamics Corp. 41,458 44,064
2,000 Honeywell International Inc. 85,573 91,441 1,100 Kansas City Southern 32,450 33,582
700 Lockheed Martin Corp. 65,629 67,342 400 Manitowoc Co. 20,290 20,028
1,700 Republic Services Inc. 72,333 76,413 500 Sotheby's Holdings Inc., Class A, Voting Shares 15,464 18,020 900 Union Pacific Corp. 81,468 88,534
2,800 United Technologies Corp. 194,393 198,285 1,500 UTI Worldwide Inc. 44,837 46,900 3,800 Waste Management Inc. 140,216 155,811 1,400 WESCO International Inc. 88,675 90,817
2,026,722 2,142,520 ENERGY (5.9%)
1,100 Chevron Corp. 79,269 79,755 3,700 ConocoPhillips 259,253 246,220 1,400 Devon Energy Corp. 108,956 98,830 1,600 Diamond Offshore Drilling Inc. 127,894 129,439 6,050 Exxon Mobil Corp. 459,937 453,799 2,400 Forest Oil Corp. 88,230 84,751 2,050 National Oilwell Varco Inc. 141,866 134,173
500 Noble Energy Inc. 25,387 25,482 2,700 Overseas Shipholding Group 201,549 186,435 1,100 Weatherford International Ltd. 48,413 51,301
1,540,754 1,490,185 CONSUMER STAPLES (4.9%)
1,550 Altria Group Inc. 139,454 132,636 3,450 Bunge Ltd. 211,094 223,490
800 Corn Products International Inc. 30,975 29,100 4,200 CVS Corp. 165,383 150,803
900 Herbal Ltd. 33,515 38,110 2,100 Hershey Foods Corp. 123,847 125,474 3,100 Kroger Co. 82,150 80,188 1,500 Loews Corp - Carolina Group 96,428 92,877 1,600 PepsiCo Inc. 115,827 116,722
600 Procter & Gamble Co. 41,415 41,571 3,550 Smithfield Foods Inc. 116,189 107,226 2,900 SYSCO Corp. 100,415 108,438
1,256,692 1,246,635
MATERIALS (3.8%) 850 Air Products and Chemicals Inc. 61,855 63,063 600 Albemarle Corp. 36,151 36,440
3,550 Arch Coal Inc. 122,631 114,726 1,300 Barrick Gold Corp. 46,943 44,629 1,300 Ecolab Inc., Preferred 61,198 62,227 4,100 EI Du Pont de Nemours & Co. 181,148 196,345 1,700 Freeport-McMoRan Copper & Gold Inc.,
Class B (USD) 111,703 101,213 4,250 International Flavors & Fragrances Inc. 183,797 187,850 2,400 Praxair Inc. 151,593 158,718
957,019 965,211 UTILITIES (2.1%)
3,500 AES Corp. 80,546 79,776 400 Entergy Corp. 34,371 34,980
2,950 NSTAR 106,245 110,010 4,050 SCANA Corp. 183,364 182,315 4,550 Southern Union Co. 136,329 134,328
540,855 541,409 TELECOMMUNICATION SERVICES (1.0%)
1,400 AT&T Inc. 49,488 50,956 3,600 Cogent Communications Group Inc. 34,156 46,641 1,200 NII Holdings Inc., Class B 70,852 83,383 4,100 Sprint Nextel Corp. 75,867 78,602
230,363 259,582
Total Bonds & Equities (85.6%) 21,111,120 21,765,816
DERIVATIVE INSTRUMENTS
Foreign Currency Forward Contracts (0.1%)(see Schedule A) 2,934
Total Investments (85.7%) 21,111,120 21,768,750
Other Assets (net) (14.3%) 3,617,506
Total Net Assets (100.0%) 25,386,256
Schedule AForeign Currency Forward Contracts (0.1%)
Credit MarketContracts Pay Receive Price Due Date Rating Value $
1 (3,600,000) US$ 4,022,856 Canadian$ 1.12 3-Nov-06 A-1+ 2,934
Total Foreign Currency Forward Contracts Value 2,934
The accompanying notes and supplementary schedules are an integral part of these financial statements. All common shares unless otherwise noted. Percentages shown in brackets relate investments at market value to total net assets of the Fund.
Semi-Annual Report as at September 30, 2006

– 14 –
Select US Equity Managed Corporate ClassFinancial Statements
Semi-Annual Report as at September 30, 2006
AssetsInvestments at market valueCash and short term investmentsMargin for short salesIncome taxes recoverableDaily variation margin on derivative investmentsUnrealized gain on derivative investmentsReceivable for share subscriptionsReceivable for securities soldDividends and accrued interest receivable
LiabilitiesBank overdraftManagement fees payableAccrued expensesUnrealized loss on derivative investmentsPremium received from options contractPayable for securities purchasedPayable for share redemptionsInvestments sold short at market valueDividends payableCapital taxes payable
Net assets and shareholders' equity
Net assets per classA SharesF SharesI SharesW Shares
Net asset value per shareA SharesF SharesI SharesW Shares
Number of shares outstanding(see Schedule of Fund Share Transactions)
A SharesF SharesI SharesW Shares
IncomeDividendsInterest Securities lendingDerivative income (loss)Income distribution from investmentsLess: Foreign withholding taxes
ExpensesManagement fees Administrative fees Capital taxesGoods and services tax
Income (loss) before taxesProvision for income taxesNet income (loss) for the period
Realized and unrealized gain (loss) on investments(see Schedule of Commissions)
Realized gain (loss) on investmentsForeign exchange gain (loss)Capital gain distribution from investmentsChange in unrealized appreciation (depreciation) of investmentsNet gain (loss) on investmentsIncrease (decrease) in net assets from operations
Increase (decrease) in net assets from operations per classA SharesF SharesI SharesW Shares
Increase (decrease) in net assets from operationsper share
A SharesF SharesI SharesW Shares
as at as atSept. 30, 2006 Mar. 31, 2006
(unaudited) (audited)
21,766 4,6892,932 191
- -- -- -3 -
806 33272 -16 -
25,595 5,212
- -31 1
4 1- -- -
164 2913 -- -- -7 3
209 29625,386 4,916
19,011 3,461420 255
2,123 -3,832 1,200
10.36 10.7410.04 10.3610.56 -10.20 10.52
1,835,653 322,35341,809 24,581
201,004 -375,718 114,116
2006
1423
---
(2)35
1131348
138(103)
-(103)
(97)9-
516428325
231(4)
6929
(0.34)(0.32)0.60
(0.29)
Statement of Operations for the six months ended September 30 (in $000’s except for per share amounts) (unaudited)
Statements of Net Assets(in $000’s except for per share amounts and shares outstanding)
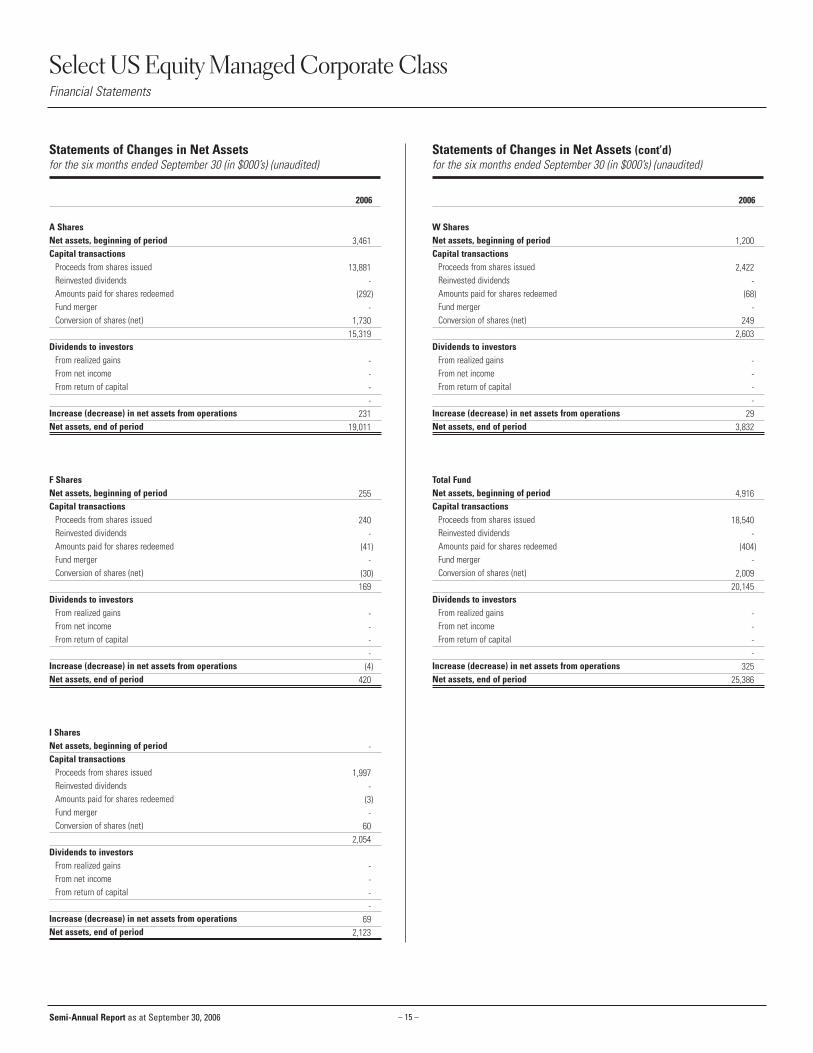
– 15 –
Select US Equity Managed Corporate ClassFinancial Statements
Semi-Annual Report as at September 30, 2006
A SharesNet assets, beginning of periodCapital transactions
Proceeds from shares issued Reinvested dividends Amounts paid for shares redeemedFund merger Conversion of shares (net)
Dividends to investorsFrom realized gainsFrom net incomeFrom return of capital
Increase (decrease) in net assets from operationsNet assets, end of period
F SharesNet assets, beginning of periodCapital transactions
Proceeds from shares issued Reinvested dividends Amounts paid for shares redeemedFund merger Conversion of shares (net)
Dividends to investorsFrom realized gainsFrom net incomeFrom return of capital
Increase (decrease) in net assets from operationsNet assets, end of period
I SharesNet assets, beginning of periodCapital transactions
Proceeds from shares issued Reinvested dividends Amounts paid for shares redeemedFund merger Conversion of shares (net)
Dividends to investorsFrom realized gainsFrom net incomeFrom return of capital
Increase (decrease) in net assets from operationsNet assets, end of period
W SharesNet assets, beginning of periodCapital transactions
Proceeds from shares issued Reinvested dividends Amounts paid for shares redeemedFund merger Conversion of shares (net)
Dividends to investorsFrom realized gainsFrom net incomeFrom return of capital
Increase (decrease) in net assets from operationsNet assets, end of period
Total FundNet assets, beginning of periodCapital transactions
Proceeds from shares issued Reinvested dividends Amounts paid for shares redeemedFund merger Conversion of shares (net)
Dividends to investorsFrom realized gainsFrom net incomeFrom return of capital
Increase (decrease) in net assets from operationsNet assets, end of period
1,200
2,422-
(68)-
2492,603
----
293,832
4,916
18,540-
(404)-
2,00920,145
----
32525,386
3,461
13,881-
(292)-
1,73015,319
----
23119,011
255
240-
(41)-
(30)169
----
(4)420
-
1,997-
(3)-
602,054
----
692,123
Statements of Changes in Net Assets for the six months ended September 30 (in $000’s) (unaudited)
2006
Statements of Changes in Net Assets (cont’d)for the six months ended September 30 (in $000’s) (unaudited)
2006
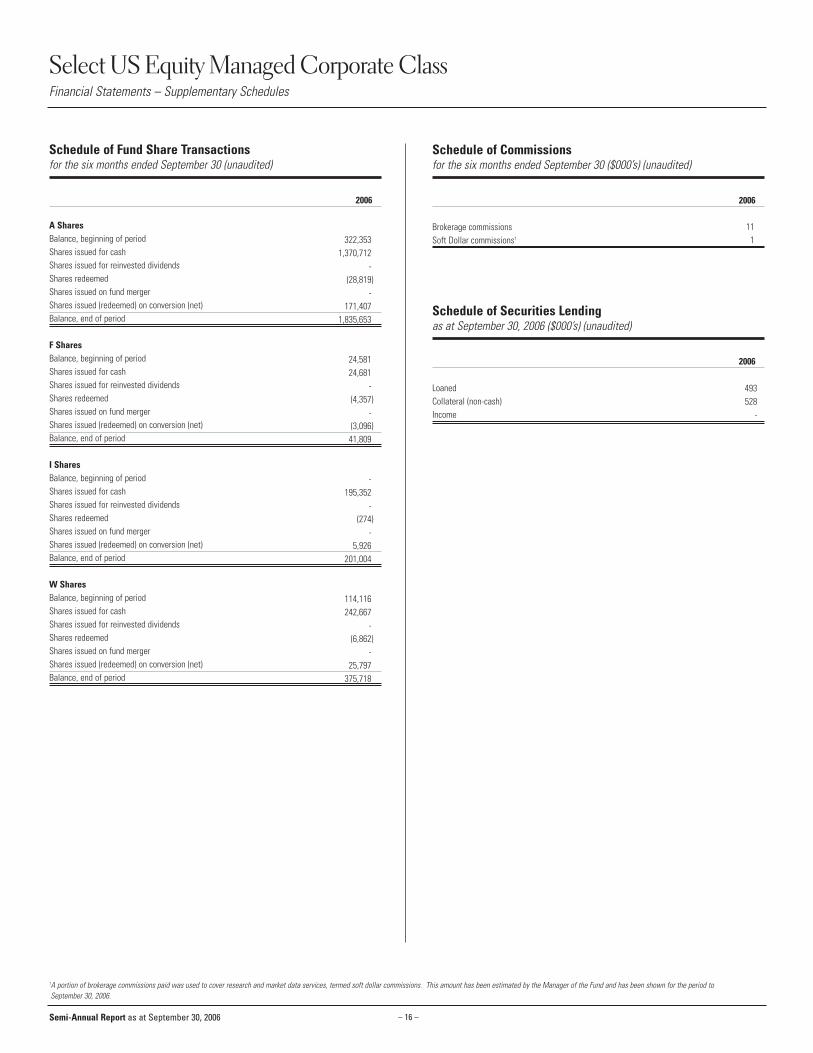
– 16 –
Select US Equity Managed Corporate ClassFinancial Statements – Supplementary Schedules
Semi-Annual Report as at September 30, 2006
†A portion of brokerage commissions paid was used to cover research and market data services, termed soft dollar commissions. This amount has been estimated by the Manager of the Fund and has been shown for the period to September 30, 2006.
A SharesBalance, beginning of periodShares issued for cash Shares issued for reinvested dividends Shares redeemedShares issued on fund merger Shares issued (redeemed) on conversion (net)Balance, end of period
F SharesBalance, beginning of periodShares issued for cash Shares issued for reinvested dividends Shares redeemedShares issued on fund merger Shares issued (redeemed) on conversion (net)Balance, end of period
I SharesBalance, beginning of periodShares issued for cash Shares issued for reinvested dividends Shares redeemedShares issued on fund merger Shares issued (redeemed) on conversion (net)Balance, end of period
W SharesBalance, beginning of periodShares issued for cash Shares issued for reinvested dividends Shares redeemedShares issued on fund merger Shares issued (redeemed) on conversion (net)Balance, end of period
Schedule of Securities Lendingas at September 30, 2006 ($000’s) (unaudited)
2006
LoanedCollateral (non-cash)Income
493528
-
Schedule of Commissionsfor the six months ended September 30 ($000’s) (unaudited)
2006
Brokerage commissionsSoft Dollar commissions†
111
Schedule of Fund Share Transactions for the six months ended September 30 (unaudited)
2006
322,3531,370,712
-(28,819)
-171,407
1,835,653
24,58124,681
-(4,357)
-(3,096)41,809
-195,352
-(274)
-5,926
201,004
114,116242,667
-(6,862)
-25,797
375,718
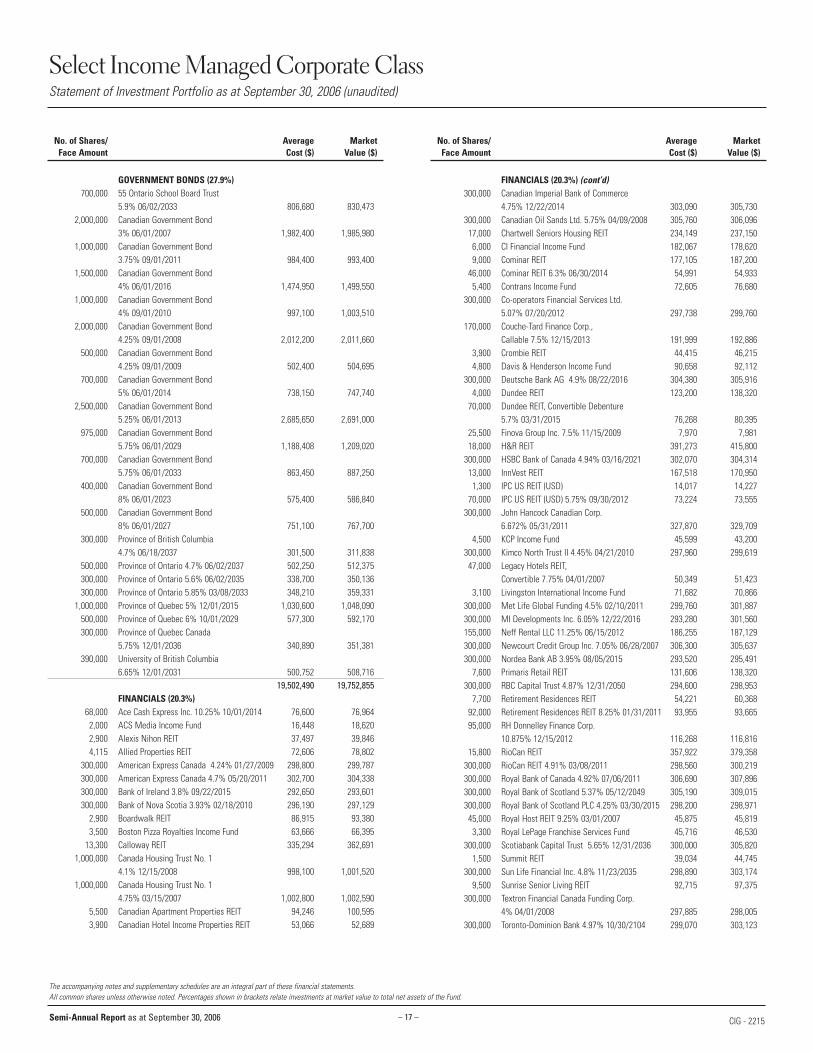
– 17 –
Select Income Managed Corporate ClassStatement of Investment Portfolio as at September 30, 2006 (unaudited)
No. of Shares/ Average MarketFace Amount Cost ($) Value ($)
No. of Shares/ Average MarketFace Amount Cost ($) Value ($)
GOVERNMENT BONDS (27.9%) 700,000 55 Ontario School Board Trust
5.9% 06/02/2033 806,680 830,473 2,000,000 Canadian Government Bond
3% 06/01/2007 1,982,400 1,985,980 1,000,000 Canadian Government Bond
3.75% 09/01/2011 984,400 993,400 1,500,000 Canadian Government Bond
4% 06/01/2016 1,474,950 1,499,550 1,000,000 Canadian Government Bond
4% 09/01/2010 997,100 1,003,510 2,000,000 Canadian Government Bond
4.25% 09/01/2008 2,012,200 2,011,660 500,000 Canadian Government Bond
4.25% 09/01/2009 502,400 504,695 700,000 Canadian Government Bond
5% 06/01/2014 738,150 747,740 2,500,000 Canadian Government Bond
5.25% 06/01/2013 2,685,650 2,691,000 975,000 Canadian Government Bond
5.75% 06/01/2029 1,188,408 1,209,020 700,000 Canadian Government Bond
5.75% 06/01/2033 863,450 887,250 400,000 Canadian Government Bond
8% 06/01/2023 575,400 586,840 500,000 Canadian Government Bond
8% 06/01/2027 751,100 767,700 300,000 Province of British Columbia
4.7% 06/18/2037 301,500 311,838 500,000 Province of Ontario 4.7% 06/02/2037 502,250 512,375 300,000 Province of Ontario 5.6% 06/02/2035 338,700 350,136 300,000 Province of Ontario 5.85% 03/08/2033 348,210 359,331
1,000,000 Province of Quebec 5% 12/01/2015 1,030,600 1,048,090 500,000 Province of Quebec 6% 10/01/2029 577,300 592,170 300,000 Province of Quebec Canada
5.75% 12/01/2036 340,890 351,381 390,000 University of British Columbia
6.65% 12/01/2031 500,752 508,716 19,502,490 19,752,855
FINANCIALS (20.3%) 68,000 Ace Cash Express Inc. 10.25% 10/01/2014 76,600 76,964
2,000 ACS Media Income Fund 16,448 18,620 2,900 Alexis Nihon REIT 37,497 39,846 4,115 Allied Properties REIT 72,606 78,802
300,000 American Express Canada 4.24% 01/27/2009 298,800 299,787 300,000 American Express Canada 4.7% 05/20/2011 302,700 304,338 300,000 Bank of Ireland 3.8% 09/22/2015 292,650 293,601 300,000 Bank of Nova Scotia 3.93% 02/18/2010 296,190 297,129
2,900 Boardwalk REIT 86,915 93,380 3,500 Boston Pizza Royalties Income Fund 63,666 66,395
13,300 Calloway REIT 335,294 362,691 1,000,000 Canada Housing Trust No. 1
4.1% 12/15/2008 998,100 1,001,520 1,000,000 Canada Housing Trust No. 1
4.75% 03/15/2007 1,002,800 1,002,590 5,500 Canadian Apartment Properties REIT 94,246 100,595 3,900 Canadian Hotel Income Properties REIT 53,066 52,689
FINANCIALS (20.3%) (cont’d) 300,000 Canadian Imperial Bank of Commerce
4.75% 12/22/2014 303,090 305,730 300,000 Canadian Oil Sands Ltd. 5.75% 04/09/2008 305,760 306,096
17,000 Chartwell Seniors Housing REIT 234,149 237,150 6,000 CI Financial Income Fund 182,067 178,620 9,000 Cominar REIT 177,105 187,200
46,000 Cominar REIT 6.3% 06/30/2014 54,991 54,933 5,400 Contrans Income Fund 72,605 76,680
300,000 Co-operators Financial Services Ltd. 5.07% 07/20/2012 297,738 299,760
170,000 Couche-Tard Finance Corp., Callable 7.5% 12/15/2013 191,999 192,886
3,900 Crombie REIT 44,415 46,215 4,800 Davis & Henderson Income Fund 90,658 92,112
300,000 Deutsche Bank AG 4.9% 08/22/2016 304,380 305,916 4,000 Dundee REIT 123,200 138,320
70,000 Dundee REIT, Convertible Debenture 5.7% 03/31/2015 76,268 80,395
25,500 Finova Group Inc. 7.5% 11/15/2009 7,970 7,981 18,000 H&R REIT 391,273 415,800
300,000 HSBC Bank of Canada 4.94% 03/16/2021 302,070 304,314 13,000 InnVest REIT 167,518 170,950 1,300 IPC US REIT (USD) 14,017 14,227
70,000 IPC US REIT (USD) 5.75% 09/30/2012 73,224 73,555 300,000 John Hancock Canadian Corp.
6.672% 05/31/2011 327,870 329,709 4,500 KCP Income Fund 45,599 43,200
300,000 Kimco North Trust II 4.45% 04/21/2010 297,960 299,619 47,000 Legacy Hotels REIT,
Convertible 7.75% 04/01/2007 50,349 51,423 3,100 Livingston International Income Fund 71,682 70,866
300,000 Met Life Global Funding 4.5% 02/10/2011 299,760 301,887 300,000 MI Developments Inc. 6.05% 12/22/2016 293,280 301,560 155,000 Neff Rental LLC 11.25% 06/15/2012 186,255 187,129 300,000 Newcourt Credit Group Inc. 7.05% 06/28/2007 306,300 305,637 300,000 Nordea Bank AB 3.95% 08/05/2015 293,520 295,491
7,600 Primaris Retail REIT 131,606 138,320 300,000 RBC Capital Trust 4.87% 12/31/2050 294,600 298,953
7,700 Retirement Residences REIT 54,221 60,368 92,000 Retirement Residences REIT 8.25% 01/31/2011 93,955 93,665 95,000 RH Donnelley Finance Corp.
10.875% 12/15/2012 116,268 116,816 15,800 RioCan REIT 357,922 379,358
300,000 RioCan REIT 4.91% 03/08/2011 298,560 300,219 300,000 Royal Bank of Canada 4.92% 07/06/2011 306,690 307,896 300,000 Royal Bank of Scotland 5.37% 05/12/2049 305,190 309,015 300,000 Royal Bank of Scotland PLC 4.25% 03/30/2015 298,200 298,971
45,000 Royal Host REIT 9.25% 03/01/2007 45,875 45,819 3,300 Royal LePage Franchise Services Fund 45,716 46,530
300,000 Scotiabank Capital Trust 5.65% 12/31/2036 300,000 305,820 1,500 Summit REIT 39,034 44,745
300,000 Sun Life Financial Inc. 4.8% 11/23/2035 298,890 303,174 9,500 Sunrise Senior Living REIT 92,715 97,375
300,000 Textron Financial Canada Funding Corp. 4% 04/01/2008 297,885 298,005
300,000 Toronto-Dominion Bank 4.97% 10/30/2104 299,070 303,123
The accompanying notes and supplementary schedules are an integral part of these financial statements. All common shares unless otherwise noted. Percentages shown in brackets relate investments at market value to total net assets of the Fund.
Semi-Annual Report as at September 30, 2006 CIG - 2215
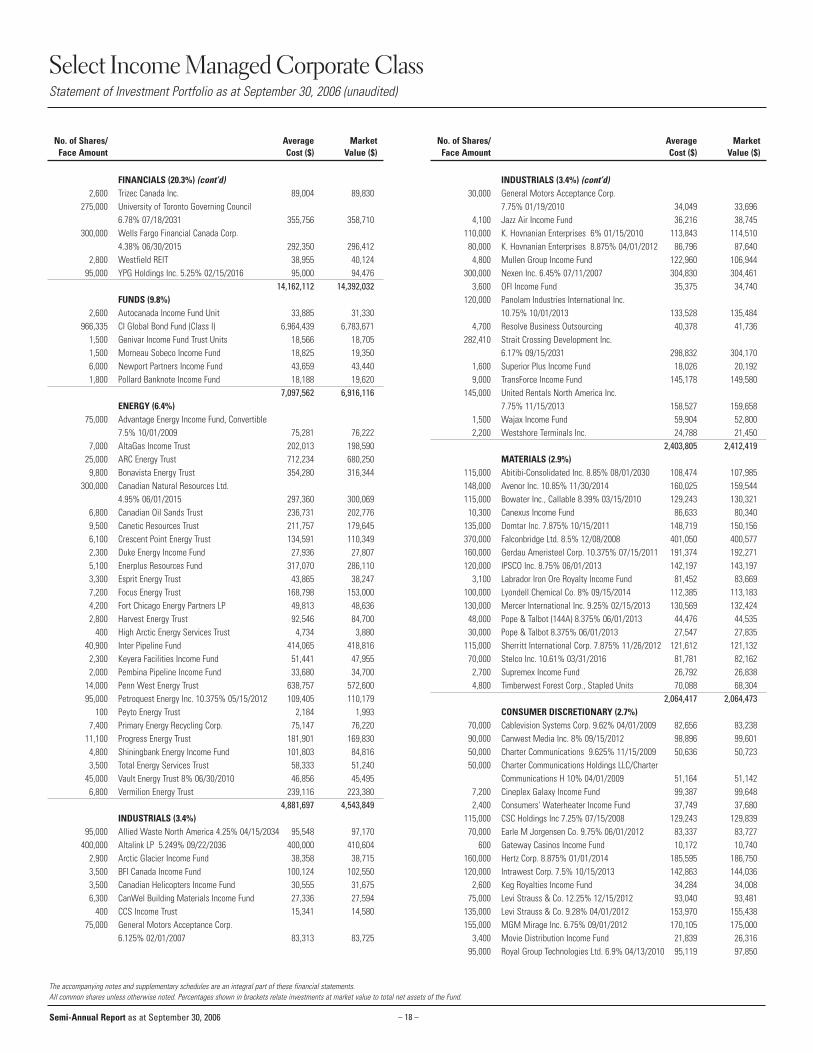
– 18 –
Select Income Managed Corporate ClassStatement of Investment Portfolio as at September 30, 2006 (unaudited)
No. of Shares/ Average MarketFace Amount Cost ($) Value ($)
No. of Shares/ Average MarketFace Amount Cost ($) Value ($)
FINANCIALS (20.3%) (cont’d) 2,600 Trizec Canada Inc. 89,004 89,830
275,000 University of Toronto Governing Council 6.78% 07/18/2031 355,756 358,710
300,000 Wells Fargo Financial Canada Corp. 4.38% 06/30/2015 292,350 296,412
2,800 Westfield REIT 38,955 40,124 95,000 YPG Holdings Inc. 5.25% 02/15/2016 95,000 94,476
14,162,112 14,392,032FUNDS (9.8%)
2,600 Autocanada Income Fund Unit 33,885 31,330 966,335 CI Global Bond Fund (Class I) 6,964,439 6,783,671
1,500 Genivar Income Fund Trust Units 18,566 18,705 1,500 Morneau Sobeco Income Fund 18,825 19,350 6,000 Newport Partners Income Fund 43,659 43,440 1,800 Pollard Banknote Income Fund 18,188 19,620
7,097,562 6,916,116ENERGY (6.4%)
75,000 Advantage Energy Income Fund, Convertible 7.5% 10/01/2009 75,281 76,222
7,000 AltaGas Income Trust 202,013 198,590 25,000 ARC Energy Trust 712,234 680,250 9,800 Bonavista Energy Trust 354,280 316,344
300,000 Canadian Natural Resources Ltd. 4.95% 06/01/2015 297,360 300,069
6,800 Canadian Oil Sands Trust 236,731 202,776 9,500 Canetic Resources Trust 211,757 179,645 6,100 Crescent Point Energy Trust 134,591 110,349 2,300 Duke Energy Income Fund 27,936 27,807 5,100 Enerplus Resources Fund 317,070 286,110 3,300 Esprit Energy Trust 43,865 38,247 7,200 Focus Energy Trust 168,798 153,000 4,200 Fort Chicago Energy Partners LP 49,813 48,636 2,800 Harvest Energy Trust 92,546 84,700
400 High Arctic Energy Services Trust 4,734 3,880 40,900 Inter Pipeline Fund 414,065 418,816
2,300 Keyera Facilities Income Fund 51,441 47,955 2,000 Pembina Pipeline Income Fund 33,680 34,700
14,000 Penn West Energy Trust 638,757 572,600 95,000 Petroquest Energy Inc. 10.375% 05/15/2012 109,405 110,179
100 Peyto Energy Trust 2,184 1,993 7,400 Primary Energy Recycling Corp. 75,147 76,220
11,100 Progress Energy Trust 181,901 169,830 4,800 Shiningbank Energy Income Fund 101,803 84,816 3,500 Total Energy Services Trust 58,333 51,240
45,000 Vault Energy Trust 8% 06/30/2010 46,856 45,495 6,800 Vermilion Energy Trust 239,116 223,380
4,881,697 4,543,849INDUSTRIALS (3.4%)
95,000 Allied Waste North America 4.25% 04/15/2034 95,548 97,170 400,000 Altalink LP 5.249% 09/22/2036 400,000 410,604
2,900 Arctic Glacier Income Fund 38,358 38,715 3,500 BFI Canada Income Fund 100,124 102,550 3,500 Canadian Helicopters Income Fund 30,555 31,675 6,300 CanWel Building Materials Income Fund 27,336 27,594
400 CCS Income Trust 15,341 14,580 75,000 General Motors Acceptance Corp.
6.125% 02/01/2007 83,313 83,725
INDUSTRIALS (3.4%) (cont’d) 30,000 General Motors Acceptance Corp.
7.75% 01/19/2010 34,049 33,696 4,100 Jazz Air Income Fund 36,216 38,745
110,000 K. Hovnanian Enterprises 6% 01/15/2010 113,843 114,510 80,000 K. Hovnanian Enterprises 8.875% 04/01/2012 86,796 87,640
4,800 Mullen Group Income Fund 122,960 106,944 300,000 Nexen Inc. 6.45% 07/11/2007 304,830 304,461
3,600 OFI Income Fund 35,375 34,740 120,000 Panolam Industries International Inc.
10.75% 10/01/2013 133,528 135,484 4,700 Resolve Business Outsourcing 40,378 41,736
282,410 Strait Crossing Development Inc. 6.17% 09/15/2031 298,832 304,170
1,600 Superior Plus Income Fund 18,026 20,192 9,000 TransForce Income Fund 145,178 149,580
145,000 United Rentals North America Inc. 7.75% 11/15/2013 158,527 159,658
1,500 Wajax Income Fund 59,904 52,800 2,200 Westshore Terminals Inc. 24,788 21,450
2,403,805 2,412,419MATERIALS (2.9%)
115,000 Abitibi-Consolidated Inc. 8.85% 08/01/2030 108,474 107,985 148,000 Avenor Inc. 10.85% 11/30/2014 160,025 159,544 115,000 Bowater Inc., Callable 8.39% 03/15/2010 129,243 130,321
10,300 Canexus Income Fund 86,633 80,340 135,000 Domtar Inc. 7.875% 10/15/2011 148,719 150,156 370,000 Falconbridge Ltd. 8.5% 12/08/2008 401,050 400,577 160,000 Gerdau Ameristeel Corp. 10.375% 07/15/2011 191,374 192,271 120,000 IPSCO Inc. 8.75% 06/01/2013 142,197 143,197
3,100 Labrador Iron Ore Royalty Income Fund 81,452 83,669 100,000 Lyondell Chemical Co. 8% 09/15/2014 112,385 113,183 130,000 Mercer International Inc. 9.25% 02/15/2013 130,569 132,424
48,000 Pope & Talbot (144A) 8.375% 06/01/2013 44,476 44,535 30,000 Pope & Talbot 8.375% 06/01/2013 27,547 27,835
115,000 Sherritt International Corp. 7.875% 11/26/2012 121,612 121,132 70,000 Stelco Inc. 10.61% 03/31/2016 81,781 82,162
2,700 Supremex Income Fund 26,792 26,838 4,800 Timberwest Forest Corp., Stapled Units 70,088 68,304
2,064,417 2,064,473CONSUMER DISCRETIONARY (2.7%)
70,000 Cablevision Systems Corp. 9.62% 04/01/2009 82,656 83,238 90,000 Canwest Media Inc. 8% 09/15/2012 98,896 99,601 50,000 Charter Communications 9.625% 11/15/2009 50,636 50,723 50,000 Charter Communications Holdings LLC/Charter
Communications H 10% 04/01/2009 51,164 51,142 7,200 Cineplex Galaxy Income Fund 99,387 99,648 2,400 Consumers' Waterheater Income Fund 37,749 37,680
115,000 CSC Holdings Inc 7.25% 07/15/2008 129,243 129,839 70,000 Earle M Jorgensen Co. 9.75% 06/01/2012 83,337 83,727
600 Gateway Casinos Income Fund 10,172 10,740 160,000 Hertz Corp. 8.875% 01/01/2014 185,595 186,750 120,000 Intrawest Corp. 7.5% 10/15/2013 142,863 144,036
2,600 Keg Royalties Income Fund 34,284 34,008 75,000 Levi Strauss & Co. 12.25% 12/15/2012 93,040 93,481
135,000 Levi Strauss & Co. 9.28% 04/01/2012 153,970 155,438 155,000 MGM Mirage Inc. 6.75% 09/01/2012 170,105 175,000
3,400 Movie Distribution Income Fund 21,839 26,316 95,000 Royal Group Technologies Ltd. 6.9% 04/13/2010 95,119 97,850
The accompanying notes and supplementary schedules are an integral part of these financial statements. All common shares unless otherwise noted. Percentages shown in brackets relate investments at market value to total net assets of the Fund.
Semi-Annual Report as at September 30, 2006
– 19 –
Select Income Managed Corporate ClassStatement of Investment Portfolio as at September 30, 2006 (unaudited)
No. of Shares/ Average MarketFace Amount Cost ($) Value ($)
No. of Shares/ Average MarketFace Amount Cost ($) Value ($)
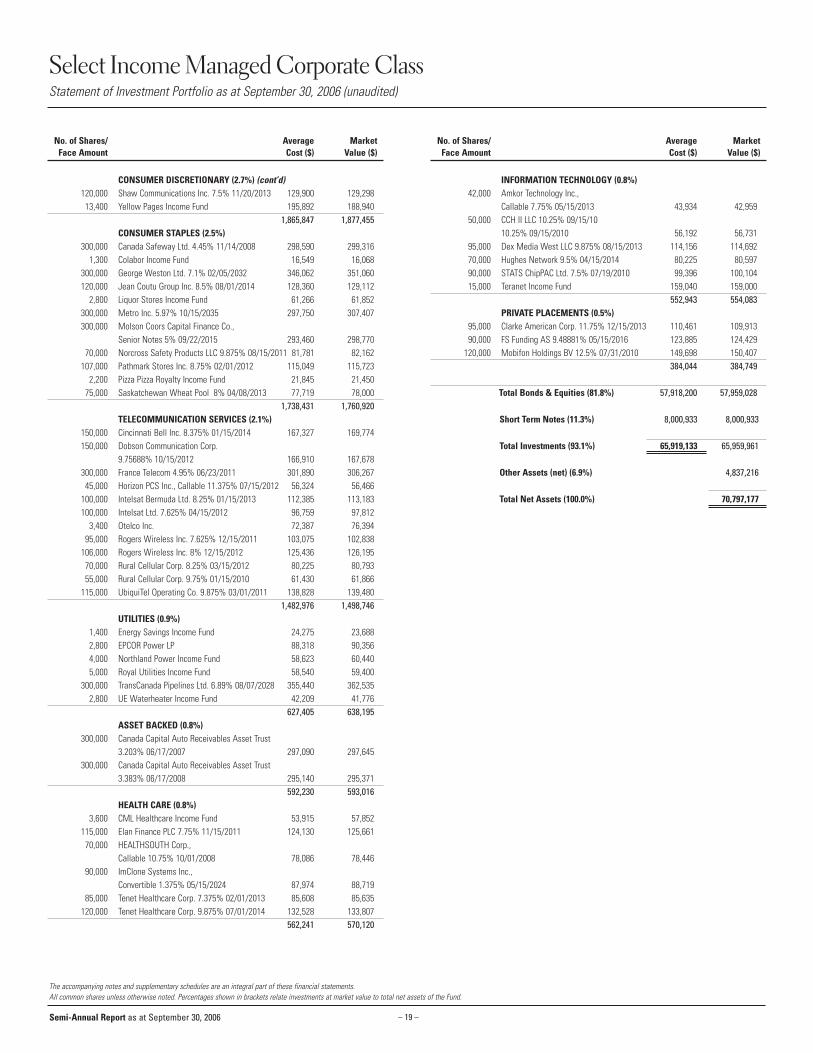
CONSUMER DISCRETIONARY (2.7%) (cont’d) 120,000 Shaw Communications Inc. 7.5% 11/20/2013 129,900 129,298
13,400 Yellow Pages Income Fund 195,892 188,940 1,865,847 1,877,455
CONSUMER STAPLES (2.5%) 300,000 Canada Safeway Ltd. 4.45% 11/14/2008 298,590 299,316
1,300 Colabor Income Fund 16,549 16,068 300,000 George Weston Ltd. 7.1% 02/05/2032 346,062 351,060 120,000 Jean Coutu Group Inc. 8.5% 08/01/2014 128,360 129,112
2,800 Liquor Stores Income Fund 61,266 61,852 300,000 Metro Inc. 5.97% 10/15/2035 297,750 307,407 300,000 Molson Coors Capital Finance Co.,
Senior Notes 5% 09/22/2015 293,460 298,770 70,000 Norcross Safety Products LLC 9.875% 08/15/2011 81,781 82,162
107,000 Pathmark Stores Inc. 8.75% 02/01/2012 115,049 115,723 2,200 Pizza Pizza Royalty Income Fund 21,845 21,450
75,000 Saskatchewan Wheat Pool 8% 04/08/2013 77,719 78,000 1,738,431 1,760,920
TELECOMMUNICATION SERVICES (2.1%) 150,000 Cincinnati Bell Inc. 8.375% 01/15/2014 167,327 169,774 150,000 Dobson Communication Corp.
9.75688% 10/15/2012 166,910 167,678 300,000 France Telecom 4.95% 06/23/2011 301,890 306,267
45,000 Horizon PCS Inc., Callable 11.375% 07/15/2012 56,324 56,466 100,000 Intelsat Bermuda Ltd. 8.25% 01/15/2013 112,385 113,183 100,000 Intelsat Ltd. 7.625% 04/15/2012 96,759 97,812
3,400 Otelco Inc. 72,387 76,394 95,000 Rogers Wireless Inc. 7.625% 12/15/2011 103,075 102,838
106,000 Rogers Wireless Inc. 8% 12/15/2012 125,436 126,195 70,000 Rural Cellular Corp. 8.25% 03/15/2012 80,225 80,793 55,000 Rural Cellular Corp. 9.75% 01/15/2010 61,430 61,866
115,000 UbiquiTel Operating Co. 9.875% 03/01/2011 138,828 139,480 1,482,976 1,498,746
UTILITIES (0.9%) 1,400 Energy Savings Income Fund 24,275 23,688 2,800 EPCOR Power LP 88,318 90,356 4,000 Northland Power Income Fund 58,623 60,440 5,000 Royal Utilities Income Fund 58,540 59,400
300,000 TransCanada Pipelines Ltd. 6.89% 08/07/2028 355,440 362,535 2,800 UE Waterheater Income Fund 42,209 41,776
627,405 638,195 ASSET BACKED (0.8%)
300,000 Canada Capital Auto Receivables Asset Trust 3.203% 06/17/2007 297,090 297,645
300,000 Canada Capital Auto Receivables Asset Trust 3.383% 06/17/2008 295,140 295,371
592,230 593,016 HEALTH CARE (0.8%)
3,600 CML Healthcare Income Fund 53,915 57,852 115,000 Elan Finance PLC 7.75% 11/15/2011 124,130 125,661
70,000 HEALTHSOUTH Corp., Callable 10.75% 10/01/2008 78,086 78,446
90,000 ImClone Systems Inc., Convertible 1.375% 05/15/2024 87,974 88,719
85,000 Tenet Healthcare Corp. 7.375% 02/01/2013 85,608 85,635 120,000 Tenet Healthcare Corp. 9.875% 07/01/2014 132,528 133,807
562,241 570,120
INFORMATION TECHNOLOGY (0.8%) 42,000 Amkor Technology Inc.,
Callable 7.75% 05/15/2013 43,934 42,959 50,000 CCH II LLC 10.25% 09/15/10
10.25% 09/15/2010 56,192 56,731 95,000 Dex Media West LLC 9.875% 08/15/2013 114,156 114,692 70,000 Hughes Network 9.5% 04/15/2014 80,225 80,597 90,000 STATS ChipPAC Ltd. 7.5% 07/19/2010 99,396 100,104 15,000 Teranet Income Fund 159,040 159,000
552,943 554,083 PRIVATE PLACEMENTS (0.5%)
95,000 Clarke American Corp. 11.75% 12/15/2013 110,461 109,913 90,000 FS Funding AS 9.48881% 05/15/2016 123,885 124,429
120,000 Mobifon Holdings BV 12.5% 07/31/2010 149,698 150,407 384,044 384,749
Total Bonds & Equities (81.8%) 57,918,200 57,959,028
Short Term Notes (11.3%) 8,000,933 8,000,933
Total Investments (93.1%) 65,919,133 65,959,961
Other Assets (net) (6.9%) 4,837,216
Total Net Assets (100.0%) 70,797,177
The accompanying notes and supplementary schedules are an integral part of these financial statements. All common shares unless otherwise noted. Percentages shown in brackets relate investments at market value to total net assets of the Fund.
Semi-Annual Report as at September 30, 2006
– 20 –
Select Income Managed Corporate ClassFinancial Statements
Semi-Annual Report as at September 30, 2006
AssetsInvestments at market valueCash and short term investmentsMargin for short salesIncome taxes recoverableDaily variation margin on derivative investmentsUnrealized gain on derivative investmentsReceivable for share subscriptionsReceivable for securities soldDividends and accrued interest receivable
LiabilitiesBank overdraftManagement fees payableAccrued expensesUnrealized loss on derivative investmentsPremium received from options contractPayable for securities purchasedPayable for share redemptionsInvestments sold short at market valueDividends payableCapital taxes payable
Net assets and shareholders' equity
Net assets per classA SharesF SharesI SharesW Shares
Net asset value per shareA SharesF SharesI SharesW Shares
Number of shares outstanding(see Schedule of Fund Share Transactions)
A SharesF SharesI SharesW Shares
IncomeDividendsInterest Securities lendingDerivative income (loss)Income distribution from investmentsLess: Foreign withholding taxes
ExpensesManagement fees Administrative fees Capital taxesGoods and services tax
Income (loss) before taxesProvision for income taxesNet income (loss) for the period
Realized and unrealized gain (loss) on investments(see Schedule of Commissions)
Realized gain (loss) on investmentsForeign exchange gain (loss)Capital gain distribution from investmentsChange in unrealized appreciation (depreciation) of investmentsNet gain (loss) on investmentsIncrease (decrease) in net assets from operations
Increase (decrease) in net assets from operations per classA SharesF SharesI SharesW Shares
Increase (decrease) in net assets from operationsper share
A SharesF SharesI SharesW Shares
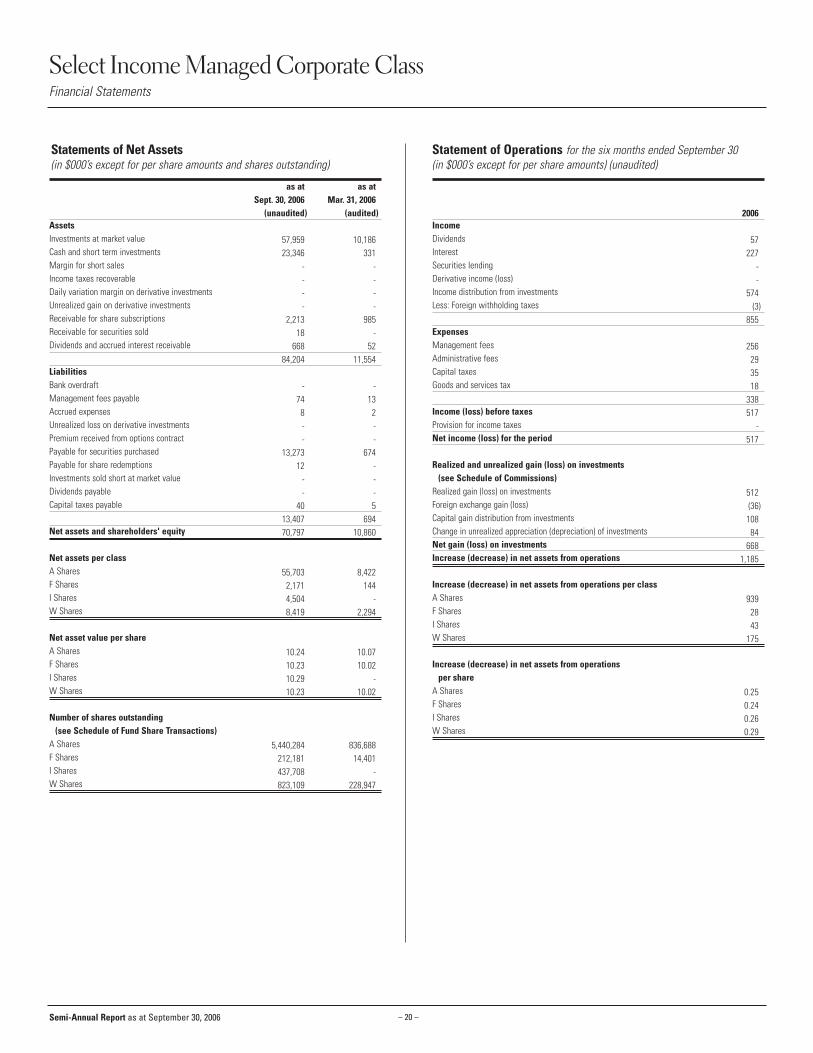
as at as atSept. 30, 2006 Mar. 31, 2006
(unaudited) (audited)
57,959 10,18623,346 331
- -- -- -- -
2,213 98518 -
668 5284,204 11,554
- -74 138 2- -- -
13,273 67412 -
- -- -
40 513,407 69470,797 10,860
55,703 8,4222,171 1444,504 -8,419 2,294
10.24 10.0710.23 10.0210.29 -10.23 10.02
5,440,284 836,688212,181 14,401437,708 -823,109 228,947
2006
57227
--
574(3)
855
256293518
338517
-517
512(36)
10884
6681,185
9392843
175
0.250.240.260.29
Statement of Operations for the six months ended September 30 (in $000’s except for per share amounts) (unaudited)
Statements of Net Assets(in $000’s except for per share amounts and shares outstanding)

– 21 –
Select Income Managed Corporate ClassFinancial Statements
Semi-Annual Report as at September 30, 2006
A SharesNet assets, beginning of periodCapital transactions
Proceeds from shares issued Reinvested dividends Amounts paid for shares redeemedFund merger Conversion of shares (net)
Dividends to investorsFrom realized gainsFrom net incomeFrom return of capital
Increase (decrease) in net assets from operationsNet assets, end of period
F SharesNet assets, beginning of periodCapital transactions
Proceeds from shares issued Reinvested dividends Amounts paid for shares redeemedFund merger Conversion of shares (net)
Dividends to investorsFrom realized gainsFrom net incomeFrom return of capital
Increase (decrease) in net assets from operationsNet assets, end of period
I SharesNet assets, beginning of periodCapital transactions
Proceeds from shares issued Reinvested dividends Amounts paid for shares redeemedFund merger Conversion of shares (net)
Dividends to investorsFrom realized gainsFrom net incomeFrom return of capital
Increase (decrease) in net assets from operationsNet assets, end of period
W SharesNet assets, beginning of periodCapital transactions
Proceeds from shares issued Reinvested dividends Amounts paid for shares redeemedFund merger Conversion of shares (net)
Dividends to investorsFrom realized gainsFrom net incomeFrom return of capital
Increase (decrease) in net assets from operationsNet assets, end of period
Total FundNet assets, beginning of periodCapital transactions
Proceeds from shares issued Reinvested dividends Amounts paid for shares redeemedFund merger Conversion of shares (net)
Dividends to investorsFrom realized gainsFrom net incomeFrom return of capital
Increase (decrease) in net assets from operationsNet assets, end of period
2,294
5,967-
(193)-
1765,950
----
1758,419
10,860
55,668-
(1,376)-
4,46058,752
----
1,18570,797
8,422
44,731-
(1,154)-
2,76546,342
----
93955,703
144
1,980-
(10)-
291,999
----
282,171
-
2,990-
(19)-
1,4904,461
----
434,504
Statements of Changes in Net Assets for the six months ended September 30 (in $000’s) (unaudited)
2006
Statements of Changes in Net Assets (cont’d)for the six months ended September 30 (in $000’s) (unaudited)
2006
– 22 –
Select Income Managed Corporate ClassFinancial Statements – Supplementary Schedules
Semi-Annual Report as at September 30, 2006
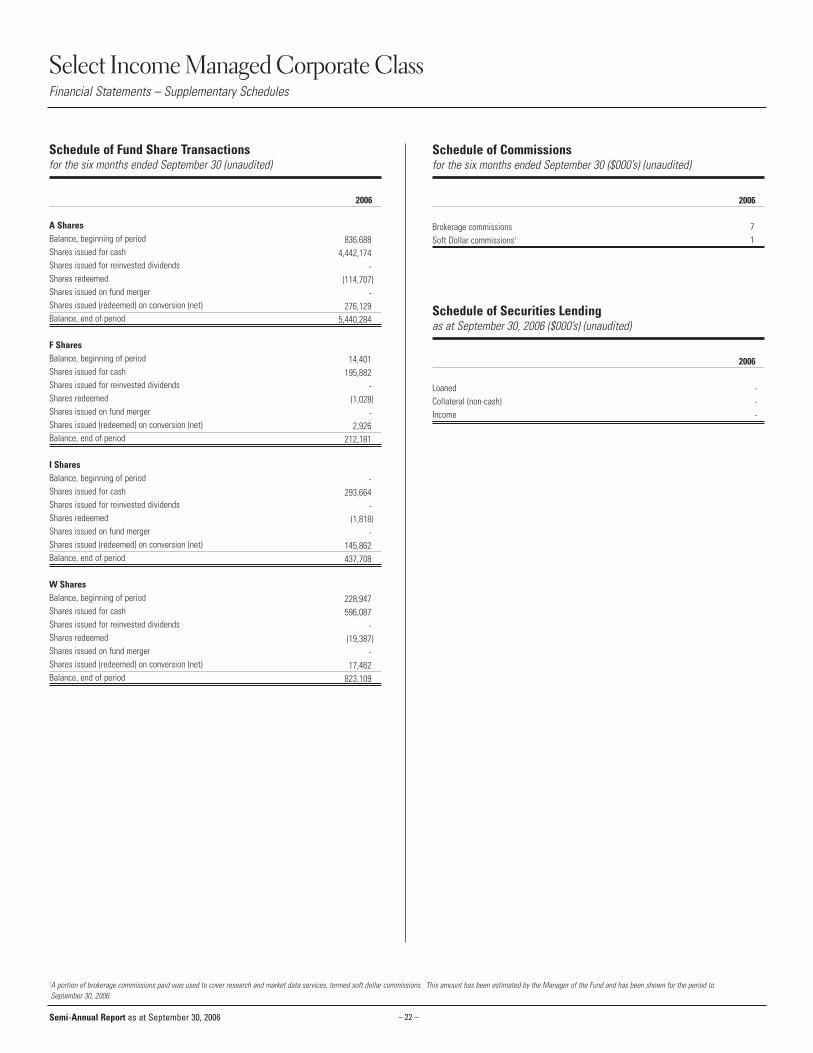
†A portion of brokerage commissions paid was used to cover research and market data services, termed soft dollar commissions. This amount has been estimated by the Manager of the Fund and has been shown for the period to September 30, 2006.
A SharesBalance, beginning of periodShares issued for cash Shares issued for reinvested dividends Shares redeemedShares issued on fund merger Shares issued (redeemed) on conversion (net)Balance, end of period
F SharesBalance, beginning of periodShares issued for cash Shares issued for reinvested dividends Shares redeemedShares issued on fund merger Shares issued (redeemed) on conversion (net)Balance, end of period
I SharesBalance, beginning of periodShares issued for cash Shares issued for reinvested dividends Shares redeemedShares issued on fund merger Shares issued (redeemed) on conversion (net)Balance, end of period
W SharesBalance, beginning of periodShares issued for cash Shares issued for reinvested dividends Shares redeemedShares issued on fund merger Shares issued (redeemed) on conversion (net)Balance, end of period
Schedule of Securities Lendingas at September 30, 2006 ($000’s) (unaudited)
2006
LoanedCollateral (non-cash)Income
---
Schedule of Commissionsfor the six months ended September 30 ($000’s) (unaudited)
2006
Brokerage commissionsSoft Dollar commissions†
71
Schedule of Fund Share Transactions for the six months ended September 30 (unaudited)
2006
836,6884,442,174
-(114,707)
-276,129
5,440,284
14,401195,882
-(1,028)
-2,926
212,181
-293,664
-(1,818)
-145,862437,708
228,947596,087
-(19,387)
-17,462
823,109
– 23 –
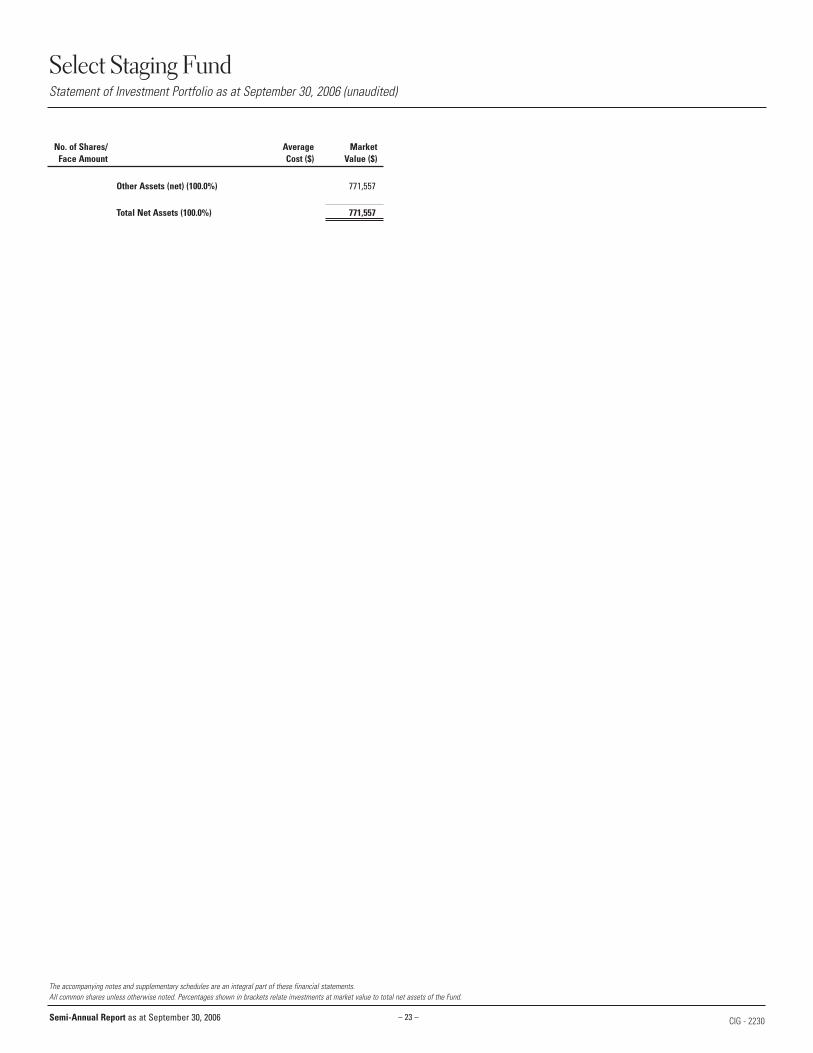
Select Staging FundStatement of Investment Portfolio as at September 30, 2006 (unaudited)
No. of Shares/ Average MarketFace Amount Cost ($) Value ($)
Other Assets (net) (100.0%) 771,557
Total Net Assets (100.0%) 771,557
The accompanying notes and supplementary schedules are an integral part of these financial statements. All common shares unless otherwise noted. Percentages shown in brackets relate investments at market value to total net assets of the Fund.
Semi-Annual Report as at September 30, 2006 CIG - 2230
– 24 –
Select Staging FundFinancial Statements
Semi-Annual Report as at September 30, 2006
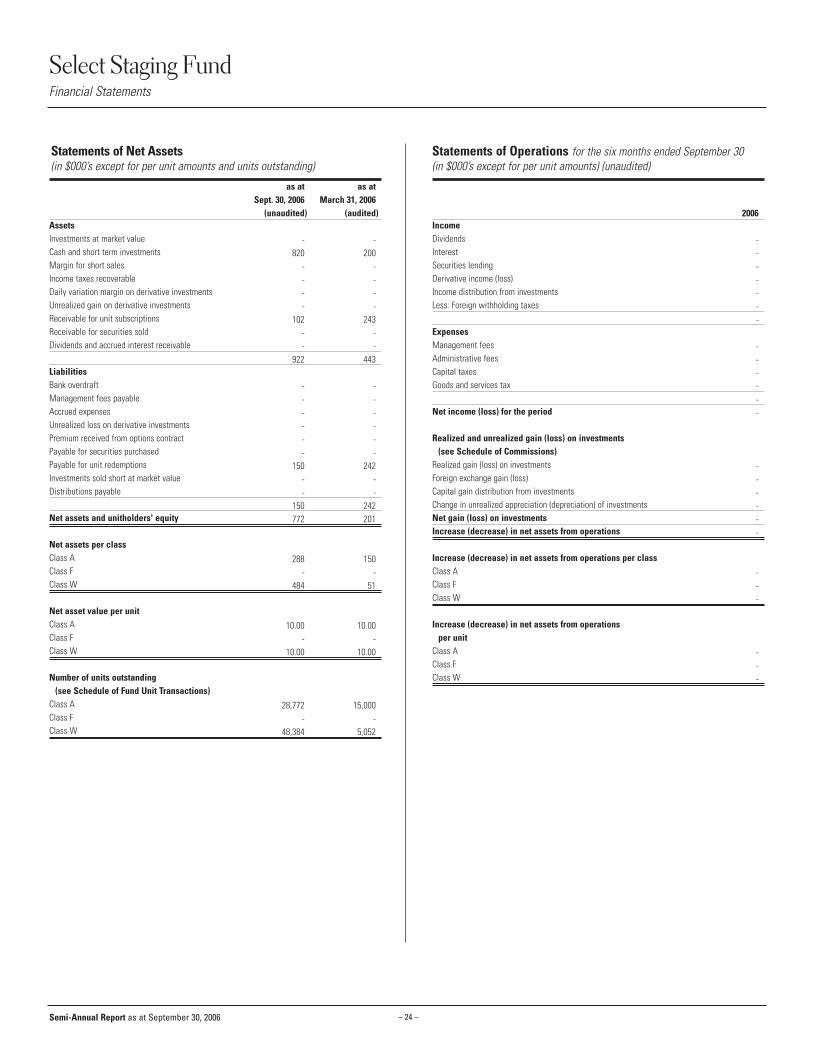
AssetsInvestments at market valueCash and short term investmentsMargin for short salesIncome taxes recoverableDaily variation margin on derivative investmentsUnrealized gain on derivative investmentsReceivable for unit subscriptionsReceivable for securities soldDividends and accrued interest receivable
LiabilitiesBank overdraftManagement fees payableAccrued expensesUnrealized loss on derivative investmentsPremium received from options contractPayable for securities purchasedPayable for unit redemptionsInvestments sold short at market valueDistributions payable
Net assets and unitholders' equity
Net assets per classClass AClass FClass W
Net asset value per unitClass AClass FClass W
Number of units outstanding(see Schedule of Fund Unit Transactions)
Class AClass FClass W
IncomeDividendsInterest Securities lendingDerivative income (loss)Income distribution from investmentsLess: Foreign withholding taxes
ExpensesManagement fees Administrative fees Capital taxesGoods and services tax
Net income (loss) for the period
Realized and unrealized gain (loss) on investments(see Schedule of Commissions)
Realized gain (loss) on investmentsForeign exchange gain (loss)Capital gain distribution from investmentsChange in unrealized appreciation (depreciation) of investmentsNet gain (loss) on investmentsIncrease (decrease) in net assets from operations
Increase (decrease) in net assets from operations per classClass AClass FClass W
Increase (decrease) in net assets from operationsper unit
Class AClass FClass W
as at as atSept. 30, 2006 March 31, 2006
(unaudited) (audited)
- -820 200
- -- -- -- -
102 243- -- -
922 443
- -- -- -- -- -- -
150 242- -- -
150 242772 201
288 150- -
484 51
10.00 10.00- -
10.00 10.00
28,772 15,000- -
48,384 5,052
2006
-------
------
------
---
---
Statements of Operations for the six months ended September 30 (in $000’s except for per unit amounts) (unaudited)
Statements of Net Assets(in $000’s except for per unit amounts and units outstanding)
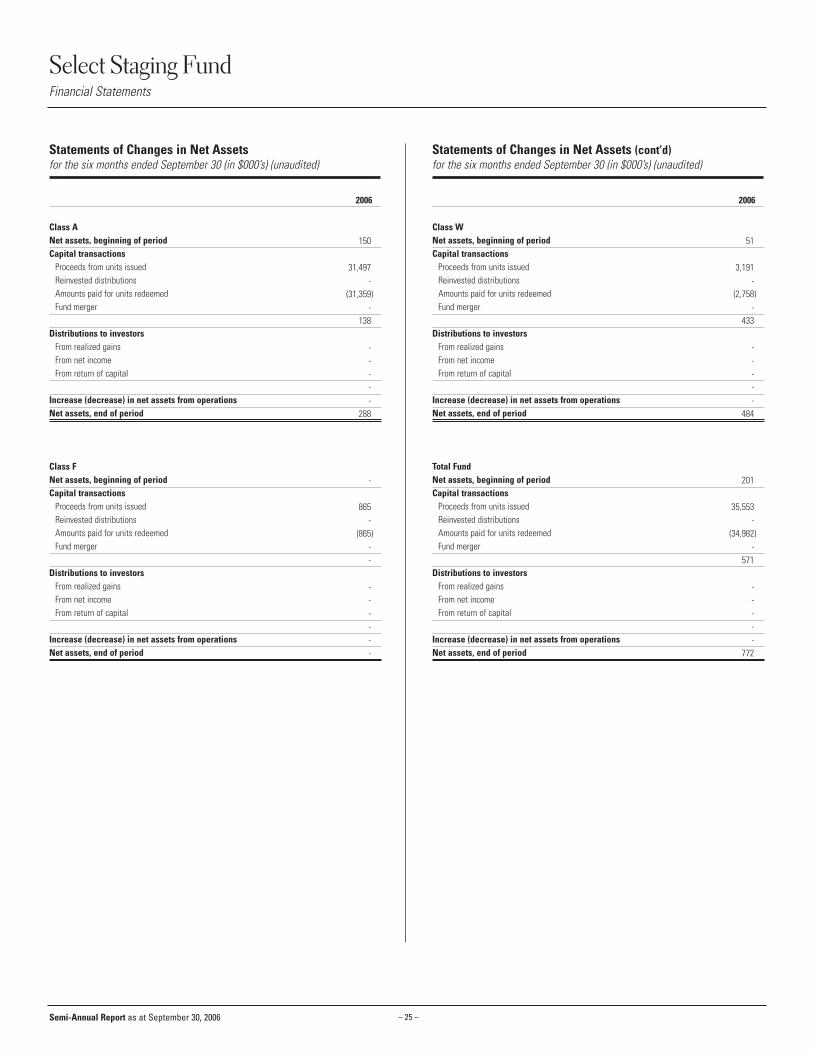
– 25 –
Class ANet assets, beginning of periodCapital transactions
Proceeds from units issued Reinvested distributions Amounts paid for units redeemedFund merger
Distributions to investorsFrom realized gainsFrom net incomeFrom return of capital
Increase (decrease) in net assets from operationsNet assets, end of period
Class FNet assets, beginning of periodCapital transactions
Proceeds from units issued Reinvested distributions Amounts paid for units redeemedFund merger
Distributions to investorsFrom realized gainsFrom net incomeFrom return of capital
Increase (decrease) in net assets from operationsNet assets, end of period
Class WNet assets, beginning of periodCapital transactions
Proceeds from units issued Reinvested distributionsAmounts paid for units redeemedFund merger
Distributions to investorsFrom realized gainsFrom net incomeFrom return of capital
Increase (decrease) in net assets from operationsNet assets, end of period
Total FundNet assets, beginning of periodCapital transactions
Proceeds from units issued Reinvested distributionsAmounts paid for units redeemedFund merger
Distributions to investorsFrom realized gainsFrom net incomeFrom return of capital
Increase (decrease) in net assets from operationsNet assets, end of period
51
3,191-
(2,758)-
433
-----
484
201
35,553-
(34,982)-
571
-----
772
150
31,497-
(31,359)-
138
-----
288
-
865-
(865)--
------
Select Staging FundFinancial Statements
Semi-Annual Report as at September 30, 2006
Statements of Changes in Net Assets for the six months ended September 30 (in $000’s) (unaudited)
2006
Statements of Changes in Net Assets (cont’d)for the six months ended September 30 (in $000’s) (unaudited)
2006
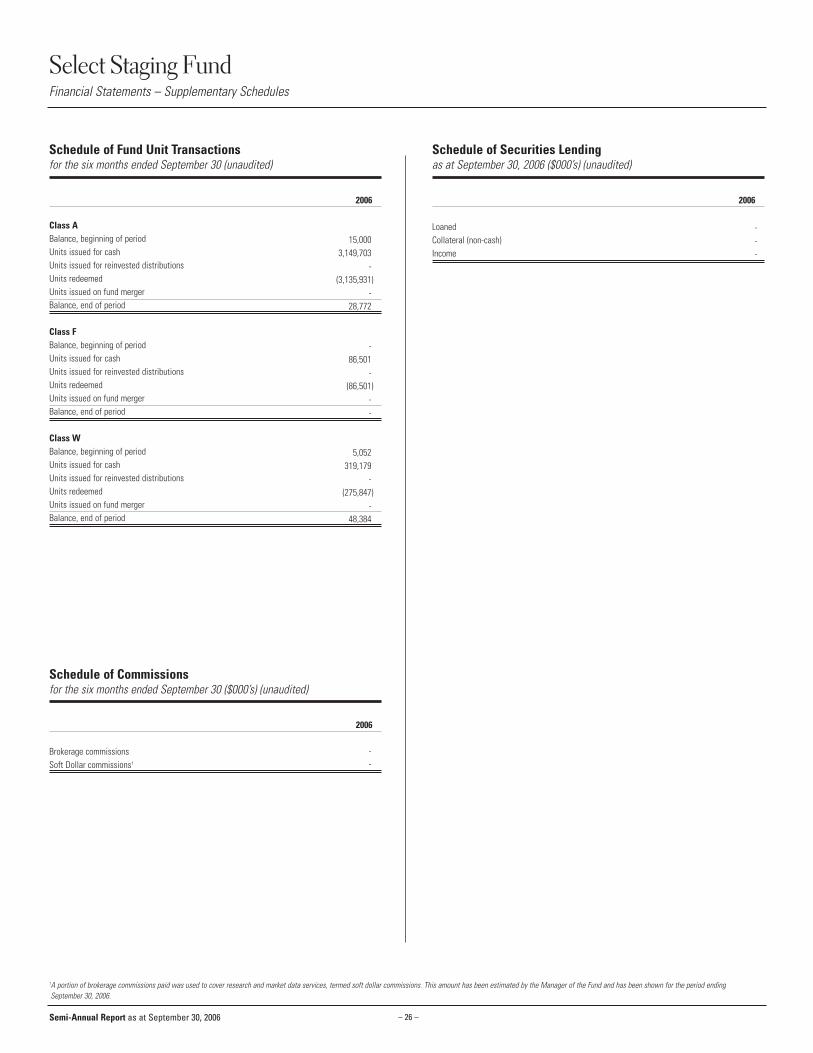
– 26 –
Class ABalance, beginning of periodUnits issued for cash Units issued for reinvested distributions Units redeemedUnits issued on fund merger Balance, end of period
Class FBalance, beginning of periodUnits issued for cash Units issued for reinvested distributions Units redeemedUnits issued on fund merger Balance, end of period
Class WBalance, beginning of periodUnits issued for cash Units issued for reinvested distributions Units redeemedUnits issued on fund merger Balance, end of period
Select Staging FundFinancial Statements – Supplementary Schedules
Schedule of Securities Lendingas at September 30, 2006 ($000’s) (unaudited)
2006
LoanedCollateral (non-cash)Income
Schedule of Commissionsfor the six months ended September 30 ($000’s) (unaudited)
2006
Brokerage commissionsSoft Dollar commissions†
--
Schedule of Fund Unit Transactions for the six months ended September 30 (unaudited)
2006
15,0003,149,703
-(3,135,931)
-28,772
-86,501
-(86,501)
--
5,052319,179
-(275,847)
-48,384
Semi-Annual Report as at September 30, 2006
†A portion of brokerage commissions paid was used to cover research and market data services, termed soft dollar commissions. This amount has been estimated by the Manager of the Fund and has been shown for the period ending September 30, 2006.
---
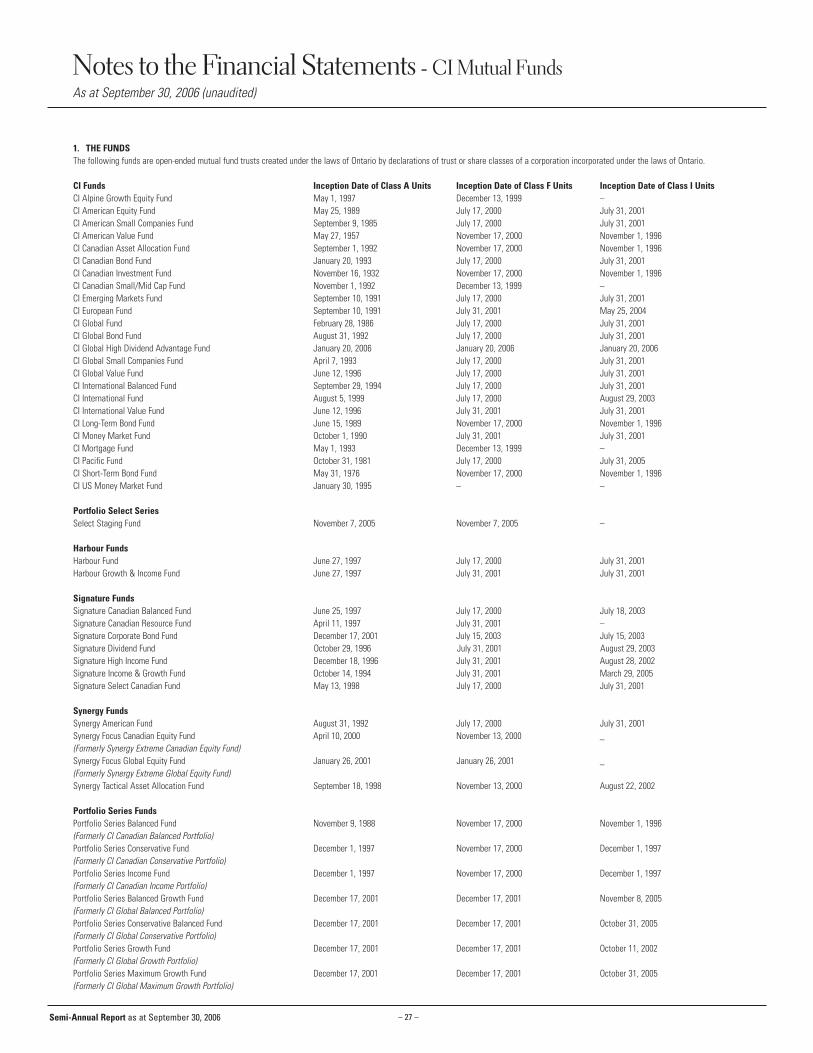
1. THE FUNDSThe following funds are open-ended mutual fund trusts created under the laws of Ontario by declarations of trust or share classes of a corporation incorporated under the laws of Ontario.
CI Funds Inception Date of Class A Units Inception Date of Class F Units Inception Date of Class I UnitsCI Alpine Growth Equity Fund May 1, 1997 December 13, 1999 –CI American Equity Fund May 25, 1989 July 17, 2000 July 31, 2001CI American Small Companies Fund September 9, 1985 July 17, 2000 July 31, 2001CI American Value Fund May 27, 1957 November 17, 2000 November 1, 1996CI Canadian Asset Allocation Fund September 1, 1992 November 17, 2000 November 1, 1996CI Canadian Bond Fund January 20, 1993 July 17, 2000 July 31, 2001CI Canadian Investment Fund November 16, 1932 November 17, 2000 November 1, 1996CI Canadian Small/Mid Cap Fund November 1, 1992 December 13, 1999 –CI Emerging Markets Fund September 10, 1991 July 17, 2000 July 31, 2001CI European Fund September 10, 1991 July 31, 2001 May 25, 2004CI Global Fund February 28, 1986 July 17, 2000 July 31, 2001CI Global Bond Fund August 31, 1992 July 17, 2000 July 31, 2001CI Global High Dividend Advantage Fund January 20, 2006 January 20, 2006 January 20, 2006CI Global Small Companies Fund April 7, 1993 July 17, 2000 July 31, 2001CI Global Value Fund June 12, 1996 July 17, 2000 July 31, 2001CI International Balanced Fund September 29, 1994 July 17, 2000 July 31, 2001CI International Fund August 5, 1999 July 17, 2000 August 29, 2003CI International Value Fund June 12, 1996 July 31, 2001 July 31, 2001CI Long-Term Bond Fund June 15, 1989 November 17, 2000 November 1, 1996CI Money Market Fund October 1, 1990 July 31, 2001 July 31, 2001CI Mortgage Fund May 1, 1993 December 13, 1999 –CI Pacific Fund October 31, 1981 July 17, 2000 July 31, 2005CI Short-Term Bond Fund May 31, 1976 November 17, 2000 November 1, 1996CI US Money Market Fund January 30, 1995 – –
Portfolio Select SeriesSelect Staging Fund November 7, 2005 November 7, 2005 –
Harbour Funds Harbour Fund June 27, 1997 July 17, 2000 July 31, 2001Harbour Growth & Income Fund June 27, 1997 July 31, 2001 July 31, 2001
Signature Funds Signature Canadian Balanced Fund June 25, 1997 July 17, 2000 July 18, 2003Signature Canadian Resource Fund April 11, 1997 July 31, 2001 –Signature Corporate Bond Fund December 17, 2001 July 15, 2003 July 15, 2003Signature Dividend Fund October 29, 1996 July 31, 2001 August 29, 2003Signature High Income Fund December 18, 1996 July 31, 2001 August 28, 2002Signature Income & Growth Fund October 14, 1994 July 31, 2001 March 29, 2005Signature Select Canadian Fund May 13, 1998 July 17, 2000 July 31, 2001
Synergy FundsSynergy American Fund August 31, 1992 July 17, 2000 July 31, 2001Synergy Focus Canadian Equity Fund April 10, 2000 November 13, 2000 _(Formerly Synergy Extreme Canadian Equity Fund)Synergy Focus Global Equity Fund January 26, 2001 January 26, 2001 _(Formerly Synergy Extreme Global Equity Fund)Synergy Tactical Asset Allocation Fund September 18, 1998 November 13, 2000 August 22, 2002
Portfolio Series Funds Portfolio Series Balanced Fund November 9, 1988 November 17, 2000 November 1, 1996(Formerly CI Canadian Balanced Portfolio)Portfolio Series Conservative Fund December 1, 1997 November 17, 2000 December 1, 1997(Formerly CI Canadian Conservative Portfolio)Portfolio Series Income Fund December 1, 1997 November 17, 2000 December 1, 1997(Formerly CI Canadian Income Portfolio)Portfolio Series Balanced Growth Fund December 17, 2001 December 17, 2001 November 8, 2005(Formerly CI Global Balanced Portfolio)Portfolio Series Conservative Balanced Fund December 17, 2001 December 17, 2001 October 31, 2005(Formerly CI Global Conservative Portfolio)Portfolio Series Growth Fund December 17, 2001 December 17, 2001 October 11, 2002(Formerly CI Global Growth Portfolio)Portfolio Series Maximum Growth Fund December 17, 2001 December 17, 2001 October 31, 2005(Formerly CI Global Maximum Growth Portfolio)
Notes to the Financial Statements - CI Mutual FundsAs at September 30, 2006 (unaudited)
Semi-Annual Report as at September 30, 2006 – 27 –
The following Funds offered Insight units to investors commencing on July 15, 2003.CI American Value Fund CI International FundCI Canadian Bond Fund CI International Value FundCI Canadian Investment Fund CI Money Market FundCI Global Bond Fund Signature Corporate Bond FundCI Global Fund Signature Select Canadian FundCI Global Small Companies FundCI Explorer Fund
CI Alpine Growth Equity Fund, CI Canadian Small/Mid Cap Fund and CI Mortgage Fund offeredClass B units to investors commencing on December 13, 1999.
Signature Dividend Fund offered Class X units and Class Y units to investors commencingAugust 29, 2003.
Harbour Growth & Income Fund and Signature Dividend Fund offered Class Z units to investorscommencing on August 29, 2003.
Signature Select Canadian Fund and Signature Canadian Balanced Fund offered Class Z Unitsto investors commencing on August 2, 2005.
CI Money Market Fund offered Class M units to investors commencing October 18, 2005.
Select Staging Fund offered Class W units to investors commencing November 7, 2005.
The date of inception of each Fund is shown above.
Class A units are available to all investors.Class F units are available to certain investors including those who participate in fee-basedprograms through their financial advisers or who are members of certain groups.Class I units are available to institutional clients and investors who have entered into Class IAccount Agreements with CI Investments Inc. (formerly, CI Mutual Funds Inc.).Insight units are issued to investors of the Insight Program, for use in fee-based accounts.Class X, Class Y or Class Z units were issued to certain investors in connection with variousmutual fund reorganizations and are generally only available for purchase by those investors.
Effective as of close of business on July 28, 2006 the following funds were merged:
Terminated Funds Continuing FundsCI Explorer Fund CI American Small Companies FundCI Canadian Growth Portfolio Portfolio Series Balanced Growth Fund
(Formerly CI Global Balanced Portfolio)CI Canadian Maximum Growth Portfolio Portfolio Series Maximum Growth Fund
(Formerly CI Global Maximum Growth Portfolio)
The purchase method of accounting has been adopted for the merger of the Funds. Under thismethod, one of the Funds in each merger is identified as the acquiring Fund, and is known as the“Continuing Fund”, and any other Fund involved in the merger is known as the “Terminated Fund”.
The mergers were effected by transferring the net assets of the Terminated Funds in exchangefor securities of the Continuing Funds. The value of the securities of the Continuing Fundsissued in connection with these mergers was equal to the market value of the net assetstransferred from the Terminated Funds.
The Terminated Funds are not included in these financial statements.
The Investment Portfolios for each of the Funds are as at September 30, 2006 and theStatements of Net Assets are as at September 30, 2006 and March 31, 2006. The Statementsof Operations, Changes in Net Assets and Schedule of Fund Unit Transactions for each Fundare for the period from April 1, 2006 to September 30, 2006 and April 1, 2005 to September 30,2005 except for CI Global High Dividend Advantage Fund where information presented is forthe period from April 1, 2006 to September 30, 2006 only.
2. SIGNIFICANT ACCOUNTING POLICIESThe following is a summary of significant accounting policies of the Funds:
(a) Valuation of InvestmentsListed securities are valued on each business day at their latest available sale price. In theabsence of recorded sales on that day, they are valued at the average of the last recordedbid and ask prices where appropriate. Unlisted securities are valued on each business daybased on price quotations from recognized investment dealers, or failing that, management’sbest estimate of fair value. Short-term fixed income securities are valued at cost which,together with accrued interest, approximates market value. Mutual funds are valued oneach business day at their closing net asset value.
(b) Foreign ExchangeForeign currency amounts are translated into Canadian dollars as follows: market value ofinvestments, forward currency contracts, other assets and liabilities at the closing rate ofexchange on each business day; income, expenses and purchases, sales and settlementsof investments at the rate of exchange prevailing on the respective dates of such transactions.
(c) Investment Transactions and Income RecognitionInvestment transactions are accounted for on the trade date for financial reportingpurposes and any realized gains and losses from such transactions are calculated on anaverage cost basis. Dividend income and distributions from investments are recognized onthe ex-dividend/ex-distribution date and interest income on the accrual basis.
Distributions received from investment trust holdings are recorded as income, capital gainsor a return of capital, based on the best information available to the Manager. Due to thenature of these investments, actual allocations could vary from this information.Distributions from investment trusts that are treated as a return of capital for income taxpurposes reduce the average cost of the underlying investment trust on the Statement ofInvestments.
Distributions received from investment fund holdings are recognized by the funds in thesame form in which they were received from the underlying funds.
(d) Net Asset Value Per UnitNet asset value per unit for each class is calculated at the end of each day on which theToronto Stock Exchange is open for business by dividing the net assets of each class by itsoutstanding units. The net asset value of each class is computed by calculating the valueof that class’s proportionate share of the Fund’s assets less that class’s proportionate shareof the Fund’s common liabilities and less class specific liabilities. Expenses directlyattributable to a class are charged to that class. Other income and expenses are allocatedto each class proportionately based upon the relative net asset value of each class.
(e) Futures, Forward, Option and Swap ContractsFutures, forward, option and swap contracts are marked-to-market on each valuation dayaccording to the gain or loss that would be realized if the contracts were closed out. Allgains or losses arising from futures, forward, option and swap contracts are recorded asunrealized appreciation/depreciation of investments until the contracts are closed out orexpire, at which time the gains (losses) are realized.
(f) Short SellingThe value of any short sale is determined by calculating the daily marked-to-market gainor loss on the short sale. The cash proceeds of a short sale will be recorded as a deferreddebit. The market value of the securities sold short will be recorded as a deferred credit.The gain or loss will be calculated by subtracting (i) the sum of the market value of thesecurities sold short plus any recorded costs of borrowing, from (ii) the sum of the cashproceeds of the short sale plus any recorded interest earned on the cash proceeds.
Notes to the Financial Statements - CI Mutual Funds
Semi-Annual Report as at September 30, 2006 – 28 –
(g) Increase (Decrease) in Net Assets from Operations per UnitIncrease (decrease) in net assets from operations per unit in the Statements of Operationsis calculated by dividing the increase (decrease) in net assets from operations of the Fundby the weighted average number of units outstanding during the period.
(h) Use of EstimatesThe preparation of financial statements in accordance with Canadian generally acceptedaccounting principles requires management to make estimates and assumptions thataffect the reported amounts of assets and liabilities at the reporting date and the reportedamounts of income and expenses during the reporting period. Actual results could differfrom those estimates.
(i) AcG-15 Variable Interest EntitiesThe Funds have adopted the provisions of Accounting Guideline 15, which requires a fund todisclose its investment in an underlying fund when it is the primary beneficiary of that fund.
In accordance with their investment policy, certain funds may invest in units of anotherinvestment fund. Funds that own more than 50% of the units of an underlying investmentfund are deemed to be primary beneficiaries of that investment fund.
The Portfolio Series Balanced Fund has investments in the underlying investment funds atSeptember 30, 2006:
Ownership % ofUnderlying Fund Underlying FundCI American Managers® Corporate Class (I Shares) 25.2Synergy American Fund (Class I) 24.0CI American Value Corporate Class (I Shares) 30.8CI Global Bond Fund (Class I) 22.9CI International Fund (Class I) 22.4Signature Corporate Bond Fund (Class I) 28.2CI International Value Fund (Class I) 20.7CI American Equity Fund (Class I) 19.9CI Canadian Bond Fund (Class I) 15.7
The Portfolio Series Balanced Fund together with related funds hold more than 50% of theabove underlying funds, and as such, the Portfolio Series Balanced Fund is deemed to be theprimary beneficiary of the above underlying funds through its largest ownership interest.
Consolidation of the Portfolio Series Balanced Fund interest in the underlying investmentfunds above has been made for the six-month period ending September 30, 2006, however,consolidation has not been retroactively applied to any prior periods.
(j) ComparativesCertain prior period amounts have been reclassified to conform to the current period’sfinancial statement presentation.
3. INCOME TAXESThe Funds qualify as mutual fund trusts under the provisions of the Income Tax Act (Canada)and, accordingly, are not subject to tax on net income, including net realized capital gains forthe taxation year, which is paid or payable to unitholders at the end of the taxation year.However, such part of each Fund’s taxable income and net realized capital gains that is not sopaid or payable will be taxable to that Fund. Income tax on net realized capital gains not paidor payable will generally be recoverable by virtue of refunding provisions contained in the IncomeTax Act (Canada) and provincial income tax legislation, as redemptions occur. It is the intentionof each Fund to pay all net taxable income and sufficient net realized capital gains so that theFund will not be subject to income tax. Occasionally, a Fund may distribute more than it earns.This excess distribution is a return of capital and is not taxable to unitholders.
Net capital losses may be carried forward indefinitely to reduce future net realized capital gains.Non-capital losses may be carried forward ten years.
4. MANAGEMENT FEES AND OTHER EXPENSESCI Investments Inc. is the Manager of each Fund and, in consideration of management feesreceived, provides management services required in the day-to-day operations of the Fundsincluding management of the investment portfolios of the Funds.
The management fee is calculated on the net assets of each Fund at the end of each businessday and is paid daily.
Prior to September 2005, each Fund was responsible for all operating and administrativeexpenses including audit and legal fees, registry and transfer agency fees, custody fees,expenses relating to reporting and making distributions to unitholders, all other costs and feesimposed by statute or regulation and expenses of all communications with unitholders.
Effective September 2005, the manager bears all of the operating expenses of the Funds (otherthan certain taxes, borrowing costs and new governmental fees) in return for fixed annualadministration fees (the “Administration Fees”).
Each Administration Fee is calculated as a fixed annual percentage of the net asset value ofeach class of the Fund at the end of each business day and is paid daily.
Administration Fees (%)CI Mutual Funds CI Alpine Growth Equity Fund 0.20CI American Equity Fund 0.21CI American Small Companies Fund 0.21CI American Value Fund 0.21CI Canadian Asset Allocation Fund 0.20CI Canadian Bond Fund 0.17CI Canadian Investment Fund 0.20CI Canadian Small/Mid Cap Fund 0.20CI Emerging Markets Fund 0.22CI European Fund 0.22CI Global Fund 0.22CI Global Bond Fund 0.18CI Global High Dividend Advantage Fund 0.20CI Global Small Companies Fund 0.22CI Global Value Fund 0.22CI International Balanced Fund 0.22CI International Fund 0.22CI International Value Fund 0.22CI Long-Term Bond Fund 0.17CI Money Market Fund nilCI Mortgage Fund 0.20CI Pacific Fund 0.22CI Short-Term Bond Fund 0.17CI US Money Market Fund nilSelect Staging Fund nil
Harbour Funds Harbour Fund 0.20Harbour Growth & Income Fund 0.20
Signature Funds Signature Canadian Balanced Fund 0.20Signature Canadian Resource Fund 0.20Signature Corporate Bond Fund 0.20Signature Dividend Fund 0.20
Notes to the Financial Statements - CI Mutual Funds
Semi-Annual Report as at September 30, 2006 – 29 –
Notes to the Financial Statements - CI Mutual Funds
Semi-Annual Report as at September 30, 2006
(cont’d)Administration Fees (%)
Signature Funds Signature High Income Fund 0.20Signature Income & Growth Fund 0.20Signature Select Canadian Fund 0.20
Synergy Mutual Funds Synergy American Fund 0.21 Synergy Focus Canadian Equity Fund 0.20(Formerly Synergy Extreme Canadian Equity Fund)Synergy Focus Global Equity Fund 0.22(Formerly Synergy Extreme Global Equity Fund)Synergy Tactical Asset Allocation Fund 0.22
CI Portfolio Series Funds Portfolio Series Balanced Fund 0.20(Formerly CI Canadian Balanced Portfolio)Portfolio Series Conservative Fund 0.20(Formerly CI Canadian Conservative Portfolio)Portfolio Series Income Fund 0.17(Formerly CI Canadian Income Portfolio)Portfolio Series Balanced Growth 0.22(Formerly CI Global Balanced Portfolio)Portfolio Series Conservative Balaced Fund 0.22(Formerly CI Global Conservative Portfolio)Portfolio Series Growth Fund 0.22(Formerly CI Global Growth Portfolio)Portfolio Series Maximum Growth Fund 0.22(Formerly CI Global Maximum Growth Portfolio)
Prior to 2003, in order to reduce the effective Management Expense Ratios of certain fundssome of the management fees and/or operating expenses may have been waived by theManager.
5. SECURITIES LENDINGCertain Funds have entered into a securities lending program with their custodian, RBC DexiaInvestor Services Trust ("RBC Dexia"). The aggregate market value of all securities loaned by aFund cannot exceed 50% of the assets of the Fund. A Fund will receive collateral of at least102% of the value of securities on loan. Collateral will generally be comprised of cash andobligations of or guaranteed by the Government of Canada or a province thereof, or by theUnited States government or its agencies, but may include obligations of other governmentswith appropriate credit ratings. RBC Dexia has indemnified the Funds against the credit risk ofthe borrowers. For those Funds participating in the program, amounts for securities loaned, thecollateral received, and the income collected appear on the fund specific schedules in thefinancial statements and income from securities lending is included in "Securities lending" inthe Statements of Operations.
6. REINVESTMENT OF DISTRIBUTIONSWhen a Fund pays a distribution to a unitholder, it will be paid in the same currency in whichthe units are held. Distributions are automatically reinvested without charge in the same Fund.The Manager may change the distribution policy at its discretion. Further information regardingreinvestment of distributions can be found in the Fund’s Simplified Prospectus.
7. SHORT SELLING RISKThere is no assurance that securities will decline in value during the period of the short salesufficient to offset the interest paid by the mutual fund and make a profit for the mutual fund,and securities sold short may instead increase in value. The mutual fund may also experiencedifficulties repurchasing and returning the borrowed securities if a liquid market for thesecurities does not exist. The lender from whom the mutual fund has borrowed securities maygo bankrupt and the mutual fund may lose the collateral it has deposited with the lender.
8 . RELATED PARTY TRANSACTIONS Sun Life Financial Inc. (“Sun Life”) owns a significant interest in CI Financial Income Fund, theparent company of the Manager, and is therefore considered a related party to the Funds. Sun Life does not hold investments in the Funds.
– 30 –
1. THE FUNDSCI Corporate Class Limited (the “Corporation”) was incorporated on July 8, 1987 under the laws of the Province of Ontario.
The Corporation is authorized to issue an unlimited number of non-cumulative, redeemable, restricted voting, convertible shares of various designated classes and an unlimited number of common shares.Each designated class of shares holds a separate proprietary right in the investments and net assets acquired specifically for that class of shares. Each class of shares has a right of conversion to anyother class of shares of the Corporation.
The following Funds are a class of shares of the Corporation.
CI Corporate Class Inception Date of A Shares Inception Date of F Shares Inception Date of I SharesCI American Equity Corporate Class February 24, 2000 July 17, 2000 –CI American Managers® Corporate Class July 17, 2000 July 17, 2000 August 31, 2001CI American Small Companies Corporate Class February 24, 2000 July 17, 2000 –CI American Value Corporate Class July 31, 2001 July 31, 2001 August 28, 2002CI Canadian Bond Corporate Class August 28, 2002 August 28, 2002 February 7, 2006CI Canadian Investment Corporate Class July 15, 2003 July 15, 2003 January 24, 2006CI Can-Am Small Cap Corporate Class November 28, 2005* November 28, 2005* November 28, 2005*CI Emerging Markets Corporate Class September 21, 1992 July 17, 2000 –CI European Corporate Class September 21, 1992 July 31, 2001 –CI Global Corporate Class July 8, 1987 July 8, 1987 February 17, 2006CI Global Biotechnology Corporate Class August 5, 1999 July 17, 2000 –CI Global Bond Corporate Class August 28, 2002 July 17, 2000 –CI Global Balanced Corporate Class June 11, 1998 July 17, 2000 July 31, 2001(Formerly CI Global Boomernomics® Corporate Class)CI Global Consumer Products Corporate Class April 11, 1997 July 17, 2000 July 31, 2001CI Global Energy Corporate Class June 11, 1998 July 31, 2001 –CI Global Financial Services Corporate Class July 23, 1996 July 17, 2000 July 31, 2001CI Global Health Sciences Corporate Class July 23, 1996 July 17, 2000 December 17, 2001CI Global Managers® Corporate Class February 24, 2000 July 17, 2000 July 31, 2001CI Global Small Companies Corporate Class February 24, 2000 July 17, 2000 –CI Global Science & Technology Corporate Class July 23, 1996 July 17, 2000 July 31, 2001CI Global Value Corporate Class July 23, 1996 July 17, 2000 August 11, 2006CI International Balanced Corporate Class July 31, 2001 December 17, 2001 –CI International Corporate Class July 31, 2001 July 31, 2001 –CI International Value Corporate Class July 23, 1996 July 31, 2001 September 27, 2006CI Japanese Corporate Class December 23, 1998 July 17, 2000 –CI Pacific Corporate Class July 8, 1987 July 17, 2000 –CI Short-Term Corporate Class July 8, 1987 July 17, 2000 November 7, 2005CI Short-Term US$ Corporate Class July 31, 2001 – –CI Value Trust Corporate Class December 31, 2001 December 31, 2001 December 31, 2001Harbour Corporate Class June 27, 1997 July 17, 2000 November 7, 2005Harbour Foreign Equity Corporate Class December 31, 2001 December 31, 2001 February 7, 2006Harbour Foreign Growth & Income Corporate Class December 23, 2002 December 23, 2002 –Harbour Growth & Income Corporate Class August 1, 2006 August 1, 2006 –Signature Canadian Resource Corporate Class July 31, 2001 July 31, 2001 –Signature Corporate Bond Corporate Class July 15, 2003 July 15, 2003 –Signature Select Canadian Corporate Class July 31, 2001 July 31, 2001 February 14, 2006Signature Dividend Corporate Class August 28, 2002 August 28, 2002 January 24, 2006Signature High Income Corporate Class August 28, 2002 August 28, 2002 January 24, 2006Signature Income & Growth Corporate Class March 30, 2005 March 30, 2005 March 30, 2005Synergy American Corporate Class September 21, 1992 July 17, 2000 –Synergy Canadian Corporate Class November 28, 2005* November 28, 2005* November 28, 2005*Synergy Canadian Style Management Corporate Class November 28, 2005* November 28, 2005* November 28, 2005*Synergy Global Corporate Class July 23, 2004 July 23, 2004 September 7, 2004Synergy Global Style Management Corporate Class July 23, 2004 July 23, 2004 –
Portfolio Select SeriesSelect Canadian Equity Managed Corporate Class November 7, 2005 November 7, 2005 July 5, 2006Select Income Managed Corporate Class November 7, 2005 November 7, 2005 June 8, 2006Select International Equity Managed Corporate Class November 7, 2005 November 7, 2005 June 8, 2006Select U.S. Equity Managed Corporate Class November 7, 2005 November 7, 2005 June 8, 2006
* Inception dates as a result of amalgamation and becoming a share class within CI Corporate Class Limited.
Notes to the Financial Statements - CI Corporate ClassAs at September 30, 2006 (unaudited)
Semi-Annual Report as at September 30, 2006 – 31 –
CI Value Trust Corporate Class offered class Y, Z and Insight shares to investors commencingon April 7, 2004.
Select Canadian Equity Managed Corporate Class, Select Income Managed Corporate Class,Select International Equity Managed Corporate Class and Select U.S. Equity ManagedCorporate Class offered Class W shares to investors commencing on November 7, 2005.
Synergy Canadian Corporate Class offered Insight shares to investors commencing onNovember 28, 2005.
The date of inception of each class of shares is shown above.
A Shares are available to all investors.F Shares are available to certain investors including those who participate in fee-based programsthrough their financial advisers or who are members of certain groups.I Shares are available to institutional clients and investors who have entered into a Class IAccount Agreement with CI Investments Inc. (formerly, CI Mutual Funds Inc.).Insight units are issued to investors of the Insight Program, for use in fee-based accounts.Class Y or Class Z units were issued to certain investors in connection with various mutual fundreorganizations and are generally only available for purchase by those investors.
Effective as of close of business on July 28, 2006, CI Explorer Corporate Class was mergedwith CI American Small Companies Corporate Class.
The purchase method of accounting has been adopted for the merger of the Funds. Under thismethod, one of the Funds in the merger is identified as the acquiring Fund, and is known as the“Continuing Fund”, and the other Fund involved in the merger is known as the “Terminated Fund”.
The merger was effected by transferring the net assets of the Terminated Fund in exchange forsecurities of the Continuing Fund. The value of the securities of the Continuing Fund issued inconnection with the merger was equal to the market value of the net assets transferred fromthe Terminated Fund.
The Terminated Fund is not included in these financial statements.
The Statements of Investment Portfolios for each of the Funds are as at September 30, 2006and the Statements of Net Assets are as at September 30, 2006 and March 31, 2006. TheStatements of Operations, Changes in Net Assets and Schedule of Fund Share Transactions foreach Fund are for the period from April 1, 2006 to September 30, 2006 and April 1, 2005 toSeptember 30, 2005, except for funds established during either period, in which case theinformation provided for the period of inception relates to the period from inception toSeptember 30, 2006 or 2005.
2. SIGNIFICANT ACCOUNTING POLICIESThe following is a summary of significant accounting policies of the Corporation and the Fundswhich are a class of shares of the Corporation:
(a) Valuation of InvestmentsListed securities are valued on each business day at their latest available sale price. In theabsence of recorded sales on that day, they are valued at the average of the last recordedbid and ask prices where appropriate. Unlisted securities are valued on each business daybased on price quotations from recognized investment dealers, or failing that, management’sbest estimate of fair value. Short-term fixed income securities are valued at cost which,together with accrued interest, approximates market value. Mutual funds are valued oneach business day at their closing net asset value.
(b) Foreign ExchangeForeign currency amounts are translated into Canadian dollars as follows: market value ofinvestments, forward currency contracts, other assets and liabilities at the closing rate ofexchange on each business day; income, expenses and purchases, sales and settlementsof investments at the rate of exchange prevailing on the respective dates of such transactions.
(c) Investment Transactions and Income RecognitionInvestment transactions are accounted for on the trade date for financial reportingpurposes and any realized gains and losses from such transactions are calculated on anaverage cost basis. Dividend income and dividends from investments are recognized on theex-dividend/ex-distribution date and interest income on the accrual basis.
Dividends received from investment trust holdings are recorded as income, capital gains ora return of capital, based on the best information available to the Manager. Due to thenature of these investments, actual allocations could vary from this information. Dividendsfrom investment trusts that are treated as a return of capital for income tax purposesreduce the average cost of the underlying investment trust on the Statement ofInvestments.
Dividends received from investment fund holdings are recognized by the funds in the sameform in which they were received from the underlying funds.
(d) Net Asset Value Per ShareNet asset value per share of each class is calculated at the end of each day on which theToronto Stock Exchange is open for business by dividing the net assets of eachclass of the Fund by the number of shares of that class outstanding.
The net asset value of each class is computed by calculating the value of that class’sproportionate share of the Fund’s assets less that class’s proportionate share of the Fund’scommon liabilities and less class specific liabilities. Expenses directly attributable to a classare charged to that class. Other income and expenses are allocated to each classproportionately based upon the relative net asset value of each class.
(e) Futures, Forward, Option and Swap ContractsFutures, forward, option and swap contracts are marked-to-market on each valuation dayaccording to the gain or loss that would be realized if the contracts were closed out. Allgains or losses arising from futures, forward, option and swap contracts are recorded asunrealized appreciation/depreciation of investments until the contracts are closed out orexpire, at which time the gains (losses) are realized.
(f) Short SellingThe value of any short sale is determined by calculating the daily marked-to-market gainor loss on the short sale. The cash proceeds of a short sale will be recorded as a deferreddebit. The market value of the securities sold short will be recorded as a deferred credit.The gain or loss will be calculated by subtracting (i) the sum of the market value of thesecurities sold short plus any recorded costs of borrowing, from (ii) the sum of the cashproceeds of the short sale plus any recorded interest earned on the cash proceeds.
(g) Increase (Decrease) in Net Assets from Operations per ShareIncrease (decrease) in net assets from operations per share in the Statements ofOperations is calculated by dividing the increase (decrease) in net assets from operationsof the Fund by the weighted average number of shares outstanding during the period.
Notes to the Financial Statements - CI Corporate Class
Semi-Annual Report as at September 30, 2006 – 32 –
(h) Use of EstimatesThe preparation of financial statements in accordance with Canadian generally acceptedaccounting principles requires management to make estimates and assumptions thataffect the reported amounts of assets and liabilities at the reporting date and the reportedamounts of income and expenses during the reporting period. Actual results could differfrom those estimates.
(i) AcG-15 Variable Interest EntitiesThe Funds have adopted the provisions of Accounting Guideline 15, which requires a fund todisclose its investment in an underlying fund when it is the primary beneficiary of that fund.
In accordance with their investment policy, certain funds may invest in units of anotherinvestment fund. Funds that own more than 50% of the units of an underlying investmentfund are deemed to be primary beneficiaries of that investment fund.
The Funds have no significant investments in underlying investment funds.
(j) ComparativesCertain prior period amounts have been reclassified to conform to the current period’sfinancial statement presentation.
3. INCOME TAXESThe Corporation complies with the requirements of the Income Tax Act (Canada) to qualify asa mutual fund corporation. A mutual fund corporation is subject to a special 33 1/3% tax ontaxable dividends received from corporations resident in Canada and to tax at normal corporaterates on other income and net taxable realized capital gains for the year. The special 33 1/3%tax is refundable on payments of taxable dividends to shareholders at the rate of $1 for each$3 of such dividend paid. All the tax on net taxable realized capital gains is refundable whenthe gains are distributed to shareholders as capital gains dividends or through redemption ofshares at the request of shareholders, while the Corporation qualifies as a mutual fund corporation. Income and capital taxes (if any) are allocated to the class on a reasonable basis.
Temporary differences between the carrying value of assets and liabilities for accounting andincome tax purposes give rise to future income tax assets and liabilities. When the marketvalue of a security in the Corporation exceeds its cost base, a future income tax liability arises. As capital gains taxes payable by the Corporation are refundable under the provisionsof the Income Tax Act (Canada), the future tax liability is offset by these future refundabletaxes. If the cost base exceeds the market value of the security, a future income tax asset isgenerated. A full valuation allowance is taken to offset this asset given the uncertainty thatsuch future assets will ultimately be realized. Unused capital and non-capital losses, asdisclosed below, represent future tax assets to the Corporation for which a full valuationallowance has been established for the reasons noted above.
4. MANAGEMENT FEES AND OTHER EXPENSESCI Investments Inc. is the Manager of the Corporation. The Manager is entitled to receive a feecalculated on the net assets, excluding mutual fund investments, at the end of each business day.
Prior to September 2005, each Fund was responsible for all operating and administrativeexpenses including audit and legal fees, directors’ fees, registry and transfer agency fees,custody fees, expenses relating to reporting and making dividends to shareholders, all other costsand fees imposed by statute or regulation and expenses of all communication with shareholders.
Effective September 2005, the Manager bears all of the operating expenses of the Funds (otherthan certain taxes, borrowing costs and new governmental fees) in return for fixed annualadministration fees (the “Administration Fees”).
Each Administration Fee is calculated as a fixed annual percentage of the net asset value ofeach class of the Fund at the end of each business day and is paid daily.
Administration Fees (%)Fund Names CI American Equity Corporate Class 0.21CI American Managers® Corporate Class 0.21CI American Small Companies Corporate Class 0.21CI American Value Corporate Class 0.21CI Canadian Bond Corporate Class 0.17CI Canadian Investment Corporate Class 0.20CI Can-Am Small Cap Corporate Class 0.20CI Emerging Markets Corporate Class 0.22CI European Corporate Class 0.22CI Global Corporate Class 0.22CI Global Biotechnology Corporate Class 0.22CI Global Bond Corporate Class 0.18CI Global Balanced Corporate Class 0.22(Formerly CI Global Boomernomics® Corporate Class)CI Global Consumer Products Corporate Class 0.22CI Global Energy Corporate Class 0.22CI Global Financial Services Corporate Class 0.22CI Global Health Sciences Corporate Class 0.22CI Global Managers® Corporate Class 0.22CI Global Small Companies Corporate Class 0.22CI Global Science & Technology Corporate Class 0.22CI Global Value Corporate Class 0.22CI International Balanced Corporate Class 0.22CI International Corporate Class 0.22CI International Value Corporate Class 0.22CI Japanese Corporate Class 0.22CI Pacific Corporate Class 0.22CI Short-Term Corporate Class nilCI Short-Term US$ Corporate Class nilCI Value Trust Corporate Class 0.21Select Income Managed Corporate Class 0.17Select Canadian Equity Managed Corporate Class 0.20Select U.S. Equity Managed Corporate Class 0.21Select International Equity Managed Corporate Class 0.22Harbour Corporate Class 0.20Harbour Foreign Equity Corporate Class 0.22Harbour Foreign Growth & Income Corporate Class 0.22Harbour Growth & Income Corporate Class 0.20Signature Canadian Resource Corporate Class 0.20Signature Corporate Bond Corporate Class 0.20Signature Select Canadian Corporate Class 0.20Signature Dividend Corporate Class 0.20Signature High Income Corporate Class 0.20Signature Income & Growth Corporate Class 0.20Synergy American Corporate Class 0.21Synergy Canadian Corporate Class 0.20Synergy Canadian Style Management Corporate Class 0.20Synergy Global Corporate Class 0.22Synergy Global Style Management Corporate Class 0.22
Notes to the Financial Statements - CI Corporate Class
Semi-Annual Report as at September 30, 2006 – 33 –
Notes to the Financial Statements - CI Corporate Class
Semi-Annual Report as at September 30, 2006
5. SECURITIES LENDINGCertain Funds have entered into a securities lending program with their custodian, RBC DexiaInvestor Services Trust ("RBC Dexia"). The aggregate market value of all securities loaned by aFund cannot exceed 50% of the assets of the Fund. A Fund will receive collateral of at least102% of the value of securities on loan. Collateral will generally be comprised of cash andobligations of or guaranteed by the Government of Canada or a province thereof, or by theUnited States government or its agencies, but may include obligations of other governmentswith appropriate credit ratings. RBC Dexia has indemnified the Funds against the credit risk ofthe borrowers. For those Funds participating in the program, amounts for securities loaned, thecollateral received, and the income collected appear on the fund specific schedules in thefinancial statements and income from securities lending is included in "Securities lending" inthe Statements of Operations.
6. REINVESTMENT OF DIVIDENDSWhen a Fund pays a dividend to a shareholder, it will be paid in the same currency in which theshares are held. Dividends are automatically reinvested without charge in the same Fund. TheManager may change the dividend policy at its discretion. Further information regardingreinvestment of dividends can be found in the Fund’s Simplified Prospectus.
7. SHORT SELLING RISKThere is no assurance that securities will decline in value during the period of the short salesufficient to offset the interest paid by the mutual fund and make a profit for the mutual fund,and securities sold short may instead increase in value. The mutual fund may also experiencedifficulties repurchasing and returning the borrowed securities if a liquid market for thesecurities does not exist. The lender from whom the mutual fund has borrowed securities maygo bankrupt and the mutual fund may lose the collateral it has deposited with the lender.
8 . RELATED PARTY TRANSACTIONSSun Life Financial Inc. (“Sun Life”) owns a significant interest in CI Financial Income Fund, theparent company of the Manager, and is therefore considered a related party to the Funds. Sun Life does not hold investments in the Funds.
– 34 –
The CI Funds Board of Governors was voluntarily established by CI in 1998 making it one of the
first such fund governance bodies in Canada.
The Board of Governors acts as an independent governance body of all CI Funds, providing
impartial judgment on conflicts of interest with a view to the best interests of the CI Funds and
CI Funds investors. The Board of Governors recommends the best course of action to achieve
a fair and reasonable result on any conflict of interest issues, and CI takes into account its
recommendation in accordance with its fiduciary duty to the CI Funds. All of the members of
the Board are independent of CI.
The Board of Governors mandate is set out in a separate charter and reviewed annually by
the Board to ensure its mandate conforms to the expectations and requirements of Canadian
securities regulators. Along with dealing with conflicts of interest, the mandate provides that
the Board acts as an audit committee for the CI Funds for the purpose of reviewing the financial
statements of the CI Funds with the auditors of the CI Funds and reviews holdings, purchases
and sales by the CI Funds of securities of Sun Life Financial Inc. and CI Financial Income Fund.
The Board also reviews and discusses on a regular basis matters including compliance of the
CI Funds with CI’s relevant policies and procedures, approval of the CI Funds’ auditors and the
fees paid to those auditors, and the performance of the Board and its members.
The Board of Governors adheres to the guidelines set out by Canadian securities regulators in
National Instrument 81-107 Independent Review Committee for Investment Funds which will
require all mutual funds in Canada to have independent review committees.
The Board of Governors are compensated as recommended by the Canadian securities regulators
in their rule and as set out in its mandate. These expenses are paid by CI and charged to the
CI Funds as part of their fixed administration fee.
The members of the Board of Governors are:
William Harding, Managing Partner, Alpine Asset Advisors AG
Governor since June 2005
Stuart P. Hensman, Corporate Director
Governor since December 2004
Stephen T. Moore, Managing Director, Newhaven Asset Management Inc.
Governor since September 2001
Sharon M. Ranson, President, The Ranson Group
Governor since December 2004
Further information regarding the Board is available at www.ci.com including the Board’s
full mandate.
About the CI Funds Board of Governors
Your CI Funds Board of Governors is pleased to report on its activities in respect of the period
ended March 31, 2006 and September 30, 2006 and to date. The Governors are appointed
pursuant to the Declarations of Trust governing the CI Funds that are trusts, and constitute the
board of directors of CI Corporate Class Limited.
The Governors have reviewed, commented on and approved the CI Code of Ethics and Conduct,
which establishes rules of conduct designed to ensure fair treatment of the CI Funds’
securityholders and that, at all times, the interests of the CI Funds and their securityholders are
placed above personal interests of employees, officers and directors of the Manager and each
of its subsidiaries and affiliates, the subadvisers, and the Governors, through the application
of the highest standards of integrity and ethical business conduct. The CI Code of Ethics and
Conduct requires the prior clearance of personal trades and restricts the ability of staff to trade
any securities held by the CI Funds. The objective is not only to remove any potential for real
conflict of interest but to avoid any perception of conflict. The Manager's year 2005 report on
compliance with the CI Code of Ethics and Conduct and other relevant policies has been
provided to the Governors in a timely and satisfactory manner.
The Governors report that management has been open and cooperative, permitting the Governors
to meet with subadvisers, to meet with individual department heads and personnel to review
control mechanisms and compliance procedures, including those relating to the personal securities
trading activity of employees, and to consider other matters that affect the CI Funds. During
the period ended March 31, 2006, the Governors also acted as the audit committee of the
CI Funds. The audit committee reviewed, with the CI Funds’ auditors, the planning, scope and
results of the audit of the financial statements of the CI Funds for the period ended March 31,
2006. In June 2006, the Board of Governors received and accepted the Annual Reports of the
CI Funds for the period ended March 31, 2006.
Stephen T. Moore
Chair, CI Funds Board of Governors
November 1, 2006
Letter from the CI Funds Board of Governors
Semi-Annual Report as at September 30, 2006 – 35 –
Notice: Should you require additional copies of this Semi-Annual Report or have received more than
one copy, please contact CI Investments Inc. (the “Manager”) or your financial advisor.
Commissions, trailing commissions, management fees and expenses all maybe associated with mutual
fund investments. Please read the prospectus before investing. Unless otherwise indicated and
except for returns for periods less than one year, the indicated rates of return are the historical annual
compounded total returns including changes in security value. All performance data assume
reinvestment of all distributions or dividends and do not take into account sales, redemption, distribution
or optional charges or income taxes payable by any securityholder that would have reduced returns.
Mutual funds are not guaranteed, their values change frequently and past performance may not be
repeated. Mutual fund securities are not covered by the Canada Deposit Insurance Corporation or by
any other government deposit insurer.
The commentaries contained herein are provided as a general source of information and should not be
considered personal investment advice or an offer or solicitation to buy or sell securities. Every effort
has been made to ensure that the material contained in these commentaries is accurate at the time
of publication. However, the Manager cannot guarantee its accuracy or completeness and accepts no
responsibility for any loss arising from any use of or reliance on the information contained herein.
Simplified Prospectus: The Simplified Prospectus and Annual Information Form of a Fund are renewed
annually. The Manager would be pleased to provide, without charge, the most recent Simplified
Prospectus upon request to its Toronto office.
Distribution or Dividend Reinvestment: Distributions or dividends from the Funds are
automatically reinvested, free of any sales commissions or charges, in additional securities of the
relevant Fund, unless you otherwise direct. You may withdraw from participation in the reinvestment
plan at any time by delivering a written request to your financial advisor or to the Manager.
Redemption of Securities: Securities may be redeemed by securityholders on any business day by
delivering to your financial advisor or the Manager a redemption request in writing, or in such other
form as permitted by your financial advisor. If your redemption request is received by the Manager on
any valuation date prior to 4:00 p.m. (Eastern time), then your securities being redeemed will be
priced at the next valuation time following receipt by the Manager of the redemption request. If the
proceeds of redemption exceed $10,000 or are to be paid to someone other than the registered owner,
your signature must be guaranteed by a bank, trust company, investment dealer, or broker. If certificates
representing the securities to be redeemed have been issued, the redemption request must be
accompanied by the certificates, properly endorsed for redemption with the signature guaranteed in
the manner described above. If the registered owner is a corporation, partnership, agent, fiduciary or
surviving joint owner, additional documentation may be required.
®CI Funds, CI Investments, Harbour Funds, Global Managers and American Managers are registered
trademarks of CI Investments Inc. ™The CI Investments design, Portfolio Select Series and Signature Funds are trademarks of CI
Investments Inc.
Legal Notice
Semi-Annual Report as at September 30, 2006 – 36 –

PSS_
SA_1
1/06
E
Head Office2 Queen Street East, Twentieth FloorToronto, Ontario M5C 3G7Tel: 416-364-1145Toll Free: 1-800-268-9374English Client Services Team: 1-800-563-5181French Client Services Team: 1-800-668-3528
Sales OfficesCalgary Tel: 403-205-4396 Toll Free: 1-800-776-9027Halifax Tel: 902-422-2444 Toll Free: 1-888-246-8887Montreal Tel: 514-875-0090 Toll Free: 1-800-268-1602Vancouver Tel: 604-681-3346 Toll Free: 1-800-665-6994CI Teleservice: 1-800-275-3672 Automated account informationE-mail: [email protected] • www.ci.com