2008 annual report - datatec | home datatec annual report 2008 ebitda > scope > global market...
TRANSCRIPT

2008 annual report
Datatec
Limited
2008annualreport

1
Datatec Annual Report 2008
Highlights
Financial highlights
2008US$’000
2007US$’000
Financial results
Revenue 4 007 932 3 167 772
Distributable earnings 80 036 62 152
Total assets 1 884 319 1 391 234
Net (debt)/cash (31 936) 98 014
Share performance on the JSE
Operational highlights
> Major acquisitions transform Westcon’s European business and diversify product mix
> Significant second half turnaround in the performance of Logicalis US
> Creation of South American market leader with completion of US$77,2 million merger for Logicalis
Revenue up 27%
$4,0 billion(2007: US$3,2 billion)
Underlying* earnings per share up 21%
47,3 US cents(2007: 39,2 US cents)
Gross margin
13,7%(2007: 13,1%)
Cash distribution to shareholders up 20%
12 US cents(2007: 10 US cents)
Operating profit up 25%
$123,6 million(2007: US$99,1 million)
* excluding goodwill impairment, amortisation of acquired intangible fixed assets, profits or loss on sale of assets and businesses and unrealised foreign exchange movements on inter-company loans.
DATATEC VS SOFTWARE AND COMPUTER SERVICES SECTOR > Monthly 01/02/2003 – 30/05/2008 based on a starting index of 100
900
800
700
600
500
400
300
200
100
02003
— DTC — JSE Software and computer services
2004 2005 2006 2007 2008

Datatec Annual Report 2008
2
United Kingdom Europe Middle East and North Africa
Our Group in brief
Europe Asia-Pacific Americas
46%
45%
9%
1%
49%42%
8%
8%
41%
26%
18%
2%5%
52%20%
28%
Analysys Mason is the world’s premier adviser in telecoms, IT and media. Through their global presence, they deliver strategy advice, operations support and market intelligence consulting services to leading commercial and public-sector organisations in over 80 countries.For more than 20 years, their intellectual rigour, operational experience and insight have helped their clients resolve issues ranging from development of operator strategy, evolution of national sector regulation and execution of major financial transactions, to the deployment of public and private network infrastructure. Analysys Mason consistently delivers significant and sustainable business benefits.The company has over 250 staff worldwide, with headquarters in London and offices in Cambridge, Dubai, Dublin, Edinburgh, Madrid, Manchester, Milan, Paris, Singapore and Washington DC. Analysys Mason represents 2% of the Group’s revenue and 5% of the Group’s EBITDA.
Westcon SA and Online Distribution are value-added networking distributors in South Africa and the Middle East, respectively, whose operations mirror those of the Westcon Group. African Legend Indigo is a provider of Enterprise Management Solutions, infrastructure solutions and professional services to the telecommunication industry, financial services and the public and private sectors in South Africa and the African continent. Comstor Middle East is a speciality distributor of Cisco-focused advanced technology solutions. Collectively these operations represent 6% of the Group’s revenue and 4% of the Group’s EBITDA.
Logicalis is an international provider of integrated ICT solutions, delivering secure, converged computing and communications infrastructure solutions and services, which sources its products from OEMs and distributors. They provide an end-to-end ICT delivery capability for organisations’ work and social tools, their data centre and business integration, supported with a full suite of professional services, maintenance and managed services.Logicalis, headquartered in Slough, UK and with operations in nine countries in North America, South America and Europe and over 1 300 employees, provides the architecture, deployment, integration and management of networks and systems to deliver solutions for over 6 500 corporate and public sector customers. Logicalis’ customers include mid-market and large enterprise end-users, as well as telcos and service providers. Logicalis represents 21% of the Group’s revenue and 24% of the Group’s EBITDA. North America
South America United Kingdom Germany
South Africa Middle East and North Africa Sub-Saharan Africa
REVENUE BY REGION >
Westcon Group, Inc.™ is the world’s leading speciality distributor of networking, security, mobility and convergence products for leading technology vendors with particular expertise in the convergence of voice, data and video applications and technologies, including voice-over Internet Protocol (VoIP) security for networking and communications systems, videoconferencing and wireless connectivity. The Company’s customers consist of value-added resellers, systems integrators and service providers that resell networking products and solutions to small- and medium-sized businesses, enterprise organisations and governments around the world.Westcon’s primary vendor partners are Cisco, Nortel, Avaya, Juniper and Polycom, in addition to a host of other complementary vendors. Westcon, headquartered in New York, US and with operations in 18 countries, and approximately 1 650 employees, adds value to its distribution activities by providing resources such as dedicated solutions programmes, technical expertise, sales and product training, engineering support and professional services. Among the solutions Westcon Group provides is the design and configuration of convergence and mobility networks, network extensions such as videoconferencing, network storage, unified messaging and network security. Westcon represents 71% of the Group’s revenue and 68% of the Group’s EBITDA.
OVERVIEW >
Other emerging market holdings (Africa & Middle East)
WEB INFO >
www.datatec-group.com
www.westcongroup.com
www.datatec-group.com
www.logicalis.com
www.datatec-group.com
www.analysysmason.com
www.datatec-group.com
www.westconsa.co.za
www.wame.co.za
www.online-dubai.com
www.alindigo.com
www.me.comstor.com
Asia USA Rest of world

3
Datatec Annual Report 2008
GLOBAL MARKET PENETRATION > EBITDA > SCOPE >
1 647 employees
Operations in 18 countries
1 388 employees
Operations in 9 countries
254 employees
Operations in 9 countries
476 employees
Operations in 13 countries
120
110
100
90
80
70
60
50
40
30
20
10
0
83
102
US$’millions
07 08
50
45
40
35
30
25
20
15
10
5
0
27
36
US$’millions
07 08
8
7
6
5
4
3
2
1
0
6
7
US$’millions
07 08
7
6
5
4
3
2
1
0
4
6
US$’millions
07 08

Datatec Annual Report 2008
4
Datatec offers shareholders an opportunity to invest in a leading international ICT Group that is uniquely positioned to take advantage of advances in networking, information security and convergence technologies. The spread of business activities across distribution, ICT Solutions, consulting and services provides the Group with multiple points of entry to the global market, and acts as a defensive hedge against the decline of any one vendor, geography or technology in a fast-consolidating and dynamic market. The Group has a strong operational management team, with considerable experience in the international ICT industry, and a successful track record of delivering organic and acquisition-led growth.
5 000
4 500
4 000
3 500
3 000
2 500
2 000
1 500
1 000
500
0
1 7642 032
2 299
2 715
3 168
4 008
US$’millions
03 04 05 06 07 08
REVENUE (ONGOING OPERATIONS) >
18
16
14
12
10
8
6
4
2
0
– 2
(1,4) 0,3
2,3
13,5
16,315,9
%
03 04 05 06 07 08
RETURN ON CAPITAL EMPLOYED >
40
35
30
25
20
15
10
5
0
– 5
– 10
–15
1 (10) (5)3
3436
US$’000
03 04 05 06 07 08
OPERATING PROFIT PER EMPLOYEE >
50
45
40
35
30
25
20
15
10
5
0
– 5
– 10
(7) (7)
4
27
41
46US cents
03 04 05 06 07 08
HEADLINE EARNINGS/(LOSS) PER SHARE >
200
180
160
140
120
100
80
60
40
20
0
18 2028
85
119
151
US$’millions
03 04 05 06 07 08
EBITDA (ONGOING OPERATIONS) >
4,0
3,5
3,0
2,5
2,0
1,5
1,0
0,5
0
1,01,1 1,1
3,1
3,8 3,8%
03 04 05 06 07 08
EBITDAMARGIN >
Investment case

5
Datatec Annual Report 2008
Business streams
StrategyThe Group’s strategy is to deliver long-term, sustainable, above-average returns to shareholders through the development of its three principal operating divisions Westcon, Logicalis and Analysys Mason. These divisions are run as sector-focused standalone businesses to facilitate enhanced operational and financial performance as well as to react faster to technology change. The key elements of the Group’s strategy include:
and global presence.
the Group’s principal business streams. The spread of activities across these business streams not only provides the
no particular vendor, technology, geography or industry sector dependency.
Our business philosophyOur business philosophy has its roots in an entrepreneurial culture. We strive to be ethical, honest, socially responsible and acceptable corporate citizens to all our stakeholders and to be an employer-of-choice attracting, developing and retaining talented people. We value business partnerships and we work towards creating shareholder value by developing a best-in-class portfolio of actively managed businesses operating in the high-value, fast-growing sectors of
Distribution ICT Solutions
Consulting & Services
6% – US$258 million
76% – US$3 029 million
18% – US$721 million
Revenue
58% – US$317 million
Gross profit
17% – US$95 million
25% – US$135 million

Datatec Annual Report 2008
6 Our history and vendor brands
1986
Datatec was founded in 1986 as a distributor of networking access
and communications solutions. The Group comprised two separate
business divisions: Datatec Networking and Communications
and POStec. Jens Montanana was the founder and chief architect
behind Datatec.
Datatec successfully listed on the Johannesburg Stock Exchange and raised R9 million by way of an initial public offering. The listing placed the group in a strong position to take advantage of the expanding data communications and networking market. Revenues and profits grew significantly in the first reporting period. A third business division called PIPEX SA was formed in the same year.
1995
1996
UUNET Internet Africa was established as a joint venture between Datatec and UUNET
Technologies offering extensive national and international
access to the Internet as well as specialised design and
support services.
>
The Group celebrated its 20th anniversary and reported record revenue figures. Datatec declared a maiden distribution of 5 US cents a share.
2006
2007
The Group made a successful debut on AIM in London in
October 2006 and since admission has become the largest
technology stock on the AIM market. Datatec concluded its BEE
transaction with African Legend Technologies. Logicalis made a
further three acquisitions, Alliance Consulting, Computech Resources
and CSF Solutions. Westcon Group became the world’s largest
distributor of Nortel products by adding the distribution operations
of Ronco in the US.
> 2008
Westcon completes four acquisitions NOXS, Crane, ReView Video
and Cernet which opens up new opportunities in convergence,
security and mobility in Europe, the US and Latin America. Westcon
Africa Middle East acquires 51% stake in Sparnoon-Dynatech
expanding its African footprint to seven African countries. Logicalis
US acquires Carotek, a leading HP enterprise systems partner. Logicalis
is awarded a US$150 million contract to operate public sector
broadband aggregation service for the Welsh Assembly.

7
Datatec Annual Report 2008
>
International expansion - Datatec UK was established as a focused Internet technology and networking solutions value-added distributor in the wake of the acquisition of a number of distribution businesses in the UK. The acquisition of Logical Networks enabled the Group to provide the full scope of network integration services to blue chip companies in the UK and Europe.
1997
1998
The acquisition of US distributor Westcon Inc. saw the consolidation of Datatec’s distribution businesses
on five continents under the Westcon brand. The Group
successfully achieved the transition from a regional player to a truly
international operation.
The acquisition of the Manchester-based Mason Communications, a strategic telecommunications consultancy, saw the Group fulfil its strategy of providing networking-based products and services to organisations across the full spectrum of the IT supply chain.
1999
2001
Datatec sold its 76% stake in UUNET SA to WorldCom for over US$140 million. The Group made significant advances in its strategy
to divest and realign those South African investments and businesses
that were no longer core or synergistic in nature.
Logicalis sold its Australian and New Zealand operations to IBM Global Services for US$66 million. The sale came after an unsolicited offer from IBM.
2004
2005
Logicalis made three strategic acquisitions, all aimed at enhancing
the company’s position as a strategic IBM partner in the US and UK.
Analysys Mason was formed out of the merger of the Mason Group and Analysys Consulting and Research,
expanding the Group’s global footprint and positioning it to take
advantage of the burgeoning growth in mobile telephony.
>

Datatec Annual Report 2008
8
for the year ended 29 February 2008
2008 2007 2006 2005 2004 2003
In US Dollars (US$’000)Revenue 4 007 932 3 167 772 2 714 751 2 312 458 2 155 663 1 891 387
3 623 024 3 075 344 2 609 497 2 213 636 2 031 952 1 660 202 384 908 92 428 105 254 85 628 – 103 467
Discontinued operations – – – 13 194 123 711 127 718 Operating profit before finance costs, depreciation and amortisation
150 816 119 356 85 151 24 363 23 788 18 250 Operating profit/(loss) before goodwill adjustment/impairment 124 010 100 284 69 394 9 964 1 061 (5 356)
Westcon 86 588 72 504 56 861 15 420 23 781 20 908 Logicalis 26 140 18 783 11 546 6 081 (6 811) (7 390)Analysys Mason 6 239 5 752 5 835 3 007 (1 400) 2 057 Other Holdings (1 636) (5 916) (5 743) (4 686) (8 124) (4 747)
(loss) 6 559 9 161 895 (5 602) (6 727) (10 730)Discontinued operations – – – (4 256) 342 (5 454)
Operating profit/(loss) 123 590 99 142 68 969 6 649 (13 219) (31 774) 108 282 89 433 63 795 53 525 (20 522) (29 080) 80 036 62 152 39 187 51 864 (26 383) (31 683)
Attributable profit/(loss) 75 654 60 049 37 772 51 757 (26 612) (31 513)Headline earnings/(loss) 75 910 61 226 38 293 4 958 (9 213) (9 842)
(16 775) (6 589) – – – –
Non-current assets 421 074 242 096 189 959 138 608 118 028 144 326 1 463 245 1 149 138 951 613 841 778 860 956 747 351
the parent 654 707 537 744 448 846 412 227 344 283 337 886 Minorities’ interest 23 576 14 852 12 505 24 089 19 276 18 782 Non-current liabilities 99 317 65 518 50 880 3 950 7 643 23 682
1 106 719 773 120 629 341 540 120 607 782 511 327
Net cash inflow/(outflow) from operating activities 32 298 (3 626) 52 207 19 539 (31 948) 124 701 Net cash (outflow)/inflow from investing activities (208 384) (60 334) (54 382) 24 469 (3 365) (32 594)Net cash inflow/(outflow) from financing activities 53 799 24 896 40 740 1 067 (12 213) 2 274
34 179 141 392 172 251 140 270 88 703 115 604
borrowings (31 936) 98 783 129 356 138 820 85 047 101 428
Headline earnings/(loss) per share 46 41 27 4 (7) (7)Basic earnings/(loss) per share 45 40 27 37 (19) (23)Net tangible asset value per share 177 220 207 228 203 195
Six-year review

9
Datatec Annual Report 2008
2008 2007 2006 2005 2004 2003
Summary of statistics
RatiosReturn on total assets 6,6% 7,2% 6,1% 1,0% 0,1% (0,6%)Return on capital employed 15,9% 16,3% 13,5% 2,3% 0,3% (1,4%)Return on ordinary shareholders’ funds 16,6% 16,9% 14,3% 1,5% (1,0%) (2,2%)
0,15:1 0,12:1 0,11:1 0,01:1 0,02:1 0,07:1 1,3:1 1,5:1 1,5:1 1,6:1 1,4:1 1,5:13,8% 3,8% 3,1% 1,1% 1,1% 1,0%
Operating profit margin 3,1% 3,2% 2,6% 0,6% 0,0% (0,3%) 4,6 5,2 6,0 1,6 0,1 –
6,1 4,6 3,4 1,4 5,8 9,2
Stock exchange performance (JSE + AIM)Total number of shares traded (‘000) 154 763 94 326 74 667 54 950 58 790 90 719 Total number of shares traded as a percentage of total shares 91,5% 60,7% 51,0% 39,7% 42,6% 65,9%Total value of shares traded (R’million) 5 626 2 725 1 202 477 484 1 027
Prices (cents) 3 200 3 360 2 200 959 1 480 500
High 4 495 3 675 2 350 1 515 1 750 1 850 Low 2 500 2 125 867 840 370 470 Market capitalisation (R’million) 5 415 5 208 3 220 1 328 2 042 689 P:E ratio 10 17 22 20 (17) 4
Shares issued 169 155 146 138 138 138
Weighted average (million) 166 150 142 138 138 138
EmployeesNumber of employees at end of year 3 765 3 084 2 440 2 232 2 389 3 202 Average number of employees 3 425 2 954 2 336 2 311 2 796 3 113 Operating profit per employee (US$’000) 36 34 30 3 (5) (10) Gross assets per employee (US$’000) 500 451 468 439 410 278
Exchange ratesRand/US$ income statement translation rate 7,1 7,0 6,4 6,2 7,2 9,7 Rand/US$ balance sheet translation rate 7,7 7,2 6,2 5,8 6,6 8,1 Notes:2003 represents an 11 month period for all Group companies other than Westcon, which is included for a 12-month period.Revenue in years 2003 to 2006 has been restated to consider the effect of the change in accounting for the sale of vendor maintenance contracts.Net tangible asset value per share is calculated on net asset value exclusive of intangible assets and capitalised development costs and the number of shares in issue at the end of the financial period.2005 and 2004 numbers have been restated in accordance with IFRS. Years prior to 2004 are presented under the previously applicable SA GAAP.Detailed segmental information is set out in Note 33 of the annual financial statements on pages 130 to 133.Return on total assets is calculated utilising operating profit.Return on capital employed is calculated utilising profit before goodwill adjustment/impairment and total shareholders’ funds and non-current liabilities.Return on ordinary shareholders’ funds is calculated utilising profit before goodwill adjustment/impairment and after net finance costs.Debt includes all long-term liabilities including amounts due to vendors of a long-term nature.The SA Consumer Price Index is sourced from The Standard Bank of South Africa Limited.

Datatec Annual Report 2008
10

11
Datatec Annual Report 2008

Datatec Annual Report 2008
12 Chairman’s statement
Stephen Davidson
OBITUARY LESLIE BOYD >Leslie became Chairman of Datatec in December 2001 and made an invaluable contribution to the Group as Chairman of the Board at an important stage of the Group’s development. He will be fondly remembered and we all owe him a debt of gratitude for his wise stewardship over the last six years.
delighted to report continued
success in the growth and
development of our business, the
satisfaction my colleagues and
the untimely death of our previous
on 28 March 2008 after a short
13
Datatec Annual Report 2008
strong performance for the Group with further increases in revenues and earnings, and significant progress reported across all areas of the business. As a result of
our revenue target of US$4 billion (up by 27%) over the prior year. Despite a slowdown in the US, the pre-emptive steps we took during the middle of last year, coupled with tight operating cost controls and improving productivity, have underpinned our solid progress. Profits grew at all levels of the income statement and gross margins increased in all divisions.
The Group continues to benefit from its international reach, geographic diversity and sector focus on
solutions and services to multinational corporate customers, integrators, service providers and business users around the world. We believe we are well-attuned to improving our business through a combination of
model has proved to be relatively defensive in more difficult market conditions. Significantly, over half of our business is now derived from outside the US.
During the year, the Group completed a number of
position, geographic reach and enhanced our operational leverage around the world. Our increased scale and broader international reach, together with our comprehensive solutions and services, have helped the
developing economies.
By virtue of this strong market position, the Group has been able to take advantage of favourable market conditions in most regions and markets. Whilst trading conditions remain subdued in the US, as yet there appears to have been little impact on demand in the rest of the world. Europe, South America, Asia-Pacific and, in particular, emerging markets have continued
weakening US Dollar has helped to underpin the broad-based global demand for technology products (which are mostly priced in US dollars) and the lower growth conditions in the US have been largely offset by stronger growth elsewhere.
The US and European operations continued to account for a large proportion of the Group’s revenues and profits but, as planned, the higher growth emerging market operations are now contributing an ever increasing proportion of the Group’s business. Now 58% of the Group’s revenues are derived from outside North
US for the first time. This is as a result of faster organic
For the year as a whole 42% of revenues were generated from North America, 43% from Europe, 6% from Asia-Pacific, 6% from the Middle East and Africa and 3% from South America.
“During the year, the Group completed a number of acquisitions which have improved its competitive position, geographic reach and enhanced our operational leverage around the world. Our increased scale and broader international reach, together with our comprehensive solutions and services, have helped the Group to expand into high-growth emerging markets and developing economies.”

Datatec Annual Report 2008
14
The growth in South American operations is particularly notable. We firmly believe that this continent represents a major growth market for advanced technology products
to have a significant impact on our business in the year ahead.
its Latin American operations with those of Promon Tecnologia, the leading Brazilian network integrator and
transaction for Datatec as it catapults Logicalis into becoming the leading independent integrator, not only in Brazil, but across South America.
This earnings enhancing transaction came shortly after Westcon also increased its presence in Brazil, by adding a full service capability to distribute and support
the country.
Both initiatives should transform our operations in South America and we look forward to reporting on progress in these markets later in the year.
PERFORMANCE > 2008, Group revenue increased by 27% (12% organic) to over US$4 billion (2007: US$3,2 billion), while gross margin increased from 13,1% to 13,7%. Gross profit increased by 32% from US$415,2 million to US$547,1 million, while operating costs increased 34% from US$295,8 million to US$396,4 million,
which operate at higher margins with higher operating costs.
26% to US$150,8 million (2007: US$119,4 million). Operating profits increased by 25% to US$123,6 million (2007: US$99,1 million).
Underlying earnings per share rose 21% to 47,3 US cents (2007: 39,2 US cents) and headline earnings
(2007: 40,8 US cents).
Shareholders will benefit from a 20% increase in
share (90 SA cents) (2007: 10 US cents per share (72 SA cents)) out of share premium, which represents a cover of 3,8 times relative to headline earnings.
CORPORATE GOVERNANCE > Datatec and its directors are fully committed to good corporate governance and to the principles of openness, integrity and accountability in dealing with shareholders and all
adopt the principles of corporate governance contained
PROSPECTS > During the coming year we believe that the Group will continue to benefit from its improving
to high-growth emerging markets and developing economies should help balance any slowdown in the more mature markets of the US and Western Europe.
We remain confident that the Group’s business model will remain resilient and continue to deliver growth as
demand, even as other areas of the global economy show signs of weakness.
businesses will continue to improve driven by recent system and process enhancements, the depth of its
Chairman’s statement CONTINUED

15
Datatec Annual Report 2008
management and operating leverage brought through scale and geographic diversity. However, we will maintain prudent management of the Group’s cost base and tight controls on working capital.
The current year has started well and in line with
deterioration in global markets, but is confident of continuing improvement in Datatec’s financial performance in the year ahead.
BOARD AND APPRECIATION > During the year we made a number of significant Board changes, including
28 March 2008.
Datatec between 1998 and 2002 and has been the
director, and chairman of the audit, risk and compliance committee, who stood down from the Board at the Group’s annual general meeting on 6 August 2007.
he joined the Board in 2001.
resignation from the Group in order to pursue alternative
Dittrich, who was appointed as Group Finance Director with effect from 1 May 2008, after joining the Board on 1 March 2008.
of roles across the Group for nine years. Prior to taking up his new position he was Group corporate director,
Group’s corporate Head Office functions and emerging
Group company secretary for five years, and successfully managed the Group’s dual listing in London during 2006.
my fellow directors for their continued contribution and
Datatec’s employees for their splendid efforts throughout the year.
Stephen Davidson

3. Stephen DavidsonIndependent Non-executive ChairmanAge: 52 (British)Date of appointment: 1 February 2007Stephen is chairman of SPG Media plc, Enteraction TV Ltd and Digital Marketing
positions in investment banking, most recently at WestLB Panmure where he was global head of media and telecoms, investment banking, then vice-chairman of investment banking. From 1993 to 1998
Association from 1996 to 1998.
4. John McCartneyIndependent Non-executive DirectorAge: 55 (American)Date of appointment: 16 July 2007
director of Datatec from 11 May 1998 to 30 September 2002 and has been a
president and chief operating officer for
of US Robotics in 1984. John is also a
1. Jens MontananaChief Executive OfficerAge: 47 (British)Date of appointment: 6 October 1994Jens is the founder and chief architect behind Datatec, which he established in 1986. Between 1989 and 1993 Jens served as managing director and vice-president
owned subsidiary of US Robotics which was
MA, an early pioneer of network switching
of Datatec which listed on the JSE Limited in November 1994 and on the Alternative
100% owned subsidiary company, Logicalis.
2. Ivan DittrichGroup Finance DirectorAge: 35 (South African)Date of appointment: 1 March 2008
been with Datatec for the past nine years.
responsible for investor relations and group
dual listing in London during 2006.
Datatec Annual Report 2008
16 Board of Directors
1.
2.
3.
4.

17
Datatec Annual Report 2008
17
DatDatDatateateatec Ac Ac Annunnunnual alal RepRepReportortort 20 2020080808
17
Datatec Annual Report 2008
5. Prof Wiseman NkuhluIndependent Non-executive DirectorAge: 64 (South African)Date of appointment: 1 September 2006Prof Nkuhlu, who was trained as a chartered accountant and who served
currently serves as chairman of Pan-African
and AngloGold Ashanti. Between October 2000 and July 2005 he served as economic advisor to President Thabo Mbeki
New Partnership for Africa’s Development
6. Cedric SavageIndependent Non-executive DirectorAge: 69 (South African)Date of appointment: 6 December 2001
in 1977 as managing director of Tongaat Foods and thereafter progressed to
and director of other JSE-listed companies,
and Denel.
7. Chris SeabrookeIndependent Non-executive DirectorAge: 55 (South African)Date of appointment: 6 October 1994
Limited, chairman of Setpoint Technology Holdings Limited and Metrofile Holdings Limited and deputy chairman of Massmart Holdings Limited. He is also a director of Net1 UEPS
director of a number of unlisted companies,
Partners Fund 1.
8. Nick TempleIndependent Non-executive DirectorAge: 60 (British)Date of appointment: 1 October 2002Nick has had a distinguished career
positions around the world. He was one of
He currently serves as a director of a number of LSE- listed companies including
also the chairman of a number of privately-owned companies.
5.
6.
7.
8.

Datatec Annual Report 2008
18 Chief Executive Officer’s report
Jens Montanana
“The spread of activities across
these three business streams
provides the Group not only
with multiple points of leverage
a defensive businesses model
with no particular vendor,
technology, geography or industry

19
Datatec Annual Report 2008
2008 represented our fifth successive year of improvement in revenues and earnings across the Group. We continue to benefit from our scale and
target of US$4 billion, with the non-US operations now accounting for 58% of total revenues (2007: 52%). The Group’s operations in Asia-Pacific, Africa and the Middle East and South America continued to grow and now account for 15% of the Group’s revenues (2007: 14%).
13,7% and increased operating profit before finance
26%. Operating profits rose 25% to US$123,6 million from US$99,1 million, and headline earnings per
40,8 US cents). Underlying earnings per share grew by 21% from 39,2 US cents to 47,3 US cents. Despite a slowdown in the US, tight operating cost controls and improving productivity have underpinned solid progress for the year as a whole and in the second half of the year in particular. Each of our principal business divisions, Westcon, Logicalis and Analysys Mason, had strong years and are described further below and in more detail in their own divisional reports on pages 28 to 49.
for the Group, this year we have also provided an analysis of revenue streams across the Group’s principal
how both revenues and profits are derived.
Of the US$4 billion revenues generated during 2008, some 76% came from product distribution, principally through Westcon Group, but also from our other operations in Africa and the Middle East (eg. Westcon
derived principally from Logicalis but also includes our
The balance of 6% is attributable to revenues derived from consulting and services generated across our operating units, which comprise consulting revenues of Analysys Mason and attached services from both the
services and other professional services. These activities
they contributed more than 17% of the Group’s gross profit.
The spread of activities across these three business streams provides the Group not only with multiple points
business model with no particular vendor, technology, geography or industry dependency.
MARKET > While the financial and consumer sectors remain under pressure in the US and increasingly in some parts of Europe, as yet there seems to have been limited impact on the corporate market with respect to
The weak US Dollar has helped to underpin the broad-based global demand for technology products
“We will continue to target faster growth emerging markets and developing countries, as demonstrated by our recent transactions in Brazil, Turkey and Africa. These markets are attractive because of their often superior growth characteristics and lower cost of entry when compared to more mature markets.”

Datatec Annual Report 2008
20
cycles of innovation driven by the convergence of
personal online communications use, unleashing a whole new generation of data-intensive and network-hungry applications and new content services. Significantly, unlike the setback following the dot.com collapse in
shifted their business models away from direct selling in favour of growing third-party channels such as through resellers and distributors to improve market access. This continuing trend clearly supports the positioning of Datatec and its divisions in distribution channels, solutions integration and professional services.
STRATEGIC FOCUS > The Group continues to make good progress with its strategy to deliver long-term, sustainable, above-average returns to shareholders by focusing on a combination of organic growth in the
During the year, the Group completed a number of
enhanced its overall scale and global presence. These
overviews below and in more detail in the relevant divisional reports on pages 28 to 49.
opportunities to consolidate where we can improve the Group’s market share and financial returns or facilitate
ongoing participation of the local management of
individuals and ensuring that their interests are aligned to the Group’s, Datatec benefits substantially from their local knowledge and contacts and allows the Group to scale rapidly without adding substantially to Head Office costs.
Specifically, we will continue to target faster growth emerging markets and developing countries, as demonstrated by our recent transactions in Brazil, Turkey and Africa. These markets are attractive because of their superior growth characteristics and lower cost of entry when compared to more mature markets. Further
WESTCON > Westcon accounted for 71% of the
Westcon is the world’s leading speciality distributor in networking, security, mobility and convergence for
Avaya, Juniper and Polycom.
Despite the softening of the US market, Westcon delivered another strong performance. Overall revenue increased 26% from US$2,3 billion to US$2,9 billion,
US$319 million in revenue, in addition to an organic revenue increase of 12%.
Chief Executive Officer’s report CONTINUED

21
Datatec Annual Report 2008
Gross margins increased from 9,5% to 10,4% with gross profit increasing 37% from US$216,2 million to US$296,7 million. The increase is attributable to
gross margins in Europe and Asia-Pacific.
from US$82,7 million to US$102 million, while overall
Across all regions Westcon continued to gain market
solutions in higher growth SMB/SME sectors, and through providing outsourced logistics and procurement services to a growing number of international service providers and global system integrators.
During the year, Westcon invested heavily in developing its convergence and information security portfolio which
products made up 55% (2007: 60%) of Westcon’s revenue, 11% Nortel (2007: 13%), 11% Avaya (2007: 9%), 13% security (2007: 4%) and 10% other
Westcon’s revenue was generated in Europe, followed by 45% in the Americas and 9% in Asia-Pacific.
During the year the Group completed a number of
market position, broaden its portfolio and strengthen its vendor relationships.
Westcon into a market-leading position in Europe in not just data networking, but also in the high-growth
The integration of these assets has progressed well and they have made a strong contribution to the improved performance of Europe in the year under review.
videoconferencing solutions, added voice and
to high-growth markets, Westcon also made a number of strategic investments in Eastern Europe and South America.
a 50% stake in wholly owned subsidiary Neteks, a networking and security distributor whose vendor
year. As a result of the joint venture, Westcon Group became the leading networking and security distributor in that region. With a GDP of US$358,5 billion and population of over 71 million, Turkey is an important
increasingly important role.
services from its established Westcon operations in Brazil. This new organic initiative has the potential to

Datatec Annual Report 2008
22
steps in the Group’s strategy to leverage Weston’s scale
geographically to mirror the growth objectives of its leading vendor partners.
LOGICALIS > Logicalis accounted for 21% of the
solutions, delivering secure, converged computing and communications infrastructure and services. Specialising in the areas of advanced technologies, the Group’s integrated services portfolio comprises the architecture, deployment, integration and management of customers’ networks and systems to deliver optimum solutions that meet their business needs now and into the future.
performed strongly. Tougher market conditions in the US accelerated a strategic assessment of the US business model during the first half and a restructuring which resulted in multiple service delivery activities being unified under a focused management team and a streamlining of the cost base.
Revenue for the year increased by 22% to US$845,1 million (2007: US$693,1 million) including
2008 organic revenue increased by 10%.
Product and solutions sales growth of 19% year-on-year generated additional demand for consulting and technical services which increased by 27%. Managed services and annuity revenues grew 33% year-on-year.
Gross margin percentage for the year was 22,9% (2007: 22,3%) with services and annuity margins off-setting slightly weaker product margins.
The gross profit increased 25% on the prior year to US$193,8 million (2007: US$155 million).
Florida, whilst broadening and deepening its relationship with HP. The Group also purchased the outstanding 20% minority interest in its South American operations and increased its stake in its Germany-based services business to 75%.
Across the business, the Logicalis management has increased the focus on client-specific solutions that leverage the full Logicalis portfolio. Each region has developed single solutions sales and consulting services units. This approach improves the value added and further strengthens client relationships. A significant number of major long-term customer contracts have recently been secured. Most notable was the awarding of a US$150 million seven-year contract with the Welsh Assembly Government for the provisioning and support of a new national broadband network.
of the market rate by offering a customer-driven portfolio of solutions that address business efficiencies through
growing economies.
the leading Brazilian network integration businesses, completed in May 2008, is significant. The combination of Logicalis’ South American businesses in Argentina,
Chief Executive Officer’s report CONTINUED

23
Datatec Annual Report 2008
has transformed Logicalis into the largest network integrator in South America, with over 500 employees
The merger also provides a solid foundation for further growth in the Latin American market and increases Logicalis’ capability to service major multinational clients across the region.
We anticipate a growing proportion of profits to be
that profits will be derived evenly from our operations in the US, Europe and South America.
ANALYSYS MASON > Analysys Mason accounted
Analysys Mason provides strategic and technical consulting to many of the industry’s leading service providers, regulators and government bodies.
television and online media content is being fuelled by widespread deployment of faster broadband internet infrastructure. The Group is particularly well positioned to
this market around the world.
Revenues grew to US$63,5 million (2007: US$61,4 million). Telecoms strategy consulting revenues have continued to enjoy strong growth in recent months with a compound annual growth of 12% over the last three years. Analysys Mason has also seen
international revenues now representing 60% total revenue (2007: 55%). Much of this growth has come
region where a Dubai office was recently established to capitalise on the opportunity in that area.
Gross margin improved to 40% (2007: 36,3%),
(2007: US$6,2 million) at a margin of 10,9% (2007: 10,1%) and operating profit of US$6,2 million (2007: US$5,8 million).
On 19 February 2008 Analysys Mason completed
that can be offered to clients. The business will be fully integrated into the Analysys Mason consulting model
additional revenue in 2009.
Analysys Mason has increasingly worked to deliver projects that span the full business development cycle of its clients, including research, strategy, planning and
enhancing the value it delivers to customers, and in response to clients who are currently engaging with other parts of the Group, it has consolidated its portfolio of offerings under the integrated Analysys Mason brand.
EMERGING MARKET HOLDINGS > Datatec’s Africa and Middle East operations made up 6% of the Group’s
holding company for Datatec’s 55% stake in Westcon
up 23% to US$85 million (2007: US$69,2 million) and
African-focused businesses which distribute products similar to the rest of Westcon.

Datatec Annual Report 2008
24 Chief Executive Officer’s report CONTINUED
The other WAME operation’s revenues were
its first reporting period as part of the Group. The gross
be achieved by better procurement capability and the
model.
African operation formed in partnership with African Legend Technologies as part of South Africa’s Black Economic Empowerment programme. This business generated revenue of US$51,1 million (2007:
loss of US$0,2 million).
distributor for data networking products and services, covering the Middle East, Western Asia and North Africa, revenue increased by 24% to US$55,6 million
Middle East, started operations in February 2007.
growing market in the Middle East.
The growth outlook for Westcon SA remains strong,
will take a further 12 months before starting to realise the higher growth opportunities and deliver margins in line with the rest of the Group. The growth in the Middle East market has been sustained this year and is
hospitality sectors.
PROSPECTS > There is no clarity yet on the impact of the financial crisis in the US and how it may affect the broader economy long term. Recent poor economic
US Dollar is helping to underpin a relatively strong tech sector with demand in fast-growing emerging economies off-setting any softening of the US market.
Whilst Datatec is not immune to any slowdown in the global economy, we remain confident that our global
leading vendor portfolio will help to insulate the Group against any adverse market conditions
We believe that the defensive nature of our business model will continue to generate superior financial
performance over any cycle.
We are aiming to double the proportion of our revenues
recent investments in South America will contribute
of our growth coming from organic operations, with
will continue to improve in the year ahead, driven by
value-added services streams across the Group. The
in the medium term.

25
Datatec Annual Report 2008
For the year ahead, we have set a number of core objectives for the business:
We will report on progress against these objectives in
Jens Montanana

Datatec Annual Report 2008
26

27
Datatec Annual Report 2008

Datatec Annual Report 2008
28 Westcon divisional report
John O’Malley
“The company views its focus on advanced technologies as the key differentiator between Westcon and its broad-line multinational competitors. Management believes that its core-vendor partners, Cisco, Nortel, Avaya, Polycom and Juniper, will continue to develop new technology categories for which Westcon can offer valued-added solutions developed specifically to help its reseller customers compete effectively in the market.”
Revenue up 26% to
US$2,9 billion(2007: US$2,3 billion)
Gross profit up 37% to
US$297 million(2007: US$216 million)
EBITDA up 23% to
US$102 million(2007: US$83 million)
HIGHLIGHTS >
Cisco Nortel Avaya Security Other
11%
13%
11%
10%
REVENUE % BY VENDOR >
55%
Tom Dolan

29
Datatec Annual Report 2008
distributor of networking, security, mobility and
convergence products for leading technology vendors
data and video applications and technologies, including
and communications systems, videoconferencing and
wireless connectivity. The company’s customers consist
of value-added resellers, systems integrators and service
providers that resell networking products and solutions
to small- and medium-sized businesses, enterprise
organisations and governments around the world.
Avaya, Juniper and Polycom, in addition to a host of
other complementary vendors. Westcon adds value to
its distribution activities by providing resources such as
sales and product training, engineering support and
professional services. Among the solutions Westcon
Group provides is the design and configuration of
such as videoconferencing, network storage, unified
messaging and network security.
STRUCTURE > Westcon Group operates its
multinational distribution business through its branded
customers through its world-class logistics capabilities,
powerful solutions programme infrastructure, innovative
financing alternatives and through its highly skilled sales,
marketing, technical and operational staff.
oriented advanced technology solutions and operates
in North and South America, Europe, Australia, Asia
offerings, which are centred on convergence, security
and mobility, include OneDefense, OneVoice,
OneNetwork and OneWave.
and Europe, is focused on delivering solutions from
vendors like Nortel and Avaya, while providing
a wide range of complementary voice and data
also offers security solutions from vendors like Blue
Nokia and many others. Westcon programmes
America, is focused on delivering convergence and
unified communications solutions from Avaya while
hardware and applications.
2008 SUMMARY >
“While the financial markets in the US and other regions continue to tighten, opportunities in networking – particularly convergence, security and mobility – continue to expand. Demand for effective IT security remains paramount as companies begin to rely increasingly on mobile hardware and applications – this has created significant demand for VoIP security products that protect mobile networks and devices.”

Datatec Annual Report 2008
30 Westcon divisional report CONTINUED
2008 OPERATIONAL HIGHLIGHTS >
> Organic growth of 12%> Gross margins improve to
10,4%> NOXS and Crane
acquisitions create leadership position in Security and Convergence
> Significant improvement in product mix
> Completed acquisition of Review Video (US), a specialist distributor of networked videoconferencing and collaboration solutions
> Acquired Cernet (Americas), providing entry into Mexico and Central American markets
> Entered into a strategic joint venture in Turkey
prior year. The company achieved this growth through
a combination of strong organic growth and strategic
Telecommunications – which together significantly increased
Review Video, a specialist distributor of videoconferencing
a multinational basis, while broadening its technological
vendor partners such as Avaya and Polycom.
Westcon’s advanced technology focus is a key factor
supporting the higher-than-average gross margin that the
company achieves. Enabling and supporting this success
is a set of marketing strategies which is geared to leverage
the internal intellectual capital of any sales and marketing
team against the customer base of the whole company.
These marketing strategies are embodied in Westcon
Group’s branded programmes, which are now available
to customers all over the world.

31
Datatec Annual Report 2008
“Westcon will continue to seek to leverage its international reach and global scale for its vendor partners which are increasingly turning to Westcon to help them to develop their global channels to market, especially for more complex technologies.”
OneVoice and OneDefense were launched in Singapore
and Turkey, OneWave and OneNetwork were launched
were launched in Brazil. Westcon’s technology-focused
solutions programmes continue to provide a very
customers.
Westcon Group continued to perform ahead of budget
it firmly held its ground in other regions. The company
forged important vendor relationships around the globe,
signing a distribution agreement with Juniper to include
Europe.
enhancing its programme-offering worldwide, Westcon
also offered many other added-value customer services
States, targeted network and managed services in
customers around the world.
During the year, Westcon Group received several
industry accolades from its peers and the media. For
up the award for the last five consecutive years.
CRN, an important channel publication
in the United States, awarded Westcon Group with
no less than 13 awards in its annual sourcing study.
Among the awards Westcon picked up were number
one Distribution Programmes, number one Emerging
one Financing and available credit. Two notable
channel publications in Europe, Microscope and
CommsBusiness, also awarded Westcon “Distributor
PEOPLE > The key to Westcon Group’s success around
the world is its diverse and talented employees. Westcon
employees in each of the markets in which it operates,
and continually invests in its employees through internal
training and career-development programmes. Westcon
employs over 1 600 employees around the world and

Datatec Annual Report 2008
32
prides itself on its strong and stable workforce. The
retention rate for employees with five years seniority
is strong at 37%. During the year, Westcon launched
Westcon University, an internal training and career
development programme for employees, and also
enhanced its orientation programme for new hires.
This year, Westcon once again initiated a company
survey to its global employee base to gain insight into
company morale, alignment with strategic direction and
overall satisfaction. This was the third year Westcon
captured this information as a benchmark, and the
survey continues to yield very positive results, as well
as helping management gauge employee productivity
issues.
CONTINUED FOCUS ON ADVANCED
TECHNOLOGIES > The company views its focus on
advanced technologies as the key differentiator between
Westcon and its broad-line multinational competitors.
Nortel, Avaya, Polycom and Juniper, will continue to
develop new technology categories for which Westcon
can offer valued-added solutions developed specifically
to help its reseller customers compete effectively in
the market. Additionally, by continually developing its
portfolio of new complementary vendors, and through
networking alternatives for its customers.
MARKETS > While the financial markets in the
US and other regions continue to tighten, opportunities
in networking – particularly convergence, security and
market contraction. As end-user companies face pressure
to be more efficient, it is becoming more important
for their networks to be able to support productivity-
security remains paramount as companies begin to rely
increasingly on mobile hardware and applications – this
that protect mobile networks and devices.
FINANCIAL PERFORMANCE > During the year,
Westcon’s revenue increased 26% to US$2,9 billion
contributed US$319 million in revenue, resulting in an
increase in organic revenue of 12%. This reflects an
increase across all geographic regions due to strong
Gross margins increased from 9,5% in 2007 to
10,4% in 2008 with gross profit increasing 37% from
US$216 million to US$297 million. The increase is
coupled with increased gross margins in Europe and
Asia-Pacific, offset by lower gross margins in the
Americas.
and Asia-Pacific were offset by the twin effects of lower
Westcon used US$156 million for investing activities.
Of this amount, US$145 million was used for
US$163 million of cash, which was used to fund the
Westcon divisional report CONTINUED

33
Datatec Annual Report 2008
revenue followed by 11% for Nortel, 11% for Avaya,
13% for security and 10% for other developing vendors.
From a geographic perspective, 46% of Westcon’s
revenue was generated in Europe followed by 45% in
the Americas and 9% in Asia-Pacific.
FURTHER PROSPECTS > Whilst the US market
remains soft and the outlook remains uncertain,
management remains confident that Westcon’s multiyear
growth trajectory will remain intact over the coming
year. Westcon will continue to seek to leverage its
international reach and global scale for its vendor
partners which are increasingly turning to Westcon to
help them to develop their global channels to market,
There are significant opportunities to further consolidate
and invest in new markets to parallel the objectives of
our major partners. Geographically we see the biggest
growth opportunities to be in Asia-Pacific and Latin
Europe by virtue of our increased scale and operating
efficiencies.
Westcon’s strengths are its geographic diversity and
synergistic technology, coupled with a sector specialism
that has positioned us at the forefront of the global
ingredients and depth of management to continue to
further growth in the year ahead.

Datatec Annual Report 2008
34 Logicalis divisional report
“Overall, investment in IT is expected to continue to show steady growth over the next few years with a number of higher growth areas driven by convergence and unified communications, consolidation and virtualisation technologies. Industry analysts also forecast strong growth in outsourced managed services.”
Revenue up 22% to
US$845,1 million(2007: US$693,1 million)
Gross profit up 25% to
US$193,8 million(2007: US$155,0 million)
EBITDA up 35% to
US$36,2 million(2007: US$26,8 million)
HIGHLIGHTS >
Los Angeles office
IBM Cisco HP Others EMC
21%
11%
27%
2%
REVENUE % BY VENDOR >
39%
Nigel Drakeford-Lewis
Ian Cook

35
Datatec Annual Report 2008
OVERVIEW > Logicalis is an international provider of integrated information and communication technology
and communications infrastructure and services.
Specialising in the areas of advanced technologies the group’s integrated services portfolio comprises the architecture, deployment, integration and management of customers’ networks and systems to deliver optimum solutions that meet their business needs now and into the future. Our business model is built around helping our customers use technology to embrace, support and drive their strategic business processes. We help them
advanced technical skills, world-class products, and
employs around 1 500 people worldwide, including highly trained service specialists who design, specify,
meet the needs of over 6 000 corporate and public sector customers. To achieve this, Logicalis maintains strong partnerships with technology leaders such as
THE YEAR IN REVIEW > Logicalis’ management is focused on building strong businesses that provide the core information and communication technologies that
strategy with above-market-rate organic growth targets.
Tougher market conditions in the US in the first half of the year caused planned revenue growth not to materialise. This accelerated a strategic assessment of the US business model and resulted in service delivery being unified under a focused management team and a streamlining of the cost base to match the ongoing activity level.
After a weak first-half performance, for the full year, group revenues of US$845,1 million were up 22% and
year.
During the financial period under review, Logicalis
Alabama, Tennessee and Florida, while strengthening its
revenue by US$14 million in the fiscal year. During the year, the group also purchased the 20% minority interest in its South American operations and increased its stake in a Germany-based services business to 75%.
After the year-end, on 17 March 2008, the group
operations across South America with the business of
“The group’s focus remains on higher demand advanced technologies that deliver secure, converged computing and communications infrastructures. These include wireless, IP communications, storage and data management, intelligent networking and security.”

Datatec Annual Report 2008
36 Logicalis divisional report CONTINUED
2008 OPERATIONAL HIGHLIGHTS >
> Organic growth of 10%> Gross margin expanded to
22,9%> Robust growth in profitability
in the UK operations> South America had very
strong revenue growth of 71%
> Completed acquisition of Promon – largest independent network integrator in South America
> US H1 restructure resulted in strong profit recovery despite softening in the market
integrator, to create a regional market leader with a
2 May 2008.
strong consulting and service offerings. PT enjoys a market-leading position in the Brazilian service provider and telecommunications market, and complements Logicalis’
Under the terms of the merger, Logicalis holds 70% of the shares of the enlarged holding company which will own all of the South American operations with Promon SA, PT’s parent, retaining the remaining 30% shareholding. The combined operation will be the largest independent network integrator in South America with almost 500 employees and annualised revenues approaching US$300 million. The
will trade under the Logicalis name whilst the Brazilian operation will be called PromonLogicalis and will be based
The focus of the division will be to capture synergies across South America by providing cross-border solutions and services to customers in the region. The board and management of PromonLogicalis Latin America will comprise

37
Datatec Annual Report 2008
“The group will seek to make further acquisitions that extend its services business as well as its participation in other strategic geographic markets.”
This transaction marked an important step for Logicalis, to realise its plans to double revenues and improve the
increase its geographical reach into the faster growing economies. Management has long believed that there is a significant market opportunity for an integrator to
South American market. The merger with PT provides the platform for further growth in the South American market and enhances Logicalis’ capability to service major multi-nationals that operate in the region.
Logicalis now enjoys the following commanding market positions:
mid-market segment).
Uruguay and Brazil.
MARKETS >the year under review saw trading conditions soften compared to the previous year with economic growth
conditions remained strong, driving investment in
71% growth in revenue.
advanced technology products enjoying growth of
servers market, HP enjoyed high, single-digit year-on-
systems and technology group revenues of -3% (driven by lower zSeries and iSeries revenues).
number of higher growth areas driven by convergence and unified communications, consolidation and
strong growth in outsourced managed services. Latin
year to 2010.
decisions are increasingly being made by functional
computing platforms and applications are becoming
value-added resellers such as Logicalis increasingly need to engage with customers on a business level to identify the issues for which solutions will be designed.
Logicalis will focus on new sales and partnering models, developing and maintaining deep skills across a broad spectrum of technologies and applications, better marketing, leveraging vendor and distributor relationships as well as strong financial and business management.
STRATEGY > Logicalis’ solution-led and service-oriented go-to-market strategy is built around four proposition

Datatec Annual Report 2008
38
portfolio of solutions underpinning each theme. Each of these themes is focused on enabling our customers
achieve the key strategic goals of business agility, continuity, responsibility and governance.
The group’s strategy is based on three key principles:
services to our customers.
growth in profit and value by being a leading player in our chosen markets and with strength in scale, efficiency
objectives include:
US and Latin American operations.
orientation tied to better strategic marketing and proposition development.
technologies.
growing the capabilities of our sales team, through
support.
our customer bases.
brand.
driving efficiencies.
measurement by operation and by business line.
Logicalis will focus on building long-term corporate relationships by:
partner for our entire portfolio.
service capability through investment in resources and
competitors can gain entry.
higher demand, advanced technologies that deliver secure, converged computing and communications
storage and data management, intelligent networking and security.
This strategy, combined with our established technical skills, has been recognised by our key vendors for the year under review.
for its integrated management system supporting computing and communications solutions, information
certification, the Environmental Management System.
Logicalis divisional report CONTINUED
39
Datatec Annual Report 2008
Moving forward, Logicalis will seek to make further
participation in other strategic geographic markets.
FINANCIAL PERFORMANCE > Revenue was US$845,1 million for the year ended 29 February 2008. This compares to revenue of US$693,1 million
10% over the prior year on a like-for-like basis. Logicalis
market.
Product sales growth of 19% year-on-year generated additional demand for consulting and technical services which increased by 27%. Managed services and annuity revenues grew 33% year-on-year.
Total gross margin percentage for the year was
margins offsetting slightly weaker product margins. The total gross margin increased 25% on the prior year.
previous financial year, lower than the 25% growth in gross margin. Further leverage benefits were held back by the failure of planned revenue growth in the US to
the US operations.
previous financial year, an increase of 35%.
After charges for depreciation and amortisation of intangible assets, the total operating profit was
The days’ sales outstanding for accounts receivable of 44 days, was better than the 50 days achieved at 28 February 2007. Net cash was US$44,3 million, a significant increase on the US$8,6 million at 28 February 2007, with the increase primarily due to the profits generated for the year, the reduction in the accounts receivable days’ sales outstanding and some favourable trading terms with certain suppliers.
PEOPLE >
and management works closely with its vendors to ensure that employees are trained appropriately, taking full advantage of vendor-funded training schemes wherever possible. We are committed to building an environment where each employee can fulfil his or her potential.
FUTURE PROSPECTS > The three main goals for the coming year are to achieve a revenue growth rate in
operating margins by increasing the services and annuity
to focus on driving sales volumes, by continuing to develop compelling solutions, growing the customer
With the increased uncertainty in the macro-economic outlook, management is alert to any reduction in revenue from market-related drivers. However, Logicalis remains focused on delivering the right solutions to our customers

Datatec Annual Report 2008
40 Analysys Mason divisional report
“Analysys Mason’s reputation is built upon the sector-specific knowledge, intellectual rigour, and operational experience of its consultants, whose expertise provides industry-leading insight into issues facing the convergence industries of telecoms, IT and media.”
Revenue up 3,4% to
US$63,5 million(2007: US$61,4 million)
Gross profit up 14% to
US$25,4 million(2007: US$22,3 million)
EBITDA up 11% to
US$6,9 million(2007: US$6,2 million)
HIGHLIGHTS >
MENA Asia USUKEurope
Rest of world
5%
41%
2%
18%
8%
REVENUE % BY GEOGRAPHY >
26%
Bill Moore, Finance Director
Simon Jones

41
Datatec Annual Report 2008
“The internationalisation of the company has continued to improve throughout the year, with 60% of all business now derived from outside the UK.”
OVERVIEW > Analysys Mason is established as the
consulting, market intelligence and implementation services on a global basis. Analysys Mason provides strategy advice, operations support and market intelligence to leading players in the industry, including: operators, broadcasters, vendors, financial institutions, regulators, new media companies, public sector organisations and enterprises.
Analysys Mason has a wide range of clients in over 80 countries around the world which it services from
Madrid, Manchester, Milan, Paris, Dubai, Singapore
Analysys Mason offers end-to-end solutions that support a client’s entire business development cycle and offers a portfolio of services which is delivered out of two major divisions: consulting and research:
on setting strategy, planning for change, and implementing that change.
research products.
THE YEAR IN REVIEW >Mason improved its financial performance at all levels of the income statement. Revenue grew modestly to US$63,5 million (2007 US$61,4 million) but more
significant was the improving operating leverage derived
(2007 US$6,2 million) and would have been greater but for some restructuring costs. The revenue gains were accompanied by better utilisation of consultants, reflected in the overall improvements in both gross and net margins.
The internationalisation of the company has continued to improve throughout the year, with 60% of all business
North Africa in particular continued to show strong growth and Analysys Mason opened an office in Dubai to make the most of this opportunity. North America and Asia have also showed good progress in 2007.
Strategic telecoms consulting remained strong during the year, especially for new emerging markets driven by
and management in the research division led to a strong turnaround in performance with a resurgence of revenue. The group continues to invest actively in this area.
Analysys Mason continued to win challenging and
group’s three strongest client categories continue to be
government.

Datatec Annual Report 2008
42 Analysys Mason divisional report CONTINUED
2008 OPERATIONAL HIGHLIGHTS >
> Further globalisation of client base with 60% of revenues now coming from non-UK clients
> Core telecoms consulting revenue have had 12% CAGR over the last three years
> Strategy consulting business had record performance at both revenue and profit
> Research business had strong revenue growth of 24%
> Established Dubai office for Middle East and North Africa (MENA) region
> Completed the acquisition of Redbox Consulting in February 2008
On 19 February 2008 Analysys Mason completed the
the range of services that can be offered to clients. The business will be fully integrated into the consulting division
revenues in 2009.
MARKETS > Analysys Mason’s addressable market continues to be characterised by rapid technological and regulatory change. While strategy work has continued to grow at a pleasing rate there has been a significant shift in the market away from large-scale network roll-out projects in developed markets, to more business-driven operational improvement, restructuring, operator launch and optimisation projects.
The group responded to this change by focusing on its core
by 12% per year since 2005/6.
There are a number of key industry drivers which will drive the business over the coming year.
These include:
product innovation, fibre deployment.
markets.

43
Datatec Annual Report 2008
“Strategic telecoms consulting remained strong during the year, especially for new emerging markets driven by deregulation and mergers and acquisitions, such as the Middle East and Africa. Changes to the business model and management in the research division led to a strong turnaround in performance with a resurgence of revenue.”
service providers – cash flow impact of legacy decline vs digital content and applications.
dividend review.
STRATEGY > Analysys Mason’s reputation is built upon the sector-specific knowledge, intellectual rigour,
media. The group’s service portfolio is clearly defined into strategy, implementation, planning and review, with market intelligence at the centre of its work.
Analysys Mason delivers services to the industry across five major areas (see diagram overleaf).
Analysys Mason has increasingly worked to deliver projects that span the full business development cycle,
with its strategy of continually enhancing the value it delivers to partners, and in response to clients who are
currently engaging with all parts of the group, the group is now moving to offer the full portfolio of client services under a single brand.
On 30 April 2008 the new brand was launched and the group’s four constituent companies (Analysys
single name: Analysys Mason.
FINANCIAL PERFORMANCE > Revenue grew to
telecoms consulting revenues have seen a much stronger improvement with compound annual growth of 12% over the last three years. Analysys Mason has also seen
revenues now represent 60% of total revenue (2007: 55%). Much of this growth has come from the Middle
increased to US$5,9 million (2007: US$3,8 million). This improvement in profitability has been driven by a stepped increase in gross margin to 40% (2007: 36,3%).
PEOPLE > advisory group Analysys Mason’s success depends

Datatec Annual Report 2008
44
retaining the best people in the sector to maintain the group’s leadership in the markets it serves remains a key strategic objective for the business.
Today Analysys Mason employs 254 consultants around the world, servicing clients in more than 80 countries. The group’s employees have had a major influence on the industry for more than 20 years and have been involved in many groundbreaking projects such as:
Asia.
used by regulators to govern the operation of the sector.
parties and regulators.
institutions.
Marketing and recruitment will continue to be focused on enhancing Analysys Mason’s reputation in growth
and solutions, and consulting to the media and
geographical markets. Management will continue to look for ways to improve productivity and enhance operational synergies as a platform to accelerate future growth.
Analysys Mason divisional report CONTINUED
CLIENTS >
Fixed and mobile operators, broadcasters, financial institutions, regulators, public sector bodies, enterprises, IT and technology companies, equipment manufacturers
ANALYSYS MASON OFFICES >
Europe, Asia, Americas, Middle East and Africa Client presence
CONSULTING AND RESEARCH SERVICES >
Service portfolio
STRATEGY
Establishing direction
PLANNING
Preparing to excel
IMPLEMENTATION
Delivering success
REVIEW
Measuring up
MARKET INTELLIGENCE >
Research reports and continual industry intelligence services

45
Datatec Annual Report 2008
FUTURE PROSPECTS >opportunities in established markets and sectors, Analysys Mason continues to make the most of group synergies and much potential remains for the group to broaden and deepen both its thought leadership-based service offerings and its geographic footprint.
Organisation priorities for 2009 include:
and end-to-end service portfolio.
geographic market penetration.
leadership across the entire portfolio.
transformation and operations improvement.
implementation businesses.
consulting, geographic and publications scale.
strategy.
Management remains very conscious of the uncertain economic climate we face and retains a prudent and cautious approach to recruitment, cost management and growth initiatives.

Datatec Annual Report 2008
46 Other emerging markets holdings (Africa and Middle East) divisional report
“The growth in the Middle East market has been sustained this year and is expected to remain buoyant during the next 12 months with investments expected in the finance, health and hospitality sectors.”
Revenue up 73% to
US$246 million(2007: US$142 million)
EBITDA up 54% to
US$5,7 million(2007: US$3,7 million)
Operating profit up 56% to
US$5,0 million(2007: US$3,2 million)
HIGHLIGHTS >
Westcon SA and Westcon Africa ALI Online and CME
51%28%
21%
REVENUE % BY BUSINESS >

47
Datatec Annual Report 2008
WESTCON AFRICA MIDDLE EAST (PTY) LTD
(“WAME”) > was formed in 2007 to be the holding
company for Datatec Ltd’s 55% stake in Westcon
principally African-focused businesses which distribute
similar products to the rest of Westcon.
bearing loans from Datatec Ltd.
For the year under review, the WAME group of
companies produced revenue of US$135,6 million and
SA contributed revenue of US$84,8 million (2007:
US$69,2 million) which represents 23% growth. Gross
margins were 10,3% down from 12,1% in the prior
year, however, management does not believe this to be
US$2 million.
These other WAME operations produced revenues
of US$50,8 million at a gross margin of 9,6%. This
only a slow upward trend on gross margin. This will be
achieved by better procurement capability and gradual
operations was US$0,1 million during this period.
The growth outlook in Westcon SA remains strong.
However, management believes that other WAME
operations will take a further 12 months before they start
to realise their full potential to develop opportunities in
the high-growth market in Africa. Thereafter they are
Group.
ONLINE DISTRIBUTION LIMITED > is a value-added
distributor for networking products and services covering
the Middle East, Western Asia, and North Africa.
Through its network of resellers Online has developed
the business of the vendor partners across these
geographies.
increased marginally by 7% to US$2,9 million. By virtue

Datatec Annual Report 2008
48 Other emerging markets holdings (Africa and Middle East) divisional report CONTINUED
2008 OPERATIONAL HIGHLIGHTS >
> Improvements in market share, geographic reach and new vendors
> Significant revenue growth (73%) mainly acquisitive
> Pan Africa footprint established
> Investments in organic startups (Comstor ME) impacted margins
> South African IT services group “AL Indigo” performing profitably
into new geographies Online is poised for an increased
The growth in the Middle East market was sustained
the broadline distributors continues to depress margins.
However, management remains confident that Online’s
value-added approach will help it to maintain the current
levels of operating margins.
COMSTOR MIDDLE EAST LTD > started its operations
in the Middle East in February 2007. During the year
ME achieved overall revenue of US$13 million.
However, being the start-up year, the company made a small
Middle East.
AFRICAN LEGEND INDIGO >of Enterprise Management Solutions including the supply
of soft/hardware and support, configuration support,
software customisation, initial installation planning as well as
professional services including implementation and project
management, disaster recovery, maintenance, knowledge

49
Datatec Annual Report 2008
solutions to the telecommunications industry, to financial
services, to the public sector with its vendor partners Sun
wireless mobile technology systems integration business
and mobile supply chain solutions to sectors such as
retail, industrial, manufacturing, transport and logistics.
For the year ended 29 February 2008
the company achieved revenues of
US$51,1 million (2007: US$28,3 million) and

50
Datatec Annual Report 2008

51
Datatec Annual Report 2008

Datatec Annual Report 2008
for the year ended 29 February 2008
52 Finance report
Ivan Dittrich, Group Finance Director
“The Group has continued with
its policy of making an annual
distribution to shareholders and
has decided to make a cash
distribution of 12 US cents per
share (2007: 10 US cents per
share) out of share premium,
which represents a cover of
3,8 times relative to headline
earnings.

53
Datatec Annual Report 2008
INTRODUCTION > This review provides further insight into the performance and financial position of the Group
otherwise indicated, focuses primarily on continuing operations. This review is not comprehensive and should be read in conjunction with the annual financial statements presented on pages 90 to 150. The annual financial statements have been prepared in accordance with the Group’s published accounting policies, which
PERFORMANCE > Our trading results were solid, and represent another year of continued organic growth. Group revenue increased by 27% (12% organic) to over US$4 billion (2007: US$3,2 billion), while gross margin increased from 13,1% to 13,7%.
Of the Group’s US$4 billion revenue in the year, 42% was generated from North America, 43% from Europe, 6% from Asia-Pacific, 3% from South America and 6% from the Middle East and Africa.
Gross profit increased by 32% from US$415,2 million to US$547,1 million, while operating costs increased 34% from US$295,8 million to US$396,4 million, mainly
operate at higher margins with higher operating costs.
to US$150,8 million (2007: US$119,4 million),
US$5,3 million (2007: US$6,3 million). Amortisation
US$10,3 million (2007: US$5,4 million) as a result of
during the past year.
Operating profit increased by 25% to US$123,6 million (2007: US$99,1 million). The net interest charge in the year was US$15,3 million (2007: US$9,7 million) as
utilisation of Westcon facilities resulting in profit before
US$89,4 million.
30,5% in 2007, primarily due to the utilisation and
rate for the financial year ended 28 February 2009 is
Underlying* earnings per share rose 21% to 47,3 US cents (2007: 39,2 US cents). HEPS increased by 12% to 45,6 US cents (2007: 40,8 US cents).
The Group issued 14,5 million new shares during the year. 7,2 million shares were issued in May 2007 in connection with an institutional placing, 5,1 million
* excluding goodwill impairment, amortisation of acquired intangible fixed assets, profits or loss on sale of assets and businesses and unrealised foreign exchange movements on inter-company loans.

Datatec Annual Report 2008
54
shares. A further 1,1 million shares were repurchased by the company share trust and are held as treasury shares.
well as enhanced its overall scale.
1 March 2007, the pro forma revenue would have
they had been included for the entire year.
DIVIDEND POLICY > The Group has continued with its policy of making an annual distribution to shareholders and has decided to make a cash distribution of 12 US cents per share (2007: 10 US cents per share) out of share premium, which represents a cover of 3,8 times relative to headline earnings.
This policy is subject to annual review and may be
changes in reported earnings resulting from applying fair value accounting principles, or as circumstances dictate.
BALANCE SHEET > Ordinary shareholders’ funds at the reporting date were US$654,7 million, representing a US$117 million increase from US$537,7 million in 2007. The change is due primarily to the share placement which took place in May of 2007 for US$35,4 million, as well as shares issued as part of the
(2007: US$3,47).
Working capital remained tightly controlled. Receivables increased 34% over the year, inventory increased by
27% and payables and provisions increased by 33%. The increase in receivables, inventory and payable balances is in line with revenue growth and is, to a
the year. Goodwill and other intangible assets have increased from US$183,3 million to US$339,3 million
POST-RETIREMENT BENEFITS > The Group’s retirement benefit funds comprise a number of defined contribution funds throughout the world. The Group has no liability to these funds other than the monthly payment of staff contributions. The Group has no liability in terms of post-retirement medical aid contributions for staff.
DEBT LEVELS > Our overall attitude to debt remains conservative. The Group is dependent on its bank overdrafts, working capital lines of credit and trade finance facilities to operate. These facilities generally
repayable on demand, are secured against the assets of the subsidiary company to which the facility is made available and contain certain covenants which include
not obtained for such violation, this may, amongst other things, result in that breached facility becoming repayable on demand. There were no breaches of covenants during the year. For full details refer to Note 17 and Note 21 of the annual financial statements.
The interest cover ratio at 5,6 times (2007: 6,5 times)
Furthermore, Datatec has no restrictions on its borrowing powers in terms of its memorandum and articles of association.
CASH FLOW > activities (after working capital changes) amounted to
Finance report CONTINUED

55
Datatec Annual Report 2008
US$32,3 million (2007: cash outflow: US$3,6 million). The Group paid US$16,8 million to shareholders as a capital distribution in July 2007 and US$35,4 million was received from an institutional placing in May 2007. The Group ended the year with net debt of US$31,9 million, including long-term and short-term debt (28 February 2007 net cash: US$98 million).
BUSINESS RISK AREAS > The Group’s success and our performance over the last five years, indicate that our overall strategy of supporting decentralised, standalone business units mitigates the business risks that we face. Our managers are held accountable for the performance of their business units, which includes understanding and responding to the financial and operational risks they face.
The Board, however, recognises that some elements of risk management can be achieved only on an integrated basis and as such, are controlled centrally. The Group’s risk management policies and procedures are summarised in the corporate governance report on pages 59 to 67.
The risk management process has identified certain key risks faced by the Group some of which are summarised below. The risks identified below do not necessarily comprise all those affecting the Group and the risks listed are not set out in any particular order of priority. Additional risks and uncertainties not presently known to the Group or the directors or that the Group or the directors currently deem immaterial may also adversely affect the Group’s business or operations.
Financial risk related to financial instruments > These
interest rate risk. The Group seeks to minimise the effects of these risks by using derivative financial instruments
derivative financial instruments where appropriate,
fluctuations upon future operating results and there can
have a material adverse effect on its business, operating results or financial condition.
Dependence on key vendors > The Group is particularly
renew or materially adversely changes its agreement or arrangements with the Group, it could materially reduce the Group’s revenue and operating profit and thereby seriously harm the Group’s business, financial condition and results of operations.
Working capital > As a speciality distributor of
technology vendors, the Group’s business is working
Westcon’s working capital needs are utilised to finance accounts receivable and inventories. Westcon largely relies on revolving credit and vendor inventory purchase financing for its working capital needs. Typically,
to enable it to promptly meet anticipated customer demand. Westcon maintains inventory levels based on its projections of future demand and market conditions. Any sudden decline in demand or technological change
Whilst Westcon takes steps to mitigate this risk by including protective provisions in its purchase agreements with vendors, there can be no assurance that such risks will be obviated.
Management of future growth and acquisition risk > The Group’s planned growth strategy will continue to place additional demand on the Group’s management, customer support, administrative and technological

Datatec Annual Report 2008
56
effectively, its business operations or financial conditions may deteriorate. To date, the business of the Group has
Group may have to decrease the value attributed to the
Payment discounts, product rebates and allowances > The Group receives significant benefits from purchase and prompt payment discounts, product rebates, allowances and other programmes from vendors based on various factors. A decrease in purchases and/or sales of a particular vendor’s products could negatively affect the amount of volume rebates the Group receives from such vendor. Because some purchase discounts, product rebates and allowances from vendors are based on percentage increases in purchases and/or sales of products, it may become more difficult for the Group to
larger discounts due to the current size of its revenue
from time to time from participation in some of their programmes.
Dependence on key personnel > The Group’s future success depends largely upon the continued employment
key employees have personal relationships with principal vendors and customers which are particularly important
senior management team and key technical personnel would be very difficult to replace and the loss of any of these key employees could harm the business and prospects of the Group.
Other risks faced by the Group include >
THE FUTURE > The continued management of risk will be critical in all markets. Our business units have delivered good results over the last number of years and despite widespread macro-economic concerns, we remain cautiously optimistic about the year ahead.
Ivan DittrichGroup Finance Director
Finance report CONTINUED

57
Datatec Annual Report 2008
Board Charter/Terms of reference
CONSTITUTION > The primary objective of the
MEMBERSHIP > The number of directors shall not be less than four directors and not more than 15. The appointment of directors shall be recommended by the
whole.
respectively.
Unless varied by these terms of reference, the appointment of directors will be governed by the articles of association
RESPONSIBILITIES OF THE BOARD > The Board will be responsible for, inter alia:
is planned.
and monitoring management in implementing Board plans and strategies.
management.
statements and all related information.
to conclude that the business will continue as a going concern in the financial year ahead or why it will not, and, in that case, what steps the Board is taking to remedy the situation.
to itself and delegating other matters with the necessary written authority to management.
accountability of assets.
loss.
internal control procedures.
are designed to provide reasonable, but not absolute, assurance as to the reliability of the financial statements.
laws, regulations and codes of business practice, and that it communicates with its shareholders and relevant
and with substance prevailing over form.
conflicts of interest, particularly relating to directors and management.
diversity and demographics makes it effective.
and authority on the Board, such that no individual or block of individuals can dominate the Board’s decision taking.
in the notice of the annual general meeting, or any other shareholder meeting, is accompanied by a full
directors should be present.
Board. The Board should have unrestricted access to all

Datatec Annual Report 2008
58
carried out.
The Board may delegate any of its responsibilities to committees of the Board.
MEETINGS >
Board considers appropriate, but it will normally not meet less than four times a year. Any Board member
conducted shall be given to members of the Board.
Board.
PROCEEDINGS AT MEETINGS >
and proceedings of the Board will be governed by the
meetings. These shall be reviewed and approved by the members of the Board.
GENERAL >
terms of reference, may obtain such outside or other independent professional advice as it considers necessary to carry out its duties.
have access to professional advice both inside and
its duties.
subject to the approval of the Board.
review by the Board.
Board Charter CONTINUED

59
Datatec Annual Report 2008
Corporate governance
The Group and its directors are fully committed to good corporate governance and to the principles of openness, integrity and accountability in dealing with shareholders and all other stakeholders. All directors
principles of corporate governance contained in the
COMPLIANCE WITH THE KING II REPORT AND THE COMBINED CODE > corporate governance is fundamental to the relationship
Throughout the year ended 29 February 2008 and up to the date of approval of this annual report and
complied with the provisions set out in Section 1 of
following matters:
during the year having previously operated as a
evaluation annually in October as noted in the annual report. Although it was not recorded in the 2007 annual report, the October 2006 evaluation concluded that all directors continued to be effective and those directors proposed for re-election at the annual general meeting in August 2007 were fully supported by the entire board. The resolutions proposed for re-election of directors at the 2008 annual general meeting will record the result of the annual assessment for the individual directors concerned.
BOARD OF DIRECTORS > At 29 February 2008, the
acumen to ensure impartial and objective viewpoints in decision-making processes and standards of conduct. The
financial and business skills of the directors to be balanced, thus enhancing the effectiveness of the Board.
the Board since 6 December 2001 and served in that role throughout the financial year ended 29 February 2008. Following Mr Boyd’s untimely death on 28 March
from the Board following the annual general meeting in August 2008 at which time the Board had intended to
a balance of authority and precludes any one director
The Board has appointed Nick Temple to be the senior
Board previously between May 1998 and September
continues to act in that role.

Datatec Annual Report 2008
60
Board and on 1 May 2008 took over from David Pfaff as Group finance director. Mr Pfaff has decided to resign from the Group in order to pursue new investment opportunities.
Following the changes in the directorate since 29 February 2008 the Board will consist of eight
directors. Full details of the directorate are set out on pages 16 and 17.
The Board retains full and effective control over the
and decisions in the subsidiary companies. The Board is responsible for the adoption of strategic plans, monitoring of operational performance and management, determination of policy and processes to ensure the integrity of the Group’s risk management and internal controls, communications policy, and director selection, orientation and evaluation. These responsibilities are set out in the approved Board
that they have adhered to the terms of reference as
ended 29 February 2008.
unrestricted access to timely financial information, all Group information, records and documents. During the year, the Board received presentations from the management teams of its major subsidiaries enabling it
depth. Directors are provided with guidelines regarding their duties and responsibilities as directors and a formal orientation programme has been established to
familiarise incoming directors with information about the Group’s business, competitive posture and strategic plans and objectives.
The Board meets at least four times a year and additional meetings are held when non-scheduled matters arise. At all Board meetings directors declare their interests in contracts where applicable.
Formal appraisal processes are in place to monitor Board performance. A Board self-assessment review is performed annually. At the same time assessments are performed on the committees of the Board, as well as the
of the directors retires by rotation each year and are eligible for re-election by shareholders at the annual general meeting. This year at the annual general meeting Mr Montanana and Mr Temple will retire by rotation and, being eligible, offer themselves for re-election. On
basis of the annual evaluation of the Board and of the performance of individual directors, the performance and commitment of Mr Montanana and Mr Temple throughout their periods of office were highly satisfactory. The appointment of new directors in the previous year is also the subject of ratification by shareholders annually
history with Datatec and an intimate understanding of the Group’s operations and businesses around the world, including all financial aspects. He is familiar
management of the Group, in addition to having gained
management, financial and corporate finance roles. The Board is of the opinion that Mr Dittrich will make a significant contribution to the Group. The Board strongly recommends the re-appointment of Mr Montanana, Mr Temple and Mr Dittrich and recommends shareholders vote in favour of their re-appointment at the annual general meeting.
Corporate governance CONTINUED
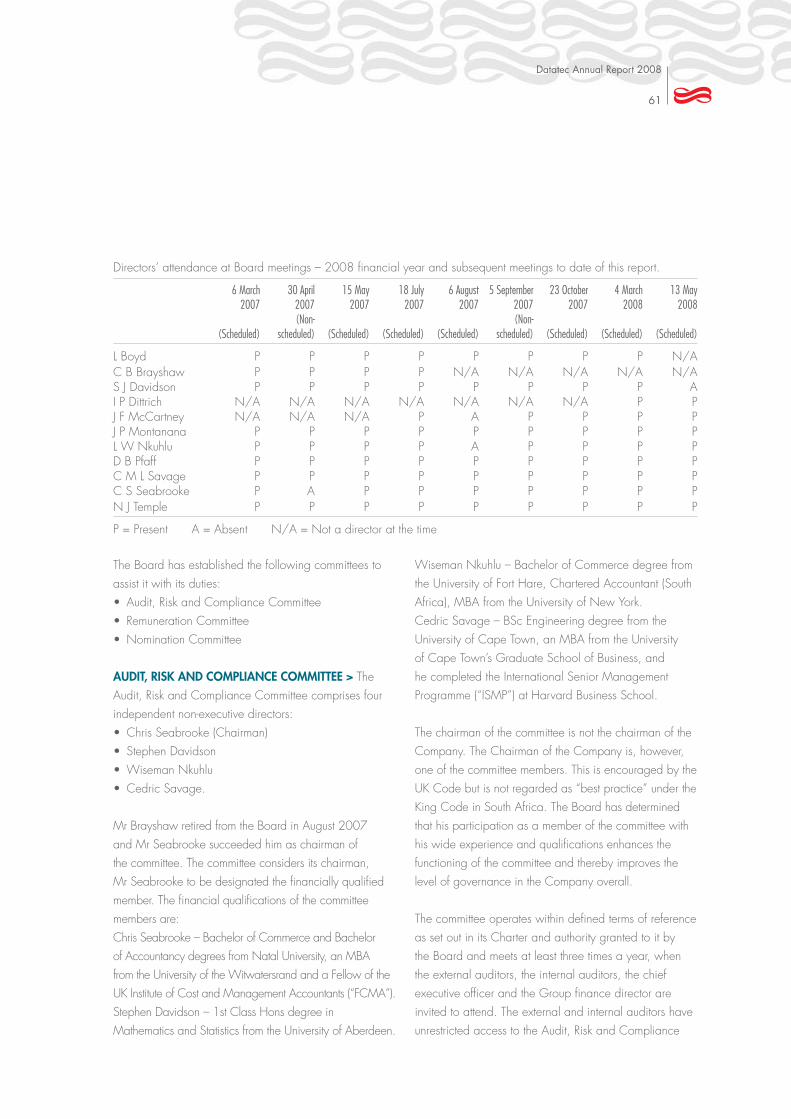
61
Datatec Annual Report 2008
6 March2007
(Scheduled)
30 April2007(Non-
scheduled)
15 May2007
(Scheduled)
18 July2007
(Scheduled)
6 August2007
(Scheduled)
5 September2007(Non-
scheduled)
23 October2007
(Scheduled)
4 March2008
(Scheduled)
13 May2008
(Scheduled)
L Boyd P P P P P P P P N/AP P P P N/A N/A N/A N/A N/A
S J Davidson P P P P P P P P AN/A N/A N/A N/A N/A N/A N/A P PN/A N/A N/A P A P P P P
J P Montanana P P P P P P P P PL W Nkuhlu P P P P A P P P PD B Pfaff P P P P P P P P P
P P P P P P P P PP A P P P P P P P
N J Temple P P P P P P P P P
P = Present A = Absent N/A = Not a director at the time
The Board has established the following committees to assist it with its duties:
AUDIT, RISK AND COMPLIANCE COMMITTEE > The
Mr Brayshaw retired from the Board in August 2007 and Mr Seabrooke succeeded him as chairman of the committee. The committee considers its chairman,
members are:
of Accountancy degrees from Natal University, an MBA from the University of the Witwatersrand and a Fellow of the
Mathematics and Statistics from the University of Aberdeen.
The chairman of the committee is not the chairman of the
one of the committee members. This is encouraged by the
that his participation as a member of the committee with
functioning of the committee and thereby improves the
The committee operates within defined terms of reference
the Board and meets at least three times a year, when

Datatec Annual Report 2008
62
without management present, at least once a year.
The committee is satisfied that it has met its responsibilities for the year with respect to its terms of reference. The committee’s charter is available on the Group’s website (www.datatec.co.za) or from the company secretary.
The principal functions of the committee are to review the annual financial statements, the half-yearly results announcement, monitor the effectiveness of internal controls, assess the risks facing the business, discuss the findings and recommendations of the internal and
plans and to review the effectiveness of the internal and
on the committee’s activities at each Board meeting.
Westcon Group has its own separate audit committee
committee are submitted to, and form part of, the documentation made available to the Datatec Audit,
operating subsidiary companies have financial review and compliance committees. Full reports from these sub-committees are submitted to the Datatec Audit, Risk and
an audit committee in respect of these subsidiaries. The
is invited to attend the sub-committee meetings.
there is appropriate independence relating to non-audit
audit services including valuation and accounting work where its independence might be compromised by later auditing its own work. Other non-audit services provided
approved by the chairman of the committee or by the full
the audit fee.
audit partner and those of South African subsidiaries every five years and the other subsidiary audit partners every seven years. The committee has adopted the same policy.
The committee assists the Board in reviewing the risk management process and significant risks facing the Group. The committee sets the Group’s risk strategy
management, making use of generally recognised risk management and internal control models and frameworks in order to maintain a sound system of risk management and internal control as described later in this report.
Corporate governance CONTINUED
meetings to date of this report.
26 April2007
(Non-scheduled)
10 May2007
(Scheduled)
11 October2007
(Scheduled)
8 February2008
(Scheduled)
8 May2008
(Scheduled)
P P N/A N/A N/AS J Davidson P P P P PL W Nkuhlu A P P P P
P P P P PP P P P P
P = Present A = Absent N/A = Not a member of the committee at the time

63
Datatec Annual Report 2008
The committee identifies and monitors, at least annually, key performance indicators and key risks, including operational, physical, human resources, technology, continuity, credit, market and compliance risks.
will be available at the annual general meeting to answer
REMUNERATION COMMITTEE > The Remuneration
Stephen Davidson assumed the role of chairman of the
The committee operates within defined terms of reference as set out in its charter, and authority granted to it by the Board and meets at least three times a year. The chief
invited to attend these meetings, but neither may take any part in decisions regarding their own remuneration.
The committee is satisfied that it has met its responsibilities for the year with respect to its terms
of reference. The committee’s charter is available on the Group’s website (www.datatec.co.za) or from the company secretary.
The committee is responsible for making recommendations to the Board on the Group’s
directors and certain senior managers of the Group. The committee is also responsible for the Group’s remuneration policies and the allocation of share-based payments in terms of the Group’s share-based incentive schemes.
recommended by the Board and ratified by shareholders at the annual general meeting. Full disclosure of individual directors’ remuneration appears on page 77.
The chairman of the committee will be available at the
committee’s work.
NOMINATION COMMITTEE > The Nomination
this report.
6 March2007
15 May2007
18 July2007
23 October2007
4 March2008
8 May2008
L Boyd P P P P P N/AS J Davidson P P P P P P
N/A N/A P A P PP P P P P P
N J Temple P P P P P A
P = Present A = Absent N/A = Not a member of the committee at the time
Refer to remuneration report on pages 68 to 81.

Datatec Annual Report 2008
64
Stephen Davidson assumed the role of chairman of the
The committee operates within defined terms of reference as set out in its charter, and authority granted to it by
invited to attend these meetings, but neither may take any part in decisions regarding their own succession.
The committee is satisfied that it has met its responsibilities for the year with respect to its terms of reference. The committee’s charter is available on the Group’s website (www.datatec.co.za) or from the company secretary.
The committee is responsible for making recommendations
on the composition of the Board generally. Director appointments are formal and transparent. The chairman of the committee reports on the committee’s activities at each Board meeting.
The chairman of the committee will be available at the
committee’s work.
of this report.
6 March2007
23 October2007
4 March2008
L Boyd P P PS J Davidson P P P
N/A A PP P P
N J Temple P P P
P = Present A = AbsentN/A = Not a member of the committee at the time
COMPANY SECRETARY > All directors have access to the advice and services of the company secretary and are entitled and authorised to seek independent and professional advice about affairs of the Group at the
Act. Datatec Management Services (Pty) Limited, a South African company, is the legal entity which is the company secretary. This company is managed by Simon
subsection (d) of the Act appears on page 88.
RISK MANAGEMENT > Datatec’s Board is responsible for the total process of risk management and has established an ongoing process for identifying, evaluating and managing the significant risks faced by the Group. The Board and the Audit, Risk and
activities as a standard item on its agenda and actively participate in discussions around risk topics raised.
Each of the significant subsidiaries of Datatec regularly reviews their strategic risks and has followed a consistent
according to standard risk rating guidelines based on
defined in terms of the following assessment criteria:
ratings are defined in terms of the overall likelihood of a risk materialising. These criteria formed the basis for
High-risk areas are further analysed to identify potential root causes. This allows Datatec to:
and
organisational control.
Corporate governance CONTINUED

65
Datatec Annual Report 2008
Mitigating actions and associated monitoring/assurance
identified to monitor and manage specific risk areas on
The Group reports annually on key risk areas identified by the risk assessment processes described above in the Finance Report – see page 55.
FINANCIAL AND INTERNAL CONTROL > The Board has
management and internal control throughout the financial year under review and up to the date of approval of the annual report and accounts in accordance with the revised guidance. The Group’s internal control and accounting systems are designed to provide reasonable, but not absolute, assurance as to the integrity and reliability of the financial information and to safeguard, verify and maintain accountability of its revenues and assets. These controls are implemented and maintained by skilled company personnel.
Board is able to report that procedures are in place for monitoring and evaluating the effectiveness of the internal
submit control self-assessment programmes annually and management is monitored against internal control norms in other Group companies. Action is taken where ratings
Nothing came to the attention of the directors or arose out of the internal control self-assessment process, internal
material breakdown in the functioning of the Group’s internal controls, procedures and systems had occurred during the course of the year.
in the major subsidiaries which will allow these subsidiaries to continue their critical business processes
in the event of a disastrous incident impacting their activities. Such documented procedures are reviewed
subsidiaries are in the process of ameliorating them.
INTERNAL AUDIT >
the activities and the appropriateness of the systems of internal control, risk management and governance processes. Datatec has outsourced the internal audit
operates within defined terms of reference as set out in its charter, and authority granted to it by the Audit, Risk
audit has met its responsibilities for the year with respect to its terms of reference.
secretary on day-to-day matters, and to the chairman of the
involving an independent review of the Group’s own risk assessments. The internal audit team attends and presents its
The objective of internal audit is to assist the Board in the effective discharge of its responsibilities.
MANAGEMENT REPORTING > The Group has established management reporting disciplines which include the preparation of annual budgets by operating entities. Monthly results and the financial status of operating entities are reported against approved budgets. Profit projections and cash flow forecasts are reviewed regularly, while working capital and borrowing levels are monitored on an ongoing basis.
EMPOWERMENT AND EMPLOYMENT EQUITY > Datatec places particularly high value on the abilities and contributions made by employees in the development and achievements of its businesses.

Datatec Annual Report 2008
66
employer. The Group strives to afford all staff members opportunities to realise their full potential and advance their careers. The Group is committed to a working environment that is free from any discrimination and seeks to develop skills and talent inherent in its work force.
The Group is open to new partnerships that will increase shareholder value as well as plough back skills and resources into the South African community and into the local communities round the world in which Group companies operate.
All the South African operations have committed themselves to a transformation process designed to minimise barriers to
The Group’s social responsibility activities are detailed on page 82.
ORGANISATIONAL INTEGRITY AND ETHICS > The Group operates on a basis of decentralised management
been approved by the directors and has been rolled
maintain the highest level of ethical standards in ensuring that the Group’s business practices are conducted in a manner that, in all circumstances, is above reproach. The
been met during the year under review.
Datatec maintains a performance-driven culture of full disclosure and transparency in which individual employees assume responsibility for the actions of the business. The integrity of new appointees is assessed in the selection and promotion process and the basis
entrenched in the company culture.
All employees of the Group have been notified of a
available to call to report anonymously any matter of concern. Any significant matter reported in this way is
No significant matters were reported on the whistle-blowing hotline during the year under review.
SAFETY, HEALTH AND ENVIRONMENT > A formal safety, health and environmental policy has been implemented and approved by the Board.
Datatec recognises its obligation to reduce the risk of injury in the working environment and to supply a clean and safe workplace. The Group undertakes to comply with health and safety regulations as set in the jurisdictions in which the Group operates around
subsidiaries have individual health and safety policies.
Although the Group operates in a predominantly office and warehouse-based environment the Group recognises its responsibility to safeguard the environment in the course of conducting business operations. Where applicable each operating subsidiary has its own environmental policy.
Datatec has set the following environmental objectives to be applied across the Group using best practice in environmental management. The Group will:
issues.
possible.
by active involvement.
Corporate governance CONTINUED

67
Datatec Annual Report 2008
SHARE DEALINGS > code to regulate dealings by its directors and applicable
No Group director or employee may deal, directly or indirectly, in Datatec shares or warrants on the basis of previously unpublished, price-sensitive information.
Restrictions are imposed upon directors and senior management in the trading of Datatec shares and warrants and upon all employees regarding the
corporate governance, the Datatec Remuneration
or when in possession of unpublished price-sensitive or inside information relating to Datatec. The closed periods include the periods between Datatec’s interim and financial year-end reporting times and the dates on which the relevant results are published, and any time when Datatec is trading under a cautionary announcement.
Employees may nonetheless on application, and at the
their share options while Datatec is trading under a cautionary announcement provided that the JSE Listings
they are not in possession of unpublished price-sensitive or inside information relating to Datatec.
options during a period of one month prior to the starting date of such a closed period. This concession has been made in accordance with clause 5.8.1 of the Datatec Share Option Scheme whereby “the directors shall be entitled if in their opinion special circumstances exist and in
consequence of which they consider it reasonable to permit the exercise of the option (in whole or in part) prior to the date on which it could be otherwise exercised, to permit such exercise”. No employee shall, however, be permitted
price-sensitive or inside information relating to Datatec.
INVESTOR RELATIONS AND SHAREHOLDER COMMUNICATION > Datatec is committed to providing timely, transparent and full disclosure to all its stakeholders on both financial and non-financial matters.
The Group maintains a dialogue with its institutional shareholders via a planned programme of
and the Group Finance Director together with nominated investor relations management. These activities include regular meetings and presentations to analysts, institutional
as well as biannual meetings with institutional investors after the release of the Group’s interim and final results.
The Group’s website (www.datatec.co.za) provides current and historical financial and other information on the Group including formal announcements, presentations, webcasts as well as annual reports. Datatec also disseminates information to stakeholders who subscribe to the Group’s investor relations programme on the website. Press releases, announcements and notifications are distributed via email to subscribers as soon as they become publicly available.
Shareowners and their appointed representatives are encouraged to attend Datatec’s annual general meeting, to vote on the resolutions placed before the meeting and to conduct relevant discussions with the Group’s directors. As noted above, the chairmen of the
annual general meeting and are available to answer
GOING CONCERN > The directors’ assessment on the Group as a going concern is set out on page 91.

Datatec Annual Report 2008
68
The Board has delegated responsibility for remuneration
principles that determine the remuneration of the
committee has taken into account the provisions and
which has been approved by the Board.
the 2008 financial year was:
16 July 2007).
Director may be invited to attend meetings of the
in any discussions regarding their own remuneration.
REMUNERATION PHILOSOPHY > The Remuneration
which it has set the remuneration package for each
rewarded for their contribution to the Group’s operating and financial performance at levels which take account of the
performance linked share-based incentives are considered
The basic objective of the policies is that the
is appropriate to their scale of responsibility and performance and which will attract, motivate and retain individuals of the necessary calibre. The underlying
base pay above median levels by comparison with relevant comparator companies and to provide the
necessity of being competitive in the different parts of the world in which the Group operates, particularly the
SUMMARY OF REMUNERATION > The remuneration
main ingredients designed to balance long- and short-
the form of share-based incentive schemes (also with performance targets). The last two elements are designed to encourage and reward superior performance and to
receive retirement and other benefits as outlined below.
BASE SALARY > directors is subject to annual review and is set with
ANNUAL BONUS PLAN > participate in an annual bonus plan based on the achievement of short-term performance targets set for
of corporate performance (HEPS, PBT and operating cash flow), share price performance, divisional objectives (where applicable) and the achievement of individual objectives. These targets are reviewed
base salary for the Group Finance Director.
Remuneration report

69
Datatec Annual Report 2008
OTHER BENEFITS > pensions, the provision of car allowances or a fully maintained car, medical insurance and death and disability insurance. The total value of benefits received by each director is shown on page 77.
During the financial year under review the Group contributed
J P Montanana and D B Pfaff to private pension schemes, with the individuals contributing 5% of their salary.
SHARE-BASED REMUNERATION > Datatec operates the
Group employees:
Before the introduction of these schemes in August 2005 share options were granted to Group and subsidiary employees under the Datatec Share Option Scheme.
dilution effect is included in the diluted earnings per share figure. Details of these schemes are given below.
Datatec’s subsidiaries operate a number of cash-settled share-based incentive schemes for their senior employees. Summaries of these schemes are also provided below.
THE DATATEC LIMITED SHARE APPRECIATION RIGHTS SCHEME 2005 (“SARS”) > Eligible employees may receive annual grants of Share Appreciation Rights (SARs),
Vesting of the SAR is subject to performance conditions. The duration and specific nature of the performance conditions and performance period are stated in the letter of grant. The condition that has been imposed for all grants of SARs to date is that HEPS must increase by two
inflation over a three-year performance period. Retesting of the performance conditions is permitted on the first and second anniversary of the end of the performance period (i.e. years 4 and 5). For the initial, 2005, SARs awards, a pro-forma HEPS base of 15 US cents was implemented, as opposed to the actual HEPS base of 4 US cents. Therefore
period will be applied to a base HEPS of 15 US cents, before the SARs will vest. For the 2006 and 2007 SARs awards the actual HEPS base of 26,9 US cents and 40,8 US cents, respectively, were used.
letter of grant, will lapse.
Details of the three issues under the Datatec Limited SARs Scheme made to date are given below:
Datatec Limited Share Appreciation Rights Scheme 2008 2007 2006
Date of issue17 May
200717 May
200616 August
2005
Number of SARs issued 345 405 326 418 579 228 Number of SARs lapsed since issue (70 031) (46 849) (75 245)
Number of SARs remaining in issue at 29 February 2008 275 374 279 569 503 983
Number of eligible employees to whom SARs were issued 7 5 5Number of lapsed holdings of SARs (1) (1) (2)Number of employees remaining entitled to SARs at 29 February 2008 6 4 3
Grant price (Rand) 38,64 22,79 13,76Life 7 years 7 years 7 years

Datatec Annual Report 2008
70
The SARs in issue during the year ended 29 February
weighted average shares for the year.
of Datatec SARs was made to five key employees of
by Westcon. 272 925 SARs were granted at a price of
shares at the time of issue). These SARs vest one-third on issue, one-third on the first anniversary of issue and
three years after vesting. Vesting of the second and third
division meeting certain performance criteria.
Refer to the limits for the SARS below.
THE DATATEC LIMITED LONG-TERM INCENTIVE PLAN 2005 (“LTIP”) > Eligible employees receive annual grants of conditional awards.
The conditional awards will vest after the performance
conditions have been satisfied. The duration and specifics of the performance condition and performance period are stated in the letter of grant. The intended performance period is three years. The performance condition that is
relative to the TSR of an international peer group. No retesting of the performance condition will be allowed.
The performance condition will determine if, and to what
portion of the award. The conditional awards which do not vest at the end of the three-year performance period will lapse.
conditional awards in issue during the year ended 29 February 2008 constitutes a 0,28% dilution of the
preceding the issue date, holding the shares, and reinvesting
shares, until 28 February three years later, and then selling the portfolio on that day. The TSR calculation will be
on the nearest trading day following the start and the nearest trading day following the end of the three-year period, and
be smoothed by computing the TSR in the same manner for
months preceding 28 February in each year of issue.
Subject to the participant remaining in the employment of
TSR condition will lapse and will be of no further force
and ranks greater than the median of the peer group,
TSR condition, which becomes unconditional and will vest, will be linearly apportioned as the ranking of
subject to the TSR condition will lapse and will be of
Remuneration report CONTINUED
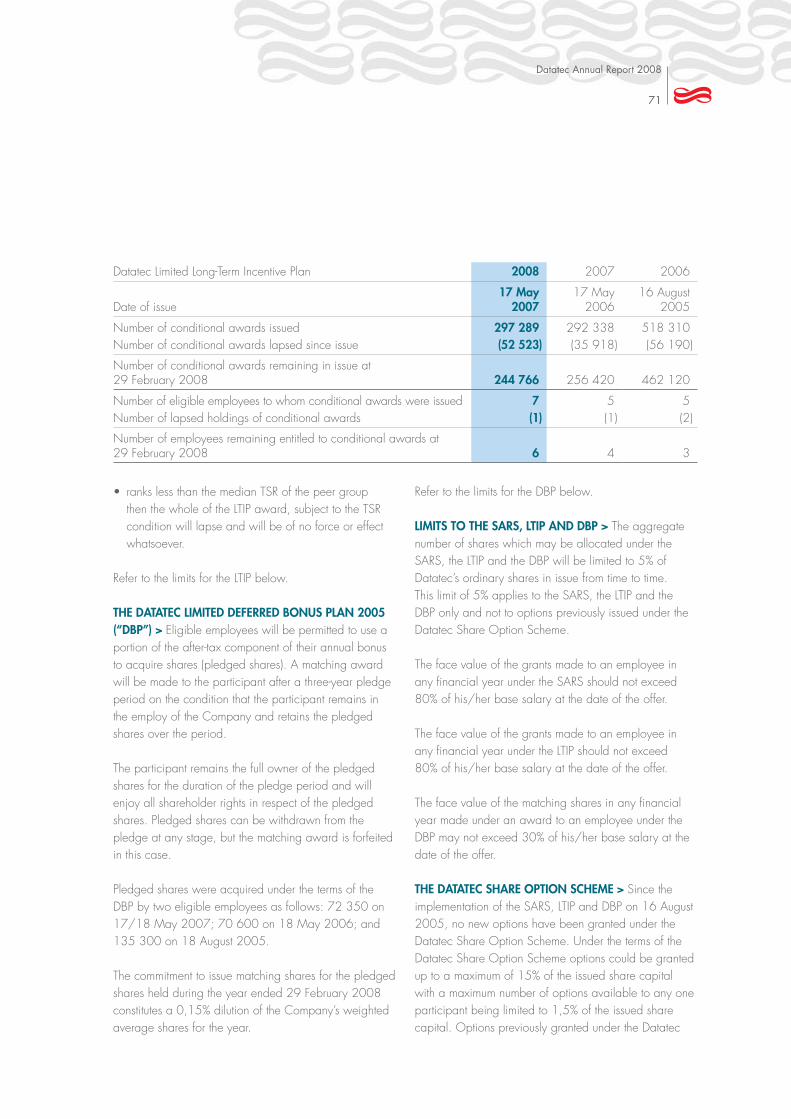
71
Datatec Annual Report 2008
condition will lapse and will be of no force or effect whatsoever.
THE DATATEC LIMITED DEFERRED BONUS PLAN 2005 (“DBP”) > Eligible employees will be permitted to use a
will be made to the participant after a three-year pledge period on the condition that the participant remains in
shares over the period.
The participant remains the full owner of the pledged shares for the duration of the pledge period and will enjoy all shareholder rights in respect of the pledged shares. Pledged shares can be withdrawn from the pledge at any stage, but the matching award is forfeited in this case.
DBP by two eligible employees as follows: 72 350 on
135 300 on 18 August 2005.
The commitment to issue matching shares for the pledged shares held during the year ended 29 February 2008
average shares for the year.
Refer to the limits for the DBP below.
LIMITS TO THE SARS, LTIP AND DBP > The aggregate number of shares which may be allocated under the
Datatec’s ordinary shares in issue from time to time.
DBP only and not to options previously issued under the Datatec Share Option Scheme.
The face value of the grants made to an employee in
80% of his/her base salary at the date of the offer.
The face value of the grants made to an employee in
80% of his/her base salary at the date of the offer.
The face value of the matching shares in any financial year made under an award to an employee under the
date of the offer.
THE DATATEC SHARE OPTION SCHEME > Since the
2005, no new options have been granted under the Datatec Share Option Scheme. Under the terms of the Datatec Share Option Scheme options could be granted
participant being limited to 1,5% of the issued share capital. Options previously granted under the Datatec
2008 2007 2006
Date of issue17 May
200717 May
200616 August
2005
Number of conditional awards issued 297 289 292 338 518 310 Number of conditional awards lapsed since issue (52 523) (35 918) (56 190)
Number of conditional awards remaining in issue at 29 February 2008 244 766 256 420 462 120
Number of eligible employees to whom conditional awards were issued 7 5 5Number of lapsed holdings of conditional awards (1) (1) (2)
Number of employees remaining entitled to conditional awards at 29 February 2008 6 4 3

Datatec Annual Report 2008
72
Share Option Scheme will run their course in terms of the rules of the scheme. Options were granted to employees
the 30 day average closing market price prior to the date of such grant (always subject to a minimum price of 2,00 ZAR).
Options vest over a period of four years from the date on which the option was granted at the rate of 25% per annum at each anniversary of the date of grant. Options
granted, unless such option lapses through the death or termination of employment of the option holder.
As at 29 February 2008 10 546 654 (2007: 8 321 878) share options had been
(2007: 6 187 158) share options had been granted
Number of holders
Number of options
Option price per share
129 1 821 485 R5 – R10216 1 049 180 R10 – R2022 104 400 R20 – R3077 418 719 R30 – R4094 429 323 R40 – R504 13 000 R50 – R603 2 700 R60 – R707 4 700 R70 – R80
12 30 650 R80 – R90
564 3 874 157
WESTCON GROUP, INC. SHARE INCENTIVE PLAN (“THE WESTCON PLAN”) > The Westcon Plan has been in operation since January 2001 and provides
share options and share appreciation rights for the purchase of up to 23 300 Westcon common shares to employees, directors (other than directors who serve on the compensation committee), consultants and other advisers to Westcon. Grants of share appreciation rights allow the holder to receive a payment based on the appreciation of Westcon’s common stock.
Westcon’s board of directors has authorised the Westcon compensation committee to administer the Westcon Plan. The compensation committee determines the estimated
value of a Westcon ordinary share on the date of grant. Share options granted under the Westcon Plan are
of employment due to death or total disability, and for three months after other terminations of employment other than just cause. For share appreciation rights granted under the plan, termination due to death, disability or retirement results in immediate redemption of any vested but unredeemed share appreciation rights. Under any other separation of service all vested and unvested share appreciation rights will immediately terminate.
The Westcon Plan provides that in the event of a merger, consolidation, or sale of, all or substantially all of the assets of Westcon, or upon a dividend or other distribution, recapitalisation, share split or other similar corporate transaction, as more fully described in the Westcon Plan, the compensation committee may adjust: the number and type of shares (or other securities) that
and the number and type of shares (or other securities) covered by each outstanding grant. The Westcon board of directors may suspend, amend or terminate the Westcon Plan at any time. However, unless approved by a majority of Westcon shareholders, no amendment
no termination of the Westcon Plan or action by the Westcon board of directors in amending or suspending the Westcon Plan will affect or impair the rights of an option holder under any share option or share appreciation right previously granted.
Share appreciation rights issued in the years ended
Remuneration report CONTINUED

73
Datatec Annual Report 2008
instalments over three years from the date of grant, are
three years beginning with the date of each vesting
five years from the date of grant.
Westcon Group options included below from a former employee of Westcon Group.
As of 29 February 2008 4 917 shares were available for future grants. Of the share options outstanding as of
the completion of an initial public offering of Westcon’s common shares. Additionally, if there is a change in control prior to an initial public offering of Westcon’s common shares, the vested share options and share
appreciation rights, as well as one-half of the unvested share appreciation rights, will be redeemed and paid based on the appreciation, if any, of Westcon’s common shares.
THE LOGICALIS GROUP CASH-SETTLED SHARE APPRECIATION RIGHT SCHEME 2005 (“THE LOGICALIS SAR SCHEME”) > Under the terms of the Logicalis SAR Scheme, SARs are granted annually to senior managers. The scheme is cash-settled which
liability to the valuation share price and to establish both
for vested SARs. Fifty percent of the SARs vest after 24 months and the remainder after 36 months. All rights
issue. There are certain headline earnings performance conditions which govern the vesting of each award.
2008 2007 2006
Date of issue1 June 2007
1 June 2006
2006and prior
Number of SARs/options issued 2 506 2 145 22 561– (116) (1 181)
Number of SARs/options lapsed since issue (480) (318) (11 958)
Number of SARs/options remaining in issue at 29 February 2008 2 026 1 711 9 422Number of eligible employees to whom SARs/options were issued 27 22 214Number of lapsed holdings of SARs/options (3) (2) (42)
Number of employees remaining entitled to SARs/options at 29 February 2008 24 20 172
Grant price (US$) 2 590,00 1 990,00 1 171,62Grant as a percentage of Westcon Group’s issued share capital 1,13% 0,97% 10,23%Life 10 years 10 years 10 years

Datatec Annual Report 2008
74
Details of the three annual grants of SARs under the Logicalis SAR Scheme made to date are given in the table below:
Logicalis Group Share Appreciation Rights Scheme 2008 2007 2006
Date of issue1 July2007
1 July2006
1 July2005
Number of SARs issued 835 750 1 100 000 1 250 000 Number of SARs lapsed since issue – (62 500) (65 000)
– – (155 000)
Number of SARs remaining in issue at 29 February 2008 835 750 1 037 500 1 030 000
Number of eligible employees to whom SARs were issued 31 43 21Number of lapsed holdings of SARs – (5) (3)
Number of employees remaining entitled to SARs at 29 February 2008 31 38 18
Grant price (US$) 3,82 3,00 2,095Grant as a percentage of Logicalis Group’s issued share capital 1,16% 1,53% 1,74%Life 5 years 5 years 5 years
ANALYSYS MASON SHARE BASED REMUNERATION > During the year ended 29 February 2008, Analysys Mason introduced a performance share plan to replace a performance warrant scheme and a shadow option scheme under the terms of which share-based remuneration had been granted in previous years. Details of the grants under these schemes are given in the table below.
Analysys Mason share-based incentive schemes 2008 2007 2006 2005
Date of issue1 June2007
23 August2006
17 August2005
23 December2004
Number of awards issued 44 984 25 900 37 480 12 516Number of awards lapsed since issue (5 755) (10 700) (12 820) (7 450)
Number of awards remaining in issue at 29 February 2008 39 229 15 200 24 660 5 066
Number of eligible employees to whom awards were issued 67 35 72 42Number of lapsed holdings of awards (9) (14) (31) (25)
Number of employees remaining entitled to awards at 29 February 2008 58 21 41 17
Grant price (GBP) 21,72 22,45 18,00 11,86Grant as a percentage of Analysys Mason’s issued share capital 2,25% 1,29% 1,90% 0,63%Life 3 years 4 years 4 years 4 years
Remuneration report CONTINUED

75
Datatec Annual Report 2008
THE WESTCON SA CASH-SETTLED SHARE APPRECIATION RIGHT SCHEME 2006 (“THE WESTCON SA SAR SCHEME”) > Under the terms of the Westcon SA SAR Scheme, SARs are granted annually to senior
valuation of Westcon SA (and agreed other entities under management control) to mark the liability to the valuation share price and to establish both a grant price
The SARs vest three years after the grant date. All rights
issue. There are certain headline earnings performance conditions which govern the vesting of each award.
Westcon SA Share Appreciation Rights Scheme 2008 2007
Date of issue17 May
200717 May
2006
Number of SARs issued 22 500 25 000Number of SARs lapsed since issue – –
Number of SARs remaining in issue at 29 February 2008 22 500 25 000
Number of eligible employees to whom SARs were issued 14 4Number of lapsed holdings of SARs – –
Number of employees remaining entitled to SARs at 29 February 2008 14 4
Grant price (ZAR) 74,71 39,73Grant price as a percentage of Westcon SA notional share capital 2,25% 2,5%Life 5 years 5 years
THE ONLINE DISTRIBUTION CASH-SETTLED SHARE APPRECIATION RIGHT SCHEME 2006 (“THE ONLINE SAR SCHEME”) > Under the terms of the OnLine SAR Scheme, SARs are granted annually to senior managers.
OnLine to mark the liability to the valuation share price and to establish both a grant price for new awards and
by the end of the fifth year after issue. There are certain headline earnings performance conditions which govern the vesting of each award.
Online Distribution Share Appreciation Rights Scheme 2008 2007
Date of issue17 May
200717 May
2006
Number of SARs issued 17 000 20 000Number of SARs lapsed since issue (3 600) (2 900)
Number of SARs remaining in issue at 29 February 2008 13 400 17 100
Number of eligible employees to whom SARs were issued 11 7Number of lapsed holdings of SARs (3) (2)
Number of employees remaining entitled to SARs at 29 February 2008 8 5
Grant price (US$) 19,70 16,18Grant as a percentage of OnLine notional share capital 1,7% 2,0%Life 5 years 5 years

Datatec Annual Report 2008
76
NON-EXECUTIVE DIRECTORS’ REMUNERATION >
directors received fees as approved by the 2007 annual general meeting as follows:
remuneration above will also apply for the year ending 28 February 2009.
The terms and conditions of appointment of
company secretary.
EXTERNAL APPOINTMENTS > Subject to the approval
a directorship in one non-Group listed company and to retain the fees payable from this appointment.
company which provides hardware and software technology to enable transaction-based business solutions based on its series of proprietary software
Mr Montanana has held this directorship since 1998 and does not receive any remuneration for his services. He holds 2 578 571 shares and 125 000 share
DIRECTORS’ SERVICE CONTRACTS >
directors have employment contracts as follows:
Holdings Limited. The employment contracts of all
by either party.
directors retire in accordance with the articles of
Retiring directors may offer themselves for re-election.
Remuneration report CONTINUED

77
Datatec Annual Report 2008
DIRECTORS’ EMOLUMENTS > for individual directors who held office during the financial years ended 29 February 2008 and 28 February
have independently confirmed the emoluments disclosed below. Please refer to page 80 for details of directors’ share-based incentive awards.
Year ended 29 February 2008 – US$
Basic salary Bonus Fees* Pension Other
benefits Total
Executive directors J P Montanana 1 052 000 893 279 164 250 48 639 2 158 168D B Pfaff 532 630 270 450 79 895 28 365 911 340
Total executive directors 1 584 630 1 163 729 244 145 77 004 3 069 508
Non-executive directorsL Boyd 137 500 137 500
36 694 36 694S J Davidson 95 287 95 287
42 049 42 049L W Nkuhlu 70 000 70 000
70 000 70 00097 104 97 104
N J Temple 82 500 82 500
Total non-executive directors 631 134 631 134
Total directors’ emoluments 1 584 630 1 163 729 631 134 244 145 77 004 3 700 642
US$205 649 of the emoluments referred to above have been paid by Datatec Limited andUS$3 494 993 have been paid by subsidiaries of Datatec Limited.*Fees as directors and committee fees.

Datatec Annual Report 2008
78
Year ended 28 February 2007 – US$
Basic salary Bonus Fees* Pension Other
benefits Total
Executive directors J P Montanana 1 004 577 758 419 125 572 2 239 1 890 807D B Pfaff 451 684 341 110 56 461 4 914 854 169
Total executive directors 1 456 261 1 099 529 182 033 7 153 2 744 976
Non-executive directorsL Boyd 105 000 105 000
70 000 70 000S J Davidson – from 1 February 2007 5 625 5 625L W Nkuhlu – from 1 September 2006 28 750 28 750
57 500 57 50075 000 75 000
N J Temple 60 000 60 000
Total non-executive directors 401 875 401 875
Total directors’ emoluments 1 456 261 1 099 529 401 875 182 033 7 153 3 146 851
US$223 456 of the emoluments referred to above have been paid by Datatec Limited andUS$2 923 395 have been paid by subsidiaries of Datatec Limited.*Fees as directors and committee fees.
Remuneration report CONTINUED

79
Datatec Annual Report 2008
DIRECTORS’ SHARE INTERESTS > The interests of directors who held office at 29 February 2008 in ordinary shares
2008Direct
beneficial beneficial Associates Total
Executive directorsJ P Montanana 7 500 000 3 829 467 – 11 329 467D B Pfaff 23 000 78 250 65 000 166 250
Non-executive directorsL Boyd 13 000 – – 13 000S J Davidson – – – –
233 000 233 000L W Nkuhlu 300 – – 300
– – – –– – 550 000 550 000
N J Temple – – – –
Total 7 769 300 3 907 717 615 000 12 292 017
over Datatec shares with a strike price of R35,00 per option which he purchased on 7 February 2008: 500 000
premium of R5,86 per option.
During the financial year, Mr Montanana sold 300 000 three-year American call options over Datatec shares with a strike price of R9,48 per option which he had purchased on 28 February 2005 at a premium of R4,32 per option.
When he was appointed a director on 1 March 2008, Mr Dittrich held no Datatec shares.
2007Direct
beneficial beneficial Associates Total
Executive directorsJ P Montanana 7 500 000 2 977 058 – 10 477 058D B Pfaff 23 000 55 900 65 000 143 900
Non-executive directorsL Boyd 13 000 – – 13 000S J Davidson – – – –L W Nkuhlu 300 – – 300
– – – –– – 550 000 550 000
N J Temple – – – –
Total 7 536 300 3 032 958 615 000 11 184 258
At the date of this annual report, there have been no changes to the total shareholding of the current directors of the

Datatec Annual Report 2008
80
DIRECTORS’ SHARE-BASED INCENTIVES > Directors holding office at 29 February 2008 held the following Datatec share options (under the Datatec Scheme):
Grant dateprice(ZAR)
Options heldat beginning
of year
Granted during
the yearduring
the year
Optionsheld at
year-end
J P Montanana 2000-12-11 35,46 200 000 – – 200 000 2001-12-10 10,96 700 000 – 700 000 –2002-11-21 7,44 202 369 – 202 369 –2003-11-24 8,88 350 000 – – 350 0002004-12-10 9,69 350 000 – – 350 000
Sub-total 1 802 369 – 902 369 900 000
2002-03-14 18,06 125 000 – 125 000 –
Sub-total 125 000 – 125 000 –
D B Pfaff 2001-12-10 10,96 200 000 – – 200 000 2002-11-21 7,44 312 639 – 312 639 –2003-11-24 8,88 175 000 – – 175 0002004-12-10 9,69 175 000 – – 175 000
Sub-total 862 639 – 312 639 550 0001997-10-29 14,25 40 000 – 40 000 – 2002-03-14 18,06 80 000 – 80 000 –
Sub-total 120 000 – 120 000 –
Total 2 910 008 – 1 460 008 1 450 000*Appointed as a director on 16 July 2007.
Option Scheme.
Mr Dittrich held the following share options when he was appointed a director on 1 March 2008: 12 670 at a
Remuneration report CONTINUED

81
Datatec Annual Report 2008
Directors holding office at 29 February 2008 held the following share appreciation rights (under the SARS):
Grant dateprice(ZAR)
Awards heldat beginning
of year
Grantedduring
the year
Forfeitedduring
the year
Awardsheld at
year-end
J P Montanana 2005-08-16 13,76 330 669 – – 330 669 2006-05-17 27,22 187 482 – – 187 4822006-05-17 38,64 – 157 617 – 157 617
Sub-total 518 151 157 617 – 675 768
D B Pfaff 2005-08-16 13,76 132 267 – – 132 267 2006-05-17 27,22 74 963 – 24 988 49 9752007-05-17 38,64 – 75 543 50 362 25 181
Sub-total 207 230 75 543 75 350 207 423
Total 725 381 233 160 75 350 883 191
Mr Dittrich held the following share appreciation rights when he was appointed a director on 1 March 2008: 41 047
Grant date
Awards heldat beginning
of year
Granted during
the year
Forfeited during
the year
Awardsheld at
year-end
J P Montanana 2005-08-16 330 669 – – 330 669 2006-05-17 187 482 – – 187 4822007-05-17 – 157 617 – 157 617
Sub-total 518 151 157 617 – 675 768
D B Pfaff 2005-08-16 99 201 – – 99 2012006-05-17 56 222 – 18 741 37 481 2007-05-17 – 56 657 37 771 18 886
Sub-total 155 423 56 657 56 512 155 568
Total 673 574 214 274 56 512 831 336
of US$2 590 per share.

Datatec Annual Report 2008
82
Datatec’s origins are firmly entrenched in South Africa and the company has always been conscious of its responsibilities towards the community and economy that fostered its initial growth. The Datatec Educational
to support educational organisations with a specific focus on uplifting the standard and talent in the fields of mathematics, science and technology within previously disadvantaged communities.
Trust has actively supported the following initiatives:
CENTRE FOR INNOVATION >
brings mathematics, science, entrepreneurship and computer skills training to local schools and communities. The centre is also used by Protec, a national organisation involved in technology skills training within disadvantaged communities.
THE MATHS CENTRE > Professional and accomplished teachers are essential to any educational structure.
Johannesburg, aims to uplift the standard of mathematics, science and technology teaching in government schools.
learning these disciplines and serves as a resource base for teachers in those curriculums.
SIYAKHULA COMPUTER LITERACY AND SCHOOLS ENRICHMENT > Situated between the economically
Gauteng lies the small, but ambitious, community-based non-profit organisation, Siyakhula. Siyakhula is about empowering underserved and under-resourced communities through educational initiatives. For eight years, Siyakhula has offered practical and accessible computer literacy training as a stepping stone towards further study, learnership, employment and/or entrepreneurial opportunities. The vast majority of
working with computers and Siyakhula is helping bridge
interventions developed specifically for the South African
Enrichment Programme aims to provide support to both educators and learners in nearby high schools by means of educator development, career guidance and mentoring, and supplementary tutoring. Siyakhula is currently engaging over 4 000 learners from two partnering schools and over 140 educators. Siyakhula is
is the most effective tool for establishing a more
OLIVER’S HOUSE > Based on Gauteng’s East Rand, Oliver’s House provides free after-school education to
surrounding areas. Tuition includes five matric subjects as well as computer literacy and adult literacy classes.
EDUCATION ALIVE > The Education Alive training centre
struggle with maths, science and technical subjects. The centre also offers literacy classes and is part of Applied
educators, parents, learners and college students in disadvantaged communities. The recently launched Work Readiness Programme is aimed at unemployed
workplace. The programme consists of Education
established accounting practices. To date, 80% of the trainees have been offered full learnership contracts.
Of course, Datatec’s philanthropic endeavour is not limited to South Africa. Through the Group’s various subsidiaries around the world, many initiatives, both internally driven and locally focused, have received support.
Corporate social investment

83
Datatec Annual Report 2008
WESTCON > Westcon follows a dedicated policy in the form of charitable donations. They support various causes with the main focus on family health and well-
financial year included breast cancer awareness, blood
number of food drives. Westcon has sponsored many charities over the years including the American Parkinson
list a few.
deduction and matching programme up to $500 for its employees. Westcon has also held various fundraising events and provides support to volunteers by allowing them paid volunteer leave.
LOGICALIS > Logicalis’ policy is to encourage its various operations to make their own contribution to the communities within which they work. Not only does this approach ensure operational buy-in at a local level, but it also means that monies are fed directly into the community that might otherwise be overlooked. All employees are encouraged to bring suitable opportunities to local management for review. The following is a list of just some of the initiatives supported over the past year.
Logicalis US has made donations and held fund-raising events for the following charities: Big Brothers, Big Sisters of Metropolitan Detroit which provides one-to-
of disaster and helps people prevent, prepare for,
engages individuals and organisations in creating a healthy and sustainable environment.
Foundation, an independent charity supported by a number of major companies, which provides grants to small local voluntary groups that tackle needs at the grassroots of the community. This commitment will
foundation supports children and young people with special needs, people with long-term disabilities, the elderly, homeless and people with mental health needs.
ANALYSYS MASON > Analysys Mason has supported local and international charities of all sizes. They have
empowering homeless young women, to international
worldwide. Analysys Mason has also continued to
donated to over a number of years. Funds raised for this have come directly from the company as well as donations from staff of both their time and money.

Datatec Annual Report 2008
84
1 March 2007to 29 February
2008
1 March 2006to 28 February
2007
1 March 2005to 28 February
2006Stock exchange performanceTotal number of shares traded (‘000) 154 763 94 326 74 667Total number of shares traded as a percentage of total shares 93,2% 60,7% 51,0%Total value of shares traded (R’million) 5 626 2 725 1 202JSE Limited prices (SA cents)
3 200 3 360 2 200High 4 495 3 675 2 350Low 2 500 2 125 867London Stock Exchange (AIM) prices (UK pence)
209,5 236,2 –High 314,0 256,5 –Low 172,5 202,5 –Public/non-public shareholdingPercentage of shares held by non-public shareholders 29,2% 7,2% 32,9%Percentage of shares held by public shareholders 70,8% 92,8% 67,1%
Shareholder type Shareholders in SAShareholders
other than in SA Total shareholders
NumberPercentage
of sharesNominalnumber
Percentageof shares
Nominalnumber
Percentageof shares
Directors 3 0,3% 3 7,0% 6 7,3%Shareholders over 10% 2 20,9% 2 20,9%Share Trust (Treasury shares) 1 1,0% 1 1,0%Total non-public 6 22,2% 3 7,0% 9 29,2%Public 3 321 52,9% 315 17,9% 3 636 70,8%Total 3 327 75,1% 275 24,9% 3 645 100,0%
more than 3% of the issued share capital as at 29 February 2008:17 977 431 11,0%17 381 676 10,6%
Jens Montanana (Director) 11 329 467 6,7%9 265 783 5,7%
Liberty Life Assoc of Africa (SA) 6 950 138 4,2%
Annual general meeting 4 August 2008Reports
Published 15 October 2008Announcement of 2009 annual results Published May 20092009 annual report Published July 2009
Shareholders’ diary
Shares and shareholders

85
Datatec Annual Report 2008
Value added statement
Employees Providers of capital Government Reinvested in the Group
2008US$’000
2007US$’000
Revenue 4 007 932 3 167 772 Other income not included in revenue:
11 533 9 641 Loss on disposal and closure of discontinued operations – (31)
Less: Paid to suppliers for materials and services (3 520 324) (2 797 767)
Total value added 499 141 379 615
Distributed as follows:Employees
Salaries, wages and benefits 345 556 254 855 Providers of capital
Financing costs 26 841 19 295 Government
32 470 19 280
Total value distributed 404 867 293 430
Depreciation and amortisation 26 805 19 072 Goodwill adjustment 421 1 142
(4 224) 8 025 Minorities’ interests (4 382) (2 103)
75 654 60 049
Total value distributed and reinvested 499 141 379 615
69%
5%
7%
19%67%
5%
5%
23%
2008 2007

Datatec Annual Report 2008
86

87
Datatec Annual Report 2008
88 Board approval 88 Certificate by secretary 89 Report of the independent auditors 90 Directors’ report 94 Group and Company accounting policies102 Group income statement103 Group balance sheet104 Group statement of changes in equity105 Group cash-flow statement106 Notes to the Group annual financial statements136 Annexure 1 – Subsidiary companies138 Company income statement139 Company balance sheet140 Company statement of changes in equity141 Company cash-flow statement142 Notes to the Company annual financial statements
CONTENTS > an
nual
fin
anci
al s
tate
men
ts

Datatec Annual Report 2008
88
The Group annual financial statements for the year ended 29 February 2008 are prepared in accordance with International Financial Reporting Standards, the Companies Act of South Africa and incorporate transparent and responsible disclosure, together with appropriate accounting policies.
The directors are responsible for the maintenance of adequate accounting records, the preparation and integrity of the Group annual financial statements and all related information. The directors are also responsible for the systems of internal control which are designed to provide reasonable, but not absolute, assurance as to the reliability of the financial statements and to adequately safeguard, verify and maintain accountability of assets and to prevent and detect material misstatement and loss.
The directors believe that the Group has adequate resources to continue in operation for the foreseeable future and accordingly the financial statements have been prepared on a going-concern basis.
The Group annual financial statements which appear on pages 90 to 150 were approved by the Board of Directors on 13 May 2008 and are signed on its behalf by:
J P Montanana I P DittrichChief Executive Officer Group Finance Director
Board approvalfor the year ended 29 February 2008
Certificate by secretary
In terms of section 268G(d) of the Companies Act (Act 61 of 1973), as amended (“Act”), I certify that for the year ended 29 February 2008, Datatec Limited has lodged with the Registrar of Companies all such returns as are required of a public company in terms of the Act.
Further, that such returns are true, correct and up to date.
S P MorrisFor and on behalf ofDatatec Management Services (Pty) LtdSecretary
13 May 2008

89
Datatec Annual Report 2008
TO THE MEMBERS OF DATATEC LIMITED
We have audited the annual financial statements and group annual financial statements of Datatec Limited, which comprise the directors’ report, the balance sheet and the consolidated balance sheet as at 29 February 2008, the income statement and the consolidated income statement, the statement of changes in equity and the consolidated statement of changes in equity and cash-flow statement and the consolidated cash-flow statement for the year then ended, and a summary of significant accounting policies and other explanatory notes, as set out on pages 90 to 150.
Directors’ responsibility for the financial statementsThe Company’s directors are responsible for the preparation and fair presentation of these financial statements in accordance with International Financial Reporting Standards, and in the manner required by the Companies Act of South Africa. This responsibility includes: designing, implementing and maintaining internal control relevant to the preparation and fair presentation of financial statements that are free from material misstatement, whether due to fraud or error; selecting and applying appropriate accounting policies; and making accounting estimates that are reasonable in the circumstances.
Auditors’ responsibilityOur responsibility is to express an opinion on these financial statements based on our audit. We conducted our audit in accordance with International Standards on Auditing. Those standards require that we comply with ethical requirements and plan and perform the audit to obtain reasonable assurance whether the financial statements are free from material misstatement.
An audit involves performing procedures to obtain audit evidence about the amounts and disclosures in the financial statements. The procedures selected depend on the auditors’ judgement, including the assessment of the risks of material misstatement of the financial statements, whether due to fraud or error. In making those risk assessments, the auditors’ consider internal control relevant to the entity’s preparation and fair presentation of the financial statements in order to design audit procedures that are appropriate in the circumstances, but not for the purpose of expressing an opinion on the effectiveness of the entity’s internal control. An audit also includes evaluating the appropriateness of accounting principles used and the reasonableness of accounting estimates made by the directors, as well as evaluating the overall financial statement presentation.
We believe that the audit evidence we have obtained is sufficient and appropriate to provide a basis for our audit opinion.
OpinionIn our opinion, the financial statements present fairly, in all material respects, the financial position of the Company and of the Group as at 29 February 2008, and of their financial performance and their cash flows for the year then ended in accordance with International Financial Reporting Standards, and in the manner required by the Companies Act of South Africa.
Deloitte & ToucheRegistered Auditors
Per I T MarshallPartner
13 May 2008
Buildings 1 and 2Deloitte PlaceThe WoodlandsWoodlands DriveWoodmead SandtonDocex 10 JohannesburgPrivate Bag X6Gallo Manor 2052South Africa
National Executive: G G Gelink Chief Executive A E Swiegers Chief Operating Officer G M Pinnock Audit D L Kennedy Tax & Legal and Financial Advisory L Geeringh Consulting L Bam Corporate FinanceC R Beukman Finance T J Brown Clients & Markets N T Mtoba Chairman of the Board
A full list of partners and directors is available on request.
Report of the independent auditorsfor the year ended 29 February 2008

Datatec Annual Report 2008
90
NATURE OF THE BUSINESS
PROFILE AND GROUP STRUCTUREDatatec (“the Company”) and its subsidiaries (“the Group”) is an international ICT networking and related services group with operations in many of the world’s leading economies. The Group’s main lines of business comprise: the global distribution of advanced networking and communications convergence products (“Westcon”), ICT infrastructure solutions and services (“Logicalis”) and telecommunications strategy consulting (“Analysys Mason”).
The Group also has other interests which are included with the Group Head Office under Other Holdings. These encompass the Group’s distribution and integration businesses in the Middle East and Africa.
GROUP FINANCIAL RESULTSCommentary on the Group financial results is given in the finance report on pages 52 to 56. Full details of the financial position and financial results of the Group are set out in the financial statements on pages 90 to 150.
SHARE CAPITALAuthorised share capitalThe authorised share capital of the Company at 29 February 2008 and 28 February 2007 is R4 000 000 made up of 400 000 000 ordinary shares of one cent each.
Issued share capitalAs at 29 February 2008, the issued share capital amounts to R1 692 069 divided into 169 206 941 ordinary shares of one cent each (2007: R1 552 985 comprising 155 298 505 ordinary shares).
SHARE CAPITAL CHANGES DURING THE YEARDuring the year, 2 224 776 shares were issued to settle obligations in terms of the Datatec Share Option Scheme and 5 108 330 shares were issued as part of the consideration for acquisitions.
A further 7 200 000 shares were issued in an institutional placement on the Alternative Investment Market (“AIM”) of the London Stock Exchange.
In February 2008 Datatec executed a share buy-back where it repurchased and subsequently cancelled 624 670 shares. A further 1 068 489 shares were repurchased by the Company share trust during the year ended 29 February 2008 and are held as treasury shares.
Financial details of the movement in share capital have been reflected in the statement of changes in equity on page 104, and in Note 16 in the annual financial statements.
DIRECTORSFull details of the current Board of Directors appear on pages 16 and 17. During the year under review Mr John McCartney was appointed to the Board as an independent non-executive director with effect from 16 July 2007. Mr Colin Brayshaw retired from the Board on 6 August 2007. Mr Ivan Dittrich was appointed to the Board on 1 March 2008 to succeed Mr David Pfaff who has resigned from the Board with effect from 31 May 2008.
Subsequent to the year-end Mr Leslie Boyd, the Group’s Chairman, passed away suddenly after a short illness. Mr Stephen Davidson, who was Deputy Chairman, has succeeded to the role of Chairman. Mr Boyd had indicated his intention to retire from the Board after the Group’s AGM in August at which time the Board had intended to appoint Mr Davidson as Chairman.
Directors’ reportfor the year ended 29 February 2008

91
Datatec Annual Report 2008
All directors, including non-executive directors, are required, in terms of the Company’s articles of association, to retire at least every three years and may offer themselves for re-election. All directors are subject to re-election by shareholders at the first opportunity after their appointment in addition to re-election at least every three years.
Brief curricula vitae of directors are included on pages 16 and 17 and further information on the directors, including their interests in the shares of the Company and share-based remuneration schemes, are provided in the remuneration report set out on pages 68 to 81.
GOING CONCERNThe directors believe that the Datatec Group has adequate financial resources to continue in operation for the foreseeable future and accordingly the financial statements have been prepared on a going-concern basis.
The Group is solvent and has access to sufficient cash resources. Shareholders’ funds are $655 million (2007: $538 million). Working capital remains well controlled. Receivables and inventory are of sound quality and adequate provisions are held against both. The Group has sufficient liquidity and borrowing capacity to meet its ongoing operating needs, including approved capital expenditure. At 29 February 2008 the Group had cash balances on hand of $245 million, bank overdrafts of $211 million and unused borrowing facilities of $334 million of which $177 million was available for draw down against existing collateral at that date.
The Group has no need to undertake a capital restructuring and key executive management is in place. The Board is not aware of any new material changes that may adversely impact the Group relative to customers, suppliers, services or markets. The Board is not aware of any material non-compliance with statutory or regulatory requirements and there are no pending legal proceedings other than in the normal course of business. The Board is not aware of any pending changes in legislation in any of the major countries in which it operates that may affect the Group.
INVESTMENTS AND SUBSIDIARIESFinancial information relating to the Group’s investments and interests in subsidiaries is contained in Annexure 1 of the Group financial statements and Note 4 of the Company financial statements.
ACQUISITIONSThe following significant acquisitions were concluded during the 2008 financial year:On 8 March 2007, Westcon Africa Middle East acquired 100% of Jet Distribution Ltd and Resolv Computers Ltd for $3,8 million.
On 24 April 2007, Westcon Group, Inc. acquired NOXS Europe BV and NOXS Ireland Ltd from Unit 4 Agresso NV for a maximum cash consideration of $74 million. NOXS is a leading European distributor of security products and services with offices in France, Belgium, The Netherlands, Germany, the United Kingdom, Ireland and Italy. NOXS’ primary vendors include Juniper Networks, Checkpoint Systems, Trend Micro, Nokia and McAfee.
On 3 May 2007, Datatec Ltd acquired Crane Telecommunications Group Ltd, a leading UK-based European value-added distributor of voice, data and converged communications solutions for $42 million in cash and Datatec shares. Datatec subsequently transferred these shares in Crane to Westcon Group, Inc.
On 31 May 2007, Logicalis US Holdings, Inc. acquired Carotek’s Information Technology Division, based in North Carolina for $7 million in cash and shares.
On 16 July 2007, Westcon Group, Inc. acquired the assets of ReView Video LLC, a leading US distributor of audio, network, videoconferencing and voice over IP (“VoIP”) solutions, for a cash consideration of $25 million.

Datatec Annual Report 2008
92
On 2 October 2007, Logicalis Group Ltd purchased the 20% minority interest in its South American operations for $6 million, and on 30 September 2007, increased its stake in a German services business to 75% for $2 million.
On 1 September 2007, Westcon Africa Middle East acquired 51% of International Technology Distributors FZCo which has since been renamed Westcon Africa FZCo (“Westcon Africa”) for a net $4,2 million (note that part of the consideration included the transfer of the investment in Jet Distribution Ltd and Resolv Computers Ltd).
On 19 February 2008, Analysys Mason completed the acquisition of Redbox Consulting Services Ltd for $3,6 million. This acquisition will further enhance the range of services that can be offered to clients.
Investments increased to $3,7 million, as a result of the joint venture transaction in respect of Neteks in Turkey. Comprehensive financial details of the acquisitions made during the year can be found in Note 34 in the annual financial statements.
SPECIAL RESOLUTIONS OF THE GROUPOn 30 August 2007 the Company registered a special resolution after receiving general shareholder approval at the Annual General Meeting (“AGM”) held on 6 August 2007 to repurchase its own securities or to effect the repurchase of the Company’s securities by a subsidiary of the Company.
On 30 August 2007 the Company registered a special resolution after receiving shareholder approval at the AGM held on 6 August 2007 to change its articles of association to:
CORPORATE GOVERNANCE COMPLIANCE STATEMENTSA statement on the Group’s corporate governance policies and procedures is set out in the corporate governance report on pages 59 to 67.
SHARE OPTION AND MANAGEMENT INCENTIVE SCHEMESDetails of the Group’s share option and other management incentive schemes are set out in the remuneration report on pages 68 to 81.
EVENTS OCCURRING SUBSEQUENT TO THE YEAR-ENDOn 2 May 2008, Logicalis completed the merger of its Latin American operations with the leading Brazilian network integration businesses of Promon Tecnologia (“PT”). The initial announcement was on 14 March 2008. Logicalis paid PT’s owner, Promon S.A., $77,2 million in cash and new Datatec shares for a 70% equity holding in the combined business which has since been renamed Promon-Logicalis Latin America Ltd (“PLLAL”). Promon S.A. will have a 30% equity interest in the business. The focus of the division will be to capture synergies across Latin America by providing cross-border solutions and services to customers in the region. The board and management of PLLAL comprise directors and executives from both Promon S.A. and Logicalis.
CAPITAL DISTRIBUTIONThe Company will distribute out of share premium, in lieu of a dividend, 90 RSA cents per share (approximately 12 US cents per share) for the year ended 29 February 2008, in terms of the general authority granted to directors at the AGM held on 6 August 2007. The capital distribution will be paid to shareholders on the Jersey branch register in GBP translated at the closing exchange rate on Thursday, 10 July 2008.
Directors’ report continuedfor the year ended 29 February 2008

93
Datatec Annual Report 2008
The salient dates are:Last day to trade Friday, 4 July 2008Shares to commence trading “ex” the distribution Monday, 7 July 2008Record date Friday, 11 July 2008Payment date Monday, 14 July 2008
Share certificates may not be dematerialised or rematerialised between Monday, 7 July 2008 and Friday, 11 July 2008, both days inclusive.
The Company has instituted a policy of making an annual distribution to shareholders subject to annual review which will be influenced by business growth, acquisition activity, or changes in reported earnings resulting from applying fair value accounting principles.
ANNUAL GENERAL MEETINGThe AGM will be held at 12:00 on 4 August 2008 at the Sandton Sun Hotel, 5th Street, Sandton. In addition to the ordinary business of the meeting, as special business, shareholder consent will be sought to authorise directors to repurchase the Company’s shares from time to time according to certain guidelines. Refer to the notice to the AGM on pages 151 to 156 of this report for further details.
Datatec Annual Report 2008
94
BASIS OF ACCOUNTING AND REPORTINGThe financial statements as set out on pages 90 to 150 have been prepared on the historical cost basis except for the revaluation of certain financial instruments. Significant details of the Group and Company’s accounting policies are set out below which are consistent with those applied in the previous year, except for the adoption of IFRS 7 Financial Instruments: Disclosures which is effective for annual reporting periods beginning on or after 1 January 2007, and the consequential amendments to IAS 1 Presentation of Financial Statements.
The financial statements comply with the International Financial Reporting Standards (“IFRS”) of the International Accounting Standards Board, the JSE Listings Requirements, AIM Rules and the Companies Act of South Africa.
ADOPTION OF NEW ACCOUNTING STANDARDS, AMENDMENTS TO STANDARDS AND INTERPRETATIONSThe Group and Company have adopted the following statements and interpretations:
New standardsThe impact of the adoption of IFRS 7 Financial Instruments: Disclosures and the changes to IAS 1 Presentation of Financial Statements has been to expand the disclosures provided in these financial statements regarding the Group and Company’s financial instruments and management of capital (see Note 25).
New interpretationsFour interpretations issued by the International Financial Reporting Interpretations Committee are effective for the current period. These are: IFRIC 7 Applying the Restatement Approach under IAS 29, Financial Reporting in Hyperinflationary Economies; IFRIC 8 Scope of IFRS 2; IFRIC 9 Reassessment of Embedded Derivatives; IFRIC 10 Interim Financial Reporting and Impairment; IFRIC 11 IFRS 2 Group Treasury Share Transactions. Two further interpretations are not yet effective but have been early-adopted, namely IFRIC 12 Service Concession Arrangements; and IFRIC 14 The Limit on a Defined Benefit Asset, Minimum Funding Requirements and their Interaction. The adoption of these interpretations has not led to any changes in the Group’s accounting policies, and has had no material impact on the Group and Company financial statements.
New interpretations and standards not yet adoptedAt the date of authorisation of these financial statements, the following standards and interpretations applicable to the Group were in issue but not yet effective:
Share-based Payment: Vesting Conditions and Cancellations (effective for accounting periods beginning on or after 1 January 2009);
Business Combinations (effective for accounting periods beginning on or after 1 July 2009);Presentation of Financial Statements (effective for accounting periods beginning on or after 1 January 2009);Consolidated and Separate Financial Statements (effective for accounting periods beginning on or after 1 July 2009);
Financial Instruments: Presentation together with consequential amendments to IAS 1 Presentation of Financial Statements: Puttable Financial Instruments and Obligations Arising on Liquidation (effective for accounting periods beginning on or after 1 January 2009);
(Revised) Borrowing Costs (effective for accounting periods beginning on or after 1 January 2009);Operating Segments (effective for accounting periods beginning on or after 1 January 2009); and
Customer Loyalty Programmes (effective for accounting periods beginning on or after 1 July 2008).
The revised IFRS 3 Business Combinations standard has a number of amendments that will impact the Group for business combinations concluded post the effective date. The most significant of which are expected to be:
professional costs associated with the transaction. Currently these costs are capitalised as part of the cost of the acquisition.
accounting for the change in consideration depends on whether the additional consideration is an equity instrument or cash or other assets paid or owed. If it is equity, the original amount is not remeasured. If the additional consideration is cash or other assets paid or owed, the changed amount is recognised in profit or loss. Currently the contingent consideration, regardless of the manner in which it is settled, is remeasured and an adjustment is made to goodwill.
goodwill method” and such option may be elected on a transaction-by-transaction basis.
IFRS 8 is a disclosure standard which may result in a redesignation of the Group’s reportable segments but is not expected to have an impact on the reported results or financial position of the Group.
Group and Company accounting policiesfor the year ended 29 February 2008

95
Datatec Annual Report 2008
The directors believe that none of the other new or revised standards and interpretations will have a significant effect on the Group’s accounting policies.
KEY ASSUMPTIONS MADE BY MANAGEMENT IN APPLYING ACCOUNTING POLICIESIn the application of the Group’s accounting policies described below, management is required to make judgements, estimates and assumptions about the carrying value of assets and liabilities that are not readily apparent from other sources. The estimates and associated assumptions are based on historical experience and other factors which are considered to be relevant. Actual results may differ from these estimates.
The estimates and the underlying assumptions are reviewed on an ongoing basis. Revisions to accounting estimates are recognised in the period in which the estimate is revised if the revision affects only that period or in the period of the revision and future periods if the revision affects both current and future periods.
The following are the key assumptions concerning the future, and other key areas of estimation included in the Group’s annual financial statements, that have a significant risk of causing a material adjustment to the carrying amount of assets and liabilities within the next financial year:
$55,0 million (2007: $20,7 million). The Group continually assesses the carrying value of its intangible assets recognised as part of historical acquisitions. This requires an estimation of the value in use, based on estimated future cash flows and discount rates, of the asset or cash-generating units to which these assets belong;
(2007: $162,6 million). Similar to acquired intangible assets this requires an estimation of the value in use of the cash-generating unit to which the goodwill is allocated;
included in the balance sheet at $29,3 million (2007: $22,4 million);
analyses of these assumptions are provided in Note 25;
respectively;
BASIS OF CONSOLIDATIONThe Group reports in US Dollars in order to be consistent with the economic substance of the underlying events and circumstances of the Group’s businesses. The US Dollar is the functional currency in which the major part of the Group’s trading is conducted. Reporting in US Dollars reduces the distorting effects of changes in currency exchange rates, simplifies financial analysis and enhances the transparency of the financial results. Presenting financial information in US Dollars is also more meaningful to global investors and for international benchmarking.
The translation for reporting purposes into US Dollars is done as follows:
approximates the ruling exchange rates at the dates of the transactions.
The consolidated Group financial statements incorporate the financial statements of the Company and all enterprises controlled by the Company up to the end of February each year. Control is achieved where the Group has the power to govern the financial and operating policies of an enterprise so as to obtain economic benefits from its activities.
The operating results of Group entities have been included from the effective dates of acquisition to the effective dates of disposal. All significant inter-company transactions, balances, income and expenses have been eliminated in full on consolidation.
On acquisition, the assets and liabilities of a subsidiary are measured at their fair values at the date of acquisition. To the extent that the cost of the acquisition, in excess of the fair value of the net assets acquired, is attributable to intangible assets that the entity holds for its own use or for rental to others, this value is recognised as an intangible asset. Any additional difference between the cost

Datatec Annual Report 2008
96
of acquisition and total net asset value of the entity is recognised as goodwill. The interest of minority shareholders is stated at the minority’s proportion of the fair values of the net assets recognised (excluding goodwill).
Where necessary, adjustments are made to the financial statements of subsidiaries to bring their accounting policies in line with those of the Group.
BUSINESS COMBINATIONSAcquisitions of subsidiaries and businesses are accounted for using the purchase method. The cost of the business combination is measured as the aggregate of the fair values (at date of exchange) of assets given, liabilities incurred or assumed, and equity instruments issued by the Group in exchange for control of the acquiree, plus any costs directly attributable to the business combination. The acquiree’s identifiable assets, liabilities and contingent liabilities that meet the conditions of recognition under IFRS 3 Business Combinations are recognised at their fair values at the acquisition date, except for non-current assets that are classified as held-for-sale in accordance with IFRS 5 Non-current Assets Held for Sale and Discontinued Operations, which are recognised and measured at fair value less costs to sell.
Goodwill arising on acquisition is recognised as an asset and initially measured at cost, being the excess of cost of the business combination over the Group’s interest in the net fair value of the identifiable assets, liabilities and contingent liabilities recognised. If, after reassessment, the Group’s interest in the net fair value of the acquiree’s identifiable assets, liabilities and contingent liabilities exceeds the cost of the business combination, the excess is recognised immediately in profit and loss.
The interest of minority shareholders in the acquiree is initially measured at the minority’s proportion of the net fair value of the assets, liabilities and contingent liabilities recognised.
FOREIGN CURRENCY TRANSACTIONSTransactions in currencies other than the reporting currency are initially recorded at the rates of exchange ruling on the dates of the transactions. At each balance sheet date, monetary assets and liabilities denominated in such currencies are retranslated at the rates prevailing on the balance sheet date. Profits and losses arising on exchange are dealt with in the income statement except for profits and losses on exchange arising from equity loans which are taken directly to equity, until the entity to which the loan was made has been disposed of, at which time they are recognised as income or an expense.
Exchange differences arising on equity loans and the translation of foreign subsidiaries are classified as equity and transferred to the Group’s translation reserve. Such translation differences are recognised as income or expenses in the period during which disposals are effected.
Where appropriate, in order to minimise its exposure to foreign exchange risks, the Group enters into forward exchange contracts.
Goodwill and fair value adjustments arising on the acquisition of a foreign operation are treated as assets and liabilities of the foreign operation and translated at the closing rate.
PROPERTY, PLANT AND EQUIPMENTLand and buildings comprise mainly warehouses and offices. All property, plant and equipment have been stated at cost less accumulated depreciation and impairment except land, which is shown at cost less impairment. Depreciation is calculated based on cost using the straight-line method over the estimated useful lives of the assets and their recoverable amount.
The basis of depreciation provided on property, plant and equipment is: Useful lives (years)Office furniture and equipment 2 – 6Motor vehicles 2 – 4Computer equipment and software 2 – 6Buildings 20Leasehold improvements Period of the leaseLand is not depreciated.
The assets’ residual values and useful lives are reviewed, and adjusted if appropriate, at each balance sheet date. An asset’s carrying amount is written down immediately to its recoverable amount if the asset’s carrying amount is greater than its estimated recoverable amount.
Group and Company accounting policies continuedfor the year ended 29 February 2008
97
Datatec Annual Report 2008
Gains and losses on disposals are determined by comparing proceeds with the carrying amount. These are included in the income statement.
LEASED ASSETSAssets leased in terms of agreements, which are considered to be finance leases, are capitalised. Capitalised leased assets are depreciated at the same rate and on the same basis as equivalent owned assets or over the term of the lease if this is shorter. The liability to the lessor is included in the balance sheet as a finance lease obligation. Lease finance charges are amortised over the duration of the underlying leases, using the effective interest rate method.
Operating leases, mainly for the rental of premises, office furniture, computer equipment and motor vehicles are not capitalised and rentals are expensed on a straight-line basis over the lease term.
CAPITALISED DEVELOPMENT EXPENDITUREAn intangible asset arising from internal development (or from the development phase of an internal project) is recognised only if the Group can demonstrate all of the following:(a) the technical feasibility of completing the intangible asset so that it will be available for use or sale;(b) its intention or ability to complete the intangible asset, and use or sell it;(c) how the intangible asset will generate probable future economic benefits, including the existence of a market for the output of the
intangible asset or the intangible asset itself or, if it is to be used internally, the usefulness of the intangible asset;(d) the availability of adequate technical, financial and other resources to complete the development, and to use or sell the
intangible asset; and(e) its ability to reliably measure the expenditure attributable to the intangible asset during its development.
Capitalised development costs are amortised using the straight-line method over their useful lives, which generally do not exceed seven years.
Expenditure on research activities is recognised as an expense in the period in which it is incurred.
OTHER INTANGIBLE ASSETSOther intangible assets include those intangible assets acquired and identified as part of a business combination. Intangible assets are identifiable non-monetary assets without physical substance that an entity holds for its own use or for rental to others and include technology-based items like patents, copyrights and databases; customer-based items, research and development and contract-based items.
An intangible asset is recognised when it meets the following criteria:(a) is identifiable;(b) the entity has control over the asset;(c) it is probable that economic benefits will flow to the entity; and(d) the cost of the asset can be measured reliably.
Intangible assets are amortised using the straight-line method over their useful lives, which generally do not exceed 10 years.Intangible assets which do not meet the criteria listed above are recognised as an expense in the period in which it is incurred.
GOODWILLGoodwill represents the excess cost of an acquisition over the fair value of the Group’s share of the net identifiable assets of the acquired subsidiary at the date of acquisition. For the purpose of impairment testing, goodwill is allocated to each of the Group’s cash-generating units expected to benefit from the synergies of the combination. Goodwill is tested annually for impairment and carried at cost less accumulated impairment losses. The carrying amount of goodwill (or relevant portion thereof) is included in computing the gains and losses on the disposal of an entity.
Impairment tests are conducted annually on goodwill based on future discounted cash flows, and other appropriate methods.
INVESTMENTS IN ASSOCIATES AND JOINT VENTURESAn associate is an entity over which the Group has significant influence and that is neither a subsidiary nor an interest in a joint venture. Significant influence is the power to participate in the financial and operating policy decisions of the investee but is not control or joint control over those policies.

Datatec Annual Report 2008
98
A joint venture is a contractual arrangement whereby the Group and other parties undertake an economic activity that is subject to joint control, that is, when the strategic financial and operating policy decisions relating to the activities of the joint venture require the unanimous consent of the parties sharing control.
The results and assets and liabilities of associates and joint ventures are incorporated in these financial statements using the equity method of accounting.
Any excess of the cost of acquisition over the Group’s share of the net fair value of the identifiable assets, liabilities and contingent liabilities of the associate recognised at the date of acquisition is recognised as goodwill. The goodwill is included within the carrying amount of the investment and is assessed for impairment as part of that investment. Any excess of the Group’s share of the net fair value of the identifiable assets, liabilities and contingent liabilities over the cost of acquisition, after reassessment, is recognised immediately in profit or loss.
Where a Group entity transacts with an associate or joint venture of the Group, profits and losses are eliminated to the extent of the Group’s interest in the relevant associate or joint venture.
IMPAIRMENTAt each balance sheet date, the Group reviews the carrying amounts of its tangible and intangible assets to determine whether there is any indication that those assets have suffered an impairment loss. If any such indication exists, the recoverable amount of the asset is estimated in order to determine the extent of the impairment loss, if any. Where it is not possible to estimate the recoverable amount of an individual asset, the Group estimates the recoverable amount of the cash-generating unit to which the asset belongs. Recoverable amount is the higher of fair value less costs to sell and value in use. In assessing value in use, the estimated future cash flows are discounted to their present value using a pre-tax discount rate that reflects current market assessments of the time value of money and the risks specific to the asset.
If the recoverable amount of an asset or cash-generating unit is estimated to be less than its carrying amount, its carrying amount is reduced to its recoverable amount. Impairment losses are recognised as an expense immediately and are reflected in the income statement.
Where an impairment loss subsequently reverses, the carrying amount of the asset or cash-generating unit is increased to the revised estimate of its recoverable amount, but will never exceed the carrying amount that would have been determined had no impairment loss been recognised in prior years. A reversal of an impairment loss is recognised immediately in the income statement.
INVENTORIESInventories, comprising merchandise for resale and raw materials, are stated at the lower of cost and net realisable value and are mainly valued on the weighted average cost basis.
Provision is made for obsolete and slow-moving inventory.
Contract work in progress is recognised on the percentage of completion method by reference to the milestones for each contract.
FINANCIAL INSTRUMENTSMeasurementFinancial instruments are initially measured at fair value, which includes transaction costs and approximates fair value. Subsequent to initial recognition these instruments are measured at amortised cost using the effective interest rate method.
InvestmentsInvestments, other than investments in subsidiaries, are recognised on a trade-date basis and are initially measured at cost, including transaction costs. These investments are classified as either held-for-trading or available-for-sale, and are measured at subsequent reporting dates at fair value. An investment is classified as held-for-trading if it has been acquired principally for the purpose of selling in the near future, or it is part of an identified portfolio of financial instruments that the Group manages together and has a recent actual pattern of short-term profit-taking. An investment is classified as available-for-sale if it is not held for trading.
Where securities are held for trading purposes, gains or losses arising from changes in fair value are included in the income statement for the period in operating profit. For available-for-sale investments, gains and losses arising from changes in fair value are recognised directly in equity, until the security is disposed of or is determined to be impaired, at which time the cumulative gain or loss previously recognised in equity is included in the income statement for the period.
Group and Company accounting policies continuedfor the year ended 29 February 2008

99
Datatec Annual Report 2008
Fair value of listed investments is calculated by reference to the quoted selling price at the close of business on the balance sheet date.
Unlisted investments are shown at fair value or at cost where fair value cannot be measured reliably. Fair value is determined with reference to independent valuations using discounted cash-flow analysis or other suitable valuation methodologies or recent arm’s length market transactions between knowledgeable, willing parties.
Trade receivablesTrade receivables are recognised initially at cost, which approximates fair value and are subsequently measured at amortised cost using the effective interest rate method. The effective interest method is a method of calculating the amortised cost of a financial asset or financial liability and of allocating interest income or expense over the period of the instrument. Effectively, this method determines the rate that exactly discounts the estimated future cash payments or receipts through the expected life of the financial instrument or, if appropriate, a shorter period, to the net carrying amount of the financial asset or liability.
A provision for impairment of trade receivables is established when there is objective evidence that the Group will not be able to collect all the amounts due according to the original terms of the receivables. Objective evidence includes observable data about the following loss events:
In instances where there is clear and unassailable evidence that a trade receivable has been impaired and that there is no evidence to indicate that the trade receivable is recoverable and all reasonable measures to recover the amount have been exhausted, the Group would reduce the carrying amount of the impaired trade receivable directly against the asset account or the provision for impairment of trade receivables if one had previously been raised.
Any increase or decrease in the provision for impairment of trade receivables or any reduction in trade receivables directly against the asset account is recorded in operating profit.
Renegotiated financial assetsFinancial assets whose terms have been renegotiated to terms outside the entities’ normal terms and conditions, but the new terms are still within acceptable industry standards and norms, will not be deemed to have been derecognised and the renegotiated terms will be accounted for as part of the old financial asset.
In those instances where an entity has renegotiated the terms of an existing financial asset to terms outside the entities’ normal terms and conditions and the new terms are beyond acceptable industry standards and norms, the financial asset will be deemed to have been derecognised and a new financial asset would be raised with the resultant gain or loss on derecognition being recognised in operating profit.
Cash and cash equivalentsCash and cash equivalents include cash in hand, deposits held at call with banks, other short-term highly liquid investments with original maturities of three months or less, and bank overdrafts. Bank overdrafts are shown within borrowings in current liabilities on the balance sheet.
BorrowingsBorrowings are initially recorded at fair value, net of direct issue costs, and are subsequently measured at amortised cost using the effective interest rate method. Finance charges, including premiums payable on settlement or redemption, are accounted for on an accrual basis and are added to the carrying amount of the instrument to the extent that they are not settled in the period in which they arise.
Trade payablesTrade payables are recognised initially at cost, which approximates fair value and are subsequently measured at amortised cost using the effective interest rate method.

Datatec Annual Report 2008
100
Equity instrumentsEquity instruments issued by the Company are recorded at the proceeds received, net of the direct issue costs.
PROVISIONSProvisions are recognised when the Group has a present legal or constructive obligation, as a result of past events, for which it is probable that an outflow of economic benefits will be required to settle the obligation, and a reliable estimate can be made for the amount of the obligation. Non-current provisions are adjusted to reflect the time value of money.
Present obligations arising under onerous contracts are recognised and measured as a provision. An onerous contract is considered to exist where the Group has a contract under which the unavoidable costs of meeting the obligations under the contract exceed the economic benefits expected to be received under it.
AMOUNTS OWING TO VENDORSAmounts owing to vendors represent purchase considerations owing in respect of acquisitions. These purchase considerations are to be settled with the vendors in cash or shares on fulfilment of the relevant profit warranties. The amounts owing are interest-free and will be settled within the next year. Any additional amounts payable to vendors will be allocated to goodwill arising on acquisition and will have no effect on the income statement.
TAXATIONThe tax expense represents the sum of the tax currently payable and deferred tax.
The tax currently payable is based on taxable income for the year. Taxable income differs from net income as reported in the income statement because it includes items of income or expense that are taxable or deductible in other periods and it further excludes items that are never taxable or deductible. The Group’s liability for current tax uses relevant rates that have been enacted or substantively enacted by the balance sheet date.
Deferred tax is accounted for using the balance sheet liability method in respect of temporary differences which arise from differences between the carrying amount of assets and liabilities in the financial statements and the corresponding tax basis used in the computation of taxable income. In principle, deferred tax liabilities are recognised for all taxable temporary differences and deferred tax assets are recognised to the extent that it is probable that taxable income will be available against which deductible temporary differences can be utilised. The carrying value of deferred tax assets is reviewed at each balance sheet date and reduced to the extent that it is no longer probable that sufficient taxable income will be available to allow all or part of the asset to be recovered.
Deferred tax is calculated at the tax rates that are expected to apply to the period when the asset is realised or the liability is settled. Deferred tax is charged or credited in the income statement, except when it relates to items credited or charged directly to equity, in which case the deferred tax is also dealt with in equity.
Deferred tax assets and liabilities are offset when there is a legally enforceable right to set off current tax assets against current tax liabilities and when they relate to income taxes levied by the same taxation authority and the Group intends to settle its current tax assets and liabilities on a net basis.
REVENUE RECOGNITIONRevenue is measured at fair value of the consideration received or receivable and, except for certain sales arrangements where the Group acts as agent, represents the invoiced value of sales and services rendered, excluding discounts and sales-related taxes. Revenue from sales arrangements where the Group acts as agent is recognised on a net basis and the commission or gross profit earned on these contracts is recognised as revenue. In respect of trading operations revenue is recognised at the date on which goods are delivered to customers or services are provided.
Revenue and profits from the rendering of services on long-term and fixed-price contracts are recognised on the percentage-of-completion method, after providing for contingencies and once the outcome of the contract can be assessed with reasonable assurance. The percentage of completion is measured by reference to milestones set out in each contract. As soon as losses on individual contracts become evident, they are provided for in full.
Group and Company accounting policies continuedfor the year ended 29 February 2008

101
Datatec Annual Report 2008
Revenue from cost plus contracts is recognised by reference to the recoverable costs incurred during the period plus the fee earned, measured by the proportion that costs incurred to date bear to the estimated total costs of the contract.
Within the Group, inter-company and inter-divisional revenue is eliminated on consolidation.
Interest received is accrued on a time basis, by reference to the principal outstanding and at the effective interest rate applicable.
BORROWING COSTSAll borrowing costs are recognised in profit and loss in the period in which they are incurred.
SHARE-BASED PAYMENTSThe Group issues equity-settled and cash-settled share-based incentives to certain employees.
Equity-settled share-based payments are measured at fair value (excluding the effect of non-market-based vesting conditions) at the date of grant. The fair value determined at the grant date of the equity-settled share-based payments is expensed on a straight-line basis over the vesting period, based on the Group’s estimate of shares that will eventually vest and adjusted for the effect of non-market-based vesting conditions.
For cash-settled share-based payments the liability for the fair value of all unexercised share rights which are expected to vest, is determined initially at grant date and then revalued at each reporting date and amortised over the applicable period.
Fair value is measured by use of a binomial model for equity-settled share-based payments and by use of a Black-Scholes-Merton model for cash-settled share-based payments. The expected life used in the models has been adjusted, based on management’s best estimate, for the effects of non-transferability, exercise restrictions and behavioural considerations.
PENSION SCHEME ARRANGEMENTSCertain subsidiaries of the Group make contributions to various defined contribution retirement plans on behalf of employees, in accordance with the local practice in the country of operation. These contributions are charged against income as incurred.
The Group has no liability to these defined contribution retirement plans other than the payment of its share of the contribution in terms of the agreement with the funds and employees concerned, which differs from country to country.
DISCONTINUING OPERATIONSDiscontinuing operations are significant, distinguishable components of the Group that have been sold, abandoned or are the subject of formal plans for disposal or discontinuance. Any operation disposed of subsequent to year-end is considered to be a discontinuing operation for disclosure purposes.
Once an operation has been identified as discontinuing, comparative information is restated.

Datatec Annual Report 2008
102
for the year ended 29 February 2008
Notes2008
US$’0002007
US$’000
Revenue 1 4 007 932 3 167 772 Continuing operations 3 623 024 3 075 344 Acquisitions 384 908 92 428 Cost of sales (3 460 802) (2 752 601)
Gross profit 547 130 415 171 Operating costs (387 747) (286 872)Share-based payments 2 (8 688) (8 943)
Operating profit before finance costs, depreciation and amortisation (“EBITDA”) 150 695 119 356 Depreciation and amortisation 3 (26 805) (19 072)
Operating profit before goodwill adjustment 123 890 100 284 Goodwill adjustment 10 (421) (1 142)
Operating profit 3 123 469 99 142 Interest received 11 533 9 641 Financing costs 4 (26 841) (19 295)Loss on disposal of investments 6 – (55)Share of joint venture earnings 12 121 –
Profit before taxation 108 282 89 433 Taxation 5 (28 246) (27 305)
Profit for the year from continuing operations 80 036 62 128 Profit for the year from discontinued operations 6 – 24
Profit for the year 80 036 62 152
Attributable to:Minority interests 4 382 2 103 Equity holders of the parent 75 654 60 049
80 036 62 152
Number of shares issued (millions)– Issued 169 155 – Weighted average 166 150 – Diluted weighted average 170 153 Earnings per share (cents)– Basic 7 45,4 40,0 – Diluted 7 44,6 39,2
Group income statement

103
Datatec Annual Report 2008
as at 29 February 2008
Group balance sheet
Notes2008
US$’0002007
US$’000
ASSETSNon-current assets 421 074 242 096 Property, plant and equipment 9 32 220 22 307 Goodwill 10 284 348 162 586 Capitalised development expenditure 11 16 638 14 068 Acquired intangible assets 11 54 956 20 720 Investments 12 3 652 – Deferred tax assets 13 29 260 22 415 Current assets 1 463 245 1 149 138 Inventories 14 341 036 268 944 Trade receivables 15 769 329 566 123 Other receivables 108 198 90 464 Cash and cash equivalents 244 682 223 607
Total assets 1 884 319 1 391 234
EQUITY AND LIABILITIESEquity attributable to equity holders of the parent 654 707 537 744 Share capital and premium 16 224 815 198 017 Non-distributable reserves 36 239 24 036 Share-based payments reserve 2 5 777 3 469 Distributable reserves 387 876 312 222 Minorities’ interest 23 576 14 852
Total equity 678 283 552 596 Non-current liabilities 99 317 65 518 Long-term liabilities 17 58 761 42 608 Liability for share-based payments 2 16 058 9 678 Deferred tax liabilities 13 24 498 13 232 Current liabilities 1 106 719 773 120 Trade and other payables 18 864 673 664 573 Provisions 19 13 148 7 412 Amounts owing to vendors 20 2 000 4 044 Current tax liabilities 16 395 14 876 Bank overdrafts 21 210 503 82 215
Total equity and liabilities 1 884 319 1 391 234

Datatec Annual Report 2008
104
for the year ended 29 February 2008
US$’000
Share capital
Sharepremium
Non-distri-
butable reserves
Share- based
payments reserve
Distri-butablereserves
Equity attri-
butable to equity holders
of the parent Minorities
Total equity
Balance at 1 March 2006 237 209 097 (11 990) 2 094 249 408 448 846 12 505 461 351 Difference arising on translation into US$ (35) (31 523) 27 268 (4 290) (1 128) (5 418)Translation difference on equity loans 8 758 8 758 8 758
Recognised directly in equity (35) (31 523) 36 026 – – 4 468 (1 128) 3 340 Attributable profit for the year 60 049 60 049 2 103 62 152
Total income/(expense) recognised for the year (35) (31 523) 36 026 60 049 64 517 975 65 492 New share issues 13 26 817 26 830 26 830 Capital distribution (6 589) (6 589) (6 589)Acquisitions 2 765 2 765 1 372 4 137 Share-based payments 1 375 1 375 1 375
Balance at 28 February 2007 215 197 802 24 036 3 469 312 222 537 744 14 852 552 596
Difference arising on translation into US$ (14) (14 887) 9 967 (4 934) 50 (4 884)Translation difference on equity loans 2 236 2 236 2 236
Recognised directly in equity (14) (14 887) 12 203 – – (2 698) 50 (2 648)Attributable profit for the year 75 654 75 654 4 382 80 036
Total income/(expense) recognised for the year (14) (14 887) 12 203 75 654 72 956 4 432 77 388 New share issues 20 64 585 64 605 64 605 Capital distribution (16 775) (16 775) (16 775)Acquisitions 4 292 4 292 Share buy-back (1) (6 130) (6 131) (6 131)Share-based payments 2 308 2 308 2 308
Balance at 29 February 2008 220 224 595 36 239 5 777 387 876 654 707 23 576 678 283
Non-distributable reserves relate to foreign currency translation reserves.
The Group issues equity-settled and cash-settled share-based incentives to certain employees. Equity-settled share-based payments are measured at the fair value at the date of grant. The fair value determined at the grant date of the equity-settled share-based payments is expensed on a straight-line basis over the vesting period, based on the Group’s estimate of the shares that will eventually vest. A liability equal to the portion of services received is recognised at the current fair value determined at each balance sheet date for cash-settled share-based payments.
Group statement of changes in equity

105
Datatec Annual Report 2008
for the year ended 29 February 2008
Group cash flow statement
Notes2008
US$’0002007
US$’000
Cash flow from operating activitiesCash generated from operations 26 77 415 20 067 Interest received 11 533 9 641 Financing costs (26 841) (19 295)Taxation paid 27 (29 809) (14 039)
Net cash inflow/(outflow) from operating activities 32 298 (3 626)
Cash flow from investing activitiesAcquisition of subsidiary companies 28 (180 744) (44 741)Acquisition of joint venture 12 (3 828) – Proceeds on disposal of businesses and investments 29 – (31)Additions to property, plant and equipment 30 (18 502) (10 632)Additions to capitalised development expenditure 11 (5 848) (5 040)Proceeds on disposal of property, plant and equipment 538 110
Net cash outflow from investing activities (208 384) (60 334)
Cash flow from financing activitiesNet proceeds from issue of shares 64 605 26 830 Capital distribution (16 775) (6 589)Share buy-back (6 131) – (Decrease)/increase in amounts owing to vendors (2 044) 2 349 Movement in minority interests – 2 593 Net proceeds from/(payment of) long-term liabilities 14 144 (287)
Net cash inflow from financing activities 53 799 24 896
Net decrease in cash and cash equivalents (122 287) (39 064)
Cash and cash equivalents at the beginning of year 141 392 172 251 Translation difference on opening cash position 31 15 074 8 205
Cash and cash equivalents at end of year 32 34 179 141 392

Datatec Annual Report 2008
106
for the year ended 29 February 2008
2008US$’000
2007US$’000
1. REVENUESale of goods 3 750 079 2 999 231 Services rendered 257 853 168 541
4 007 932 3 167 772
2008 2007
Number of shares
(‘000)
Weighted average
grant priceNumber of shares
(‘000)
Weightedaverage
grant price
2. SHARE-BASED PAYMENTS The Group plans are detailed in the remuneration report on pages 68 to 81. They provide for a grant price equal or approximately equal to the market price at the date of the grant. The vesting periods for the different plans range between two and four years. Equity-settled schemesDatatec Share Appreciation Rights Scheme (“SARS”) (i) denominated in ZAR ZAR ZAR Outstanding at beginning of year 808 18,83 545 13,76 Granted during year 345 38,64 326 22,79 Forfeited during year (95) 35,64 (63) 18,44
Outstanding at end of year 1 058 23,78 808 18,83
Exercisable at end of year – –
The ZAR-denominated SARs outstanding at 29 February 2008 had a weighted average remaining contractual life of 5,1 years (2007: 5,7 years).(ii) denominated in GBP GBP GBP Outstanding at beginning of year – – – – Granted during year 273 2,36 – – Forfeited during year – – – –
Outstanding at end of year 273 2,36
Exercisable at end of year 91 2,36 –
The GBP-denominated SARs outstanding at 29 February 2008 had a weighted average remaining contractual life of 3,2 years.
Datatec Long-Term Incentive Plan (“LTIP”) Outstanding at beginning of year 737 494 Granted during year 297 292 Forfeited during year (72) (49)
Outstanding at end of year 962 737
Exercisable at end of year – –
Datatec Deferred Bonus Plan (“DBP”) Outstanding at beginning of year 206 135 Granted during year 72 71 Forfeited during year (22) –
Outstanding at end of year 256 206
Exercisable at end of year – –
Notes to the Group annual financial statements

107
Datatec Annual Report 2008
2008 2007
Number of shares
(‘000)
Weighted average
grant priceNumber of shares
(‘000)
Weightedaverage
grant price
2. SHARE-BASED PAYMENTS (continued)Datatec Share Option Scheme (“The Datatec Scheme”) ZAR ZAR Outstanding at beginning of year 6 187 15,15 7 722 15,39 Forfeited during year (88) 17,05 (679) 25,87 Exercised during year (2 225) 10,87 (856) 10,22
Outstanding at end of year 3 874 17,59 6 187 15,15
Exercisable at end of year 3 449 18,56 5 010 16,44
The weighted average share price at the date of exercise for the share options exercised during the year was ZAR 40,45 (2007: ZAR 29,43). The options outstanding at 29 February 2008 had a weighted average remaining contractual life of 4,81 years (2007: 5,66 years).
Cash-settled schemes
Westcon Group, Inc. Share Options US$ US$ Outstanding at beginning of year 8 1 280,00 9 1 280,00 Forfeited during year – – (1) 1 280,00
Outstanding at end of year 8 1 280,00 8 1 280,00
Exercisable at end of year 3 1 280,00 3 1 280,00
The options outstanding at 29 February 2008 had a weighted remaining contractual life of 3,8 years (2007: 5,7 years).
Westcon Group, Inc. Share Appreciation Rights (“SARS”) US$ US$ Outstanding at beginning of year 8 1 211,00 7 960,00 Granted during year 3 2 590,00 2 1 990,00 Forfeited during year (1) 2 385,00 (1) 1 172,00 Exercised during year (1) 1 052,00 – 960,00
Outstanding at end of year 9 1 526,00 8 1 211,00
Exercisable at end of year 460 –
The options outstanding at 29 February 2008 had a weighted average remaining contractual life of 1,6 years (2007: 2,2 years).
Logicalis Scheme (“The Logicalis SAR Scheme”) US$ US$ Outstanding at beginning of year 2 265 2,53 1 250 2,10 Granted during year 836 3,82 1 100 3,00 Forfeited during year (43) 3,00 (85) 2,31 Exercised during year (155) 2,10 – –
Outstanding at end of year 2 903 2,91 2 265 2,53
Exercisable at end of year 460 –
The SARS outstanding at 29 February 2008 had a weighted average remaining contractual life of 2,9 years (2007: 3,8 years).

Datatec Annual Report 2008
108
for the year ended 29 February 2008
2008 2007
Number of shares
(‘000)
Weighted average
grant priceNumber of shares
(‘000)
Weightedaverage
grant price
2. SHARE-BASED PAYMENTS (continued)Analysys Mason Share-based Remuneration Schemes GBP GBP Outstanding at beginning of year 56 19,40 50 16,47 Granted during year 45 21,72 26 22,45 Forfeited during year (17) 12,99 (20) 15,98
Outstanding at end of year 84 20,17 56 19,40
Exercisable at end of year – –
The awards outstanding at 29 February 2008 had a weighted average remaining contractual life of 2,1 years (2007: 3,3 years).
The Westcon SA SAR Scheme ZAR ZAR Outstanding at beginning of year 25 39,73 – – Granted during year 23 74,71 25 39,73
Outstanding at end of year 48 56,30 25 39,73
Exercisable at end of year – –
The SARs outstanding at 29 February 2008 had a weighted average remaining contractual life of 3,8 years (2007: 4,3 years).
The OnLine SAR Scheme US$ US$Outstanding at beginning of year 20 16,18 – –Granted during year 17 19,70 20 16,18 Forfeited during year (7) 18,13 – –
Outstanding at end of year 30 17,73 20 16,18
Exercisable at end of year – –
The options outstanding at 29 February 2008 had a weighted average remaining contractual life of 3,7 years (2007: 4,2 years).
Fair value is measured by use of an actuarial binomial model for the equity-settled share-based payments and by use of a Black-Scholes-Merton model for cash-settled share-based payments. The expected life used in the models has been adjusted, based on management’s best estimate, for the effects of non-transferability, exercise restrictions and behavioural considerations.
In determining valuations, expected volatility was determined by calculating the historical volatility of the Group’s share price over the previous four years. The expected volatility for share-based instruments that exist in unlisted subsidiary companies in the Group is based on peer data.
2008US$’000
2007US$’000
Expense in respect of equity-settled schemes 2 308 1 375 Expense in respect of cash-settled schemes 6 380 7 568
8 688 8 943
Notes to the Group annual financial statements continued

109
Datatec Annual Report 2008
2008US$’000
2007US$’000
3. OPERATING PROFITOperating profit is arrived at after taking into account the following items: Auditors’ remuneration Audit fees 3 634 2 816 Other services and expenses 342 424 – Taxation services 227 330 – Other services 115 2 121 Less amount capitalised – (2 027)
3 976 3 240
Depreciation Office furniture, equipment and motor vehicles 1 706 1 340 Computer equipment and software 9 354 7 880 Land and buildings 76 76 Leasehold improvements 2 046 1 106
13 182 10 402 Amortisation of capitalised development expenditure 3 278 3 274 Amortisation of other intangible assets 10 345 5 396
Total depreciation and amortisation 26 805 19 072
Foreign exchange gains Realised 4 736 3 693 Unrealised 5 315 6 314
Net foreign exchange gains 10 051 10 007
Impairment losses recognised on trade receivables 6 425 4 584 Reversal of impairment losses recognised on trade receivables (4 554) (3 060)
Fees for services Administrative 1 390 791 Managerial 172 631 Technical 2 263 1 732
3 825 3 154
Operating lease rentals Property 19 994 15 428 Computer equipment 1 055 796 Office furniture, equipment and motor vehicles 1 903 1 970
22 952 18 194
Net (profit) loss on disposal of: Office furniture, equipment and motor vehicles (80) 6
Retirement benefit contributions 7 349 5 175
Staff costs 345 556 254 855
Directors’ emoluments Executive directors Salaries 1 585 1 456 Incentive bonuses 1 164 1 100 Benefits 321 189
3 070 2 745
Non-executive directors’ fees 631 402
3 701 3 147
Full details of directors’ emoluments are provided in the remuneration report on pages 68 to 81.

Datatec Annual Report 2008
110
for the year ended 29 February 2008
2008US$’000
2007US$’000
4. FINANCING COSTS Interest paid Finance leases 200 174 Bank overdraft and trade finance 26 641 19 121
26 841 19 295
5. TAXATION 5.1 Taxation charge
South African normal taxation: Current taxation – current year 3 644 1 337
– prior year (2 483) (70) Deferred taxation – current year (230) (59)
– prior year 91 –
1 022 1 208
Foreign taxation: Current taxation – current year 32 953 20 826
– prior year (1 644) (2 813) Deferred taxation – current year (3 159) 7 622
– prior year (926) 462
27 224 26 097
Total taxation charge 28 246 27 305
5.2 Reconciliation of taxation rate to profit before taxation South African statutory tax rate 29,0% 29,0%Tax losses utilised (5,2%) (9,8%)Permanent differences 7,2% 6,1%Foreign taxation rate differential 3,6% 4,7%Tax losses and other deferred tax assets not recognised (4,0%) 3,2%Prior year adjustment (4,4%) (2,7%)Rate adjustment (0,1%) 0,0%
Effective taxation rate 26,1% 30,5%
Certain subsidiaries had tax losses at the end of the financial year that are available to reduce the future taxable income of the Group estimated to be: 42 639 76 540
Estimated future tax relief at an estimated tax rate of 27,6% (2007: 30,9%) is $11,8 million. A deferred tax asset of $4,7 million has already been recognised in respect of these losses (2007: $5,5 million) as set out in Note 13. 11 763 23 680
6. DISPOSALS AND DISCONTINUED OPERATIONS Loss on disposal of investments – (55)Profit on disposal and closure of discontinued operations – 24
Loss after taxation – (31)
Notes to the Group annual financial statements continued

111
Datatec Annual Report 2008
2008US$’000
2007US$’000
7. EARNINGS PER SHARE Reconciliation of attributable profit to headline earnings Profit for the year attributable to equity holders of the parent 75 654 60 049 Headline earnings adjustments: 256 1 177 Goodwill adjustments 314 1 142 Loss on disposal and closure of discontinuing operations – 31 Net (profit)/loss on disposal of property, plant and equipment (80) 6
234 1 179 Tax effect 24 (2) Minorities’ interest (2) 0
Headline earnings 75 910 61 226
Reconciliation of headline earnings to underlying earnings Underlying earnings adjustments: 2 886 (2 366) Unrealised foreign exchange gains (5 315) (6 314) Amortisation of acquired intangible assets 10 345 5 396
5 030 (918) Tax effect (3 074) (1 607) Minorities’ interest 930 159
Underlying earnings 78 796 58 860
US cents US cents
Basic earnings per share 45,4 40,0 Headline earnings per share 45,6 40,8 Underlying earnings per share 47,3 39,2
The earnings metrics above are calculated on the weighted average number of shares in issue during the year of 166 459 347 (2007: 149 786 450). Diluted earnings per share 44,6 39,2 Diluted headline earnings per share 44,7 40,0 Diluted underlying earnings per share 46,4 38,5
The diluted earnings metrics above are calculated on the diluted weighted average number of shares in issue during the year of 169 696 485 (2007: 153 092 881), taking into account the difference between the number of shares issuable and the number of shares that would be issued at fair value in respect of the 3 874 157 (2007: 6 187 158) options granted, but not exercised.
2008US$’000
2007US$’000
8. INTEREST IN PROFITS AND LOSSES OF SUBSIDIARIES Interest in the aggregate amount of profits and losses of subsidiaries after taxation Profits – continuing operations 73 115 50 617 Losses – continuing operations (171) (2 560)
72 944 48 057

Datatec Annual Report 2008
112
for the year ended 29 February 2008
2008US$’000
2007US$’000
Cost Accumulateddepreciation
Net bookvalue Cost
Accumulateddepreciation
Net bookvalue
9. PROPERTY, PLANT AND EQUIPMENT Office furniture, equipment and motor vehicles 18 447 12 090 6 357 13 943 11 143 2 800 Computer equipment and software 75 976 59 810 16 166 71 296 59 296 12 000 Leasehold improvements 16 887 8 561 8 326 13 720 7 660 6 060 Land and buildings 1 905 534 1 371 1 905 458 1 447
113 215 80 995 32 220 100 864 78 557 22 307
Included in property, plant and equipment are assets held under finance lease agreements with a book value of $0,3 million (2007: $0,1 million) which are encumbered as security for liabilities under finance lease agreements as stated in Note 17. A register of land and buildings is maintained at the Company’s registered office and may be inspected by members of the public or their duly authorised agents.
Movement of property, plant and equipment (US$’000)
Office furniture
equipment and motor
vehicles
Computer equipment
and software Leasehold
improvements Land and buildings Total
2008Net book value at beginning of year 2 800 12 000 6 060 1 447 22 307 Subsidiaries acquired 621 2 495 – – 3 116 Additions 4 576 10 143 3 783 – 18 502 Translation differences 55 1 252 628 – 1 935
8 052 25 890 10 471 1 447 45 860 Disposals 11 (370) (99) – (458)Depreciation (1 706) (9 354) (2 046) (76) (13 182)
Net book value at end of year 6 357 16 166 8 326 1 371 32 220
2007Net book value at beginning of year 2 590 11 464 4 527 1 597 20 178 Subsidiaries acquired 135 538 34 – 707 Additions 1 376 7 106 2 150 – 10 632 Translation differences 108 862 412 (74) 1 308
4 209 19 970 7 123 1 523 32 825 Disposals (69) (90) 43 – (116)Depreciation (1 340) (7 880) (1 106) (76) (10 402)
Net book value at end of year 2 800 12 000 6 060 1 447 22 307
Notes to the Group annual financial statements continued

113
Datatec Annual Report 2008
2008US$’000
2007US$’000
10. GOODWILL Net book value 284 769 163 728 At beginning of year 162 586 125 294 Arising on acquisition of subsidiaries 120 817 37 050 Other 1 366 1 384 Adjustment (421) (1 142)
Balance at end of year 284 348 162 586 Goodwill at cost 360 566 238 383 Accumulated impairment (76 218) (75 797)Per division 284 348 162 586 Westcon 163 628 54 081 Logicalis 89 431 81 309 Analysys Mason 20 016 16 698 Other Holdings 11 273 10 498
Impairment tests are conducted annually on goodwill based on value-in-use calculations of the cash-generating unit to which the goodwill belongs. This includes an assessment of future cash flows over periods ranging from three years to 10 years. The future cash flows are discounted at rates appropriate to the investment and vary from 10% to 15%.
During the year goodwill reduced by $0,4 million (2007: $1,1 million). This reduction is primarily as a result of a deferred tax asset subsequently recognised in African Legend Indigo from the acquisition of African Legend in 2006. In terms of IFRS 3, if a tax asset is not recognised at acquisition due to uncertainty over its recoverability, but is subsequently realised through use of losses, there will be a benefit to income. The Group is required to reduce the amount of goodwill which is attributable to the value of the deferred tax asset and recognise this as an expense in the income statement.
11. OTHER INTANGIBLE ASSETS 11.1 Capitalised development expenditure
Net book value 19 916 17 342 At beginning of year 14 068 12 317 Amounts capitalised 5 987 5 040 Other (139) (15)Amounts amortised (3 278) (3 274)
Balance at end of year 16 638 14 068 Capitalised development expenditure at cost 41 053 35 205 Accumulated amortisation and impairment (24 415) (21 137)
11.2 Acquired intangible assets Net book value 65 301 26 116 At beginning of year 20 720 8 098 Arising on acquisition of subsidiaries 44 939 18 018 Disposals (875) – Translation 517 – Amortisation (10 345) (5 396)
Balance at end of year 54 956 20 720
Intangibles at cost 72 931 28 350 Accumulated amortisation and impairment (17 975) (7 630)

Datatec Annual Report 2008
114
for the year ended 29 February 2008
12. INVESTMENTS Investments currently comprise one investment in a joint venture which is equity accounted. Details of the Group’s investment are:
% Ownership Fair value
Name Country 2008 2007 2008
US$’0002007
US$’000
Neteks JV Turkey 50 – 3 652 –
2008US$’000
2007US$’000
Summarised financial information in respect of the above joint venture:
Total assets 13 985 – Total liabilities (12 458) –
Net assets 1 527 –
Group’s share of net assets of joint venture 764 –
Total revenue 28 280 – Profit for the period 242 –
Group’s share of profits of joint venture 121 –
13. DEFERRED TAX ASSETS/(LIABILITIES) 13.1 Movement of deferred tax assets
Balance at beginning of year 22 415 24 072 Arising on acquisition of subsidiaries 889 – Charge/(credit) to income statement 6 292 (2 975)Other movements (336) 1 318
29 260 22 415
Analysis of deferred tax assets Capital allowances 1 505 1 792 Provisions 16 389 11 854 Effect of tax losses 4 683 5 461 Other temporary differences 6 683 3 308
29 260 22 415
13.2 Movement of deferred tax liabilities Balance at beginning of year (13 232) (5 875)Arising on acquisition of subsidiaries (8 604) (2 267)Credit to income statement (2 068) (5 050)Other movements (594) (40)
(24 498) (13 232)
Analysis of deferred tax liabilities Capital allowances (754) (1 506)Other temporary differences (23 744) (11 726)
(24 498) (13 232)
Notes to the Group annual financial statements continued

115
Datatec Annual Report 2008
2008US$’000
2007US$’000
14. INVENTORIES Spares/maintenance inventory 7 764 7 907 Work in progress 795 5 839 Finished goods 50 903 17 922 Merchandise for resale 297 776 252 323
357 238 283 991 Inventory provisions (16 202) (15 047)
341 036 268 944
Obsolete inventory amounting to $1,7 million (2007: $3,9 million) was written off during the year.
The Group has certain limited return policies with its major vendors to reduce risk of technological obsolescence of inventories.
$208,1 million (2007: $202,7 million) inventories are encumbered.
In December 2007, one of Westcon’s European subsidiaries entered into a new inbound inventory flooring agreement with a certain major vendor’s purchases for a maximum of $11,0 million which extends payment terms from 30 days to 60 days. The agreement may be cancelled at any time with 60-days’ notice by either the Company or the vendor. The agreement bears an interest rate of 8% above the LIBOR rate (11,1% as of 29 February 2008).
15. TRADE RECEIVABLES Trade receivables 779 765 576 624 Receivables allowance (10 436) (10 501)
769 329 566 123
All trade receivables represent financial assets of the Group and are classified as loans at amortised cost.
$699,1 million (2007: $535,2 million) of trade receivables are encumbered as set out in Note 21. The carrying value of receivables balances approximates the fair value.
Trade receivables older than 90 days are assessed and provided for based on estimated irrecoverable amounts from the sale of goods, determined by reference to past default experience.
Before accepting any new customer, use is made of local external credit agencies, where necessary, to assess the potential customer’s credit quality and define credit limits by customer. Limits attributed to customers are reviewed regularly.
There are no customers who represent more than 5% of the total balance of trade receivables.
Included in the Group’s trade receivable balance are debtors with a carrying amount of $195,2 million (2007: $96,4 million) which are past due at the reporting date for which the Group has not provided as there has not been a significant change in credit quality and the amounts are still considered recoverable. The Group does not hold any collateral over these balances. However, the weighted average write-off rate over recent years across all classes of trade receivables is 0,8% (2007: 0,7%). The Group is therefore confident that it has provided adequately for any possible bad debt write-offs, as the receivables allowances exceed this write-off rate.

Datatec Annual Report 2008
116
for the year ended 29 February 2008
15. TRADE RECEIVABLES (continued)Analysis of the age of financial assets that are past due but not impaired
(US$’000)North
AmericaSouth
AmericaUK and Europe
Asia- Pacific
Middle East/Africa Total
20081 month past due 29 247 3 947 66 211 7 910 16 139 123 454 2 months past due 6 275 1 342 22 214 2 825 4 453 37 109 3 months past due 1 935 761 7 227 535 5 767 16 225 4 months and greater past due 9 079 1 131 4 619 556 3 021 18 406
46 536 7 181 100 271 11 826 29 380 195 194
20071 month past due 22 899 1 811 19 664 3 543 8 781 56 698 2 months past due 6 644 767 9 331 2 210 2 319 21 271 3 months past due 2 490 247 1 746 1 138 1 173 6 794 4 months and greater past due 4 396 363 3 828 398 2 638 11 623
36 429 3 188 34 569 7 289 14 911 96 386
The increase in receivables past due but not impaired is as a result of the acquisitions during the year and higher levels of revenue.Reconciliation of the receivables allowance account
(US$’000)North
AmericaSouth
AmericaUK and Europe
Asia- Pacific
Middle East/Africa Total
2008Opening balance (3 280) (316) (4 777) (713) (1 415) (10 501)Impairment losses recognised on receivables (3 037) (138) (1 202) (626) (1 422) (6 425)Impairment losses reversed 358 96 3 398 331 371 4 554 Bad debt write offs 1 374 – (227) 546 297 1 990 Exchange gains and losses – (43) (7) (53) 49 (54)
Closing balance (4 585) (401) (2 815) (515) (2 120) (10 436)
2007Opening balance (4 877) (436) (4 108) (646) (1 497) (11 564)Impairment losses recognised on receivables (2 282) (106) (929) (564) (703) (4 584)Impairment losses reversed 219 220 1 727 334 560 3 060 Bad debt write offs 3 660 3 (1 142) 208 104 2 833 Exchange gains and losses – 3 (325) (45) 121 (246)
Closing balance (3 280) (316) (4 777) (713) (1 415) (10 501)
In determining the recoverability of a trade receivable, the Group considers any change in the credit quality of the trade receivable from the date credit was initially granted up to the reporting date. The concentration of credit risk is limited due to the customer base being large and geographically diverse. Accordingly, the directors believe that there is no further credit provision required in excess of the allowance for doubtful debts.
Notes to the Group annual financial statements continued

117
Datatec Annual Report 2008
15. TRADE RECEIVABLES (continued)Analysis of impaired trade receivablesIncluded in the allowance for doubtful debts are individually impaired trade receivables with a balance of $38,3 million (2007: $43,3 million). The impairment recognised represents the difference between the carrying amount of these trade receivables and the present value of any expected collections.
(US$’000)North
AmericaSouth
AmericaUK and Europe
Asia- Pacific
Middle East/Africa Total
2008Gross value of debtors that have been individually impaired 23 531 1 631 2 815 16 215 4 589 48 781 Impairment loss against these debtors (4 585) (401) (2 815) (515) (2 120) (10 436)
18 946 1 230 – 15 700 2 469 38 345
2007Gross value of debtors that have been individually impaired 39 812 1 339 4 777 5 652 2 267 53 847 Impairment loss against these debtors (3 280) (316) (4 777) (713) (1 415) (10 501)
36 532 1 023 – 4 939 852 43 346
The Group does not hold any collateral against these specific debtors.
2008US$’000
2007US$’000
16. SHARE CAPITAL AND PREMIUM Authorised share capital 400 000 000 (2007: 400 000 000) ordinary shares of R0,01 each Issued share capital 220 215 169 206 941 (2007: 155 298 505) ordinary shares of R0,01 each Share premium 224 595 197 802
224 815 198 017
Reconciliation of issued shares, share capital and share premium Numberof shares
Share capital
US$’000
Sharepremium
US$’000
Balance at 1 March 2006 146 359 468 237 209 097 Issue of shares for share options 956 015 2 2 868 Issue of shares for acquisitions 748 349 1 2 245 Issue of shares in institutional placement 7 234 673 10 21 704 Capital distribution (6 589)Effects of foreign currency translation (35) (31 523)
Balance at 1 March 2007 155 298 505 215 197 802 Issue of shares for share options 2 224 776 3 9 887 Issue of shares for acquisitions 5 108 330 7 22 701 Issue of shares in institutional placement 7 200 000 10 31 997 Share buy-back (624 670) (1) (2 400)Treasury shares acquired during the year (3 730)Capital distribution (16 775)Effects of foreign currency translation (14) (14 887)
Balance at 29 February 2008 169 206 941 220 224 595
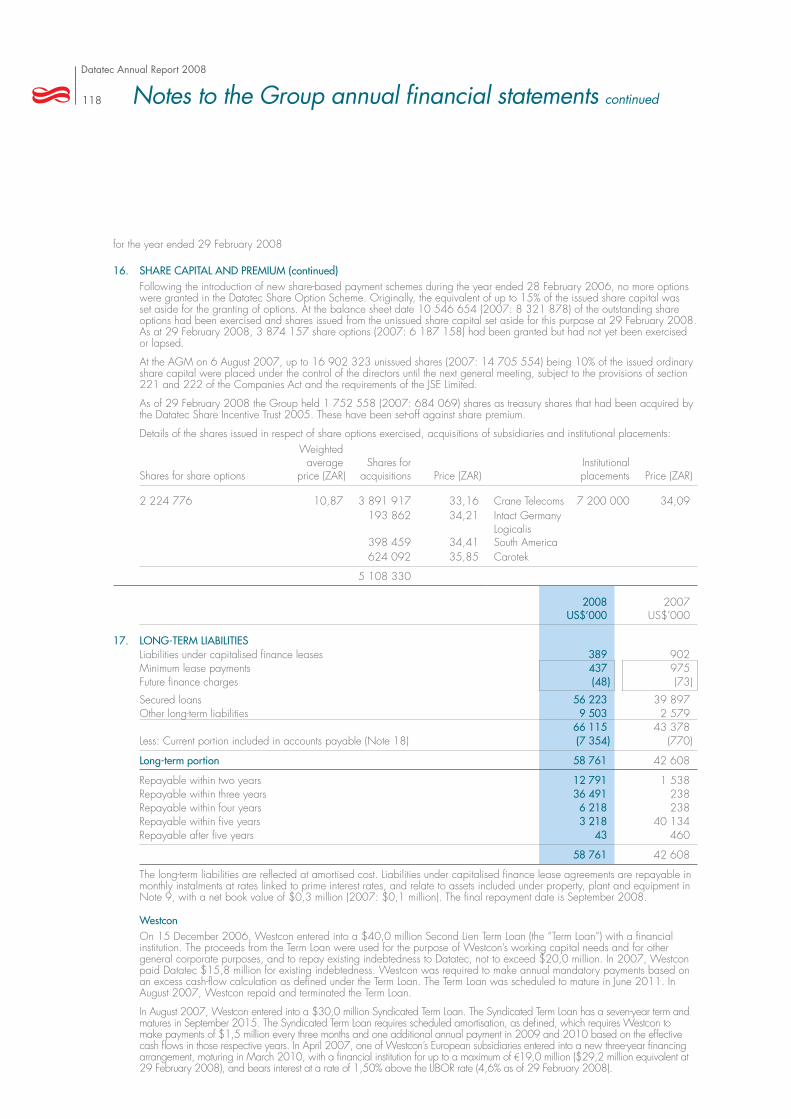
Datatec Annual Report 2008
118
for the year ended 29 February 2008
16. SHARE CAPITAL AND PREMIUM (continued)Following the introduction of new share-based payment schemes during the year ended 28 February 2006, no more options were granted in the Datatec Share Option Scheme. Originally, the equivalent of up to 15% of the issued share capital was set aside for the granting of options. At the balance sheet date 10 546 654 (2007: 8 321 878) of the outstanding share options had been exercised and shares issued from the unissued share capital set aside for this purpose at 29 February 2008. As at 29 February 2008, 3 874 157 share options (2007: 6 187 158) had been granted but had not yet been exercised or lapsed.
At the AGM on 6 August 2007, up to 16 902 323 unissued shares (2007: 14 705 554) being 10% of the issued ordinary share capital were placed under the control of the directors until the next general meeting, subject to the provisions of section 221 and 222 of the Companies Act and the requirements of the JSE Limited.
As of 29 February 2008 the Group held 1 752 558 (2007: 684 069) shares as treasury shares that had been acquired by the Datatec Share Incentive Trust 2005. These have been set-off against share premium.
Details of the shares issued in respect of share options exercised, acquisitions of subsidiaries and institutional placements:
Shares for share options
Weighted average
price (ZAR)Shares for
acquisitions Price (ZAR)Institutionalplacements Price (ZAR)
2 224 776 10,87 3 891 917 33,16 Crane Telecoms 7 200 000 34,09 193 862 34,21 Intact Germany
398 459 34,41 Logicalis South America
624 092 35,85 Carotek
5 108 330
2008US$’000
2007US$’000
17. LONG-TERM LIABILITIES Liabilities under capitalised finance leases 389 902 Minimum lease payments 437 975 Future finance charges (48) (73)
Secured loans 56 223 39 897 Other long-term liabilities 9 503 2 579
66 115 43 378 Less: Current portion included in accounts payable (Note 18) (7 354) (770)
Long-term portion 58 761 42 608
Repayable within two years 12 791 1 538 Repayable within three years 36 491 238 Repayable within four years 6 218 238 Repayable within five years 3 218 40 134 Repayable after five years 43 460
58 761 42 608
The long-term liabilities are reflected at amortised cost. Liabilities under capitalised finance lease agreements are repayable in monthly instalments at rates linked to prime interest rates, and relate to assets included under property, plant and equipment in Note 9, with a net book value of $0,3 million (2007: $0,1 million). The final repayment date is September 2008.
WestconOn 15 December 2006, Westcon entered into a $40,0 million Second Lien Term Loan (the “Term Loan”) with a financial institution. The proceeds from the Term Loan were used for the purpose of Westcon’s working capital needs and for other general corporate purposes, and to repay existing indebtedness to Datatec, not to exceed $20,0 million. In 2007, Westcon paid Datatec $15,8 million for existing indebtedness. Westcon was required to make annual mandatory payments based on an excess cash-flow calculation as defined under the Term Loan. The Term Loan was scheduled to mature in June 2011. In August 2007, Westcon repaid and terminated the Term Loan.
In August 2007, Westcon entered into a $30,0 million Syndicated Term Loan. The Syndicated Term Loan has a seven-year term and matures in September 2015. The Syndicated Term Loan requires scheduled amortisation, as defined, which requires Westcon to make payments of $1,5 million every three months and one additional annual payment in 2009 and 2010 based on the effective cash flows in those respective years. In April 2007, one of Westcon’s European subsidiaries entered into a new three-year financing arrangement, maturing in March 2010, with a financial institution for up to a maximum of €19,0 million ($29,2 million equivalent at 29 February 2008), and bears interest at a rate of 1,50% above the LIBOR rate (4,6% as of 29 February 2008).
Notes to the Group annual financial statements continued

119
Datatec Annual Report 2008
2008US$’000
2007US$’000
18. Trade and other payables 18.1 Trade payables 697 882 534 662
Other payables 159 437 129 141 Current portion of long-term liabilities (Note 17) 7 354 770
864 673 664 573
The carrying value of liabilities approximates their fair value. Trade accounts payable will be settled in normal trade operations.
18.2 Foreign liabilities Uncovered foreign liabilities at the balance sheet date: Trade accounts payable US Dollars – 9 665 Euro 160 528 Pounds Sterling 7 996 4 774 Other 26 010 – Paraguayan Guanari 458 – Argentinian Peso 21 533 – Peruvian Nuevo Sol 796 – Uruguayan Peso 3 223 –
Certain of Westcon’s European subsidiaries have arrangements with a financial institution to provide up to an aggregate of $250 million of vendor inventory purchase financing which effectively enables Westcon to obtain extended payment terms (normally 60 days from receipt of product) on inventory it purchases from Cisco. Westcon becomes obligated to pay the financial institution upon receipt of the product, at which time title passes to Westcon. The financial institution may, at any time upon the occurrence of certain events, including late payments under the arrangements and a cross-default to non-payment of other debt, terminate the funding. Obligations under these financings are guaranteed by Westcon Group, Inc. and several of Westcon’s European subsidiaries and are secured by inventory and inter-company accounts receivable relating to the sale of Cisco products in Europe.
Westcon’s subsidiaries that are party to this funding must also comply with financial covenants that establish minimum liquidity and a minimum net profit before tax to revenue percentage and maximum leverage. These arrangements also prohibit Westcon’s European subsidiaries from paying dividends to Westcon. As part of this arrangement, Westcon is required to maintain cash on deposit with the financial institution to be used as security. These deposits earn interest at the 30 day LIBOR rate. As of 29 February 2008, $184,4 million (2007: $180,2 million) was outstanding under these arrangements and is included in accounts payable.

Datatec Annual Report 2008
120
for the year ended 29 February 2008
2008US$’000Onerous contract
provisions
2008US$’000
Other
19. PROVISIONS Balance at 1 March 2006 3 399 10 573 Amounts added 168 1 852 Amounts utilised (1 229) (2 430)Amounts unused (25) (5 376)Translation differences 202 278
Balance at 1 March 2007 2 515 4 897 Amounts added 420 10 880 Amounts utilised (94) (4 272)Amounts unused (1 506) (626)Translation differences 73 861
Balance at 29 February 2008 1 408 11 740
Total provisions at 29 February 2008 13 148
Onerous contract provisions relate to building rentals where the costs of the rentals exceed the economic benefits expected to be received therefrom. Other provisions are an accumulation of expected legal costs, restructuring provisions and provisions for possible taxes in some foreign jurisdictions.
These provisions are exclusive of accounts receivable and inventory provisions.
2008US$’000
2007US$’000
20. AMOUNTS OWING TO VENDORS Purchase considerations owing 2 000 4 044
Amounts owing to vendors represent purchase considerations owing in respect of acquisitions. These purchase considerations are to be settled with the vendors in cash or shares on fulfilment of the relevant profit warranties. The amounts owing are interest-free and will be settled within the next year. Any additional amounts payable to vendors will be allocated to the goodwill arising on acquisition and will have no effect on the income statement.
21. BANK OVERDRAFTS Total bank overdrafts at year-end 210 503 82 215
South Africa and Other HoldingsThe Group has general short-term banking facilities amounting to R24 million (2007: R24 million) with The Standard Bank of South Africa Limited, bearing interest at the South African prime interest rate (14,5% as at 29 February 2008 and 12,5% as at 28 February 2007). In terms of the cash management system operated in SA, various cross-guarantees have been put in place to restrict the overall exposure to the amount of the banking facility.
Datatec Limited stands guarantor to OnLine Distribution who have a facility of $1,5 million with HSBC Bank in the Middle East (2007: $1,5 million), backed by a lien on a deposit of $0,5 million by Online Distribution. The facility bears interest at 4,6% (2007: 10,3%) and inventory and accounts receivable balances have been pledged as collateral.
Datatec Limited stands guarantor to Westcon SA (Pty) Ltd in respect of their supplier, Cisco Systems International BV. The guarantee is for an amount of $12 million and it expires on 30 June 2008.
Notes to the Group annual financial statements continued

121
Datatec Annual Report 2008
21. BANK OVERDRAFTS (continued)WestconIn 2006, Westcon entered into a $150,0 million Revolving Credit Facility for its US and Canadian subsidiaries with various US and Canadian lenders and was scheduled to mature in June 2011. In August 2007, Westcon amended the Revolving Credit Facility (the “Revolver”) to increase the borrowing limit from $150,0 million to $250,0 million with substantially the same syndicate and to extend the maturity date. The Revolver has a five-year term and matures in August 2012. The Revolver also includes an accordion feature which gives Westcon the right to require the lead bank to increase the facility up to an additional $40,0 million without a vote of the syndicate by identifying a willing lender on these terms.
The Revolver allows for the issuance of irrevocable commercial or standby letters of credit of up to $10,0 million. As of 29 February 2008, $2,1 million in letters of credit was outstanding, which reduced the amount available under the Revolver. The Revolver bears interest at the rate of LIBOR plus 1,25%. The Revolver also calls for a commitment fee of 0,2% per annum on the unutilised portion. Borrowings under the Revolver are collateralised by: (i) a pledge of 100% of the stock of Westcon’s subsidiaries in the United States and a pledge of 66,7% of the stock of Westcon’s subsidiary in Canada and (ii) a security interest in substantially all of the assets of Westcon’s subsidiaries in the United States and Canada.
The Revolver contains certain affirmative and negative covenants including, but not limited to, financial covenants establishing a minimum fixed charge ratio, minimum last 12-month EBITDA (as defined in the Revolver agreement) and total funded debt to EBITDA, and covenants that restrict Westcon’s US and Canadian subsidiaries’ ability to incur debt, create liens, make acquisitions and investments, sell assets and place limitations on the ability of Westcon’s US and Canadian subsidiaries to pay dividends to Westcon. As of 29 February 2008, Westcon was in compliance with all such covenants. The effective interest rate at 29 February 2008 was 4,7%.
In February 2008, one of Westcon’s United Kingdom subsidiaries entered into a new accounts receivable financing arrangement with a financial institution. Advances under this arrangement are generally available for up to 85% of the subsidiary’s eligible accounts receivable up to a maximum of €45,0 million ($68,3 million at 29 February 2008), and bear interest at a rate of 1,5% above the LIBOR rate (4,6% as of 29 February 2008), or, if the discounting account is kept in a currency other than Euro, its equivalent for that currency quoted from time to time by HSBC Bank PLC (or its successors) for London-based accounts. The duration of this agreement is 36 months.
Westcon’s Australian subsidiary has an arrangement with a financial institution to provide up to $18,0 million of accounts receivable, foreign currency settlement and other financing. The advances under the accounts receivable arrangement are generally available for up to 85% of the subsidiary’s eligible accounts receivable and bear interest at the financial institution’s base rate plus 1,5% (currently 9,1% per annum). This arrangement contains financial covenants setting forth requirements for minimum earnings before interest and taxes to fixed charge coverage ratio, minimum after-tax retained earnings and minimum net inventory value to amount outstanding under the arrangement.
LogicalisLogicalis operates a treasury management system with Barclays Bank PLC in the UK and has an overdraft facility, subject to an accounts receivable security covenant and a fixed and floating security charge, to a maximum of £12 million (2007: £2 million). During the year cross-guarantees were in place between the UK operating companies in order for them to benefit from pooling their financial resources by using the treasury management system. The overdraft facility is repayable on demand and bears interest at the UK base rate plus 1,75%. At 29 February 2008 the UK base rate was 5,25%. Logicalis Computing Solutions Limited has a standby letter of credit facility with Barclays Bank PLC under which a standby letter of credit for £5 million (2007: £4 million) has been provided to a supplier. This is secured by a Datatec Limited guarantee.
Logicalis, Inc. has agreed a $60 million revolving credit facility with HSBC Business Credit (USA) Inc. in the US. The accounts receivable book of Logicalis, Inc. is security for the facility and the facility is subject to a minimum net income covenant and a fixed charge coverage covenant. The facility bears interest at HSBC’s prime rate less 0,25% or US$ LIBOR plus 2% as selected by Logicalis at the time of each draw down. At 29 February 2008 the US prime rate was 6,0% and one month US$ LIBOR was 3,1%.
At 29 February 2008, the funds drawn under the HSBC facility were $0,75 million (2007: $16,1 million) and the Barclays overdraft facility was not utilised (2007: nil).
Analysys MasonAnalysys Mason has access to general overdraft facilities amounting to £2 million (2007: £2 million), bearing interest at the UK base rate plus 1%.
CovenantsThere were no breaches of covenants during the year.

Datatec Annual Report 2008
122
for the year ended 29 February 2008
2008US$’000
2007US$’000
22. COMMITMENTS 22.1 Capital commitments
Capital expenditure authorised and contracted for 1 038 2 300 Capital expenditure authorised but not yet contracted for 10 245 9 578
Total capital commitments 11 283 11 878
This expenditure will be incurred in the ensuing year and will be financed from existing cash resources and available borrowing facilities.
22.2 Operating lease commitments Due within one year: Property 18 801 15 985 Office furniture, equipment and motor vehicles 786 1 397 Computer equipment 733 489
Total operating lease commitments due within one year 20 320 17 871
Due between one and two years: Property 16 456 14 683 Office furniture, equipment and motor vehicles 341 787 Computer equipment 510 246
Total operating lease commitments due between one and two years 17 307 15 716
Due between two and three years: Property 13 323 13 265 Office furniture, equipment and motor vehicles 343 332 Computer equipment 236 244
Total operating lease commitments due between two and three years 13 902 13 841
Due between three and four years: Property 11 191 13 920 Office furniture, equipment and motor vehicles 181 89 Computer equipment 93 –
Total operating lease commitments due between three and four years 11 465 14 009
Due between four and five years: Property 10 409 8 223 Office furniture, equipment and motor vehicles 49 71 Computer equipment 93 –
Total operating lease commitments due between four and five years 10 551 8 294
Due after five years: Property 43 141 38 308
Total non-cancellable operating lease commitments 116 686 108 039
The fair value of the operating lease commitments is approximately equal to their carrying value.
22.3 Other commitments In the event of a change of control of Westcon, should Datatec International Limited directly own less than 51% of the issued capital shares of Westcon, Datatec International has committed to pay an amount of $1,7 million to Routine Capital Corp, whose shareholder is Tom Dolan (Westcon’s CEO). This obligation expires upon the commencement of trading of Westcon common stock on the NASDAQ, New York, or London Stock Exchanges, or if Routine Capital Corp no longer owns a minority share in Westcon.
Notes to the Group annual financial statements continued
123
Datatec Annual Report 2008
23. CONTINGENT LIABILITIES, GUARANTEES AND LITIGATION Datatec and its subsidiaries have issued, in the ordinary course of business, guarantees and letters of comfort to third parties in respect of trading facilities and lease commitments. In addition, the vendor inventory purchase financing referred to in Note 18 is generally guaranteed by Westcon.
The Group has certain other contingent liabilities resulting from litigation and claims including breach of warranties where operations have been acquired or disposed of, generally involving commercial and employment matters, which are incidental to the ordinary conduct of its business. Management believes, after taking legal advice where appropriate on the probable outcome of these contingencies, that none of these contingencies will materially affect the financial position or the results of operations of the Group.
24. RELATED-PARTY TRANSACTIONS Sales and purchases between Group companies are concluded at arm’s length in the ordinary course of business. For the year ended 29 February 2008, the intergroup sales of goods and provision of services amounted to $61,0 million (2007: $25,3 million).
Datatec International Limited has a commitment to pay Routine Capital Corp, of which Tom Dolan (Westcon’s CEO) is a shareholder, $1,7 million in the event of a change in control in Westcon. Refer Note 22.3.
2008US$’000
2007US$’000
Key management personnel compensation:Short-term employee benefits 8 784 7 985 Post-employment benefits 674 613 Share-based payment 2 606 272
Key management personnel comprise the compensation of Chief Executive and Chief Financial Officers of Datatec subsidiaries. The remuneration of the Datatec CEO and Group Finance Director is included in directors’ emoluments in Note 3 and in the remuneration report.

Datatec Annual Report 2008
124
for the year ended 29 February 2008
25. FINANCIAL INSTRUMENTS 25.1 Financial risk management objectives
The Group’s senior management is responsible for monitoring and managing the financial risks relating to the operations of the Group. This is achieved through the use of internal risk analyses which analyse exposures by likelihood and magnitude of risks. These risks include market risk (including currency and interest risk), credit risk and liquidity risk.
The Group seeks to minimise the effects of these risks by using derivative financial instruments to hedge these risk exposures. The use of financial derivatives is governed by the Group’s internal policies applicable at subsidiary level. Compliance with policies and exposure limits is reviewed by the internal auditors on a continual basis. The Group does not enter into or trade financial instruments, including derivative financial instruments, for speculative purposes.
When appropriate, management reports regularly to the Group’s audit, risk and compliance committee.
The Group’s financial instruments consist mainly of cash and cash equivalents, accounts receivable, accounts payable, borrowings and derivative instruments.
25.2 Capital risk management The Group manages its capital to ensure that entities in the Group will be able to continue as a going concern while maximising the return to stakeholders. The Group’s overall strategy with respect to the debt and equity balance remains unchanged from 2007. The capital structure of the Group consists of debt, which includes the borrowings disclosed in Note 17 and 21, cash and cash equivalents and equity attributable to equity holders of the parent, comprising issued capital, Note 16, reserves and retained earnings.
25.2.1 Gearing ratio The Group’s capital structure is reviewed on at least a semi-annual basis. As part of this review, the Board considers the cost of capital and the risks associated with each class of capital.
The gearing ratio at the year-end was:
2008US$’000
2007US$’000
Long-term liabilities 58 761 42 608 Short-term portion of long-term liabilities 7 354 770 Cash and cash equivalents (34 179) (141 392)
Net debt 31 936 (98 014)Equity 678 283 552 596 Net debt to equity ratio 5% (18%)
25.3 Categories of financial instruments Financial assets Financial assets held for trading 2 690 1 318 Loans and receivables (including cash and cash equivalents) 1 040 237 806 856
Financial liabilities Financial liabilities held for trading (7 704) (1 996)Liabilities at amortised cost (979 016) (668 645)
Notes to the Group annual financial statements continued
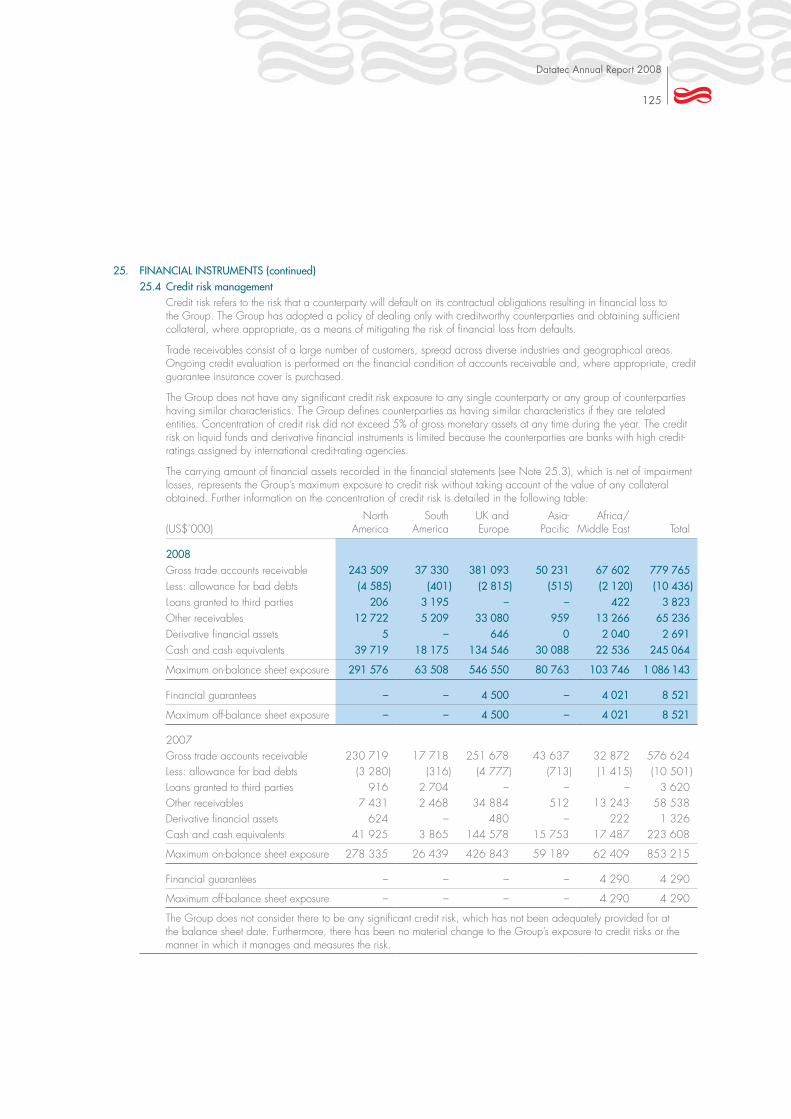
125
Datatec Annual Report 2008
25. FINANCIAL INSTRUMENTS (continued)25.4 Credit risk management
Credit risk refers to the risk that a counterparty will default on its contractual obligations resulting in financial loss to the Group. The Group has adopted a policy of dealing only with creditworthy counterparties and obtaining sufficient collateral, where appropriate, as a means of mitigating the risk of financial loss from defaults.
Trade receivables consist of a large number of customers, spread across diverse industries and geographical areas. Ongoing credit evaluation is performed on the financial condition of accounts receivable and, where appropriate, credit guarantee insurance cover is purchased.
The Group does not have any significant credit risk exposure to any single counterparty or any group of counterparties having similar characteristics. The Group defines counterparties as having similar characteristics if they are related entities. Concentration of credit risk did not exceed 5% of gross monetary assets at any time during the year. The credit risk on liquid funds and derivative financial instruments is limited because the counterparties are banks with high credit-ratings assigned by international credit-rating agencies.
The carrying amount of financial assets recorded in the financial statements (see Note 25.3), which is net of impairment losses, represents the Group’s maximum exposure to credit risk without taking account of the value of any collateral obtained. Further information on the concentration of credit risk is detailed in the following table:
(US$’000)North
AmericaSouth
AmericaUK and Europe
Asia- Pacific
Africa/Middle East Total
2008Gross trade accounts receivable 243 509 37 330 381 093 50 231 67 602 779 765 Less: allowance for bad debts (4 585) (401) (2 815) (515) (2 120) (10 436)Loans granted to third parties 206 3 195 – – 422 3 823 Other receivables 12 722 5 209 33 080 959 13 266 65 236 Derivative financial assets 5 – 646 0 2 040 2 691 Cash and cash equivalents 39 719 18 175 134 546 30 088 22 536 245 064
Maximum on-balance sheet exposure 291 576 63 508 546 550 80 763 103 746 1 086 143
Financial guarantees – – 4 500 – 4 021 8 521
Maximum off-balance sheet exposure – – 4 500 – 4 021 8 521
2007Gross trade accounts receivable 230 719 17 718 251 678 43 637 32 872 576 624 Less: allowance for bad debts (3 280) (316) (4 777) (713) (1 415) (10 501)Loans granted to third parties 916 2 704 – – – 3 620 Other receivables 7 431 2 468 34 884 512 13 243 58 538 Derivative financial assets 624 – 480 – 222 1 326 Cash and cash equivalents 41 925 3 865 144 578 15 753 17 487 223 608
Maximum on-balance sheet exposure 278 335 26 439 426 843 59 189 62 409 853 215
Financial guarantees – – – – 4 290 4 290
Maximum off-balance sheet exposure – – – – 4 290 4 290
The Group does not consider there to be any significant credit risk, which has not been adequately provided for at the balance sheet date. Furthermore, there has been no material change to the Group’s exposure to credit risks or the manner in which it manages and measures the risk.

Datatec Annual Report 2008
126
for the year ended 29 February 2008
25. FINANCIAL INSTRUMENTS (continued)25.5 Liquidity risk management
Ultimate responsibility for liquidity risk management rests with the board of directors, which has built an appropriate liquidity risk management framework for the management of the Group’s short, medium and long-term funding and liquidity requirements. The Group manages liquidity risk by maintaining adequate reserves, banking facilities and borrowing facilities and by continuously monitoring forecast and actual cash flows.
The Group is dependent on its bank overdrafts and trade finance facilities to operate. These facilities generally consist of either a fixed term or fixed period but are repayable on demand, are secured against the assets of the company to which the facility is made available and contain certain covenants which include financial covenants such as minimum liquidity, maximum leverage and pre-tax earnings coverage. In certain circumstances if these covenants are violated and a waiver is not obtained for such violation, this may, amongst other things, mean that the facility may be repayable on demand. There have been no violations of covenants during the current year nor none that exist at year-end. Included in Note 21 is a listing of additional undrawn facilities that the Group has at its disposal to further reduce liquidity risk.
The following tables detail the Group’s remaining contractual maturity for its non-derivative and derivative financial liabilities. The tables have been drawn up based on the undiscounted cash flows of financial liabilities based on the earliest date on which the Group can be required to pay. The table includes both interest and principal cash flows.
0 – 1 year 1 – 2 years 2 – 5 years > 5 years Total
2008Trade payables (697 882) – – – (697 882)Non-interest-bearing long-term liabilities (64) (384) – – (448)Fixed rate liabilities (612) (639) (12) – (1 263)Variable rate liabilities (162 690) (10 644) (38 703) – (212 037)Derivative financial liabilities (9 743) – – – (9 743)Financial guarantees/commitments (10 433) – (141) – (10 574)Other (8 646) (2 799) (1 437) – (12 882)
(890 070) (14 466) (40 293) – (944 829)
2007Trade payables (529 843) – – – (529 843)Non-interest-bearing long-term liabilities (50) (297) – – (347)Fixed rate liabilities (495) (181) – – (676)Variable rate liabilities (93 216) (43 363) – – (136 579)Derivative financial liabilities (2 193) – – – (2 193)Financial guarantees/commitments (10 644) (203) – – (10 847)
Other (7 956) (1 024) (191) – (9 171)
(644 397) (45 068) (191) – (689 656)
There has been no material change to the Group’s exposure to liquidity risks or the manner in which it manages and measures the risk.
25.6 Market risk management The Group’s activities expose it primarily to the financial risks of changes in foreign currency exchange rates (see Note 25.7) and interest rates (see Note 25.8). The Group enters into a variety of derivative financial instruments to manage its exposure to foreign currency and interest rate risk, including:
foreign currency; and
There has been no material change to the Group’s exposure to market risks or the manner in which it manages and measures the risk.
Notes to the Group annual financial statements continued

127
Datatec Annual Report 2008
25. FINANCIAL INSTRUMENTS (continued)25.7 Foreign exchange risk management
The Group operates in the global business environment and undertakes many transactions denominated in foreign currencies. The Group is exposed to the risk of fluctuating exchange rates and seeks to actively manage this exposure, within approved policy parameters and through the use of derivative instruments. These instruments primarily comprise forward exchange contracts. Forward exchange contracts require a future purchase or sale of foreign currency at a specified price. The Group does not trade with forward exchange contracts for speculative purposes.
Fluctuations in exchange rates also affect the translation of the profits of subsidiaries whose reporting currency is not the US Dollar. The most significant other currencies in which the Group trades are the South African Rand, Pound Sterling, and the Euro.
25.7.1 Foreign currency sensitivity analysisThe following table details the Group’s sensitivity to a 10% increase and decrease in the US$ against the relevant foreign currencies. Ten percent is the sensitivity rate that represents management’s assessment of the possible change in foreign exchange rates. The sensitivity analysis includes only outstanding foreign currency denominated monetary items and adjusts their translation at the period-end for a 10% change in foreign currency rates. The sensitivity analysis includes external loans as well as loans to foreign operations within the Group where the denomination of the loan is in a currency other than the currency of the lender or the borrower. A positive number below indicates an increase in profit and other equity where the US$ strengthens 10% against the functional currency. For a 10% weakening of the US$ against the relevant currency, there would be an equal and opposite impact on the profit and other equity.
(Gain)/Loss US$ GBP EUR
2008US$’000
2007US$’000
2008US$’000
2007US$’000
2008US$’000
2007US$’000
Profit before tax (3 250) 2 155 1 315 2 439 1 211 639 Other equity (339) (289) (2 929) (5 042) (106) –
25.7.2 Forward foreign exchange contracts (“FECs”)It is the policy of the Group to enter into FECs to cover specific foreign currency payments and receipts based on the known exposure generated. The Group also enters into FECs to manage the risk associated with anticipated sales and purchase transactions out to approximately six months within 100% of the anticipated exposure generated. The Group does not apply any hedge accounting.
The Group’s FECs were all bought at 29 February 2008 of which the contract amount is $171 million (2007: $110 million) which approximates fair value. Details of open FECs as at 29 February 2008 are:
Purchases/(sales)2008
US$’0002007
US$’000
EUR 121 267 (30 216)US$ 26 212 140 245 Other 23 648 (117)
171 127 109 912

Datatec Annual Report 2008
128
for the year ended 29 February 2008
25. FINANCIAL INSTRUMENTS (continued)25.8 Interest rate risk management
The Group is exposed to interest rate risk as entities in the Group borrow funds at both fixed and floating interest rates. The risk is managed by the Group by maintaining an appropriate mix between fixed and floating rate borrowings, by the use of interest rate swap contracts and forward interest rate contracts. The interest rate characteristics of new borrowings and the refinancing of existing borrowings are positioned according to expected movements in interest rates and defined risk appetite.
The Group’s exposures to interest rates on financial liabilities are detailed in the liquidity risk management section of this note (See Note 25.5).
25.8.1 Interest rate sensitivity analysesThe sensitivity analyses below have been determined based on the exposure to interest rates for both derivatives and non-derivative instruments at the balance sheet date. For floating rate liabilities, the analysis is prepared assuming the amount of liability outstanding at the balance sheet date was outstanding for the whole year. The applicable increase or decrease that represents management’s assessment of the reasonably possible change in interest rates is dependent on the location of the borrowings. Globally, if interest rates had been between 50 and 200 basis points higher and all other variables were held constant, the Group’s:
$8,4 million increase); and
The Group’s sensitivity to interest rates has decreased during the current period mainly due to the reduction in variable rate debt instruments and the increase in interest rate swaps.
25.8.2 Interest rate swap contractsIn January 2008, Westcon entered into an interest rate swap agreement to eliminate the variability of cash flows in the interest payments for $60 million notional amount of variable rate debt. This agreement was used to convert the variable rate on the revolving line of credit to a fixed rate of 4,03%. The variable rate is due to changes in the benchmark one-month LIBOR interest rate. Notional amounts do not quantify risk or represent assets or liabilities, but are used in the determination of cash settlements under the agreement. Westcon is exposed to credit losses from counterparty non-performance, but does not anticipate any losses from its agreement with a major financial institution.
2008US$’000
2007US$’000
26. CASH GENERATED FROM OPERATIONSProfit before taxation 108 282 89 433 Adjustments for:Unrealised foreign exchange gains (5 315) (6 314)Share-based payments 8 688 8 943 Share of joint venture earnings (121) – Depreciation and amortisation 26 805 19 072 (Profit)/Loss on disposal of property, plant and equipment (80) 6 Loss on disposal of investments – 55 Interest received (11 533) (9 641)Financing costs 26 841 19 295 Goodwill adjustment 421 1 142 Other non-cash items 8 762 (5 774)
Operating profit before working capital changes 162 750 116 217
Working capital changes:Increase in inventories (65 598) (58 246)Increase in accounts receivable (88 049) (122 813)Increase in accounts payable 68 312 84 909
77 415 20 067
Notes to the Group annual financial statements continued

129
Datatec Annual Report 2008
2008US$’000
2007US$’000
27. TAXATION PAIDAmounts unpaid at beginning of year (14 876) (9 492)Amounts charged to the income statement excluding deferred tax (32 470) (19 280)Other movements and translation differences 1 142 (143)Amount unpaid at end of year 16 395 14 876
(29 809) (14 039)
28. ACQUISITION OF SUBSIDIARY COMPANIESThe fair value of assets acquired and the liabilities assumed on the acquisition of subsidiary companies, net of cash acquired, is: 180 744 44 741
Property, plant and equipment 3 116 707 Intangibles 44 939 18 018 Goodwill arising on acquisitions 120 817 37 050 Accounts receivable 134 763 39 477 Inventories 29 566 1 315 Accounts payable (136 721) (48 819)Long-term liabilities (2 009) (740)Net deferred tax (9 315) (2 267)
185 156 44 741 Minority interest acquired (4 412) –
180 744 44 741
Refer also to Note 34 for details of all acquisitions during the year.
29. PROCEEDS ON DISPOSAL OF BUSINESSES AND INVESTMENTSLoss on disposal – (31)
– (31)
30. ADDITIONS TO PROPERTY, PLANT AND EQUIPMENTMaintenance of operations: Office furniture, equipment and motor vehicles 3 172 1 341 Computer equipment and software 6 724 6 498 Leasehold improvements 3 596 2 150 Expansion of operations: Office furniture, equipment and motor vehicles 1 404 80 Computer equipment and software 3 419 563 Leasehold improvements 187 –
18 502 10 632
31. TRANSLATION DIFFERENCE ON OPENING CASH POSITIONThe translation difference on the opening cash position is calculated on opening cash balances of companies that hold cash in currencies other than the US$ and not on the net cash and cash equivalents included on the balance sheet at the beginning of the year, which is inclusive of cash held in US$. 15 074 8 205
32. CASH AND CASH EQUIVALENTS AT END OF YEARCash resources 244 682 223 607 Bank overdrafts (210 503) (82 215)
34 179 141 392

Datatec Annual Report 2008
130
for the year ended 29 February 2008
33. SEGMENTAL REPORTFor management purposes the Group is currently organised into four operating divisions which are the basis on which the Group reports its primary segmental information.
Principal activities are:Westcon – Global distribution of advanced networking and communication productsLogicalis – Provision of professional services and IT network integrationAnalysys Mason – Strategic and technical telecommunications IT consultancyOther Holdings – Other distribution and service-orientated interests in SA and the Middle East and the Group Head Office including the Group unrealised foreign exchange gains/losses.
Westcon Logicalis Analysys Mason
Condensed income statement2008
US$’0002007
US$’0002008
US$’0002007
US$’0002008
US$’0002007
US$’000
Revenue 2 853 636 2 271 557 845 112 693 113 63 477 61 352 – North America 1 270 881 1 123 930 412 590 417 086 1 919 614 – South America 35 488 25 925 71 158 40 956 243 – – UK and Europe 1 351 791 927 887 362 156 238 205 37 473 42 966 – Asia-Pacific 245 753 214 709 – – 16 124 – – Africa and Middle East – – – – 7 762 17 800 – Intersegmental (50 277) (20 894) (792) (3 134) (44) (28)EBITDA 101 834 82 671 36 196 26 795 6 944 6 202 – North America 48 002 48 533 16 864 20 971 297 62 – South America 2 757 725 4 395 4 745 43 – – UK and Europe 39 358 25 380 14 937 1 079 2 933 6 140 – Asia-Pacific 11 717 8 033 – – 2 560 – – Africa and Middle East – – – – 1 111 – – Datatec central costs and
foreign exchange – – – – – – Depreciation and amortisation (15 246) (10 167) (10 055) (8 012) (705) (450)
Operating profit before goodwill adjustments 86 588 72 504 26 141 18 783 6 239 5 752 Goodwill adjustments – – – 335 – (1 477)
Operating profit 86 588 72 504 26 141 19 118 6 239 4 275 Interest received 3 513 4 563 1 758 1 386 215 159 Financing costs (20 403) (13 840) (3 698) (3 914) (14) (9)Loss on disposal of investments – – – – – – Share of associate company earnings 121 – – – – –
Profit before taxation 69 819 63 227 24 201 16 590 6 440 4 425 Taxation (20 190) (22 081) (5 365) (3 627) (1 630) (389)
Profit after taxation – continuing operations 49 629 41 146 18 836 12 963 4 810 4 036 Profit after taxation – discontinued operations – – – – – –
Profit after taxation 49 629 41 146 18 836 12 963 4 810 4 036
Notes to the Group annual financial statements continued

131
Datatec Annual Report 2008
Other Holdings Intergroup eliminations Total
2008US$’000
2007US$’000
2008US$’000
2007US$’000
2008US$’000
2007US$’000
245 707 141 750 – – 4 007 932 3 167 772 – – (4 571) (8 466) 1 680 819 1 533 164 – – – – 106 889 66 881 – – (17 122) (8 245) 1 734 298 1 200 813 – – (29 421) – 232 456 214 709
255 628 142 994 (9 921) (8 589) 253 470 152 205 (9 921) (1 244) 61 035 25 300 – – 5 721 3 688 – – 150 695 119 356
– – – – 65 163 69 566 – – – – 7 195 5 470 – – – – 57 228 32 599 – – – – 14 277 8 033
8 213 5 167 – – 9 324 5 167
(2 492) (1 479) – – (2 492) (1 479)(799) (443) – – (26 805) (19 072)
4 922 3 245 – – 123 890 100 284 (421) – – – (421) (1 142)
4 501 3 245 – – 123 469 99 142 6 047 3 533 – – 11 533 9 641
(2 726) (1 532) – – (26 841) (19 295)(55) – – – (55)
– – – – 121 –
7 822 5 191 – – 108 282 89 433 (1 061) (1 208) – – (28 246) (27 305)
6 761 3 983 – – 80 036 62 128
– 24 – – – 24
6 761 4 007 – – 80 036 62 152

Datatec Annual Report 2008
132
for the year ended 29 February 2008
33. SEGMENTAL REPORT (continued)
Westcon Logicalis Analysys Mason
Condensed balance sheet2008
US$’0002007
US$’0002008
US$’0002007
US$’0002008
US$’0002007
US$’000
Total assets 1 270 967 873 966 391 979 343 189 55 594 42 518 – North America 493 779 393 989 176 965 160 811 – – – South America 47 769 17 379 46 302 19 348 – – – UK and Europe 626 168 380 214 168 712 163 030 55 594 42 518 – Asia-Pacific 103 251 82 384 – – – – – Africa and Middle East – – – – – – Property, plant, equipment, capitalised development costs and intangibles assets 67 630 24 870 27 907 8 680 2 916 1 013 – North America 28 782 16 631 11 426 3 844 – – – South America 3 422 2 166 5 810 984 – – – UK and Europe 34 530 5 262 10 671 3 852 2 916 1 013 – Asia-Pacific 896 811 – – – – – Africa and Middle East – – – – – – Net cash resources (82 510) 70 597 44 332 8 562 4 135 6 090 – North America (103 687) (21 888) 3 198 (12 905) – – – South America 4 256 1 336 13 919 2 529 – – – UK and Europe (13 104) 75 396 27 215 18 938 4 135 6 090 – Asia-Pacific 30 025 15 753 – – – – – Africa and Middle East – – – – – – Inventories 278 573 232 278 27 994 23 706 767 375 – North America 135 810 117 496 13 993 12 095 – – – South America 18 249 3 726 2 348 1 037 – – – UK and Europe 98 361 86 260 11 653 10 574 767 375 – Asia-Pacific 26 153 24 796 – – – – – Africa and Middle East – – – – – – Trade accounts receivable 548 629 375 600 133 883 147 164 16 114 17 016 – North America 171 108 159 758 72 048 78 441 – – – South America 16 425 5 201 20 174 11 677 – – – UK and Europe 314 345 170 833 41 661 57 046 16 114 17 016 – Asia-Pacific 46 751 39 808 – – – – – Africa and Middle East – – – – – – Liabilities (843 888) (477 054) (240 724) (204 647) (16 026) (14 950)– North America (278 202) (177 525) (97 773) (81 884) – – – South America (33 529) (7 209) (34 689) (17 575) – – – UK and Europe (457 790) (233 406) (108 262) (105 188) (16 026) (14 950)– Asia-Pacific (74 367) (58 914) – – – – – Africa and Middle East – – – – – – Trade accounts payable (483 679) (385 606) (128 344) (116 987) (1 688) (2 948)– North America (122 604) (119 231) (68 608) (73 824) – – – South America (15 568) (2 853) (29 700) (16 559) – – – UK and Europe (284 008) (210 211) (30 036) (26 604) (1 688) (2 948)– Asia-Pacific (61 499) (53 311) – – – – – Africa and Middle East – – – – – – The number of employees for the year for each of the Group’s principal divisions was: 1 647 1 114 1 388 1 353 254 262
Notes to the Group annual financial statements continued

133
Datatec Annual Report 2008
Other Holdings Intergroup eliminations Total
2008US$’000
2007US$’000
2008US$’000
2007US$’000
2008US$’000
2007US$’000
165 779 131 561 – – 1 884 319 1 391 234 – – – – 670 744 554 800 – – – – 94 071 36 727
34 041 37 225 – – 884 515 622 987 – – – – 103 251 82 384
131 738 94 336 – – 131 738 94 336
5 361 1 812 – – 103 814 36 375 – – – – 40 208 20 475 – – – – 9 232 3 150 – – – – 48 117 10 127 – – – – 896 811
5 361 1 812 – – 5 361 1 812 68 222 56 143 – – 34 179 141 392
– – – – (100 489) (34 793)– – – – 18 175 3 865 – 36 182 – – 18 246 136 606 – – – – 30 025 15 753
68 222 19 961 – – 68 222 19 961 33 702 12 585 – – 341 036 268 944
– – – – 149 803 129 591 – – – – 20 597 4 763 – – – – 110 781 97 209 – – – – 26 153 24 796
33 702 12 585 – – 33 702 12 585 70 703 26 343 – – 769 329 566 123
– – – – 243 156 238 199 – – – – 36 599 16 878 – – – – 372 120 244 895 – – – – 46 751 39 808
70 703 26 343 – – 70 703 26 343 (105 398) (59 772) – – (1 206 036) (756 423)
– – – – (375 975) (259 409)– – – – (68 218) (24 784)– (6 178) – – (582 078) (359 722)– – – – (74 367) (58 914)
(105 398) (53 594) – – (105 398) (53 594)(84 171) (29 121) – – (697 882) (534 662)
– – – – (191 212) (193 055)– – – – (45 268) (19 412)– – – – (315 732) (239 763)– – – – (61 499) (53 311)
(84 171) (29 121) – – (84 171) (29 121)
476 355 – – 3 765 3 084

Datatec Annual Report 2008
134
for the year ended 29 February 2008
34. ACQUISITIONS IN SUBSIDIARIES/BUSINESSES
Material susbsidiaries/business acquiredPrincipal
activityDate of
acquisition
Proportion of shares/
business acquired
Fair value of acquisition US$’000
Distribution business of Jet Distribution Ltd and Resolve Computers Ltd (“Westcon Africa”) Distribution 8/03/07 100% 3 693
Distribution business of NOXS Europe BV (“NOXS”) Distribution 24/04/07 100% 79 874
Distribution business of Crane Telecommunications Group (“Crane”) Distribution 10/05/07 100% 49 771
Consulting business of Carotek Inc. (“Carotek”) IT Solutions 01/06/07 100% 7 077
Distribution business of ReView Video LLC (“ReView”) Distribution 16/07/07 100% 24 861
Distribution business of International Technology Distributers FZCo (“Westcon Africa”) Distribution 1/09/07 51% 5 210
Further 50% of Intact GmbH (“Intact”) IT Solutions 30/09/07 50% 1 580
Distribution business of Cernet of America, Inc. (“Cernet”) Distribution 1/10/07 100% 3 829
Further 20% of Logicalis South America (“LSAL”) Consulting 2/10/07 20% 6 042
Consulting business of Redbox Consulting Services Ltd (“Redbox”) Distribution 19/02/08 100% 3 987
NOXS Crane
Book value
US$’000
Fair value adjustment
US$’000
Fair value on
acquisitionUS$’000
Book value
US$’000
Fair value adjustment
US$’000
Fair value on
acquisitionUS$’000
Current assetsCash and cash equivalents 1 008 – 1 008 – – – Trade and other receivables 58 176 – 58 176 41 645 – 41 645 Inventories 8 541 – 8 541 7 248 – 7 248 Non-current assetsPlant and equipment 1 153 – 1 153 1 310 – 1 310 Deferred tax assets – – – – – – Investment – – – – – – Intangible assets – 17 473 17 473 – 13 589 13 589 Current liabilitiesTrade and other payables (44 060) – (44 060) (58 464) – (58 464)Non-current liabilitiesDeferred tax liabilities (5 242) – (5 242) (4 075) – (4 075)Long-term liabilities – – – – – –
19 576 17 473 37 049 (12 336) 13 589 1 253 Goodwill on acquisition 42 825 48 518 Minority interest acquired/(recognised)
Fair value of acquisition 79 874 49 771
The above acquisitions represent the material subsidiaries and businesses acquired during the year. The amounts recorded in Other represent the balance of the acquisitions made during the year and earn-out payments made on acquisitions made in prior years. The earn-out payments represent additional goodwill as a result of certain profit targets being achieved.
The revenue included from these acquisitions in 2008 was US$384,9 million. Had the acquisition date been 1 March 2007, the pro forma revenue would have been approximately US$500 million. Since these acquisitions are fully integrated into existing operations it is not practical to establish the profit after tax contributed by the acquisitions in 2008, or the profit after tax which the acquisitions would have contributed to the Group if they had been included for the entire year.
Notes to the Group annual financial statements continued

135
Datatec Annual Report 2008
ReView Carotek Westcon Africa Other Total
Book value
US$’000
Fair value adjustmentUS$’000
Fair value on
acquisitionUS$’000
Book value
US$’000
Fair value adjustmentUS$’000
Fair valueon
acquisitionUS$’000
Book value
US$’000
Fair valueadjustmentUS$’000
Fair valueon
acquisitionUS$’000
Fair valueon
acquisitionUS$’000
Fair valueon
acquisitionUS$’000
– – – – – – 6 222 – 6 222 155 7 385 11 827 – 11 827 28 – 28 21 531 – 21 531 1 556 134 763
6 466 – 6 466 – – – 6 991 – 6 991 320 29 566
132 – 132 132 – 132 302 – 302 87 3 116 – – – – – – 2 – 2 – 2 – – – – – – – – – (297) (297)– 6 010 6 010 – 4 200 4 200 – 933 933 2 734 44 939
(9 809) – (9 809) – – – (22 815) – (22 815) (1 277) (136 425)
– – – – – – – – – – (9 317)(861) – (861) – – – (1 148) – (1 148) – (2 009)
7 755 6 010 13 765 160 4 200 4 360 11 085 933 12 018 3 278 71 723 11 096 2 717 1 721 13 940 120 817
(5 690) 1 278 (4 412)
24 861 7 077 8 049 18 496 188 128

Datatec Annual Report 2008
136
Effective holding
SUBSIDIARY COMPANIESNature of business
Issued ordinary
capital2008
%2007
%
Active subsidiariesINCORPORATED IN AFRICAAfrican Legends Indigo (Pty) Ltd O 20 000 55,0 100,0Datatec Management Services (Pty) Ltd O 100 100,0 100,0Westcon SA (Pty) Ltd O 200 55,0 55,0Westcon Africa Middle East (Pty) Ltd O 200 100,0 0,0Westcon Africa (SADC) (Pty) Ltd O 1 000 51,0 0,0Westcon Africa FZCo O 100 51,0 0,0Scantec (Pty) Ltd O 1 000 55,0 55,0Westcon Africa (Tanz) O 100 51,0 0,0Resolv Computers Ltd O 1 000 51,0 0,0Westcon Africa (Nigeria) O 1 000 000 45,9 0,0Westcon Africa (Kenya) O 200 000 51,0 0,0Westcon Africa (Uganda) O 10 000 51,0 0,0
INCORPORATED IN UK & EUROPEComstor Belgium NV W 620 97,4 97,4Comstor Group Ltd W 3 010 000 97,4 97,4Comstor Networking SL W – – 97,4Westcon France SAS W – – 97,4Comstor Sweden AB W – – 97,4Westcon (UK) Ltd W 1 190 732 97,4 97,4Westcon Group BV W 180 97,4 97,4Westcon European Holdings Ltd W 4 97,4 – Westcon Group GmbH W 1 97,4 97,4Westcon Deutschland GmbH W 1 97,4 97,4Westcon Group European Operations Ltd W 5 97,4 97,4Westcon Group European Holdings Ltd W 6 97,4 97,4Westcon European Holdings Limited W 4 97,4 97,4Westcon Acquisitions Ltd W 4 97,4 97,4Crane Telecommunications Group Ltd W 3 031 646 97,4 – Crane Telecommunications Ltd W 2 97,4 – Logicalis Group Ltd L 79 085 888 100,0 100,0Logicalis Group Services Ltd L 2 100,0 100,0Logicalis UK Ltd (formerly Logicalis Network Solutions Ltd) L 4 645 665 100,0 100,0Logicalis (Ireland) Ltd L 1 000 100,0 100,0Logicalis Computing Solutions Ltd L 11 655 100,0 100,0Logicalis South America Ltd L 14 073 100,0 80,0Logicalis CSF Solutions Ltd L 1 000 100,0 100,0Hawke Systems Ltd L 8 515 100,0 100,0TBC Limited L 40 000 100,0 100,0Satelcom Ltd L 59 380 100,0 100,0Logicalis Deutschland GmbH L 255 646 100,0 100,0Logicalis Networks GmbH L 25 565 100,0 100,0Intact Integrated Services GmbH L 1 75,0 25,0Intact Integrated Services Ltd L 1 100,0 100,0Analysys Mason Group Ltd M 1 995 388 88,2 86,5Catalyst IT Partners Ltd M 306 638 88,2 86,5Mason Group Ltd M 1 925 288 88,2 86,5Mason Communications Ltd M 121 426 88,2 86,5Mason Communications Ireland Ltd M 2 88,2 86,5Mason SiteFinder Ltd M 2 88,2 86,5
Annexure 1for the year ended 29 February 2008

137
Datatec Annual Report 2008
Effective holding
SUBSIDIARY COMPANIES (continued)Nature of business
Issued ordinary
capital2008
%2007
%
Active subsidiaries (continued)INCORPORATED IN UK & EUROPE (continued)Analysys Ltd M 61 316 88,2 86,5Analysys Research Ltd M 2 88,2 86,5Analysys Consulting Ltd M 2 88,2 86,5Analysys Venture Ltd M 2 88,2 86,5Redbox Consulting Services Ltd M 3 88,2 – Greening Associates Ltd M 1 88,2 – Datatec International Ltd O 1 000 100,0 100,0Datatec UK Holdings PLC O 50 000 100,0 100,0Novell Africa (UK) Ltd O 1 000 26,0 0,0Jet Distribution Ltd O 50 000 51,0 0,0Westcon Africa (UK) Ltd O 40 000 51,0 0,0
INCORPORATED IN US AND CANADAWestcon Group North America, Inc. W 82 97,4 97,4Westcon Canada Systems (WCS), Inc. W 173 228 97,4 97,4Westcon Group, Inc. W 220 530 97,4 97,4Westcon CALA, Inc. W 100 97,4 – Cernet Tecnologia en Telecomunicaciones SA de CY (Mexico) W 6 659 97,4 – Pegasus Telecom LLC W 100 97,4 97,4ActiveSymbols, Inc. L 10 000 100,0 100,0Logicalis, Inc. L 54 100,0 100,0Logicalis US Holdings, Inc. L 340 000 100,0 100,0Logicalis Leasing, Ltd L 1 000 0,0 100,0Computech Resources , Inc. L 3 316 0,0 100,0Eisco Technology, Inc. L 900 000 0,0 100,0
INCORPORATED IN SOUTH AMERICAWestcon Brasil Ltda W 987 748 97,4 97,4Soft Net SA (Argentina) L 400 000 100,0 80,0Softnet-Logical Paraguay SA L 110 100,0 80,0Softnet Uruguay SA L 130 000 100,0 80,0Softnet-Logical Comercial Importadora, Exportadora e de Servicos Ltda (Brazil) L 480 000 100,0 80,0X-Net Cuyo SA (Argentina) L 2 000 000 100,0 80,0Softnet Inc SA (Uruguay) L 375 000 100,0 80,0Softnet Logicalis Chile SA L 20 918 100,0 80,0Softnet Logicalis Perú SAC L 900 500 100,0 80,0
INCORPORATED IN AUSTRALIA AND NEW ZEALANDLAN Systems (Pty) Ltd W 100 000 97,4 97,4LAN Systems Ltd (New Zealand) W 1 97,4 97,4
INCORPORATED IN SOUTH EAST ASIAComstor Pte Ltd (Singapore) W 8 500 000 97,4 97,4Comstor Malaysia Sdn Bhd W 2 97,4 0,0Analysys Consulting PTE Ltd M 1 88,2 86,5
INCORPORATED IN BRITISH VIRGIN ISLANDSDatatec International Holdings Ltd O 50 000 100,0 100,0Online Distribution Ltd O 1 350 000 100,0 100,0Comstor Middle East Ltd O 1 000 100,0 100,0
W: Westcon L: Logicalis M: Analysys Mason Group O: Other Holdings

Datatec Annual Report 2008
for the year ended 29 February 2008
138
Notes2008
R’m2007
R’m
Revenue – management fee income 34 41 Operating income/(costs) 8 (29)Foreign exchange gain 48 133 Share-based payments – equity settled (14) (10)
Operating income 1 76 135 Interest received 2 48 27 Interest paid (5) (5)
Profit before taxation 119 157 Taxation 3 (35) (2)
Profit for the year 84 155
Company income statement

139
Datatec Annual Report 2008
as at 29 February 2008
Company balance sheet
Notes2008
R’m2007
R’m
ASSETSNon-current assets 4 231 3 949 Office furniture and equipment 1 1 Subsidiary companies 4 4 230 3 948
Current assets 686 499 Accounts receivable 4 5 Subsidiary company loans 4 475 365 Cash and cash equivalents 207 129
Total assets 4 917 4 448
EQUITY AND LIABILITIESEquity attributable to equity holders of the parent 4 859 4 424 Share capital and premium 5 1 767 1 444 Non-distributable reserves 213 213 Share-based payment reserve 33 19 Distributable reserves 2 846 2 748
Non-current liabilitiesDeferred tax liabilities 3 21 2
Current liabilities 37 22 Accounts payable 6 18 17 Provisions 7 3 – Taxation 16 – Bank overdraft 8 * 5
Total equity and liabilities 4 917 4 448
* Less than R1 million.

Datatec Annual Report 2008
140
for the year ended 29 February 2008
Share capital
R’m
Sharepremium
R’m
Non-distributable
reserves R’m
Share-basedpayments
reserve R’m
Distributablereserves
R’m
Total equity
R’m
Balance at 28 February 2006 1 1 301 213 9 2 593 4 117
Profit for the year 155 155
New share issues ** 186 186
Capital distribution (44) (44)Share-based payments 10 10
Balance at 28 February 2007 1 1 443 213 19 2 748 4 424
Profit for the year 84 84 Transfers directly to distributable reserves* 14 14 New share issues 1 458 459 Capital distribution (118) (118) Share buy-back (18) (18) Share-based payments 14 14
Balance at 29 February 2008 2 1 765 213 33 2 846 4 859
* During the current year an amount was received from a subsidiary company for the repayment of an inter-company loan that had, in previous years, been capitalised and subsequently written off against reserves, as part of a goodwill write-down in 2000.
** Less than R1 million.
Company statement of changes in equity

141
Datatec Annual Report 2008
for the year ended 29 February 2008
Company cash-flow statement
Notes2008
R’m2007
R’m
Cash flow from operating activitiesCash generated from operations 12 11 27 Interest received 48 27 Interest paid (5) (5)Taxation paid 13 – –
Net cash inflow from operating activities 54 49
Cash flow from investing activitiesAcquisition of subsidiary companies (277) (159)Net loans advanced to subsidiaries (17) (34)
Net cash outflow from investing activities (294) (193)
Cash flow from financing activitiesProceeds from issue of shares 459 186 Share buy-back (18) – Capital distribution (118) (44)
Net cash inflow from financing activities 323 142
Net increase/(decrease) in cash and cash equivalents 83 (2)Cash and cash equivalents at the beginning of year 124 126
Cash and cash equivalents at end of year 14 207 124

Datatec Annual Report 2008
142
for the year ended 29 February 2008
2008R’m
2007R’m
1. OPERATING INCOME Operating income is arrived at after taking into account the following items: Auditors’ remuneration Audit fees – current year 1 1 – Other services 1 2 Less amount capitalised – (2)
Audit services and expenses 2 1
Foreign exchange gains Realised (8) (3) Unrealised (40) (130)
(48) (133)
Fees for services Administrative 5 3 Technical * * Secretarial * * Operating lease rentals Premises, office furniture, equipment and motor vehicles 2 1 Retirement benefit contributions 1 1 Staff costs 21 16 Reversal of impairment intercompany loans 43 15This relates to the release of impairments raised in prior years against loans made to Westcon SA (Pty) Ltd, African Legend Indigo (Pty) Ltd and Datatec International Holdings Limited (BVI).
Loss on sale of investments – 14
Directors’ emoluments Executive directors Salaries * * Benefits * * Non-executive directors’ fees 3 2
3 2
Full details on directors’ emoluments are provided in the remuneration report on pages 68 to 81
2. INTEREST RECEIVED
From subsidiary companies 26 12Other investments 22 15
48 27
*Less than R1 million.
Notes to the Company annual financial statements

143
Datatec Annual Report 2008
2008R’m
2007R’m
3. TAXATION Taxation charge Current taxation – current year 16 – Deferred taxation – current year 19 2
35 2
Reconciliation of taxation rate to profit before taxation South African normal tax rate 29,0% 29,0%Tax losses utilised – (23,7%)Permanent differences – (4,0%)Disallowed expenses 0,6% –Tax rate adjustment (0,2%) –
Effective taxation rate 29,4% 1,3%
Datatec Limited has no estimated tax loss at the end of the financial year (2007: R36 million).
Movement of deferred tax liabilitiesBalance at beginning of the year 2 – Charge to income statement 19 –Exchange differences – 2
21 2
Analysis of deferred tax liabilities Forex 22 2Prepayments * –Provisions (1) –Rental smoothing * –
21 2
*Less than R1 million.

Datatec Annual Report 2008
144
for the year ended 29 February 2008
2008R’m
2007R’m
4. SUBSIDIARY COMPANIES Unlisted shares Datatec International Ltd 3 899 3 502 Westcon Africa Middle East (Pty) Ltd 22 – Datatec Integration Services (Pty) Ltd 13 – Westcon SA (Pty) Ltd – 22 Online Distribution Ltd 52 52 African Legend Indigo (Pty) Ltd (formerly Rangegate SA (Pty) Ltd) – 18 Comstor Middle East ** 2 Unlisted shares at cost 3 986 3 596 Impairment of unlisted shares – (7)Unlisted shares at written down value 3 986 3 589 Net amounts owing by subsidiaries 719 724 Total investment 4 705 4 313 Presented as follows: Shares at cost and long-term portion of loans receivable 4 230 3 948 Current portion of loans 475 365 Current assets 475 365
4 705 4 313 Directors’ valuation of unlisted investments is R4,0 billion (2007: R3,6 billion). The directors have reviewed the valuations and believe that the carrying value of the investment is reasonable.Details of investment in subsidiaries detailing the number of shares held are recorded in Annexure 1 of the Group Annual Financial Statements.Amounts due by/(to) Group CompaniesLoans ZAR-denominated Loans Datatec Management Services (Pty) Ltd 14 14 African Legend Indigo (Pty) Limited (formerly Rangegate SA (Pty) Ltd)* 1 44 Westcon AME (Pty) Ltd ** 13 Analysys Mason Group Ltd ** – Online Distribution ** – Comstor Middle East* ** – Logicalis Group Ltd 1 13 Westcon Group, Inc. 8 15 Datatec Integration Services (Pty) Ltd 28 – Datatec Limited Share Incentive Trust 49 20 EUR-denominated Loans Logicalis GmbH 8 – USD-denominated Loans Logicalis Group Limited – 11 Datatec Integration Services (Pty) Ltd 18 – Datatec International Holdings Ltd 6 2 Logicalis Group Limited (LSAL) 15 Westcon Africa Middle East (Pty) Ltd 75 ** GBP-denominated Loans Logicalis Computing Solutions – 11 Logicalis Group Ltd 112 Datatec International Holdings Ltd – 7 Datatec International Ltd 365 522 Datatec UK Holdings Ltd ** (4) Westcon Group European Operations 149 – Analysys Mason Group Limited – (1)
737 779Impairment provisions (18) (55)Net amounts owing by subsidiaries 719 724 Loans amounting to R52 million are subject to interest at the UK base rate and there are no fixed repayment terms. Loans amounting to R93 million are subject to South African prime rate plus 2%. Loans amounting to R149 million are subject to the UK LIBOR six months rate plus 2% The remainder of the loans is subject to no interest and there are no fixed repayment terms.
*These loan balances have been subordinated.**Less than R1 million.
Notes to the Company annual financial statements continued

145
Datatec Annual Report 2008
2008R’m
2007R’m
5. SHARE CAPITAL AND PREMIUM Authorised share capital400 000 000 (2007: 400 000 000) ordinary shares of R0,01 each 4 4Issued share capital169 206 941 (2007: 155 298 505) ordinary shares of R0,01 each 2 1Share premium 1 765 1 443
1 767 1 444
During the year the following shares were issued in respect of share options exercised, share buy-backs and acquisitions in subsidiaries:
Following the introduction of new share-based payment schemes during the year ended 28 February 2006, no more options were granted in the Datatec Share Option Scheme. Originally, the equivalent of up to 15% of the issued share capital was set aside for the granting of options. At the balance sheet date 10 546 654 (2007: 8 321 878) of the outstanding share options had been exercised and shares issued from the unissued share capital set aside for the purpose at 29 February 2008. 3 874 157 (2007: 6 187 158) share options had been granted but had not yet been exercised or lapsed.
At the AGM on 6 August 2007, up to 16 902 323 unissued shares (2007: 14 705 554 unissued shares), being 10% of the issued ordinary share capital, were placed under the control of the directors until the next general meeting, subject to the provisions of section 221 and 222 of the Companies Act and the requirements of the JSE Limited.
As of 29 February 2008 the group held 1 752 558 (2007: 684 069) shares as treasury shares that had been acquired by the Datatec Share Incentive Trust 2005. These have been set off against share premium.
Details of the shares issued in respect of share options exercised, acquisitions of subsidiaries and institutional placements:
Shares for share options
Shares for acquisitions
Price (ZAR)
Institutional placements
Price (ZAR)
2 224 776 3 891 917 33,16 Crane Telecoms 7 200 000 34,09 193 862 34,21 Intact Germany 398 459 34,41 Logicalis South America 624 092 35,85 Carotek
5 108 330
2008R’m
2007R’m
6. ACCOUNTS PAYABLE Other payables 18 17
The carrying value of other accounts payable approximates the fair value.
Datatec Annual Report 2008
146
for the year ended 29 February 2008
OtherR’m
7. PROVISIONS Balance at 1 March 2006 7 Amounts utilised (7)
Balance at 28 February 2007 – Amounts added 4 Amounts utilised (1)Amounts reversed –
Balance at 29 February 2008 3
2008R’m
2007R’m
8. BANK OVERDRAFT
Total borrowings at year-end * 5
*Less than R1 million.
Datatec Limited has general short-term banking facilities amounting to R24 million (2007: R24 million) with The Standard Bank of South Africa Limited. In terms of the cash management system operated in SA, various cross-guarantees have been put in place to restrict the overall exposure to the amount of the banking facility.
9. COMMITMENTS Operating lease commitments Due within one year: Property 1 1
Due between one and five years: Property 1 2
Datatec Limited has issued in the ordinary course of business, guarantees and letters of comfort to third parties in SA in respect of trading facilities and lease commitments.
10. GUARANTEES Datatec Limited stands guarantor to OnLine Distribution who has a facility of $1,5 million with HSBC Bank in the Middle East (2007: $1,5 million), backed by a lien on a deposit of $0,5 million by Online Distribution. The facility bears interest at 4,6% (2007: 10,3%) and inventory and accounts receivable balances have been pledged as collateral.
Datatec Limited stands guarantor to Westcon SA (Pty) Ltd in respect of their supplier, Cisco Systems International BV. The guarantee is for an amount of $12 million and it expires on 30 June 2008.
Notes to the Company annual financial statements continued

147
Datatec Annual Report 2008
11. FINANCIAL INSTRUMENTS 11.1 Financial risk management objectives
The Company’s senior management is responsible for monitoring and managing the financial risks relating to the operations of the Company. This is achieved through the use of internal risk analyses which analyse exposures by likelihood and magnitude of risks. These risks include market risk (including currency and interest risk), credit risk and liquidity risk.
The Company does not enter into or trade financial instruments, including derivative financial instruments, for speculative purposes.
When appropriate, management reports regularly to the Group’s audit, risk and compliance committee.
The Company financial instruments consist mainly of cash and cash equivalents, accounts receivable, accounts payable, and borrowings.
11.2 Capital risk management The Company manages its capital to ensure that it will be able to continue as a going concern while maximising the return to stakeholders. The Company’s overall strategy with respect to the debt and equity balance remains unchanged from 2007. The capital structure of the Company consists mainly of cash and cash equivalents and equity attributable to equity holders of the parent, comprising issued capital (Note 5), reserves and retained earnings.
2008R’m
2007R’m
11.3 Categories of financial instruments Financial assets Loans and receivables (including cash and cash equivalents) 686 499 Financial liabilities Liabilities at amortised cost 21 22
11.4 Credit risk management Credit risk refers to the risk that a counterparty will default on its contractual obligations resulting in financial loss to the Company. The Company has adopted a policy of dealing only with creditworthy counterparties and obtaining sufficient collateral, where appropriate, as a means of mitigating the risk of financial loss from defaults.
Trade receivables consist of sundry receivables.
The carrying amount of financial assets recorded in the financial statements (see 11.3), which is net of impairment losses, represents the Company’s maximum exposure to credit risk, concentrated all in South Africa, without taking account of the value of any collateral obtained.
The Company does not consider there to be any significant credit risk which has not been adequately provided for at the balance sheet date. Furthermore, there has been no material change to the Company’s exposure to credit risks or the manner in which it manages and measures the risk.

Datatec Annual Report 2008
148
for the year ended 29 February 2008
11. FINANCIAL INSTRUMENTS (continued)11.5 Liquidity risk management
Ultimate responsibility for liquidity risk management rests with the board of directors, which has built an appropriate liquidity risk management framework for the management of the Company’s short-, medium- and long-term funding and liquidity requirements. The Company manages liquidity risk by maintaining adequate reserves, banking facilities and borrowing facilities and by continually monitoring forecast and actual cash flows.
The following tables detail the Company’s remaining contractual maturity for its non-derivative financial liabilities. The tables have been drawn up based on the undiscounted cash flows of financial liabilities based on the earliest date on which the Company can be required to pay. The table includes both interest and principal cash flows.
0 – 1 yearR’m
TotalR’m
2008Financial guarantees and commitments (50) (50)
2007Financial guarantees and commitments (47) (47)
There has been no material change to the Company’s exposure to liquidity risks or the manner in which it manages and measures the risk.
11.6 Market risk management The Company’s activities expose it primarily to the financial risks of changes in foreign currency exchange rates (see Note 11.7) and interest rates (see Note 11.8). The Company does not make use of derivative financial instruments to manage its exposure to foreign currency and interest rate risks.
There has been no material change to the Company’s exposure to market risks or the manner in which it manages and measures the risk.
11.7 Foreign exchange risk management The Company operates in the global business environment and undertakes many transactions denominated in foreign currencies. The Company is exposed to the risk of fluctuating exchange rates and actively seeks to manage this exposure, within approved policy parameters.
Fluctuations in exchange rates also affect the translation of the profits of the Company whose reporting currency is the South African rand.
Notes to the Company annual financial statements continued
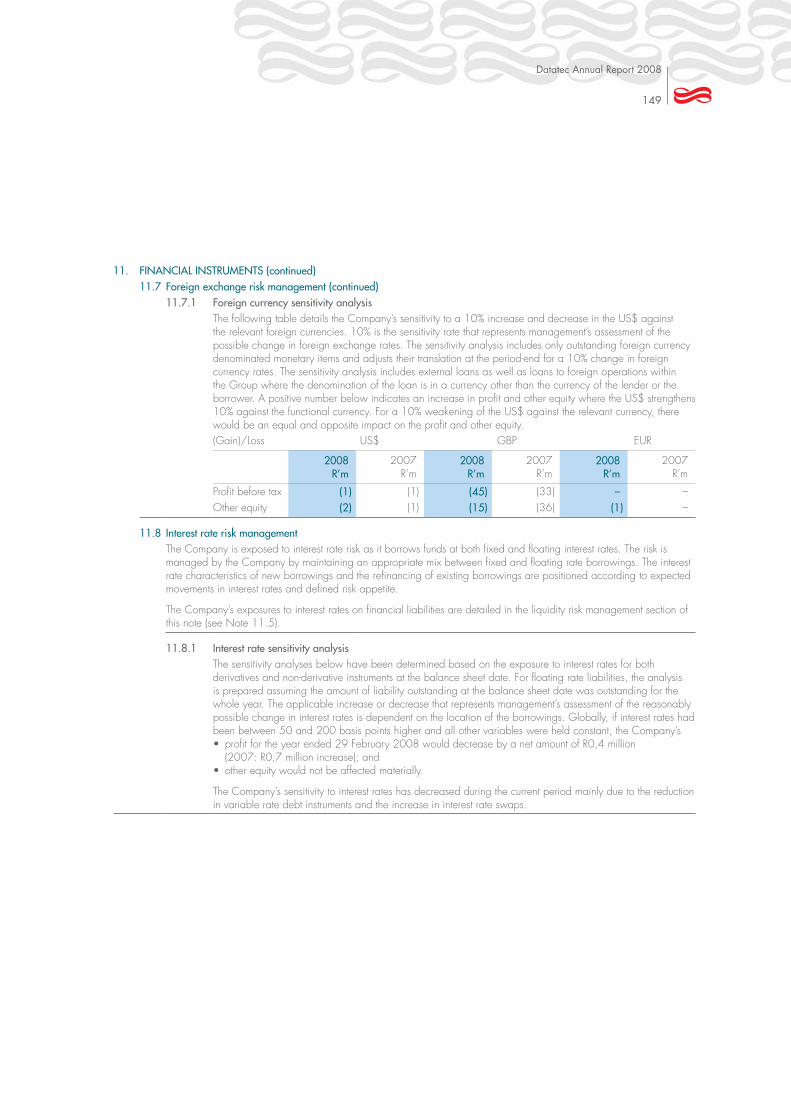
149
Datatec Annual Report 2008
11. FINANCIAL INSTRUMENTS (continued)11.7 Foreign exchange risk management (continued)
11.7.1 Foreign currency sensitivity analysisThe following table details the Company’s sensitivity to a 10% increase and decrease in the US$ against the relevant foreign currencies. 10% is the sensitivity rate that represents management’s assessment of the possible change in foreign exchange rates. The sensitivity analysis includes only outstanding foreign currency denominated monetary items and adjusts their translation at the period-end for a 10% change in foreign currency rates. The sensitivity analysis includes external loans as well as loans to foreign operations within the Group where the denomination of the loan is in a currency other than the currency of the lender or the borrower. A positive number below indicates an increase in profit and other equity where the US$ strengthens 10% against the functional currency. For a 10% weakening of the US$ against the relevant currency, there would be an equal and opposite impact on the profit and other equity.(Gain)/Loss US$ GBP EUR
2008R’m
2007R’m
2008R’m
2007R’m
2008R’m
2007R’m
Profit before tax (1) (1) (45) (33) – –Other equity (2) (1) (15) (36) (1) –
11.8 Interest rate risk management The Company is exposed to interest rate risk as it borrows funds at both fixed and floating interest rates. The risk is managed by the Company by maintaining an appropriate mix between fixed and floating rate borrowings. The interest rate characteristics of new borrowings and the refinancing of existing borrowings are positioned according to expected movements in interest rates and defined risk appetite.
The Company’s exposures to interest rates on financial liabilities are detailed in the liquidity risk management section of this note (see Note 11.5).
11.8.1 Interest rate sensitivity analysisThe sensitivity analyses below have been determined based on the exposure to interest rates for both derivatives and non-derivative instruments at the balance sheet date. For floating rate liabilities, the analysis is prepared assuming the amount of liability outstanding at the balance sheet date was outstanding for the whole year. The applicable increase or decrease that represents management’s assessment of the reasonably possible change in interest rates is dependent on the location of the borrowings. Globally, if interest rates had been between 50 and 200 basis points higher and all other variables were held constant, the Company’s
(2007: R0,7 million increase); and
The Company’s sensitivity to interest rates has decreased during the current period mainly due to the reduction in variable rate debt instruments and the increase in interest rate swaps.

Datatec Annual Report 2008
150
for the year ended 29 February 2008
2008R’m
2007R’m
12. CASH GENERATED FROM OPERATIONSProfit before taxation 119 157 Adjustments for: Unrealised foreign exchange gains (40) (130) Share-based payments 14 10 Non-cash items – reversal of impairment 43 15 Interest received (48) (27) Interest paid 5 5 Other non-cash items (84) –
Operating profit before working capital changes 9 30 Working capital changes: Decrease in accounts receivable 1 2 Increase/(decrease) in accounts payable 1 (5)
11 27
13. TAXATION PAIDAmounts at beginning of year – – Amounts charged to income statement 16 – Amount payable at end of year (16) –
– –
14. CASH AND CASH EQUIVALENTS AT END OF YEARCash resources 207 129 Bank overdraft * (5)
207 124
*Less than R1 million.
Notes to the Company annual financial statements continued

151
Datatec Annual Report 2008
Notice of Annual General Meeting
DATATEC LIMITED(Incorporated in the Republic of South Africa)
Registration number 1994/005004/06Share code: DTC ISIN: ZAE000017745
(“Datatec” or “the Company”)
Notice is hereby given that the Annual General Meeting of shareholders of Datatec will be held at the Sandton Sun Hotel, 5th Street, Sandton, Republic of South Africa, at 12:00 on 4 August 2008 for the purpose of considering and voting on the following resolutions with or without modification:
1. CONSIDERATION OF ANNUAL FINANCIAL STATEMENTS Ordinary Resolution Number 1 “Resolved that the audited annual financial statements and Group annual financial statements for the year ended
29 February 2008 be and are hereby accepted.”
2. RE-ELECTION OF DIRECTOR Ordinary Resolution Number 2 “Resolved that Mr J P Montanana, who retires in terms of the Company’s articles of association (“the articles”) and who offers
himself for re-election, be and is hereby re-elected as a director of the Company.”
Please refer to page 16 for Mr Montanana’s brief curriculum vitae. On behalf of the Board, the Chairman confirms that on the basis of the annual evaluation of the Board and of the performance of individual directors, the performance and commitment of Mr Montanana throughout his period of office was highly satisfactory.
3. RE-ELECTION OF DIRECTOR Ordinary Resolution Number 3 “Resolved that Mr N J Temple, who retires in terms of the articles and who offers himself for re-election, be and is hereby re-
elected as a director of the Company.”
Please refer to page 17 for Mr Temple’s brief curriculum vitae. On behalf of the Board, the Chairman confirms that on the basis of the annual evaluation of the Board and of the performance of individual directors, the performance and commitment of Mr Temple throughout his period of office was highly satisfactory.
4. ELECTION OF DIRECTOR Ordinary Resolution Number 4 “Resolved that Mr I P Dittrich, who was appointed by the Board on 1 March 2008, be and is hereby elected as a director of
the Company.”
Please refer to page 16 for Mr Dittrich’s brief curriculum vitae. On behalf of the Board, the Chairman confirms that Mr Dittrich has a lengthy history with Datatec and an intimate understanding of the Group’s operations and businesses around the world, including all financial aspects. He is familiar with the workings of the Board and the executive management of the Group, in addition to having gained considerable experience in various operational, group management, financial and corporate finance roles. The Board is of the opinion that Mr Dittrich will make a significant contribution to the Group.

Datatec Annual Report 2008
152
5. APPROVAL OF AUDITORS’ REMUNERATION Ordinary Resolution Number 5 “Resolved that the directors of the Company be and are hereby authorised to fix and pay the auditors’ remuneration for the year
ended 29 February 2008.”
6. RATIFICATION OF DIRECTORS’ REMUNERATION Ordinary Resolution Number 6 “Resolved that the remuneration of the directors of the Company for the past financial year as reflected on page 77 of the
annual report, of which this notice forms part, be and is hereby ratified.”
7. APPROVAL OF NON-EXECUTIVE DIRECTORS’ REMUNERATION Ordinary Resolution Number 7 “Resolved that the fees and committee fees of the non-executive directors of the Company for the 2008/2009 financial year,
which remain unchanged from the previous financial year, as reflected on page 76 of the annual report of which this notice forms part, be and are hereby approved.”
8. PLACE UNISSUED SHARES UNDER THE CONTROL OF THE DIRECTORS Ordinary Resolution Number 8 “Resolved that the authorised but unissued ordinary shares in the capital of the Company be and are hereby placed under the
control and authority of the Board of Directors of the Company in terms of section 221 of the Companies Act, Act 61 of 1973 (“the Act”) until the next Annual General Meeting and that the directors of the Company be and are hereby authorised and empowered to allot, issue and otherwise dispose of such unissued ordinary shares as they may deem fit, subject always to:
shares in the Company being limited to a maximum number of unissued ordinary shares equal to 10% (ten percent) of the issued share capital, prior to any repurchase and cancellation of shares in the preceding year, of the Company from time to time.”
9. GENERAL AUTHORITY TO ISSUE SHARES FOR CASH Ordinary Resolution Number 9 “Resolved that in terms of the JSE Listing Requirements, the Board of Directors of the Company be and is hereby given the
general authority by way of a renewable mandate to issue all or any of the authorised, but unissued, ordinary shares of one cent each in the share capital of the Company for cash as and when they in their discretion deem fit, subject to the Act, the articles, the JSE Listing Requirements and the following limitations:
must be limited to such securities or rights that are convertible into a class already in issue;
General Meeting, whichever is the earlier date;
Requirements and not to related parties;
Company’s issued share capital, including instruments which are compulsorily convertible into shares of that class;
including the impact on net tangible asset value, earnings per share and headline earnings per share, will be published at the time of any issue representing, on a cumulative basis within a financial year, 5% or more of the number of ordinary shares of that class in issue prior to the issue;
Notice of Annual General Meeting continued

153
Datatec Annual Report 2008
permitted be 10% of the weighted average traded price on the JSE of the shares in question, as determined over the 30 business days prior to the date that the price of the issue is determined or agreed between the directors of Datatec and the party subscribing for the securities; and
The approval of a 75% majority of the votes cast in favour of such resolution by shareholders present or represented by proxy at this Annual General Meeting is required for this ordinary resolution to become effective.
10. AUTHORITY TO MAKE GENERAL PAYMENT TO SECURITIES HOLDERS Ordinary Resolution Number 10 “Resolved that as contemplated in section 90 of the Act the Board of Directors of the Company shall, subject to the provisions
of the Act, the articles and the JSE Listings Requirements, by way of a renewable mandate, be entitled to make a pro-rata payment to shareholders of the Company by way of a general payment from the Company’s share capital or share premium, subject to the following limitations, namely that:
General Meeting, whichever is the earlier date;
exceed the Rand value of 20% (twenty percent) of the Company’s issued share capital, but excluding minority interests and re-valuations of assets and intangible assets that are not supported by a valuation by an independent professional expert acceptable to the JSE prepared within the last six months, in any one financial year, measured as at the beginning of such financial year; and
The directors of the Company undertake that they shall not implement the proposed general payment, unless for a period of 12 (twelve) months following the date of the notice of the Annual General Meeting:
basis consistent with the last financial year of the Company, exceed the liabilities of the Company and the Group;
JSE Listings Requirements.
The directors of the Company intend to utilise the authority in terms of this Ordinary Resolution Number 10 in order to make a general payment to the shareholders of the Company, by way of a general payment from the Company’s share capital or share premium.
Although the Board has no immediate intention to use this authority to make general payments to shareholders by way of a general payment from the Company’s share capital or share premium, the Board is of the opinion that this authority should be in place should it become appropriate to make such a payment.
Announcements will be published on SENS and in the press setting out the terms and date of the general payment, the financial effects of the general payment prior to such payment being effected and complying with Section 11.31 and Schedule 24 of the JSE Listings Requirements.

Datatec Annual Report 2008
154
11. AUTHORITY TO SIGN ALL DOCUMENTS REQUIRED Ordinary Resolution Number 11 “Resolved that subject to the passing of terms of the Ordinary Resolutions 1 to 10, any director of the Company or the
Company Secretary shall be and is hereby authorised to sign all documents and perform all acts which may be required to give effect to such Ordinary Resolutions number 1 to 10 passed at the Annual General Meeting.”
To consider, and if deemed fit, to pass the following special resolutions:
12. GENERAL AUTHORITY TO REPURCHASE SHARES Special Resolution Number 1 “Resolved that the Board of Directors of the Company be authorised by way of a general authority given as a renewable
mandate, to facilitate the acquisition by the Company or a subsidiary of the Company of the issued ordinary shares of the Company, upon such terms and conditions and in such amounts as the directors of the Company may from time to time determine, but subject to the articles, the provisions of the Act and the JSE Listings Requirements, when applicable and provided that:
or its subsidiaries have cumulatively repurchased 3% (three percent) of the initial number of the shares of the Company in issue as at the time the general authority was granted and for each 3% in aggregate of the initial number of shares acquired thereafter;
15 (fifteen) months or until the next Annual General Meeting, whichever period is shorter;
concerning shareholder spread requirements;
the JSE Listings Requirements unless it has in place a repurchase programme where the dates and quantities of securities to be traded during the relevant period are fixed (not subject to any variation) and full details of the programme have been disclosed in an announcement over SENS prior to the commencement of the prohibited period;
prior understanding or arrangement between the Company and the counter party;
share capital in the aggregate in any one financial year or, in the case of acquisition by any of the Company’s subsidiaries, 10% (ten percent) of such issued ordinary share capital in the aggregate if such shares are to be held as treasury shares;
the maximum premium at which such ordinary shares may be acquired will be 10% (ten percent) of the weighted average of the market price at which such ordinary shares are traded on the JSE, as determined over the 5 (five) trading days immediately preceding the date of the repurchase of such ordinary shares by the Company or a subsidiary of the Company; and
the JSE Listings Requirements prior to any repurchases being implemented on the open market of the JSE.
As at the date of this report, the Company’s directors undertake that they will not implement any such repurchase in the 12 (twelve) months following the date of this Annual General Meeting or for the period of the general authority, whichever is the longer, unless:
period of 12 months after the date of the notice of the Annual General Meeting;
consistent with the last financial year of the Company, would exceed the liabilities of the Company and the Group for a period of 12 months after the date of the notice of the Annual General Meeting;
12 months after the date of the notice of the Annual General Meeting; and
12 months after the date of the notice of the Annual General Meeting.”
Notice of Annual General Meeting continued

155
Datatec Annual Report 2008
Reason for and effect of the Special Resolution The reason for and the effect of the special resolution are to grant to the directors of the Company a general authority, up to
and including the date of the next Annual General Meeting of the Company or the expiration date of the period commencing on the date of passing of the special resolution and expiring on the date 15 (fifteen) months thereafter, to approve the Company’s purchase of shares in itself, or to permit a subsidiary of the Company to purchase shares in the Company.
The Board is of the opinion that this authority should be in place should it become appropriate to undertake a share repurchase.
Additional disclosure For purposes of considering Ordinary Resolution Number 10 and Special Resolution Number 1 and in terms of the JSE Listings
Requirements, the information below has been included in the Annual Report, in which this notice of Annual General Meeting is included, at the places indicated:
Litigation statement The directors, whose names are given on pages 16 and 17 of the annual report of which this notice forms part, are not aware
of any legal or arbitration proceedings, other than such proceedings disclosed on page 123, including proceedings that are pending or threatened, that may have or have had in the recent past, being at least the previous 12 (twelve) months, a material effect on the Group’s financial position.
Directors’ responsibility statement The directors, whose names are given on pages 16 and 17 of the annual report, collectively and individually accept
full responsibility for the accuracy of the information pertaining to this special resolution number 1 and ordinary resolution number 10 and certify that to the best of their knowledge and belief there are no facts that have been omitted which would make any statement false or misleading, and that all reasonable enquiries to ascertain such facts have been made and that this special resolution contains all information required by law and the JSE Listings Requirements.
Material changes Other than the facts and developments reported on in the annual report, there have been no material changes in the affairs or
financial position of the Company and/or the Group since the date of signature of the audit report and the date of this notice.
13. TO TRANSACT SUCH OTHER BUSINESS AS MAY BE TRANSACTED AT AN ANNUAL GENERAL MEETING Voting and Proxies Members who have not dematerialised their shares or who have dematerialised their shares with “own name” registration
are entitled to attend and vote at the Annual General Meeting and are entitled to appoint a proxy or proxies to attend, speak and vote in their stead. The person so appointed need not be a member. Proxy forms must be forwarded to reach the registered office of the Company or the Company’s transfer secretaries, Computershare Investor Services (Proprietary) Limited, 70 Marshall Street, Johannesburg 2001, or posted to the transfer secretaries at PO Box 61051, Marshalltown 2107, South Africa, so as to be received by them by no later than 12:00 on 31 July 2008. Members holding shares on the Jersey Branch register should forward the proxy form sent with this notice to Computershare Investor Services (Channel Islands) Limited in accordance with the instructions on the proxy form.

Datatec Annual Report 2008
156
Proxy forms must be completed only by members who have dematerialised their shares with “own name” registration or who have not dematerialised their shares.
On a show of hands, every member of the Company present in person or represented by proxy shall have one vote only. On a poll, every member of the Company present in person or represented by proxy shall have one vote for every share held in the Company by such member.
Members who have dematerialised their shares, other than those members who have dematerialised their shares with “own name” registration, who are unable to attend the AGM but wish to be represented thereat, should contact their Central Securities Depository Participant (“CSDP”) or broker (as the case may be) in the manner and time stipulated in their agreement entered into by such member and the CSDP or broker (as the case may be) to furnish the CSDP or broker (as the case may be) with their voting instructions and, in the event that such members wish to attend the meeting, to obtain the necessary authority to do so. Such members who wish to attend the AGM in person must obtain the necessary letter of representation from their CSDP or broker. Members holding depositary interests in shares on the Jersey Branch register should forward the form of instruction sent to them with this notice to Computershare Investor Services (Channel Islands) Limited in accordance with the instructions on the form of instruction.
By order of the Board
S P MorrisFor and on behalf of Datatec Management Services (Pty) LtdCompany Secretary
Sandton2008
Notice of Annual General Meeting continued
157
Datatec Annual Report 2008
Form of proxy
DATATEC LIMITED(“the company”)
(Incorporated in the Republic of South Africa)Registration number: 1994/005004/06
JSE Code: DTCISIN: ZAE000017745
Please note that this proxy form is only for use by members who have not dematerialised their ordinary shares or who have dematerialised their ordinary shares and registered them with own name registration.
I/We
Of
being a member/members of the abovementioned company, hereby appoint:
or failing him/her,
or failing him/her, the chairperson of the Annual General Meeting as my/our proxy to vote for me/us on my/our behalf at the Annual General Meeting of the Company to be held at 12:00 noon on 4 August 2008 and at any adjournment of that meeting.
Signed at this day of 2008
Signature
Please indicate with an “X” in the appropriate space on the right how you wish your votes to be cast. If you return this form duly signed, without any specific direction, the proxy shall be entitled to vote as he/she thinks fit.
In favour of resolution
Against resolution
Abstain from voting
ORDINARY RESOLUTIONS
1. Acceptance of annual financial statements
2. Re-election of J P Montanana
3. Re-election of N J Temple
4. Election of I P Dittrich
5. Approval of the auditors’ remuneration
6. Ratification of directors’ remuneration for the past financial year
7. Approval of non-executive directors’ fees and committee fees for the current financial year
8. Placing unissued shares under the control of the directors
9. General authority to issue shares for cash
10. Authority to make general payment to security holders
11. Authority to sign all documents required
SPECIAL RESOLUTION
1. General authority to repurchase shares

Datatec Annual Report 2008
158
I. A member entitled to attend and vote at the Annual General Meeting is entitled to appoint one or more proxies to attend, speak and vote in his/her stead. A proxy need not be a registered member of the Company.
2. Every member present in (person or by proxy and entitled to vote at the Annual General Meeting of the Company shall, on a show of hands, have one vote only irrespective of the number of shares such member holds. In the event of a poll, every member shall he entitled to that proportion of the total votes in the Company which the aggregate amount of the nominal value of the shares held by such member bears to the aggregate amount of the nominal value of all the shares issued by the Company.
3. Members registered in their own name are members who elected not to participate in the Issuer-Sponsored Nominee Programme and who appointed Computershare Limited as their Central Securities Depository Participant (“CSDP”) with the express instruction that their uncertificated shares are to be registered in the electronic subregister of members in their own names.
Instructions on signing and lodging the form of proxy:1. A member may insert the name of a proxy or the names of two alternative proxies of the member’s choice in the space/s
provided overleaf, with or without deleting “the chairperson of the Annual General Meeting’’, but any such deletion must be initialled by the member. Should these spaces be left blank, the proxy will be exercised by the chairperson of the Annual General Meeting. The person whose name appears first on the form of proxy and who is present at the Annual General Meeting will be entitled to act as proxy to the exclusion of those whose names follow.
2. A member’s voting instructions to the proxy must be indicated by the insertion of an ‘’X”, or the number of votes exercisable by that member, in the appropriate spaces provided overleaf. Failure to do so will be deemed to authorise the proxy to vote or to abstain from voting at the Annual General Meeting as he/she thinks fit in respect of all the member’s exercisable votes. A member or his/her proxy is not obliged to use all the votes exercisable by him/her or by his/her proxy but the total number of votes cast, or those in respect of which abstention is recorded, may not exceed the total number of votes exercisable by the member or by his/her proxy.
3. To be valid, the completed forms of proxy must be lodged with the transfer secretaries of the Company, Computershare Investor Services (Proprietary) Limited, at 70 Marshall Street, Johannesburg, 2001, South Africa, or posted to the transfer secretaries at PO Box 61051, Marshalltown, 2107, South Africa, to be received by them not later than 12:00 on Thursday, 31 July 2008.
4. Documentary evidence establishing the authority of a person signing this term of proxy in a representative capacity must be attached to this form of proxy unless previously recorded by the transfer secretaries or waived by the chairperson of the Annual General Meeting.
5. The completion and lodging of this form of proxy will not preclude the relevant member from attending the Annual General Meeting and speaking and voting in person thereat to the exclusion of any proxy appointed in terms hereof, should such member wish to do so.
The completion of any blank spaces overleaf need not be initialled. Any alterations or corrections to this form of proxy must be initialled by the signatory/ies.
The chairperson of the Annual General Meeting may accept any form of proxy which is completed other than in accordance with these instructions provided that he is satisfied as to the manner in which a member wishes to vote.
Members who have dematerialised their shares must inform their CSDP or broker of their intention to attend the Annual General Meeting and request their CSDP or broker to issue them with the necessary authorisation to attend or provide their CSDP or broker with their voting instructions should they not wish to attend the general meeting in person.
Notes to form of proxy

159
Datatec Annual Report 2008
Administration
Name Date of appointment Position held at 29 February 2008
Executive directorsJ P Montanana (British) 6 October 1994 Chief Executive OfficerD B Pfaff 1 July 2001 Group Finance DirectorI P Dittrich 1 March 2008 ~
Non-executive directorsL Boyd^ 6 December 2001 ChairmanC M L Savage* 6 December 2001 DirectorC S Seabrooke*^ 6 October 1994 DirectorN Temple (British)^ 1 October 2002 DirectorL W Nkuhlu* 1 September 2006 DirectorS J Davidson (British)*^ 1 February 2007 DirectorJ F McCartney (American) 16 July 2007 Director
*Audit, Risk and Compliance Committee^Remuneration Committee and Nomination Committee~Appointed after the end of the financial year

Datatec Annual Report 2008
160 Administration continued
Registered officeGround FloorSandown ChambersSandown Village16 Maude StreetSandownSouth AfricaTelephone +27 (0)11 233 1000Telefax +27 (0) 11 233 3300
Registration number1994/005004/06
SecretaryDatatec Management Services (Pty) Ltd (Managing Director – S P Morris)
Office – UK110 Buckingham AvenueSloughBerkshire SL14PFTelephone +44 (0) 1753 797 100Telefax +44 (0) 1753 819 284
Office – US520 White Plains RoadTarrytownNew York 10591Telephone +1 914 829 7170Telefax +1 914 829 7184
SponsorsRand Merchant Bank (a division of FirstRand Bank Limited)1 Merchant PlaceCorner Fredman Drive and Rivonia RoadSandton, 2196South Africa
Dresdner Kleinwort Limited30 Gresham StreetLondonEC2V 7PGUnited Kingdom
Investec Bank (UK) Limited2 Gresham StreetLondonEC2V 7QPUnited Kingdom
Transfer secretariesComputershare Investor Services (Pty) LimitedGround Floor 70 Marshall StreetJohannesburg, 2001South Africa
Computershare Investor Services (Channel Islands) LimitedOrdnance House31 Pier RoadSt HelierJerseyChannel Islands JE4 8PWUnited Kingdom
Corporate law advisers and consultantsBowman Gilfillan (Pty) Limited165 West StreetSandton, 2196South Africa
AuditorsDeloitte & ToucheThe Woodlands Woodlands DriveWoodmeadSandton, 2148South Africa
Principal bankers – SAThe Standard Bank of South Africa LimitedCommercial Banking Division7th Floor, 3 Simmonds StreetJohannesburg, 2000
Principal bankers – UKBarclays Bank PLCP.O. Box 54454 Lombard StreetLondon EC3V 9EX
Principal bankers – USHSBC Business Credit (USA) Inc452 Fifth AvenueNew York, NY 10018
GE Corporate Financial Services201 Merritt 7Norwalk, CT 06856

www.datatec-group.com Datatec Lim
ited 2008 annual report