2008 - world banksiteresources.worldbank.org/intstatinafr/resources/ldb-africa-12-2... · ldb...
TRANSCRIPT

2008 THE LITTLE DATA BOOK ON AFRICA
LDB Africa 12-2-08.indd 1 12/2/08 12:20:16 PM

Copyright ©2009 by the International Bank for Reconstruction and Development/THE WORLD BANK1818 H Street NWWashington DC 20433U.S.A.
All rights reservedManufactured in the United States of AmericaFirst printing December 2008
This volume is a product of the staff of the International Bank for Reconstruction and Development/The World Bank. The findings, interpretations, and conclusions expressed in this volume do not necessarily reflect the views of the Executive Directors of The World Bank or the governments they represent.
The World Bank does not guarantee the accuracy of the data included in this work. The boundaries, colors, denominations, and other information shown on any map in this work do not imply any judgment on the part of The World Bank concerning the legal status of any territory or the endorsement or acceptance of such boundaries.
Rights and PermissionsThe material in this publication is copyrighted. Copying and/or transmitting portions or all of this work without permission may be a violation of applicable law. The International Bank for Reconstruction and Development/The World Bank encourages dissemination of its work and will normally grant permission to reproduce portions of the work promptly.
For permission to photocopy or reprint any part of this work, please send a request with complete information to the Copyright Clearance Center Inc., 222 Rosewood Drive, Danvers, MA 01923, USA; telephone: 978-750-8400; fax: 978-750-4470; Internet: www.copyright.com.
All other queries on rights and licenses, including subsidiary rights, should be addressed to the Office of the Publisher, The World Bank, 1818 H Street NW, Washington, DC 20433, USA; fax: 202–522-2422; e-mail: [email protected].
For more information about the Africa Development Indicators suite of products, please visit our web site at www.worldbank.org/afr or email: [email protected].
To order The Little Data Book on Africa 2008/09, Africa Development Indicators 2008/09, African Development Indicators 2008/09 CD-ROM, and Africa Development Indicators Online, please visit the publications web site at www.worldbank.org/publications, email [email protected], or call 1-800-645-7247 or 703-661-1580. Discounts apply for residents of Africa. To subscribe to Africa Development Indicators Online please visit: http://publications.worldbank.org/ADI
ISBN: 978–0–8213–7788–8e-ISBN: 978–0–8213–7814–4DOI: 10.1596/978–0–8213–7788–8SKU: 17788
The Little Data Book on Africa 2008/09 is a product of the Africa Region.
Editing, design, and layout by Word Express, Inc,Washington, D.C.
Cover design by Peter Grundy Art & Design, London, UK.
X X X XX XX XX
LDB Africa 12-2-08.indd 2 12/2/08 12:20:16 PM

The Little Data Book on Africa 2008 iii
Acknowledgments ................................................................................ iv
Introduction ..........................................................................................v
User Guide ........................................................................................... vi
Country tables (in alphabetical order) ....................................................1
Algeria..........................................................................................2Angola ..........................................................................................4Benin............................................................................................6Botswana .....................................................................................8Burkina Faso ..............................................................................10Burundi ......................................................................................12Cameroon ...................................................................................14Cape Verde .................................................................................16Central African Republic ..............................................................18Chad ..........................................................................................20Comoros .....................................................................................22Congo, Rep. ................................................................................24Congo, Dem. Rep. .......................................................................26Côte d’Ivoire ...............................................................................28Djibouti.......................................................................................30Egypt, Arab Rep. .........................................................................32Eritrea ........................................................................................34Ethiopia ......................................................................................36Equatorial Guinea ........................................................................38Gabon .........................................................................................40Gambia, The ...............................................................................42Ghana .........................................................................................44Guinea ........................................................................................46Guinea-Bissau .............................................................................48Kenya .........................................................................................50Lesotho ......................................................................................52Liberia ........................................................................................54Libya ..........................................................................................56Madagascar ................................................................................58Malawi .......................................................................................60Mali............................................................................................62Mauritania ..................................................................................64Mauritius ....................................................................................66Morocco .....................................................................................68Mozambique ...............................................................................70Namibia ......................................................................................72Niger ..........................................................................................74Nigeria .......................................................................................76Rwanda ......................................................................................78São Tomé and Principe ................................................................80Senegal ......................................................................................82Seychelles ..................................................................................84Sierra Leone ...............................................................................86Somalia ......................................................................................88South Africa ................................................................................90Sudan .........................................................................................92Swaziland ...................................................................................94Tanzania .....................................................................................96Togo ...........................................................................................98Tunisia......................................................................................100Uganda .....................................................................................102Zambia .....................................................................................104Zimbabwe.................................................................................106
Glossary............................................................................................108
Contents
LDB Africa 12-2-08.indd 3 12/2/08 12:20:17 PM

iv 2008 The Little Data Book on Africa
AcknowledgmentsThe Little Data Book on Africa 2008/09 is a product of the Africa Region. Jorge Saba Arbache was the manager of this book and its companions. Rose Mungai led the work on data gathering, consistency checks and com-pilation. The core team included Mehdi Akhlaghi, Mpho Chinyolo, Francoise Genouille, Jane Njuguna, and Christophe Rockmore.
Shantayanan Devarajan, chief economist for the Africa Region, provided overall guidance and supervision.
Word Express, Inc, provided design, editing, and layout.
Dohatec New Media prepared the navigation structure and interface de-sign of the Africa Development Indicators 2008/09 CD-ROM.
LDB Africa 12-2-08.indd 4 12/2/08 12:20:17 PM

The Little Data Book on Africa 2008 v
IntroductionThe Little Data Book on Africa 2008/09 is a pocket edition of Africa De-velopment Indicators 2008/09. It contains some 115 key indicators on economics, human development, governance, and partnership and is in-tended as a quick reference for users of the Africa Development Indicators 2008/09 book and African Development Indicators Online. The country tables present the latest available data for World Bank member countries in Africa.
LDB Africa 12-2-08.indd 5 12/2/08 12:20:17 PM
vi 2008 The Little Data Book on Africa
User GuideCountries are listed alphabetically.
StatisticsData are shown for economies as they were constituted in 2006, and his-torical data are revised to reflect current political arrangements. Excep-tions are noted throughout the tables. Data will, however, be provided for doing business, investment climate, Governance and anticorruption indica-tors, and Country Policy and Institutional Assessment ratings (CPIA) for later years (2007–08).
Data in the table are for 2006, 2007 or 2008, except where otherwise noted.
Data in italics are the most recent values for the period 2000–2005.
Growth rates are proportional changes from the previous year.
.. means that data are not available or that aggregates cannot be calculated because of missing data in the years shown
$ means U.S. dollars
0 or 0.0 means zero or small enough that the number would round to zero at the displayed number of decimal places.
Dash or hyphen in dates, as in 2004–06, means that the period of time straddles between those years.
A blank means not applicable or, for an aggregate, not analytically mean-ingful.
Data consistency, reliability and comparabilityConsiderable effort has been made to harmonize the data, but full compara-bility cannot be assured, and care must be taken in interpreting indicators. Many factors affect data availability, comparability, and reliability. Data coverage may not be complete because of special circumstances affect-ing the collection and reporting of data, such as conflicts. Except where otherwise stated, growth rates are in real terms.
LDB Africa 12-2-08.indd 6 12/2/08 12:20:17 PM

The Little Data Book on Africa 2008 1
Country tables
LDB Africa 12-2-08.indd 1 12/2/08 12:20:17 PM

2 2008 The Little Data Book on Africa
Algeria North Country Africa
Population (millions)Population growth (%)GNI per capita ($)
Economic density (current $/sq km)GDP ($ millions)GDP growth (%)GDP per capita (2000 $)GDP per capita growth (%)GDP deflator, index (2000=100; US$ series)CPI (% change)Value added, agriculture (% of GDP)Value added, industry (% of GDP)Value added, services and etc (% of GDP)Current account balance (% of GDP)Fiscal balance (cash surplus or deficit, % of GDP)Central government revenue (% of GDP)Total external debt (% of GDP)
DriversofgrowthGross domestic savings (% of GDP)Gross fixed capital formation (% of GDP)Private sector capital formation (% of GDP)Gross primary school enrollment, total (% of relevant age group)Gross secondary school enrollment, total (% of relevant age group)Gross tertiary school enrollment, total (% of relevant age group)Public current education expenditure, primary (% of total current education expenditure)Starting a business, procedures (number)Starting a business, time (days)Starting a business, cost (% of income per capita)Registering property, time (days)Enforcing contracts, time (days)Protecting investors, disclosure Index (0=less disclosure to 10=more disclosure)Paying taxes, time (hours)Paying taxes, total tax rate (% profit)Average time to clear direct exports through customs (days)Average time to clear imports from customs (days)Rigidity of employment index (0 least rigid to 100 most rigid)Delay in obtaining an electrical connection (days)Electric power outages in a typical month (number)Access to electricity (% of total population)Ratio of paved to total roads (%)Road density (road km/1,000 km2 of land area)Real interest rate (%)Domestic credit to private sector (% of GDP)Corruption (% of firms identifying this as a major constraint)Believing the court system is fair, impartial and uncorrupted (% of firms this as a major contraint)Crime, theft and disorder (% of firms identifying this as major constraint)Tax rates (% of firms identifying this as major constraint)Access to finance (% of firms identifying this as a major constraint)Electricity (% of firms identifying this as a major constraint)Labor regulations (% of firms identifying this as a major constraint)Labor skill level (% of firms identifying this as a major constraint)Irrigated land (% of cropland)Fertilizer consumption (100 grams per hectare of arable land)Agricultural machinery tractors per 100 hectares of arable landCereal crop yield (kg per hectare)Exports of goods and services (% of GDP)
33.4 154.2 1.5 1.6 3,110 2,333
48,897 64,481 116,459 370,017 1.8 5.5 2,123 2,060 0.3 3.9 164 117 2.5 7.9 10.3 57.4 41.9 28.1 40.9 .. 10.3 13.6 0.0 46.2 36.2 4.8 19.4
54.1 37.0 30.0 23.5 14.1 14.8 110.5 106.1 83.2 77.2 21.8 26.6 .. .. 14 9 24 14 13.2 15.4 51 83 630 705 6 5 451 447 74 57 9 3 17 10 48 47 49 34 5 4 .. .. 70 68 45 .. –3 12 38 64 .. 21 47 50 48 14 37 6.9 .. 144 1,265 134 139 1,503 2,906 48 39
LDB Africa 12-2-08.indd 2 12/2/08 12:20:17 PM
The Little Data Book on Africa 2008 3
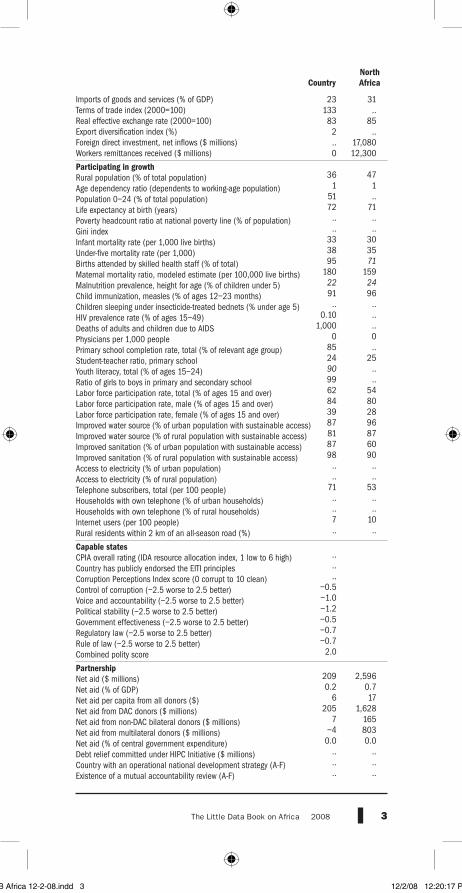
Imports of goods and services (% of GDP)Terms of trade index (2000=100)Real effective exchange rate (2000=100)Export diversification index (%)Foreign direct investment, net inflows ($ millions)Workers remittances received ($ millions)
ParticipatingingrowthRural population (% of total population)Age dependency ratio (dependents to working-age population)Population 0–24 (% of total population)Life expectancy at birth (years)Poverty headcount ratio at national poverty line (% of population)Gini indexInfant mortality rate (per 1,000 live births)Under-five mortality rate (per 1,000)Births attended by skilled health staff (% of total)Maternal mortality ratio, modeled estimate (per 100,000 live births)Malnutrition prevalence, height for age (% of children under 5)Child immunization, measles (% of ages 12–23 months)Children sleeping under insecticide-treated bednets (% under age 5)HIV prevalence rate (% of ages 15–49)Deaths of adults and children due to AIDSPhysicians per 1,000 peoplePrimary school completion rate, total (% of relevant age group)Student-teacher ratio, primary schoolYouth literacy, total (% of ages 15–24)Ratio of girls to boys in primary and secondary schoolLabor force participation rate, total (% of ages 15 and over)Labor force participation rate, male (% of ages 15 and over)Labor force participation rate, female (% of ages 15 and over)Improved water source (% of urban population with sustainable access) Improved water source (% of rural population with sustainable access) Improved sanitation (% of urban population with sustainable access) Improved sanitation (% of rural population with sustainable access) Access to electricity (% of urban population)Access to electricity (% of rural population)Telephone subscribers, total (per 100 people)Households with own telephone (% of urban households)Households with own telephone (% of rural households)Internet users (per 100 people)Rural residents within 2 km of an all-season road (%)
CapablestatesCPIA overall rating (IDA resource allocation index, 1 low to 6 high)Country has publicly endorsed the EITI principles Corruption Perceptions Index score (0 corrupt to 10 clean)Control of corruption (–2.5 worse to 2.5 better)Voice and accountability (–2.5 worse to 2.5 better)Political stability (–2.5 worse to 2.5 better)Government effectiveness (–2.5 worse to 2.5 better)Regulatory law (–2.5 worse to 2.5 better)Rule of law (–2.5 worse to 2.5 better)Combined polity score
PartnershipNet aid ($ millions)Net aid (% of GDP)Net aid per capita from all donors ($)Net aid from DAC donors ($ millions)Net aid from non-DAC bilateral donors ($ millions)Net aid from multilateral donors ($ millions)Net aid (% of central government expenditure)Debt relief committed under HIPC Initiative ($ millions)Country with an operational national development strategy (A-F)Existence of a mutual accountability review (A-F)
North Country Africa
23 31 133 .. 83 85 2 .. .. 17,080 0 12,300 36 47 1 1 51 .. 72 71 .. .. .. .. 33 30 38 35 95 71 180 159 22 24 91 96 .. .. 0.10 .. 1,000 .. 0 0 85 .. 24 25 90 .. 99 .. 62 54 84 80 39 28 87 96 81 87 87 60 98 90 .. .. .. .. 71 53 .. .. .. .. 7 10 .. ..
.. .. .. –0.5 –1.0 –1.2 –0.5 –0.7 –0.7 2.0
209 2,596 0.2 0.7 6 17 205 1,628 7 165 –4 803 0.0 0.0 .. .. .. .. .. ..
LDB Africa 12-2-08.indd 3 12/2/08 12:20:17 PM

4 2008 The Little Data Book on Africa
Angola Sub-Saharan Country Africa
Population (millions)Population growth (%)GNI per capita ($)
Economic density (current $/sq km)GDP ($ millions)GDP growth (%)GDP per capita (2000 $)GDP per capita growth (%)GDP deflator, index (2000=100; US$ series)CPI (% change)Value added, agriculture (% of GDP)Value added, industry (% of GDP)Value added, services and etc (% of GDP)Current account balance (% of GDP)Fiscal balance (cash surplus or deficit, % of GDP)Central government revenue (% of GDP)Total external debt (% of GDP)
DriversofgrowthGross domestic savings (% of GDP)Gross fixed capital formation (% of GDP)Private sector capital formation (% of GDP)Gross primary school enrollment, total (% of relevant age group)Gross secondary school enrollment, total (% of relevant age group)Gross tertiary school enrollment, total (% of relevant age group)Public current education expenditure, primary (% of total current education expenditure)Starting a business, procedures (number)Starting a business, time (days)Starting a business, cost (% of income per capita)Registering property, time (days)Enforcing contracts, time (days)Protecting investors, disclosure Index (0=less disclosure to 10=more disclosure)Paying taxes, time (hours)Paying taxes, total tax rate (% profit)Average time to clear direct exports through customs (days)Average time to clear imports from customs (days)Rigidity of employment index (0 least rigid to 100 most rigid)Delay in obtaining an electrical connection (days)Electric power outages in a typical month (number)Access to electricity (% of total population)Ratio of paved to total roads (%)Road density (road km/1,000 km2 of land area)Real interest rate (%)Domestic credit to private sector (% of GDP)Corruption (% of firms identifying this as a major constraint)Believing the court system is fair, impartial and uncorrupted (% of firms this as a major contraint)Crime, theft and disorder (% of firms identifying this as major constraint)Tax rates (% of firms identifying this as major constraint)Access to finance (% of firms identifying this as a major constraint)Electricity (% of firms identifying this as a major constraint)Labor regulations (% of firms identifying this as a major constraint)Labor skill level (% of firms identifying this as a major constraint)Irrigated land (% of cropland)Fertilizer consumption (100 grams per hectare of arable land)Agricultural machinery tractors per 100 hectares of arable landCereal crop yield (kg per hectare)Exports of goods and services (% of GDP)
16.6 782.5 2.9 2.5 1,970 861
36,226 31,518 45,163 744,731 18.6 5.8 1,069 580 15.3 3.2 255 164 11.7 8.9 14.5 69.7 34.0 21.4 42.6 23.7 2.0 .. .. 46.4 23.9 21.2 23.4
49.5 29.0 13.7 18.9 2.4 12.5 .. 93.2 17.8 28.6 2.9 6.1 .. .. 12 11 119 56 343.7 160.3 334 103 1,011 673 5 5 272 320 53 67 16 8 28 8 69 42 60 44 8 7 .. .. 10 12 41 .. 4 7 65 36 32 37 23 55 46 12 21 2.2 3.5 23 106 31 13 485 1,262 74 37
LDB Africa 12-2-08.indd 4 12/2/08 12:20:18 PM
The Little Data Book on Africa 2008 5
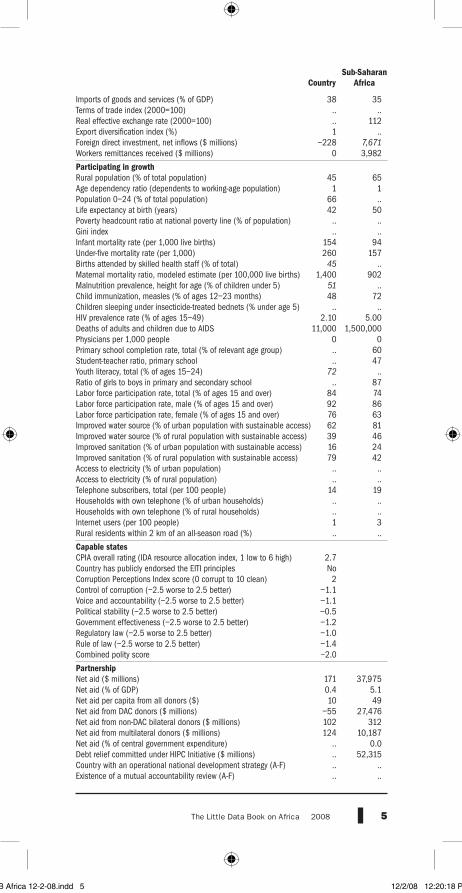
Imports of goods and services (% of GDP)Terms of trade index (2000=100)Real effective exchange rate (2000=100)Export diversification index (%)Foreign direct investment, net inflows ($ millions)Workers remittances received ($ millions)
ParticipatingingrowthRural population (% of total population)Age dependency ratio (dependents to working-age population)Population 0–24 (% of total population)Life expectancy at birth (years)Poverty headcount ratio at national poverty line (% of population)Gini indexInfant mortality rate (per 1,000 live births)Under-five mortality rate (per 1,000)Births attended by skilled health staff (% of total)Maternal mortality ratio, modeled estimate (per 100,000 live births)Malnutrition prevalence, height for age (% of children under 5)Child immunization, measles (% of ages 12–23 months)Children sleeping under insecticide-treated bednets (% under age 5)HIV prevalence rate (% of ages 15–49)Deaths of adults and children due to AIDSPhysicians per 1,000 peoplePrimary school completion rate, total (% of relevant age group)Student-teacher ratio, primary schoolYouth literacy, total (% of ages 15–24)Ratio of girls to boys in primary and secondary schoolLabor force participation rate, total (% of ages 15 and over)Labor force participation rate, male (% of ages 15 and over)Labor force participation rate, female (% of ages 15 and over)Improved water source (% of urban population with sustainable access) Improved water source (% of rural population with sustainable access) Improved sanitation (% of urban population with sustainable access) Improved sanitation (% of rural population with sustainable access) Access to electricity (% of urban population)Access to electricity (% of rural population)Telephone subscribers, total (per 100 people)Households with own telephone (% of urban households)Households with own telephone (% of rural households)Internet users (per 100 people)Rural residents within 2 km of an all-season road (%)
CapablestatesCPIA overall rating (IDA resource allocation index, 1 low to 6 high)Country has publicly endorsed the EITI principles Corruption Perceptions Index score (0 corrupt to 10 clean)Control of corruption (–2.5 worse to 2.5 better)Voice and accountability (–2.5 worse to 2.5 better)Political stability (–2.5 worse to 2.5 better)Government effectiveness (–2.5 worse to 2.5 better)Regulatory law (–2.5 worse to 2.5 better)Rule of law (–2.5 worse to 2.5 better)Combined polity score
PartnershipNet aid ($ millions)Net aid (% of GDP)Net aid per capita from all donors ($)Net aid from DAC donors ($ millions)Net aid from non-DAC bilateral donors ($ millions)Net aid from multilateral donors ($ millions)Net aid (% of central government expenditure)Debt relief committed under HIPC Initiative ($ millions)Country with an operational national development strategy (A-F)Existence of a mutual accountability review (A-F)
Sub-Saharan Country Africa
38 35 .. .. .. 112 1 .. –228 7,671 0 3,982
45 65 1 1 66 .. 42 50 .. .. .. .. 154 94 260 157 45 .. 1,400 902 51 .. 48 72 .. .. 2.10 5.00 11,000 1,500,000 0 0 .. 60 .. 47 72 .. .. 87 84 74 92 86 76 63 62 81 39 46 16 24 79 42 .. .. .. .. 14 19 .. .. .. .. 1 3 .. ..
2.7 No 2 –1.1 –1.1 –0.5 –1.2 –1.0 –1.4 –2.0
171 37,975 0.4 5.1 10 49 –55 27,476 102 312 124 10,187 .. 0.0 .. 52,315 .. .. .. ..
LDB Africa 12-2-08.indd 5 12/2/08 12:20:18 PM
6 2008 The Little Data Book on Africa
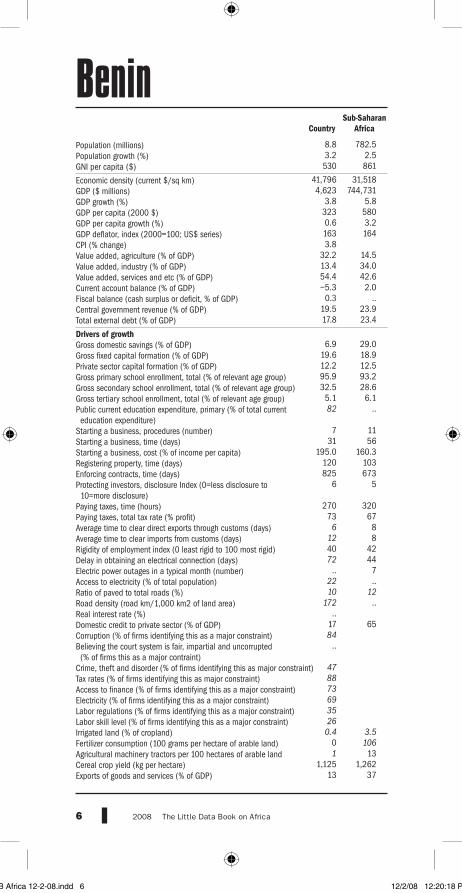
Benin Sub-Saharan Country Africa
Population (millions)Population growth (%)GNI per capita ($)
Economic density (current $/sq km)GDP ($ millions)GDP growth (%)GDP per capita (2000 $)GDP per capita growth (%)GDP deflator, index (2000=100; US$ series)CPI (% change)Value added, agriculture (% of GDP)Value added, industry (% of GDP)Value added, services and etc (% of GDP)Current account balance (% of GDP)Fiscal balance (cash surplus or deficit, % of GDP)Central government revenue (% of GDP)Total external debt (% of GDP)
DriversofgrowthGross domestic savings (% of GDP)Gross fixed capital formation (% of GDP)Private sector capital formation (% of GDP)Gross primary school enrollment, total (% of relevant age group)Gross secondary school enrollment, total (% of relevant age group)Gross tertiary school enrollment, total (% of relevant age group)Public current education expenditure, primary (% of total current education expenditure)Starting a business, procedures (number)Starting a business, time (days)Starting a business, cost (% of income per capita)Registering property, time (days)Enforcing contracts, time (days)Protecting investors, disclosure Index (0=less disclosure to 10=more disclosure)Paying taxes, time (hours)Paying taxes, total tax rate (% profit)Average time to clear direct exports through customs (days)Average time to clear imports from customs (days)Rigidity of employment index (0 least rigid to 100 most rigid)Delay in obtaining an electrical connection (days)Electric power outages in a typical month (number)Access to electricity (% of total population)Ratio of paved to total roads (%)Road density (road km/1,000 km2 of land area)Real interest rate (%)Domestic credit to private sector (% of GDP)Corruption (% of firms identifying this as a major constraint)Believing the court system is fair, impartial and uncorrupted (% of firms this as a major contraint)Crime, theft and disorder (% of firms identifying this as major constraint)Tax rates (% of firms identifying this as major constraint)Access to finance (% of firms identifying this as a major constraint)Electricity (% of firms identifying this as a major constraint)Labor regulations (% of firms identifying this as a major constraint)Labor skill level (% of firms identifying this as a major constraint)Irrigated land (% of cropland)Fertilizer consumption (100 grams per hectare of arable land)Agricultural machinery tractors per 100 hectares of arable landCereal crop yield (kg per hectare)Exports of goods and services (% of GDP)
8.8 782.5 3.2 2.5 530 861
41,796 31,518 4,623 744,731 3.8 5.8 323 580 0.6 3.2 163 164 3.8 32.2 14.5 13.4 34.0 54.4 42.6 –5.3 2.0 0.3 .. 19.5 23.9 17.8 23.4
6.9 29.0 19.6 18.9 12.2 12.5 95.9 93.2 32.5 28.6 5.1 6.1 82 ..
7 11 31 56 195.0 160.3 120 103 825 673 6 5
270 320 73 67 6 8 12 8 40 42 72 44 .. 7 22 .. 10 12 172 .. .. 17 65 84 ..
47 88 73 69 35 26 0.4 3.5 0 106 1 13 1,125 1,262 13 37
LDB Africa 12-2-08.indd 6 12/2/08 12:20:18 PM

The Little Data Book on Africa 2008 7
Imports of goods and services (% of GDP)Terms of trade index (2000=100)Real effective exchange rate (2000=100)Export diversification index (%)Foreign direct investment, net inflows ($ millions)Workers remittances received ($ millions)
ParticipatingingrowthRural population (% of total population)Age dependency ratio (dependents to working-age population)Population 0–24 (% of total population)Life expectancy at birth (years)Poverty headcount ratio at national poverty line (% of population)Gini indexInfant mortality rate (per 1,000 live births)Under-five mortality rate (per 1,000)Births attended by skilled health staff (% of total)Maternal mortality ratio, modeled estimate (per 100,000 live births)Malnutrition prevalence, height for age (% of children under 5)Child immunization, measles (% of ages 12–23 months)Children sleeping under insecticide-treated bednets (% under age 5)HIV prevalence rate (% of ages 15–49)Deaths of adults and children due to AIDSPhysicians per 1,000 peoplePrimary school completion rate, total (% of relevant age group)Student-teacher ratio, primary schoolYouth literacy, total (% of ages 15–24)Ratio of girls to boys in primary and secondary schoolLabor force participation rate, total (% of ages 15 and over)Labor force participation rate, male (% of ages 15 and over)Labor force participation rate, female (% of ages 15 and over)Improved water source (% of urban population with sustainable access) Improved water source (% of rural population with sustainable access) Improved sanitation (% of urban population with sustainable access) Improved sanitation (% of rural population with sustainable access) Access to electricity (% of urban population)Access to electricity (% of rural population)Telephone subscribers, total (per 100 people)Households with own telephone (% of urban households)Households with own telephone (% of rural households)Internet users (per 100 people)Rural residents within 2 km of an all-season road (%)
CapablestatesCPIA overall rating (IDA resource allocation index, 1 low to 6 high)Country has publicly endorsed the EITI principles Corruption Perceptions Index score (0 corrupt to 10 clean)Control of corruption (–2.5 worse to 2.5 better)Voice and accountability (–2.5 worse to 2.5 better)Political stability (–2.5 worse to 2.5 better)Government effectiveness (–2.5 worse to 2.5 better)Regulatory law (–2.5 worse to 2.5 better)Rule of law (–2.5 worse to 2.5 better)Combined polity score
PartnershipNet aid ($ millions)Net aid (% of GDP)Net aid per capita from all donors ($)Net aid from DAC donors ($ millions)Net aid from non-DAC bilateral donors ($ millions)Net aid from multilateral donors ($ millions)Net aid (% of central government expenditure)Debt relief committed under HIPC Initiative ($ millions)Country with an operational national development strategy (A-F)Existence of a mutual accountability review (A-F)
Sub-Saharan Country Africa
26 35 92 .. .. 112 5 .. 53 7,671 0 3,982
60 65 1 1 64 .. 56 50 .. .. 36 .. 88 94 148 157 79 .. 840 902 39 .. 89 72 7 .. 1.20 5.00 3,300 1,500,000 0 0 64 60 44 47 45 .. 73 87 71 74 86 86 55 63 78 81 57 46 11 24 59 42 51 .. 6 .. 13 19 10 .. 1 .. 1 3 32.0 ..
3.6 No 3 –0.5 0.3 0.4 –0.6 –0.4 –0.6 7.0
375 37,975 8.1 5.1 43 49 228 27,476 0 312 147 10,187 0.0 0.0 460 52,315 3 .. 2 ..
LDB Africa 12-2-08.indd 7 12/2/08 12:20:18 PM

8 2008 The Little Data Book on Africa
Botswana Sub-Saharan Country Africa
Population (millions)Population growth (%)GNI per capita ($)
Economic density (current $/sq km)GDP ($ millions)GDP growth (%)GDP per capita (2000 $)GDP per capita growth (%)GDP deflator, index (2000=100; US$ series)CPI (% change)Value added, agriculture (% of GDP)Value added, industry (% of GDP)Value added, services and etc (% of GDP)Current account balance (% of GDP)Fiscal balance (cash surplus or deficit, % of GDP)Central government revenue (% of GDP)Total external debt (% of GDP)
DriversofgrowthGross domestic savings (% of GDP)Gross fixed capital formation (% of GDP)Private sector capital formation (% of GDP)Gross primary school enrollment, total (% of relevant age group)Gross secondary school enrollment, total (% of relevant age group)Gross tertiary school enrollment, total (% of relevant age group)Public current education expenditure, primary (% of total current education expenditure)Starting a business, procedures (number)Starting a business, time (days)Starting a business, cost (% of income per capita)Registering property, time (days)Enforcing contracts, time (days)Protecting investors, disclosure Index (0=less disclosure to 10=more disclosure)Paying taxes, time (hours)Paying taxes, total tax rate (% profit)Average time to clear direct exports through customs (days)Average time to clear imports from customs (days)Rigidity of employment index (0 least rigid to 100 most rigid)Delay in obtaining an electrical connection (days)Electric power outages in a typical month (number)Access to electricity (% of total population)Ratio of paved to total roads (%)Road density (road km/1,000 km2 of land area)Real interest rate (%)Domestic credit to private sector (% of GDP)Corruption (% of firms identifying this as a major constraint)Believing the court system is fair, impartial and uncorrupted (% of firms this as a major contraint)Crime, theft and disorder (% of firms identifying this as major constraint)Tax rates (% of firms identifying this as major constraint)Access to finance (% of firms identifying this as a major constraint)Electricity (% of firms identifying this as a major constraint)Labor regulations (% of firms identifying this as a major constraint)Labor skill level (% of firms identifying this as a major constraint)Irrigated land (% of cropland)Fertilizer consumption (100 grams per hectare of arable land)Agricultural machinery tractors per 100 hectares of arable landCereal crop yield (kg per hectare)Exports of goods and services (% of GDP)
1.9 782.5 1.2 2.5 5,680 861
19,421 31,518 11,006 744,731 3.4 5.8 4,511 580 2.2 3.2 131 164 11.6 1.7 14.5 50.9 34.0 39.6 42.6 17.6 2.0 .. .. 39.9 23.9 3.7 23.4
52.4 29.0 30.0 18.9 9.6 12.5 106.7 93.2 76.5 28.6 5.1 6.1 78 .. 11 11 108 56 9.9 160.3 11 103 987 673 8 5 140 320 17 67 1 8 3 8 20 42 25 44 2 7 .. .. 33 12 43 .. 1 19 65 23 70 24 25 41 7 9 20 0.3 3.5 122 106 159 13 341 1,262 51 37
LDB Africa 12-2-08.indd 8 12/2/08 12:20:19 PM

The Little Data Book on Africa 2008 9
Imports of goods and services (% of GDP)Terms of trade index (2000=100)Real effective exchange rate (2000=100)Export diversification index (%)Foreign direct investment, net inflows ($ millions)Workers remittances received ($ millions)
ParticipatingingrowthRural population (% of total population)Age dependency ratio (dependents to working-age population)Population 0–24 (% of total population)Life expectancy at birth (years)Poverty headcount ratio at national poverty line (% of population)Gini indexInfant mortality rate (per 1,000 live births)Under-five mortality rate (per 1,000)Births attended by skilled health staff (% of total)Maternal mortality ratio, modeled estimate (per 100,000 live births)Malnutrition prevalence, height for age (% of children under 5)Child immunization, measles (% of ages 12–23 months)Children sleeping under insecticide-treated bednets (% under age 5)HIV prevalence rate (% of ages 15–49)Deaths of adults and children due to AIDSPhysicians per 1,000 peoplePrimary school completion rate, total (% of relevant age group)Student-teacher ratio, primary schoolYouth literacy, total (% of ages 15–24)Ratio of girls to boys in primary and secondary schoolLabor force participation rate, total (% of ages 15 and over)Labor force participation rate, male (% of ages 15 and over)Labor force participation rate, female (% of ages 15 and over)Improved water source (% of urban population with sustainable access) Improved water source (% of rural population with sustainable access) Improved sanitation (% of urban population with sustainable access) Improved sanitation (% of rural population with sustainable access) Access to electricity (% of urban population)Access to electricity (% of rural population)Telephone subscribers, total (per 100 people)Households with own telephone (% of urban households)Households with own telephone (% of rural households)Internet users (per 100 people)Rural residents within 2 km of an all-season road (%)
CapablestatesCPIA overall rating (IDA resource allocation index, 1 low to 6 high)Country has publicly endorsed the EITI principles Corruption Perceptions Index score (0 corrupt to 10 clean)Control of corruption (–2.5 worse to 2.5 better)Voice and accountability (–2.5 worse to 2.5 better)Political stability (–2.5 worse to 2.5 better)Government effectiveness (–2.5 worse to 2.5 better)Regulatory law (–2.5 worse to 2.5 better)Rule of law (–2.5 worse to 2.5 better)Combined polity score
PartnershipNet aid ($ millions)Net aid (% of GDP)Net aid per capita from all donors ($)Net aid from DAC donors ($ millions)Net aid from non-DAC bilateral donors ($ millions)Net aid from multilateral donors ($ millions)Net aid (% of central government expenditure)Debt relief committed under HIPC Initiative ($ millions)Country with an operational national development strategy (A-F)Existence of a mutual accountability review (A-F)
Sub-Saharan Country Africa
28 35 98 .. .. 112 2 .. 536 7,671 79 3,982
42 65 1 1 58 .. 50 50 .. .. .. .. 90 94 124 157 94 .. 380 902 29 .. 90 72 .. .. 23.90 5.00 11,000 1,500,000 0 0 95 60 24 47 94 .. 101 87 59 74 71 86 48 63 100 81 90 46 30 24 60 42 .. .. .. .. 51 19 .. .. .. .. 4 3 .. ..
.. No 5 0.9 0.5 0.8 0.7 0.5 0.7 9.0
65 37,975 0.6 5.1 35 49 36 27,476 –2 312 30 10,187 0.0 0.0 .. 52,315 .. .. .. ..
LDB Africa 12-2-08.indd 9 12/2/08 12:20:19 PM

10 2008 The Little Data Book on Africa
Burkina Faso Sub-Saharan Country Africa
Population (millions)Population growth (%)GNI per capita ($)
Economic density (current $/sq km)GDP ($ millions)GDP growth (%)GDP per capita (2000 $)GDP per capita growth (%)GDP deflator, index (2000=100; US$ series)CPI (% change)Value added, agriculture (% of GDP)Value added, industry (% of GDP)Value added, services and etc (% of GDP)Current account balance (% of GDP)Fiscal balance (cash surplus or deficit, % of GDP)Central government revenue (% of GDP)Total external debt (% of GDP)
DriversofgrowthGross domestic savings (% of GDP)Gross fixed capital formation (% of GDP)Private sector capital formation (% of GDP)Gross primary school enrollment, total (% of relevant age group)Gross secondary school enrollment, total (% of relevant age group)Gross tertiary school enrollment, total (% of relevant age group)Public current education expenditure, primary (% of total current education expenditure)Starting a business, procedures (number)Starting a business, time (days)Starting a business, cost (% of income per capita)Registering property, time (days)Enforcing contracts, time (days)Protecting investors, disclosure Index (0=less disclosure to 10=more disclosure)Paying taxes, time (hours)Paying taxes, total tax rate (% profit)Average time to clear direct exports through customs (days)Average time to clear imports from customs (days)Rigidity of employment index (0 least rigid to 100 most rigid)Delay in obtaining an electrical connection (days)Electric power outages in a typical month (number)Access to electricity (% of total population)Ratio of paved to total roads (%)Road density (road km/1,000 km2 of land area)Real interest rate (%)Domestic credit to private sector (% of GDP)Corruption (% of firms identifying this as a major constraint)Believing the court system is fair, impartial and uncorrupted (% of firms this as a major contraint)Crime, theft and disorder (% of firms identifying this as major constraint)Tax rates (% of firms identifying this as major constraint)Access to finance (% of firms identifying this as a major constraint)Electricity (% of firms identifying this as a major constraint)Labor regulations (% of firms identifying this as a major constraint)Labor skill level (% of firms identifying this as a major constraint)Irrigated land (% of cropland)Fertilizer consumption (100 grams per hectare of arable land)Agricultural machinery tractors per 100 hectares of arable landCereal crop yield (kg per hectare)Exports of goods and services (% of GDP)
14.4 782.5 3.1 2.5 420 861
21,094 31,518 5,771 744,731 5.5 5.8 258 580 2.4 3.2 156 164 2.3 32.8 14.5 22.0 34.0 43.7 42.6 –10.3 2.0 –6.1 .. 13.0 23.9 19.8 23.4
2.8 29.0 18.1 18.9 11.1 12.5 59.8 93.2 14.5 28.6 2.3 6.1 96 .. 6 11 18 56 82.1 160.3 182 103 446 673 6 5 270 320 48 67 3 8 5 8 51 42 20 44 10 7 10 .. 4 12 338 .. .. 18 65 54 39 18 75 80 49 12 13 0.5 3.5 126 106 4 13 1,127 1,262 12 37
LDB Africa 12-2-08.indd 10 12/2/08 12:20:19 PM

The Little Data Book on Africa 2008 11
Imports of goods and services (% of GDP)Terms of trade index (2000=100)Real effective exchange rate (2000=100)Export diversification index (%)Foreign direct investment, net inflows ($ millions)Workers remittances received ($ millions)
ParticipatingingrowthRural population (% of total population)Age dependency ratio (dependents to working-age population)Population 0–24 (% of total population)Life expectancy at birth (years)Poverty headcount ratio at national poverty line (% of population)Gini indexInfant mortality rate (per 1,000 live births)Under-five mortality rate (per 1,000)Births attended by skilled health staff (% of total)Maternal mortality ratio, modeled estimate (per 100,000 live births)Malnutrition prevalence, height for age (% of children under 5)Child immunization, measles (% of ages 12–23 months)Children sleeping under insecticide-treated bednets (% under age 5)HIV prevalence rate (% of ages 15–49)Deaths of adults and children due to AIDSPhysicians per 1,000 peoplePrimary school completion rate, total (% of relevant age group)Student-teacher ratio, primary schoolYouth literacy, total (% of ages 15–24)Ratio of girls to boys in primary and secondary schoolLabor force participation rate, total (% of ages 15 and over)Labor force participation rate, male (% of ages 15 and over)Labor force participation rate, female (% of ages 15 and over)Improved water source (% of urban population with sustainable access) Improved water source (% of rural population with sustainable access) Improved sanitation (% of urban population with sustainable access) Improved sanitation (% of rural population with sustainable access) Access to electricity (% of urban population)Access to electricity (% of rural population)Telephone subscribers, total (per 100 people)Households with own telephone (% of urban households)Households with own telephone (% of rural households)Internet users (per 100 people)Rural residents within 2 km of an all-season road (%)
CapablestatesCPIA overall rating (IDA resource allocation index, 1 low to 6 high)Country has publicly endorsed the EITI principles Corruption Perceptions Index score (0 corrupt to 10 clean)Control of corruption (–2.5 worse to 2.5 better)Voice and accountability (–2.5 worse to 2.5 better)Political stability (–2.5 worse to 2.5 better)Government effectiveness (–2.5 worse to 2.5 better)Regulatory law (–2.5 worse to 2.5 better)Rule of law (–2.5 worse to 2.5 better)Combined polity score
PartnershipNet aid ($ millions)Net aid (% of GDP)Net aid per capita from all donors ($)Net aid from DAC donors ($ millions)Net aid from non-DAC bilateral donors ($ millions)Net aid from multilateral donors ($ millions)Net aid (% of central government expenditure)Debt relief committed under HIPC Initiative ($ millions)Country with an operational national development strategy (A-F)Existence of a mutual accountability review (A-F)
Sub-Saharan Country Africa
27 35 96 .. .. 112 2 .. 8 7,671 0 3,982
81 65 1 1 66 .. 52 50 46 .. 40 .. 122 94 204 157 54 .. 700 902 43 .. 88 72 2 .. 1.60 5.00 9,200 1,500,000 0 0 31 60 46 47 33 .. 80 87 85 74 90 86 80 63 97 81 66 46 6 24 41 42 54 .. 1 .. 8 19 20 .. 0 .. 1 3 25.0 ..
3.7 No 3 –0.4 –0.3 0.1 –0.8 –0.3 –0.5 0.0
871 37,975 15.1 5.1 61 49 386 27,476 10 312 475 10,187 0.0 0.0 930 52,315 2 .. 2 ..
LDB Africa 12-2-08.indd 11 12/2/08 12:20:20 PM

12 2008 The Little Data Book on Africa
Burundi Sub-Saharan Country Africa
Population (millions)Population growth (%)GNI per capita ($)
Economic density (current $/sq km)GDP ($ millions)GDP growth (%)GDP per capita (2000 $)GDP per capita growth (%)GDP deflator, index (2000=100; US$ series)CPI (% change)Value added, agriculture (% of GDP)Value added, industry (% of GDP)Value added, services and etc (% of GDP)Current account balance (% of GDP)Fiscal balance (cash surplus or deficit, % of GDP)Central government revenue (% of GDP)Total external debt (% of GDP)
DriversofgrowthGross domestic savings (% of GDP)Gross fixed capital formation (% of GDP)Private sector capital formation (% of GDP)Gross primary school enrollment, total (% of relevant age group)Gross secondary school enrollment, total (% of relevant age group)Gross tertiary school enrollment, total (% of relevant age group)Public current education expenditure, primary (% of total current education expenditure)Starting a business, procedures (number)Starting a business, time (days)Starting a business, cost (% of income per capita)Registering property, time (days)Enforcing contracts, time (days)Protecting investors, disclosure Index (0=less disclosure to 10=more disclosure)Paying taxes, time (hours)Paying taxes, total tax rate (% profit)Average time to clear direct exports through customs (days)Average time to clear imports from customs (days)Rigidity of employment index (0 least rigid to 100 most rigid)Delay in obtaining an electrical connection (days)Electric power outages in a typical month (number)Access to electricity (% of total population)Ratio of paved to total roads (%)Road density (road km/1,000 km2 of land area)Real interest rate (%)Domestic credit to private sector (% of GDP)Corruption (% of firms identifying this as a major constraint)Believing the court system is fair, impartial and uncorrupted (% of firms this as a major contraint)Crime, theft and disorder (% of firms identifying this as major constraint)Tax rates (% of firms identifying this as major constraint)Access to finance (% of firms identifying this as a major constraint)Electricity (% of firms identifying this as a major constraint)Labor regulations (% of firms identifying this as a major constraint)Labor skill level (% of firms identifying this as a major constraint)Irrigated land (% of cropland)Fertilizer consumption (100 grams per hectare of arable land)Agricultural machinery tractors per 100 hectares of arable landCereal crop yield (kg per hectare)Exports of goods and services (% of GDP)
8.2 782.5 4.0 2.5 100 861
35,172 31,518 903 744,731 5.1 5.8 102 580 1.1 3.2 109 164 2.8 31.6 14.5 18.2 34.0 41.0 42.6 –14.9 2.0 .. .. 35.5 23.9 156.2 23.4
–20.2 29.0 16.7 18.9 1.7 12.5 103.2 93.2 14.3 28.6 2.2 6.1 98 .. 11 11 43 56 251.0 160.3 94 103 558 673 4 5 140 320 279 67 .. 8 11 8 30 42 24 44 12 7 .. .. 10 12 480 .. 14 25 65 20 41 20 36 51 72 4 12 1.5 3.5 35 106 2 13 1,330 1,262 11 37
LDB Africa 12-2-08.indd 12 12/2/08 12:20:20 PM

The Little Data Book on Africa 2008 13
Imports of goods and services (% of GDP)Terms of trade index (2000=100)Real effective exchange rate (2000=100)Export diversification index (%)Foreign direct investment, net inflows ($ millions)Workers remittances received ($ millions)
ParticipatingingrowthRural population (% of total population)Age dependency ratio (dependents to working-age population)Population 0–24 (% of total population)Life expectancy at birth (years)Poverty headcount ratio at national poverty line (% of population)Gini indexInfant mortality rate (per 1,000 live births)Under-five mortality rate (per 1,000)Births attended by skilled health staff (% of total)Maternal mortality ratio, modeled estimate (per 100,000 live births)Malnutrition prevalence, height for age (% of children under 5)Child immunization, measles (% of ages 12–23 months)Children sleeping under insecticide-treated bednets (% under age 5)HIV prevalence rate (% of ages 15–49)Deaths of adults and children due to AIDSPhysicians per 1,000 peoplePrimary school completion rate, total (% of relevant age group)Student-teacher ratio, primary schoolYouth literacy, total (% of ages 15–24)Ratio of girls to boys in primary and secondary schoolLabor force participation rate, total (% of ages 15 and over)Labor force participation rate, male (% of ages 15 and over)Labor force participation rate, female (% of ages 15 and over)Improved water source (% of urban population with sustainable access) Improved water source (% of rural population with sustainable access) Improved sanitation (% of urban population with sustainable access) Improved sanitation (% of rural population with sustainable access) Access to electricity (% of urban population)Access to electricity (% of rural population)Telephone subscribers, total (per 100 people)Households with own telephone (% of urban households)Households with own telephone (% of rural households)Internet users (per 100 people)Rural residents within 2 km of an all-season road (%)
CapablestatesCPIA overall rating (IDA resource allocation index, 1 low to 6 high)Country has publicly endorsed the EITI principles Corruption Perceptions Index score (0 corrupt to 10 clean)Control of corruption (–2.5 worse to 2.5 better)Voice and accountability (–2.5 worse to 2.5 better)Political stability (–2.5 worse to 2.5 better)Government effectiveness (–2.5 worse to 2.5 better)Regulatory law (–2.5 worse to 2.5 better)Rule of law (–2.5 worse to 2.5 better)Combined polity score
PartnershipNet aid ($ millions)Net aid (% of GDP)Net aid per capita from all donors ($)Net aid from DAC donors ($ millions)Net aid from non-DAC bilateral donors ($ millions)Net aid from multilateral donors ($ millions)Net aid (% of central government expenditure)Debt relief committed under HIPC Initiative ($ millions)Country with an operational national development strategy (A-F)Existence of a mutual accountability review (A-F)
Sub-Saharan Country Africa
48 35 .. .. 73 112 3 .. 0 7,671 0 3,982
90 65 1 1 66 .. 49 50 .. .. .. .. 109 94 181 157 34 .. 1,100 902 63 .. 75 72 8 .. 2.00 5.00 11,000 1,500,000 0 0 36 60 54 47 73 .. 89 87 93 74 94 86 93 63 84 81 70 46 41 24 44 42 .. .. .. .. 3 19 .. .. .. .. 1 3 .. ..
3.0 No 3 –1.1 –0.8 –1.4 –1.3 –1.2 –1.2 6.0
415 37,975 45.9 5.1 51 49 222 27,476 0 312 192 10,187 0.0 0.0 1,472 52,315 3 .. 1 ..
LDB Africa 12-2-08.indd 13 12/2/08 12:20:20 PM
14 2008 The Little Data Book on Africa
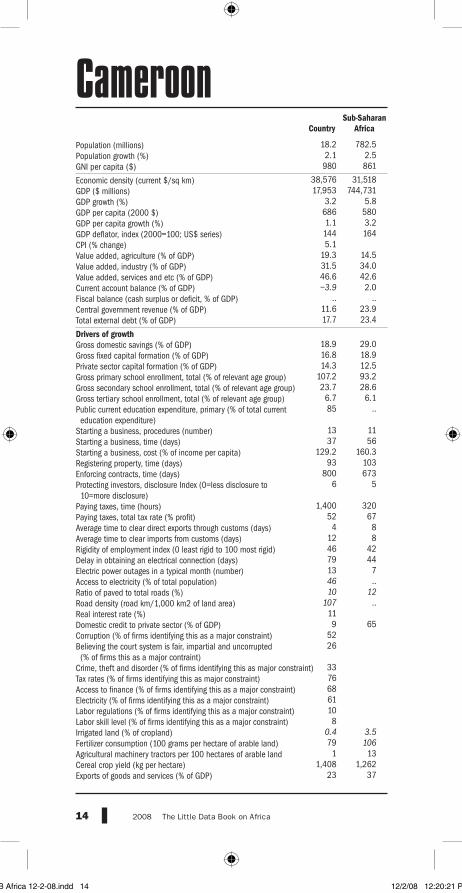
Cameroon Sub-Saharan Country Africa
Population (millions)Population growth (%)GNI per capita ($)
Economic density (current $/sq km)GDP ($ millions)GDP growth (%)GDP per capita (2000 $)GDP per capita growth (%)GDP deflator, index (2000=100; US$ series)CPI (% change)Value added, agriculture (% of GDP)Value added, industry (% of GDP)Value added, services and etc (% of GDP)Current account balance (% of GDP)Fiscal balance (cash surplus or deficit, % of GDP)Central government revenue (% of GDP)Total external debt (% of GDP)
DriversofgrowthGross domestic savings (% of GDP)Gross fixed capital formation (% of GDP)Private sector capital formation (% of GDP)Gross primary school enrollment, total (% of relevant age group)Gross secondary school enrollment, total (% of relevant age group)Gross tertiary school enrollment, total (% of relevant age group)Public current education expenditure, primary (% of total current education expenditure)Starting a business, procedures (number)Starting a business, time (days)Starting a business, cost (% of income per capita)Registering property, time (days)Enforcing contracts, time (days)Protecting investors, disclosure Index (0=less disclosure to 10=more disclosure)Paying taxes, time (hours)Paying taxes, total tax rate (% profit)Average time to clear direct exports through customs (days)Average time to clear imports from customs (days)Rigidity of employment index (0 least rigid to 100 most rigid)Delay in obtaining an electrical connection (days)Electric power outages in a typical month (number)Access to electricity (% of total population)Ratio of paved to total roads (%)Road density (road km/1,000 km2 of land area)Real interest rate (%)Domestic credit to private sector (% of GDP)Corruption (% of firms identifying this as a major constraint)Believing the court system is fair, impartial and uncorrupted (% of firms this as a major contraint)Crime, theft and disorder (% of firms identifying this as major constraint)Tax rates (% of firms identifying this as major constraint)Access to finance (% of firms identifying this as a major constraint)Electricity (% of firms identifying this as a major constraint)Labor regulations (% of firms identifying this as a major constraint)Labor skill level (% of firms identifying this as a major constraint)Irrigated land (% of cropland)Fertilizer consumption (100 grams per hectare of arable land)Agricultural machinery tractors per 100 hectares of arable landCereal crop yield (kg per hectare)Exports of goods and services (% of GDP)
18.2 782.5 2.1 2.5 980 861
38,576 31,518 17,953 744,731 3.2 5.8 686 580 1.1 3.2 144 164 5.1 19.3 14.5 31.5 34.0 46.6 42.6 –3.9 2.0 .. .. 11.6 23.9 17.7 23.4
18.9 29.0 16.8 18.9 14.3 12.5 107.2 93.2 23.7 28.6 6.7 6.1 85 .. 13 11 37 56 129.2 160.3 93 103 800 673 6 5 1,400 320 52 67 4 8 12 8 46 42 79 44 13 7 46 .. 10 12 107 .. 11 9 65 52 26 33 76 68 61 10 8 0.4 3.5 79 106 1 13 1,408 1,262 23 37
LDB Africa 12-2-08.indd 14 12/2/08 12:20:21 PM

The Little Data Book on Africa 2008 15
Imports of goods and services (% of GDP)Terms of trade index (2000=100)Real effective exchange rate (2000=100)Export diversification index (%)Foreign direct investment, net inflows ($ millions)Workers remittances received ($ millions)
ParticipatingingrowthRural population (% of total population)Age dependency ratio (dependents to working-age population)Population 0–24 (% of total population)Life expectancy at birth (years)Poverty headcount ratio at national poverty line (% of population)Gini indexInfant mortality rate (per 1,000 live births)Under-five mortality rate (per 1,000)Births attended by skilled health staff (% of total)Maternal mortality ratio, modeled estimate (per 100,000 live births)Malnutrition prevalence, height for age (% of children under 5)Child immunization, measles (% of ages 12–23 months)Children sleeping under insecticide-treated bednets (% under age 5)HIV prevalence rate (% of ages 15–49)Deaths of adults and children due to AIDSPhysicians per 1,000 peoplePrimary school completion rate, total (% of relevant age group)Student-teacher ratio, primary schoolYouth literacy, total (% of ages 15–24)Ratio of girls to boys in primary and secondary schoolLabor force participation rate, total (% of ages 15 and over)Labor force participation rate, male (% of ages 15 and over)Labor force participation rate, female (% of ages 15 and over)Improved water source (% of urban population with sustainable access) Improved water source (% of rural population with sustainable access) Improved sanitation (% of urban population with sustainable access) Improved sanitation (% of rural population with sustainable access) Access to electricity (% of urban population)Access to electricity (% of rural population)Telephone subscribers, total (per 100 people)Households with own telephone (% of urban households)Households with own telephone (% of rural households)Internet users (per 100 people)Rural residents within 2 km of an all-season road (%)
CapablestatesCPIA overall rating (IDA resource allocation index, 1 low to 6 high)Country has publicly endorsed the EITI principles Corruption Perceptions Index score (0 corrupt to 10 clean)Control of corruption (–2.5 worse to 2.5 better)Voice and accountability (–2.5 worse to 2.5 better)Political stability (–2.5 worse to 2.5 better)Government effectiveness (–2.5 worse to 2.5 better)Regulatory law (–2.5 worse to 2.5 better)Rule of law (–2.5 worse to 2.5 better)Combined polity score
PartnershipNet aid ($ millions)Net aid (% of GDP)Net aid per capita from all donors ($)Net aid from DAC donors ($ millions)Net aid from non-DAC bilateral donors ($ millions)Net aid from multilateral donors ($ millions)Net aid (% of central government expenditure)Debt relief committed under HIPC Initiative ($ millions)Country with an operational national development strategy (A-F)Existence of a mutual accountability review (A-F)
Sub-Saharan Country Africa
21 35 108 .. 113 112 3 .. 21 7,671 0 3,982
45 65 1 1 63 .. 50 50 40 .. 45 .. 87 94 149 157 63 .. 1,000 902 35 .. 73 72 1 .. 5.10 5.00 39,000 1,500,000 0 0 52 60 45 47 .. .. 83 87 68 74 81 86 54 63 88 81 47 46 42 24 58 42 77 .. 16 .. 18 19 5 .. 0 .. 2 3 20.0 ..
3.2 Yes 2 –0.9 –0.9 –0.4 –0.9 –0.7 –1.1 –4.0
1,684 37,975 9.4 5.1 93 49 1,505 27,476 6 312 173 10,187 0.0 0.0 4,917 52,315 3 .. 2 ..
LDB Africa 12-2-08.indd 15 12/2/08 12:20:21 PM

16 2008 The Little Data Book on Africa
Cape Verde Sub-Saharan Country Africa
Population (millions)Population growth (%)GNI per capita ($)
Economic density (current $/sq km)GDP ($ millions)GDP growth (%)GDP per capita (2000 $)GDP per capita growth (%)GDP deflator, index (2000=100; US$ series)CPI (% change)Value added, agriculture (% of GDP)Value added, industry (% of GDP)Value added, services and etc (% of GDP)Current account balance (% of GDP)Fiscal balance (cash surplus or deficit, % of GDP)Central government revenue (% of GDP)Total external debt (% of GDP)
DriversofgrowthGross domestic savings (% of GDP)Gross fixed capital formation (% of GDP)Private sector capital formation (% of GDP)Gross primary school enrollment, total (% of relevant age group)Gross secondary school enrollment, total (% of relevant age group)Gross tertiary school enrollment, total (% of relevant age group)Public current education expenditure, primary (% of total current education expenditure)Starting a business, procedures (number)Starting a business, time (days)Starting a business, cost (% of income per capita)Registering property, time (days)Enforcing contracts, time (days)Protecting investors, disclosure Index (0=less disclosure to 10=more disclosure)Paying taxes, time (hours)Paying taxes, total tax rate (% profit)Average time to clear direct exports through customs (days)Average time to clear imports from customs (days)Rigidity of employment index (0 least rigid to 100 most rigid)Delay in obtaining an electrical connection (days)Electric power outages in a typical month (number)Access to electricity (% of total population)Ratio of paved to total roads (%)Road density (road km/1,000 km2 of land area)Real interest rate (%)Domestic credit to private sector (% of GDP)Corruption (% of firms identifying this as a major constraint)Believing the court system is fair, impartial and uncorrupted (% of firms this as a major contraint)Crime, theft and disorder (% of firms identifying this as major constraint)Tax rates (% of firms identifying this as major constraint)Access to finance (% of firms identifying this as a major constraint)Electricity (% of firms identifying this as a major constraint)Labor regulations (% of firms identifying this as a major constraint)Labor skill level (% of firms identifying this as a major constraint)Irrigated land (% of cropland)Fertilizer consumption (100 grams per hectare of arable land)Agricultural machinery tractors per 100 hectares of arable landCereal crop yield (kg per hectare)Exports of goods and services (% of GDP)
0.5 782.5 2.3 2.5 2,190 861
293,210 31,518 1,182 744,731 10.7 5.8 1,383 580 8.2 3.2 165 164 5.4 8.8 14.5 16.3 34.0 74.9 42.6 –3.4 2.0 .. .. 24.2 23.9 50.9 23.4
4.7 29.0 38.1 18.9 29.4 12.5 105.7 93.2 80.2 28.6 7.9 6.1 85 .. 12 11 52 56 40.1 160.3 83 103 425 673 1 5 100 320 54 67 .. 8 11 8 44 42 8 44 13 7 .. .. 69 12 335 .. 4 48 65 16 62 28 50 39 65 15 16 6.1 3.5 48 106 12 13 355 1,262 19 37
LDB Africa 12-2-08.indd 16 12/2/08 12:20:21 PM

The Little Data Book on Africa 2008 17
Imports of goods and services (% of GDP)Terms of trade index (2000=100)Real effective exchange rate (2000=100)Export diversification index (%)Foreign direct investment, net inflows ($ millions)Workers remittances received ($ millions)
ParticipatingingrowthRural population (% of total population)Age dependency ratio (dependents to working-age population)Population 0–24 (% of total population)Life expectancy at birth (years)Poverty headcount ratio at national poverty line (% of population)Gini indexInfant mortality rate (per 1,000 live births)Under-five mortality rate (per 1,000)Births attended by skilled health staff (% of total)Maternal mortality ratio, modeled estimate (per 100,000 live births)Malnutrition prevalence, height for age (% of children under 5)Child immunization, measles (% of ages 12–23 months)Children sleeping under insecticide-treated bednets (% under age 5)HIV prevalence rate (% of ages 15–49)Deaths of adults and children due to AIDSPhysicians per 1,000 peoplePrimary school completion rate, total (% of relevant age group)Student-teacher ratio, primary schoolYouth literacy, total (% of ages 15–24)Ratio of girls to boys in primary and secondary schoolLabor force participation rate, total (% of ages 15 and over)Labor force participation rate, male (% of ages 15 and over)Labor force participation rate, female (% of ages 15 and over)Improved water source (% of urban population with sustainable access) Improved water source (% of rural population with sustainable access) Improved sanitation (% of urban population with sustainable access) Improved sanitation (% of rural population with sustainable access) Access to electricity (% of urban population)Access to electricity (% of rural population)Telephone subscribers, total (per 100 people)Households with own telephone (% of urban households)Households with own telephone (% of rural households)Internet users (per 100 people)Rural residents within 2 km of an all-season road (%)
CapablestatesCPIA overall rating (IDA resource allocation index, 1 low to 6 high)Country has publicly endorsed the EITI principles Corruption Perceptions Index score (0 corrupt to 10 clean)Control of corruption (–2.5 worse to 2.5 better)Voice and accountability (–2.5 worse to 2.5 better)Political stability (–2.5 worse to 2.5 better)Government effectiveness (–2.5 worse to 2.5 better)Regulatory law (–2.5 worse to 2.5 better)Rule of law (–2.5 worse to 2.5 better)Combined polity score
PartnershipNet aid ($ millions)Net aid (% of GDP)Net aid per capita from all donors ($)Net aid from DAC donors ($ millions)Net aid from non-DAC bilateral donors ($ millions)Net aid from multilateral donors ($ millions)Net aid (% of central government expenditure)Debt relief committed under HIPC Initiative ($ millions)Country with an operational national development strategy (A-F)Existence of a mutual accountability review (A-F)
Sub-Saharan Country Africa
53 35 59 .. .. 112 9 .. 123 7,671 136 3,982
42 65 1 1 62 .. 71 50 .. .. 51 .. 25 94 34 157 .. .. 210 902 .. .. 65 72 .. .. .. 5.00 .. 1,500,000 0 0 92 60 25 47 96 .. 103 87 56 74 78 86 37 63 86 81 73 46 19 24 61 42 .. .. .. .. 35 19 .. .. .. .. 6 3 .. ..
4.2 No 5 0.8 0.9 1.0 0.4 –0.2 0.6 ..
138 37,975 11.7 5.1 267 49 99 27,476 2 312 38 10,187 0.0 0.0 .. 52,315 3 .. 2 ..
LDB Africa 12-2-08.indd 17 12/2/08 12:20:21 PM
18 2008 The Little Data Book on Africa
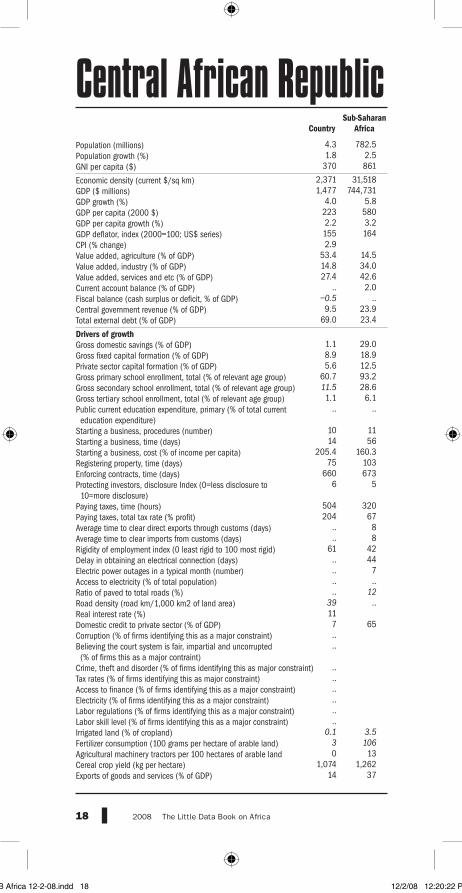
Central African Republic Sub-Saharan Country Africa
Population (millions)Population growth (%)GNI per capita ($)
Economic density (current $/sq km)GDP ($ millions)GDP growth (%)GDP per capita (2000 $)GDP per capita growth (%)GDP deflator, index (2000=100; US$ series)CPI (% change)Value added, agriculture (% of GDP)Value added, industry (% of GDP)Value added, services and etc (% of GDP)Current account balance (% of GDP)Fiscal balance (cash surplus or deficit, % of GDP)Central government revenue (% of GDP)Total external debt (% of GDP)
DriversofgrowthGross domestic savings (% of GDP)Gross fixed capital formation (% of GDP)Private sector capital formation (% of GDP)Gross primary school enrollment, total (% of relevant age group)Gross secondary school enrollment, total (% of relevant age group)Gross tertiary school enrollment, total (% of relevant age group)Public current education expenditure, primary (% of total current education expenditure)Starting a business, procedures (number)Starting a business, time (days)Starting a business, cost (% of income per capita)Registering property, time (days)Enforcing contracts, time (days)Protecting investors, disclosure Index (0=less disclosure to 10=more disclosure)Paying taxes, time (hours)Paying taxes, total tax rate (% profit)Average time to clear direct exports through customs (days)Average time to clear imports from customs (days)Rigidity of employment index (0 least rigid to 100 most rigid)Delay in obtaining an electrical connection (days)Electric power outages in a typical month (number)Access to electricity (% of total population)Ratio of paved to total roads (%)Road density (road km/1,000 km2 of land area)Real interest rate (%)Domestic credit to private sector (% of GDP)Corruption (% of firms identifying this as a major constraint)Believing the court system is fair, impartial and uncorrupted (% of firms this as a major contraint)Crime, theft and disorder (% of firms identifying this as major constraint)Tax rates (% of firms identifying this as major constraint)Access to finance (% of firms identifying this as a major constraint)Electricity (% of firms identifying this as a major constraint)Labor regulations (% of firms identifying this as a major constraint)Labor skill level (% of firms identifying this as a major constraint)Irrigated land (% of cropland)Fertilizer consumption (100 grams per hectare of arable land)Agricultural machinery tractors per 100 hectares of arable landCereal crop yield (kg per hectare)Exports of goods and services (% of GDP)
4.3 782.5 1.8 2.5 370 861
2,371 31,518 1,477 744,731 4.0 5.8 223 580 2.2 3.2 155 164 2.9 53.4 14.5 14.8 34.0 27.4 42.6 .. 2.0 –0.5 .. 9.5 23.9 69.0 23.4
1.1 29.0 8.9 18.9 5.6 12.5 60.7 93.2 11.5 28.6 1.1 6.1 .. .. 10 11 14 56 205.4 160.3 75 103 660 673 6 5 504 320 204 67 .. 8 .. 8 61 42 .. 44 .. 7 .. .. .. 12 39 .. 11 7 65 .. .. .. .. .. .. .. .. 0.1 3.5 3 106 0 13 1,074 1,262 14 37
LDB Africa 12-2-08.indd 18 12/2/08 12:20:22 PM

The Little Data Book on Africa 2008 19
Imports of goods and services (% of GDP)Terms of trade index (2000=100)Real effective exchange rate (2000=100)Export diversification index (%)Foreign direct investment, net inflows ($ millions)Workers remittances received ($ millions)
ParticipatingingrowthRural population (% of total population)Age dependency ratio (dependents to working-age population)Population 0–24 (% of total population)Life expectancy at birth (years)Poverty headcount ratio at national poverty line (% of population)Gini indexInfant mortality rate (per 1,000 live births)Under-five mortality rate (per 1,000)Births attended by skilled health staff (% of total)Maternal mortality ratio, modeled estimate (per 100,000 live births)Malnutrition prevalence, height for age (% of children under 5)Child immunization, measles (% of ages 12–23 months)Children sleeping under insecticide-treated bednets (% under age 5)HIV prevalence rate (% of ages 15–49)Deaths of adults and children due to AIDSPhysicians per 1,000 peoplePrimary school completion rate, total (% of relevant age group)Student-teacher ratio, primary schoolYouth literacy, total (% of ages 15–24)Ratio of girls to boys in primary and secondary schoolLabor force participation rate, total (% of ages 15 and over)Labor force participation rate, male (% of ages 15 and over)Labor force participation rate, female (% of ages 15 and over)Improved water source (% of urban population with sustainable access) Improved water source (% of rural population with sustainable access) Improved sanitation (% of urban population with sustainable access) Improved sanitation (% of rural population with sustainable access) Access to electricity (% of urban population)Access to electricity (% of rural population)Telephone subscribers, total (per 100 people)Households with own telephone (% of urban households)Households with own telephone (% of rural households)Internet users (per 100 people)Rural residents within 2 km of an all-season road (%)
CapablestatesCPIA overall rating (IDA resource allocation index, 1 low to 6 high)Country has publicly endorsed the EITI principles Corruption Perceptions Index score (0 corrupt to 10 clean)Control of corruption (–2.5 worse to 2.5 better)Voice and accountability (–2.5 worse to 2.5 better)Political stability (–2.5 worse to 2.5 better)Government effectiveness (–2.5 worse to 2.5 better)Regulatory law (–2.5 worse to 2.5 better)Rule of law (–2.5 worse to 2.5 better)Combined polity score
PartnershipNet aid ($ millions)Net aid (% of GDP)Net aid per capita from all donors ($)Net aid from DAC donors ($ millions)Net aid from non-DAC bilateral donors ($ millions)Net aid from multilateral donors ($ millions)Net aid (% of central government expenditure)Debt relief committed under HIPC Initiative ($ millions)Country with an operational national development strategy (A-F)Existence of a mutual accountability review (A-F)
Sub-Saharan Country Africa
22 35 72 .. 129 112 4 .. .. 7,671 0 3,982
62 65 1 1 63 .. 44 50 .. .. .. .. 115 94 175 157 53 .. 980 902 45 .. 35 72 2 .. 6.30 5.00 11,000 1,500,000 0 0 24 60 .. 47 59 .. .. 87 80 74 90 86 71 63 90 81 51 46 25 24 40 42 .. .. .. .. 3 19 .. .. .. .. 0 3 .. ..
2.5 No 2 –0.9 –0.9 –1.8 –1.4 –1.2 –1.5 –1.0
134 37,975 9.1 5.1 31 49 65 27,476 0 312 69 10,187 0.0 0.0 .. 52,315 4 .. 2 ..
LDB Africa 12-2-08.indd 19 12/2/08 12:20:22 PM

20 2008 The Little Data Book on Africa
Chad Sub-Saharan Country Africa
Population (millions)Population growth (%)GNI per capita ($)
Economic density (current $/sq km)GDP ($ millions)GDP growth (%)GDP per capita (2000 $)GDP per capita growth (%)GDP deflator, index (2000=100; US$ series)CPI (% change)Value added, agriculture (% of GDP)Value added, industry (% of GDP)Value added, services and etc (% of GDP)Current account balance (% of GDP)Fiscal balance (cash surplus or deficit, % of GDP)Central government revenue (% of GDP)Total external debt (% of GDP)
DriversofgrowthGross domestic savings (% of GDP)Gross fixed capital formation (% of GDP)Private sector capital formation (% of GDP)Gross primary school enrollment, total (% of relevant age group)Gross secondary school enrollment, total (% of relevant age group)Gross tertiary school enrollment, total (% of relevant age group)Public current education expenditure, primary (% of total current education expenditure)Starting a business, procedures (number)Starting a business, time (days)Starting a business, cost (% of income per capita)Registering property, time (days)Enforcing contracts, time (days)Protecting investors, disclosure Index (0=less disclosure to 10=more disclosure)Paying taxes, time (hours)Paying taxes, total tax rate (% profit)Average time to clear direct exports through customs (days)Average time to clear imports from customs (days)Rigidity of employment index (0 least rigid to 100 most rigid)Delay in obtaining an electrical connection (days)Electric power outages in a typical month (number)Access to electricity (% of total population)Ratio of paved to total roads (%)Road density (road km/1,000 km2 of land area)Real interest rate (%)Domestic credit to private sector (% of GDP)Corruption (% of firms identifying this as a major constraint)Believing the court system is fair, impartial and uncorrupted (% of firms this as a major contraint)Crime, theft and disorder (% of firms identifying this as major constraint)Tax rates (% of firms identifying this as major constraint)Access to finance (% of firms identifying this as a major constraint)Electricity (% of firms identifying this as a major constraint)Labor regulations (% of firms identifying this as a major constraint)Labor skill level (% of firms identifying this as a major constraint)Irrigated land (% of cropland)Fertilizer consumption (100 grams per hectare of arable land)Agricultural machinery tractors per 100 hectares of arable landCereal crop yield (kg per hectare)Exports of goods and services (% of GDP)
10.5 782.5 3.2 2.5 440 861
5,003 31,518 6,300 744,731 0.2 5.8 266 580 –2.9 3.2 227 164 8.0 20.9 14.5 55.7 34.0 25.1 42.6 .. 2.0 .. .. 11.1 23.9 28.1 23.4
39.8 29.0 22.3 18.9 13.2 12.5 75.6 93.2 15.2 28.6 1.2 6.1 50 .. 19 11 75 56 188.8 160.3 44 103 743 673 6 5 122 320 64 67 .. 8 .. 8 46 42 .. 44 .. 7 4 .. 1 12 27 .. 9 3 65 .. .. .. .. .. .. .. .. 0.8 3.5 49 106 0 13 750 1,262 61 37
LDB Africa 12-2-08.indd 20 12/2/08 12:20:22 PM

The Little Data Book on Africa 2008 21
Imports of goods and services (% of GDP)Terms of trade index (2000=100)Real effective exchange rate (2000=100)Export diversification index (%)Foreign direct investment, net inflows ($ millions)Workers remittances received ($ millions)
ParticipatingingrowthRural population (% of total population)Age dependency ratio (dependents to working-age population)Population 0–24 (% of total population)Life expectancy at birth (years)Poverty headcount ratio at national poverty line (% of population)Gini indexInfant mortality rate (per 1,000 live births)Under-five mortality rate (per 1,000)Births attended by skilled health staff (% of total)Maternal mortality ratio, modeled estimate (per 100,000 live births)Malnutrition prevalence, height for age (% of children under 5)Child immunization, measles (% of ages 12–23 months)Children sleeping under insecticide-treated bednets (% under age 5)HIV prevalence rate (% of ages 15–49)Deaths of adults and children due to AIDSPhysicians per 1,000 peoplePrimary school completion rate, total (% of relevant age group)Student-teacher ratio, primary schoolYouth literacy, total (% of ages 15–24)Ratio of girls to boys in primary and secondary schoolLabor force participation rate, total (% of ages 15 and over)Labor force participation rate, male (% of ages 15 and over)Labor force participation rate, female (% of ages 15 and over)Improved water source (% of urban population with sustainable access) Improved water source (% of rural population with sustainable access) Improved sanitation (% of urban population with sustainable access) Improved sanitation (% of rural population with sustainable access) Access to electricity (% of urban population)Access to electricity (% of rural population)Telephone subscribers, total (per 100 people)Households with own telephone (% of urban households)Households with own telephone (% of rural households)Internet users (per 100 people)Rural residents within 2 km of an all-season road (%)
CapablestatesCPIA overall rating (IDA resource allocation index, 1 low to 6 high)Country has publicly endorsed the EITI principles Corruption Perceptions Index score (0 corrupt to 10 clean)Control of corruption (–2.5 worse to 2.5 better)Voice and accountability (–2.5 worse to 2.5 better)Political stability (–2.5 worse to 2.5 better)Government effectiveness (–2.5 worse to 2.5 better)Regulatory law (–2.5 worse to 2.5 better)Rule of law (–2.5 worse to 2.5 better)Combined polity score
PartnershipNet aid ($ millions)Net aid (% of GDP)Net aid per capita from all donors ($)Net aid from DAC donors ($ millions)Net aid from non-DAC bilateral donors ($ millions)Net aid from multilateral donors ($ millions)Net aid (% of central government expenditure)Debt relief committed under HIPC Initiative ($ millions)Country with an operational national development strategy (A-F)Existence of a mutual accountability review (A-F)
Sub-Saharan Country Africa
40 35 100 .. 127 112 1 .. .. 7,671 0 3,982
74 65 1 1 66 .. 51 50 .. .. .. .. 124 94 209 157 14 .. 1,500 902 45 .. 23 72 1 .. 3.50 5.00 14,000 1,500,000 0 0 31 60 63 47 38 .. 61 87 72 74 77 86 66 63 71 81 40 46 4 24 23 42 20 .. 0 .. 5 19 4 .. 0 .. 1 3 5.0 ..
2.6 Yes 2 –1.2 –1.4 –2.0 –1.5 –1.2 –1.4 –2.0
284 37,975 4.5 5.1 27 49 153 27,476 3 312 128 10,187 0.0 0.0 260 52,315 3 .. .. ..
LDB Africa 12-2-08.indd 21 12/2/08 12:20:22 PM

22 2008 The Little Data Book on Africa
Comoros Sub-Saharan Country Africa
Population (millions)Population growth (%)GNI per capita ($)
Economic density (current $/sq km)GDP ($ millions)GDP growth (%)GDP per capita (2000 $)GDP per capita growth (%)GDP deflator, index (2000=100; US$ series)CPI (% change)Value added, agriculture (% of GDP)Value added, industry (% of GDP)Value added, services and etc (% of GDP)Current account balance (% of GDP)Fiscal balance (cash surplus or deficit, % of GDP)Central government revenue (% of GDP)Total external debt (% of GDP)
DriversofgrowthGross domestic savings (% of GDP)Gross fixed capital formation (% of GDP)Private sector capital formation (% of GDP)Gross primary school enrollment, total (% of relevant age group)Gross secondary school enrollment, total (% of relevant age group)Gross tertiary school enrollment, total (% of relevant age group)Public current education expenditure, primary (% of total current education expenditure)Starting a business, procedures (number)Starting a business, time (days)Starting a business, cost (% of income per capita)Registering property, time (days)Enforcing contracts, time (days)Protecting investors, disclosure Index (0=less disclosure to 10=more disclosure)Paying taxes, time (hours)Paying taxes, total tax rate (% profit)Average time to clear direct exports through customs (days)Average time to clear imports from customs (days)Rigidity of employment index (0 least rigid to 100 most rigid)Delay in obtaining an electrical connection (days)Electric power outages in a typical month (number)Access to electricity (% of total population)Ratio of paved to total roads (%)Road density (road km/1,000 km2 of land area)Real interest rate (%)Domestic credit to private sector (% of GDP)Corruption (% of firms identifying this as a major constraint)Believing the court system is fair, impartial and uncorrupted (% of firms this as a major contraint)Crime, theft and disorder (% of firms identifying this as major constraint)Tax rates (% of firms identifying this as major constraint)Access to finance (% of firms identifying this as a major constraint)Electricity (% of firms identifying this as a major constraint)Labor regulations (% of firms identifying this as a major constraint)Labor skill level (% of firms identifying this as a major constraint)Irrigated land (% of cropland)Fertilizer consumption (100 grams per hectare of arable land)Agricultural machinery tractors per 100 hectares of arable landCereal crop yield (kg per hectare)Exports of goods and services (% of GDP)
0.6 782.5 2.2 2.5 670 861
216,645 31,518 403 744,731 1.2 5.8 382 580 –0.9 3.2 172 164 .. 45.2 14.5 11.8 34.0 38.0 42.6 .. 2.0 .. .. 13.6 23.9 69.9 23.4
–14.0 29.0 9.8 18.9 4.9 12.5 85.4 93.2 35.1 28.6 2.3 6.1 .. .. 11 11 23 56 188.4 160.3 24 103 506 673 6 5 100 320 49 67 .. 8 .. 8 46 42 .. 44 .. 7 .. .. 77 12 473 .. 8 8 65 .. .. .. .. .. .. .. .. .. 3.5 38 106 1 13 1,338 1,262 12 37
LDB Africa 12-2-08.indd 22 12/2/08 12:20:23 PM

The Little Data Book on Africa 2008 23
Imports of goods and services (% of GDP)Terms of trade index (2000=100)Real effective exchange rate (2000=100)Export diversification index (%)Foreign direct investment, net inflows ($ millions)Workers remittances received ($ millions)
ParticipatingingrowthRural population (% of total population)Age dependency ratio (dependents to working-age population)Population 0–24 (% of total population)Life expectancy at birth (years)Poverty headcount ratio at national poverty line (% of population)Gini indexInfant mortality rate (per 1,000 live births)Under-five mortality rate (per 1,000)Births attended by skilled health staff (% of total)Maternal mortality ratio, modeled estimate (per 100,000 live births)Malnutrition prevalence, height for age (% of children under 5)Child immunization, measles (% of ages 12–23 months)Children sleeping under insecticide-treated bednets (% under age 5)HIV prevalence rate (% of ages 15–49)Deaths of adults and children due to AIDSPhysicians per 1,000 peoplePrimary school completion rate, total (% of relevant age group)Student-teacher ratio, primary schoolYouth literacy, total (% of ages 15–24)Ratio of girls to boys in primary and secondary schoolLabor force participation rate, total (% of ages 15 and over)Labor force participation rate, male (% of ages 15 and over)Labor force participation rate, female (% of ages 15 and over)Improved water source (% of urban population with sustainable access) Improved water source (% of rural population with sustainable access) Improved sanitation (% of urban population with sustainable access) Improved sanitation (% of rural population with sustainable access) Access to electricity (% of urban population)Access to electricity (% of rural population)Telephone subscribers, total (per 100 people)Households with own telephone (% of urban households)Households with own telephone (% of rural households)Internet users (per 100 people)Rural residents within 2 km of an all-season road (%)
CapablestatesCPIA overall rating (IDA resource allocation index, 1 low to 6 high)Country has publicly endorsed the EITI principles Corruption Perceptions Index score (0 corrupt to 10 clean)Control of corruption (–2.5 worse to 2.5 better)Voice and accountability (–2.5 worse to 2.5 better)Political stability (–2.5 worse to 2.5 better)Government effectiveness (–2.5 worse to 2.5 better)Regulatory law (–2.5 worse to 2.5 better)Rule of law (–2.5 worse to 2.5 better)Combined polity score
PartnershipNet aid ($ millions)Net aid (% of GDP)Net aid per capita from all donors ($)Net aid from DAC donors ($ millions)Net aid from non-DAC bilateral donors ($ millions)Net aid from multilateral donors ($ millions)Net aid (% of central government expenditure)Debt relief committed under HIPC Initiative ($ millions)Country with an operational national development strategy (A-F)Existence of a mutual accountability review (A-F)
Sub-Saharan Country Africa
36 35 100 .. .. 112 6 .. .. 7,671 0 3,982
72 65 1 1 62 .. 63 50 .. .. .. .. 51 94 68 157 62 .. 400 902 47 .. 66 72 9 .. 0.10 5.00 100 1,500,000 0 0 50 60 35 47 .. .. 84 87 73 74 87 86 59 63 91 81 81 46 26 24 49 42 .. .. .. .. 9 19 .. .. .. .. 3 3 .. ..
2.4 No 3 –0.7 –0.5 –0.4 –1.8 –1.4 –0.9 9.0
30 37,975 7.5 5.1 50 49 20 27,476 1 312 10 10,187 0.0 0.0 .. 52,315 .. .. .. ..
LDB Africa 12-2-08.indd 23 12/2/08 12:20:23 PM

24 2008 The Little Data Book on Africa
Congo, Rep. Sub-Saharan Country Africa
Population (millions)Population growth (%)GNI per capita ($)
Economic density (current $/sq km)GDP ($ millions)GDP growth (%)GDP per capita (2000 $)GDP per capita growth (%)GDP deflator, index (2000=100; US$ series)CPI (% change)Value added, agriculture (% of GDP)Value added, industry (% of GDP)Value added, services and etc (% of GDP)Current account balance (% of GDP)Fiscal balance (cash surplus or deficit, % of GDP)Central government revenue (% of GDP)Total external debt (% of GDP)
DriversofgrowthGross domestic savings (% of GDP)Gross fixed capital formation (% of GDP)Private sector capital formation (% of GDP)Gross primary school enrollment, total (% of relevant age group)Gross secondary school enrollment, total (% of relevant age group)Gross tertiary school enrollment, total (% of relevant age group)Public current education expenditure, primary (% of total current education expenditure)Starting a business, procedures (number)Starting a business, time (days)Starting a business, cost (% of income per capita)Registering property, time (days)Enforcing contracts, time (days)Protecting investors, disclosure Index (0=less disclosure to 10=more disclosure)Paying taxes, time (hours)Paying taxes, total tax rate (% profit)Average time to clear direct exports through customs (days)Average time to clear imports from customs (days)Rigidity of employment index (0 least rigid to 100 most rigid)Delay in obtaining an electrical connection (days)Electric power outages in a typical month (number)Access to electricity (% of total population)Ratio of paved to total roads (%)Road density (road km/1,000 km2 of land area)Real interest rate (%)Domestic credit to private sector (% of GDP)Corruption (% of firms identifying this as a major constraint)Believing the court system is fair, impartial and uncorrupted (% of firms this as a major contraint)Crime, theft and disorder (% of firms identifying this as major constraint)Tax rates (% of firms identifying this as major constraint)Access to finance (% of firms identifying this as a major constraint)Electricity (% of firms identifying this as a major constraint)Labor regulations (% of firms identifying this as a major constraint)Labor skill level (% of firms identifying this as a major constraint)Irrigated land (% of cropland)Fertilizer consumption (100 grams per hectare of arable land)Agricultural machinery tractors per 100 hectares of arable landCereal crop yield (kg per hectare)Exports of goods and services (% of GDP)
3.7 782.5 2.2 2.5 1,370 861
22,639 31,518 7,731 744,731 6.2 5.8 1,145 580 3.9 3.2 183 164 3.4 4.0 14.5 70.2 34.0 25.8 42.6 14.8 2.0 6.4 .. 44.4 23.9 79.3 23.4
65.7 29.0 22.8 18.9 13.8 12.5 107.6 93.2 42.9 28.6 3.7 6.1 91 .. 10 11 37 56 150.1 160.3 137 103 560 673 6 5 606 320 65 67 .. 8 .. 8 69 42 .. 44 .. 7 35 .. 5 12 51 .. –3 2 65 .. .. .. .. .. .. .. .. 0.4 3.5 94 106 14 13 790 1,262 87 37
LDB Africa 12-2-08.indd 24 12/2/08 12:20:23 PM

The Little Data Book on Africa 2008 25
Imports of goods and services (% of GDP)Terms of trade index (2000=100)Real effective exchange rate (2000=100)Export diversification index (%)Foreign direct investment, net inflows ($ millions)Workers remittances received ($ millions)
ParticipatingingrowthRural population (% of total population)Age dependency ratio (dependents to working-age population)Population 0–24 (% of total population)Life expectancy at birth (years)Poverty headcount ratio at national poverty line (% of population)Gini indexInfant mortality rate (per 1,000 live births)Under-five mortality rate (per 1,000)Births attended by skilled health staff (% of total)Maternal mortality ratio, modeled estimate (per 100,000 live births)Malnutrition prevalence, height for age (% of children under 5)Child immunization, measles (% of ages 12–23 months)Children sleeping under insecticide-treated bednets (% under age 5)HIV prevalence rate (% of ages 15–49)Deaths of adults and children due to AIDSPhysicians per 1,000 peoplePrimary school completion rate, total (% of relevant age group)Student-teacher ratio, primary schoolYouth literacy, total (% of ages 15–24)Ratio of girls to boys in primary and secondary schoolLabor force participation rate, total (% of ages 15 and over)Labor force participation rate, male (% of ages 15 and over)Labor force participation rate, female (% of ages 15 and over)Improved water source (% of urban population with sustainable access) Improved water source (% of rural population with sustainable access) Improved sanitation (% of urban population with sustainable access) Improved sanitation (% of rural population with sustainable access) Access to electricity (% of urban population)Access to electricity (% of rural population)Telephone subscribers, total (per 100 people)Households with own telephone (% of urban households)Households with own telephone (% of rural households)Internet users (per 100 people)Rural residents within 2 km of an all-season road (%)
CapablestatesCPIA overall rating (IDA resource allocation index, 1 low to 6 high)Country has publicly endorsed the EITI principles Corruption Perceptions Index score (0 corrupt to 10 clean)Control of corruption (–2.5 worse to 2.5 better)Voice and accountability (–2.5 worse to 2.5 better)Political stability (–2.5 worse to 2.5 better)Government effectiveness (–2.5 worse to 2.5 better)Regulatory law (–2.5 worse to 2.5 better)Rule of law (–2.5 worse to 2.5 better)Combined polity score
PartnershipNet aid ($ millions)Net aid (% of GDP)Net aid per capita from all donors ($)Net aid from DAC donors ($ millions)Net aid from non-DAC bilateral donors ($ millions)Net aid from multilateral donors ($ millions)Net aid (% of central government expenditure)Debt relief committed under HIPC Initiative ($ millions)Country with an operational national development strategy (A-F)Existence of a mutual accountability review (A-F)
Sub-Saharan Country Africa
44 35 .. .. .. 112 1 .. 724 7,671 0 3,982
39 65 1 1 62 .. 55 50 51 .. .. .. 79 94 126 157 86 .. 740 902 31 .. 66 72 6 .. 3.50 5.00 6,400 1,500,000 0 0 73 60 55 47 97 .. 90 87 72 74 88 86 57 63 95 81 35 46 21 24 19 42 51 .. 16 .. 14 19 2 .. 0 .. 2 3 .. ..
2.7 Yes 2 –1.0 –1.1 –0.8 –1.3 –1.2 –1.3 –4.0
254 37,975 3.3 5.1 69 49 169 27,476 1 312 84 10,187 0.0 0.0 2,881 52,315 .. .. .. ..
LDB Africa 12-2-08.indd 25 12/2/08 12:20:23 PM
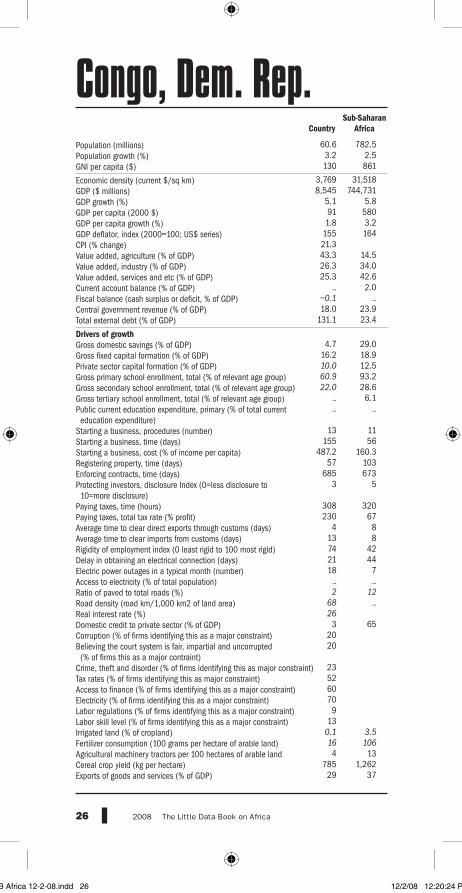
26 2008 The Little Data Book on Africa
Congo, Dem. Rep. Sub-Saharan Country Africa
Population (millions)Population growth (%)GNI per capita ($)
Economic density (current $/sq km)GDP ($ millions)GDP growth (%)GDP per capita (2000 $)GDP per capita growth (%)GDP deflator, index (2000=100; US$ series)CPI (% change)Value added, agriculture (% of GDP)Value added, industry (% of GDP)Value added, services and etc (% of GDP)Current account balance (% of GDP)Fiscal balance (cash surplus or deficit, % of GDP)Central government revenue (% of GDP)Total external debt (% of GDP)
DriversofgrowthGross domestic savings (% of GDP)Gross fixed capital formation (% of GDP)Private sector capital formation (% of GDP)Gross primary school enrollment, total (% of relevant age group)Gross secondary school enrollment, total (% of relevant age group)Gross tertiary school enrollment, total (% of relevant age group)Public current education expenditure, primary (% of total current education expenditure)Starting a business, procedures (number)Starting a business, time (days)Starting a business, cost (% of income per capita)Registering property, time (days)Enforcing contracts, time (days)Protecting investors, disclosure Index (0=less disclosure to 10=more disclosure)Paying taxes, time (hours)Paying taxes, total tax rate (% profit)Average time to clear direct exports through customs (days)Average time to clear imports from customs (days)Rigidity of employment index (0 least rigid to 100 most rigid)Delay in obtaining an electrical connection (days)Electric power outages in a typical month (number)Access to electricity (% of total population)Ratio of paved to total roads (%)Road density (road km/1,000 km2 of land area)Real interest rate (%)Domestic credit to private sector (% of GDP)Corruption (% of firms identifying this as a major constraint)Believing the court system is fair, impartial and uncorrupted (% of firms this as a major contraint)Crime, theft and disorder (% of firms identifying this as major constraint)Tax rates (% of firms identifying this as major constraint)Access to finance (% of firms identifying this as a major constraint)Electricity (% of firms identifying this as a major constraint)Labor regulations (% of firms identifying this as a major constraint)Labor skill level (% of firms identifying this as a major constraint)Irrigated land (% of cropland)Fertilizer consumption (100 grams per hectare of arable land)Agricultural machinery tractors per 100 hectares of arable landCereal crop yield (kg per hectare)Exports of goods and services (% of GDP)
60.6 782.5 3.2 2.5 130 861
3,769 31,518 8,545 744,731 5.1 5.8 91 580 1.8 3.2 155 164 21.3 43.3 14.5 26.3 34.0 25.3 42.6 .. 2.0 –0.1 .. 18.0 23.9 131.1 23.4
4.7 29.0 16.2 18.9 10.0 12.5 60.9 93.2 22.0 28.6 .. 6.1 .. .. 13 11 155 56 487.2 160.3 57 103 685 673 3 5 308 320 230 67 4 8 13 8 74 42 21 44 18 7 .. .. 2 12 68 .. 26 3 65 20 20 23 52 60 70 9 13 0.1 3.5 16 106 4 13 785 1,262 29 37
LDB Africa 12-2-08.indd 26 12/2/08 12:20:24 PM

The Little Data Book on Africa 2008 27
Imports of goods and services (% of GDP)Terms of trade index (2000=100)Real effective exchange rate (2000=100)Export diversification index (%)Foreign direct investment, net inflows ($ millions)Workers remittances received ($ millions)
ParticipatingingrowthRural population (% of total population)Age dependency ratio (dependents to working-age population)Population 0–24 (% of total population)Life expectancy at birth (years)Poverty headcount ratio at national poverty line (% of population)Gini indexInfant mortality rate (per 1,000 live births)Under-five mortality rate (per 1,000)Births attended by skilled health staff (% of total)Maternal mortality ratio, modeled estimate (per 100,000 live births)Malnutrition prevalence, height for age (% of children under 5)Child immunization, measles (% of ages 12–23 months)Children sleeping under insecticide-treated bednets (% under age 5)HIV prevalence rate (% of ages 15–49)Deaths of adults and children due to AIDSPhysicians per 1,000 peoplePrimary school completion rate, total (% of relevant age group)Student-teacher ratio, primary schoolYouth literacy, total (% of ages 15–24)Ratio of girls to boys in primary and secondary schoolLabor force participation rate, total (% of ages 15 and over)Labor force participation rate, male (% of ages 15 and over)Labor force participation rate, female (% of ages 15 and over)Improved water source (% of urban population with sustainable access) Improved water source (% of rural population with sustainable access) Improved sanitation (% of urban population with sustainable access) Improved sanitation (% of rural population with sustainable access) Access to electricity (% of urban population)Access to electricity (% of rural population)Telephone subscribers, total (per 100 people)Households with own telephone (% of urban households)Households with own telephone (% of rural households)Internet users (per 100 people)Rural residents within 2 km of an all-season road (%)
CapablestatesCPIA overall rating (IDA resource allocation index, 1 low to 6 high)Country has publicly endorsed the EITI principles Corruption Perceptions Index score (0 corrupt to 10 clean)Control of corruption (–2.5 worse to 2.5 better)Voice and accountability (–2.5 worse to 2.5 better)Political stability (–2.5 worse to 2.5 better)Government effectiveness (–2.5 worse to 2.5 better)Regulatory law (–2.5 worse to 2.5 better)Rule of law (–2.5 worse to 2.5 better)Combined polity score
PartnershipNet aid ($ millions)Net aid (% of GDP)Net aid per capita from all donors ($)Net aid from DAC donors ($ millions)Net aid from non-DAC bilateral donors ($ millions)Net aid from multilateral donors ($ millions)Net aid (% of central government expenditure)Debt relief committed under HIPC Initiative ($ millions)Country with an operational national development strategy (A-F)Existence of a mutual accountability review (A-F)
Sub-Saharan Country Africa
41 35 140 .. 33 112 6 .. .. 7,671 0 3,982
67 65 1 1 67 .. 46 50 .. .. .. .. 129 94 205 157 61 .. 1,100 902 44 .. 73 72 .. .. 3.20 5.00 90,000 1,500,000 0 0 38 60 34 47 70 .. 73 87 77 74 91 86 63 63 82 81 29 46 25 24 42 42 .. .. .. .. 7 19 .. .. .. .. 0 3 26.0 ..
2.8 Yes 2 –1.3 –1.5 –2.3 –1.7 –1.4 –1.7 5.0
2,056 37,975 24.1 5.1 34 49 1,500 27,476 –1 312 556 10,187 0.0 0.0 10,389 52,315 4 .. 2 ..
LDB Africa 12-2-08.indd 27 12/2/08 12:20:24 PM

28 2008 The Little Data Book on Africa
Côte d’Ivoire Sub-Saharan Country Africa
Population (millions)Population growth (%)GNI per capita ($)
Economic density (current $/sq km)GDP ($ millions)GDP growth (%)GDP per capita (2000 $)GDP per capita growth (%)GDP deflator, index (2000=100; US$ series)CPI (% change)Value added, agriculture (% of GDP)Value added, industry (% of GDP)Value added, services and etc (% of GDP)Current account balance (% of GDP)Fiscal balance (cash surplus or deficit, % of GDP)Central government revenue (% of GDP)Total external debt (% of GDP)
DriversofgrowthGross domestic savings (% of GDP)Gross fixed capital formation (% of GDP)Private sector capital formation (% of GDP)Gross primary school enrollment, total (% of relevant age group)Gross secondary school enrollment, total (% of relevant age group)Gross tertiary school enrollment, total (% of relevant age group)Public current education expenditure, primary (% of total current education expenditure)Starting a business, procedures (number)Starting a business, time (days)Starting a business, cost (% of income per capita)Registering property, time (days)Enforcing contracts, time (days)Protecting investors, disclosure Index (0=less disclosure to 10=more disclosure)Paying taxes, time (hours)Paying taxes, total tax rate (% profit)Average time to clear direct exports through customs (days)Average time to clear imports from customs (days)Rigidity of employment index (0 least rigid to 100 most rigid)Delay in obtaining an electrical connection (days)Electric power outages in a typical month (number)Access to electricity (% of total population)Ratio of paved to total roads (%)Road density (road km/1,000 km2 of land area)Real interest rate (%)Domestic credit to private sector (% of GDP)Corruption (% of firms identifying this as a major constraint)Believing the court system is fair, impartial and uncorrupted (% of firms this as a major contraint)Crime, theft and disorder (% of firms identifying this as major constraint)Tax rates (% of firms identifying this as major constraint)Access to finance (% of firms identifying this as a major constraint)Electricity (% of firms identifying this as a major constraint)Labor regulations (% of firms identifying this as a major constraint)Labor skill level (% of firms identifying this as a major constraint)Irrigated land (% of cropland)Fertilizer consumption (100 grams per hectare of arable land)Agricultural machinery tractors per 100 hectares of arable landCereal crop yield (kg per hectare)Exports of goods and services (% of GDP)
18.9 782.5 1.8 2.5 860 861
54,301 31,518 17,268 744,731 –0.3 5.8 549 580 –2.0 3.2 166 164 2.5 23.1 14.5 26.8 34.0 50.2 42.6 2.8 2.0 –1.4 .. 18.5 23.9 80.2 23.4
20.4 29.0 9.9 18.9 6.8 12.5 70.6 93.2 24.6 28.6 .. 6.1 94 ..
10 11 40 56 135.8 160.3 62 103 770 673 6 5
270 320 45 67 .. 8 .. 8 38 42 .. 44 .. 7 .. .. 8 12 252 .. .. 14 65 .. .. .. .. .. .. .. .. 1.1 3.5 142 106 27 13 1,777 1,262 52 37
LDB Africa 12-2-08.indd 28 12/2/08 12:20:24 PM

The Little Data Book on Africa 2008 29
Imports of goods and services (% of GDP)Terms of trade index (2000=100)Real effective exchange rate (2000=100)Export diversification index (%)Foreign direct investment, net inflows ($ millions)Workers remittances received ($ millions)
ParticipatingingrowthRural population (% of total population)Age dependency ratio (dependents to working-age population)Population 0–24 (% of total population)Life expectancy at birth (years)Poverty headcount ratio at national poverty line (% of population)Gini indexInfant mortality rate (per 1,000 live births)Under-five mortality rate (per 1,000)Births attended by skilled health staff (% of total)Maternal mortality ratio, modeled estimate (per 100,000 live births)Malnutrition prevalence, height for age (% of children under 5)Child immunization, measles (% of ages 12–23 months)Children sleeping under insecticide-treated bednets (% under age 5)HIV prevalence rate (% of ages 15–49)Deaths of adults and children due to AIDSPhysicians per 1,000 peoplePrimary school completion rate, total (% of relevant age group)Student-teacher ratio, primary schoolYouth literacy, total (% of ages 15–24)Ratio of girls to boys in primary and secondary schoolLabor force participation rate, total (% of ages 15 and over)Labor force participation rate, male (% of ages 15 and over)Labor force participation rate, female (% of ages 15 and over)Improved water source (% of urban population with sustainable access) Improved water source (% of rural population with sustainable access) Improved sanitation (% of urban population with sustainable access) Improved sanitation (% of rural population with sustainable access) Access to electricity (% of urban population)Access to electricity (% of rural population)Telephone subscribers, total (per 100 people)Households with own telephone (% of urban households)Households with own telephone (% of rural households)Internet users (per 100 people)Rural residents within 2 km of an all-season road (%)
CapablestatesCPIA overall rating (IDA resource allocation index, 1 low to 6 high)Country has publicly endorsed the EITI principles Corruption Perceptions Index score (0 corrupt to 10 clean)Control of corruption (–2.5 worse to 2.5 better)Voice and accountability (–2.5 worse to 2.5 better)Political stability (–2.5 worse to 2.5 better)Government effectiveness (–2.5 worse to 2.5 better)Regulatory law (–2.5 worse to 2.5 better)Rule of law (–2.5 worse to 2.5 better)Combined polity score
PartnershipNet aid ($ millions)Net aid (% of GDP)Net aid per capita from all donors ($)Net aid from DAC donors ($ millions)Net aid from non-DAC bilateral donors ($ millions)Net aid from multilateral donors ($ millions)Net aid (% of central government expenditure)Debt relief committed under HIPC Initiative ($ millions)Country with an operational national development strategy (A-F)Existence of a mutual accountability review (A-F)
Sub-Saharan Country Africa
42 35 82 .. 116 112 7 .. 319 7,671 2 3,982
53 65 1 1 63 .. 48 50 .. .. 45 .. 90 94 127 157 57 .. 810 902 34 .. 73 72 4 .. 3.90 5.00 38,000 1,500,000 0 0 43 60 46 47 61 .. 68 87 65 74 89 86 40 63 98 81 66 46 12 24 38 42 .. .. .. .. 23 19 .. .. .. .. 2 3 .. ..
2.6 Yes 2 –1.1 –1.3 –2.1 –1.4 –1.0 –1.5 4.0
251 37,975 1.5 5.1 13 49 199 27,476 0 312 52 10,187 0.0 0.0 .. 52,315 5 .. 2 ..
LDB Africa 12-2-08.indd 29 12/2/08 12:20:24 PM

30 2008 The Little Data Book on Africa
Djibouti Sub-Saharan Country Africa
Population (millions)Population growth (%)GNI per capita ($)
Economic density (current $/sq km)GDP ($ millions)GDP growth (%)GDP per capita (2000 $)GDP per capita growth (%)GDP deflator, index (2000=100; US$ series)CPI (% change)Value added, agriculture (% of GDP)Value added, industry (% of GDP)Value added, services and etc (% of GDP)Current account balance (% of GDP)Fiscal balance (cash surplus or deficit, % of GDP)Central government revenue (% of GDP)Total external debt (% of GDP)
DriversofgrowthGross domestic savings (% of GDP)Gross fixed capital formation (% of GDP)Private sector capital formation (% of GDP)Gross primary school enrollment, total (% of relevant age group)Gross secondary school enrollment, total (% of relevant age group)Gross tertiary school enrollment, total (% of relevant age group)Public current education expenditure, primary (% of total current education expenditure)Starting a business, procedures (number)Starting a business, time (days)Starting a business, cost (% of income per capita)Registering property, time (days)Enforcing contracts, time (days)Protecting investors, disclosure Index (0=less disclosure to 10=more disclosure)Paying taxes, time (hours)Paying taxes, total tax rate (% profit)Average time to clear direct exports through customs (days)Average time to clear imports from customs (days)Rigidity of employment index (0 least rigid to 100 most rigid)Delay in obtaining an electrical connection (days)Electric power outages in a typical month (number)Access to electricity (% of total population)Ratio of paved to total roads (%)Road density (road km/1,000 km2 of land area)Real interest rate (%)Domestic credit to private sector (% of GDP)Corruption (% of firms identifying this as a major constraint)Believing the court system is fair, impartial and uncorrupted (% of firms this as a major contraint)Crime, theft and disorder (% of firms identifying this as major constraint)Tax rates (% of firms identifying this as major constraint)Access to finance (% of firms identifying this as a major constraint)Electricity (% of firms identifying this as a major constraint)Labor regulations (% of firms identifying this as a major constraint)Labor skill level (% of firms identifying this as a major constraint)Irrigated land (% of cropland)Fertilizer consumption (100 grams per hectare of arable land)Agricultural machinery tractors per 100 hectares of arable landCereal crop yield (kg per hectare)Exports of goods and services (% of GDP)
0.8 782.5 1.8 2.5 1,060 861
33,170 31,518 769 744,731 4.8 5.8 817 580 3.0 3.2 115 164 .. 3.1 14.5 14.6 34.0 71.4 42.6 –2.2 2.0 .. .. 31.2 23.9 60.3 23.4
12.1 29.0 29.6 18.9 22.0 12.5 44.1 93.2 22.4 28.6 2.4 6.1 93 .. 11 11 37 56 206.6 160.3 40 103 1,225 673 5 5 114 320 39 67 .. 8 .. 8 46 42 .. 44 .. 7 .. .. 45 12 132 .. 8 20 65 .. .. .. .. .. .. .. .. .. 3.5 .. 106 80 13 1,500 1,262 40 37
LDB Africa 12-2-08.indd 30 12/2/08 12:20:25 PM

The Little Data Book on Africa 2008 31
Imports of goods and services (% of GDP)Terms of trade index (2000=100)Real effective exchange rate (2000=100)Export diversification index (%)Foreign direct investment, net inflows ($ millions)Workers remittances received ($ millions)
ParticipatingingrowthRural population (% of total population)Age dependency ratio (dependents to working-age population)Population 0–24 (% of total population)Life expectancy at birth (years)Poverty headcount ratio at national poverty line (% of population)Gini indexInfant mortality rate (per 1,000 live births)Under-five mortality rate (per 1,000)Births attended by skilled health staff (% of total)Maternal mortality ratio, modeled estimate (per 100,000 live births)Malnutrition prevalence, height for age (% of children under 5)Child immunization, measles (% of ages 12–23 months)Children sleeping under insecticide-treated bednets (% under age 5)HIV prevalence rate (% of ages 15–49)Deaths of adults and children due to AIDSPhysicians per 1,000 peoplePrimary school completion rate, total (% of relevant age group)Student-teacher ratio, primary schoolYouth literacy, total (% of ages 15–24)Ratio of girls to boys in primary and secondary schoolLabor force participation rate, total (% of ages 15 and over)Labor force participation rate, male (% of ages 15 and over)Labor force participation rate, female (% of ages 15 and over)Improved water source (% of urban population with sustainable access) Improved water source (% of rural population with sustainable access) Improved sanitation (% of urban population with sustainable access) Improved sanitation (% of rural population with sustainable access) Access to electricity (% of urban population)Access to electricity (% of rural population)Telephone subscribers, total (per 100 people)Households with own telephone (% of urban households)Households with own telephone (% of rural households)Internet users (per 100 people)Rural residents within 2 km of an all-season road (%)
CapablestatesCPIA overall rating (IDA resource allocation index, 1 low to 6 high)Country has publicly endorsed the EITI principles Corruption Perceptions Index score (0 corrupt to 10 clean)Control of corruption (–2.5 worse to 2.5 better)Voice and accountability (–2.5 worse to 2.5 better)Political stability (–2.5 worse to 2.5 better)Government effectiveness (–2.5 worse to 2.5 better)Regulatory law (–2.5 worse to 2.5 better)Rule of law (–2.5 worse to 2.5 better)Combined polity score
PartnershipNet aid ($ millions)Net aid (% of GDP)Net aid per capita from all donors ($)Net aid from DAC donors ($ millions)Net aid from non-DAC bilateral donors ($ millions)Net aid from multilateral donors ($ millions)Net aid (% of central government expenditure)Debt relief committed under HIPC Initiative ($ millions)Country with an operational national development strategy (A-F)Existence of a mutual accountability review (A-F)
Sub-Saharan Country Africa
57 35 100 .. .. 112 23 .. 108 7,671 4 3,982
14 65 1 1 59 .. 54 50 .. .. .. .. 86 94 130 157 93 .. 650 902 39 .. 67 72 1 .. 3.10 5.00 1,100 1,500,000 0 0 35 60 34 47 .. .. 76 87 69 74 84 86 55 63 98 81 54 46 11 24 76 42 .. .. .. .. 7 19 .. .. .. .. 1 3 .. ..
3.1 .. .. –0.5 –1.1 –0.1 –1.0 –0.8 –0.5 2.0
117 37,975 15.2 5.1 143 49 89 27,476 2 312 26 10,187 0.0 0.0 .. 52,315 .. .. .. ..
LDB Africa 12-2-08.indd 31 12/2/08 12:20:25 PM

32 2008 The Little Data Book on Africa
Egypt, Arab Rep. North Country Africa
Population (millions)Population growth (%)GNI per capita ($)
Economic density (current $/sq km)GDP ($ millions)GDP growth (%)GDP per capita (2000 $)GDP per capita growth (%)GDP deflator, index (2000=100; US$ series)CPI (% change)Value added, agriculture (% of GDP)Value added, industry (% of GDP)Value added, services and etc (% of GDP)Current account balance (% of GDP)Fiscal balance (cash surplus or deficit, % of GDP)Central government revenue (% of GDP)Total external debt (% of GDP)
DriversofgrowthGross domestic savings (% of GDP)Gross fixed capital formation (% of GDP)Private sector capital formation (% of GDP)Gross primary school enrollment, total (% of relevant age group)Gross secondary school enrollment, total (% of relevant age group)Gross tertiary school enrollment, total (% of relevant age group)Public current education expenditure, primary (% of total current education expenditure)Starting a business, procedures (number)Starting a business, time (days)Starting a business, cost (% of income per capita)Registering property, time (days)Enforcing contracts, time (days)Protecting investors, disclosure Index (0=less disclosure to 10=more disclosure)Paying taxes, time (hours)Paying taxes, total tax rate (% profit)Average time to clear direct exports through customs (days)Average time to clear imports from customs (days)Rigidity of employment index (0 least rigid to 100 most rigid)Delay in obtaining an electrical connection (days)Electric power outages in a typical month (number)Access to electricity (% of total population)Ratio of paved to total roads (%)Road density (road km/1,000 km2 of land area)Real interest rate (%)Domestic credit to private sector (% of GDP)Corruption (% of firms identifying this as a major constraint)Believing the court system is fair, impartial and uncorrupted (% of firms this as a major contraint)Crime, theft and disorder (% of firms identifying this as major constraint)Tax rates (% of firms identifying this as major constraint)Access to finance (% of firms identifying this as a major constraint)Electricity (% of firms identifying this as a major constraint)Labor regulations (% of firms identifying this as a major constraint)Labor skill level (% of firms identifying this as a major constraint)Irrigated land (% of cropland)Fertilizer consumption (100 grams per hectare of arable land)Agricultural machinery tractors per 100 hectares of arable landCereal crop yield (kg per hectare)Exports of goods and services (% of GDP)
74.2 154.2 1.8 1.6 1,360 2,333
107,975 64,481 107,484 370,017 6.8 5.5 1,724 2,060 4.9 3.9 84 117 7.6 13.2 10.3 36.2 41.9 44.7 40.9 2.5 10.3 –5.8 0.0 37.6 36.2 27.3 19.4
17.1 37.0 18.7 23.5 11.4 14.8 103.5 106.1 87.8 77.2 34.7 26.6 .. .. 7 9 9 14 28.6 15.4 193 83 1,010 705 7 5 711 447 48 57 5 3 10 10 27 47 167 34 .. 4 .. .. 81 68 93 .. 5 55 38 50 .. .. 79 37 27 25 22 100.4 .. 7,331 1,265 325 139 7,499 2,906 30 39
LDB Africa 12-2-08.indd 32 12/2/08 12:20:25 PM

The Little Data Book on Africa 2008 33
Imports of goods and services (% of GDP)Terms of trade index (2000=100)Real effective exchange rate (2000=100)Export diversification index (%)Foreign direct investment, net inflows ($ millions)Workers remittances received ($ millions)
ParticipatingingrowthRural population (% of total population)Age dependency ratio (dependents to working-age population)Population 0–24 (% of total population)Life expectancy at birth (years)Poverty headcount ratio at national poverty line (% of population)Gini indexInfant mortality rate (per 1,000 live births)Under-five mortality rate (per 1,000)Births attended by skilled health staff (% of total)Maternal mortality ratio, modeled estimate (per 100,000 live births)Malnutrition prevalence, height for age (% of children under 5)Child immunization, measles (% of ages 12–23 months)Children sleeping under insecticide-treated bednets (% under age 5)HIV prevalence rate (% of ages 15–49)Deaths of adults and children due to AIDSPhysicians per 1,000 peoplePrimary school completion rate, total (% of relevant age group)Student-teacher ratio, primary schoolYouth literacy, total (% of ages 15–24)Ratio of girls to boys in primary and secondary schoolLabor force participation rate, total (% of ages 15 and over)Labor force participation rate, male (% of ages 15 and over)Labor force participation rate, female (% of ages 15 and over)Improved water source (% of urban population with sustainable access) Improved water source (% of rural population with sustainable access) Improved sanitation (% of urban population with sustainable access) Improved sanitation (% of rural population with sustainable access) Access to electricity (% of urban population)Access to electricity (% of rural population)Telephone subscribers, total (per 100 people)Households with own telephone (% of urban households)Households with own telephone (% of rural households)Internet users (per 100 people)Rural residents within 2 km of an all-season road (%)
CapablestatesCPIA overall rating (IDA resource allocation index, 1 low to 6 high)Country has publicly endorsed the EITI principles Corruption Perceptions Index score (0 corrupt to 10 clean)Control of corruption (–2.5 worse to 2.5 better)Voice and accountability (–2.5 worse to 2.5 better)Political stability (–2.5 worse to 2.5 better)Government effectiveness (–2.5 worse to 2.5 better)Regulatory law (–2.5 worse to 2.5 better)Rule of law (–2.5 worse to 2.5 better)Combined polity score
PartnershipNet aid ($ millions)Net aid (% of GDP)Net aid per capita from all donors ($)Net aid from DAC donors ($ millions)Net aid from non-DAC bilateral donors ($ millions)Net aid from multilateral donors ($ millions)Net aid (% of central government expenditure)Debt relief committed under HIPC Initiative ($ millions)Country with an operational national development strategy (A-F)Existence of a mutual accountability review (A-F)
Notrth Country Africa
32 31 112 .. .. 85 13 .. 9,894 17,080 5,330 12,300
57 47 1 1 54 .. 71 71 17 .. 34 .. 29 30 35 35 74 71 130 159 24 24 98 96 .. .. 0.10 .. 500 .. 0 0 94 .. 26 25 85 .. 95 .. 49 54 77 80 22 28 99 96 98 87 52 60 85 90 .. .. .. .. 39 53 .. .. .. .. 8 10 .. ..
.. .. .. –0.6 –1.2 –0.8 –0.4 –0.3 –0.1 –3.0
873 2,596 0.8 0.7 12 17 537 1,628 50 165 287 803 0.0 0.0 .. .. 6 .. 2 ..
LDB Africa 12-2-08.indd 33 12/2/08 12:20:25 PM

34 2008 The Little Data Book on Africa
Eritrea Sub-Saharan Country Africa
Population (millions)Population growth (%)GNI per capita ($)
Economic density (current $/sq km)GDP ($ millions)GDP growth (%)GDP per capita (2000 $)GDP per capita growth (%)GDP deflator, index (2000=100; US$ series)CPI (% change)Value added, agriculture (% of GDP)Value added, industry (% of GDP)Value added, services and etc (% of GDP)Current account balance (% of GDP)Fiscal balance (cash surplus or deficit, % of GDP)Central government revenue (% of GDP)Total external debt (% of GDP)
DriversofgrowthGross domestic savings (% of GDP)Gross fixed capital formation (% of GDP)Private sector capital formation (% of GDP)Gross primary school enrollment, total (% of relevant age group)Gross secondary school enrollment, total (% of relevant age group)Gross tertiary school enrollment, total (% of relevant age group)Public current education expenditure, primary (% of total current education expenditure)Starting a business, procedures (number)Starting a business, time (days)Starting a business, cost (% of income per capita)Registering property, time (days)Enforcing contracts, time (days)Protecting investors, disclosure Index (0=less disclosure to 10=more disclosure)Paying taxes, time (hours)Paying taxes, total tax rate (% profit)Average time to clear direct exports through customs (days)Average time to clear imports from customs (days)Rigidity of employment index (0 least rigid to 100 most rigid)Delay in obtaining an electrical connection (days)Electric power outages in a typical month (number)Access to electricity (% of total population)Ratio of paved to total roads (%)Road density (road km/1,000 km2 of land area)Real interest rate (%)Domestic credit to private sector (% of GDP)Corruption (% of firms identifying this as a major constraint)Believing the court system is fair, impartial and uncorrupted (% of firms this as a major contraint)Crime, theft and disorder (% of firms identifying this as major constraint)Tax rates (% of firms identifying this as major constraint)Access to finance (% of firms identifying this as a major constraint)Electricity (% of firms identifying this as a major constraint)Labor regulations (% of firms identifying this as a major constraint)Labor skill level (% of firms identifying this as a major constraint)Irrigated land (% of cropland)Fertilizer consumption (100 grams per hectare of arable land)Agricultural machinery tractors per 100 hectares of arable landCereal crop yield (kg per hectare)Exports of goods and services (% of GDP)
4.7 782.5 3.7 2.5 190 861
10,742 31,518 1,085 744,731 –1.0 5.8 160 580 –4.5 3.2 145 164 .. 16.0 14.5 21.1 34.0 54.5 42.6 –16.5 2.0 .. .. 53.1 23.9 73.7 23.4
–23.3 29.0 18.7 18.9 4.2 12.5 62.2 93.2 31.1 28.6 1.0 6.1 73 .. 13 11 84 56 125.8 160.3 101 103 405 673 4 5 216 320 85 67 .. 8 .. 8 20 42 .. 44 .. 7 .. .. 22 12 40 .. .. 29 65 .. .. .. .. .. .. .. .. 3.5 3.5 22 106 7 13 406 1,262 8 37
LDB Africa 12-2-08.indd 34 12/2/08 12:20:26 PM

The Little Data Book on Africa 2008 35
Imports of goods and services (% of GDP)Terms of trade index (2000=100)Real effective exchange rate (2000=100)Export diversification index (%)Foreign direct investment, net inflows ($ millions)Workers remittances received ($ millions)
ParticipatingingrowthRural population (% of total population)Age dependency ratio (dependents to working-age population)Population 0–24 (% of total population)Life expectancy at birth (years)Poverty headcount ratio at national poverty line (% of population)Gini indexInfant mortality rate (per 1,000 live births)Under-five mortality rate (per 1,000)Births attended by skilled health staff (% of total)Maternal mortality ratio, modeled estimate (per 100,000 live births)Malnutrition prevalence, height for age (% of children under 5)Child immunization, measles (% of ages 12–23 months)Children sleeping under insecticide-treated bednets (% under age 5)HIV prevalence rate (% of ages 15–49)Deaths of adults and children due to AIDSPhysicians per 1,000 peoplePrimary school completion rate, total (% of relevant age group)Student-teacher ratio, primary schoolYouth literacy, total (% of ages 15–24)Ratio of girls to boys in primary and secondary schoolLabor force participation rate, total (% of ages 15 and over)Labor force participation rate, male (% of ages 15 and over)Labor force participation rate, female (% of ages 15 and over)Improved water source (% of urban population with sustainable access) Improved water source (% of rural population with sustainable access) Improved sanitation (% of urban population with sustainable access) Improved sanitation (% of rural population with sustainable access) Access to electricity (% of urban population)Access to electricity (% of rural population)Telephone subscribers, total (per 100 people)Households with own telephone (% of urban households)Households with own telephone (% of rural households)Internet users (per 100 people)Rural residents within 2 km of an all-season road (%)
CapablestatesCPIA overall rating (IDA resource allocation index, 1 low to 6 high)Country has publicly endorsed the EITI principles Corruption Perceptions Index score (0 corrupt to 10 clean)Control of corruption (–2.5 worse to 2.5 better)Voice and accountability (–2.5 worse to 2.5 better)Political stability (–2.5 worse to 2.5 better)Government effectiveness (–2.5 worse to 2.5 better)Regulatory law (–2.5 worse to 2.5 better)Rule of law (–2.5 worse to 2.5 better)Combined polity score
PartnershipNet aid ($ millions)Net aid (% of GDP)Net aid per capita from all donors ($)Net aid from DAC donors ($ millions)Net aid from non-DAC bilateral donors ($ millions)Net aid from multilateral donors ($ millions)Net aid (% of central government expenditure)Debt relief committed under HIPC Initiative ($ millions)Country with an operational national development strategy (A-F)Existence of a mutual accountability review (A-F)
Sub-Saharan Country Africa
50 35 86 .. .. 112 17 .. 28 7,671 0 3,982
80 65 1 1 64 .. 57 50 .. .. .. .. 48 94 74 157 28 .. 450 902 44 .. 95 72 4 .. 1.30 5.00 2,600 1,500,000 0 0 49 60 47 47 .. .. 72 87 75 74 91 86 60 63 74 81 57 46 3 24 14 42 .. .. .. .. 2 19 .. .. .. .. 2 3 .. ..
2.4 No 3 –0.6 –2.2 –1.0 –1.3 –2.0 –1.1 –7.0
129 37,975 11.9 5.1 28 49 63 27,476 –2 312 67 10,187 0.0 0.0 .. 52,315 .. .. .. ..
LDB Africa 12-2-08.indd 35 12/2/08 12:20:26 PM

36 2008 The Little Data Book on Africa
Sub-Saharan Country Africa
Population (millions)Population growth (%)GNI per capita ($)
Economic density (current $/sq km)GDP ($ millions)GDP growth (%)GDP per capita (2000 $)GDP per capita growth (%)GDP deflator, index (2000=100; US$ series)CPI (% change)Value added, agriculture (% of GDP)Value added, industry (% of GDP)Value added, services and etc (% of GDP)Current account balance (% of GDP)Fiscal balance (cash surplus or deficit, % of GDP)Central government revenue (% of GDP)Total external debt (% of GDP)
DriversofgrowthGross domestic savings (% of GDP)Gross fixed capital formation (% of GDP)Private sector capital formation (% of GDP)Gross primary school enrollment, total (% of relevant age group)Gross secondary school enrollment, total (% of relevant age group)Gross tertiary school enrollment, total (% of relevant age group)Public current education expenditure, primary (% of total current education expenditure)Starting a business, procedures (number)Starting a business, time (days)Starting a business, cost (% of income per capita)Registering property, time (days)Enforcing contracts, time (days)Protecting investors, disclosure Index (0=less disclosure to 10=more disclosure)Paying taxes, time (hours)Paying taxes, total tax rate (% profit)Average time to clear direct exports through customs (days)Average time to clear imports from customs (days)Rigidity of employment index (0 least rigid to 100 most rigid)Delay in obtaining an electrical connection (days)Electric power outages in a typical month (number)Access to electricity (% of total population)Ratio of paved to total roads (%)Road density (road km/1,000 km2 of land area)Real interest rate (%)Domestic credit to private sector (% of GDP)Corruption (% of firms identifying this as a major constraint)Believing the court system is fair, impartial and uncorrupted (% of firms this as a major contraint)Crime, theft and disorder (% of firms identifying this as major constraint)Tax rates (% of firms identifying this as major constraint)Access to finance (% of firms identifying this as a major constraint)Electricity (% of firms identifying this as a major constraint)Labor regulations (% of firms identifying this as a major constraint)Labor skill level (% of firms identifying this as a major constraint)Irrigated land (% of cropland)Fertilizer consumption (100 grams per hectare of arable land)Agricultural machinery tractors per 100 hectares of arable landCereal crop yield (kg per hectare)Exports of goods and services (% of GDP)
77.2 782.5 2.6 2.5 190 861
15,166 31,518 15,166 744,731 10.9 5.8 161 580 8.0 3.2 122 164 12.3 44.4 14.5 11.7 34.0 36.5 42.6 –11.8 2.0 –7.6 .. 14.8 23.9 15.3 23.4
1.5 29.0 24.2 18.9 7.6 12.5 83.5 93.2 27.4 28.6 2.4 6.1 65 .. 7 11 16 56 41.3 160.3 43 103 690 673 4 5 198 320 31 67 4 8 14 8 34 42 44 44 5 7 12 .. 13 12 39 .. –4 24 65 23 24 12 40 44 21 4 23 2.5 3.5 26 106 2 13 1,589 1,262 14 37
Ethiopia
LDB Africa 12-2-08.indd 36 12/2/08 12:20:26 PM

The Little Data Book on Africa 2008 37
Imports of goods and services (% of GDP)Terms of trade index (2000=100)Real effective exchange rate (2000=100)Export diversification index (%)Foreign direct investment, net inflows ($ millions)Workers remittances received ($ millions)
ParticipatingingrowthRural population (% of total population)Age dependency ratio (dependents to working-age population)Population 0–24 (% of total population)Life expectancy at birth (years)Poverty headcount ratio at national poverty line (% of population)Gini indexInfant mortality rate (per 1,000 live births)Under-five mortality rate (per 1,000)Births attended by skilled health staff (% of total)Maternal mortality ratio, modeled estimate (per 100,000 live births)Malnutrition prevalence, height for age (% of children under 5)Child immunization, measles (% of ages 12–23 months)Children sleeping under insecticide-treated bednets (% under age 5)HIV prevalence rate (% of ages 15–49)Deaths of adults and children due to AIDSPhysicians per 1,000 peoplePrimary school completion rate, total (% of relevant age group)Student-teacher ratio, primary schoolYouth literacy, total (% of ages 15–24)Ratio of girls to boys in primary and secondary schoolLabor force participation rate, total (% of ages 15 and over)Labor force participation rate, male (% of ages 15 and over)Labor force participation rate, female (% of ages 15 and over)Improved water source (% of urban population with sustainable access) Improved water source (% of rural population with sustainable access) Improved sanitation (% of urban population with sustainable access) Improved sanitation (% of rural population with sustainable access) Access to electricity (% of urban population)Access to electricity (% of rural population)Telephone subscribers, total (per 100 people)Households with own telephone (% of urban households)Households with own telephone (% of rural households)Internet users (per 100 people)Rural residents within 2 km of an all-season road (%)
CapablestatesCPIA overall rating (IDA resource allocation index, 1 low to 6 high)Country has publicly endorsed the EITI principles Corruption Perceptions Index score (0 corrupt to 10 clean)Control of corruption (–2.5 worse to 2.5 better)Voice and accountability (–2.5 worse to 2.5 better)Political stability (–2.5 worse to 2.5 better)Government effectiveness (–2.5 worse to 2.5 better)Regulatory law (–2.5 worse to 2.5 better)Rule of law (–2.5 worse to 2.5 better)Combined polity score
PartnershipNet aid ($ millions)Net aid (% of GDP)Net aid per capita from all donors ($)Net aid from DAC donors ($ millions)Net aid from non-DAC bilateral donors ($ millions)Net aid from multilateral donors ($ millions)Net aid (% of central government expenditure)Debt relief committed under HIPC Initiative ($ millions)Country with an operational national development strategy (A-F)Existence of a mutual accountability review (A-F)
Sub-Saharan Country Africa
37 35 79 .. 100 112 5 .. 545 7,671 169 3,982
84 65 1 1 64 .. 52 50 44 .. .. .. 77 94 123 157 6 .. 720 902 51 .. 63 72 2 .. 2.10 5.00 67,000 1,500,000 0 0 43 60 59 47 50 .. 81 87 82 74 91 86 74 63 96 81 31 46 8 24 27 42 86 .. 2 .. 2 19 35 .. 0 .. 0 3 17.0 ..
3.4 No 2 –0.7 –1.2 –1.7 –0.5 –0.9 –0.5 1.0
1,947 37,975 12.8 5.1 25 49 1,024 27,476 25 312 898 10,187 0.0 0.0 3,275 52,315 2 .. 1 ..
LDB Africa 12-2-08.indd 37 12/2/08 12:20:27 PM

38 2008 The Little Data Book on Africa
Sub-Saharan Country Africa
Population (millions)Population growth (%)GNI per capita ($)
Economic density (current $/sq km)GDP ($ millions)GDP growth (%)GDP per capita (2000 $)GDP per capita growth (%)GDP deflator, index (2000=100; US$ series)CPI (% change)Value added, agriculture (% of GDP)Value added, industry (% of GDP)Value added, services and etc (% of GDP)Current account balance (% of GDP)Fiscal balance (cash surplus or deficit, % of GDP)Central government revenue (% of GDP)Total external debt (% of GDP)
DriversofgrowthGross domestic savings (% of GDP)Gross fixed capital formation (% of GDP)Private sector capital formation (% of GDP)Gross primary school enrollment, total (% of relevant age group)Gross secondary school enrollment, total (% of relevant age group)Gross tertiary school enrollment, total (% of relevant age group)Public current education expenditure, primary (% of total current education expenditure)Starting a business, procedures (number)Starting a business, time (days)Starting a business, cost (% of income per capita)Registering property, time (days)Enforcing contracts, time (days)Protecting investors, disclosure Index (0=less disclosure to 10=more disclosure)Paying taxes, time (hours)Paying taxes, total tax rate (% profit)Average time to clear direct exports through customs (days)Average time to clear imports from customs (days)Rigidity of employment index (0 least rigid to 100 most rigid)Delay in obtaining an electrical connection (days)Electric power outages in a typical month (number)Access to electricity (% of total population)Ratio of paved to total roads (%)Road density (road km/1,000 km2 of land area)Real interest rate (%)Domestic credit to private sector (% of GDP)Corruption (% of firms identifying this as a major constraint)Believing the court system is fair, impartial and uncorrupted (% of firms this as a major contraint)Crime, theft and disorder (% of firms identifying this as major constraint)Tax rates (% of firms identifying this as major constraint)Access to finance (% of firms identifying this as a major constraint)Electricity (% of firms identifying this as a major constraint)Labor regulations (% of firms identifying this as a major constraint)Labor skill level (% of firms identifying this as a major constraint)Irrigated land (% of cropland)Fertilizer consumption (100 grams per hectare of arable land)Agricultural machinery tractors per 100 hectares of arable landCereal crop yield (kg per hectare)Exports of goods and services (% of GDP)
Equatorial Guinea 0.5 782.5 2.4 2.5 8,510 861
305,359 31,518 8,565 744,731 –5.6 5.8 7,470 580 –7.8 3.2 231 164 4.2 2.7 14.5 93.6 34.0 2.9 42.6 .. 2.0 .. .. 22.3 23.9 3.2 23.4
86.0 29.0 41.7 18.9 26.6 12.5 122.0 93.2 31.9 28.6 2.7 6.1 90 .. 20 11 136 56 105.1 160.3 23 103 553 673 6 5 296 320 60 67 .. 8 .. 8 66 42 .. 44 .. 7 .. .. .. 12 103 .. –3 3 65 .. .. .. .. .. .. .. .. .. 3.5 .. 106 16 13 .. 1,262 95 37
LDB Africa 12-2-08.indd 38 12/2/08 12:20:27 PM

The Little Data Book on Africa 2008 39
Imports of goods and services (% of GDP)Terms of trade index (2000=100)Real effective exchange rate (2000=100)Export diversification index (%)Foreign direct investment, net inflows ($ millions)Workers remittances received ($ millions)
ParticipatingingrowthRural population (% of total population)Age dependency ratio (dependents to working-age population)Population 0–24 (% of total population)Life expectancy at birth (years)Poverty headcount ratio at national poverty line (% of population)Gini indexInfant mortality rate (per 1,000 live births)Under-five mortality rate (per 1,000)Births attended by skilled health staff (% of total)Maternal mortality ratio, modeled estimate (per 100,000 live births)Malnutrition prevalence, height for age (% of children under 5)Child immunization, measles (% of ages 12–23 months)Children sleeping under insecticide-treated bednets (% under age 5)HIV prevalence rate (% of ages 15–49)Deaths of adults and children due to AIDSPhysicians per 1,000 peoplePrimary school completion rate, total (% of relevant age group)Student-teacher ratio, primary schoolYouth literacy, total (% of ages 15–24)Ratio of girls to boys in primary and secondary schoolLabor force participation rate, total (% of ages 15 and over)Labor force participation rate, male (% of ages 15 and over)Labor force participation rate, female (% of ages 15 and over)Improved water source (% of urban population with sustainable access) Improved water source (% of rural population with sustainable access) Improved sanitation (% of urban population with sustainable access) Improved sanitation (% of rural population with sustainable access) Access to electricity (% of urban population)Access to electricity (% of rural population)Telephone subscribers, total (per 100 people)Households with own telephone (% of urban households)Households with own telephone (% of rural households)Internet users (per 100 people)Rural residents within 2 km of an all-season road (%)
CapablestatesCPIA overall rating (IDA resource allocation index, 1 low to 6 high)Country has publicly endorsed the EITI principles Corruption Perceptions Index score (0 corrupt to 10 clean)Control of corruption (–2.5 worse to 2.5 better)Voice and accountability (–2.5 worse to 2.5 better)Political stability (–2.5 worse to 2.5 better)Government effectiveness (–2.5 worse to 2.5 better)Regulatory law (–2.5 worse to 2.5 better)Rule of law (–2.5 worse to 2.5 better)Combined polity score
PartnershipNet aid ($ millions)Net aid (% of GDP)Net aid per capita from all donors ($)Net aid from DAC donors ($ millions)Net aid from non-DAC bilateral donors ($ millions)Net aid from multilateral donors ($ millions)Net aid (% of central government expenditure)Debt relief committed under HIPC Initiative ($ millions)Country with an operational national development strategy (A-F)Existence of a mutual accountability review (A-F)
Sub-Saharan Country Africa
50 35 168 .. 151 112 1 .. .. 7,671 0 3,982
61 65 1 1 61 .. 51 50 .. .. .. .. 124 94 206 157 65 .. 680 902 43 .. 51 72 1 .. 3.40 5.00 1,000 1,500,000 0 0 58 60 32 47 95 .. 83 87 73 74 94 86 53 63 45 81 42 46 46 24 60 42 .. .. .. .. 22 19 .. .. .. .. 2 3 .. ..
.. Yes 2 –1.4 –1.9 –0.2 –1.4 –1.4 –1.2 –5.0
27 37,975 0.3 5.1 54 49 19 27,476 0 312 8 10,187 0.0 0.0 .. 52,315 .. .. .. ..
LDB Africa 12-2-08.indd 39 12/2/08 12:20:27 PM

40 2008 The Little Data Book on Africa
Sub-Saharan Country Africa
Population (millions)Population growth (%)GNI per capita ($)
Economic density (current $/sq km)GDP ($ millions)GDP growth (%)GDP per capita (2000 $)GDP per capita growth (%)GDP deflator, index (2000=100; US$ series)CPI (% change)Value added, agriculture (% of GDP)Value added, industry (% of GDP)Value added, services and etc (% of GDP)Current account balance (% of GDP)Fiscal balance (cash surplus or deficit, % of GDP)Central government revenue (% of GDP)Total external debt (% of GDP)
DriversofgrowthGross domestic savings (% of GDP)Gross fixed capital formation (% of GDP)Private sector capital formation (% of GDP)Gross primary school enrollment, total (% of relevant age group)Gross secondary school enrollment, total (% of relevant age group)Gross tertiary school enrollment, total (% of relevant age group)Public current education expenditure, primary (% of total current education expenditure)Starting a business, procedures (number)Starting a business, time (days)Starting a business, cost (% of income per capita)Registering property, time (days)Enforcing contracts, time (days)Protecting investors, disclosure Index (0=less disclosure to 10=more disclosure)Paying taxes, time (hours)Paying taxes, total tax rate (% profit)Average time to clear direct exports through customs (days)Average time to clear imports from customs (days)Rigidity of employment index (0 least rigid to 100 most rigid)Delay in obtaining an electrical connection (days)Electric power outages in a typical month (number)Access to electricity (% of total population)Ratio of paved to total roads (%)Road density (road km/1,000 km2 of land area)Real interest rate (%)Domestic credit to private sector (% of GDP)Corruption (% of firms identifying this as a major constraint)Believing the court system is fair, impartial and uncorrupted (% of firms this as a major contraint)Crime, theft and disorder (% of firms identifying this as major constraint)Tax rates (% of firms identifying this as major constraint)Access to finance (% of firms identifying this as a major constraint)Electricity (% of firms identifying this as a major constraint)Labor regulations (% of firms identifying this as a major constraint)Labor skill level (% of firms identifying this as a major constraint)Irrigated land (% of cropland)Fertilizer consumption (100 grams per hectare of arable land)Agricultural machinery tractors per 100 hectares of arable landCereal crop yield (kg per hectare)Exports of goods and services (% of GDP)
1.3 782.5 1.6 2.5 5,360 861
37,047 31,518 9,546 744,731 1.2 5.8 4,263 580 –0.4 3.2 171 164 –1.4 4.9 14.5 61.2 34.0 33.9 42.6 12.9 2.0 .. .. 11.4 23.9 45.6 23.4
64.7 29.0 23.1 18.9 18.3 12.5 152.2 93.2 54.7 28.6 .. 6.1 .. .. 9 11 58 56 25.6 160.3 60 103 1,070 673 6 5 272 320 45 67 .. 8 .. 8 52 42 .. 44 .. 7 75 .. 10 12 36 .. 7 9 65 .. .. .. .. .. .. .. .. 1.4 3.5 27 106 29 13 1,540 1,262 65 37
Gabon
LDB Africa 12-2-08.indd 40 12/2/08 12:20:27 PM

The Little Data Book on Africa 2008 41
Imports of goods and services (% of GDP)Terms of trade index (2000=100)Real effective exchange rate (2000=100)Export diversification index (%)Foreign direct investment, net inflows ($ millions)Workers remittances received ($ millions)
ParticipatingingrowthRural population (% of total population)Age dependency ratio (dependents to working-age population)Population 0–24 (% of total population)Life expectancy at birth (years)Poverty headcount ratio at national poverty line (% of population)Gini indexInfant mortality rate (per 1,000 live births)Under-five mortality rate (per 1,000)Births attended by skilled health staff (% of total)Maternal mortality ratio, modeled estimate (per 100,000 live births)Malnutrition prevalence, height for age (% of children under 5)Child immunization, measles (% of ages 12–23 months)Children sleeping under insecticide-treated bednets (% under age 5)HIV prevalence rate (% of ages 15–49)Deaths of adults and children due to AIDSPhysicians per 1,000 peoplePrimary school completion rate, total (% of relevant age group)Student-teacher ratio, primary schoolYouth literacy, total (% of ages 15–24)Ratio of girls to boys in primary and secondary schoolLabor force participation rate, total (% of ages 15 and over)Labor force participation rate, male (% of ages 15 and over)Labor force participation rate, female (% of ages 15 and over)Improved water source (% of urban population with sustainable access) Improved water source (% of rural population with sustainable access) Improved sanitation (% of urban population with sustainable access) Improved sanitation (% of rural population with sustainable access) Access to electricity (% of urban population)Access to electricity (% of rural population)Telephone subscribers, total (per 100 people)Households with own telephone (% of urban households)Households with own telephone (% of rural households)Internet users (per 100 people)Rural residents within 2 km of an all-season road (%)
CapablestatesCPIA overall rating (IDA resource allocation index, 1 low to 6 high)Country has publicly endorsed the EITI principles Corruption Perceptions Index score (0 corrupt to 10 clean)Control of corruption (–2.5 worse to 2.5 better)Voice and accountability (–2.5 worse to 2.5 better)Political stability (–2.5 worse to 2.5 better)Government effectiveness (–2.5 worse to 2.5 better)Regulatory law (–2.5 worse to 2.5 better)Rule of law (–2.5 worse to 2.5 better)Combined polity score
PartnershipNet aid ($ millions)Net aid (% of GDP)Net aid per capita from all donors ($)Net aid from DAC donors ($ millions)Net aid from non-DAC bilateral donors ($ millions)Net aid from multilateral donors ($ millions)Net aid (% of central government expenditure)Debt relief committed under HIPC Initiative ($ millions)Country with an operational national development strategy (A-F)Existence of a mutual accountability review (A-F)
Sub-Saharan Country Africa
24 35 150 .. 100 112 2 .. 344 7,671 0 3,982
16 65 1 1 56 .. 57 50 .. .. .. .. 60 94 91 157 86 .. 520 902 26 .. 55 72 .. .. 5.90 5.00 2,300 1,500,000 0 0 75 60 36 47 96 .. 96 87 75 74 85 86 64 63 95 81 47 46 30 24 37 42 91 .. 31 .. 71 19 20 .. 2 .. 6 3 .. ..
.. Yes 3 –0.9 –0.8 0.2 –0.7 –0.5 –0.6 –4.0
31 37,975 0.3 5.1 24 49 32 27,476 1 312 –1 10,187 0.0 0.0 .. 52,315 6 .. 2 ..
LDB Africa 12-2-08.indd 41 12/2/08 12:20:28 PM

42 2008 The Little Data Book on Africa
Sub-Saharan Country Africa
Population (millions)Population growth (%)GNI per capita ($)
Economic density (current $/sq km)GDP ($ millions)GDP growth (%)GDP per capita (2000 $)GDP per capita growth (%)GDP deflator, index (2000=100; US$ series)CPI (% change)Value added, agriculture (% of GDP)Value added, industry (% of GDP)Value added, services and etc (% of GDP)Current account balance (% of GDP)Fiscal balance (cash surplus or deficit, % of GDP)Central government revenue (% of GDP)Total external debt (% of GDP)
DriversofgrowthGross domestic savings (% of GDP)Gross fixed capital formation (% of GDP)Private sector capital formation (% of GDP)Gross primary school enrollment, total (% of relevant age group)Gross secondary school enrollment, total (% of relevant age group)Gross tertiary school enrollment, total (% of relevant age group)Public current education expenditure, primary (% of total current education expenditure)Starting a business, procedures (number)Starting a business, time (days)Starting a business, cost (% of income per capita)Registering property, time (days)Enforcing contracts, time (days)Protecting investors, disclosure Index (0=less disclosure to 10=more disclosure)Paying taxes, time (hours)Paying taxes, total tax rate (% profit)Average time to clear direct exports through customs (days)Average time to clear imports from customs (days)Rigidity of employment index (0 least rigid to 100 most rigid)Delay in obtaining an electrical connection (days)Electric power outages in a typical month (number)Access to electricity (% of total population)Ratio of paved to total roads (%)Road density (road km/1,000 km2 of land area)Real interest rate (%)Domestic credit to private sector (% of GDP)Corruption (% of firms identifying this as a major constraint)Believing the court system is fair, impartial and uncorrupted (% of firms this as a major contraint)Crime, theft and disorder (% of firms identifying this as major constraint)Tax rates (% of firms identifying this as major constraint)Access to finance (% of firms identifying this as a major constraint)Electricity (% of firms identifying this as a major constraint)Labor regulations (% of firms identifying this as a major constraint)Labor skill level (% of firms identifying this as a major constraint)Irrigated land (% of cropland)Fertilizer consumption (100 grams per hectare of arable land)Agricultural machinery tractors per 100 hectares of arable landCereal crop yield (kg per hectare)Exports of goods and services (% of GDP)
Gambia, The 1.7 782.5 2.8 2.5 270 861
51,069 31,518 511 744,731 6.5 5.8 326 580 3.5 3.2 94 164 3.2 29.6 14.5 11.9 34.0 49.2 42.6 –12.8 2.0 .. .. 23.0 23.9 142.0 23.4
4.4 29.0 24.3 18.9 14.9 12.5 74.0 93.2 44.9 28.6 1.1 6.1 86 ..
9 11 32 56 279.0 160.3 371 103 434 673 2 5 376 320 292 67 5 8 3 8 27 42 64 44 24 7 .. .. 19 12 374 .. 27 16 65 10 63 12 31 40 78 3 12 0.6 3.5 25 106 3 13 1,223 1,262 45 37
LDB Africa 12-2-08.indd 42 12/2/08 12:20:28 PM

The Little Data Book on Africa 2008 43
Imports of goods and services (% of GDP)Terms of trade index (2000=100)Real effective exchange rate (2000=100)Export diversification index (%)Foreign direct investment, net inflows ($ millions)Workers remittances received ($ millions)
ParticipatingingrowthRural population (% of total population)Age dependency ratio (dependents to working-age population)Population 0–24 (% of total population)Life expectancy at birth (years)Poverty headcount ratio at national poverty line (% of population)Gini indexInfant mortality rate (per 1,000 live births)Under-five mortality rate (per 1,000)Births attended by skilled health staff (% of total)Maternal mortality ratio, modeled estimate (per 100,000 live births)Malnutrition prevalence, height for age (% of children under 5)Child immunization, measles (% of ages 12–23 months)Children sleeping under insecticide-treated bednets (% under age 5)HIV prevalence rate (% of ages 15–49)Deaths of adults and children due to AIDSPhysicians per 1,000 peoplePrimary school completion rate, total (% of relevant age group)Student-teacher ratio, primary schoolYouth literacy, total (% of ages 15–24)Ratio of girls to boys in primary and secondary schoolLabor force participation rate, total (% of ages 15 and over)Labor force participation rate, male (% of ages 15 and over)Labor force participation rate, female (% of ages 15 and over)Improved water source (% of urban population with sustainable access) Improved water source (% of rural population with sustainable access) Improved sanitation (% of urban population with sustainable access) Improved sanitation (% of rural population with sustainable access) Access to electricity (% of urban population)Access to electricity (% of rural population)Telephone subscribers, total (per 100 people)Households with own telephone (% of urban households)Households with own telephone (% of rural households)Internet users (per 100 people)Rural residents within 2 km of an all-season road (%)
CapablestatesCPIA overall rating (IDA resource allocation index, 1 low to 6 high)Country has publicly endorsed the EITI principles Corruption Perceptions Index score (0 corrupt to 10 clean)Control of corruption (–2.5 worse to 2.5 better)Voice and accountability (–2.5 worse to 2.5 better)Political stability (–2.5 worse to 2.5 better)Government effectiveness (–2.5 worse to 2.5 better)Regulatory law (–2.5 worse to 2.5 better)Rule of law (–2.5 worse to 2.5 better)Combined polity score
PartnershipNet aid ($ millions)Net aid (% of GDP)Net aid per capita from all donors ($)Net aid from DAC donors ($ millions)Net aid from non-DAC bilateral donors ($ millions)Net aid from multilateral donors ($ millions)Net aid (% of central government expenditure)Debt relief committed under HIPC Initiative ($ millions)Country with an operational national development strategy (A-F)Existence of a mutual accountability review (A-F)
Sub-Saharan Country Africa
65 35 74 .. 54 112 4 .. 82 7,671 63 3,982
45 65 1 1 59 .. 59 50 61 .. 47 .. 84 94 113 157 57 .. 690 902 24 .. 95 72 15 .. 0.90 5.00 1,300 1,500,000 0 0 63 60 35 47 .. .. 102 87 73 74 87 86 60 63 91 81 81 46 55 24 50 42 .. .. .. .. 27 19 .. .. .. .. 5 3 .. ..
3.2 No 2 –0.8 –1.0 –0.1 –0.7 –0.4 –0.2 –5.0
74 37,975 14.5 5.1 45 49 25 27,476 6 312 43 10,187 0.0 0.0 90 52,315 .. .. .. ..
LDB Africa 12-2-08.indd 43 12/2/08 12:20:28 PM

44 2008 The Little Data Book on Africa
Sub-Saharan Country Africa
Population (millions)Population growth (%)GNI per capita ($)
Economic density (current $/sq km)GDP ($ millions)GDP growth (%)GDP per capita (2000 $)GDP per capita growth (%)GDP deflator, index (2000=100; US$ series)CPI (% change)Value added, agriculture (% of GDP)Value added, industry (% of GDP)Value added, services and etc (% of GDP)Current account balance (% of GDP)Fiscal balance (cash surplus or deficit, % of GDP)Central government revenue (% of GDP)Total external debt (% of GDP)
DriversofgrowthGross domestic savings (% of GDP)Gross fixed capital formation (% of GDP)Private sector capital formation (% of GDP)Gross primary school enrollment, total (% of relevant age group)Gross secondary school enrollment, total (% of relevant age group)Gross tertiary school enrollment, total (% of relevant age group)Public current education expenditure, primary (% of total current education expenditure)Starting a business, procedures (number)Starting a business, time (days)Starting a business, cost (% of income per capita)Registering property, time (days)Enforcing contracts, time (days)Protecting investors, disclosure Index (0=less disclosure to 10=more disclosure)Paying taxes, time (hours)Paying taxes, total tax rate (% profit)Average time to clear direct exports through customs (days)Average time to clear imports from customs (days)Rigidity of employment index (0 least rigid to 100 most rigid)Delay in obtaining an electrical connection (days)Electric power outages in a typical month (number)Access to electricity (% of total population)Ratio of paved to total roads (%)Road density (road km/1,000 km2 of land area)Real interest rate (%)Domestic credit to private sector (% of GDP)Corruption (% of firms identifying this as a major constraint)Believing the court system is fair, impartial and uncorrupted (% of firms this as a major contraint)Crime, theft and disorder (% of firms identifying this as major constraint)Tax rates (% of firms identifying this as major constraint)Access to finance (% of firms identifying this as a major constraint)Electricity (% of firms identifying this as a major constraint)Labor regulations (% of firms identifying this as a major constraint)Labor skill level (% of firms identifying this as a major constraint)Irrigated land (% of cropland)Fertilizer consumption (100 grams per hectare of arable land)Agricultural machinery tractors per 100 hectares of arable landCereal crop yield (kg per hectare)Exports of goods and services (% of GDP)
Ghana 23.0 782.5 2.1 2.5 510 861
55,881 31,518 12,715 744,731 6.4 5.8 294 580 4.2 3.2 188 164 10.9 38.0 14.5 25.8 34.0 36.3 42.6 –8.2 2.0 –2.9 .. 20.9 23.9 25.1 23.4
7.9 29.0 32.9 18.9 18.3 12.5 91.8 93.2 45.9 28.6 4.7 6.1 86 .. 11 11 42 56 41.4 160.3 34 103 487 673 7 5 304 320 33 67 8 8 7 8 37 42 24 44 10 7 44 .. 18 12 253 .. .. 18 65 10 60 11 31 66 86 2 5 0.5 3.5 75 106 9 13 1,334 1,262 40 37
LDB Africa 12-2-08.indd 44 12/2/08 12:20:28 PM

The Little Data Book on Africa 2008 45
Imports of goods and services (% of GDP)Terms of trade index (2000=100)Real effective exchange rate (2000=100)Export diversification index (%)Foreign direct investment, net inflows ($ millions)Workers remittances received ($ millions)
ParticipatingingrowthRural population (% of total population)Age dependency ratio (dependents to working-age population)Population 0–24 (% of total population)Life expectancy at birth (years)Poverty headcount ratio at national poverty line (% of population)Gini indexInfant mortality rate (per 1,000 live births)Under-five mortality rate (per 1,000)Births attended by skilled health staff (% of total)Maternal mortality ratio, modeled estimate (per 100,000 live births)Malnutrition prevalence, height for age (% of children under 5)Child immunization, measles (% of ages 12–23 months)Children sleeping under insecticide-treated bednets (% under age 5)HIV prevalence rate (% of ages 15–49)Deaths of adults and children due to AIDSPhysicians per 1,000 peoplePrimary school completion rate, total (% of relevant age group)Student-teacher ratio, primary schoolYouth literacy, total (% of ages 15–24)Ratio of girls to boys in primary and secondary schoolLabor force participation rate, total (% of ages 15 and over)Labor force participation rate, male (% of ages 15 and over)Labor force participation rate, female (% of ages 15 and over)Improved water source (% of urban population with sustainable access) Improved water source (% of rural population with sustainable access) Improved sanitation (% of urban population with sustainable access) Improved sanitation (% of rural population with sustainable access) Access to electricity (% of urban population)Access to electricity (% of rural population)Telephone subscribers, total (per 100 people)Households with own telephone (% of urban households)Households with own telephone (% of rural households)Internet users (per 100 people)Rural residents within 2 km of an all-season road (%)
CapablestatesCPIA overall rating (IDA resource allocation index, 1 low to 6 high)Country has publicly endorsed the EITI principles Corruption Perceptions Index score (0 corrupt to 10 clean)Control of corruption (–2.5 worse to 2.5 better)Voice and accountability (–2.5 worse to 2.5 better)Political stability (–2.5 worse to 2.5 better)Government effectiveness (–2.5 worse to 2.5 better)Regulatory law (–2.5 worse to 2.5 better)Rule of law (–2.5 worse to 2.5 better)Combined polity score
PartnershipNet aid ($ millions)Net aid (% of GDP)Net aid per capita from all donors ($)Net aid from DAC donors ($ millions)Net aid from non-DAC bilateral donors ($ millions)Net aid from multilateral donors ($ millions)Net aid (% of central government expenditure)Debt relief committed under HIPC Initiative ($ millions)Country with an operational national development strategy (A-F)Existence of a mutual accountability review (A-F)
Sub-Saharan Country Africa
65 35 103 .. 115 112 4 .. 435 7,671 105 3,982
51 65 1 1 60 .. 60 50 29 .. .. .. 76 94 120 157 50 .. 560 902 36 .. 85 72 4 .. 1.90 5.00 21,000 1,500,000 0 0 71 60 35 47 71 .. 94 87 74 74 76 86 72 63 90 81 71 46 6 24 15 42 77 .. 21 .. 24 19 17 .. 1 .. 3 3 .. ..
4.0 Yes 4 –0.2 0.5 0.2 0.0 0.0 –0.1 8.0
1,176 37,975 9.2 5.1 51 49 595 27,476 1 312 580 10,187 0.0 0.0 3,500 52,315 2 .. 1 ..
LDB Africa 12-2-08.indd 45 12/2/08 12:20:29 PM

46 2008 The Little Data Book on Africa
Sub-Saharan Country Africa
Population (millions)Population growth (%)GNI per capita ($)
Economic density (current $/sq km)GDP ($ millions)GDP growth (%)GDP per capita (2000 $)GDP per capita growth (%)GDP deflator, index (2000=100; US$ series)CPI (% change)Value added, agriculture (% of GDP)Value added, industry (% of GDP)Value added, services and etc (% of GDP)Current account balance (% of GDP)Fiscal balance (cash surplus or deficit, % of GDP)Central government revenue (% of GDP)Total external debt (% of GDP)
DriversofgrowthGross domestic savings (% of GDP)Gross fixed capital formation (% of GDP)Private sector capital formation (% of GDP)Gross primary school enrollment, total (% of relevant age group)Gross secondary school enrollment, total (% of relevant age group)Gross tertiary school enrollment, total (% of relevant age group)Public current education expenditure, primary (% of total current education expenditure)Starting a business, procedures (number)Starting a business, time (days)Starting a business, cost (% of income per capita)Registering property, time (days)Enforcing contracts, time (days)Protecting investors, disclosure Index (0=less disclosure to 10=more disclosure)Paying taxes, time (hours)Paying taxes, total tax rate (% profit)Average time to clear direct exports through customs (days)Average time to clear imports from customs (days)Rigidity of employment index (0 least rigid to 100 most rigid)Delay in obtaining an electrical connection (days)Electric power outages in a typical month (number)Access to electricity (% of total population)Ratio of paved to total roads (%)Road density (road km/1,000 km2 of land area)Real interest rate (%)Domestic credit to private sector (% of GDP)Corruption (% of firms identifying this as a major constraint)Believing the court system is fair, impartial and uncorrupted (% of firms this as a major contraint)Crime, theft and disorder (% of firms identifying this as major constraint)Tax rates (% of firms identifying this as major constraint)Access to finance (% of firms identifying this as a major constraint)Electricity (% of firms identifying this as a major constraint)Labor regulations (% of firms identifying this as a major constraint)Labor skill level (% of firms identifying this as a major constraint)Irrigated land (% of cropland)Fertilizer consumption (100 grams per hectare of arable land)Agricultural machinery tractors per 100 hectares of arable landCereal crop yield (kg per hectare)Exports of goods and services (% of GDP)
Guinea 9.2 782.5 2.0 2.5 410 861
13,039 31,518 3,204 744,731 2.2 5.8 406 580 0.2 3.2 86 164 .. 12.7 14.5 36.7 34.0 45.0 42.6 –4.1 2.0 .. .. 12.5 23.9 102.4 23.4
10.5 29.0 13.3 18.9 10.2 12.5 88.3 93.2 34.9 28.6 5.3 6.1 .. .. 13 11 41 56 138.3 160.3 104 103 276 673 6 5 416 320 50 67 4 8 10 8 44 42 16 44 34 7 21 .. 10 12 180 .. 7 5 65 48 26 30 39 58 84 2 12 5.4 3.5 28 106 46 13 1,436 1,262 33 37
LDB Africa 12-2-08.indd 46 12/2/08 12:20:29 PM

The Little Data Book on Africa 2008 47
Imports of goods and services (% of GDP)Terms of trade index (2000=100)Real effective exchange rate (2000=100)Export diversification index (%)Foreign direct investment, net inflows ($ millions)Workers remittances received ($ millions)
ParticipatingingrowthRural population (% of total population)Age dependency ratio (dependents to working-age population)Population 0–24 (% of total population)Life expectancy at birth (years)Poverty headcount ratio at national poverty line (% of population)Gini indexInfant mortality rate (per 1,000 live births)Under-five mortality rate (per 1,000)Births attended by skilled health staff (% of total)Maternal mortality ratio, modeled estimate (per 100,000 live births)Malnutrition prevalence, height for age (% of children under 5)Child immunization, measles (% of ages 12–23 months)Children sleeping under insecticide-treated bednets (% under age 5)HIV prevalence rate (% of ages 15–49)Deaths of adults and children due to AIDSPhysicians per 1,000 peoplePrimary school completion rate, total (% of relevant age group)Student-teacher ratio, primary schoolYouth literacy, total (% of ages 15–24)Ratio of girls to boys in primary and secondary schoolLabor force participation rate, total (% of ages 15 and over)Labor force participation rate, male (% of ages 15 and over)Labor force participation rate, female (% of ages 15 and over)Improved water source (% of urban population with sustainable access) Improved water source (% of rural population with sustainable access) Improved sanitation (% of urban population with sustainable access) Improved sanitation (% of rural population with sustainable access) Access to electricity (% of urban population)Access to electricity (% of rural population)Telephone subscribers, total (per 100 people)Households with own telephone (% of urban households)Households with own telephone (% of rural households)Internet users (per 100 people)Rural residents within 2 km of an all-season road (%)
CapablestatesCPIA overall rating (IDA resource allocation index, 1 low to 6 high)Country has publicly endorsed the EITI principles Corruption Perceptions Index score (0 corrupt to 10 clean)Control of corruption (–2.5 worse to 2.5 better)Voice and accountability (–2.5 worse to 2.5 better)Political stability (–2.5 worse to 2.5 better)Government effectiveness (–2.5 worse to 2.5 better)Regulatory law (–2.5 worse to 2.5 better)Rule of law (–2.5 worse to 2.5 better)Combined polity score
PartnershipNet aid ($ millions)Net aid (% of GDP)Net aid per capita from all donors ($)Net aid from DAC donors ($ millions)Net aid from non-DAC bilateral donors ($ millions)Net aid from multilateral donors ($ millions)Net aid (% of central government expenditure)Debt relief committed under HIPC Initiative ($ millions)Country with an operational national development strategy (A-F)Existence of a mutual accountability review (A-F)
Sub-Saharan Country Africa
36 35 93 .. .. 112 4 .. 79 7,671 0 3,982
67 65 1 1 63 .. 56 50 .. .. 39 .. 98 94 161 157 38 .. 910 902 39 .. 67 72 0 .. 1.60 5.00 4,500 1,500,000 0 0 64 60 44 47 47 .. 74 87 86 74 88 86 83 63 91 81 59 46 12 24 33 42 63 .. 3 .. 2 19 24 .. 0 .. 1 3 .. ..
3.0 Yes 2 –1.3 –1.2 –2.0 –1.5 –1.1 –1.5 –1.0
164 37,975 5.1 5.1 18 49 103 27,476 3 312 58 10,187 0.0 0.0 800 52,315 .. .. .. ..
LDB Africa 12-2-08.indd 47 12/2/08 12:20:29 PM

48 2008 The Little Data Book on Africa
Sub-Saharan Country Africa
Population (millions)Population growth (%)GNI per capita ($)
Economic density (current $/sq km)GDP ($ millions)GDP growth (%)GDP per capita (2000 $)GDP per capita growth (%)GDP deflator, index (2000=100; US$ series)CPI (% change)Value added, agriculture (% of GDP)Value added, industry (% of GDP)Value added, services and etc (% of GDP)Current account balance (% of GDP)Fiscal balance (cash surplus or deficit, % of GDP)Central government revenue (% of GDP)Total external debt (% of GDP)
DriversofgrowthGross domestic savings (% of GDP)Gross fixed capital formation (% of GDP)Private sector capital formation (% of GDP)Gross primary school enrollment, total (% of relevant age group)Gross secondary school enrollment, total (% of relevant age group)Gross tertiary school enrollment, total (% of relevant age group)Public current education expenditure, primary (% of total current education expenditure)Starting a business, procedures (number)Starting a business, time (days)Starting a business, cost (% of income per capita)Registering property, time (days)Enforcing contracts, time (days)Protecting investors, disclosure Index (0=less disclosure to 10=more disclosure)Paying taxes, time (hours)Paying taxes, total tax rate (% profit)Average time to clear direct exports through customs (days)Average time to clear imports from customs (days)Rigidity of employment index (0 least rigid to 100 most rigid)Delay in obtaining an electrical connection (days)Electric power outages in a typical month (number)Access to electricity (% of total population)Ratio of paved to total roads (%)Road density (road km/1,000 km2 of land area)Real interest rate (%)Domestic credit to private sector (% of GDP)Corruption (% of firms identifying this as a major constraint)Believing the court system is fair, impartial and uncorrupted (% of firms this as a major contraint)Crime, theft and disorder (% of firms identifying this as major constraint)Tax rates (% of firms identifying this as major constraint)Access to finance (% of firms identifying this as a major constraint)Electricity (% of firms identifying this as a major constraint)Labor regulations (% of firms identifying this as a major constraint)Labor skill level (% of firms identifying this as a major constraint)Irrigated land (% of cropland)Fertilizer consumption (100 grams per hectare of arable land)Agricultural machinery tractors per 100 hectares of arable landCereal crop yield (kg per hectare)Exports of goods and services (% of GDP)
Guinea-Bissau 1.6 782.5 3.0 2.5 180 861
10,937 31,518 308 744,731 1.8 5.8 130 580 –1.2 3.2 143 164 2.0 60.3 14.5 11.2 34.0 26.2 42.6 5.1 2.0 .. .. 25.8 23.9 231.3 23.4
6.3 29.0 17.2 18.9 6.4 12.5 69.7 93.2 17.7 28.6 0.4 6.1 .. .. 17 11 233 56 255.5 160.3 211 103 1,140 673 6 5 208 320 46 67 6 8 11 8 66 42 21 44 9 7 .. .. 28 12 123 .. .. 4 65 44 12 30 44 72 74 4 12 4.5 3.5 80 106 1 13 1,625 1,262 42 37
LDB Africa 12-2-08.indd 48 12/2/08 12:20:29 PM

The Little Data Book on Africa 2008 49
Imports of goods and services (% of GDP)Terms of trade index (2000=100)Real effective exchange rate (2000=100)Export diversification index (%)Foreign direct investment, net inflows ($ millions)Workers remittances received ($ millions)
ParticipatingingrowthRural population (% of total population)Age dependency ratio (dependents to working-age population)Population 0–24 (% of total population)Life expectancy at birth (years)Poverty headcount ratio at national poverty line (% of population)Gini indexInfant mortality rate (per 1,000 live births)Under-five mortality rate (per 1,000)Births attended by skilled health staff (% of total)Maternal mortality ratio, modeled estimate (per 100,000 live births)Malnutrition prevalence, height for age (% of children under 5)Child immunization, measles (% of ages 12–23 months)Children sleeping under insecticide-treated bednets (% under age 5)HIV prevalence rate (% of ages 15–49)Deaths of adults and children due to AIDSPhysicians per 1,000 peoplePrimary school completion rate, total (% of relevant age group)Student-teacher ratio, primary schoolYouth literacy, total (% of ages 15–24)Ratio of girls to boys in primary and secondary schoolLabor force participation rate, total (% of ages 15 and over)Labor force participation rate, male (% of ages 15 and over)Labor force participation rate, female (% of ages 15 and over)Improved water source (% of urban population with sustainable access) Improved water source (% of rural population with sustainable access) Improved sanitation (% of urban population with sustainable access) Improved sanitation (% of rural population with sustainable access) Access to electricity (% of urban population)Access to electricity (% of rural population)Telephone subscribers, total (per 100 people)Households with own telephone (% of urban households)Households with own telephone (% of rural households)Internet users (per 100 people)Rural residents within 2 km of an all-season road (%)
CapablestatesCPIA overall rating (IDA resource allocation index, 1 low to 6 high)Country has publicly endorsed the EITI principles Corruption Perceptions Index score (0 corrupt to 10 clean)Control of corruption (–2.5 worse to 2.5 better)Voice and accountability (–2.5 worse to 2.5 better)Political stability (–2.5 worse to 2.5 better)Government effectiveness (–2.5 worse to 2.5 better)Regulatory law (–2.5 worse to 2.5 better)Rule of law (–2.5 worse to 2.5 better)Combined polity score
PartnershipNet aid ($ millions)Net aid (% of GDP)Net aid per capita from all donors ($)Net aid from DAC donors ($ millions)Net aid from non-DAC bilateral donors ($ millions)Net aid from multilateral donors ($ millions)Net aid (% of central government expenditure)Debt relief committed under HIPC Initiative ($ millions)Country with an operational national development strategy (A-F)Existence of a mutual accountability review (A-F)
Sub-Saharan Country Africa
53 35 97 .. .. 112 1 .. 9 7,671 0 3,982
70 65 1 1 66 .. 46 50 66 .. .. .. 119 94 200 157 39 .. 1,100 902 36 .. 60 72 7 .. 1.80 5.00 1,100 1,500,000 0 0 27 60 44 47 .. .. 65 87 78 74 93 86 63 63 82 81 47 46 26 24 48 42 .. .. .. .. 10 19 .. .. .. .. 2 3 .. ..
2.6 No 2 –1.1 –0.5 –0.4 –1.2 –1.1 –1.4 6.0
82 37,975 26.8 5.1 50 49 39 27,476 0 312 43 10,187 0.0 0.0 790 52,315 .. .. .. ..
LDB Africa 12-2-08.indd 49 12/2/08 12:20:30 PM

50 2008 The Little Data Book on Africa
Sub-Saharan Country Africa
Population (millions)Population growth (%)GNI per capita ($)
Economic density (current $/sq km)GDP ($ millions)GDP growth (%)GDP per capita (2000 $)GDP per capita growth (%)GDP deflator, index (2000=100; US$ series)CPI (% change)Value added, agriculture (% of GDP)Value added, industry (% of GDP)Value added, services and etc (% of GDP)Current account balance (% of GDP)Fiscal balance (cash surplus or deficit, % of GDP)Central government revenue (% of GDP)Total external debt (% of GDP)
DriversofgrowthGross domestic savings (% of GDP)Gross fixed capital formation (% of GDP)Private sector capital formation (% of GDP)Gross primary school enrollment, total (% of relevant age group)Gross secondary school enrollment, total (% of relevant age group)Gross tertiary school enrollment, total (% of relevant age group)Public current education expenditure, primary (% of total current education expenditure)Starting a business, procedures (number)Starting a business, time (days)Starting a business, cost (% of income per capita)Registering property, time (days)Enforcing contracts, time (days)Protecting investors, disclosure Index (0=less disclosure to 10=more disclosure)Paying taxes, time (hours)Paying taxes, total tax rate (% profit)Average time to clear direct exports through customs (days)Average time to clear imports from customs (days)Rigidity of employment index (0 least rigid to 100 most rigid)Delay in obtaining an electrical connection (days)Electric power outages in a typical month (number)Access to electricity (% of total population)Ratio of paved to total roads (%)Road density (road km/1,000 km2 of land area)Real interest rate (%)Domestic credit to private sector (% of GDP)Corruption (% of firms identifying this as a major constraint)Believing the court system is fair, impartial and uncorrupted (% of firms this as a major contraint)Crime, theft and disorder (% of firms identifying this as major constraint)Tax rates (% of firms identifying this as major constraint)Access to finance (% of firms identifying this as a major constraint)Electricity (% of firms identifying this as a major constraint)Labor regulations (% of firms identifying this as a major constraint)Labor skill level (% of firms identifying this as a major constraint)Irrigated land (% of cropland)Fertilizer consumption (100 grams per hectare of arable land)Agricultural machinery tractors per 100 hectares of arable landCereal crop yield (kg per hectare)Exports of goods and services (% of GDP)
Kenya 36.6 782.5 2.7 2.5 580 861
40,024 31,518 22,779 744,731 6.1 5.8 439 580 3.3 3.2 142 164 14.5 24.0 14.5 16.7 34.0 48.0 42.6 –2.3 2.0 1.5 .. 24.1 23.9 28.7 23.4
9.5 29.0 21.8 18.9 15.2 12.5 105.9 93.2 50.3 28.6 2.7 6.1 92 .. 12 11 44 56 46.1 160.3 64 103 465 673 3 5 432 320 51 67 5 8 9 8 21 42 51 44 .. 7 13 .. 14 12 111 .. 4 26 65 74 .. 70 68 44 48 23 28 1.8 3.5 178 106 25 13 1,675 1,262 25 37
LDB Africa 12-2-08.indd 50 12/2/08 12:20:30 PM

The Little Data Book on Africa 2008 51
Imports of goods and services (% of GDP)Terms of trade index (2000=100)Real effective exchange rate (2000=100)Export diversification index (%)Foreign direct investment, net inflows ($ millions)Workers remittances received ($ millions)
ParticipatingingrowthRural population (% of total population)Age dependency ratio (dependents to working-age population)Population 0–24 (% of total population)Life expectancy at birth (years)Poverty headcount ratio at national poverty line (% of population)Gini indexInfant mortality rate (per 1,000 live births)Under-five mortality rate (per 1,000)Births attended by skilled health staff (% of total)Maternal mortality ratio, modeled estimate (per 100,000 live births)Malnutrition prevalence, height for age (% of children under 5)Child immunization, measles (% of ages 12–23 months)Children sleeping under insecticide-treated bednets (% under age 5)HIV prevalence rate (% of ages 15–49)Deaths of adults and children due to AIDSPhysicians per 1,000 peoplePrimary school completion rate, total (% of relevant age group)Student-teacher ratio, primary schoolYouth literacy, total (% of ages 15–24)Ratio of girls to boys in primary and secondary schoolLabor force participation rate, total (% of ages 15 and over)Labor force participation rate, male (% of ages 15 and over)Labor force participation rate, female (% of ages 15 and over)Improved water source (% of urban population with sustainable access) Improved water source (% of rural population with sustainable access) Improved sanitation (% of urban population with sustainable access) Improved sanitation (% of rural population with sustainable access) Access to electricity (% of urban population)Access to electricity (% of rural population)Telephone subscribers, total (per 100 people)Households with own telephone (% of urban households)Households with own telephone (% of rural households)Internet users (per 100 people)Rural residents within 2 km of an all-season road (%)
CapablestatesCPIA overall rating (IDA resource allocation index, 1 low to 6 high)Country has publicly endorsed the EITI principles Corruption Perceptions Index score (0 corrupt to 10 clean)Control of corruption (–2.5 worse to 2.5 better)Voice and accountability (–2.5 worse to 2.5 better)Political stability (–2.5 worse to 2.5 better)Government effectiveness (–2.5 worse to 2.5 better)Regulatory law (–2.5 worse to 2.5 better)Rule of law (–2.5 worse to 2.5 better)Combined polity score
PartnershipNet aid ($ millions)Net aid (% of GDP)Net aid per capita from all donors ($)Net aid from DAC donors ($ millions)Net aid from non-DAC bilateral donors ($ millions)Net aid from multilateral donors ($ millions)Net aid (% of central government expenditure)Debt relief committed under HIPC Initiative ($ millions)Country with an operational national development strategy (A-F)Existence of a mutual accountability review (A-F)
Sub-Saharan Country Africa
37 35 87 .. .. 112 19 .. 27 7,671 570 3,982
79 65 1 1 65 .. 53 50 46 .. .. .. 79 94 121 157 42 .. 560 902 36 .. 77 72 5 .. 6.10 5.00 140,000 1,500,000 0 0 93 60 40 47 80 .. 96 87 81 74 90 86 72 63 85 81 49 46 48 24 19 42 51 .. 4 .. 21 19 37 .. 6 .. 8 3 .. ..
3.6 No 2 –0.9 –0.1 –1.1 –0.6 –0.2 –1.0 8.0
943 37,975 4.1 5.1 26 49 761 27,476 16 312 166 10,187 0.0 0.0 .. 52,315 3 .. 2 ..
LDB Africa 12-2-08.indd 51 12/2/08 12:20:30 PM
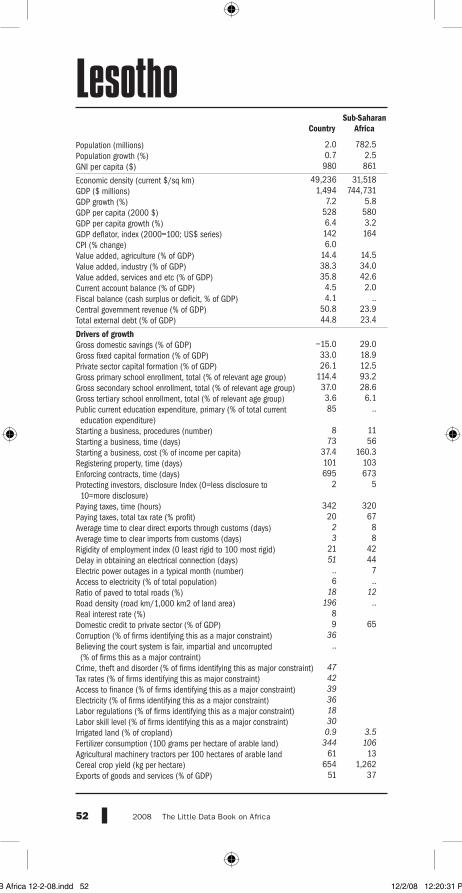
52 2008 The Little Data Book on Africa
Sub-Saharan Country Africa
Population (millions)Population growth (%)GNI per capita ($)
Economic density (current $/sq km)GDP ($ millions)GDP growth (%)GDP per capita (2000 $)GDP per capita growth (%)GDP deflator, index (2000=100; US$ series)CPI (% change)Value added, agriculture (% of GDP)Value added, industry (% of GDP)Value added, services and etc (% of GDP)Current account balance (% of GDP)Fiscal balance (cash surplus or deficit, % of GDP)Central government revenue (% of GDP)Total external debt (% of GDP)
DriversofgrowthGross domestic savings (% of GDP)Gross fixed capital formation (% of GDP)Private sector capital formation (% of GDP)Gross primary school enrollment, total (% of relevant age group)Gross secondary school enrollment, total (% of relevant age group)Gross tertiary school enrollment, total (% of relevant age group)Public current education expenditure, primary (% of total current education expenditure)Starting a business, procedures (number)Starting a business, time (days)Starting a business, cost (% of income per capita)Registering property, time (days)Enforcing contracts, time (days)Protecting investors, disclosure Index (0=less disclosure to 10=more disclosure)Paying taxes, time (hours)Paying taxes, total tax rate (% profit)Average time to clear direct exports through customs (days)Average time to clear imports from customs (days)Rigidity of employment index (0 least rigid to 100 most rigid)Delay in obtaining an electrical connection (days)Electric power outages in a typical month (number)Access to electricity (% of total population)Ratio of paved to total roads (%)Road density (road km/1,000 km2 of land area)Real interest rate (%)Domestic credit to private sector (% of GDP)Corruption (% of firms identifying this as a major constraint)Believing the court system is fair, impartial and uncorrupted (% of firms this as a major contraint)Crime, theft and disorder (% of firms identifying this as major constraint)Tax rates (% of firms identifying this as major constraint)Access to finance (% of firms identifying this as a major constraint)Electricity (% of firms identifying this as a major constraint)Labor regulations (% of firms identifying this as a major constraint)Labor skill level (% of firms identifying this as a major constraint)Irrigated land (% of cropland)Fertilizer consumption (100 grams per hectare of arable land)Agricultural machinery tractors per 100 hectares of arable landCereal crop yield (kg per hectare)Exports of goods and services (% of GDP)
Lesotho 2.0 782.5 0.7 2.5 980 861
49,236 31,518 1,494 744,731 7.2 5.8 528 580 6.4 3.2 142 164 6.0 14.4 14.5 38.3 34.0 35.8 42.6 4.5 2.0 4.1 .. 50.8 23.9 44.8 23.4
–15.0 29.0 33.0 18.9 26.1 12.5 114.4 93.2 37.0 28.6 3.6 6.1 85 .. 8 11 73 56 37.4 160.3 101 103 695 673 2 5 342 320 20 67 2 8 3 8 21 42 51 44 .. 7 6 .. 18 12 196 .. 8 9 65 36 .. 47 42 39 36 18 30 0.9 3.5 344 106 61 13 654 1,262 51 37
LDB Africa 12-2-08.indd 52 12/2/08 12:20:31 PM
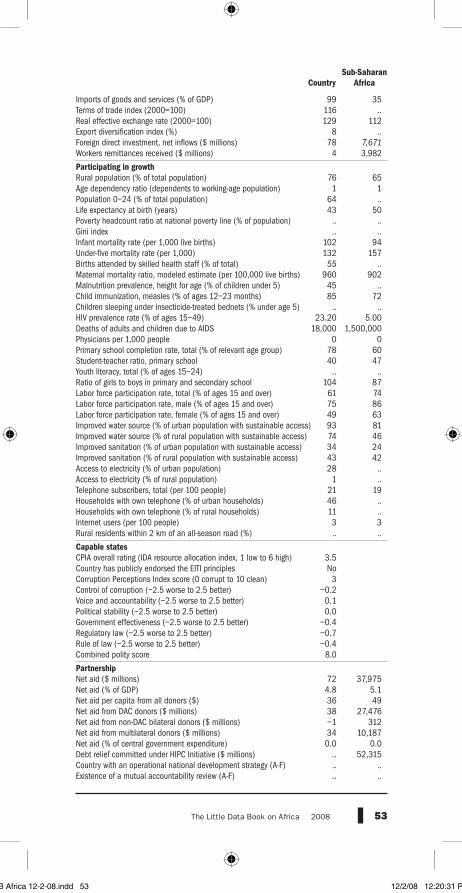
The Little Data Book on Africa 2008 53
Imports of goods and services (% of GDP)Terms of trade index (2000=100)Real effective exchange rate (2000=100)Export diversification index (%)Foreign direct investment, net inflows ($ millions)Workers remittances received ($ millions)
ParticipatingingrowthRural population (% of total population)Age dependency ratio (dependents to working-age population)Population 0–24 (% of total population)Life expectancy at birth (years)Poverty headcount ratio at national poverty line (% of population)Gini indexInfant mortality rate (per 1,000 live births)Under-five mortality rate (per 1,000)Births attended by skilled health staff (% of total)Maternal mortality ratio, modeled estimate (per 100,000 live births)Malnutrition prevalence, height for age (% of children under 5)Child immunization, measles (% of ages 12–23 months)Children sleeping under insecticide-treated bednets (% under age 5)HIV prevalence rate (% of ages 15–49)Deaths of adults and children due to AIDSPhysicians per 1,000 peoplePrimary school completion rate, total (% of relevant age group)Student-teacher ratio, primary schoolYouth literacy, total (% of ages 15–24)Ratio of girls to boys in primary and secondary schoolLabor force participation rate, total (% of ages 15 and over)Labor force participation rate, male (% of ages 15 and over)Labor force participation rate, female (% of ages 15 and over)Improved water source (% of urban population with sustainable access) Improved water source (% of rural population with sustainable access) Improved sanitation (% of urban population with sustainable access) Improved sanitation (% of rural population with sustainable access) Access to electricity (% of urban population)Access to electricity (% of rural population)Telephone subscribers, total (per 100 people)Households with own telephone (% of urban households)Households with own telephone (% of rural households)Internet users (per 100 people)Rural residents within 2 km of an all-season road (%)
CapablestatesCPIA overall rating (IDA resource allocation index, 1 low to 6 high)Country has publicly endorsed the EITI principles Corruption Perceptions Index score (0 corrupt to 10 clean)Control of corruption (–2.5 worse to 2.5 better)Voice and accountability (–2.5 worse to 2.5 better)Political stability (–2.5 worse to 2.5 better)Government effectiveness (–2.5 worse to 2.5 better)Regulatory law (–2.5 worse to 2.5 better)Rule of law (–2.5 worse to 2.5 better)Combined polity score
PartnershipNet aid ($ millions)Net aid (% of GDP)Net aid per capita from all donors ($)Net aid from DAC donors ($ millions)Net aid from non-DAC bilateral donors ($ millions)Net aid from multilateral donors ($ millions)Net aid (% of central government expenditure)Debt relief committed under HIPC Initiative ($ millions)Country with an operational national development strategy (A-F)Existence of a mutual accountability review (A-F)
Sub-Saharan Country Africa
99 35 116 .. 129 112 8 .. 78 7,671 4 3,982
76 65 1 1 64 .. 43 50 .. .. .. .. 102 94 132 157 55 .. 960 902 45 .. 85 72 .. .. 23.20 5.00 18,000 1,500,000 0 0 78 60 40 47 .. .. 104 87 61 74 75 86 49 63 93 81 74 46 34 24 43 42 28 .. 1 .. 21 19 46 .. 11 .. 3 3 .. ..
3.5 No 3 –0.2 0.1 0.0 –0.4 –0.7 –0.4 8.0
72 37,975 4.8 5.1 36 49 38 27,476 –1 312 34 10,187 0.0 0.0 .. 52,315 .. .. .. ..
LDB Africa 12-2-08.indd 53 12/2/08 12:20:31 PM

54 2008 The Little Data Book on Africa
Sub-Saharan Country Africa
Population (millions)Population growth (%)GNI per capita ($)
Economic density (current $/sq km)GDP ($ millions)GDP growth (%)GDP per capita (2000 $)GDP per capita growth (%)GDP deflator, index (2000=100; US$ series)CPI (% change)Value added, agriculture (% of GDP)Value added, industry (% of GDP)Value added, services and etc (% of GDP)Current account balance (% of GDP)Fiscal balance (cash surplus or deficit, % of GDP)Central government revenue (% of GDP)Total external debt (% of GDP)
DriversofgrowthGross domestic savings (% of GDP)Gross fixed capital formation (% of GDP)Private sector capital formation (% of GDP)Gross primary school enrollment, total (% of relevant age group)Gross secondary school enrollment, total (% of relevant age group)Gross tertiary school enrollment, total (% of relevant age group)Public current education expenditure, primary (% of total current education expenditure)Starting a business, procedures (number)Starting a business, time (days)Starting a business, cost (% of income per capita)Registering property, time (days)Enforcing contracts, time (days)Protecting investors, disclosure Index (0=less disclosure to 10=more disclosure)Paying taxes, time (hours)Paying taxes, total tax rate (% profit)Average time to clear direct exports through customs (days)Average time to clear imports from customs (days)Rigidity of employment index (0 least rigid to 100 most rigid)Delay in obtaining an electrical connection (days)Electric power outages in a typical month (number)Access to electricity (% of total population)Ratio of paved to total roads (%)Road density (road km/1,000 km2 of land area)Real interest rate (%)Domestic credit to private sector (% of GDP)Corruption (% of firms identifying this as a major constraint)Believing the court system is fair, impartial and uncorrupted (% of firms this as a major contraint)Crime, theft and disorder (% of firms identifying this as major constraint)Tax rates (% of firms identifying this as major constraint)Access to finance (% of firms identifying this as a major constraint)Electricity (% of firms identifying this as a major constraint)Labor regulations (% of firms identifying this as a major constraint)Labor skill level (% of firms identifying this as a major constraint)Irrigated land (% of cropland)Fertilizer consumption (100 grams per hectare of arable land)Agricultural machinery tractors per 100 hectares of arable landCereal crop yield (kg per hectare)Exports of goods and services (% of GDP)
Liberia 3.6 782.5 4.0 2.5 130 861
6,375 31,518 614 744,731 7.8 5.8 134 580 3.7 3.2 128 164 .. 65.8 14.5 15.7 34.0 18.4 42.6 –22.5 2.0 .. .. 5.4 23.9 435.5 23.4
2.4 29.0 16.4 18.9 4.3 12.5 91.5 93.2 32.3 28.6 15.6 6.1 .. .. 12 11 99 56 493.3 160.3 50 103 1,280 673 4 5 158 320 36 67 .. 8 .. 8 31 42 .. 44 .. 7 .. .. 6 12 110 .. 6 9 65 .. .. .. .. .. .. .. .. 0.5 3.5 .. 106 9 13 .. 1,262 29 37
LDB Africa 12-2-08.indd 54 12/2/08 12:20:31 PM

The Little Data Book on Africa 2008 55
Imports of goods and services (% of GDP)Terms of trade index (2000=100)Real effective exchange rate (2000=100)Export diversification index (%)Foreign direct investment, net inflows ($ millions)Workers remittances received ($ millions)
ParticipatingingrowthRural population (% of total population)Age dependency ratio (dependents to working-age population)Population 0–24 (% of total population)Life expectancy at birth (years)Poverty headcount ratio at national poverty line (% of population)Gini indexInfant mortality rate (per 1,000 live births)Under-five mortality rate (per 1,000)Births attended by skilled health staff (% of total)Maternal mortality ratio, modeled estimate (per 100,000 live births)Malnutrition prevalence, height for age (% of children under 5)Child immunization, measles (% of ages 12–23 months)Children sleeping under insecticide-treated bednets (% under age 5)HIV prevalence rate (% of ages 15–49)Deaths of adults and children due to AIDSPhysicians per 1,000 peoplePrimary school completion rate, total (% of relevant age group)Student-teacher ratio, primary schoolYouth literacy, total (% of ages 15–24)Ratio of girls to boys in primary and secondary schoolLabor force participation rate, total (% of ages 15 and over)Labor force participation rate, male (% of ages 15 and over)Labor force participation rate, female (% of ages 15 and over)Improved water source (% of urban population with sustainable access) Improved water source (% of rural population with sustainable access) Improved sanitation (% of urban population with sustainable access) Improved sanitation (% of rural population with sustainable access) Access to electricity (% of urban population)Access to electricity (% of rural population)Telephone subscribers, total (per 100 people)Households with own telephone (% of urban households)Households with own telephone (% of rural households)Internet users (per 100 people)Rural residents within 2 km of an all-season road (%)
CapablestatesCPIA overall rating (IDA resource allocation index, 1 low to 6 high)Country has publicly endorsed the EITI principles Corruption Perceptions Index score (0 corrupt to 10 clean)Control of corruption (–2.5 worse to 2.5 better)Voice and accountability (–2.5 worse to 2.5 better)Political stability (–2.5 worse to 2.5 better)Government effectiveness (–2.5 worse to 2.5 better)Regulatory law (–2.5 worse to 2.5 better)Rule of law (–2.5 worse to 2.5 better)Combined polity score
PartnershipNet aid ($ millions)Net aid (% of GDP)Net aid per capita from all donors ($)Net aid from DAC donors ($ millions)Net aid from non-DAC bilateral donors ($ millions)Net aid from multilateral donors ($ millions)Net aid (% of central government expenditure)Debt relief committed under HIPC Initiative ($ millions)Country with an operational national development strategy (A-F)Existence of a mutual accountability review (A-F)
Sub-Saharan Country Africa
74 35 .. .. .. 112 3 .. .. 7,671 685 3,982
41 65 1 1 67 .. 45 50 .. .. .. .. 157 94 235 157 51 .. 1,200 902 45 .. 94 72 3 .. 1.70 5.00 2,300 1,500,000 0 0 63 60 19 47 67 .. 73 87 70 74 84 86 56 63 72 81 52 46 7 24 49 42 .. .. .. .. 0 19 .. .. .. .. 0 3 .. ..
.. Yes 2 –0.4 –0.4 –1.2 –1.2 –1.2 –1.1 6.0
269 37,975 43.8 5.1 75 49 187 27,476 0 312 81 10,187 0.0 0.0 .. 52,315 4 .. 2 ..
LDB Africa 12-2-08.indd 55 12/2/08 12:20:31 PM

56 2008 The Little Data Book on Africa
North Country Africa
Population (millions)Population growth (%)GNI per capita ($)
Economic density (current $/sq km)GDP ($ millions)GDP growth (%)GDP per capita (2000 $)GDP per capita growth (%)GDP deflator, index (2000=100; US$ series)CPI (% change)Value added, agriculture (% of GDP)Value added, industry (% of GDP)Value added, services and etc (% of GDP)Current account balance (% of GDP)Fiscal balance (cash surplus or deficit, % of GDP)Central government revenue (% of GDP)Total external debt (% of GDP)
DriversofgrowthGross domestic savings (% of GDP)Gross fixed capital formation (% of GDP)Private sector capital formation (% of GDP)Gross primary school enrollment, total (% of relevant age group)Gross secondary school enrollment, total (% of relevant age group)Gross tertiary school enrollment, total (% of relevant age group)Public current education expenditure, primary (% of total current education expenditure)Starting a business, procedures (number)Starting a business, time (days)Starting a business, cost (% of income per capita)Registering property, time (days)Enforcing contracts, time (days)Protecting investors, disclosure Index (0=less disclosure to 10=more disclosure)Paying taxes, time (hours)Paying taxes, total tax rate (% profit)Average time to clear direct exports through customs (days)Average time to clear imports from customs (days)Rigidity of employment index (0 least rigid to 100 most rigid)Delay in obtaining an electrical connection (days)Electric power outages in a typical month (number)Access to electricity (% of total population)Ratio of paved to total roads (%)Road density (road km/1,000 km2 of land area)Real interest rate (%)Domestic credit to private sector (% of GDP)Corruption (% of firms identifying this as a major constraint)Believing the court system is fair, impartial and uncorrupted (% of firms this as a major contraint)Crime, theft and disorder (% of firms identifying this as major constraint)Tax rates (% of firms identifying this as major constraint)Access to finance (% of firms identifying this as a major constraint)Electricity (% of firms identifying this as a major constraint)Labor regulations (% of firms identifying this as a major constraint)Labor skill level (% of firms identifying this as a major constraint)Irrigated land (% of cropland)Fertilizer consumption (100 grams per hectare of arable land)Agricultural machinery tractors per 100 hectares of arable landCereal crop yield (kg per hectare)Exports of goods and services (% of GDP)
Libya 6.0 154.2 2.0 1.6 7,390 2,333
28,252 64,481 49,711 370,017 5.2 5.5 7,040 2,060 3.1 3.9 117 117 3.4 .. 10.3 .. 41.9 .. 40.9 44.6 10.3 .. 0.0 .. 36.2 .. 19.4
26.4 37.0 15.0 23.5 .. 14.8 110.4 106.1 93.5 77.2 55.8 26.6 .. .. .. 9 .. 14 .. 15.4 .. 83 .. 705 .. 5 .. 447 .. 57 .. 3 .. 10 .. 47 .. 34 .. 4 .. .. 57 68 47 .. –6 16 38 .. .. .. .. .. .. .. .. 21.9 .. 671 1,265 227 139 611 2,906 48 39
LDB Africa 12-2-08.indd 56 12/2/08 12:20:32 PM

The Little Data Book on Africa 2008 57
Imports of goods and services (% of GDP)Terms of trade index (2000=100)Real effective exchange rate (2000=100)Export diversification index (%)Foreign direct investment, net inflows ($ millions)Workers remittances received ($ millions)
ParticipatingingrowthRural population (% of total population)Age dependency ratio (dependents to working-age population)Population 0–24 (% of total population)Life expectancy at birth (years)Poverty headcount ratio at national poverty line (% of population)Gini indexInfant mortality rate (per 1,000 live births)Under-five mortality rate (per 1,000)Births attended by skilled health staff (% of total)Maternal mortality ratio, modeled estimate (per 100,000 live births)Malnutrition prevalence, height for age (% of children under 5)Child immunization, measles (% of ages 12–23 months)Children sleeping under insecticide-treated bednets (% under age 5)HIV prevalence rate (% of ages 15–49)Deaths of adults and children due to AIDSPhysicians per 1,000 peoplePrimary school completion rate, total (% of relevant age group)Student-teacher ratio, primary schoolYouth literacy, total (% of ages 15–24)Ratio of girls to boys in primary and secondary schoolLabor force participation rate, total (% of ages 15 and over)Labor force participation rate, male (% of ages 15 and over)Labor force participation rate, female (% of ages 15 and over)Improved water source (% of urban population with sustainable access) Improved water source (% of rural population with sustainable access) Improved sanitation (% of urban population with sustainable access) Improved sanitation (% of rural population with sustainable access) Access to electricity (% of urban population)Access to electricity (% of rural population)Telephone subscribers, total (per 100 people)Households with own telephone (% of urban households)Households with own telephone (% of rural households)Internet users (per 100 people)Rural residents within 2 km of an all-season road (%)
CapablestatesCPIA overall rating (IDA resource allocation index, 1 low to 6 high)Country has publicly endorsed the EITI principles Corruption Perceptions Index score (0 corrupt to 10 clean)Control of corruption (–2.5 worse to 2.5 better)Voice and accountability (–2.5 worse to 2.5 better)Political stability (–2.5 worse to 2.5 better)Government effectiveness (–2.5 worse to 2.5 better)Regulatory law (–2.5 worse to 2.5 better)Rule of law (–2.5 worse to 2.5 better)Combined polity score
PartnershipNet aid ($ millions)Net aid (% of GDP)Net aid per capita from all donors ($)Net aid from DAC donors ($ millions)Net aid from non-DAC bilateral donors ($ millions)Net aid from multilateral donors ($ millions)Net aid (% of central government expenditure)Debt relief committed under HIPC Initiative ($ millions)Country with an operational national development strategy (A-F)Existence of a mutual accountability review (A-F)
North Country Africa
36 31 .. .. .. 85 1 .. 1,590 17,080 6 12,300
23 47 1 1 51 .. 74 71 .. .. .. .. 17 30 18 35 .. 71 97 159 .. 24 98 96 .. .. .. .. .. .. 1 0 .. .. .. 25 98 .. 105 .. 61 54 84 80 36 28 72 96 68 87 96 60 97 90 .. .. .. .. 48 53 .. .. .. .. 4 10 .. ..
.. .. .. –0.8 –1.9 0.5 –1.1 –1.0 –0.6 –7.0
37 2,596 0.1 0.7 6 17 33 1,628 1 165 3 803 0.0 0.0 .. .. .. .. .. ..
LDB Africa 12-2-08.indd 57 12/2/08 12:20:32 PM
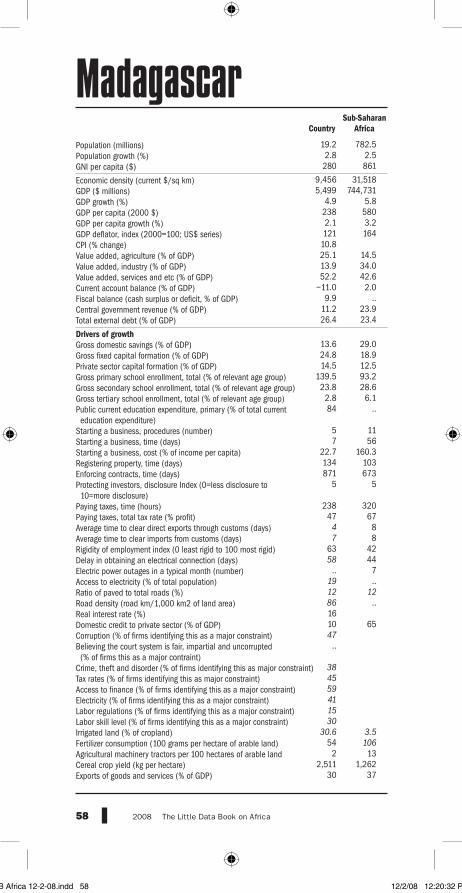
58 2008 The Little Data Book on Africa
Sub-Saharan Country Africa
Population (millions)Population growth (%)GNI per capita ($)
Economic density (current $/sq km)GDP ($ millions)GDP growth (%)GDP per capita (2000 $)GDP per capita growth (%)GDP deflator, index (2000=100; US$ series)CPI (% change)Value added, agriculture (% of GDP)Value added, industry (% of GDP)Value added, services and etc (% of GDP)Current account balance (% of GDP)Fiscal balance (cash surplus or deficit, % of GDP)Central government revenue (% of GDP)Total external debt (% of GDP)
DriversofgrowthGross domestic savings (% of GDP)Gross fixed capital formation (% of GDP)Private sector capital formation (% of GDP)Gross primary school enrollment, total (% of relevant age group)Gross secondary school enrollment, total (% of relevant age group)Gross tertiary school enrollment, total (% of relevant age group)Public current education expenditure, primary (% of total current education expenditure)Starting a business, procedures (number)Starting a business, time (days)Starting a business, cost (% of income per capita)Registering property, time (days)Enforcing contracts, time (days)Protecting investors, disclosure Index (0=less disclosure to 10=more disclosure)Paying taxes, time (hours)Paying taxes, total tax rate (% profit)Average time to clear direct exports through customs (days)Average time to clear imports from customs (days)Rigidity of employment index (0 least rigid to 100 most rigid)Delay in obtaining an electrical connection (days)Electric power outages in a typical month (number)Access to electricity (% of total population)Ratio of paved to total roads (%)Road density (road km/1,000 km2 of land area)Real interest rate (%)Domestic credit to private sector (% of GDP)Corruption (% of firms identifying this as a major constraint)Believing the court system is fair, impartial and uncorrupted (% of firms this as a major contraint)Crime, theft and disorder (% of firms identifying this as major constraint)Tax rates (% of firms identifying this as major constraint)Access to finance (% of firms identifying this as a major constraint)Electricity (% of firms identifying this as a major constraint)Labor regulations (% of firms identifying this as a major constraint)Labor skill level (% of firms identifying this as a major constraint)Irrigated land (% of cropland)Fertilizer consumption (100 grams per hectare of arable land)Agricultural machinery tractors per 100 hectares of arable landCereal crop yield (kg per hectare)Exports of goods and services (% of GDP)
Madagascar 19.2 782.5 2.8 2.5 280 861
9,456 31,518 5,499 744,731 4.9 5.8 238 580 2.1 3.2 121 164 10.8 25.1 14.5 13.9 34.0 52.2 42.6 –11.0 2.0 9.9 .. 11.2 23.9 26.4 23.4
13.6 29.0 24.8 18.9 14.5 12.5 139.5 93.2 23.8 28.6 2.8 6.1 84 .. 5 11 7 56 22.7 160.3 134 103 871 673 5 5 238 320 47 67 4 8 7 8 63 42 58 44 .. 7 19 .. 12 12 86 .. 16 10 65 47 .. 38 45 59 41 15 30 30.6 3.5 54 106 2 13 2,511 1,262 30 37
LDB Africa 12-2-08.indd 58 12/2/08 12:20:32 PM

The Little Data Book on Africa 2008 59
Imports of goods and services (% of GDP)Terms of trade index (2000=100)Real effective exchange rate (2000=100)Export diversification index (%)Foreign direct investment, net inflows ($ millions)Workers remittances received ($ millions)
ParticipatingingrowthRural population (% of total population)Age dependency ratio (dependents to working-age population)Population 0–24 (% of total population)Life expectancy at birth (years)Poverty headcount ratio at national poverty line (% of population)Gini indexInfant mortality rate (per 1,000 live births)Under-five mortality rate (per 1,000)Births attended by skilled health staff (% of total)Maternal mortality ratio, modeled estimate (per 100,000 live births)Malnutrition prevalence, height for age (% of children under 5)Child immunization, measles (% of ages 12–23 months)Children sleeping under insecticide-treated bednets (% under age 5)HIV prevalence rate (% of ages 15–49)Deaths of adults and children due to AIDSPhysicians per 1,000 peoplePrimary school completion rate, total (% of relevant age group)Student-teacher ratio, primary schoolYouth literacy, total (% of ages 15–24)Ratio of girls to boys in primary and secondary schoolLabor force participation rate, total (% of ages 15 and over)Labor force participation rate, male (% of ages 15 and over)Labor force participation rate, female (% of ages 15 and over)Improved water source (% of urban population with sustainable access) Improved water source (% of rural population with sustainable access) Improved sanitation (% of urban population with sustainable access) Improved sanitation (% of rural population with sustainable access) Access to electricity (% of urban population)Access to electricity (% of rural population)Telephone subscribers, total (per 100 people)Households with own telephone (% of urban households)Households with own telephone (% of rural households)Internet users (per 100 people)Rural residents within 2 km of an all-season road (%)
CapablestatesCPIA overall rating (IDA resource allocation index, 1 low to 6 high)Country has publicly endorsed the EITI principles Corruption Perceptions Index score (0 corrupt to 10 clean)Control of corruption (–2.5 worse to 2.5 better)Voice and accountability (–2.5 worse to 2.5 better)Political stability (–2.5 worse to 2.5 better)Government effectiveness (–2.5 worse to 2.5 better)Regulatory law (–2.5 worse to 2.5 better)Rule of law (–2.5 worse to 2.5 better)Combined polity score
PartnershipNet aid ($ millions)Net aid (% of GDP)Net aid per capita from all donors ($)Net aid from DAC donors ($ millions)Net aid from non-DAC bilateral donors ($ millions)Net aid from multilateral donors ($ millions)Net aid (% of central government expenditure)Debt relief committed under HIPC Initiative ($ millions)Country with an operational national development strategy (A-F)Existence of a mutual accountability review (A-F)
Sub-Saharan Country Africa
41 35 129 .. .. 112 19 .. 85 7,671 0 3,982
71 65 1 1 63 .. 59 50 .. .. 47 .. 72 94 115 157 51 .. 510 902 53 .. 59 72 0 .. 0.10 5.00 1,000 1,500,000 0 0 57 60 48 47 70 .. 96 87 83 74 86 86 80 63 76 81 36 46 10 24 18 42 52 .. 10 .. 6 19 12 .. 3 .. 1 3 .. ..
3.7 Yes 3 –0.2 0.0 –0.1 –0.3 –0.2 –0.4 7.0
754 37,975 13.7 5.1 39 49 266 27,476 4 312 485 10,187 0.0 0.0 1,900 52,315 3 .. 2 ..
LDB Africa 12-2-08.indd 59 12/2/08 12:20:33 PM
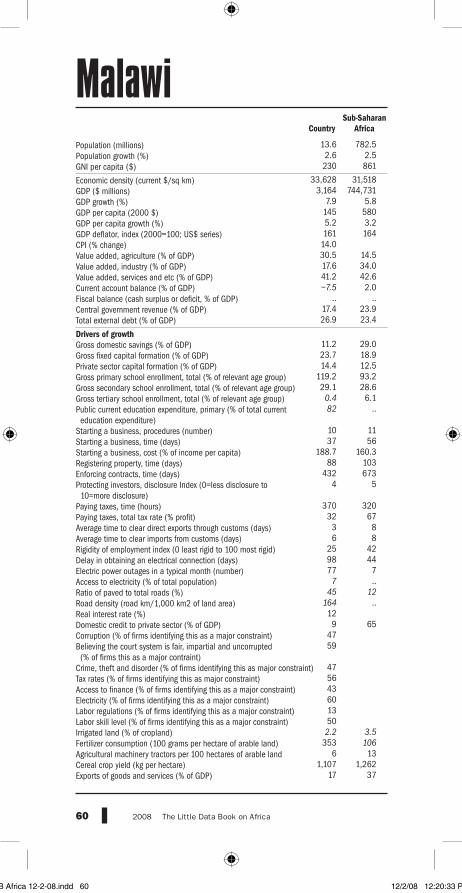
60 2008 The Little Data Book on Africa
Sub-Saharan Country Africa
Population (millions)Population growth (%)GNI per capita ($)
Economic density (current $/sq km)GDP ($ millions)GDP growth (%)GDP per capita (2000 $)GDP per capita growth (%)GDP deflator, index (2000=100; US$ series)CPI (% change)Value added, agriculture (% of GDP)Value added, industry (% of GDP)Value added, services and etc (% of GDP)Current account balance (% of GDP)Fiscal balance (cash surplus or deficit, % of GDP)Central government revenue (% of GDP)Total external debt (% of GDP)
DriversofgrowthGross domestic savings (% of GDP)Gross fixed capital formation (% of GDP)Private sector capital formation (% of GDP)Gross primary school enrollment, total (% of relevant age group)Gross secondary school enrollment, total (% of relevant age group)Gross tertiary school enrollment, total (% of relevant age group)Public current education expenditure, primary (% of total current education expenditure)Starting a business, procedures (number)Starting a business, time (days)Starting a business, cost (% of income per capita)Registering property, time (days)Enforcing contracts, time (days)Protecting investors, disclosure Index (0=less disclosure to 10=more disclosure)Paying taxes, time (hours)Paying taxes, total tax rate (% profit)Average time to clear direct exports through customs (days)Average time to clear imports from customs (days)Rigidity of employment index (0 least rigid to 100 most rigid)Delay in obtaining an electrical connection (days)Electric power outages in a typical month (number)Access to electricity (% of total population)Ratio of paved to total roads (%)Road density (road km/1,000 km2 of land area)Real interest rate (%)Domestic credit to private sector (% of GDP)Corruption (% of firms identifying this as a major constraint)Believing the court system is fair, impartial and uncorrupted (% of firms this as a major contraint)Crime, theft and disorder (% of firms identifying this as major constraint)Tax rates (% of firms identifying this as major constraint)Access to finance (% of firms identifying this as a major constraint)Electricity (% of firms identifying this as a major constraint)Labor regulations (% of firms identifying this as a major constraint)Labor skill level (% of firms identifying this as a major constraint)Irrigated land (% of cropland)Fertilizer consumption (100 grams per hectare of arable land)Agricultural machinery tractors per 100 hectares of arable landCereal crop yield (kg per hectare)Exports of goods and services (% of GDP)
Malawi 13.6 782.5 2.6 2.5 230 861
33,628 31,518 3,164 744,731 7.9 5.8 145 580 5.2 3.2 161 164 14.0 30.5 14.5 17.6 34.0 41.2 42.6 –7.5 2.0 .. .. 17.4 23.9 26.9 23.4
11.2 29.0 23.7 18.9 14.4 12.5 119.2 93.2 29.1 28.6 0.4 6.1 82 .. 10 11 37 56 188.7 160.3 88 103 432 673 4 5 370 320 32 67 3 8 6 8 25 42 98 44 77 7 7 .. 45 12 164 .. 12 9 65 47 59 47 56 43 60 13 50 2.2 3.5 353 106 6 13 1,107 1,262 17 37
LDB Africa 12-2-08.indd 60 12/2/08 12:20:33 PM

The Little Data Book on Africa 2008 61
Imports of goods and services (% of GDP)Terms of trade index (2000=100)Real effective exchange rate (2000=100)Export diversification index (%)Foreign direct investment, net inflows ($ millions)Workers remittances received ($ millions)
ParticipatingingrowthRural population (% of total population)Age dependency ratio (dependents to working-age population)Population 0–24 (% of total population)Life expectancy at birth (years)Poverty headcount ratio at national poverty line (% of population)Gini indexInfant mortality rate (per 1,000 live births)Under-five mortality rate (per 1,000)Births attended by skilled health staff (% of total)Maternal mortality ratio, modeled estimate (per 100,000 live births)Malnutrition prevalence, height for age (% of children under 5)Child immunization, measles (% of ages 12–23 months)Children sleeping under insecticide-treated bednets (% under age 5)HIV prevalence rate (% of ages 15–49)Deaths of adults and children due to AIDSPhysicians per 1,000 peoplePrimary school completion rate, total (% of relevant age group)Student-teacher ratio, primary schoolYouth literacy, total (% of ages 15–24)Ratio of girls to boys in primary and secondary schoolLabor force participation rate, total (% of ages 15 and over)Labor force participation rate, male (% of ages 15 and over)Labor force participation rate, female (% of ages 15 and over)Improved water source (% of urban population with sustainable access) Improved water source (% of rural population with sustainable access) Improved sanitation (% of urban population with sustainable access) Improved sanitation (% of rural population with sustainable access) Access to electricity (% of urban population)Access to electricity (% of rural population)Telephone subscribers, total (per 100 people)Households with own telephone (% of urban households)Households with own telephone (% of rural households)Internet users (per 100 people)Rural residents within 2 km of an all-season road (%)
CapablestatesCPIA overall rating (IDA resource allocation index, 1 low to 6 high)Country has publicly endorsed the EITI principles Corruption Perceptions Index score (0 corrupt to 10 clean)Control of corruption (–2.5 worse to 2.5 better)Voice and accountability (–2.5 worse to 2.5 better)Political stability (–2.5 worse to 2.5 better)Government effectiveness (–2.5 worse to 2.5 better)Regulatory law (–2.5 worse to 2.5 better)Rule of law (–2.5 worse to 2.5 better)Combined polity score
PartnershipNet aid ($ millions)Net aid (% of GDP)Net aid per capita from all donors ($)Net aid from DAC donors ($ millions)Net aid from non-DAC bilateral donors ($ millions)Net aid from multilateral donors ($ millions)Net aid (% of central government expenditure)Debt relief committed under HIPC Initiative ($ millions)Country with an operational national development strategy (A-F)Existence of a mutual accountability review (A-F)
Sub-Saharan Country Africa
29 35 185 .. 73 112 3 .. 6 7,671 0 3,982
82 65 1 1 67 .. 48 50 .. .. 39 .. 76 94 120 157 54 .. 1,100 902 53 .. 85 72 15 .. 11.90 5.00 68,000 1,500,000 0 0 55 60 .. 47 .. .. 100 87 88 74 90 86 86 63 96 81 72 46 62 24 51 42 34 .. 2 .. 6 19 27 .. 2 .. 0 3 .. ..
3.4 No 3 –0.7 –0.3 0.0 –0.6 –0.5 –0.4 6.0
669 37,975 21.1 5.1 49 49 398 27,476 12 312 259 10,187 0.0 0.0 1,000 52,315 3 .. 1 ..
LDB Africa 12-2-08.indd 61 12/2/08 12:20:33 PM

62 2008 The Little Data Book on Africa
Sub-Saharan Country Africa
Population (millions)Population growth (%)GNI per capita ($)
Economic density (current $/sq km)GDP ($ millions)GDP growth (%)GDP per capita (2000 $)GDP per capita growth (%)GDP deflator, index (2000=100; US$ series)CPI (% change)Value added, agriculture (% of GDP)Value added, industry (% of GDP)Value added, services and etc (% of GDP)Current account balance (% of GDP)Fiscal balance (cash surplus or deficit, % of GDP)Central government revenue (% of GDP)Total external debt (% of GDP)
DriversofgrowthGross domestic savings (% of GDP)Gross fixed capital formation (% of GDP)Private sector capital formation (% of GDP)Gross primary school enrollment, total (% of relevant age group)Gross secondary school enrollment, total (% of relevant age group)Gross tertiary school enrollment, total (% of relevant age group)Public current education expenditure, primary (% of total current education expenditure)Starting a business, procedures (number)Starting a business, time (days)Starting a business, cost (% of income per capita)Registering property, time (days)Enforcing contracts, time (days)Protecting investors, disclosure Index (0=less disclosure to 10=more disclosure)Paying taxes, time (hours)Paying taxes, total tax rate (% profit)Average time to clear direct exports through customs (days)Average time to clear imports from customs (days)Rigidity of employment index (0 least rigid to 100 most rigid)Delay in obtaining an electrical connection (days)Electric power outages in a typical month (number)Access to electricity (% of total population)Ratio of paved to total roads (%)Road density (road km/1,000 km2 of land area)Real interest rate (%)Domestic credit to private sector (% of GDP)Corruption (% of firms identifying this as a major constraint)Believing the court system is fair, impartial and uncorrupted (% of firms this as a major contraint)Crime, theft and disorder (% of firms identifying this as major constraint)Tax rates (% of firms identifying this as major constraint)Access to finance (% of firms identifying this as a major constraint)Electricity (% of firms identifying this as a major constraint)Labor regulations (% of firms identifying this as a major constraint)Labor skill level (% of firms identifying this as a major constraint)Irrigated land (% of cropland)Fertilizer consumption (100 grams per hectare of arable land)Agricultural machinery tractors per 100 hectares of arable landCereal crop yield (kg per hectare)Exports of goods and services (% of GDP)
Mali 12.0 782.5 3.1 2.5 460 861
4,808 31,518 5,866 744,731 5.3 5.8 290 580 2.2 3.2 169 164 1.5 34.1 14.5 22.2 34.0 36.0 42.6 –3.9 2.0 32.1 .. 16.4 23.9 24.5 23.4
14.8 29.0 22.9 18.9 14.3 12.5 80.1 93.2 28.3 28.6 3.0 6.1 81 .. 11 11 26 56 132.1 160.3 29 103 860 673 6 5 270 320 51 67 8 8 9 8 38 42 48 44 4 7 13 .. 18 12 15 .. .. 17 65 16 50 5 54 60 56 2 8 4.9 3.5 89 106 5 13 1,067 1,262 32 37
LDB Africa 12-2-08.indd 62 12/2/08 12:20:33 PM
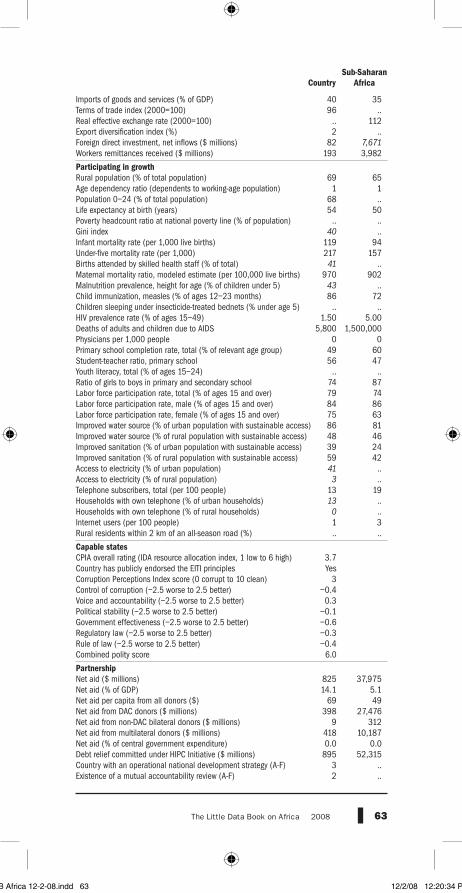
The Little Data Book on Africa 2008 63
Imports of goods and services (% of GDP)Terms of trade index (2000=100)Real effective exchange rate (2000=100)Export diversification index (%)Foreign direct investment, net inflows ($ millions)Workers remittances received ($ millions)
ParticipatingingrowthRural population (% of total population)Age dependency ratio (dependents to working-age population)Population 0–24 (% of total population)Life expectancy at birth (years)Poverty headcount ratio at national poverty line (% of population)Gini indexInfant mortality rate (per 1,000 live births)Under-five mortality rate (per 1,000)Births attended by skilled health staff (% of total)Maternal mortality ratio, modeled estimate (per 100,000 live births)Malnutrition prevalence, height for age (% of children under 5)Child immunization, measles (% of ages 12–23 months)Children sleeping under insecticide-treated bednets (% under age 5)HIV prevalence rate (% of ages 15–49)Deaths of adults and children due to AIDSPhysicians per 1,000 peoplePrimary school completion rate, total (% of relevant age group)Student-teacher ratio, primary schoolYouth literacy, total (% of ages 15–24)Ratio of girls to boys in primary and secondary schoolLabor force participation rate, total (% of ages 15 and over)Labor force participation rate, male (% of ages 15 and over)Labor force participation rate, female (% of ages 15 and over)Improved water source (% of urban population with sustainable access) Improved water source (% of rural population with sustainable access) Improved sanitation (% of urban population with sustainable access) Improved sanitation (% of rural population with sustainable access) Access to electricity (% of urban population)Access to electricity (% of rural population)Telephone subscribers, total (per 100 people)Households with own telephone (% of urban households)Households with own telephone (% of rural households)Internet users (per 100 people)Rural residents within 2 km of an all-season road (%)
CapablestatesCPIA overall rating (IDA resource allocation index, 1 low to 6 high)Country has publicly endorsed the EITI principles Corruption Perceptions Index score (0 corrupt to 10 clean)Control of corruption (–2.5 worse to 2.5 better)Voice and accountability (–2.5 worse to 2.5 better)Political stability (–2.5 worse to 2.5 better)Government effectiveness (–2.5 worse to 2.5 better)Regulatory law (–2.5 worse to 2.5 better)Rule of law (–2.5 worse to 2.5 better)Combined polity score
PartnershipNet aid ($ millions)Net aid (% of GDP)Net aid per capita from all donors ($)Net aid from DAC donors ($ millions)Net aid from non-DAC bilateral donors ($ millions)Net aid from multilateral donors ($ millions)Net aid (% of central government expenditure)Debt relief committed under HIPC Initiative ($ millions)Country with an operational national development strategy (A-F)Existence of a mutual accountability review (A-F)
Sub-Saharan Country Africa
40 35 96 .. .. 112 2 .. 82 7,671 193 3,982
69 65 1 1 68 .. 54 50 .. .. 40 .. 119 94 217 157 41 .. 970 902 43 .. 86 72 .. .. 1.50 5.00 5,800 1,500,000 0 0 49 60 56 47 .. .. 74 87 79 74 84 86 75 63 86 81 48 46 39 24 59 42 41 .. 3 .. 13 19 13 .. 0 .. 1 3 .. ..
3.7 Yes 3 –0.4 0.3 –0.1 –0.6 –0.3 –0.4 6.0
825 37,975 14.1 5.1 69 49 398 27,476 9 312 418 10,187 0.0 0.0 895 52,315 3 .. 2 ..
LDB Africa 12-2-08.indd 63 12/2/08 12:20:34 PM

64 2008 The Little Data Book on Africa
Sub-Saharan Country Africa
Population (millions)Population growth (%)GNI per capita ($)
Economic density (current $/sq km)GDP ($ millions)GDP growth (%)GDP per capita (2000 $)GDP per capita growth (%)GDP deflator, index (2000=100; US$ series)CPI (% change)Value added, agriculture (% of GDP)Value added, industry (% of GDP)Value added, services and etc (% of GDP)Current account balance (% of GDP)Fiscal balance (cash surplus or deficit, % of GDP)Central government revenue (% of GDP)Total external debt (% of GDP)
DriversofgrowthGross domestic savings (% of GDP)Gross fixed capital formation (% of GDP)Private sector capital formation (% of GDP)Gross primary school enrollment, total (% of relevant age group)Gross secondary school enrollment, total (% of relevant age group)Gross tertiary school enrollment, total (% of relevant age group)Public current education expenditure, primary (% of total current education expenditure)Starting a business, procedures (number)Starting a business, time (days)Starting a business, cost (% of income per capita)Registering property, time (days)Enforcing contracts, time (days)Protecting investors, disclosure Index (0=less disclosure to 10=more disclosure)Paying taxes, time (hours)Paying taxes, total tax rate (% profit)Average time to clear direct exports through customs (days)Average time to clear imports from customs (days)Rigidity of employment index (0 least rigid to 100 most rigid)Delay in obtaining an electrical connection (days)Electric power outages in a typical month (number)Access to electricity (% of total population)Ratio of paved to total roads (%)Road density (road km/1,000 km2 of land area)Real interest rate (%)Domestic credit to private sector (% of GDP)Corruption (% of firms identifying this as a major constraint)Believing the court system is fair, impartial and uncorrupted (% of firms this as a major contraint)Crime, theft and disorder (% of firms identifying this as major constraint)Tax rates (% of firms identifying this as major constraint)Access to finance (% of firms identifying this as a major constraint)Electricity (% of firms identifying this as a major constraint)Labor regulations (% of firms identifying this as a major constraint)Labor skill level (% of firms identifying this as a major constraint)Irrigated land (% of cropland)Fertilizer consumption (100 grams per hectare of arable land)Agricultural machinery tractors per 100 hectares of arable landCereal crop yield (kg per hectare)Exports of goods and services (% of GDP)
Mauritania 3.0 782.5 2.7 2.5 760 861
2,583 31,518 2,663 744,731 11.7 5.8 483 580 8.7 3.2 181 164 6.2 12.1 14.5 44.0 34.0 35.9 42.6 .. 2.0 .. .. 21.5 23.9 61.2 23.4
18.8 29.0 23.3 18.9 17.7 12.5 101.7 93.2 25.0 28.6 3.5 6.1 99 .. 11 11 65 56 56.2 160.3 49 103 400 673 5 5 696 320 108 67 4 8 7 8 45 42 8 44 4 7 23 .. 11 12 7 .. –4 27 65 17 49 1 35 44 29 3 23 9.8 3.5 59 106 8 13 782 1,262 55 37
LDB Africa 12-2-08.indd 64 12/2/08 12:20:34 PM

The Little Data Book on Africa 2008 65
Imports of goods and services (% of GDP)Terms of trade index (2000=100)Real effective exchange rate (2000=100)Export diversification index (%)Foreign direct investment, net inflows ($ millions)Workers remittances received ($ millions)
ParticipatingingrowthRural population (% of total population)Age dependency ratio (dependents to working-age population)Population 0–24 (% of total population)Life expectancy at birth (years)Poverty headcount ratio at national poverty line (% of population)Gini indexInfant mortality rate (per 1,000 live births)Under-five mortality rate (per 1,000)Births attended by skilled health staff (% of total)Maternal mortality ratio, modeled estimate (per 100,000 live births)Malnutrition prevalence, height for age (% of children under 5)Child immunization, measles (% of ages 12–23 months)Children sleeping under insecticide-treated bednets (% under age 5)HIV prevalence rate (% of ages 15–49)Deaths of adults and children due to AIDSPhysicians per 1,000 peoplePrimary school completion rate, total (% of relevant age group)Student-teacher ratio, primary schoolYouth literacy, total (% of ages 15–24)Ratio of girls to boys in primary and secondary schoolLabor force participation rate, total (% of ages 15 and over)Labor force participation rate, male (% of ages 15 and over)Labor force participation rate, female (% of ages 15 and over)Improved water source (% of urban population with sustainable access) Improved water source (% of rural population with sustainable access) Improved sanitation (% of urban population with sustainable access) Improved sanitation (% of rural population with sustainable access) Access to electricity (% of urban population)Access to electricity (% of rural population)Telephone subscribers, total (per 100 people)Households with own telephone (% of urban households)Households with own telephone (% of rural households)Internet users (per 100 people)Rural residents within 2 km of an all-season road (%)
CapablestatesCPIA overall rating (IDA resource allocation index, 1 low to 6 high)Country has publicly endorsed the EITI principles Corruption Perceptions Index score (0 corrupt to 10 clean)Control of corruption (–2.5 worse to 2.5 better)Voice and accountability (–2.5 worse to 2.5 better)Political stability (–2.5 worse to 2.5 better)Government effectiveness (–2.5 worse to 2.5 better)Regulatory law (–2.5 worse to 2.5 better)Rule of law (–2.5 worse to 2.5 better)Combined polity score
PartnershipNet aid ($ millions)Net aid (% of GDP)Net aid per capita from all donors ($)Net aid from DAC donors ($ millions)Net aid from non-DAC bilateral donors ($ millions)Net aid from multilateral donors ($ millions)Net aid (% of central government expenditure)Debt relief committed under HIPC Initiative ($ millions)Country with an operational national development strategy (A-F)Existence of a mutual accountability review (A-F)
Sub-Saharan Country Africa
59 35 131 .. .. 112 4 .. .. 7,671 0 3,982
59 65 1 1 60 .. 64 50 46 .. 39 .. 78 94 125 157 57 .. 820 902 40 .. 62 72 2 .. 0.80 5.00 1,000 1,500,000 0 0 47 60 41 47 61 .. 102 87 71 74 85 86 57 63 70 81 54 46 10 24 44 42 51 .. 3 .. 36 19 8 .. 0 .. 1 3 .. ..
3.4 Yes 3 –0.5 –0.8 –0.3 –0.7 –0.4 –0.6 –3.0
188 37,975 7.0 5.1 62 49 94 27,476 1 312 93 10,187 0.0 0.0 1,100 52,315 3 .. 2 ..
LDB Africa 12-2-08.indd 65 12/2/08 12:20:34 PM

66 2008 The Little Data Book on Africa
Sub-Saharan Country Africa
Population (millions)Population growth (%)GNI per capita ($)
Economic density (current $/sq km)GDP ($ millions)GDP growth (%)GDP per capita (2000 $)GDP per capita growth (%)GDP deflator, index (2000=100; US$ series)CPI (% change)Value added, agriculture (% of GDP)Value added, industry (% of GDP)Value added, services and etc (% of GDP)Current account balance (% of GDP)Fiscal balance (cash surplus or deficit, % of GDP)Central government revenue (% of GDP)Total external debt (% of GDP)
DriversofgrowthGross domestic savings (% of GDP)Gross fixed capital formation (% of GDP)Private sector capital formation (% of GDP)Gross primary school enrollment, total (% of relevant age group)Gross secondary school enrollment, total (% of relevant age group)Gross tertiary school enrollment, total (% of relevant age group)Public current education expenditure, primary (% of total current education expenditure)Starting a business, procedures (number)Starting a business, time (days)Starting a business, cost (% of income per capita)Registering property, time (days)Enforcing contracts, time (days)Protecting investors, disclosure Index (0=less disclosure to 10=more disclosure)Paying taxes, time (hours)Paying taxes, total tax rate (% profit)Average time to clear direct exports through customs (days)Average time to clear imports from customs (days)Rigidity of employment index (0 least rigid to 100 most rigid)Delay in obtaining an electrical connection (days)Electric power outages in a typical month (number)Access to electricity (% of total population)Ratio of paved to total roads (%)Road density (road km/1,000 km2 of land area)Real interest rate (%)Domestic credit to private sector (% of GDP)Corruption (% of firms identifying this as a major constraint)Believing the court system is fair, impartial and uncorrupted (% of firms this as a major contraint)Crime, theft and disorder (% of firms identifying this as major constraint)Tax rates (% of firms identifying this as major constraint)Access to finance (% of firms identifying this as a major constraint)Electricity (% of firms identifying this as a major constraint)Labor regulations (% of firms identifying this as a major constraint)Labor skill level (% of firms identifying this as a major constraint)Irrigated land (% of cropland)Fertilizer consumption (100 grams per hectare of arable land)Agricultural machinery tractors per 100 hectares of arable landCereal crop yield (kg per hectare)Exports of goods and services (% of GDP)
Mauritius 1.3 782.5 0.8 2.5 5,430 861
3,126,441 31,518 6,347 744,731 3.5 5.8 4,522 580 2.7 3.2 112 164 8.9 4.9 14.5 23.5 34.0 59.0 42.6 –9.6 2.0 –3.0 .. 19.7 23.9 31.5 23.4
17.5 29.0 24.5 18.9 15.9 12.5 101.8 93.2 88.4 28.6 17.1 6.1 84 .. 6 11 7 56 5.3 160.3 210 103 750 673 6 5 161 320 22 67 4 8 5 8 23 42 23 44 .. 7 .. .. 100 12 993 .. 16 78 65 37 .. 26 28 33 13 28 43 20.8 3.5 2,575 106 54 13 7,793 1,262 60 37
LDB Africa 12-2-08.indd 66 12/2/08 12:20:34 PM

The Little Data Book on Africa 2008 67
Imports of goods and services (% of GDP)Terms of trade index (2000=100)Real effective exchange rate (2000=100)Export diversification index (%)Foreign direct investment, net inflows ($ millions)Workers remittances received ($ millions)
ParticipatingingrowthRural population (% of total population)Age dependency ratio (dependents to working-age population)Population 0–24 (% of total population)Life expectancy at birth (years)Poverty headcount ratio at national poverty line (% of population)Gini indexInfant mortality rate (per 1,000 live births)Under-five mortality rate (per 1,000)Births attended by skilled health staff (% of total)Maternal mortality ratio, modeled estimate (per 100,000 live births)Malnutrition prevalence, height for age (% of children under 5)Child immunization, measles (% of ages 12–23 months)Children sleeping under insecticide-treated bednets (% under age 5)HIV prevalence rate (% of ages 15–49)Deaths of adults and children due to AIDSPhysicians per 1,000 peoplePrimary school completion rate, total (% of relevant age group)Student-teacher ratio, primary schoolYouth literacy, total (% of ages 15–24)Ratio of girls to boys in primary and secondary schoolLabor force participation rate, total (% of ages 15 and over)Labor force participation rate, male (% of ages 15 and over)Labor force participation rate, female (% of ages 15 and over)Improved water source (% of urban population with sustainable access) Improved water source (% of rural population with sustainable access) Improved sanitation (% of urban population with sustainable access) Improved sanitation (% of rural population with sustainable access) Access to electricity (% of urban population)Access to electricity (% of rural population)Telephone subscribers, total (per 100 people)Households with own telephone (% of urban households)Households with own telephone (% of rural households)Internet users (per 100 people)Rural residents within 2 km of an all-season road (%)
CapablestatesCPIA overall rating (IDA resource allocation index, 1 low to 6 high)Country has publicly endorsed the EITI principles Corruption Perceptions Index score (0 corrupt to 10 clean)Control of corruption (–2.5 worse to 2.5 better)Voice and accountability (–2.5 worse to 2.5 better)Political stability (–2.5 worse to 2.5 better)Government effectiveness (–2.5 worse to 2.5 better)Regulatory law (–2.5 worse to 2.5 better)Rule of law (–2.5 worse to 2.5 better)Combined polity score
PartnershipNet aid ($ millions)Net aid (% of GDP)Net aid per capita from all donors ($)Net aid from DAC donors ($ millions)Net aid from non-DAC bilateral donors ($ millions)Net aid from multilateral donors ($ millions)Net aid (% of central government expenditure)Debt relief committed under HIPC Initiative ($ millions)Country with an operational national development strategy (A-F)Existence of a mutual accountability review (A-F)
Sub-Saharan Country Africa
67 35 88 .. .. 112 12 .. 97 7,671 0 3,982
58 65 0 1 40 .. 73 50 .. .. .. .. 13 94 14 157 99 .. 15 902 .. .. 99 72 .. .. 1.70 5.00 100 1,500,000 1 0 92 60 22 47 95 .. 100 87 66 74 84 86 47 63 100 81 100 46 94 24 95 42 .. .. .. .. 90 19 .. .. .. .. 26 3 .. ..
.. No 5 0.4 0.9 0.8 0.6 0.6 0.8 10.0
19 37,975 0.3 5.1 15 49 9 27,476 –2 312 12 10,187 0.0 0.0 .. 52,315 .. .. .. ..
LDB Africa 12-2-08.indd 67 12/2/08 12:20:35 PM

68 2008 The Little Data Book on Africa
North Country Africa
Population (millions)Population growth (%)GNI per capita ($)
Economic density (current $/sq km)GDP ($ millions)GDP growth (%)GDP per capita (2000 $)GDP per capita growth (%)GDP deflator, index (2000=100; US$ series)CPI (% change)Value added, agriculture (% of GDP)Value added, industry (% of GDP)Value added, services and etc (% of GDP)Current account balance (% of GDP)Fiscal balance (cash surplus or deficit, % of GDP)Central government revenue (% of GDP)Total external debt (% of GDP)
DriversofgrowthGross domestic savings (% of GDP)Gross fixed capital formation (% of GDP)Private sector capital formation (% of GDP)Gross primary school enrollment, total (% of relevant age group)Gross secondary school enrollment, total (% of relevant age group)Gross tertiary school enrollment, total (% of relevant age group)Public current education expenditure, primary (% of total current education expenditure)Starting a business, procedures (number)Starting a business, time (days)Starting a business, cost (% of income per capita)Registering property, time (days)Enforcing contracts, time (days)Protecting investors, disclosure Index (0=less disclosure to 10=more disclosure)Paying taxes, time (hours)Paying taxes, total tax rate (% profit)Average time to clear direct exports through customs (days)Average time to clear imports from customs (days)Rigidity of employment index (0 least rigid to 100 most rigid)Delay in obtaining an electrical connection (days)Electric power outages in a typical month (number)Access to electricity (% of total population)Ratio of paved to total roads (%)Road density (road km/1,000 km2 of land area)Real interest rate (%)Domestic credit to private sector (% of GDP)Corruption (% of firms identifying this as a major constraint)Believing the court system is fair, impartial and uncorrupted (% of firms this as a major contraint)Crime, theft and disorder (% of firms identifying this as major constraint)Tax rates (% of firms identifying this as major constraint)Access to finance (% of firms identifying this as a major constraint)Electricity (% of firms identifying this as a major constraint)Labor regulations (% of firms identifying this as a major constraint)Labor skill level (% of firms identifying this as a major constraint)Irrigated land (% of cropland)Fertilizer consumption (100 grams per hectare of arable land)Agricultural machinery tractors per 100 hectares of arable landCereal crop yield (kg per hectare)Exports of goods and services (% of GDP)
Morocco 30.5 154.2 1.2 1.6 2,160 2,333
146,541 64,481 65,401 370,017 8.0 5.5 1,667 2,060 6.7 3.9 129 117 3.3 14.0 10.3 24.8 41.9 50.4 40.9 2.8 10.3 –1.8 0.0 25.6 36.2 28.3 19.4
26.2 37.0 31.6 23.5 24.9 14.8 106.0 106.1 52.4 77.2 11.8 26.6 95 .. 6 9 12 14 11.5 15.4 47 83 615 705 6 5 358 447 45 57 2 3 4 10 63 47 19 34 3 4 .. .. 62 68 129 .. 12 58 38 27 44 3 56 32 37 16 31 15.4 .. 426 1,265 58 139 1,622 2,906 33 39
LDB Africa 12-2-08.indd 68 12/2/08 12:20:35 PM

The Little Data Book on Africa 2008 69
Imports of goods and services (% of GDP)Terms of trade index (2000=100)Real effective exchange rate (2000=100)Export diversification index (%)Foreign direct investment, net inflows ($ millions)Workers remittances received ($ millions)
ParticipatingingrowthRural population (% of total population)Age dependency ratio (dependents to working-age population)Population 0–24 (% of total population)Life expectancy at birth (years)Poverty headcount ratio at national poverty line (% of population)Gini indexInfant mortality rate (per 1,000 live births)Under-five mortality rate (per 1,000)Births attended by skilled health staff (% of total)Maternal mortality ratio, modeled estimate (per 100,000 live births)Malnutrition prevalence, height for age (% of children under 5)Child immunization, measles (% of ages 12–23 months)Children sleeping under insecticide-treated bednets (% under age 5)HIV prevalence rate (% of ages 15–49)Deaths of adults and children due to AIDSPhysicians per 1,000 peoplePrimary school completion rate, total (% of relevant age group)Student-teacher ratio, primary schoolYouth literacy, total (% of ages 15–24)Ratio of girls to boys in primary and secondary schoolLabor force participation rate, total (% of ages 15 and over)Labor force participation rate, male (% of ages 15 and over)Labor force participation rate, female (% of ages 15 and over)Improved water source (% of urban population with sustainable access) Improved water source (% of rural population with sustainable access) Improved sanitation (% of urban population with sustainable access) Improved sanitation (% of rural population with sustainable access) Access to electricity (% of urban population)Access to electricity (% of rural population)Telephone subscribers, total (per 100 people)Households with own telephone (% of urban households)Households with own telephone (% of rural households)Internet users (per 100 people)Rural residents within 2 km of an all-season road (%)
CapablestatesCPIA overall rating (IDA resource allocation index, 1 low to 6 high)Country has publicly endorsed the EITI principles Corruption Perceptions Index score (0 corrupt to 10 clean)Control of corruption (–2.5 worse to 2.5 better)Voice and accountability (–2.5 worse to 2.5 better)Political stability (–2.5 worse to 2.5 better)Government effectiveness (–2.5 worse to 2.5 better)Regulatory law (–2.5 worse to 2.5 better)Rule of law (–2.5 worse to 2.5 better)Combined polity score
PartnershipNet aid ($ millions)Net aid (% of GDP)Net aid per capita from all donors ($)Net aid from DAC donors ($ millions)Net aid from non-DAC bilateral donors ($ millions)Net aid from multilateral donors ($ millions)Net aid (% of central government expenditure)Debt relief committed under HIPC Initiative ($ millions)Country with an operational national development strategy (A-F)Existence of a mutual accountability review (A-F)
North Country Africa
38 31 104 .. 93 85 69 .. 2,356 17,080 5,454 12,300
45 47 1 1 51 .. 71 71 .. .. .. .. 34 30 37 35 63 71 240 159 23 24 95 96 .. .. 0.10 .. 1,000 .. 1 0 84 .. 27 25 70 .. 87 .. 55 54 84 80 29 28 100 96 58 87 54 60 85 90 .. .. .. .. 57 53 .. .. .. .. 20 10 .. ..
.. .. .. –0.2 –0.6 –0.5 –0.1 –0.1 –0.2 –6.0
1,046 2,596 1.6 0.7 34 17 567 1,628 116 165 362 803 0.0 0.0 .. .. 6 .. 2 ..
LDB Africa 12-2-08.indd 69 12/2/08 12:20:35 PM

70 2008 The Little Data Book on Africa
Sub-Saharan Country Africa
Population (millions)Population growth (%)GNI per capita ($)
Economic density (current $/sq km)GDP ($ millions)GDP growth (%)GDP per capita (2000 $)GDP per capita growth (%)GDP deflator, index (2000=100; US$ series)CPI (% change)Value added, agriculture (% of GDP)Value added, industry (% of GDP)Value added, services and etc (% of GDP)Current account balance (% of GDP)Fiscal balance (cash surplus or deficit, % of GDP)Central government revenue (% of GDP)Total external debt (% of GDP)
DriversofgrowthGross domestic savings (% of GDP)Gross fixed capital formation (% of GDP)Private sector capital formation (% of GDP)Gross primary school enrollment, total (% of relevant age group)Gross secondary school enrollment, total (% of relevant age group)Gross tertiary school enrollment, total (% of relevant age group)Public current education expenditure, primary (% of total current education expenditure)Starting a business, procedures (number)Starting a business, time (days)Starting a business, cost (% of income per capita)Registering property, time (days)Enforcing contracts, time (days)Protecting investors, disclosure Index (0=less disclosure to 10=more disclosure)Paying taxes, time (hours)Paying taxes, total tax rate (% profit)Average time to clear direct exports through customs (days)Average time to clear imports from customs (days)Rigidity of employment index (0 least rigid to 100 most rigid)Delay in obtaining an electrical connection (days)Electric power outages in a typical month (number)Access to electricity (% of total population)Ratio of paved to total roads (%)Road density (road km/1,000 km2 of land area)Real interest rate (%)Domestic credit to private sector (% of GDP)Corruption (% of firms identifying this as a major constraint)Believing the court system is fair, impartial and uncorrupted (% of firms this as a major contraint)Crime, theft and disorder (% of firms identifying this as major constraint)Tax rates (% of firms identifying this as major constraint)Access to finance (% of firms identifying this as a major constraint)Electricity (% of firms identifying this as a major constraint)Labor regulations (% of firms identifying this as a major constraint)Labor skill level (% of firms identifying this as a major constraint)Irrigated land (% of cropland)Fertilizer consumption (100 grams per hectare of arable land)Agricultural machinery tractors per 100 hectares of arable landCereal crop yield (kg per hectare)Exports of goods and services (% of GDP)
Mozambique 21.0 782.5 2.1 2.5 310 861
8,690 31,518 6,833 744,731 8.0 5.8 330 580 5.7 3.2 99 164 13.2 25.6 14.5 23.4 34.0 41.4 42.6 –9.3 2.0 .. .. 15.6 23.9 47.8 23.4
13.3 29.0 19.3 18.9 7.1 12.5 104.8 93.2 15.5 28.6 1.5 6.1 94 .. 10 11 29 56 21.6 160.3 42 103 1,010 673 5 5 230 320 34 67 .. 8 .. 8 54 42 .. 44 .. 7 11 .. 19 12 39 .. 12 14 65 .. .. .. .. .. .. .. .. 2.6 3.5 16 106 15 13 902 1,262 41 37
LDB Africa 12-2-08.indd 70 12/2/08 12:20:35 PM

The Little Data Book on Africa 2008 71
Imports of goods and services (% of GDP)Terms of trade index (2000=100)Real effective exchange rate (2000=100)Export diversification index (%)Foreign direct investment, net inflows ($ millions)Workers remittances received ($ millions)
ParticipatingingrowthRural population (% of total population)Age dependency ratio (dependents to working-age population)Population 0–24 (% of total population)Life expectancy at birth (years)Poverty headcount ratio at national poverty line (% of population)Gini indexInfant mortality rate (per 1,000 live births)Under-five mortality rate (per 1,000)Births attended by skilled health staff (% of total)Maternal mortality ratio, modeled estimate (per 100,000 live births)Malnutrition prevalence, height for age (% of children under 5)Child immunization, measles (% of ages 12–23 months)Children sleeping under insecticide-treated bednets (% under age 5)HIV prevalence rate (% of ages 15–49)Deaths of adults and children due to AIDSPhysicians per 1,000 peoplePrimary school completion rate, total (% of relevant age group)Student-teacher ratio, primary schoolYouth literacy, total (% of ages 15–24)Ratio of girls to boys in primary and secondary schoolLabor force participation rate, total (% of ages 15 and over)Labor force participation rate, male (% of ages 15 and over)Labor force participation rate, female (% of ages 15 and over)Improved water source (% of urban population with sustainable access) Improved water source (% of rural population with sustainable access) Improved sanitation (% of urban population with sustainable access) Improved sanitation (% of rural population with sustainable access) Access to electricity (% of urban population)Access to electricity (% of rural population)Telephone subscribers, total (per 100 people)Households with own telephone (% of urban households)Households with own telephone (% of rural households)Internet users (per 100 people)Rural residents within 2 km of an all-season road (%)
CapablestatesCPIA overall rating (IDA resource allocation index, 1 low to 6 high)Country has publicly endorsed the EITI principles Corruption Perceptions Index score (0 corrupt to 10 clean)Control of corruption (–2.5 worse to 2.5 better)Voice and accountability (–2.5 worse to 2.5 better)Political stability (–2.5 worse to 2.5 better)Government effectiveness (–2.5 worse to 2.5 better)Regulatory law (–2.5 worse to 2.5 better)Rule of law (–2.5 worse to 2.5 better)Combined polity score
PartnershipNet aid ($ millions)Net aid (% of GDP)Net aid per capita from all donors ($)Net aid from DAC donors ($ millions)Net aid from non-DAC bilateral donors ($ millions)Net aid from multilateral donors ($ millions)Net aid (% of central government expenditure)Debt relief committed under HIPC Initiative ($ millions)Country with an operational national development strategy (A-F)Existence of a mutual accountability review (A-F)
Sub-Saharan Country Africa
47 35 81 .. .. 112 2 .. 153 7,671 16 3,982
65 65 1 1 64 .. 42 50 54 .. 47 .. 96 94 138 157 48 .. 520 902 47 .. 77 72 .. .. 12.50 5.00 81,000 1,500,000 0 0 42 60 67 47 .. .. 85 87 84 74 83 86 85 63 71 81 26 46 19 24 53 42 30 .. 1 .. 11 19 6 .. 0 .. 1 3 .. ..
3.6 No 3 –0.6 –0.1 0.4 –0.4 –0.5 –0.7 6.0
1,611 37,975 23.6 5.1 77 49 938 27,476 3 312 669 10,187 0.0 0.0 4,300 52,315 3 .. 1 ..
LDB Africa 12-2-08.indd 71 12/2/08 12:20:36 PM

72 2008 The Little Data Book on Africa
Sub-Saharan Country Africa
Population (millions)Population growth (%)GNI per capita ($)
Economic density (current $/sq km)GDP ($ millions)GDP growth (%)GDP per capita (2000 $)GDP per capita growth (%)GDP deflator, index (2000=100; US$ series)CPI (% change)Value added, agriculture (% of GDP)Value added, industry (% of GDP)Value added, services and etc (% of GDP)Current account balance (% of GDP)Fiscal balance (cash surplus or deficit, % of GDP)Central government revenue (% of GDP)Total external debt (% of GDP)
DriversofgrowthGross domestic savings (% of GDP)Gross fixed capital formation (% of GDP)Private sector capital formation (% of GDP)Gross primary school enrollment, total (% of relevant age group)Gross secondary school enrollment, total (% of relevant age group)Gross tertiary school enrollment, total (% of relevant age group)Public current education expenditure, primary (% of total current education expenditure)Starting a business, procedures (number)Starting a business, time (days)Starting a business, cost (% of income per capita)Registering property, time (days)Enforcing contracts, time (days)Protecting investors, disclosure Index (0=less disclosure to 10=more disclosure)Paying taxes, time (hours)Paying taxes, total tax rate (% profit)Average time to clear direct exports through customs (days)Average time to clear imports from customs (days)Rigidity of employment index (0 least rigid to 100 most rigid)Delay in obtaining an electrical connection (days)Electric power outages in a typical month (number)Access to electricity (% of total population)Ratio of paved to total roads (%)Road density (road km/1,000 km2 of land area)Real interest rate (%)Domestic credit to private sector (% of GDP)Corruption (% of firms identifying this as a major constraint)Believing the court system is fair, impartial and uncorrupted (% of firms this as a major contraint)Crime, theft and disorder (% of firms identifying this as major constraint)Tax rates (% of firms identifying this as major constraint)Access to finance (% of firms identifying this as a major constraint)Electricity (% of firms identifying this as a major constraint)Labor regulations (% of firms identifying this as a major constraint)Labor skill level (% of firms identifying this as a major constraint)Irrigated land (% of cropland)Fertilizer consumption (100 grams per hectare of arable land)Agricultural machinery tractors per 100 hectares of arable landCereal crop yield (kg per hectare)Exports of goods and services (% of GDP)
Namibia 2.0 782.5 1.3 2.5 3,210 861
7,976 31,518 6,566 744,731 2.9 5.8 2,166 580 1.6 3.2 148 164 5.1 9.9 14.5 27.6 34.0 52.9 42.6 16.2 2.0 –6.8 .. 33.6 23.9 .. 23.4
28.4 29.0 29.4 18.9 20.0 12.5 107.1 93.2 56.9 28.6 5.8 6.1 93 .. 10 11 99 56 22.3 160.3 23 103 270 673 5 5 375 320 27 67 1 8 3 8 20 42 9 44 2 7 32 .. 13 12 51 .. 2 62 65 19 66 28 20 18 6 7 20 1.0 3.5 19 106 39 13 434 1,262 54 37
LDB Africa 12-2-08.indd 72 12/2/08 12:20:36 PM

The Little Data Book on Africa 2008 73
Imports of goods and services (% of GDP)Terms of trade index (2000=100)Real effective exchange rate (2000=100)Export diversification index (%)Foreign direct investment, net inflows ($ millions)Workers remittances received ($ millions)
ParticipatingingrowthRural population (% of total population)Age dependency ratio (dependents to working-age population)Population 0–24 (% of total population)Life expectancy at birth (years)Poverty headcount ratio at national poverty line (% of population)Gini indexInfant mortality rate (per 1,000 live births)Under-five mortality rate (per 1,000)Births attended by skilled health staff (% of total)Maternal mortality ratio, modeled estimate (per 100,000 live births)Malnutrition prevalence, height for age (% of children under 5)Child immunization, measles (% of ages 12–23 months)Children sleeping under insecticide-treated bednets (% under age 5)HIV prevalence rate (% of ages 15–49)Deaths of adults and children due to AIDSPhysicians per 1,000 peoplePrimary school completion rate, total (% of relevant age group)Student-teacher ratio, primary schoolYouth literacy, total (% of ages 15–24)Ratio of girls to boys in primary and secondary schoolLabor force participation rate, total (% of ages 15 and over)Labor force participation rate, male (% of ages 15 and over)Labor force participation rate, female (% of ages 15 and over)Improved water source (% of urban population with sustainable access) Improved water source (% of rural population with sustainable access) Improved sanitation (% of urban population with sustainable access) Improved sanitation (% of rural population with sustainable access) Access to electricity (% of urban population)Access to electricity (% of rural population)Telephone subscribers, total (per 100 people)Households with own telephone (% of urban households)Households with own telephone (% of rural households)Internet users (per 100 people)Rural residents within 2 km of an all-season road (%)
CapablestatesCPIA overall rating (IDA resource allocation index, 1 low to 6 high)Country has publicly endorsed the EITI principles Corruption Perceptions Index score (0 corrupt to 10 clean)Control of corruption (–2.5 worse to 2.5 better)Voice and accountability (–2.5 worse to 2.5 better)Political stability (–2.5 worse to 2.5 better)Government effectiveness (–2.5 worse to 2.5 better)Regulatory law (–2.5 worse to 2.5 better)Rule of law (–2.5 worse to 2.5 better)Combined polity score
PartnershipNet aid ($ millions)Net aid (% of GDP)Net aid per capita from all donors ($)Net aid from DAC donors ($ millions)Net aid from non-DAC bilateral donors ($ millions)Net aid from multilateral donors ($ millions)Net aid (% of central government expenditure)Debt relief committed under HIPC Initiative ($ millions)Country with an operational national development strategy (A-F)Existence of a mutual accountability review (A-F)
Sub-Saharan Country Africa
55 35 104 .. .. 112 5 .. 342 7,671 7 3,982
64 65 1 1 61 .. 52 50 .. .. .. .. 45 94 61 157 76 .. 210 902 30 .. 63 72 .. .. 15.30 5.00 5,100 1,500,000 0 0 76 60 31 47 92 .. 104 87 56 74 64 86 48 63 99 81 90 46 18 24 66 42 75 .. 10 .. 36 19 44 .. 4 .. 4 3 .. ..
.. No 5 0.2 0.6 0.9 0.2 0.0 0.1 6.0
145 37,975 2.2 5.1 71 49 106 27,476 2 312 38 10,187 0.0 0.0 .. 52,315 .. .. .. ..
LDB Africa 12-2-08.indd 73 12/2/08 12:20:36 PM

74 2008 The Little Data Book on Africa
Sub-Saharan Country Africa
Population (millions)Population growth (%)GNI per capita ($)
Economic density (current $/sq km)GDP ($ millions)GDP growth (%)GDP per capita (2000 $)GDP per capita growth (%)GDP deflator, index (2000=100; US$ series)CPI (% change)Value added, agriculture (% of GDP)Value added, industry (% of GDP)Value added, services and etc (% of GDP)Current account balance (% of GDP)Fiscal balance (cash surplus or deficit, % of GDP)Central government revenue (% of GDP)Total external debt (% of GDP)
DriversofgrowthGross domestic savings (% of GDP)Gross fixed capital formation (% of GDP)Private sector capital formation (% of GDP)Gross primary school enrollment, total (% of relevant age group)Gross secondary school enrollment, total (% of relevant age group)Gross tertiary school enrollment, total (% of relevant age group)Public current education expenditure, primary (% of total current education expenditure)Starting a business, procedures (number)Starting a business, time (days)Starting a business, cost (% of income per capita)Registering property, time (days)Enforcing contracts, time (days)Protecting investors, disclosure Index (0=less disclosure to 10=more disclosure)Paying taxes, time (hours)Paying taxes, total tax rate (% profit)Average time to clear direct exports through customs (days)Average time to clear imports from customs (days)Rigidity of employment index (0 least rigid to 100 most rigid)Delay in obtaining an electrical connection (days)Electric power outages in a typical month (number)Access to electricity (% of total population)Ratio of paved to total roads (%)Road density (road km/1,000 km2 of land area)Real interest rate (%)Domestic credit to private sector (% of GDP)Corruption (% of firms identifying this as a major constraint)Believing the court system is fair, impartial and uncorrupted (% of firms this as a major contraint)Crime, theft and disorder (% of firms identifying this as major constraint)Tax rates (% of firms identifying this as major constraint)Access to finance (% of firms identifying this as a major constraint)Electricity (% of firms identifying this as a major constraint)Labor regulations (% of firms identifying this as a major constraint)Labor skill level (% of firms identifying this as a major constraint)Irrigated land (% of cropland)Fertilizer consumption (100 grams per hectare of arable land)Agricultural machinery tractors per 100 hectares of arable landCereal crop yield (kg per hectare)Exports of goods and services (% of GDP)
Niger 13.7 782.5 3.6 2.5 270 861
2,840 31,518 3,597 744,731 5.2 5.8 169 580 1.5 3.2 155 164 0.0 41.3 14.5 17.4 34.0 41.4 42.6 –9.4 2.0 .. .. 11.8 23.9 22.4 23.4
13.7 29.0 23.1 18.9 12.5 12.5 50.6 93.2 11.2 28.6 1.1 6.1 .. .. 11 11 23 56 174.8 160.3 35 103 545 673 6 5 270 320 42 67 7 8 7 8 70 42 21 44 21 7 .. .. 21 12 15 .. .. 8 65 59 36 6 69 56 22 6 18 0.5 3.5 3 106 0 13 605 1,262 15 37
LDB Africa 12-2-08.indd 74 12/2/08 12:20:37 PM

The Little Data Book on Africa 2008 75
Imports of goods and services (% of GDP)Terms of trade index (2000=100)Real effective exchange rate (2000=100)Export diversification index (%)Foreign direct investment, net inflows ($ millions)Workers remittances received ($ millions)
ParticipatingingrowthRural population (% of total population)Age dependency ratio (dependents to working-age population)Population 0–24 (% of total population)Life expectancy at birth (years)Poverty headcount ratio at national poverty line (% of population)Gini indexInfant mortality rate (per 1,000 live births)Under-five mortality rate (per 1,000)Births attended by skilled health staff (% of total)Maternal mortality ratio, modeled estimate (per 100,000 live births)Malnutrition prevalence, height for age (% of children under 5)Child immunization, measles (% of ages 12–23 months)Children sleeping under insecticide-treated bednets (% under age 5)HIV prevalence rate (% of ages 15–49)Deaths of adults and children due to AIDSPhysicians per 1,000 peoplePrimary school completion rate, total (% of relevant age group)Student-teacher ratio, primary schoolYouth literacy, total (% of ages 15–24)Ratio of girls to boys in primary and secondary schoolLabor force participation rate, total (% of ages 15 and over)Labor force participation rate, male (% of ages 15 and over)Labor force participation rate, female (% of ages 15 and over)Improved water source (% of urban population with sustainable access) Improved water source (% of rural population with sustainable access) Improved sanitation (% of urban population with sustainable access) Improved sanitation (% of rural population with sustainable access) Access to electricity (% of urban population)Access to electricity (% of rural population)Telephone subscribers, total (per 100 people)Households with own telephone (% of urban households)Households with own telephone (% of rural households)Internet users (per 100 people)Rural residents within 2 km of an all-season road (%)
CapablestatesCPIA overall rating (IDA resource allocation index, 1 low to 6 high)Country has publicly endorsed the EITI principles Corruption Perceptions Index score (0 corrupt to 10 clean)Control of corruption (–2.5 worse to 2.5 better)Voice and accountability (–2.5 worse to 2.5 better)Political stability (–2.5 worse to 2.5 better)Government effectiveness (–2.5 worse to 2.5 better)Regulatory law (–2.5 worse to 2.5 better)Rule of law (–2.5 worse to 2.5 better)Combined polity score
PartnershipNet aid ($ millions)Net aid (% of GDP)Net aid per capita from all donors ($)Net aid from DAC donors ($ millions)Net aid from non-DAC bilateral donors ($ millions)Net aid from multilateral donors ($ millions)Net aid (% of central government expenditure)Debt relief committed under HIPC Initiative ($ millions)Country with an operational national development strategy (A-F)Existence of a mutual accountability review (A-F)
Sub-Saharan Country Africa
25 35 .. .. .. 112 1 .. 35 7,671 0 3,982
84 65 1 1 66 .. 56 50 .. .. .. .. 148 94 253 157 18 .. 1,800 902 55 .. 47 72 1 .. 0.80 5.00 4,000 1,500,000 0 0 33 60 40 47 37 .. 70 87 84 74 96 86 73 63 91 81 32 46 3 24 27 42 .. .. .. .. 3 19 .. .. .. .. 0 3 37.0 ..
3.3 Yes 3 –0.9 –0.4 –0.6 –0.9 –0.6 –0.9 6.0
401 37,975 11.2 5.1 29 49 235 27,476 0 312 166 10,187 0.0 0.0 1,190 52,315 3 .. 2 ..
LDB Africa 12-2-08.indd 75 12/2/08 12:20:37 PM
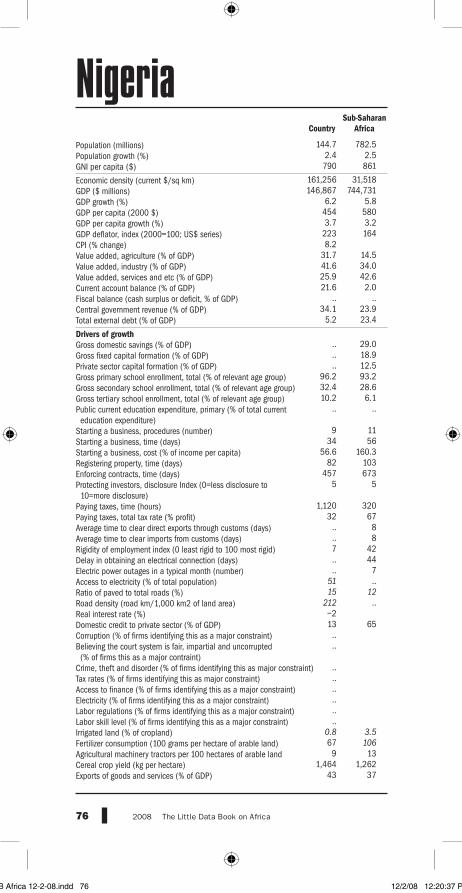
76 2008 The Little Data Book on Africa
Sub-Saharan Country Africa
Population (millions)Population growth (%)GNI per capita ($)
Economic density (current $/sq km)GDP ($ millions)GDP growth (%)GDP per capita (2000 $)GDP per capita growth (%)GDP deflator, index (2000=100; US$ series)CPI (% change)Value added, agriculture (% of GDP)Value added, industry (% of GDP)Value added, services and etc (% of GDP)Current account balance (% of GDP)Fiscal balance (cash surplus or deficit, % of GDP)Central government revenue (% of GDP)Total external debt (% of GDP)
DriversofgrowthGross domestic savings (% of GDP)Gross fixed capital formation (% of GDP)Private sector capital formation (% of GDP)Gross primary school enrollment, total (% of relevant age group)Gross secondary school enrollment, total (% of relevant age group)Gross tertiary school enrollment, total (% of relevant age group)Public current education expenditure, primary (% of total current education expenditure)Starting a business, procedures (number)Starting a business, time (days)Starting a business, cost (% of income per capita)Registering property, time (days)Enforcing contracts, time (days)Protecting investors, disclosure Index (0=less disclosure to 10=more disclosure)Paying taxes, time (hours)Paying taxes, total tax rate (% profit)Average time to clear direct exports through customs (days)Average time to clear imports from customs (days)Rigidity of employment index (0 least rigid to 100 most rigid)Delay in obtaining an electrical connection (days)Electric power outages in a typical month (number)Access to electricity (% of total population)Ratio of paved to total roads (%)Road density (road km/1,000 km2 of land area)Real interest rate (%)Domestic credit to private sector (% of GDP)Corruption (% of firms identifying this as a major constraint)Believing the court system is fair, impartial and uncorrupted (% of firms this as a major contraint)Crime, theft and disorder (% of firms identifying this as major constraint)Tax rates (% of firms identifying this as major constraint)Access to finance (% of firms identifying this as a major constraint)Electricity (% of firms identifying this as a major constraint)Labor regulations (% of firms identifying this as a major constraint)Labor skill level (% of firms identifying this as a major constraint)Irrigated land (% of cropland)Fertilizer consumption (100 grams per hectare of arable land)Agricultural machinery tractors per 100 hectares of arable landCereal crop yield (kg per hectare)Exports of goods and services (% of GDP)
Nigeria 144.7 782.5 2.4 2.5 790 861
161,256 31,518 146,867 744,731 6.2 5.8 454 580 3.7 3.2 223 164 8.2 31.7 14.5 41.6 34.0 25.9 42.6 21.6 2.0 .. .. 34.1 23.9 5.2 23.4
.. 29.0 .. 18.9 .. 12.5 96.2 93.2 32.4 28.6 10.2 6.1 .. .. 9 11 34 56 56.6 160.3 82 103 457 673 5 5 1,120 320 32 67 .. 8 .. 8 7 42 .. 44 .. 7 51 .. 15 12 212 .. –2 13 65 .. .. .. .. .. .. .. .. 0.8 3.5 67 106 9 13 1,464 1,262 43 37
LDB Africa 12-2-08.indd 76 12/2/08 12:20:37 PM

The Little Data Book on Africa 2008 77
Imports of goods and services (% of GDP)Terms of trade index (2000=100)Real effective exchange rate (2000=100)Export diversification index (%)Foreign direct investment, net inflows ($ millions)Workers remittances received ($ millions)
ParticipatingingrowthRural population (% of total population)Age dependency ratio (dependents to working-age population)Population 0–24 (% of total population)Life expectancy at birth (years)Poverty headcount ratio at national poverty line (% of population)Gini indexInfant mortality rate (per 1,000 live births)Under-five mortality rate (per 1,000)Births attended by skilled health staff (% of total)Maternal mortality ratio, modeled estimate (per 100,000 live births)Malnutrition prevalence, height for age (% of children under 5)Child immunization, measles (% of ages 12–23 months)Children sleeping under insecticide-treated bednets (% under age 5)HIV prevalence rate (% of ages 15–49)Deaths of adults and children due to AIDSPhysicians per 1,000 peoplePrimary school completion rate, total (% of relevant age group)Student-teacher ratio, primary schoolYouth literacy, total (% of ages 15–24)Ratio of girls to boys in primary and secondary schoolLabor force participation rate, total (% of ages 15 and over)Labor force participation rate, male (% of ages 15 and over)Labor force participation rate, female (% of ages 15 and over)Improved water source (% of urban population with sustainable access) Improved water source (% of rural population with sustainable access) Improved sanitation (% of urban population with sustainable access) Improved sanitation (% of rural population with sustainable access) Access to electricity (% of urban population)Access to electricity (% of rural population)Telephone subscribers, total (per 100 people)Households with own telephone (% of urban households)Households with own telephone (% of rural households)Internet users (per 100 people)Rural residents within 2 km of an all-season road (%)
CapablestatesCPIA overall rating (IDA resource allocation index, 1 low to 6 high)Country has publicly endorsed the EITI principles Corruption Perceptions Index score (0 corrupt to 10 clean)Control of corruption (–2.5 worse to 2.5 better)Voice and accountability (–2.5 worse to 2.5 better)Political stability (–2.5 worse to 2.5 better)Government effectiveness (–2.5 worse to 2.5 better)Regulatory law (–2.5 worse to 2.5 better)Rule of law (–2.5 worse to 2.5 better)Combined polity score
PartnershipNet aid ($ millions)Net aid (% of GDP)Net aid per capita from all donors ($)Net aid from DAC donors ($ millions)Net aid from non-DAC bilateral donors ($ millions)Net aid from multilateral donors ($ millions)Net aid (% of central government expenditure)Debt relief committed under HIPC Initiative ($ millions)Country with an operational national development strategy (A-F)Existence of a mutual accountability review (A-F)
Sub-Saharan Country Africa
28 35 .. .. 133 112 1 .. 2,013 7,671 0 3,982
53 65 1 1 64 .. 47 50 55 .. 44 .. 99 94 191 157 36 .. 1,100 902 43 .. 62 72 1 .. 3.10 5.00 170,000 1,500,000 0 0 76 60 37 47 84 .. 83 87 66 74 86 86 47 63 65 81 30 46 25 24 35 42 84 .. 35 .. 24 19 12 .. 2 .. 6 3 47.0 ..
3.4 Yes 2 –1.0 –0.5 –2.1 –0.9 –0.9 –1.2 4.0
11,434 37,975 7.8 5.1 79 49 10,820 27,476 2 312 613 10,187 .. 0.0 .. 52,315 3 .. 2 ..
LDB Africa 12-2-08.indd 77 12/2/08 12:20:37 PM

78 2008 The Little Data Book on Africa
Sub-Saharan Country Africa
Population (millions)Population growth (%)GNI per capita ($)
Economic density (current $/sq km)GDP ($ millions)GDP growth (%)GDP per capita (2000 $)GDP per capita growth (%)GDP deflator, index (2000=100; US$ series)CPI (% change)Value added, agriculture (% of GDP)Value added, industry (% of GDP)Value added, services and etc (% of GDP)Current account balance (% of GDP)Fiscal balance (cash surplus or deficit, % of GDP)Central government revenue (% of GDP)Total external debt (% of GDP)
DriversofgrowthGross domestic savings (% of GDP)Gross fixed capital formation (% of GDP)Private sector capital formation (% of GDP)Gross primary school enrollment, total (% of relevant age group)Gross secondary school enrollment, total (% of relevant age group)Gross tertiary school enrollment, total (% of relevant age group)Public current education expenditure, primary (% of total current education expenditure)Starting a business, procedures (number)Starting a business, time (days)Starting a business, cost (% of income per capita)Registering property, time (days)Enforcing contracts, time (days)Protecting investors, disclosure Index (0=less disclosure to 10=more disclosure)Paying taxes, time (hours)Paying taxes, total tax rate (% profit)Average time to clear direct exports through customs (days)Average time to clear imports from customs (days)Rigidity of employment index (0 least rigid to 100 most rigid)Delay in obtaining an electrical connection (days)Electric power outages in a typical month (number)Access to electricity (% of total population)Ratio of paved to total roads (%)Road density (road km/1,000 km2 of land area)Real interest rate (%)Domestic credit to private sector (% of GDP)Corruption (% of firms identifying this as a major constraint)Believing the court system is fair, impartial and uncorrupted (% of firms this as a major contraint)Crime, theft and disorder (% of firms identifying this as major constraint)Tax rates (% of firms identifying this as major constraint)Access to finance (% of firms identifying this as a major constraint)Electricity (% of firms identifying this as a major constraint)Labor regulations (% of firms identifying this as a major constraint)Labor skill level (% of firms identifying this as a major constraint)Irrigated land (% of cropland)Fertilizer consumption (100 grams per hectare of arable land)Agricultural machinery tractors per 100 hectares of arable landCereal crop yield (kg per hectare)Exports of goods and services (% of GDP)
Rwanda 9.5 782.5 2.5 2.5 280 861
116,303 31,518 2,869 744,731 5.5 5.8 263 580 2.9 3.2 115 164 8.9 41.3 14.5 13.3 34.0 45.4 42.6 –6.3 2.0 .. .. 13.2 23.9 14.6 23.4
3.2 29.0 20.3 18.9 12.8 12.5 140.0 93.2 13.4 28.6 2.6 6.1 92 .. 9 11 16 56 171.5 160.3 371 103 310 673 2 5 168 320 34 67 7 8 13 8 42 42 18 44 14 7 5 .. 19 12 568 .. 3 12 65 4 67 4 45 36 55 3 12 0.6 3.5 137 106 0 13 1,118 1,262 10 37
LDB Africa 12-2-08.indd 78 12/2/08 12:20:38 PM

The Little Data Book on Africa 2008 79
Imports of goods and services (% of GDP)Terms of trade index (2000=100)Real effective exchange rate (2000=100)Export diversification index (%)Foreign direct investment, net inflows ($ millions)Workers remittances received ($ millions)
ParticipatingingrowthRural population (% of total population)Age dependency ratio (dependents to working-age population)Population 0–24 (% of total population)Life expectancy at birth (years)Poverty headcount ratio at national poverty line (% of population)Gini indexInfant mortality rate (per 1,000 live births)Under-five mortality rate (per 1,000)Births attended by skilled health staff (% of total)Maternal mortality ratio, modeled estimate (per 100,000 live births)Malnutrition prevalence, height for age (% of children under 5)Child immunization, measles (% of ages 12–23 months)Children sleeping under insecticide-treated bednets (% under age 5)HIV prevalence rate (% of ages 15–49)Deaths of adults and children due to AIDSPhysicians per 1,000 peoplePrimary school completion rate, total (% of relevant age group)Student-teacher ratio, primary schoolYouth literacy, total (% of ages 15–24)Ratio of girls to boys in primary and secondary schoolLabor force participation rate, total (% of ages 15 and over)Labor force participation rate, male (% of ages 15 and over)Labor force participation rate, female (% of ages 15 and over)Improved water source (% of urban population with sustainable access) Improved water source (% of rural population with sustainable access) Improved sanitation (% of urban population with sustainable access) Improved sanitation (% of rural population with sustainable access) Access to electricity (% of urban population)Access to electricity (% of rural population)Telephone subscribers, total (per 100 people)Households with own telephone (% of urban households)Households with own telephone (% of rural households)Internet users (per 100 people)Rural residents within 2 km of an all-season road (%)
CapablestatesCPIA overall rating (IDA resource allocation index, 1 low to 6 high)Country has publicly endorsed the EITI principles Corruption Perceptions Index score (0 corrupt to 10 clean)Control of corruption (–2.5 worse to 2.5 better)Voice and accountability (–2.5 worse to 2.5 better)Political stability (–2.5 worse to 2.5 better)Government effectiveness (–2.5 worse to 2.5 better)Regulatory law (–2.5 worse to 2.5 better)Rule of law (–2.5 worse to 2.5 better)Combined polity score
PartnershipNet aid ($ millions)Net aid (% of GDP)Net aid per capita from all donors ($)Net aid from DAC donors ($ millions)Net aid from non-DAC bilateral donors ($ millions)Net aid from multilateral donors ($ millions)Net aid (% of central government expenditure)Debt relief committed under HIPC Initiative ($ millions)Country with an operational national development strategy (A-F)Existence of a mutual accountability review (A-F)
Sub-Saharan Country Africa
27 35 75 .. .. 112 3 .. 26 7,671 17 3,982
82 65 1 1 68 .. 46 50 60 .. 47 .. 98 94 160 157 39 .. 1,300 902 52 .. 95 72 13 .. 2.80 5.00 7,800 1,500,000 0 0 35 60 66 47 78 .. 102 87 83 74 85 86 82 63 82 81 61 46 20 24 34 42 27 .. 1 .. 3 19 6 .. 0 .. 1 3 .. ..
3.7 No 3 –0.1 –1.2 –0.2 –0.4 –0.6 –0.7 –3.0
585 37,975 20.4 5.1 62 49 321 27,476 0 312 263 10,187 0.0 0.0 1,316 52,315 2 .. 2 ..
LDB Africa 12-2-08.indd 79 12/2/08 12:20:38 PM
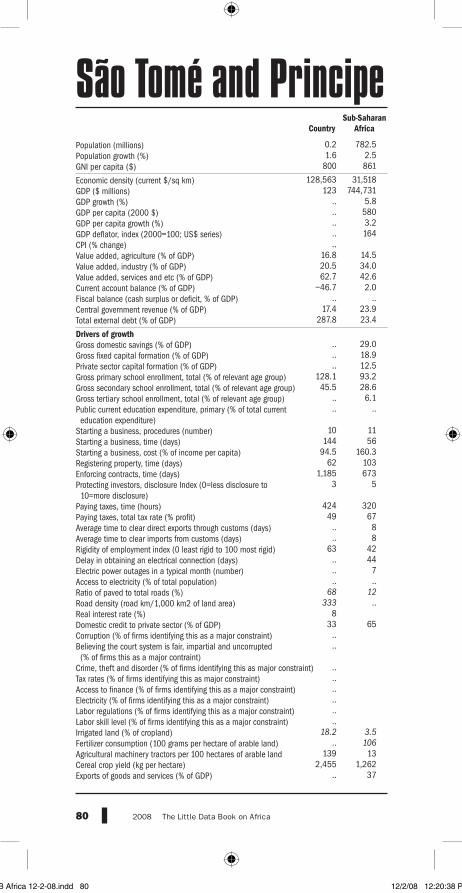
80 2008 The Little Data Book on Africa
Sub-Saharan Country Africa
Population (millions)Population growth (%)GNI per capita ($)
Economic density (current $/sq km)GDP ($ millions)GDP growth (%)GDP per capita (2000 $)GDP per capita growth (%)GDP deflator, index (2000=100; US$ series)CPI (% change)Value added, agriculture (% of GDP)Value added, industry (% of GDP)Value added, services and etc (% of GDP)Current account balance (% of GDP)Fiscal balance (cash surplus or deficit, % of GDP)Central government revenue (% of GDP)Total external debt (% of GDP)
DriversofgrowthGross domestic savings (% of GDP)Gross fixed capital formation (% of GDP)Private sector capital formation (% of GDP)Gross primary school enrollment, total (% of relevant age group)Gross secondary school enrollment, total (% of relevant age group)Gross tertiary school enrollment, total (% of relevant age group)Public current education expenditure, primary (% of total current education expenditure)Starting a business, procedures (number)Starting a business, time (days)Starting a business, cost (% of income per capita)Registering property, time (days)Enforcing contracts, time (days)Protecting investors, disclosure Index (0=less disclosure to 10=more disclosure)Paying taxes, time (hours)Paying taxes, total tax rate (% profit)Average time to clear direct exports through customs (days)Average time to clear imports from customs (days)Rigidity of employment index (0 least rigid to 100 most rigid)Delay in obtaining an electrical connection (days)Electric power outages in a typical month (number)Access to electricity (% of total population)Ratio of paved to total roads (%)Road density (road km/1,000 km2 of land area)Real interest rate (%)Domestic credit to private sector (% of GDP)Corruption (% of firms identifying this as a major constraint)Believing the court system is fair, impartial and uncorrupted (% of firms this as a major contraint)Crime, theft and disorder (% of firms identifying this as major constraint)Tax rates (% of firms identifying this as major constraint)Access to finance (% of firms identifying this as a major constraint)Electricity (% of firms identifying this as a major constraint)Labor regulations (% of firms identifying this as a major constraint)Labor skill level (% of firms identifying this as a major constraint)Irrigated land (% of cropland)Fertilizer consumption (100 grams per hectare of arable land)Agricultural machinery tractors per 100 hectares of arable landCereal crop yield (kg per hectare)Exports of goods and services (% of GDP)
São Tomé and Principe 0.2 782.5 1.6 2.5 800 861
128,563 31,518 123 744,731 .. 5.8 .. 580 .. 3.2 .. 164 .. 16.8 14.5 20.5 34.0 62.7 42.6 –46.7 2.0 .. .. 17.4 23.9 287.8 23.4
.. 29.0 .. 18.9 .. 12.5 128.1 93.2 45.5 28.6 .. 6.1 .. .. 10 11 144 56 94.5 160.3 62 103 1,185 673 3 5 424 320 49 67 .. 8 .. 8 63 42 .. 44 .. 7 .. .. 68 12 333 .. 8 33 65 .. .. .. .. .. .. .. .. 18.2 3.5 .. 106 139 13 2,455 1,262 .. 37
LDB Africa 12-2-08.indd 80 12/2/08 12:20:38 PM

The Little Data Book on Africa 2008 81
Imports of goods and services (% of GDP)Terms of trade index (2000=100)Real effective exchange rate (2000=100)Export diversification index (%)Foreign direct investment, net inflows ($ millions)Workers remittances received ($ millions)
ParticipatingingrowthRural population (% of total population)Age dependency ratio (dependents to working-age population)Population 0–24 (% of total population)Life expectancy at birth (years)Poverty headcount ratio at national poverty line (% of population)Gini indexInfant mortality rate (per 1,000 live births)Under-five mortality rate (per 1,000)Births attended by skilled health staff (% of total)Maternal mortality ratio, modeled estimate (per 100,000 live births)Malnutrition prevalence, height for age (% of children under 5)Child immunization, measles (% of ages 12–23 months)Children sleeping under insecticide-treated bednets (% under age 5)HIV prevalence rate (% of ages 15–49)Deaths of adults and children due to AIDSPhysicians per 1,000 peoplePrimary school completion rate, total (% of relevant age group)Student-teacher ratio, primary schoolYouth literacy, total (% of ages 15–24)Ratio of girls to boys in primary and secondary schoolLabor force participation rate, total (% of ages 15 and over)Labor force participation rate, male (% of ages 15 and over)Labor force participation rate, female (% of ages 15 and over)Improved water source (% of urban population with sustainable access) Improved water source (% of rural population with sustainable access) Improved sanitation (% of urban population with sustainable access) Improved sanitation (% of rural population with sustainable access) Access to electricity (% of urban population)Access to electricity (% of rural population)Telephone subscribers, total (per 100 people)Households with own telephone (% of urban households)Households with own telephone (% of rural households)Internet users (per 100 people)Rural residents within 2 km of an all-season road (%)
CapablestatesCPIA overall rating (IDA resource allocation index, 1 low to 6 high)Country has publicly endorsed the EITI principles Corruption Perceptions Index score (0 corrupt to 10 clean)Control of corruption (–2.5 worse to 2.5 better)Voice and accountability (–2.5 worse to 2.5 better)Political stability (–2.5 worse to 2.5 better)Government effectiveness (–2.5 worse to 2.5 better)Regulatory law (–2.5 worse to 2.5 better)Rule of law (–2.5 worse to 2.5 better)Combined polity score
PartnershipNet aid ($ millions)Net aid (% of GDP)Net aid per capita from all donors ($)Net aid from DAC donors ($ millions)Net aid from non-DAC bilateral donors ($ millions)Net aid from multilateral donors ($ millions)Net aid (% of central government expenditure)Debt relief committed under HIPC Initiative ($ millions)Country with an operational national development strategy (A-F)Existence of a mutual accountability review (A-F)
Sub-Saharan Country Africa
.. 35 .. .. .. 112 4 .. 34 7,671 2 3,982
41 65 1 1 64 .. 65 50 .. .. .. .. 63 94 96 157 81 .. .. 902 35 .. 85 72 50 .. .. 5.00 .. 1,500,000 0 0 74 60 31 47 95 .. 99 87 54 74 77 86 31 63 88 81 83 46 18 24 29 42 .. .. .. .. 17 19 .. .. .. .. 14 3 .. ..
3.0 Yes 3 –0.5 0.4 0.3 –0.8 –0.8 –0.4 ..
22 37,975 17.5 5.1 139 49 18 27,476 0 312 3 10,187 .. 0.0 200 52,315 .. .. .. ..
LDB Africa 12-2-08.indd 81 12/2/08 12:20:39 PM

82 2008 The Little Data Book on Africa
Sub-Saharan Country Africa
Population (millions)Population growth (%)GNI per capita ($)
Economic density (current $/sq km)GDP ($ millions)GDP growth (%)GDP per capita (2000 $)GDP per capita growth (%)GDP deflator, index (2000=100; US$ series)CPI (% change)Value added, agriculture (% of GDP)Value added, industry (% of GDP)Value added, services and etc (% of GDP)Current account balance (% of GDP)Fiscal balance (cash surplus or deficit, % of GDP)Central government revenue (% of GDP)Total external debt (% of GDP)
DriversofgrowthGross domestic savings (% of GDP)Gross fixed capital formation (% of GDP)Private sector capital formation (% of GDP)Gross primary school enrollment, total (% of relevant age group)Gross secondary school enrollment, total (% of relevant age group)Gross tertiary school enrollment, total (% of relevant age group)Public current education expenditure, primary (% of total current education expenditure)Starting a business, procedures (number)Starting a business, time (days)Starting a business, cost (% of income per capita)Registering property, time (days)Enforcing contracts, time (days)Protecting investors, disclosure Index (0=less disclosure to 10=more disclosure)Paying taxes, time (hours)Paying taxes, total tax rate (% profit)Average time to clear direct exports through customs (days)Average time to clear imports from customs (days)Rigidity of employment index (0 least rigid to 100 most rigid)Delay in obtaining an electrical connection (days)Electric power outages in a typical month (number)Access to electricity (% of total population)Ratio of paved to total roads (%)Road density (road km/1,000 km2 of land area)Real interest rate (%)Domestic credit to private sector (% of GDP)Corruption (% of firms identifying this as a major constraint)Believing the court system is fair, impartial and uncorrupted (% of firms this as a major contraint)Crime, theft and disorder (% of firms identifying this as major constraint)Tax rates (% of firms identifying this as major constraint)Access to finance (% of firms identifying this as a major constraint)Electricity (% of firms identifying this as a major constraint)Labor regulations (% of firms identifying this as a major constraint)Labor skill level (% of firms identifying this as a major constraint)Irrigated land (% of cropland)Fertilizer consumption (100 grams per hectare of arable land)Agricultural machinery tractors per 100 hectares of arable landCereal crop yield (kg per hectare)Exports of goods and services (% of GDP)
Senegal 12.1 782.5 2.6 2.5 760 861
48,141 31,518 9,269 744,731 2.3 5.8 499 580 –0.2 3.2 154 164 2.1 13.6 14.5 19.7 34.0 53.1 42.6 –6.4 2.0 –2.1 .. 20.2 23.9 21.4 23.4
10.5 29.0 28.9 18.9 19.1 12.5 79.8 93.2 23.8 28.6 5.5 6.1 83 .. 10 11 58 56 107.0 160.3 145 103 780 673 6 5 696 320 46 67 7 8 9 8 61 42 9 44 12 7 46 .. 29 12 71 .. .. 23 65 24 55 12 41 49 58 5 10 4.8 3.5 254 106 3 13 879 1,262 25 37
LDB Africa 12-2-08.indd 82 12/2/08 12:20:39 PM

The Little Data Book on Africa 2008 83
Imports of goods and services (% of GDP)Terms of trade index (2000=100)Real effective exchange rate (2000=100)Export diversification index (%)Foreign direct investment, net inflows ($ millions)Workers remittances received ($ millions)
ParticipatingingrowthRural population (% of total population)Age dependency ratio (dependents to working-age population)Population 0–24 (% of total population)Life expectancy at birth (years)Poverty headcount ratio at national poverty line (% of population)Gini indexInfant mortality rate (per 1,000 live births)Under-five mortality rate (per 1,000)Births attended by skilled health staff (% of total)Maternal mortality ratio, modeled estimate (per 100,000 live births)Malnutrition prevalence, height for age (% of children under 5)Child immunization, measles (% of ages 12–23 months)Children sleeping under insecticide-treated bednets (% under age 5)HIV prevalence rate (% of ages 15–49)Deaths of adults and children due to AIDSPhysicians per 1,000 peoplePrimary school completion rate, total (% of relevant age group)Student-teacher ratio, primary schoolYouth literacy, total (% of ages 15–24)Ratio of girls to boys in primary and secondary schoolLabor force participation rate, total (% of ages 15 and over)Labor force participation rate, male (% of ages 15 and over)Labor force participation rate, female (% of ages 15 and over)Improved water source (% of urban population with sustainable access) Improved water source (% of rural population with sustainable access) Improved sanitation (% of urban population with sustainable access) Improved sanitation (% of rural population with sustainable access) Access to electricity (% of urban population)Access to electricity (% of rural population)Telephone subscribers, total (per 100 people)Households with own telephone (% of urban households)Households with own telephone (% of rural households)Internet users (per 100 people)Rural residents within 2 km of an all-season road (%)
CapablestatesCPIA overall rating (IDA resource allocation index, 1 low to 6 high)Country has publicly endorsed the EITI principles Corruption Perceptions Index score (0 corrupt to 10 clean)Control of corruption (–2.5 worse to 2.5 better)Voice and accountability (–2.5 worse to 2.5 better)Political stability (–2.5 worse to 2.5 better)Government effectiveness (–2.5 worse to 2.5 better)Regulatory law (–2.5 worse to 2.5 better)Rule of law (–2.5 worse to 2.5 better)Combined polity score
PartnershipNet aid ($ millions)Net aid (% of GDP)Net aid per capita from all donors ($)Net aid from DAC donors ($ millions)Net aid from non-DAC bilateral donors ($ millions)Net aid from multilateral donors ($ millions)Net aid (% of central government expenditure)Debt relief committed under HIPC Initiative ($ millions)Country with an operational national development strategy (A-F)Existence of a mutual accountability review (A-F)
Sub-Saharan Country Africa
44 35 95 .. .. 112 26 .. 64 7,671 0 3,982
58 65 1 1 63 .. 63 50 .. .. 41 .. 60 94 116 157 52 .. 980 902 20 .. 80 72 7 .. 1.00 5.00 1,800 1,500,000 0 0 49 60 39 47 49 .. 92 87 71 74 83 86 58 63 93 81 65 46 9 24 54 42 82 .. 19 .. 27 19 36 .. 7 .. 5 3 .. ..
3.7 No 4 –0.5 0.0 –0.2 –0.3 –0.4 –0.4 8.0
825 37,975 8.9 5.1 68 49 509 27,476 12 312 304 10,187 0.0 0.0 850 52,315 3 .. 2 ..
LDB Africa 12-2-08.indd 83 12/2/08 12:20:39 PM

84 2008 The Little Data Book on Africa
Sub-Saharan Country Africa
Population (millions)Population growth (%)GNI per capita ($)
Economic density (current $/sq km)GDP ($ millions)GDP growth (%)GDP per capita (2000 $)GDP per capita growth (%)GDP deflator, index (2000=100; US$ series)CPI (% change)Value added, agriculture (% of GDP)Value added, industry (% of GDP)Value added, services and etc (% of GDP)Current account balance (% of GDP)Fiscal balance (cash surplus or deficit, % of GDP)Central government revenue (% of GDP)Total external debt (% of GDP)
DriversofgrowthGross domestic savings (% of GDP)Gross fixed capital formation (% of GDP)Private sector capital formation (% of GDP)Gross primary school enrollment, total (% of relevant age group)Gross secondary school enrollment, total (% of relevant age group)Gross tertiary school enrollment, total (% of relevant age group)Public current education expenditure, primary (% of total current education expenditure)Starting a business, procedures (number)Starting a business, time (days)Starting a business, cost (% of income per capita)Registering property, time (days)Enforcing contracts, time (days)Protecting investors, disclosure Index (0=less disclosure to 10=more disclosure)Paying taxes, time (hours)Paying taxes, total tax rate (% profit)Average time to clear direct exports through customs (days)Average time to clear imports from customs (days)Rigidity of employment index (0 least rigid to 100 most rigid)Delay in obtaining an electrical connection (days)Electric power outages in a typical month (number)Access to electricity (% of total population)Ratio of paved to total roads (%)Road density (road km/1,000 km2 of land area)Real interest rate (%)Domestic credit to private sector (% of GDP)Corruption (% of firms identifying this as a major constraint)Believing the court system is fair, impartial and uncorrupted (% of firms this as a major contraint)Crime, theft and disorder (% of firms identifying this as major constraint)Tax rates (% of firms identifying this as major constraint)Access to finance (% of firms identifying this as a major constraint)Electricity (% of firms identifying this as a major constraint)Labor regulations (% of firms identifying this as a major constraint)Labor skill level (% of firms identifying this as a major constraint)Irrigated land (% of cropland)Fertilizer consumption (100 grams per hectare of arable land)Agricultural machinery tractors per 100 hectares of arable landCereal crop yield (kg per hectare)Exports of goods and services (% of GDP)
Seychelles 0.1 782.5 2.1 2.5 8,870 861
1,684,323 31,518 775 744,731 5.3 5.8 7,005 580 3.2 3.2 131 164 –0.3 3.0 14.5 25.5 34.0 71.5 42.6 –21.2 2.0 –2.6 .. 52.5 23.9 116.8 23.4
10.2 29.0 32.7 18.9 22.6 12.5 115.6 93.2 105.4 28.6 .. 6.1 93 .. 9 11 38 56 8.7 160.3 33 103 720 673 4 5 76 320 48 67 .. 8 .. 8 34 42 .. 44 .. 7 .. .. 96 12 996 .. 8 37 65 .. .. .. .. .. .. .. .. .. 3.5 170 106 400 13 .. 1,262 111 37
LDB Africa 12-2-08.indd 84 12/2/08 12:20:39 PM

The Little Data Book on Africa 2008 85
Imports of goods and services (% of GDP)Terms of trade index (2000=100)Real effective exchange rate (2000=100)Export diversification index (%)Foreign direct investment, net inflows ($ millions)Workers remittances received ($ millions)
ParticipatingingrowthRural population (% of total population)Age dependency ratio (dependents to working-age population)Population 0–24 (% of total population)Life expectancy at birth (years)Poverty headcount ratio at national poverty line (% of population)Gini indexInfant mortality rate (per 1,000 live births)Under-five mortality rate (per 1,000)Births attended by skilled health staff (% of total)Maternal mortality ratio, modeled estimate (per 100,000 live births)Malnutrition prevalence, height for age (% of children under 5)Child immunization, measles (% of ages 12–23 months)Children sleeping under insecticide-treated bednets (% under age 5)HIV prevalence rate (% of ages 15–49)Deaths of adults and children due to AIDSPhysicians per 1,000 peoplePrimary school completion rate, total (% of relevant age group)Student-teacher ratio, primary schoolYouth literacy, total (% of ages 15–24)Ratio of girls to boys in primary and secondary schoolLabor force participation rate, total (% of ages 15 and over)Labor force participation rate, male (% of ages 15 and over)Labor force participation rate, female (% of ages 15 and over)Improved water source (% of urban population with sustainable access) Improved water source (% of rural population with sustainable access) Improved sanitation (% of urban population with sustainable access) Improved sanitation (% of rural population with sustainable access) Access to electricity (% of urban population)Access to electricity (% of rural population)Telephone subscribers, total (per 100 people)Households with own telephone (% of urban households)Households with own telephone (% of rural households)Internet users (per 100 people)Rural residents within 2 km of an all-season road (%)
CapablestatesCPIA overall rating (IDA resource allocation index, 1 low to 6 high)Country has publicly endorsed the EITI principles Corruption Perceptions Index score (0 corrupt to 10 clean)Control of corruption (–2.5 worse to 2.5 better)Voice and accountability (–2.5 worse to 2.5 better)Political stability (–2.5 worse to 2.5 better)Government effectiveness (–2.5 worse to 2.5 better)Regulatory law (–2.5 worse to 2.5 better)Rule of law (–2.5 worse to 2.5 better)Combined polity score
PartnershipNet aid ($ millions)Net aid (% of GDP)Net aid per capita from all donors ($)Net aid from DAC donors ($ millions)Net aid from non-DAC bilateral donors ($ millions)Net aid from multilateral donors ($ millions)Net aid (% of central government expenditure)Debt relief committed under HIPC Initiative ($ millions)Country with an operational national development strategy (A-F)Existence of a mutual accountability review (A-F)
Sub-Saharan Country Africa
133 35 100 .. .. 112 4 .. 138 7,671 14 3,982
47 65 .. 1 .. .. 72 50 .. .. .. .. 12 94 13 157 .. .. .. 902 .. .. 99 72 .. .. .. 5.00 .. 1,500,000 2 0 115 60 14 47 99 .. 100 87 .. 74 .. 86 .. 63 100 81 75 46 100 24 .. 42 .. .. .. .. 108 19 .. .. .. .. 34 3 .. ..
.. No 5 0.0 –0.1 1.0 0.0 –0.6 0.2 ..
14 37,975 1.8 5.1 165 49 7 27,476 –1 312 7 10,187 0.0 0.0 .. 52,315 .. .. .. ..
LDB Africa 12-2-08.indd 85 12/2/08 12:20:40 PM

86 2008 The Little Data Book on Africa
Sub-Saharan Country Africa
Population (millions)Population growth (%)GNI per capita ($)
Economic density (current $/sq km)GDP ($ millions)GDP growth (%)GDP per capita (2000 $)GDP per capita growth (%)GDP deflator, index (2000=100; US$ series)CPI (% change)Value added, agriculture (% of GDP)Value added, industry (% of GDP)Value added, services and etc (% of GDP)Current account balance (% of GDP)Fiscal balance (cash surplus or deficit, % of GDP)Central government revenue (% of GDP)Total external debt (% of GDP)
DriversofgrowthGross domestic savings (% of GDP)Gross fixed capital formation (% of GDP)Private sector capital formation (% of GDP)Gross primary school enrollment, total (% of relevant age group)Gross secondary school enrollment, total (% of relevant age group)Gross tertiary school enrollment, total (% of relevant age group)Public current education expenditure, primary (% of total current education expenditure)Starting a business, procedures (number)Starting a business, time (days)Starting a business, cost (% of income per capita)Registering property, time (days)Enforcing contracts, time (days)Protecting investors, disclosure Index (0=less disclosure to 10=more disclosure)Paying taxes, time (hours)Paying taxes, total tax rate (% profit)Average time to clear direct exports through customs (days)Average time to clear imports from customs (days)Rigidity of employment index (0 least rigid to 100 most rigid)Delay in obtaining an electrical connection (days)Electric power outages in a typical month (number)Access to electricity (% of total population)Ratio of paved to total roads (%)Road density (road km/1,000 km2 of land area)Real interest rate (%)Domestic credit to private sector (% of GDP)Corruption (% of firms identifying this as a major constraint)Believing the court system is fair, impartial and uncorrupted (% of firms this as a major contraint)Crime, theft and disorder (% of firms identifying this as major constraint)Tax rates (% of firms identifying this as major constraint)Access to finance (% of firms identifying this as a major constraint)Electricity (% of firms identifying this as a major constraint)Labor regulations (% of firms identifying this as a major constraint)Labor skill level (% of firms identifying this as a major constraint)Irrigated land (% of cropland)Fertilizer consumption (100 grams per hectare of arable land)Agricultural machinery tractors per 100 hectares of arable landCereal crop yield (kg per hectare)Exports of goods and services (% of GDP)
Sierra Leone 5.7 782.5 2.8 2.5 230 861
19,830 31,518 1,420 744,731 7.4 5.8 225 580 4.4 3.2 110 164 9.5 45.1 14.5 24.3 34.0 25.8 42.6 –7.1 2.0 –2.5 .. 13.2 23.9 100.5 23.4
1.7 29.0 15.5 18.9 10.4 12.5 79.4 93.2 26.1 28.6 2.1 6.1 99 .. 9 11 26 56 1,075.2 160.3 235 103 515 673 3 5 399 320 234 67 .. 8 .. 8 51 42 .. 44 .. 7 .. .. 8 12 158 .. 11 4 65 .. .. .. .. .. .. .. .. 4.7 3.5 6 106 2 13 1,485 1,262 23 37
LDB Africa 12-2-08.indd 86 12/2/08 12:20:40 PM

The Little Data Book on Africa 2008 87
Imports of goods and services (% of GDP)Terms of trade index (2000=100)Real effective exchange rate (2000=100)Export diversification index (%)Foreign direct investment, net inflows ($ millions)Workers remittances received ($ millions)
ParticipatingingrowthRural population (% of total population)Age dependency ratio (dependents to working-age population)Population 0–24 (% of total population)Life expectancy at birth (years)Poverty headcount ratio at national poverty line (% of population)Gini indexInfant mortality rate (per 1,000 live births)Under-five mortality rate (per 1,000)Births attended by skilled health staff (% of total)Maternal mortality ratio, modeled estimate (per 100,000 live births)Malnutrition prevalence, height for age (% of children under 5)Child immunization, measles (% of ages 12–23 months)Children sleeping under insecticide-treated bednets (% under age 5)HIV prevalence rate (% of ages 15–49)Deaths of adults and children due to AIDSPhysicians per 1,000 peoplePrimary school completion rate, total (% of relevant age group)Student-teacher ratio, primary schoolYouth literacy, total (% of ages 15–24)Ratio of girls to boys in primary and secondary schoolLabor force participation rate, total (% of ages 15 and over)Labor force participation rate, male (% of ages 15 and over)Labor force participation rate, female (% of ages 15 and over)Improved water source (% of urban population with sustainable access) Improved water source (% of rural population with sustainable access) Improved sanitation (% of urban population with sustainable access) Improved sanitation (% of rural population with sustainable access) Access to electricity (% of urban population)Access to electricity (% of rural population)Telephone subscribers, total (per 100 people)Households with own telephone (% of urban households)Households with own telephone (% of rural households)Internet users (per 100 people)Rural residents within 2 km of an all-season road (%)
CapablestatesCPIA overall rating (IDA resource allocation index, 1 low to 6 high)Country has publicly endorsed the EITI principles Corruption Perceptions Index score (0 corrupt to 10 clean)Control of corruption (–2.5 worse to 2.5 better)Voice and accountability (–2.5 worse to 2.5 better)Political stability (–2.5 worse to 2.5 better)Government effectiveness (–2.5 worse to 2.5 better)Regulatory law (–2.5 worse to 2.5 better)Rule of law (–2.5 worse to 2.5 better)Combined polity score
PartnershipNet aid ($ millions)Net aid (% of GDP)Net aid per capita from all donors ($)Net aid from DAC donors ($ millions)Net aid from non-DAC bilateral donors ($ millions)Net aid from multilateral donors ($ millions)Net aid (% of central government expenditure)Debt relief committed under HIPC Initiative ($ millions)Country with an operational national development strategy (A-F)Existence of a mutual accountability review (A-F)
Sub-Saharan Country Africa
37 35 .. .. 73 112 5 .. 59 7,671 30 3,982
63 65 1 1 62 .. 42 50 66 .. 37 .. 159 94 270 157 43 .. 2,100 902 38 .. 67 72 5 .. 1.70 5.00 3,300 1,500,000 0 0 .. 60 37 47 48 .. 71 87 76 74 95 86 59 63 83 81 32 46 5 24 20 42 .. .. .. .. 2 19 .. .. .. .. 0 3 .. ..
3.1 Yes 2 –1.0 –0.3 –0.3 –1.1 –1.0 –1.1 5.0
364 37,975 25.6 5.1 63 49 199 27,476 0 312 164 10,187 0.0 0.0 950 52,315 3 .. 2 ..
LDB Africa 12-2-08.indd 87 12/2/08 12:20:40 PM

88 2008 The Little Data Book on Africa
Sub-Saharan Country Africa
Population (millions)Population growth (%)GNI per capita ($)
Economic density (current $/sq km)GDP ($ millions)GDP growth (%)GDP per capita (2000 $)GDP per capita growth (%)GDP deflator, index (2000=100; US$ series)CPI (% change)Value added, agriculture (% of GDP)Value added, industry (% of GDP)Value added, services and etc (% of GDP)Current account balance (% of GDP)Fiscal balance (cash surplus or deficit, % of GDP)Central government revenue (% of GDP)Total external debt (% of GDP)
DriversofgrowthGross domestic savings (% of GDP)Gross fixed capital formation (% of GDP)Private sector capital formation (% of GDP)Gross primary school enrollment, total (% of relevant age group)Gross secondary school enrollment, total (% of relevant age group)Gross tertiary school enrollment, total (% of relevant age group)Public current education expenditure, primary (% of total current education expenditure)Starting a business, procedures (number)Starting a business, time (days)Starting a business, cost (% of income per capita)Registering property, time (days)Enforcing contracts, time (days)Protecting investors, disclosure Index (0=less disclosure to 10=more disclosure)Paying taxes, time (hours)Paying taxes, total tax rate (% profit)Average time to clear direct exports through customs (days)Average time to clear imports from customs (days)Rigidity of employment index (0 least rigid to 100 most rigid)Delay in obtaining an electrical connection (days)Electric power outages in a typical month (number)Access to electricity (% of total population)Ratio of paved to total roads (%)Road density (road km/1,000 km2 of land area)Real interest rate (%)Domestic credit to private sector (% of GDP)Corruption (% of firms identifying this as a major constraint)Believing the court system is fair, impartial and uncorrupted (% of firms this as a major contraint)Crime, theft and disorder (% of firms identifying this as major constraint)Tax rates (% of firms identifying this as major constraint)Access to finance (% of firms identifying this as a major constraint)Electricity (% of firms identifying this as a major constraint)Labor regulations (% of firms identifying this as a major constraint)Labor skill level (% of firms identifying this as a major constraint)Irrigated land (% of cropland)Fertilizer consumption (100 grams per hectare of arable land)Agricultural machinery tractors per 100 hectares of arable landCereal crop yield (kg per hectare)Exports of goods and services (% of GDP)
Somalia 8.4 782.5 3.0 2.5 .. 861
.. 31,518 .. 744,731 .. 5.8 .. 580 .. 3.2 .. 164 .. .. 14.5 .. 34.0 .. 42.6 .. 2.0 .. .. .. 23.9 .. 23.4
.. 29.0 .. 18.9 .. 12.5 .. 93.2 .. 28.6 .. 6.1 .. .. .. 11 .. 56 .. 160.3 .. 103 .. 673 .. 5 .. 320 .. 67 .. 8 .. 8 .. 42 .. 44 .. 7 .. .. 12 12 35 .. .. .. 65 .. .. .. .. .. .. .. .. 15.7 3.5 4 106 10 13 589 1,262 .. 37
LDB Africa 12-2-08.indd 88 12/2/08 12:20:40 PM

The Little Data Book on Africa 2008 89
Imports of goods and services (% of GDP)Terms of trade index (2000=100)Real effective exchange rate (2000=100)Export diversification index (%)Foreign direct investment, net inflows ($ millions)Workers remittances received ($ millions)
ParticipatingingrowthRural population (% of total population)Age dependency ratio (dependents to working-age population)Population 0–24 (% of total population)Life expectancy at birth (years)Poverty headcount ratio at national poverty line (% of population)Gini indexInfant mortality rate (per 1,000 live births)Under-five mortality rate (per 1,000)Births attended by skilled health staff (% of total)Maternal mortality ratio, modeled estimate (per 100,000 live births)Malnutrition prevalence, height for age (% of children under 5)Child immunization, measles (% of ages 12–23 months)Children sleeping under insecticide-treated bednets (% under age 5)HIV prevalence rate (% of ages 15–49)Deaths of adults and children due to AIDSPhysicians per 1,000 peoplePrimary school completion rate, total (% of relevant age group)Student-teacher ratio, primary schoolYouth literacy, total (% of ages 15–24)Ratio of girls to boys in primary and secondary schoolLabor force participation rate, total (% of ages 15 and over)Labor force participation rate, male (% of ages 15 and over)Labor force participation rate, female (% of ages 15 and over)Improved water source (% of urban population with sustainable access) Improved water source (% of rural population with sustainable access) Improved sanitation (% of urban population with sustainable access) Improved sanitation (% of rural population with sustainable access) Access to electricity (% of urban population)Access to electricity (% of rural population)Telephone subscribers, total (per 100 people)Households with own telephone (% of urban households)Households with own telephone (% of rural households)Internet users (per 100 people)Rural residents within 2 km of an all-season road (%)
CapablestatesCPIA overall rating (IDA resource allocation index, 1 low to 6 high)Country has publicly endorsed the EITI principles Corruption Perceptions Index score (0 corrupt to 10 clean)Control of corruption (–2.5 worse to 2.5 better)Voice and accountability (–2.5 worse to 2.5 better)Political stability (–2.5 worse to 2.5 better)Government effectiveness (–2.5 worse to 2.5 better)Regulatory law (–2.5 worse to 2.5 better)Rule of law (–2.5 worse to 2.5 better)Combined polity score
PartnershipNet aid ($ millions)Net aid (% of GDP)Net aid per capita from all donors ($)Net aid from DAC donors ($ millions)Net aid from non-DAC bilateral donors ($ millions)Net aid from multilateral donors ($ millions)Net aid (% of central government expenditure)Debt relief committed under HIPC Initiative ($ millions)Country with an operational national development strategy (A-F)Existence of a mutual accountability review (A-F)
Sub-Saharan Country Africa
.. 35 .. .. .. 112 9 .. .. 7,671 0 3,982
64 65 1 1 63 .. 48 50 .. .. .. .. 90 94 145 157 33 .. 1,400 902 42 .. 35 72 .. .. 0.50 5.00 1,600 1,500,000 0 0 .. 60 .. 47 .. .. 55 87 78 74 95 86 61 63 63 81 10 46 7 24 51 42 .. .. .. .. 8 19 .. .. .. .. 1 3 .. ..
.. No 1 –1.9 –1.9 –3.0 –2.4 –2.7 –2.6 ..
392 37,975 .. 5.1 46 49 263 27,476 3 312 125 10,187 .. 0.0 .. 52,315 .. .. .. ..
LDB Africa 12-2-08.indd 89 12/2/08 12:20:41 PM

90 2008 The Little Data Book on Africa
Sub-Saharan Country Africa
Population (millions)Population growth (%)GNI per capita ($)
Economic density (current $/sq km)GDP ($ millions)GDP growth (%)GDP per capita (2000 $)GDP per capita growth (%)GDP deflator, index (2000=100; US$ series)CPI (% change)Value added, agriculture (% of GDP)Value added, industry (% of GDP)Value added, services and etc (% of GDP)Current account balance (% of GDP)Fiscal balance (cash surplus or deficit, % of GDP)Central government revenue (% of GDP)Total external debt (% of GDP)
DriversofgrowthGross domestic savings (% of GDP)Gross fixed capital formation (% of GDP)Private sector capital formation (% of GDP)Gross primary school enrollment, total (% of relevant age group)Gross secondary school enrollment, total (% of relevant age group)Gross tertiary school enrollment, total (% of relevant age group)Public current education expenditure, primary (% of total current education expenditure)Starting a business, procedures (number)Starting a business, time (days)Starting a business, cost (% of income per capita)Registering property, time (days)Enforcing contracts, time (days)Protecting investors, disclosure Index (0=less disclosure to 10=more disclosure)Paying taxes, time (hours)Paying taxes, total tax rate (% profit)Average time to clear direct exports through customs (days)Average time to clear imports from customs (days)Rigidity of employment index (0 least rigid to 100 most rigid)Delay in obtaining an electrical connection (days)Electric power outages in a typical month (number)Access to electricity (% of total population)Ratio of paved to total roads (%)Road density (road km/1,000 km2 of land area)Real interest rate (%)Domestic credit to private sector (% of GDP)Corruption (% of firms identifying this as a major constraint)Believing the court system is fair, impartial and uncorrupted (% of firms this as a major contraint)Crime, theft and disorder (% of firms identifying this as major constraint)Tax rates (% of firms identifying this as major constraint)Access to finance (% of firms identifying this as a major constraint)Electricity (% of firms identifying this as a major constraint)Labor regulations (% of firms identifying this as a major constraint)Labor skill level (% of firms identifying this as a major constraint)Irrigated land (% of cropland)Fertilizer consumption (100 grams per hectare of arable land)Agricultural machinery tractors per 100 hectares of arable landCereal crop yield (kg per hectare)Exports of goods and services (% of GDP)
South Africa 47.4 782.5 1.1 2.5 5,390 861
209,963 31,518 254,993 744,731 5.0 5.8 3,562 580 3.9 3.2 151 164 4.6 2.4 14.5 27.3 34.0 58.9 42.6 –6.5 2.0 1.2 .. 26.9 23.9 13.9 23.4
17.1 29.0 20.5 18.9 15.8 12.5 105.5 93.2 94.7 28.6 15.4 6.1 97 .. 8 11 31 56 7.1 160.3 24 103 600 673 8 5 350 320 37 67 4 8 6 8 42 42 7 44 .. 7 .. .. 17 12 300 .. 4 161 65 16 .. 29 19 13 9 33 35 9.5 3.5 451 106 43 13 3,143 1,262 30 37
LDB Africa 12-2-08.indd 90 12/2/08 12:20:41 PM

The Little Data Book on Africa 2008 91
Imports of goods and services (% of GDP)Terms of trade index (2000=100)Real effective exchange rate (2000=100)Export diversification index (%)Foreign direct investment, net inflows ($ millions)Workers remittances received ($ millions)
ParticipatingingrowthRural population (% of total population)Age dependency ratio (dependents to working-age population)Population 0–24 (% of total population)Life expectancy at birth (years)Poverty headcount ratio at national poverty line (% of population)Gini indexInfant mortality rate (per 1,000 live births)Under-five mortality rate (per 1,000)Births attended by skilled health staff (% of total)Maternal mortality ratio, modeled estimate (per 100,000 live births)Malnutrition prevalence, height for age (% of children under 5)Child immunization, measles (% of ages 12–23 months)Children sleeping under insecticide-treated bednets (% under age 5)HIV prevalence rate (% of ages 15–49)Deaths of adults and children due to AIDSPhysicians per 1,000 peoplePrimary school completion rate, total (% of relevant age group)Student-teacher ratio, primary schoolYouth literacy, total (% of ages 15–24)Ratio of girls to boys in primary and secondary schoolLabor force participation rate, total (% of ages 15 and over)Labor force participation rate, male (% of ages 15 and over)Labor force participation rate, female (% of ages 15 and over)Improved water source (% of urban population with sustainable access) Improved water source (% of rural population with sustainable access) Improved sanitation (% of urban population with sustainable access) Improved sanitation (% of rural population with sustainable access) Access to electricity (% of urban population)Access to electricity (% of rural population)Telephone subscribers, total (per 100 people)Households with own telephone (% of urban households)Households with own telephone (% of rural households)Internet users (per 100 people)Rural residents within 2 km of an all-season road (%)
CapablestatesCPIA overall rating (IDA resource allocation index, 1 low to 6 high)Country has publicly endorsed the EITI principles Corruption Perceptions Index score (0 corrupt to 10 clean)Control of corruption (–2.5 worse to 2.5 better)Voice and accountability (–2.5 worse to 2.5 better)Political stability (–2.5 worse to 2.5 better)Government effectiveness (–2.5 worse to 2.5 better)Regulatory law (–2.5 worse to 2.5 better)Rule of law (–2.5 worse to 2.5 better)Combined polity score
PartnershipNet aid ($ millions)Net aid (% of GDP)Net aid per capita from all donors ($)Net aid from DAC donors ($ millions)Net aid from non-DAC bilateral donors ($ millions)Net aid from multilateral donors ($ millions)Net aid (% of central government expenditure)Debt relief committed under HIPC Initiative ($ millions)Country with an operational national development strategy (A-F)Existence of a mutual accountability review (A-F)
Sub-Saharan Country Africa
33 35 113 .. 104 112 38 .. –6,719 7,671 0 3,982
40 65 1 1 52 .. 51 50 .. .. 58 .. 56 94 69 157 92 .. 400 902 .. .. 85 72 .. .. 18.10 5.00 350,000 1,500,000 1 0 100 60 36 47 .. .. 100 87 66 74 82 86 49 63 100 81 82 46 49 24 66 42 .. .. .. .. 94 19 .. .. .. .. 8 3 .. ..
.. No 5 0.3 0.7 0.2 0.7 0.5 0.2 9.0
718 37,975 0.3 5.1 15 49 561 27,476 1 312 157 10,187 0.0 0.0 .. 52,315 .. .. 1 ..
LDB Africa 12-2-08.indd 91 12/2/08 12:20:41 PM

92 2008 The Little Data Book on Africa
Sub-Saharan Country Africa
Population (millions)Population growth (%)GNI per capita ($)
Economic density (current $/sq km)GDP ($ millions)GDP growth (%)GDP per capita (2000 $)GDP per capita growth (%)GDP deflator, index (2000=100; US$ series)CPI (% change)Value added, agriculture (% of GDP)Value added, industry (% of GDP)Value added, services and etc (% of GDP)Current account balance (% of GDP)Fiscal balance (cash surplus or deficit, % of GDP)Central government revenue (% of GDP)Total external debt (% of GDP)
DriversofgrowthGross domestic savings (% of GDP)Gross fixed capital formation (% of GDP)Private sector capital formation (% of GDP)Gross primary school enrollment, total (% of relevant age group)Gross secondary school enrollment, total (% of relevant age group)Gross tertiary school enrollment, total (% of relevant age group)Public current education expenditure, primary (% of total current education expenditure)Starting a business, procedures (number)Starting a business, time (days)Starting a business, cost (% of income per capita)Registering property, time (days)Enforcing contracts, time (days)Protecting investors, disclosure Index (0=less disclosure to 10=more disclosure)Paying taxes, time (hours)Paying taxes, total tax rate (% profit)Average time to clear direct exports through customs (days)Average time to clear imports from customs (days)Rigidity of employment index (0 least rigid to 100 most rigid)Delay in obtaining an electrical connection (days)Electric power outages in a typical month (number)Access to electricity (% of total population)Ratio of paved to total roads (%)Road density (road km/1,000 km2 of land area)Real interest rate (%)Domestic credit to private sector (% of GDP)Corruption (% of firms identifying this as a major constraint)Believing the court system is fair, impartial and uncorrupted (% of firms this as a major contraint)Crime, theft and disorder (% of firms identifying this as major constraint)Tax rates (% of firms identifying this as major constraint)Access to finance (% of firms identifying this as a major constraint)Electricity (% of firms identifying this as a major constraint)Labor regulations (% of firms identifying this as a major constraint)Labor skill level (% of firms identifying this as a major constraint)Irrigated land (% of cropland)Fertilizer consumption (100 grams per hectare of arable land)Agricultural machinery tractors per 100 hectares of arable landCereal crop yield (kg per hectare)Exports of goods and services (% of GDP)
Sudan 37.7 782.5 2.2 2.5 780 861
15,321 31,518 36,402 744,731 11.3 5.8 489 580 8.9 3.2 197 164 7.2 31.3 14.5 27.7 34.0 38.0 42.6 –13.0 2.0 .. .. 0.2 23.9 52.6 23.4
14.4 29.0 25.3 18.9 14.5 12.5 66.0 93.2 33.8 28.6 6.2 6.1 .. .. 10 11 39 56 57.9 160.3 9 103 810 673 0 5 180 320 32 67 .. 8 .. 8 36 42 .. 44 .. 7 .. .. 36 12 5 .. .. 0 65 .. .. .. .. .. .. .. .. 10.2 3.5 26 106 9 13 718 1,262 17 37
LDB Africa 12-2-08.indd 92 12/2/08 12:20:42 PM

The Little Data Book on Africa 2008 93
Imports of goods and services (% of GDP)Terms of trade index (2000=100)Real effective exchange rate (2000=100)Export diversification index (%)Foreign direct investment, net inflows ($ millions)Workers remittances received ($ millions)
ParticipatingingrowthRural population (% of total population)Age dependency ratio (dependents to working-age population)Population 0–24 (% of total population)Life expectancy at birth (years)Poverty headcount ratio at national poverty line (% of population)Gini indexInfant mortality rate (per 1,000 live births)Under-five mortality rate (per 1,000)Births attended by skilled health staff (% of total)Maternal mortality ratio, modeled estimate (per 100,000 live births)Malnutrition prevalence, height for age (% of children under 5)Child immunization, measles (% of ages 12–23 months)Children sleeping under insecticide-treated bednets (% under age 5)HIV prevalence rate (% of ages 15–49)Deaths of adults and children due to AIDSPhysicians per 1,000 peoplePrimary school completion rate, total (% of relevant age group)Student-teacher ratio, primary schoolYouth literacy, total (% of ages 15–24)Ratio of girls to boys in primary and secondary schoolLabor force participation rate, total (% of ages 15 and over)Labor force participation rate, male (% of ages 15 and over)Labor force participation rate, female (% of ages 15 and over)Improved water source (% of urban population with sustainable access) Improved water source (% of rural population with sustainable access) Improved sanitation (% of urban population with sustainable access) Improved sanitation (% of rural population with sustainable access) Access to electricity (% of urban population)Access to electricity (% of rural population)Telephone subscribers, total (per 100 people)Households with own telephone (% of urban households)Households with own telephone (% of rural households)Internet users (per 100 people)Rural residents within 2 km of an all-season road (%)
CapablestatesCPIA overall rating (IDA resource allocation index, 1 low to 6 high)Country has publicly endorsed the EITI principles Corruption Perceptions Index score (0 corrupt to 10 clean)Control of corruption (–2.5 worse to 2.5 better)Voice and accountability (–2.5 worse to 2.5 better)Political stability (–2.5 worse to 2.5 better)Government effectiveness (–2.5 worse to 2.5 better)Regulatory law (–2.5 worse to 2.5 better)Rule of law (–2.5 worse to 2.5 better)Combined polity score
PartnershipNet aid ($ millions)Net aid (% of GDP)Net aid per capita from all donors ($)Net aid from DAC donors ($ millions)Net aid from non-DAC bilateral donors ($ millions)Net aid from multilateral donors ($ millions)Net aid (% of central government expenditure)Debt relief committed under HIPC Initiative ($ millions)Country with an operational national development strategy (A-F)Existence of a mutual accountability review (A-F)
Sub-Saharan Country Africa
27 35 100 .. .. 112 1 .. 3,534 7,671 1,155 3,982
58 65 1 1 60 .. 58 50 .. .. .. .. 61 94 89 157 49 .. 450 902 48 .. 73 72 0 .. 1.40 5.00 25,000 1,500,000 0 0 47 60 34 47 77 .. 89 87 48 74 72 86 24 63 78 81 64 46 24 24 50 42 .. .. .. .. 13 19 .. .. .. .. 8 3 .. ..
2.5 No 2 –1.3 –1.7 –2.3 –1.2 –1.3 –1.5 –4.0
2,058 37,975 5.7 5.1 55 49 1,518 27,476 87 312 453 10,187 0.0 0.0 .. 52,315 4 .. 2 ..
LDB Africa 12-2-08.indd 93 12/2/08 12:20:42 PM

94 2008 The Little Data Book on Africa
Sub-Saharan Country Africa
Population (millions)Population growth (%)GNI per capita ($)
Economic density (current $/sq km)GDP ($ millions)GDP growth (%)GDP per capita (2000 $)GDP per capita growth (%)GDP deflator, index (2000=100; US$ series)CPI (% change)Value added, agriculture (% of GDP)Value added, industry (% of GDP)Value added, services and etc (% of GDP)Current account balance (% of GDP)Fiscal balance (cash surplus or deficit, % of GDP)Central government revenue (% of GDP)Total external debt (% of GDP)
DriversofgrowthGross domestic savings (% of GDP)Gross fixed capital formation (% of GDP)Private sector capital formation (% of GDP)Gross primary school enrollment, total (% of relevant age group)Gross secondary school enrollment, total (% of relevant age group)Gross tertiary school enrollment, total (% of relevant age group)Public current education expenditure, primary (% of total current education expenditure)Starting a business, procedures (number)Starting a business, time (days)Starting a business, cost (% of income per capita)Registering property, time (days)Enforcing contracts, time (days)Protecting investors, disclosure Index (0=less disclosure to 10=more disclosure)Paying taxes, time (hours)Paying taxes, total tax rate (% profit)Average time to clear direct exports through customs (days)Average time to clear imports from customs (days)Rigidity of employment index (0 least rigid to 100 most rigid)Delay in obtaining an electrical connection (days)Electric power outages in a typical month (number)Access to electricity (% of total population)Ratio of paved to total roads (%)Road density (road km/1,000 km2 of land area)Real interest rate (%)Domestic credit to private sector (% of GDP)Corruption (% of firms identifying this as a major constraint)Believing the court system is fair, impartial and uncorrupted (% of firms this as a major contraint)Crime, theft and disorder (% of firms identifying this as major constraint)Tax rates (% of firms identifying this as major constraint)Access to finance (% of firms identifying this as a major constraint)Electricity (% of firms identifying this as a major constraint)Labor regulations (% of firms identifying this as a major constraint)Labor skill level (% of firms identifying this as a major constraint)Irrigated land (% of cropland)Fertilizer consumption (100 grams per hectare of arable land)Agricultural machinery tractors per 100 hectares of arable landCereal crop yield (kg per hectare)Exports of goods and services (% of GDP)
Swaziland 1.1 782.5 0.6 2.5 2,450 861
161,879 31,518 2,784 744,731 2.8 5.8 1,297 580 2.2 3.2 189 164 5.3 6.1 14.5 34.9 34.0 34.2 42.6 3.5 2.0 –2.7 .. 28.3 23.9 19.6 23.4
8.1 29.0 15.8 18.9 7.5 12.5 105.9 93.2 46.7 28.6 4.2 6.1 100 .. 13 11 61 56 38.7 160.3 46 103 972 673 0 5 104 320 37 67 4 8 2 8 17 42 17 44 3 7 .. .. 30 12 209 .. 1 23 65 25 40 34 29 33 12 10 13 26.0 3.5 393 106 222 13 547 1,262 64 37
LDB Africa 12-2-08.indd 94 12/2/08 12:20:42 PM

The Little Data Book on Africa 2008 95
Imports of goods and services (% of GDP)Terms of trade index (2000=100)Real effective exchange rate (2000=100)Export diversification index (%)Foreign direct investment, net inflows ($ millions)Workers remittances received ($ millions)
ParticipatingingrowthRural population (% of total population)Age dependency ratio (dependents to working-age population)Population 0–24 (% of total population)Life expectancy at birth (years)Poverty headcount ratio at national poverty line (% of population)Gini indexInfant mortality rate (per 1,000 live births)Under-five mortality rate (per 1,000)Births attended by skilled health staff (% of total)Maternal mortality ratio, modeled estimate (per 100,000 live births)Malnutrition prevalence, height for age (% of children under 5)Child immunization, measles (% of ages 12–23 months)Children sleeping under insecticide-treated bednets (% under age 5)HIV prevalence rate (% of ages 15–49)Deaths of adults and children due to AIDSPhysicians per 1,000 peoplePrimary school completion rate, total (% of relevant age group)Student-teacher ratio, primary schoolYouth literacy, total (% of ages 15–24)Ratio of girls to boys in primary and secondary schoolLabor force participation rate, total (% of ages 15 and over)Labor force participation rate, male (% of ages 15 and over)Labor force participation rate, female (% of ages 15 and over)Improved water source (% of urban population with sustainable access) Improved water source (% of rural population with sustainable access) Improved sanitation (% of urban population with sustainable access) Improved sanitation (% of rural population with sustainable access) Access to electricity (% of urban population)Access to electricity (% of rural population)Telephone subscribers, total (per 100 people)Households with own telephone (% of urban households)Households with own telephone (% of rural households)Internet users (per 100 people)Rural residents within 2 km of an all-season road (%)
CapablestatesCPIA overall rating (IDA resource allocation index, 1 low to 6 high)Country has publicly endorsed the EITI principles Corruption Perceptions Index score (0 corrupt to 10 clean)Control of corruption (–2.5 worse to 2.5 better)Voice and accountability (–2.5 worse to 2.5 better)Political stability (–2.5 worse to 2.5 better)Government effectiveness (–2.5 worse to 2.5 better)Regulatory law (–2.5 worse to 2.5 better)Rule of law (–2.5 worse to 2.5 better)Combined polity score
PartnershipNet aid ($ millions)Net aid (% of GDP)Net aid per capita from all donors ($)Net aid from DAC donors ($ millions)Net aid from non-DAC bilateral donors ($ millions)Net aid from multilateral donors ($ millions)Net aid (% of central government expenditure)Debt relief committed under HIPC Initiative ($ millions)Country with an operational national development strategy (A-F)Existence of a mutual accountability review (A-F)
Sub-Saharan Country Africa
71 35 96 .. .. 112 20 .. 34 7,671 1 3,982
76 65 1 1 64 .. 41 50 69 .. 50 .. 112 94 164 157 74 .. 390 902 37 .. 57 72 0 .. 26.10 5.00 10,000 1,500,000 0 0 67 60 33 47 88 .. 95 87 54 74 77 86 34 63 87 81 51 46 46 24 64 42 .. .. .. .. 26 19 .. .. .. .. 4 3 .. ..
.. No 3 –0.5 –1.1 0.1 –0.7 –0.7 –0.8 –9.0
35 37,975 1.2 5.1 30 49 12 27,476 –1 312 23 10,187 0.0 0.0 .. 52,315 .. .. .. ..
LDB Africa 12-2-08.indd 95 12/2/08 12:20:42 PM

96 2008 The Little Data Book on Africa
Sub-Saharan Country Africa
Population (millions)Population growth (%)GNI per capita ($)
Economic density (current $/sq km)GDP ($ millions)GDP growth (%)GDP per capita (2000 $)GDP per capita growth (%)GDP deflator, index (2000=100; US$ series)CPI (% change)Value added, agriculture (% of GDP)Value added, industry (% of GDP)Value added, services and etc (% of GDP)Current account balance (% of GDP)Fiscal balance (cash surplus or deficit, % of GDP)Central government revenue (% of GDP)Total external debt (% of GDP)
DriversofgrowthGross domestic savings (% of GDP)Gross fixed capital formation (% of GDP)Private sector capital formation (% of GDP)Gross primary school enrollment, total (% of relevant age group)Gross secondary school enrollment, total (% of relevant age group)Gross tertiary school enrollment, total (% of relevant age group)Public current education expenditure, primary (% of total current education expenditure)Starting a business, procedures (number)Starting a business, time (days)Starting a business, cost (% of income per capita)Registering property, time (days)Enforcing contracts, time (days)Protecting investors, disclosure Index (0=less disclosure to 10=more disclosure)Paying taxes, time (hours)Paying taxes, total tax rate (% profit)Average time to clear direct exports through customs (days)Average time to clear imports from customs (days)Rigidity of employment index (0 least rigid to 100 most rigid)Delay in obtaining an electrical connection (days)Electric power outages in a typical month (number)Access to electricity (% of total population)Ratio of paved to total roads (%)Road density (road km/1,000 km2 of land area)Real interest rate (%)Domestic credit to private sector (% of GDP)Corruption (% of firms identifying this as a major constraint)Believing the court system is fair, impartial and uncorrupted (% of firms this as a major contraint)Crime, theft and disorder (% of firms identifying this as major constraint)Tax rates (% of firms identifying this as major constraint)Access to finance (% of firms identifying this as a major constraint)Electricity (% of firms identifying this as a major constraint)Labor regulations (% of firms identifying this as a major constraint)Labor skill level (% of firms identifying this as a major constraint)Irrigated land (% of cropland)Fertilizer consumption (100 grams per hectare of arable land)Agricultural machinery tractors per 100 hectares of arable landCereal crop yield (kg per hectare)Exports of goods and services (% of GDP)
Tanzania 39.5 782.5 2.5 2.5 370 861
16,006 31,518 14,178 744,731 6.7 5.8 339 580 4.1 3.2 106 164 6.4 37.9 14.5 14.5 34.0 31.2 42.6 –10.2 2.0 .. .. 11.6 23.9 29.9 23.4
10.8 29.0 16.7 18.9 9.9 12.5 110.3 93.2 .. 28.6 1.4 6.1 .. .. 12 11 29 56 47.1 160.3 73 103 462 673 3 5 172 320 44 67 6 8 15 8 60 42 44 44 12 7 11 .. 9 12 89 .. 11 11 65 20 47 16 37 41 88 5 20 1.8 3.5 104 106 23 13 1,514 1,262 22 37
LDB Africa 12-2-08.indd 96 12/2/08 12:20:43 PM

The Little Data Book on Africa 2008 97
Imports of goods and services (% of GDP)Terms of trade index (2000=100)Real effective exchange rate (2000=100)Export diversification index (%)Foreign direct investment, net inflows ($ millions)Workers remittances received ($ millions)
ParticipatingingrowthRural population (% of total population)Age dependency ratio (dependents to working-age population)Population 0–24 (% of total population)Life expectancy at birth (years)Poverty headcount ratio at national poverty line (% of population)Gini indexInfant mortality rate (per 1,000 live births)Under-five mortality rate (per 1,000)Births attended by skilled health staff (% of total)Maternal mortality ratio, modeled estimate (per 100,000 live births)Malnutrition prevalence, height for age (% of children under 5)Child immunization, measles (% of ages 12–23 months)Children sleeping under insecticide-treated bednets (% under age 5)HIV prevalence rate (% of ages 15–49)Deaths of adults and children due to AIDSPhysicians per 1,000 peoplePrimary school completion rate, total (% of relevant age group)Student-teacher ratio, primary schoolYouth literacy, total (% of ages 15–24)Ratio of girls to boys in primary and secondary schoolLabor force participation rate, total (% of ages 15 and over)Labor force participation rate, male (% of ages 15 and over)Labor force participation rate, female (% of ages 15 and over)Improved water source (% of urban population with sustainable access) Improved water source (% of rural population with sustainable access) Improved sanitation (% of urban population with sustainable access) Improved sanitation (% of rural population with sustainable access) Access to electricity (% of urban population)Access to electricity (% of rural population)Telephone subscribers, total (per 100 people)Households with own telephone (% of urban households)Households with own telephone (% of rural households)Internet users (per 100 people)Rural residents within 2 km of an all-season road (%)
CapablestatesCPIA overall rating (IDA resource allocation index, 1 low to 6 high)Country has publicly endorsed the EITI principles Corruption Perceptions Index score (0 corrupt to 10 clean)Control of corruption (–2.5 worse to 2.5 better)Voice and accountability (–2.5 worse to 2.5 better)Political stability (–2.5 worse to 2.5 better)Government effectiveness (–2.5 worse to 2.5 better)Regulatory law (–2.5 worse to 2.5 better)Rule of law (–2.5 worse to 2.5 better)Combined polity score
PartnershipNet aid ($ millions)Net aid (% of GDP)Net aid per capita from all donors ($)Net aid from DAC donors ($ millions)Net aid from non-DAC bilateral donors ($ millions)Net aid from multilateral donors ($ millions)Net aid (% of central government expenditure)Debt relief committed under HIPC Initiative ($ millions)Country with an operational national development strategy (A-F)Existence of a mutual accountability review (A-F)
Sub-Saharan Country Africa
28 35 78 .. .. 112 26 .. 474 7,671 8 3,982
75 65 1 1 65 .. 52 50 36 .. 35 .. 74 94 118 157 43 .. 950 902 44 .. 93 72 16 .. 6.20 5.00 96,000 1,500,000 0 0 74 60 52 47 78 .. .. 87 90 74 91 86 88 63 81 81 46 46 34 24 31 42 39 .. 2 .. 15 19 31 .. 3 .. 1 3 38.0 ..
3.9 No 3 –0.5 –0.2 –0.1 –0.4 –0.4 –0.5 1.0
1,825 37,975 12.9 5.1 46 49 992 27,476 1 312 832 10,187 0.0 0.0 3,000 52,315 2 .. 1 ..
LDB Africa 12-2-08.indd 97 12/2/08 12:20:43 PM

98 2008 The Little Data Book on Africa
Sub-Saharan Country Africa
Population (millions)Population growth (%)GNI per capita ($)
Economic density (current $/sq km)GDP ($ millions)GDP growth (%)GDP per capita (2000 $)GDP per capita growth (%)GDP deflator, index (2000=100; US$ series)CPI (% change)Value added, agriculture (% of GDP)Value added, industry (% of GDP)Value added, services and etc (% of GDP)Current account balance (% of GDP)Fiscal balance (cash surplus or deficit, % of GDP)Central government revenue (% of GDP)Total external debt (% of GDP)
DriversofgrowthGross domestic savings (% of GDP)Gross fixed capital formation (% of GDP)Private sector capital formation (% of GDP)Gross primary school enrollment, total (% of relevant age group)Gross secondary school enrollment, total (% of relevant age group)Gross tertiary school enrollment, total (% of relevant age group)Public current education expenditure, primary (% of total current education expenditure)Starting a business, procedures (number)Starting a business, time (days)Starting a business, cost (% of income per capita)Registering property, time (days)Enforcing contracts, time (days)Protecting investors, disclosure Index (0=less disclosure to 10=more disclosure)Paying taxes, time (hours)Paying taxes, total tax rate (% profit)Average time to clear direct exports through customs (days)Average time to clear imports from customs (days)Rigidity of employment index (0 least rigid to 100 most rigid)Delay in obtaining an electrical connection (days)Electric power outages in a typical month (number)Access to electricity (% of total population)Ratio of paved to total roads (%)Road density (road km/1,000 km2 of land area)Real interest rate (%)Domestic credit to private sector (% of GDP)Corruption (% of firms identifying this as a major constraint)Believing the court system is fair, impartial and uncorrupted (% of firms this as a major contraint)Crime, theft and disorder (% of firms identifying this as major constraint)Tax rates (% of firms identifying this as major constraint)Access to finance (% of firms identifying this as a major constraint)Electricity (% of firms identifying this as a major constraint)Labor regulations (% of firms identifying this as a major constraint)Labor skill level (% of firms identifying this as a major constraint)Irrigated land (% of cropland)Fertilizer consumption (100 grams per hectare of arable land)Agricultural machinery tractors per 100 hectares of arable landCereal crop yield (kg per hectare)Exports of goods and services (% of GDP)
Togo 6.4 782.5 2.8 2.5 350 861
40,788 31,518 2,218 744,731 4.1 5.8 240 580 1.3 3.2 144 164 2.2 42.7 14.5 23.5 34.0 31.7 42.6 –21.4 2.0 –0.1 .. 16.3 23.9 81.4 23.4
6.9 29.0 18.0 18.9 17.7 12.5 102.4 93.2 40.4 28.6 3.6 6.1 95 .. 13 11 53 56 245.7 160.3 295 103 588 673 6 5 270 320 48 67 .. 8 .. 8 54 42 .. 44 .. 7 .. .. 32 12 138 .. .. 17 65 .. .. .. .. .. .. .. .. 0.3 3.5 82 106 0 13 1,135 1,262 34 37
LDB Africa 12-2-08.indd 98 12/2/08 12:20:43 PM

The Little Data Book on Africa 2008 99
Imports of goods and services (% of GDP)Terms of trade index (2000=100)Real effective exchange rate (2000=100)Export diversification index (%)Foreign direct investment, net inflows ($ millions)Workers remittances received ($ millions)
ParticipatingingrowthRural population (% of total population)Age dependency ratio (dependents to working-age population)Population 0–24 (% of total population)Life expectancy at birth (years)Poverty headcount ratio at national poverty line (% of population)Gini indexInfant mortality rate (per 1,000 live births)Under-five mortality rate (per 1,000)Births attended by skilled health staff (% of total)Maternal mortality ratio, modeled estimate (per 100,000 live births)Malnutrition prevalence, height for age (% of children under 5)Child immunization, measles (% of ages 12–23 months)Children sleeping under insecticide-treated bednets (% under age 5)HIV prevalence rate (% of ages 15–49)Deaths of adults and children due to AIDSPhysicians per 1,000 peoplePrimary school completion rate, total (% of relevant age group)Student-teacher ratio, primary schoolYouth literacy, total (% of ages 15–24)Ratio of girls to boys in primary and secondary schoolLabor force participation rate, total (% of ages 15 and over)Labor force participation rate, male (% of ages 15 and over)Labor force participation rate, female (% of ages 15 and over)Improved water source (% of urban population with sustainable access) Improved water source (% of rural population with sustainable access) Improved sanitation (% of urban population with sustainable access) Improved sanitation (% of rural population with sustainable access) Access to electricity (% of urban population)Access to electricity (% of rural population)Telephone subscribers, total (per 100 people)Households with own telephone (% of urban households)Households with own telephone (% of rural households)Internet users (per 100 people)Rural residents within 2 km of an all-season road (%)
CapablestatesCPIA overall rating (IDA resource allocation index, 1 low to 6 high)Country has publicly endorsed the EITI principles Corruption Perceptions Index score (0 corrupt to 10 clean)Control of corruption (–2.5 worse to 2.5 better)Voice and accountability (–2.5 worse to 2.5 better)Political stability (–2.5 worse to 2.5 better)Government effectiveness (–2.5 worse to 2.5 better)Regulatory law (–2.5 worse to 2.5 better)Rule of law (–2.5 worse to 2.5 better)Combined polity score
PartnershipNet aid ($ millions)Net aid (% of GDP)Net aid per capita from all donors ($)Net aid from DAC donors ($ millions)Net aid from non-DAC bilateral donors ($ millions)Net aid from multilateral donors ($ millions)Net aid (% of central government expenditure)Debt relief committed under HIPC Initiative ($ millions)Country with an operational national development strategy (A-F)Existence of a mutual accountability review (A-F)
Sub-Saharan Country Africa
48 35 100 .. 112 112 8 .. 92 7,671 0 3,982
59 65 1 1 63 .. 58 50 .. .. .. .. 69 94 108 157 62 .. 510 902 .. .. 83 72 2 .. 3.30 5.00 9,100 1,500,000 0 0 67 60 38 47 74 .. 73 87 71 74 91 86 52 63 86 81 40 46 3 24 24 42 .. .. .. .. 12 19 .. .. .. .. 5 3 .. ..
2.5 No 2 –1.0 –1.2 –0.5 –1.5 –1.0 –0.9 –4.0
79 37,975 3.5 5.1 12 49 55 27,476 0 312 24 10,187 0.0 0.0 .. 52,315 6 .. 2 ..
LDB Africa 12-2-08.indd 99 12/2/08 12:20:43 PM

100 2008 The Little Data Book on Africa
North Country Africa
Population (millions)Population growth (%)GNI per capita ($)
Economic density (current $/sq km)GDP ($ millions)GDP growth (%)GDP per capita (2000 $)GDP per capita growth (%)GDP deflator, index (2000=100; US$ series)CPI (% change)Value added, agriculture (% of GDP)Value added, industry (% of GDP)Value added, services and etc (% of GDP)Current account balance (% of GDP)Fiscal balance (cash surplus or deficit, % of GDP)Central government revenue (% of GDP)Total external debt (% of GDP)
DriversofgrowthGross domestic savings (% of GDP)Gross fixed capital formation (% of GDP)Private sector capital formation (% of GDP)Gross primary school enrollment, total (% of relevant age group)Gross secondary school enrollment, total (% of relevant age group)Gross tertiary school enrollment, total (% of relevant age group)Public current education expenditure, primary (% of total current education expenditure)Starting a business, procedures (number)Starting a business, time (days)Starting a business, cost (% of income per capita)Registering property, time (days)Enforcing contracts, time (days)Protecting investors, disclosure Index (0=less disclosure to 10=more disclosure)Paying taxes, time (hours)Paying taxes, total tax rate (% profit)Average time to clear direct exports through customs (days)Average time to clear imports from customs (days)Rigidity of employment index (0 least rigid to 100 most rigid)Delay in obtaining an electrical connection (days)Electric power outages in a typical month (number)Access to electricity (% of total population)Ratio of paved to total roads (%)Road density (road km/1,000 km2 of land area)Real interest rate (%)Domestic credit to private sector (% of GDP)Corruption (% of firms identifying this as a major constraint)Believing the court system is fair, impartial and uncorrupted (% of firms this as a major contraint)Crime, theft and disorder (% of firms identifying this as major constraint)Tax rates (% of firms identifying this as major constraint)Access to finance (% of firms identifying this as a major constraint)Electricity (% of firms identifying this as a major constraint)Labor regulations (% of firms identifying this as a major constraint)Labor skill level (% of firms identifying this as a major constraint)Irrigated land (% of cropland)Fertilizer consumption (100 grams per hectare of arable land)Agricultural machinery tractors per 100 hectares of arable landCereal crop yield (kg per hectare)Exports of goods and services (% of GDP)
Tunisia 10.1 154.2 1.0 1.6 3,040 2,333
199,293 64,481 30,962 370,017 5.7 5.5 2,518 2,060 4.6 3.9 121 117 4.5 11.1 10.3 27.8 41.9 61.1 40.9 –2.0 10.3 –2.7 0.0 23.1 36.2 59.7 19.4
23.6 37.0 23.5 23.5 13.7 14.8 108.3 106.1 84.9 77.2 31.0 26.6 87 .. 10 9 11 14 8.3 15.4 39 83 565 705 0 5 268 447 61 57 .. 3 .. 10 49 47 .. 34 .. 4 .. .. 66 68 124 .. .. 64 38 .. .. .. .. .. .. .. .. 7.4 .. 644 1,265 143 139 1,245 2,906 53 39
LDB Africa 12-2-08.indd 100 12/2/08 12:20:44 PM

The Little Data Book on Africa 2008 101
Imports of goods and services (% of GDP)Terms of trade index (2000=100)Real effective exchange rate (2000=100)Export diversification index (%)Foreign direct investment, net inflows ($ millions)Workers remittances received ($ millions)
ParticipatingingrowthRural population (% of total population)Age dependency ratio (dependents to working-age population)Population 0–24 (% of total population)Life expectancy at birth (years)Poverty headcount ratio at national poverty line (% of population)Gini indexInfant mortality rate (per 1,000 live births)Under-five mortality rate (per 1,000)Births attended by skilled health staff (% of total)Maternal mortality ratio, modeled estimate (per 100,000 live births)Malnutrition prevalence, height for age (% of children under 5)Child immunization, measles (% of ages 12–23 months)Children sleeping under insecticide-treated bednets (% under age 5)HIV prevalence rate (% of ages 15–49)Deaths of adults and children due to AIDSPhysicians per 1,000 peoplePrimary school completion rate, total (% of relevant age group)Student-teacher ratio, primary schoolYouth literacy, total (% of ages 15–24)Ratio of girls to boys in primary and secondary schoolLabor force participation rate, total (% of ages 15 and over)Labor force participation rate, male (% of ages 15 and over)Labor force participation rate, female (% of ages 15 and over)Improved water source (% of urban population with sustainable access) Improved water source (% of rural population with sustainable access) Improved sanitation (% of urban population with sustainable access) Improved sanitation (% of rural population with sustainable access) Access to electricity (% of urban population)Access to electricity (% of rural population)Telephone subscribers, total (per 100 people)Households with own telephone (% of urban households)Households with own telephone (% of rural households)Internet users (per 100 people)Rural residents within 2 km of an all-season road (%)
CapablestatesCPIA overall rating (IDA resource allocation index, 1 low to 6 high)Country has publicly endorsed the EITI principles Corruption Perceptions Index score (0 corrupt to 10 clean)Control of corruption (–2.5 worse to 2.5 better)Voice and accountability (–2.5 worse to 2.5 better)Political stability (–2.5 worse to 2.5 better)Government effectiveness (–2.5 worse to 2.5 better)Regulatory law (–2.5 worse to 2.5 better)Rule of law (–2.5 worse to 2.5 better)Combined polity score
PartnershipNet aid ($ millions)Net aid (% of GDP)Net aid per capita from all donors ($)Net aid from DAC donors ($ millions)Net aid from non-DAC bilateral donors ($ millions)Net aid from multilateral donors ($ millions)Net aid (% of central government expenditure)Debt relief committed under HIPC Initiative ($ millions)Country with an operational national development strategy (A-F)Existence of a mutual accountability review (A-F)
North Country Africa
53 31 101 .. 85 85 43 .. 3,240 17,080 1,510 12,300
34 47 0 1 46 .. 74 71 .. .. 40 .. 19 30 23 35 90 71 100 159 .. 24 98 96 .. .. 0.10 .. 200 .. 1 0 120 .. 19 25 94 .. 104 .. 55 54 78 80 32 28 99 96 84 87 64 60 96 90 .. .. .. .. 85 53 .. .. .. .. 13 10 .. ..
.. .. .. 0.1 –1.2 0.1 0.5 0.2 0.3 –4.0
432 2,596 1.4 0.7 43 17 287 1,628 –9 165 154 803 0.0 0.0 .. .. .. .. .. ..
LDB Africa 12-2-08.indd 101 12/2/08 12:20:44 PM

102 2008 The Little Data Book on Africa
Sub-Saharan Country Africa
Population (millions)Population growth (%)GNI per capita ($)
Economic density (current $/sq km)GDP ($ millions)GDP growth (%)GDP per capita (2000 $)GDP per capita growth (%)GDP deflator, index (2000=100; US$ series)CPI (% change)Value added, agriculture (% of GDP)Value added, industry (% of GDP)Value added, services and etc (% of GDP)Current account balance (% of GDP)Fiscal balance (cash surplus or deficit, % of GDP)Central government revenue (% of GDP)Total external debt (% of GDP)
DriversofgrowthGross domestic savings (% of GDP)Gross fixed capital formation (% of GDP)Private sector capital formation (% of GDP)Gross primary school enrollment, total (% of relevant age group)Gross secondary school enrollment, total (% of relevant age group)Gross tertiary school enrollment, total (% of relevant age group)Public current education expenditure, primary (% of total current education expenditure)Starting a business, procedures (number)Starting a business, time (days)Starting a business, cost (% of income per capita)Registering property, time (days)Enforcing contracts, time (days)Protecting investors, disclosure Index (0=less disclosure to 10=more disclosure)Paying taxes, time (hours)Paying taxes, total tax rate (% profit)Average time to clear direct exports through customs (days)Average time to clear imports from customs (days)Rigidity of employment index (0 least rigid to 100 most rigid)Delay in obtaining an electrical connection (days)Electric power outages in a typical month (number)Access to electricity (% of total population)Ratio of paved to total roads (%)Road density (road km/1,000 km2 of land area)Real interest rate (%)Domestic credit to private sector (% of GDP)Corruption (% of firms identifying this as a major constraint)Believing the court system is fair, impartial and uncorrupted (% of firms this as a major contraint)Crime, theft and disorder (% of firms identifying this as major constraint)Tax rates (% of firms identifying this as major constraint)Access to finance (% of firms identifying this as a major constraint)Electricity (% of firms identifying this as a major constraint)Labor regulations (% of firms identifying this as a major constraint)Labor skill level (% of firms identifying this as a major constraint)Irrigated land (% of cropland)Fertilizer consumption (100 grams per hectare of arable land)Agricultural machinery tractors per 100 hectares of arable landCereal crop yield (kg per hectare)Exports of goods and services (% of GDP)
Uganda 29.9 782.5 3.3 2.5 300 861
48,175 31,518 9,495 744,731 5.1 5.8 274 580 1.7 3.2 116 164 6.8 28.7 14.5 16.7 34.0 46.7 42.6 –3.4 2.0 –2.0 .. 13.1 23.9 13.3 23.4
8.1 29.0 23.4 18.9 18.2 12.5 116.7 93.2 18.3 28.6 3.5 6.1 75 .. 18 11 28 56 92.0 160.3 227 103 535 673 2 5 237 320 37 67 5 8 7 8 3 42 33 44 11 7 8 .. 23 12 359 .. 9 8 65 24 44 13 63 48 84 1 10 0.1 3.5 11 106 9 13 1,523 1,262 15 37
LDB Africa 12-2-08.indd 102 12/2/08 12:20:44 PM

The Little Data Book on Africa 2008 103
Imports of goods and services (% of GDP)Terms of trade index (2000=100)Real effective exchange rate (2000=100)Export diversification index (%)Foreign direct investment, net inflows ($ millions)Workers remittances received ($ millions)
ParticipatingingrowthRural population (% of total population)Age dependency ratio (dependents to working-age population)Population 0–24 (% of total population)Life expectancy at birth (years)Poverty headcount ratio at national poverty line (% of population)Gini indexInfant mortality rate (per 1,000 live births)Under-five mortality rate (per 1,000)Births attended by skilled health staff (% of total)Maternal mortality ratio, modeled estimate (per 100,000 live births)Malnutrition prevalence, height for age (% of children under 5)Child immunization, measles (% of ages 12–23 months)Children sleeping under insecticide-treated bednets (% under age 5)HIV prevalence rate (% of ages 15–49)Deaths of adults and children due to AIDSPhysicians per 1,000 peoplePrimary school completion rate, total (% of relevant age group)Student-teacher ratio, primary schoolYouth literacy, total (% of ages 15–24)Ratio of girls to boys in primary and secondary schoolLabor force participation rate, total (% of ages 15 and over)Labor force participation rate, male (% of ages 15 and over)Labor force participation rate, female (% of ages 15 and over)Improved water source (% of urban population with sustainable access) Improved water source (% of rural population with sustainable access) Improved sanitation (% of urban population with sustainable access) Improved sanitation (% of rural population with sustainable access) Access to electricity (% of urban population)Access to electricity (% of rural population)Telephone subscribers, total (per 100 people)Households with own telephone (% of urban households)Households with own telephone (% of rural households)Internet users (per 100 people)Rural residents within 2 km of an all-season road (%)
CapablestatesCPIA overall rating (IDA resource allocation index, 1 low to 6 high)Country has publicly endorsed the EITI principles Corruption Perceptions Index score (0 corrupt to 10 clean)Control of corruption (–2.5 worse to 2.5 better)Voice and accountability (–2.5 worse to 2.5 better)Political stability (–2.5 worse to 2.5 better)Government effectiveness (–2.5 worse to 2.5 better)Regulatory law (–2.5 worse to 2.5 better)Rule of law (–2.5 worse to 2.5 better)Combined polity score
PartnershipNet aid ($ millions)Net aid (% of GDP)Net aid per capita from all donors ($)Net aid from DAC donors ($ millions)Net aid from non-DAC bilateral donors ($ millions)Net aid from multilateral donors ($ millions)Net aid (% of central government expenditure)Debt relief committed under HIPC Initiative ($ millions)Country with an operational national development strategy (A-F)Existence of a mutual accountability review (A-F)
Sub-Saharan Country Africa
30 35 127 .. 88 112 6 .. 393 7,671 665 3,982
87 65 1 1 70 .. 51 50 31 .. 41 .. 78 94 134 157 42 .. 550 902 45 .. 89 72 0 .. 5.40 5.00 77,000 1,500,000 0 0 54 60 49 47 77 .. 98 87 84 74 87 86 82 63 90 81 60 46 34 24 29 42 47 .. 3 .. 7 19 18 .. 1 .. 5 3 .. ..
3.9 No 3 –0.8 –0.5 –1.2 –0.4 –0.2 –0.5 –1.0
1,551 37,975 16.3 5.1 52 49 938 27,476 3 312 609 10,187 0.0 0.0 1,950 52,315 2 .. 2 ..
LDB Africa 12-2-08.indd 103 12/2/08 12:20:44 PM

104 2008 The Little Data Book on Africa
Sub-Saharan Country Africa
Population (millions)Population growth (%)GNI per capita ($)
Economic density (current $/sq km)GDP ($ millions)GDP growth (%)GDP per capita (2000 $)GDP per capita growth (%)GDP deflator, index (2000=100; US$ series)CPI (% change)Value added, agriculture (% of GDP)Value added, industry (% of GDP)Value added, services and etc (% of GDP)Current account balance (% of GDP)Fiscal balance (cash surplus or deficit, % of GDP)Central government revenue (% of GDP)Total external debt (% of GDP)
DriversofgrowthGross domestic savings (% of GDP)Gross fixed capital formation (% of GDP)Private sector capital formation (% of GDP)Gross primary school enrollment, total (% of relevant age group)Gross secondary school enrollment, total (% of relevant age group)Gross tertiary school enrollment, total (% of relevant age group)Public current education expenditure, primary (% of total current education expenditure)Starting a business, procedures (number)Starting a business, time (days)Starting a business, cost (% of income per capita)Registering property, time (days)Enforcing contracts, time (days)Protecting investors, disclosure Index (0=less disclosure to 10=more disclosure)Paying taxes, time (hours)Paying taxes, total tax rate (% profit)Average time to clear direct exports through customs (days)Average time to clear imports from customs (days)Rigidity of employment index (0 least rigid to 100 most rigid)Delay in obtaining an electrical connection (days)Electric power outages in a typical month (number)Access to electricity (% of total population)Ratio of paved to total roads (%)Road density (road km/1,000 km2 of land area)Real interest rate (%)Domestic credit to private sector (% of GDP)Corruption (% of firms identifying this as a major constraint)Believing the court system is fair, impartial and uncorrupted (% of firms this as a major contraint)Crime, theft and disorder (% of firms identifying this as major constraint)Tax rates (% of firms identifying this as major constraint)Access to finance (% of firms identifying this as a major constraint)Electricity (% of firms identifying this as a major constraint)Labor regulations (% of firms identifying this as a major constraint)Labor skill level (% of firms identifying this as a major constraint)Irrigated land (% of cropland)Fertilizer consumption (100 grams per hectare of arable land)Agricultural machinery tractors per 100 hectares of arable landCereal crop yield (kg per hectare)Exports of goods and services (% of GDP)
Zambia 11.7 782.5 1.9 2.5 640 861
14,644 31,518 10,886 744,731 6.2 5.8 371 580 4.2 3.2 251 164 9.0 19.9 14.5 31.3 34.0 43.9 42.6 1.2 2.0 –2.8 .. 16.7 23.9 21.4 23.4
30.9 29.0 22.6 18.9 18.8 12.5 116.9 93.2 30.4 28.6 2.3 6.1 99 .. 6 11 33 56 30.5 160.3 70 103 471 673 3 5 132 320 16 67 2 8 7 8 38 42 93 44 4 7 20 .. 22 12 123 .. 9 10 65 13 55 10 26 21 12 6 8 2.9 3.5 69 106 11 13 1,837 1,262 38 37
LDB Africa 12-2-08.indd 104 12/2/08 12:20:45 PM

The Little Data Book on Africa 2008 105
Imports of goods and services (% of GDP)Terms of trade index (2000=100)Real effective exchange rate (2000=100)Export diversification index (%)Foreign direct investment, net inflows ($ millions)Workers remittances received ($ millions)
ParticipatingingrowthRural population (% of total population)Age dependency ratio (dependents to working-age population)Population 0–24 (% of total population)Life expectancy at birth (years)Poverty headcount ratio at national poverty line (% of population)Gini indexInfant mortality rate (per 1,000 live births)Under-five mortality rate (per 1,000)Births attended by skilled health staff (% of total)Maternal mortality ratio, modeled estimate (per 100,000 live births)Malnutrition prevalence, height for age (% of children under 5)Child immunization, measles (% of ages 12–23 months)Children sleeping under insecticide-treated bednets (% under age 5)HIV prevalence rate (% of ages 15–49)Deaths of adults and children due to AIDSPhysicians per 1,000 peoplePrimary school completion rate, total (% of relevant age group)Student-teacher ratio, primary schoolYouth literacy, total (% of ages 15–24)Ratio of girls to boys in primary and secondary schoolLabor force participation rate, total (% of ages 15 and over)Labor force participation rate, male (% of ages 15 and over)Labor force participation rate, female (% of ages 15 and over)Improved water source (% of urban population with sustainable access) Improved water source (% of rural population with sustainable access) Improved sanitation (% of urban population with sustainable access) Improved sanitation (% of rural population with sustainable access) Access to electricity (% of urban population)Access to electricity (% of rural population)Telephone subscribers, total (per 100 people)Households with own telephone (% of urban households)Households with own telephone (% of rural households)Internet users (per 100 people)Rural residents within 2 km of an all-season road (%)
CapablestatesCPIA overall rating (IDA resource allocation index, 1 low to 6 high)Country has publicly endorsed the EITI principles Corruption Perceptions Index score (0 corrupt to 10 clean)Control of corruption (–2.5 worse to 2.5 better)Voice and accountability (–2.5 worse to 2.5 better)Political stability (–2.5 worse to 2.5 better)Government effectiveness (–2.5 worse to 2.5 better)Regulatory law (–2.5 worse to 2.5 better)Rule of law (–2.5 worse to 2.5 better)Combined polity score
PartnershipNet aid ($ millions)Net aid (% of GDP)Net aid per capita from all donors ($)Net aid from DAC donors ($ millions)Net aid from non-DAC bilateral donors ($ millions)Net aid from multilateral donors ($ millions)Net aid (% of central government expenditure)Debt relief committed under HIPC Initiative ($ millions)Country with an operational national development strategy (A-F)Existence of a mutual accountability review (A-F)
Sub-Saharan Country Africa
30 35 141 .. 177 112 2 .. 616 7,671 58 3,982
65 65 1 1 67 .. 42 50 64 .. 51 .. 102 94 182 157 43 .. 830 902 53 .. 84 72 7 .. 15.20 5.00 56,000 1,500,000 0 0 84 60 51 47 .. .. 93 87 80 74 92 86 68 63 90 81 41 46 51 24 55 42 50 .. 3 .. 15 19 11 .. 1 .. 4 3 .. ..
3.5 No 3 –0.6 –0.3 0.2 –0.6 –0.5 –0.6 5.0
1,425 37,975 13.1 5.1 122 49 1,115 27,476 2 312 308 10,187 0.0 0.0 3,900 52,315 2 .. 2 ..
LDB Africa 12-2-08.indd 105 12/2/08 12:20:45 PM

106 2008 The Little Data Book on Africa
Sub-Saharan Country Africa
Population (millions)Population growth (%)GNI per capita ($)
Economic density (current $/sq km)GDP ($ millions)GDP growth (%)GDP per capita (2000 $)GDP per capita growth (%)GDP deflator, index (2000=100; US$ series)CPI (% change)Value added, agriculture (% of GDP)Value added, industry (% of GDP)Value added, services and etc (% of GDP)Current account balance (% of GDP)Fiscal balance (cash surplus or deficit, % of GDP)Central government revenue (% of GDP)Total external debt (% of GDP)
DriversofgrowthGross domestic savings (% of GDP)Gross fixed capital formation (% of GDP)Private sector capital formation (% of GDP)Gross primary school enrollment, total (% of relevant age group)Gross secondary school enrollment, total (% of relevant age group)Gross tertiary school enrollment, total (% of relevant age group)Public current education expenditure, primary (% of total current education expenditure)Starting a business, procedures (number)Starting a business, time (days)Starting a business, cost (% of income per capita)Registering property, time (days)Enforcing contracts, time (days)Protecting investors, disclosure Index (0=less disclosure to 10=more disclosure)Paying taxes, time (hours)Paying taxes, total tax rate (% profit)Average time to clear direct exports through customs (days)Average time to clear imports from customs (days)Rigidity of employment index (0 least rigid to 100 most rigid)Delay in obtaining an electrical connection (days)Electric power outages in a typical month (number)Access to electricity (% of total population)Ratio of paved to total roads (%)Road density (road km/1,000 km2 of land area)Real interest rate (%)Domestic credit to private sector (% of GDP)Corruption (% of firms identifying this as a major constraint)Believing the court system is fair, impartial and uncorrupted (% of firms this as a major contraint)Crime, theft and disorder (% of firms identifying this as major constraint)Tax rates (% of firms identifying this as major constraint)Access to finance (% of firms identifying this as a major constraint)Electricity (% of firms identifying this as a major constraint)Labor regulations (% of firms identifying this as a major constraint)Labor skill level (% of firms identifying this as a major constraint)Irrigated land (% of cropland)Fertilizer consumption (100 grams per hectare of arable land)Agricultural machinery tractors per 100 hectares of arable landCereal crop yield (kg per hectare)Exports of goods and services (% of GDP)
Zimbabwe 13.2 782.5 0.8 2.5 340 861
8,836 31,518 3,418 744,731 –5.3 5.8 428 580 –6.0 3.2 61 164 1,096.7 13.4 14.5 16.8 34.0 40.0 42.6 .. 2.0 .. .. 45.0 23.9 125.7 23.4
0.6 29.0 16.8 18.9 19.5 12.5 101.2 93.2 40.0 28.6 3.6 6.1 .. .. 10 11 96 56 676.2 160.3 30 103 410 673 8 5 256 320 53 67 .. 8 .. 8 33 42 .. 44 .. 7 .. .. 19 12 251 .. –1 27 65 .. .. .. .. .. .. .. .. 5.2 3.5 339 106 75 13 714 1,262 57 37
LDB Africa 12-2-08.indd 106 12/2/08 12:20:45 PM

The Little Data Book on Africa 2008 107
Imports of goods and services (% of GDP)Terms of trade index (2000=100)Real effective exchange rate (2000=100)Export diversification index (%)Foreign direct investment, net inflows ($ millions)Workers remittances received ($ millions)
ParticipatingingrowthRural population (% of total population)Age dependency ratio (dependents to working-age population)Population 0–24 (% of total population)Life expectancy at birth (years)Poverty headcount ratio at national poverty line (% of population)Gini indexInfant mortality rate (per 1,000 live births)Under-five mortality rate (per 1,000)Births attended by skilled health staff (% of total)Maternal mortality ratio, modeled estimate (per 100,000 live births)Malnutrition prevalence, height for age (% of children under 5)Child immunization, measles (% of ages 12–23 months)Children sleeping under insecticide-treated bednets (% under age 5)HIV prevalence rate (% of ages 15–49)Deaths of adults and children due to AIDSPhysicians per 1,000 peoplePrimary school completion rate, total (% of relevant age group)Student-teacher ratio, primary schoolYouth literacy, total (% of ages 15–24)Ratio of girls to boys in primary and secondary schoolLabor force participation rate, total (% of ages 15 and over)Labor force participation rate, male (% of ages 15 and over)Labor force participation rate, female (% of ages 15 and over)Improved water source (% of urban population with sustainable access) Improved water source (% of rural population with sustainable access) Improved sanitation (% of urban population with sustainable access) Improved sanitation (% of rural population with sustainable access) Access to electricity (% of urban population)Access to electricity (% of rural population)Telephone subscribers, total (per 100 people)Households with own telephone (% of urban households)Households with own telephone (% of rural households)Internet users (per 100 people)Rural residents within 2 km of an all-season road (%)
CapablestatesCPIA overall rating (IDA resource allocation index, 1 low to 6 high)Country has publicly endorsed the EITI principles Corruption Perceptions Index score (0 corrupt to 10 clean)Control of corruption (–2.5 worse to 2.5 better)Voice and accountability (–2.5 worse to 2.5 better)Political stability (–2.5 worse to 2.5 better)Government effectiveness (–2.5 worse to 2.5 better)Regulatory law (–2.5 worse to 2.5 better)Rule of law (–2.5 worse to 2.5 better)Combined polity score
PartnershipNet aid ($ millions)Net aid (% of GDP)Net aid per capita from all donors ($)Net aid from DAC donors ($ millions)Net aid from non-DAC bilateral donors ($ millions)Net aid from multilateral donors ($ millions)Net aid (% of central government expenditure)Debt relief committed under HIPC Initiative ($ millions)Country with an operational national development strategy (A-F)Existence of a mutual accountability review (A-F)
Sub-Saharan Country Africa
73 35 92 .. .. 112 15 .. .. 7,671 0 3,982
64 65 1 1 64 .. 43 50 .. .. .. .. 68 94 105 157 80 .. 880 902 36 .. 90 72 3 .. 15.30 5.00 140,000 1,500,000 0 0 81 60 38 47 98 .. 97 87 75 74 86 86 65 63 98 81 72 46 37 24 63 42 .. .. .. .. 9 19 .. .. .. .. 9 3 .. ..
1.7 No 2 –1.3 –1.5 –1.3 –1.5 –2.2 –1.7 –4.0
280 37,975 11.0 5.1 21 49 200 27,476 0 312 80 10,187 0.0 0.0 .. 52,315 .. .. .. ..
LDB Africa 12-2-08.indd 107 12/2/08 12:20:45 PM

108 2008 The Little Data Book on Africa
GlossaryAccess to electricity is the percentage of the population living in house-holds with access to electricity. (Household survey data, supplemented by World Bank Project Appraisal Documents)
Age dependency ratio is the ratio of (dependents to working-age popula-tion) is those ages 15–64. For example, 0.7 means there are 7 dependents for every 10 working-age people. World Bank staff estimates from various sources including census reports, the United Nations Population Division’s World Population Prospects, national statistical offices, household surveys conducted by national agencies, and Macro International. (World Develop-ment Indicators)
Agricultural machinery refers to the number of wheel and crawler tractors (ex-cluding garden tractors) in use in agriculture at the end of the calendar year specified or during the first quarter of the following year. Arable land includes land defined by the FAO as land under temporary crops (double-cropped areas are counted once), temporary meadows for mowing or for pasture, land under market or kitchen gardens, and land temporarily fallow. Land abandoned as a result of shifting cultivation is excluded. (Food Agricultural Organization)
Agriculture value added corresponds to ISIC divisions 1–5 and includes for-estry, hunting, and fishing, as well as cultivation of crops and livestock pro-duction. Value added is the net output of a sector after adding up all outputs and subtracting intermediate inputs. It is calculated without making deduc-tions for depreciation of fabricated assets or depletion and degradation of natural resources. The origin of value added is determined by the Internation-al Standard Industrial Classification (ISIC), revision 3. Note: For VAB coun-tries, gross value added at factor cost is used as the denominator. (World Bank national accounts data and OECD National Accounts data files).
Average time to clear direct exports through customs is the number of days to clear direct exports through customs. (World Bank Enterprise Surveys (http://rru.worldbank.org/EnterpriseSurveys/).
Average time to clear imports through customs (days) is the average number of days to clear imports through customs. For survey data col-lected in 2006 and 2007, this indicator is computed for the manufacturing module only. (World Bank Enterprise Surveys (http://rru.worldbank.org/ EnterpriseSurveys/).
Births attended by skilled health staff are the percentage of deliveries at-tended by personnel trained to give the necessary supervision, care, and advice to women during pregnancy, labor, and the postpartum period; to conduct deliveries on their own; and to care for newborns. (World Bank’s World Development Indicators)
Central government revenue is cash receipts from taxes, social contribu-tions, and other revenue such as fines, fees, rent, and other income from property sales as a proportion of total gross domestic product (GDP). Grants, although also considered as revenue, are excluded here. (World Bank’s World Development Indicators)
Cereals (exports and imports) quantities and include wheat, rice, maize, barley, oats, rye, millet, sorghum, buckwheat, and mixed grains. (FAO da-tabase)
Child immunization, measles, is the percentage of children ages 12–23 months who received vaccinations before 12 months or at any time before the survey for four diseases—measles and diphtheria, pertussis (whooping
LDB Africa 12-2-08.indd 108 12/2/08 12:20:45 PM

The Little Data Book on Africa 2008 109
cough), and tetanus (DPT). A child is considered adequately immunized against measles after receiving one dose of vaccine and against DPT after receiving three doses. (World Bank’s World Development Indicators)
Children sleeping under insecticide-treated bednets (% of children under age 5) is the percentage of the children under 5 with access to an insecti-cide-treated bednets to prevent malaria. (World Bank’s World Development Indicators)
Consumer price index is a change in the cost to the average consumer of acquiring a basket of goods and services that may be fixed or changed at specified intervals, such as yearly. (World Bank national accounts data, and OECD National Accounts data files).
Control of corruption measures the extent of corruption, conventionally de-fined as the exercise of public power for private gain. It is based on scores of variables from surveys and polls of experts. These scores are divided into five groups based on percentile rank and lie between point estimates of –2.5 and 2.5, with higher scores corresponding to better outcomes. (Kaufmann, D., A. Kraay, and M. Mastruzzi, 2005, Governance Matters IV: Governance Indicators for 1996–2004)
Corruption is the percentage of firms identifying corruption as a major constraint. The computation of the indicator is based on the rating of the obstacle as a potential constraint to the current operations of the estab-lishment. (World Bank Enterprise Surveys, http://rru.worldbank.org/ EnterpriseSurveys/)
Corruption Perceptions Index score is a country’s score on Transparency International’s annual Corruption Perceptions Index, which ranks more than 150 countries on perceived levels of corruption, as determined by expert assessments and opinion surveys of businesspeople and country analysts. (www.transparency.org/policy_research/surveys_indices/cpi)
Cost to start a business is normalized by presenting it as a percent-age of gross national income (GNI) per capita. (http://rru.worldbank/DoingBusiness/)
Country endorsed the Extractive Industries Transparency Initiative (EITI) principles indicates whether a country has implemented or endorsed the EITI, a multistakeholder approach to increasing governance and transpar-ency in extractive industries. It includes civil society, the private sector, and government and requires a work plan with timeline and budget to ensure sustainability, independent audit of payments and disclosure of revenues, publication of results in a publicly accessible manner, and an approach that covers all companies and government agencies. EITI supports improved governance in resource-rich countries through the verification and full pub-lication of company payments and government revenues from oil, gas, and mining. EITI is a global initiative and the EITI Secretariat has developed an EITI Source Book that provides guidance for countries and companies wish-ing to implement the initiative (www.eitransparency.org/)
Country Policy and Institutional Assessment (CPIA) overall rating (IDA re-source allocation index) assesses the quality of a country’s current policy and institutional framework. “Quality” means how conducive that frame-work is to fostering sustainable, poverty-reducing growth and the effective use of development assistance. The CPIA is conducted annually for all Inter-national Bank for Reconstruction and Development and International Devel-opment Association borrowers. Ratings are based on 16 criteria, grouped in
LDB Africa 12-2-08.indd 109 12/2/08 12:20:46 PM

110 2008 The Little Data Book on Africa
four clusters: economic management, structural policies, policies for social inclusion and equity, and public sector management and institutions. The criteria reflect a balance between ensuring that all key factors that foster pro-poor growth and poverty alleviation are captured without overly burden-ing the evaluation process. Country scores reflect a variety of indicators and judgments that are based on country knowledge, analytic work, policy dialogue, or work done by partners as well as relevant publicly available indicators. The rating scale for each criterion varies from 1 (low) to 6 (high). Countries may also receive intermediate scores of 1.5, 2.5, 3.5, 4.5, and 5.5. The ratings are the main determinant of prospects for current aid ef-fectiveness. Improvements in policies and institutions during the course of the year are reflected in the subsequent year’s performance ratings. (World Bank Country Policy and Institutional Assessments)
Court system is fair, impartial and uncorrupted, is the percentage of firms believing the court system is fair, impartial and uncorrupted as a major con-straint. The computation of the indicator is based on the rating of the obstacle as a potential constraint to the current operations of the establishment. (World Bank’s Doing Business project (http://rru.worldbank.org/DoingBusiness).
Crime, theft and disorder is the percentage of firms who ranked crime, theft, and disorder as a major constraint. The computation of the indica-tor is based on the rating of the obstacle as a potential constraint to the current operations of the establishment. (World Bank Enterprise Surveys, http://rru.worldbank.org/EnterpriseSurveys/)
Current account balance is the sum of net exports of goods, services, net income, and net current transfers. (International Monetary Fund’s Balance of Payments Statistics Yearbook and data files; World Bank and Organisa-tion for Economic Co-operation and Development estimates of gross do-mestic product)
Deaths due to HIV/AIDS is the estimated number of adults and children that have died in a specific year based on the modeling of HIV surveil-lance data using standard and appropriate tools. (Joint United Nations Pro-gramme on HIV/AIDS’ 2004 Report on the Global AIDS Epidemic)
Debt service relief committed under HIPC is the amount of debt service re-lief, calculated at the decision point, that will allow the country to achieve debt sustainability at the completion point. (World Bank)
Delay for firm in obtaining electrical connection is the average actual de-lay in days that firms experience when obtaining an electrical connection, measured from the day the establishment applied to the day it received the service or approval. (World Bank Investment Climate Assessments)
Domestic credit to private sector is financial resources provided to the private sector, such as through loans, purchases of nonequity securities, and trade credits and other accounts receivable, that establish a claim for repayment. For some countries these claims include credit to public enterprises. (International Monetary Fund’s International Financial Statis-tics and data files; World Bank and Organization for Economic Co-operation and Development gross domestic product estimates; World Bank’s World Development Indicators)
Economic density is gross domestic product (GDP) at market prices in cur-rent U.S. dollars divided by the total land area in square kilometers. “Land area” refers to the land surface area of a country, excluding inland waters. GDP at market prices in current U.S. dollars is based on the GDP at market
Glossary
LDB Africa 12-2-08.indd 110 12/2/08 12:20:46 PM

The Little Data Book on Africa 2008 111
prices in local currency units, which is converted to dollars at the official exchange rate. If the official exchange rate is significantly different from the prevailing market rate or shows extreme volatility, the local currency is converted into U.S. dollars using an alternative conversion factor. (World Bank’s World Development Indicators)
Electricity is the percentage of firms who ranked electricity as a major constraint. The computation of the indicator is based on the rating of the obstacle as a potential constraint to the current operations of the estab-lishment. (World Bank Enterprise Surveys, http://rru.worldbank.org/ EnterpriseSurveys/)
Electric power outages in a typical month is the average number of days per year that establishments experienced power outages or surges from the public grid. (World Bank Investment Climate Assessments)
Export diversification index measures the extent to which exports are di-versified. It is constructed as the inverse of a Herfindahl index, using disag-gregated exports at four digits (following the Standard International Trade Classification Revision 3). A higher index indicates more export diversifica-tion. (Organization for Economic Co-operation and Development)
Exports of goods and services are merchandise exports divided by gross domestic product (GDP) in current U.S. dollars. (World Bank’s World De-velopment Indicators)
Fertilizer consumption is the aggregate of nitrogenous, phosphate, and pot-ash fertilizers. (Food and Agriculture Organization’s Fertilizer Yearbook)
Finance is the percentage of firms who ranked access to finance or cost of finance as a major constraint. The computation of the indicator is based on the rating of the obstacle as a potential constraint to the current operations of the establishment. (http://rru.worldbank.org/ EnterpriseSurveys
Fiscal balance is revenue (including grants) minus expense, minus net acquisition of nonfinancial assets. In the International Monetary Fund’s Government Finance Statistics Manual 1986 nonfinancial assets were in-cluded under revenue and expenditure in gross terms. This cash surplus or deficit is closest to the earlier overall budget balance (still missing is lend-ing minus repayments, which is now a financing item under net acquisition of financial assets). (World Bank’s World Development Indicators)
Foreign direct investment, net inflows, is the net inflows of investment to acquire a lasting management interest (10 percent or more of voting stock) in an enterprise operating in an economy other than that of the in-vestor. It is the sum of equity capital, reinvestment of earnings, other long-term capital, and short-term capital as shown in the balance of payments. (World Bank’s World Development Indicators)
Gini index is the most commonly used measure of inequality. The coefficient ranges from 0, which reflects complete equality, to 1, which indicates com-plete inequality (one person has all the income or consumption, all others have none). Graphically, the Gini coefficient can be easily represented by the area between the Lorenz curve and the line of equality. (World Bank’s World Development Indicators)
Government effectiveness measures the quality of public services, the quality and degree of independence from political pressures of the civil
LDB Africa 12-2-08.indd 111 12/2/08 12:20:46 PM

112 2008 The Little Data Book on Africa
service, the quality of policy formulation and implementation, and the cred-ibility of the government’s commitment to such policies. (Kaufmann, D., A. Kraay, and M. Mastruzzi, 2005, Governance Matters IV: Governance Indicators for 1996–2004)
Gross domestic product (GDP) is the total output of goods and services for final use produced by residents and nonresidents, regardless of the alloca-tion to domestic and foreign claims. It is calculated without deducting for depreciation of “manmade” assets or depletion and degradation of natural resources. GDP data are at market prices (also known as purchaser values) and have been converted to U.S. dollars using constant (2000) exchange rates. For a few countries where the official exchange rate does not effec-tively reflect the rate applied to actual foreign exchange transactions, an alternative currency conversion factor has been used. (World Bank’s World Development Indicators)
Gross domestic product (GDP) growth is the average annual growth rate calculated from GDP at constant 2000 prices. (World Bank’s World Devel-opment Indicators)
Gross domestic product (GDP) implicit price deflator is the one-year rate of price change in the economy as a whole (World Bank’s World Develop-ment Indicators)
Gross domestic product (GDP) per capita is calculated by dividing GDP by the corresponding midyear population. (World Bank’s World Development Indicators)
Gross domestic product (GDP) per capita growth is the average annual growth rate of real GDP per capita. (World Bank’s World Development Indicators)
Gross domestic savings is calculated by deducting total consumption from nominal gross domestic product (World Bank’s World Development Indicators)
Gross fixed capital formation includes land improvements (fences, ditches, drains, and so on); plant, machinery, and equipment purchases; and the construction of roads, railways, and the like, including schools, offices, hospitals, private residential dwellings, and commercial and industrial buildings. According to the 1993 System of National Accounts, net acqui-sitions of valuables are also considered capital formation. (World Bank’s World Development Indicators)
Gross national income (GNI) per capita is calculated using the World Bank Atlas method. It is similar in concept to GNI per capita in current prices, except that the use of three-year averages of exchange rates smoothes out sharp fluctuations from year to year. (World Bank’s World Development Indicators)
Gross primary school enrollment, total, is the ratio of total enrollment, re-gardless of age, to the population of the age group that officially corresponds to the primary level of education. Primary education provides children with basic reading, writing, and mathematics skills along with an elementary un-derstanding of such subjects as history, geography, natural science, social science, art, and music. (World Bank’s World Development Indicators)
Gross secondary school enrollment, total, is the ratio of total enrollment, regardless of age, to the population of the age group that officially cor-responds to the secondary level of education. Secondary education com-
Glossary
LDB Africa 12-2-08.indd 112 12/2/08 12:20:46 PM

The Little Data Book on Africa 2008 113
pletes the provision of basic education that began at the primary level, and aims at laying the foundations for lifelong learning and human development, by offering more subject- or skill-oriented instruction using more special-ized teachers. (World Bank’s World Development Indicators)
Gross tertiary school enrollment, total, is the ratio of total enrollment, regardless of age, to the population of the age group that officially cor-responds to the tertiary level of education. Tertiary education, whether or not to an advanced research qualification, normally requires, as a minimum condition of admission, the successful completion of education at the sec-ondary level. (World Bank’s World Development Indicators)
Households with own telephone are the percentage of urban or rural house-holds possessing a telephone as a proportion of the total number of urban or rural households, respectively. (Demographic and Health Surveys)
Imports of goods and services are merchandise imports divided by gross domestic product (GDP) in current U.S. dollars. (World Bank’s World De-velopment Indicators)
Improved sanitation is the percentage of the population with at least ad-equate access to excreta disposal facilities that can effectively prevent hu-man, animal, and insect contact with excreta. Improved facilities range from simple but protected pit latrines to flush toilets with a sewerage connection. The excreta disposal system is considered adequate if it is private or shared (but not public) and if it hygienically separates human excreta from human contact. To be effective, facilities must be correctly constructed and prop-erly maintained. (World Bank’s World Development Indicators)
Improved water source is the percentage of population with reasonable ac-cess to an adequate amount of water from an improved source, such as a household connection, public standpipe, borehole, protected well or spring, or rainwater collection. Unimproved sources include vendors, tanker trucks, and unprotected wells and springs. Reasonable access is defined as the availability of at least 20 liters a person a day from a source within 1 kilome-ter of the user’s dwelling. (World Bank’s World Development Indicators)
Industry value added corresponds to ISIC divisions 10–45 and includes manu-facturing (ISIC divisions 15–37). It comprises value added in mining, manu-facturing (also reported as a separate subgroup), construction, electricity, water, and gas. Value added is the net output of a sector after adding up all outputs and subtracting intermediate inputs. It is calculated without making deductions for depreciation of fabricated assets or depletion and degradation of natural resources. The origin of value added is determined by the Inter-national Standard Industrial Classification (ISIC), revision 3. Note: For VAB countries, gross value added at factor cost is used as the denominator. (World Bank national accounts data, and OECD National Accounts data files.)
Infant mortality rate is the number of infants dying before reaching one year of age, per 1,000 live births in a given year. (World Bank’s World Develop-ment Indicators)
Internet users are the number of people with access to the worldwide net-work, per 100 people. (World Bank’s World Development Indicators)
Irrigated land is areas equipped to provide water to crops. These include areas equipped for full and partial control irrigation, spate irrigation, and equipped wetland or inland valley bottoms. (Food and Agriculture Organiza-tion’s Production Yearbook and data files)
LDB Africa 12-2-08.indd 113 12/2/08 12:20:46 PM
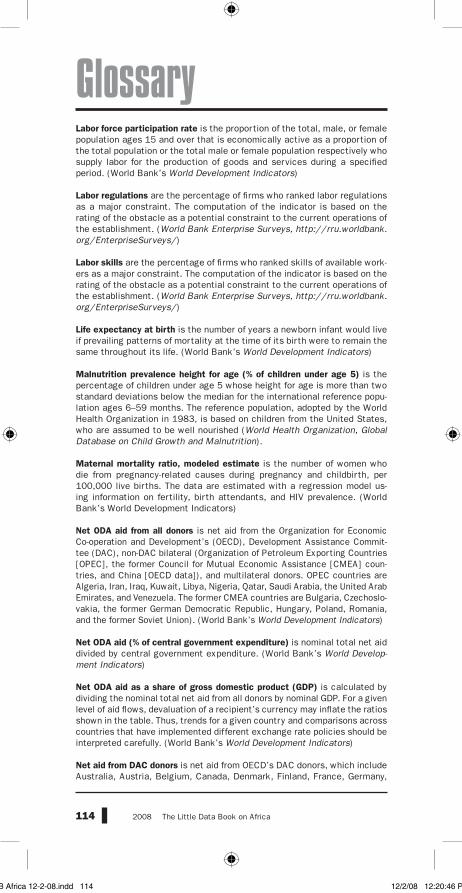
114 2008 The Little Data Book on Africa
Labor force participation rate is the proportion of the total, male, or female population ages 15 and over that is economically active as a proportion of the total population or the total male or female population respectively who supply labor for the production of goods and services during a specified period. (World Bank’s World Development Indicators)
Labor regulations are the percentage of firms who ranked labor regulations as a major constraint. The computation of the indicator is based on the rating of the obstacle as a potential constraint to the current operations of the establishment. (World Bank Enterprise Surveys, http://rru.worldbank.org/EnterpriseSurveys/)
Labor skills are the percentage of firms who ranked skills of available work-ers as a major constraint. The computation of the indicator is based on the rating of the obstacle as a potential constraint to the current operations of the establishment. (World Bank Enterprise Surveys, http://rru.worldbank.org/EnterpriseSurveys/)
Life expectancy at birth is the number of years a newborn infant would live if prevailing patterns of mortality at the time of its birth were to remain the same throughout its life. (World Bank’s World Development Indicators)
Malnutrition prevalence height for age (% of children under age 5) is the percentage of children under age 5 whose height for age is more than two standard deviations below the median for the international reference popu-lation ages 6–59 months. The reference population, adopted by the World Health Organization in 1983, is based on children from the United States, who are assumed to be well nourished (World Health Organization, Global Database on Child Growth and Malnutrition).
Maternal mortality ratio, modeled estimate is the number of women who die from pregnancy-related causes during pregnancy and childbirth, per 100,000 live births. The data are estimated with a regression model us-ing information on fertility, birth attendants, and HIV prevalence. (World Bank’s World Development Indicators)
Net ODA aid from all donors is net aid from the Organization for Economic Co-operation and Development’s (OECD), Development Assistance Commit-tee (DAC), non-DAC bilateral (Organization of Petroleum Exporting Countries [OPEC], the former Council for Mutual Economic Assistance [CMEA] coun-tries, and China [OECD data]), and multilateral donors. OPEC countries are Algeria, Iran, Iraq, Kuwait, Libya, Nigeria, Qatar, Saudi Arabia, the United Arab Emirates, and Venezuela. The former CMEA countries are Bulgaria, Czechoslo-vakia, the former German Democratic Republic, Hungary, Poland, Romania, and the former Soviet Union). (World Bank’s World Development Indicators)
Net ODA aid (% of central government expenditure) is nominal total net aid divided by central government expenditure. (World Bank’s World Develop-ment Indicators)
Net ODA aid as a share of gross domestic product (GDP) is calculated by dividing the nominal total net aid from all donors by nominal GDP. For a given level of aid flows, devaluation of a recipient’s currency may inflate the ratios shown in the table. Thus, trends for a given country and comparisons across countries that have implemented different exchange rate policies should be interpreted carefully. (World Bank’s World Development Indicators)
Net aid from DAC donors is net aid from OECD’s DAC donors, which include Australia, Austria, Belgium, Canada, Denmark, Finland, France, Germany,
Glossary
LDB Africa 12-2-08.indd 114 12/2/08 12:20:46 PM

The Little Data Book on Africa 2008 115
Greece, Ireland, Italy, Japan, Luxembourg, the Netherlands, New Zealand, Norway, Portugal, Spain, Sweden, Switzerland, the United Kingdom, and the United States. (World Bank’s World Development Indicators)
Net ODA aid from multilateral donors is net aid from multilateral sources, such as the African Development Fund, the European Development Fund for the Commission of the European Communities, the International Devel-opment Association, the International Fund for Agricultural Development, Arab and Organization of the Petroleum Exporting Countries (OPEC)–fi-nanced multilateral agencies, and UN programs and agencies. Aid flows from the International Monetary Fund’s (IMF) Trust Fund and Structural Ad-justment Facility are also included. UN programs and agencies include the United Nations Technical Assistance Programme, the United Nations Devel-opment Programme, the UN Refugee Agency, the United Nations Children’s Fund, and the World Food Programme. Arab and OPEC-financed multilateral agencies include the Arab Bank for Economic Development in Africa, the Arab Fund for Economic and Social Development, the Islamic Development Bank, the OPEC Fund for International Development, the Arab Authority for Agricultural Investment and Development, the Arab Fund for Technical Assistance to African and Arab Countries, and the Islamic Solidarity Fund. (World Bank’s World Development Indicators)
Net ODA aid from non-DAC bilateral donors is net aid from OECD’s non-DAC donors, which include Czech Republic, Hungary, Iceland, Israel, Korea Republic, Kuwait, Poland, Saudi Arabia, Slovak Republic, Taiwan China, Thailand, Turkey and United Arab Emirates and other donors (World Bank’s World Development Indicators)
Net ODA aid per capita is calculated by dividing the nominal total net aid (net disbursements of loans and grants from all official sources on conces-sional financial terms) by midyear population. These ratios offer some indi-cation of the importance of aid flows in sustaining per capita income and consumption levels, although exchange rate fluctuations, the actual rise of aid flows, and other factors vary across countries and over time. (World Bank’s World Development Indicators)
Number of Startup procedures for new business are the number of proce-dures required to start a business, including interactions to obtain neces-sary permits and licenses and to complete all inscriptions, verifications, and notifications to start operations. (World Bank’s Doing Business proj-ect, http://rru.worldbank.org/DoingBusiness/)
PDI-1 Operational national development strategies are the degree to the extent to which a country has an operational development strategy to guide the aid coordination effort and the country’s overall development. The score is based on the World Bank’s 2005 Comprehensive Development Framework Progress Report. An operational strategy calls for a coherent long-term strategy derived from it; specific targets serving a holistic, bal-anced and well sequenced development strategy; and capacity and re-sources for its implementation. (Overview of the Results 2007 Survey on Monitoring the Paris Declaration and World Bank data.)
PDI-12 Existence of a mutual accountability indicates whether there is a mechanism for mutual review of progress on aid effectiveness commit-ments. This is an important innovation of the Paris Declaration because it develops the idea that aid is more effective when both donors and partner governments are accountable to their constituents for the use of resources to achieve development results and when they are accountable to each other. The specific focus is mutual accountability for the implementation
LDB Africa 12-2-08.indd 115 12/2/08 12:20:47 PM

116 2008 The Little Data Book on Africa
of the partnership commitments included in the Paris Declaration and any local agreements on enhancing aid effectiveness. (Overview of the Results 2007 Survey on Monitoring the Paris Declaration and World Bank data).
Physicians per 1,000 people are the number of physicians, including gener-alists and specialists, per 1,000 people. (World Bank’s World Development Indicators)
Polity score is computed by subtracting the Institutionalized autocracy score from the Institutionalized democracy score; the resulting unified polity scale ranges from +10 (strongly democratic) to –10 (strongly auto-cratic). (Polity IV Project Political Regime Characteristics and Transitions, 1800–2006, Center for Systemic Peace www.systemicpeace.org/polity).
Population is total population is based on the de facto definition of popula-tion, which counts all residents regardless of legal status or citizenship—except for refugees not permanently settled in the country of asylum, who are generally considered part of the population of their country of origin. The values shown are midyear estimates. (World Bank’s World Development Indicators)
Population growth is the one-year rate of growth in total population. (World Bank’s World Development Indicators)
Population ages 0–24 (% of total population) is the percentage of the total population that is in the age group 0 to 24. World Bank staff es-timates from various sources including census reports, (United Nations Population Division’s World Population Prospects, national statistical offices, household surveys conducted by national agencies, and Macro International)
Poverty headcount ratio at national poverty line is the percentage of the population living below the national poverty line. National estimates are based on population-weighted subgroup estimates from household surveys. (World Bank’s World Development Indicators)
Prevalence of HIV is the percentage of people ages 15–49 infected by HIV. (World Bank’s World Development Indicators)
Primary school completion rate, total, is the percentage of students com-pleting the last year of primary school. It is calculated as the total number of students in the last grade of primary school, minus the number of repeat-ers in that grade, divided by the total number of children of official gradua-tion age. (World Bank’s World Development Indicators)
Private sector capital formation is gross fixed capital formation for the private sector. Gross fixed capital formation consists of gross domestic fixed capital formation plus net changes in the level of inventories, divided by gross domestic product (GDP), which is obtained by converting national currency GDP series in current prices to U.S. dollars at official annual ex-change rates. (World Bank’s World Development Indicators)
Protecting investors disclosure index measures the degree to which in-vestors are protected through disclosure of ownership and financial infor-mation. (World Bank’s Doing Business project, http://rru.worldbank.org/DoingBusiness/)
Public current education expenditure, primary is the share of public cur-rent expenditure on education that is devoted to primary education. (Unit-
Glossary
LDB Africa 12-2-08.indd 116 12/2/08 12:20:47 PM

The Little Data Book on Africa 2008 117
ed Nations Educational, Scientific and Cultural Organization Institute for Statistics)
Ratio of girls to boys in primary and secondary school is the ratio of female to male gross enrollment rates in primary and secondary school. (United Nations Educational, Scientific and Cultural Organization Institute for Statistics)
Ratio of paved to total roads is the length of paved roads, which are sur-faced with crushed stone (macadam) and hydrocarbon binder or bituminized agents, with concrete, or with cobblestones, as a percentage of the length of all the country’s roads. (World Bank’s World Development Indicators)
Real effective exchange rate is the nominal effective exchange rate (a measure of the value of a currency against a weighted average of several foreign currencies) divided by a price deflator or index of costs. (Interna-tional Monetary Fund’s International Financial Statistics).
Real interest rate is the lending interest rate adjusted for inflation as mea-sured by the gross domestic product (GDP) deflator. (International Mon-etary Fund’s International Financial Statistics and data files, using World Bank data on the GDP deflator)
Regulatory quality measures the ability of the government to formulate and implement sound policies and regulations that permit and promote private sector development (Kaufmann, D., A. Kraay, and M. Mastruzzi, 2005, Gov-ernance Matters IV: Governance Indicators for 1996–2004)
Rigidity of employment index measures the regulation of employment, spe-cifically the hiring and firing of workers and the rigidity of working hours. This index is the average of three subindexes: a difficulty of hiring index, a rigidity of hours index, and a difficulty of firing index. (World Bank’s Doing Business project, http://rru.worldbank.org/DoingBusiness/)
Road density is the total length of national road network per 1,000 square kilometers of total land area. (World Bank’s World Development Indicators)
Rule of law measures the extent to which agents have confidence in and abide by the rules of society, in particular the quality of contract enforce-ment, the police, and the courts, as well as the likelihood of crime and violence. (Kaufmann, D., A. Kraay, and M. Mastruzzi, 2005, Governance Matters IV: Governance Indicators for 1996–2004)
Rural population (% of total population) is calculated as the difference be-tween the total population and the urban population. The data on urban population shares used to estimate rural population come from the United Nations, World Urbanization Prospects. Total population figures are World Bank estimates. (World Bank’s World Development Indicators)
Services plus discrepancy value added correspond to ISIC divisions 50–99 and they include value added in wholesale and retail trade (including hotels and restaurants), transport, and government, financial, professional, and personal services such as education, health care, and real estate services. Also included are imputed bank service charges, import duties, and any statistical discrepancies noted by national compilers as well as discrepan-cies arising from rescaling. Value added is the net output of a sector after adding up all outputs and subtracting intermediate inputs. It is calculated without making deductions for depreciation of fabricated assets or deple-tion and degradation of natural resources. The industrial origin of value added is determined by the International Standard Industrial Classification
LDB Africa 12-2-08.indd 117 12/2/08 12:20:47 PM

118 2008 The Little Data Book on Africa
(ISIC), revision 3. Note: For VAB countries, gross value added at factor cost is used as the denominator. (World Bank national accounts data, and OECD National Accounts data files.)
Student-teacher ratio, primary school, is the number of pupils enrolled in primary school divided by the number of primary school teachers (regard-less of their teaching assignment). (World Bank’s World Development Indicators)
Tax rates are the percentage of firms who ranked tax rates as a major constraint. The computation of the indicator is based on the rating of the obstacle as a potential constraint to the current operations of the estab-lishment. (World Bank Enterprise Surveys, http://rru.worldbank.org/ EnterpriseSurveys/)
Telephone subscribers are subscribers to a main telephone line service, which connects a customer’s equipment to the public switched telephone network, or to a cellular telephone service, which uses cellular technology. (World Bank’s World Development Indicators)
Terms of trade index measures the relative movement of export and import prices. It is calculated as the ratio of a country’s export unit values or prices to its import unit values or prices relative to a base year (2000). (World Bank’s World Development Indicators)
Time to enforce a contract is the number of calendar days from the filing of the lawsuit in court until the final determination and, in appropriate cases, payment. (World Bank’s Doing Business project (http://rru.worldbank.org/DoingBusiness/).
Time to prepare, file, and pay taxes is the number of hours it takes to pre-pare, file, and pay (or withhold) three major types of taxes: the corporate income tax, the value added or sales tax, and labor taxes, including payroll taxes and social security contributions. (World Bank, Doing Business proj-ect (http://www.doingbusiness.org/).
Time to register a property is the number of calendar days needed for busi-nesses to secure rights to property. (World Bank’s Doing Business project, http://rru.worldbank.org/DoingBusiness/)
Time to start a business is the number of calendar days needed to com-plete the procedures to legally operate a business. If a procedure can be speeded up at additional cost, the fastest procedure, independent of cost, is chosen. (World Bank’s Doing Business project, http://rru.worldbank.org/DoingBusiness/)
Total external debt is the ratio of total debt (sum of long-term debts in the form of official concessional, official nonconcessional, and private debt plus International Monetary Fund credit and estimates of total short-term debt and interest in arrears on public and publicly guaranteed long-term loans) to gross domestic product (GDP). (World Bank’s World Development Indicators)
Total tax rate (%profit) are taxes on income, profits, and capital gains are levied on the actual or presumptive net income of individuals, on the prof-its of corporations and enterprises, and on capital gains, whether realized or not, on land, securities, and other assets. Intragovernmental payments are eliminated in consolidation. (International Monetary Fund, Government Finance Statistics Yearbook and data files).
Glossary
LDB Africa 12-2-08.indd 118 12/2/08 12:20:47 PM

The Little Data Book on Africa 2008 119
Under-five mortality rate is the probability that a newborn baby will die before reaching age five, if subject to current age-specific mortality rates. (World Bank’s World Development Indicators) Voice and accountability measures the extent to which a country’s citizens are able to participate in selecting their government and to enjoy freedom of expression, freedom of association, and a free media. (Kaufmann, D., A. Kraay, and M. Mastruzzi, 2005, Governance Matters IV: Governance Indica-tors for 1996–2004)
Workers remittances received comprise current transfers by migrant work-ers and wages and salaries by nonresident workers. (World Bank’s World Development Indicators)
Youth literacy rate, total, is the percentage of people ages 15–24 who can, with understanding, both read and write a short, simple statement about their everyday life. (World Bank’s World Development Indicators)
LDB Africa 12-2-08.indd 119 12/2/08 12:20:47 PM

LDB Africa 12-2-08.indd 120 12/2/08 12:20:47 PM

LDB Africa 12-2-08.indd 121 12/2/08 12:20:47 PM

LDB Africa 12-2-08.indd 122 12/2/08 12:20:47 PM