2009 direct observation surveys of booster seat final report
TRANSCRIPT

FINAL REPORT
2009 Direct Observation Surveys of Booster Seat Use
Prepared for:Office of Highway Safety Planning
4000 Collins RoadLansing, MI
Prepared by:Wayne State University
Transportation Research GroupDetroit, MI
Date: September 2009
ii
2009 Direct Observation Surveys of Booster Seat Use
Prepared for:
Office of Highway Safety Planning 4000 Collins Road
Lansing, MI
Prepared by: Wayne State University
Transportation Research Group Detroit, MI
Date: September 2009 The opinions, findings, and conclusions expressed in this publication are those of the author(s) and not necessarily those of the Michigan Office of Highway Safety and Planning, the U.S. Department of Transportation, or the National Highway Transportation Safety Administration. This report was prepared in cooperation with the Michigan Office of Highway Safety Planning and the U.S. Department of Transportation, and the National Highway Traffic Safety Administration.

i
Technical Report Documentation Page
1. Report No.
2. Government Accession No. 3. Recipient’s Catalog No. 5. Report Date September 2009
4. Title and Subtitle 2009 Direct Observation Surveys of Booster Seat Use
6. Performing Organization Code
7. Author(s) Peter T. Savolainen, Timothy J. Gates, Tapan K. Datta
8. Performing Organization Report No.
10. Work Unit No. (TRAIS)
9. Performing Organization Name and Address Wayne State University-Transportation Research Group Department of Civil and Environmental Engineering 5050 Anthony Wayne Drive, Room 0504 Detroit, MI 48202
11. Contract or Grant No.
13. Type of Report and Period Covered Final Report
12. Sponsoring Agency Name and Address Office of Highway Safety Planning 4000 Collins Road Lansing, MI 48909 14. Sponsoring Agency Code
15. Supplementary Notes
16. Abstract This study reports the results of the 2009 statewide direct observation surveys of booster seat use in the State of Michigan. Two waves of observational surveys were conducted as a part of this study, one approximately six months after the State’s passage of mandatory booster seat legislation and a second survey conducted twelve months post-legislation. All drivers and child passengers between ages 4 and 7 were observed for safety restraint use. Additional data was also collected, including child passenger seating position, vehicle type, and gender, age and race of the driver. Six months after enactment of the legislation, the statewide booster seat use rate was 36.7 percent and the use rate increased to 51.2 percent 12 months after enactment. While booster seat use has increased dramatically since the last statewide survey in 2004, a large percentage of Michigan children continue to travel while inappropriately restrained. 17. Key Words Booster Seat, Child Restraint, Michigan, Safety
18. Distribution Statement Unlimited
19. Security Classification (report) Unclassified
20. Security Classification (Page) Unclassified
21. No of Pages 37
22. Price

i
TABLE OF CONTENTS
PAGE 1.0 INTRODUCTION .................................................................................................................... 1 2.0 STUDY OBJECTIVES............................................................................................................. 2 3.0 METHODOLOGY ....................................................................................................................4 3.1 Sampling Strategy............................................................................................................5 3.2 Observer Training ............................................................................................................7 3.3 Data Collection Procedures..............................................................................................7 3.4 Site Selection ...................................................................................................................9 4.0 DATA COLLECTION ............................................................................................................12 5.0 DATA ANALYSIS..................................................................................................................15 5.1 Statewide Booster Seat Use Calculation........................................................................15 5.2 Statewide Booster Seat Use Variance Calculation ........................................................16 6.0 RESULTS AND CONCLUSIONS..........................................................................................17 6.1 Statewide and Stratum-Level Booster Seat Use Rates ..................................................17 6.2 Booster Seat Use Rates by Geographic, Vehicle, and Driver Characteristics ...............19 6.3 Conclusions....................................................................................................................22 7.0 REFERENCES ........................................................................................................................24 APPENDIX I – LIST OF DAYCARE CENTERS OBSERVED..................................................26 APPENDIX II – LIST OF ELEMENTARY SCHOOLS OBSERVED ........................................28 APPENDIX III – LIST OF FAST FOOD RESTAURANTS OBSERVED..................................30 APPENDIX IV – LIST OF SHOPPING CENTERS OBSERVED...............................................32 APPENDIX V – LIST OF ROADSIDE LOCATIONS OBSERVED ..........................................35

ii
LIST OF FIGURES PAGE Figure 1. Sample Data Collection Form ........................................................................................ 8
LIST OF TABLES
Table 1. 2007 Population Estimate of Children Ages 0 to 7 by County...................................... 10 Table 2. Michigan Counties by Stratum ...................................................................................... 11 Table 3. Summary of Observations by Stratum and Site Type.................................................... 13 Table 4. Summary of Observations by Vehicle Characteristics ...................................................14 Table 5. Summary of Observations by Driver Characteristics .....................................................15 Table 6. Statewide Weighted Booster Seat Use Rate for 4-to-7 Year Old Child Passengers.......18 Table 7. Statewide Weighted Restraint Use Rates for 4-to-7 Year Old Child Passengers...........18 Table 8. Booster Seat Use Summary by Stratum..........................................................................19 Table 9. Booster Seat Use Summary by Site Type.......................................................................19 Table 10. Booster Seat Use Summary by Vehicle Characteristics ...............................................20 Table 11. Booster Seat Use Summary by Driver Characteristics .................................................21

1
1.0 INTRODUCTION
Traffic crashes are the leading cause of death among children between the ages of 5 and 14 and
the second most frequent cause of death among children under age 5 in the State of Michigan [1].
Improper use of child restraint devices has been recognized as a significant factor contributing to
this public health dilemma. From 2004 to 2008, a total of 5,372 children between the ages of 4
and 7 were injured in Michigan traffic crashes [2]. Of those crash-involved child passengers,
only 1,329 were restrained in some type of child restraint device. Among those children who
were restrained in a child restraint device, 5.3 percent suffered fatal or incapacitating injuries in
comparison to 15.8 percent of children who were either improperly restrained in a child restraint
device or completely unrestrained [2]. These figures illustrate the heightened risks of injury
faced by children when traveling in automobiles with inappropriate restraint devices for their
particular age, weight, or height. Past research has shown that children between the ages of 4
and 7 and less than 4 feet 9 inches in height are best protected when restrained in either a child
safety seat or booster seat [3-5]. The risk of injury for children in this age group is reduced by
59 percent when a proper child restraint device is used and the risk of head or brain injuries is
reduced by 75 percent [4].
In light of such evidence, Section 14 of the Transportation Recall Enhancement, Accountability,
and Documentation (TREAD) Act of 2000 called for the development of a five-year strategic
plan to reduce deaths and injuries caused by a failure to use booster seats among 4 to 7 year old
children by 25 percent [6]. In response, several states passed legislation requiring the use of
booster seats by child passengers in this age group, including the State of Wisconsin on June 1,
2006. An evaluation study conducted at locations in Milwaukee, Wisconsin and using sites in
Detroit, Michigan as a control group revealed that a significantly higher proportion of children
were appropriately restrained in Milwaukee following the enactment of the law as compared to
Detroit [7]. Nationwide, research has revealed that children ages 4 through 7 in states with
booster seat laws are 39 percent more likely to be appropriately restrained in a booster seat or
child safety seat in comparison to states without booster seat laws [8].
In the State of Michigan, restraint use among child passengers under 4 years of age has increased
from 74.5 percent in 1997 to 91.8 percent in 2007 [9,10]. These gains may be due to various

2
factors, including increased public awareness efforts aimed at educating the public of the
importance of appropriate restraint use. However, restraint use among 4 to 7 year-olds has been
shown to be substantially lower. A 2004 direct observation survey revealed that only 13.7
percent of Michigan children in this age group were in a child restraint device, with 8.6 percent
of children in a booster seat and 5.1 percent in a child safety seat [11,12]. There are several
potential explanations for the low booster seat use rate, including a lack of knowledge regarding
the benefits of booster seats in comparison to seatbelts alone and differences in risk perception
among parents [13-19]. However, the primary reason appeared to be a lack of appropriate
booster seat legislation. In a 2004 telephone survey of 350 Michigan households with children
between the ages of 4 and 8, 60 percent of part-time and non-booster seat users said they would
be more likely to use booster seats if mandated by law. Among the part-time users, 70 percent of
the respondents stated they used booster seats because they believed it was the law [16].
Consequently, the State of Michigan passed Senate Bill 82 on March 27, 2008, requiring the use
of approved child restraint devices for all child passengers less than 8 years of age and less than
4 feet 9 inches in height.
2.0 STUDY OBJECTIVES
The purpose of this study is to determine the rate of booster seat use 6 months and 12 months
after the enactment of the booster seat legislation of Michigan Senate Bill 82 through direct
observation surveys. These survey results have the potential to provide valuable information
regarding changes in booster seat use throughout the State of Michigan and identify areas for
opportunity for increasing the use of appropriate child restraint devices by Michigan drivers.
Understanding the degree of nonuse will also assist agencies in developing educational efforts,
public awareness campaigns, and enforcement initiatives that may be used to improve booster
seat use. Prior to conducting these booster seat use surveys, a methodology was developed based
upon previous studies of child restraint device use that have been conducted both in Michigan
and nationwide. These studies have utilized a variety of implementation methods and sampling
designs.
Since 1998, the Children’s Hospital of Philadelphia has partnered with State Farm Insurance to
conduct a national study of restraint use. This study has utilized a 30-minute telephone survey to

3
collect data on 4 to 8 year old children involved in crashes where the crash-involved vehicle was
insured by the State Farm Insurance Company. Michigan is one of 16 states included in the
survey, which has reported nationwide booster seat use to have increased from 4 percent in 1999
to 46 percent in 2007 [20-23]. The 2007 study showed a booster seat use rate of 39 percent in
Michigan [23], though it should be noted that this data sample may not be representative of the
population of target age child passengers since these occupants were both crash involved and in a
vehicle insured by a specific insurance company.
The Motor Vehicle Occupant Safety Survey (MVOSS) is another telephone survey, conducted
biennially for the National Highway Traffic Safety Administration (NHTSA) to obtain data
related to occupant protection issues, including the use of child restraint devices. The 2003
survey provided data on 669 children between ages 4 and 7 and found that 21 percent had
reportedly used booster seats on at least one occasion during the year of the study [24].
One of the drawbacks of telephone surveys is the potential for self-selection bias as certain
persons may be more or less likely to respond or provide accurate information regarding their
use of restraint devices. Ideally, a survey design will allow for the direct, covert observation of
child passengers in a manner similar to the annual safety belt use surveys that are conducted in
the State of Michigan [25-28]. However, the random sampling procedure utilized for the safety
belt surveys is problematic when analyzing booster seat use due to the relatively low frequency
of target age child passengers generally observed at controlled intersections. Consequently, most
direct observation surveys of booster seat use are instead conducted using some form of
convenience sampling which occurs at locations subject to high volumes of 4-to-7 year old child
passengers.
The Safe Kids organization sponsored observational surveys and driver interviews as part of a
2002 study conducted at 174 sites nationwide, resulting in a sample of 9,332 children under age
15 [29]. Among children ages 4 through 7 and weighing over 40 pounds, 37 percent were
observed in booster seats. These observations were obtained from a sample of gas stations, fast
food restaurants, and shopping malls that were selected at the discretion of the trained observers.

4
Recently, the National Survey of the Use of Booster Seats (NSUBS) provided the first
nationwide probability-based estimate of booster seat use [30-32]. The survey resulted in
observations at 430 sites in 16 geographic areas across the country. Data was collected at four
types of sites, including gas stations, recreation centers, daycare centers, and fast-food
restaurants due to the expected high frequency of child trips at such locations. In the target 4 to 7
year-old age group, 37 percent of children were restrained in booster seats.
To date, one statewide direct observation survey of booster seat use was conducted in the State
of Michigan as part of a 2004 Michigan Department of Community Health study [11,12]. A total
of 3,420 children were observed at day care centers, grocery stores, shopping centers, and
McDonald’s restaurants. These types of sites were selected based upon National Household
Travel Survey (NHTS) data, which revealed trips to such establishments to be among the most
common for children in the target age group. Day care centers were observed during the
morning drop off period while the other types of establishments were observed during peak
traffic periods. Observations were conducted for 90-minute time periods at the day care centers
and 60-minute time periods at all other locations. Field staff observed the restraint use and
gender of 4-to-8 year old child passengers. The restraint use, gender, and age of the driver was
also observed and recorded as vehicles entered the parking areas of each establishment. Overall,
the statewide booster seat use rate was 8.6 percent and use was highest in sport-utility vehicles
and lowest in pickup trucks. Booster seat use rates were also higher for drivers between 30 and
59 years of age and when the driver was properly restrained.
This study builds off of the methodologies from these and other previous surveys of booster seat
use to estimate the booster seat use rate in the State of Michigan. The remainder of this report
documents the methods, procedures, and results of these direct observation surveys.
3.0 METHODOLOGY
The methodologies used in previous booster seat use surveys, both in Michigan and nationwide,
were examined to determine their appropriateness in addressing the needs of the Office of
Highway Safety Planning (OHSP) and the State of Michigan. In addition to booster seat

5
surveys, similar study designs were reviewed from direct observation surveys of safety belt and
child restraint device use in Michigan [9,10,25-28].
3.1 Sampling Strategy
Two specific sampling strategies were compared for consideration of implementation for the
statewide surveys. The two strategies can be broadly described as a “Roadside” sampling
strategy based upon the methodology developed for the 2005 to 2008 Direct Observation
Surveys of Safety Belt Use [25-27] and a “Destination” sampling strategy based upon the
methodology utilized in the recent National Survey of the Use of Booster Seats [30-32]. The
methodology from the NSUBS involves sampling of target age children from gas stations, day
care centers, fast food restaurants, and shopping centers and is closely related to that of recent
studies conducted in the State of Michigan [11,12,33,34].
Pilot data collection efforts were conducted during November and December at locations that
were randomly selected within Wayne County to compare these two sampling schemes. The
locations for the “Roadside” sample were randomly selected from the 41 sites within Wayne
County that are utilized for the annual safety belt surveys [25-27]. The “Destination” locations
were randomly selected from a list of 582 Wayne County elementary schools obtained from
SchoolTree.org [35] and from a list of businesses, including fast food restaurants and shopping
centers obtained from Microsoft Live Search Maps [36].
Data were collected at the “Roadside” locations throughout the day from approximately 7 AM to
4 PM. For the “Destination” locations, data were collected at elementary schools during the
periods immediately before school started in the morning and immediately after school finished
in the afternoon. Data were collected at the restaurants and shopping centers between the AM
and PM school data collection periods.
The pilot data revealed that during the periods before and after school, the “Destination” sample
yielded an average of 16.81 target age (4 to 7-year old) children per observer per hour in
comparison to 4.65 target age children per observer per hour for the “Roadside” sample. During
the off-peak period, the two samples yielded only 1.28 and 2.61 target age children per person

6
per hour, respectively. While the “Roadside” sample provided a marginally better sample size
during the off-peak periods, it should be noted that this data collection occurred in Wayne
County where the per-site traffic volumes are substantially larger than those of other sample
counties. It is assumed that the off-peak volumes in less populous counties would reduce these
samples further.
Based upon the findings of these pilot studies, the following destination-based sampling strategy
was proposed and accepted by the Office of Highway Safety Planning:
Weekdays
1. During the time period from approximately 7:30 to 9:00 AM (prior to the start of the
elementary school day), observations were conducted for one-hour periods at
elementary schools (one-half hour before the school start time until one-half hour
after).
2. During the time period from approximately 9:00 AM to 2:30 PM, observations were
conducted for 90-minute time periods at other destination locations, which included
shopping centers and fast food restaurants.
3. During the time period from approximately 2:30 PM to 3:30 PM (when elementary
schools are dismissed), additional one-hour observational studies were conducted at
elementary schools.
4. During the time period from 3:30 to 5:30 PM (or until darkness precluded the ability
of observers to accurately determine restraint usage), additional 90-minute studies
were conducted at other destination locations (shopping centers and fast food
restaurants).
Weekends
5. During the time period from approximately 7:30 AM to 5:30 PM (or until darkness
precluded the ability of observers to accurately determine restraint usage),
observations were conducted for 90-minute time periods at destination locations
consisting of shopping centers and fast food restaurants.

7
3.2 Observer Training
Staff members of the Wayne State University Transportation Research Group (WSU-TRG)
participated in the field data collection activities for this project. All participating staff members
were trained in general traffic data collection methods and procedures, and the majority of these
field observers also participated in 2008 direct observation surveys of safety belt use.
At the onset of the observer training program, each data collector received targeted instruction
comprised of classroom training and field data collection for the booster seat survey. Observers
were paired up for the field training, and field data collection involved two person teams at each
study location. In addition to the classroom training, each data collector also received a training
manual, supplementing the information received during the training session, as well as all
necessary field supplies.
The Principal Investigators conducted the classroom training sessions on October 30th and
December 4th of 2008 and on April 3rd and June 15th of 2009, in addition to monitoring the
performance of the field observers. Comparisons were made between the observations of each
paired observer, as well as between each group of observers. The performance of each observer
was assessed through a series of classroom tests and field training exercises conducted until
desired levels of performance were achieved. Classroom tests required observers to accurately
determine the age and restraint use of target age child passengers in photographs. Reliability and
repeatability were assessed by comparing the results of observations made within and between
pairs of observers in the field data collection exercises.
Observers who did not satisfy validity, repeatability, and reliability requirements were provided
additional training until such requirements were satisfied. Those observers who did not satisfy
these requirements were not sent into the field for the full-scale implementation of the surveys.
3.3 Data Collection Procedures
For the direct observation field surveys, the driver of each vehicle and all child passengers under
age 8 in each vehicle were observed for restraint use and non-use. A sample field observation
form is shown in Figure 1. In each survey, all drivers were identified based upon their gender,

8
age group, and ethnicity. In addition, the seating position and age of each child passenger was
recorded. It was assumed that neither gender nor ethnicity of the child passenger would impact
the use of booster seats and this data was not collected.
The vehicles were categorized into four groups: passenger vehicles, sport utility vehicles, vans or
minivans, and pickup trucks. Driver restraint use was categorized as one of the following: not
belted; belted; belt behind back; and belt under arm.
Due to similarities between the data collection efforts of the booster seat survey and a similar
survey on child restraint device use, a common form was utilized for both projects.
Consequently, an age assessment was required for each child passenger under age 8, in addition
to their restraint use and seating position in the vehicle. The same restraint use categories were
used as for the drivers, with the addition of categories for each of the four types of child restraint
devices (front-facing child safety seat, rear-facing child safety seat, high-back booster, and
backless booster).
BOOSTER SEAT/CHILD RESTRAINT DEVICE DIRECT OBSERVATION SURVEY FORMVehicle/Observation Number:______________ Location:____________________________Traffic Flow/Direction: ___________________ Site Number:___________ Date:_______
Time Started Observations: _________AM PM Time Ended Observations: _________AM PMVolume Count:____________/_____________ Observer’s Name/s_____________________
SAME VEHICLE/DRIVER AS PREVIOUS CHILD
4 to 7
Backless BoosterBelt Under ArmHigh-Back BoosterBelt Behind BackRear-Facing CSSBelted
0 to 3Front-Facing CSSNot BeltedSEATING POSITION:AGE:RESTRAINT USE:
CHILD PASSENGERNative American/OtherHispanicBelt Under ArmAsian or Pacific Islander60+Belt Behind BackAfrican AmericanFemale30-59BeltedCaucasianMale16-29Not Belted
RACE:GENDER:AGE:RESTRAINT USE:DRIVER
Passenger Car SUV Van/Minivan Pickup TruckVEHICLE TYPE:
DD
FIGURE 1: SAMPLE DATA COLLECTION FORM

9
3.4 Sample Size Determination and Site Selection
Once the sampling strategy was finalized, it was necessary to identify the individual sites to be
observed through the direct observation surveys. However, before making that determination, it
was first necessary to determine a target number of sites to ensure the reliability of the booster
seat use estimates. In order to calculate the number of children to observe within the target 4 to 7
year old age group, an acceptable error rate was specified, as well as a preliminary estimate of
the booster seat use rate among that age group. The following formula was then used, which
provides an approximate sample size for a two-sided test on a binomial proportion, such as the
proportion of booster seat users:
( )ppE
zn −⎟⎟
⎠
⎞⎜⎜⎝
⎛= 12/α ,
where:
n = minimum required sample size,
zα/2 = standard normal value corresponding to 95-percent confidence
E = acceptable error rate, and
p = proportion of children restrained in booster seats.
Assuming the 8.6 percent booster seat use rate from the 2004 survey [10,11] as a baseline and a 1
percent error rate in order to provide as precise an estimate as is practically possible, a target
sample size of 3,020 children between ages 4 and 7 was established.
These observations should be representative of vehicles and target age passengers within the
State of Michigan. In order to ensure the representativeness of the sample, these observations
should be diverse in terms of geographic coverage, vehicle mix, and socioeconomic
characteristics of the drivers. To ensure such representativeness, a methodology similar to the
NHTSA safety belt use survey requirements was utilized, similar to that of the recent direct
observation surveys of seat belt use conducted by the WSU-TRG. However, instead of sampling
from those counties which represent at least 85 percent of the state population, efficiencies are
created by instead selecting those counties which represent 85 percent of the target population
between ages 4 and 7. The census estimates of children in this age range are provided in Table 1
for the 26 counties that represent at least 85 percent of the target age population in the State of

10
Michigan. These 26 counties are all included among the 32 counties from the direct observation
surveys of seatbelt use, though differences in the population base allowed for the removal of
Clinton, Ionia, Isabella, Marquette, Montcalm, and St. Joseph counties.
TABLE 1 2007 Michigan Population Estimate of Children Ages 0 to 7 by County
County
Total Population Age 4 to 7
Percent of Statewide 4 to 7 Population
Cumulative Percent of 4 to 7 Population
Wayne 109,512 21.1% 21.1%Oakland 62,349 12.0% 33.1%Macomb 42,237 8.1% 41.2%Kent 36,923 7.1% 48.3%Genesee 23,669 4.6% 52.9%Washtenaw 17,006 3.3% 56.2%Ottawa 14,676 2.8% 59.0%Ingham 13,615 2.6% 61.6%Kalamazoo 12,497 2.4% 64.0%Saginaw 10,226 2.0% 66.0%Muskegon 9,333 1.8% 67.8%Livingston 9,269 1.8% 69.6%St. Clair 8,455 1.6% 71.2%Berrien 8,352 1.6% 72.8%Jackson 8,161 1.6% 74.4%Monroe 7,406 1.4% 75.8%Calhoun 7,197 1.4% 77.2%Allegan 6,096 1.2% 78.4%Bay 5,040 1.0% 79.4%Eaton 5,245 1.0% 80.4%Lenawee 4,994 1.0% 81.3%Lapeer 4,326 0.8% 82.2%Van Buren 4,246 0.8% 83.0%Midland 4,035 0.8% 83.8%Grand Traverse 4,034 0.8% 84.5%Shiawassee 3,552 0.7% 85.2%
The candidate counties were subsequently partitioned into four strata based upon historical
seatbelt use and vehicle miles traveled as per the direct observation surveys of safety belt use.
These counties were partitioned as shown in Table 2.

11
Table 2. Michigan Counties by Stratum
Stratum 1 Stratum 2 Stratum 3 Stratum 4 Ingham Allegan Berrien Wayne Kalamazoo Bay Calhoun Oakland Eaton Genesee Washtenaw Grand Traverse Lapeer Jackson Lenawee Kent Monroe Livingston Muskegon Macomb Saginaw Midland Shiawassee Ottawa St. Clair Van Buren
The specific sites to be observed were selected from a sample of locations that are expected to
yield high volumes of target age child passengers, including day care centers, fast food
restaurants, and shopping centers throughout the state. To allow for a direct comparison between
the results of these surveys and those conducted for the 2004 Michigan Department of
Community Health study, the same sites utilized as a part of that study were selected for use as a
part of this study. For the 6-month survey, elementary school sites were added to the sample as
this is the primary type of trip made during the school year according to National Household
Travel Survey data. A list of all elementary schools in the 26-county sample was obtained from
SchoolTree.org [35] and schools were randomly selected within each stratum in this list.
Another difference between the sites of the 2004 and 2009 studies was due to the fact that sites
were removed from those counties that were no longer among the 26 most populous counties in
terms of target age children due to changes in the 4-to-7 year old child population. In addition,
several of the destination locations observed in 2004 were no longer in business. The fast food
restaurant and shopping center sites were replaced from a list of businesses obtained through
Microsoft Live Search Maps [36]. Daycare centers were selected from a list provided through
the Michigan Department of Human Services [37]. These locations were also randomly selected
within each stratum. In cases where sites were removed due to a county no longer being
included in the sample, these locations were replaced by a sample of locations from the “new”
counties that were added to the sample for the 2009 surveys. Complete lists of locations used for
the booster seat use surveys are included by site type in Appendix I (Daycare Centers), Appendix

12
II (Elementary Schools), Appendix III (Fast Food Restaurants), Appendix IV (Shopping
Centers), and Appendix V (Roadside Locations) of this report.
During weekday surveys, the data collection schedule was arranged such that observations could
be conducted at an elementary school at the start of the day, followed by destination locations
that were en route to the second elementary school that would be visited later that day. Each
school was contacted to determine exact start and end times and each restaurant and shopping
center was contacted to ensure it was still in operation. In order to minimize the travel time and
distance required to conduct this study, the observation sites were clustered into geographic
regions upon final selection.
During the collection of the first wave of data, it was noted that the sample sizes for the non-
elementary school sites were substantially lower than was initially anticipated based upon the
2004 survey and the pilot data collection activities. Consequently, additional sites were added to
the sample until the minimum sample size requirement was met. For the 12-month post-
legislation survey, additional observational data was collected in coordination with the post-
Click-It-or-Ticket surveys of safety belt use to supplement the destination-based data.
4.0 DATA COLLECTION
The observational survey for the 6-month post-legislation statewide sample was performed
between Saturday, January 3rd and Wednesday, January 21st of 2009. During this observation
period, a total of 3,756 observations were made throughout the 26-county sample.
The observational survey for the 12-month post-legislation statewide sample was performed
between Sunday, May 31st and Tuesday, July 14th of 2009. During this observation period,
3,059 observations were made at the same sites used during the January survey, with the
exception of the school sites that were replaced by day care centers, in addition to data collected
at roadside locations in coordination with a post-Click-It-Or-Ticket survey of safety belt use.
Additional sites were added to the sample as the initial sample of locations did not meet the
sample size requirement of the study.
13
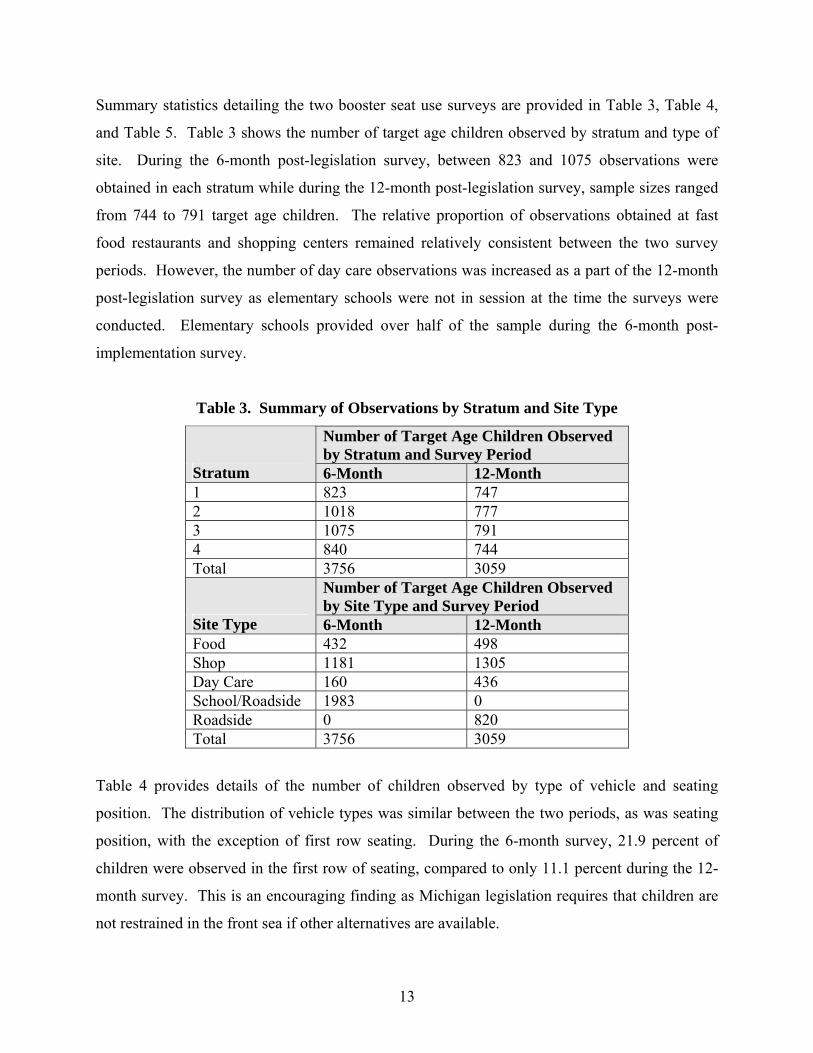
Summary statistics detailing the two booster seat use surveys are provided in Table 3, Table 4,
and Table 5. Table 3 shows the number of target age children observed by stratum and type of
site. During the 6-month post-legislation survey, between 823 and 1075 observations were
obtained in each stratum while during the 12-month post-legislation survey, sample sizes ranged
from 744 to 791 target age children. The relative proportion of observations obtained at fast
food restaurants and shopping centers remained relatively consistent between the two survey
periods. However, the number of day care observations was increased as a part of the 12-month
post-legislation survey as elementary schools were not in session at the time the surveys were
conducted. Elementary schools provided over half of the sample during the 6-month post-
implementation survey.
Table 3. Summary of Observations by Stratum and Site Type
Number of Target Age Children Observed by Stratum and Survey Period
Stratum 6-Month 12-Month 1 823 747 2 1018 777 3 1075 791 4 840 744 Total 3756 3059
Number of Target Age Children Observed by Site Type and Survey Period
Site Type 6-Month 12-Month Food 432 498 Shop 1181 1305 Day Care 160 436 School/Roadside 1983 0 Roadside 0 820 Total 3756 3059
Table 4 provides details of the number of children observed by type of vehicle and seating
position. The distribution of vehicle types was similar between the two periods, as was seating
position, with the exception of first row seating. During the 6-month survey, 21.9 percent of
children were observed in the first row of seating, compared to only 11.1 percent during the 12-
month survey. This is an encouraging finding as Michigan legislation requires that children are
not restrained in the front sea if other alternatives are available.

14
Table 4. Summary of Observations by Vehicle Characteristics
Number of Target Age Children Observed by Vehicle Type and Survey Period
Vehicle Type 6-Month 12-Month Passenger Car 1677 1403 Sport Utility Vehicle 961 773 Van/Minivan 911 693 Pickup Truck 207 190 Total 3756 3059
Number of Target Age Children Observed by Seating Position and Survey Period Child Passenger
Seating Position 6-Month 12-Month First Row – Center 19 10 First Row – Right 804 330 Second Row – Left 1526 1211 Second Row – Center 326 195 Second Row – Right 1001 1231 Third Row – Left 43 39 Third Row – Center 2 7 Third Row – Right 35 36 Total 3756 3059
Table 5 presents data on the number of children observed by various driver characteristics,
including gender, age, race, and belt use. Approximately one-third of children (33.4%) were
traveling with a male driver during the 6-month survey and this percentage decreased slightly
(29.9%) during the 12-month survey. The vast majority of drivers were in the 30-to-59 year old
age group, which comprised 86.3 percent of all observations during the 6-month survey and 84.5
percent during the 12-month survey. The percentage of drivers age 60 and above increased from
3.3 percent to 4.7 percent between the two survey periods while the percentage of drivers in the
youngest age group did not change significantly. The relative frequency of observations by
driver race also remained stable between the two survey periods. Safety belt use by the drivers
increased from 97.8 percent during the first wave of surveys to 98.8 percent during the second
wave. These rates were slightly above the statewide belt use average and the 12-month survey
was conducted after the conclusion of the Michigan State Police Click-It-Or-Ticket campaign,
which may have contributed to changes in both driver belt use and child restraint use.

15
Table 5. Summary of Observations by Driver Characteristics
Number of Target Age Children Observed By Driver Gender and Survey Period
Driver Gender 6-Month 12-Month Male 1253 915 Female 2503 2144 Total 3756 3059
Number of Target Age Children Observed by Driver Age and Survey Period
Driver Age 6-Month 12-Month 16 to 29 391 331 30 to 59 3242 2585 60 or above 123 143 3756 3059
Number of Target Age Children Observed by Driver Age and Survey Period
Driver Race 6-Month 12-Month Caucasian 2998 2506 African American 624 418 Asian or Pacific Islander 60 60 Hispanic 69 75 3751 3059
Number of Target Age Children Observed by Driver Restraint Use and Survey Period
Driver Belt Use 6-Month 12-Month Belted Appropriately 3673 3023 Not Belted Appropriately 83 36 Total 3756 3059
5.0 DATA ANALYSIS
Rates for booster seat use were determined at the state-level, as well as for each survey stratum,
and each of the characteristics previously described. The procedures used to calculate these rates
and their associated variances are outlined in this section of the report.
5.1 Statewide Booster Seat Use Rate Calculation
In order to determine the statewide booster seat use rate, a procedure was utilized similar to that
of previous studies, including the previous direct observation surveys of seatbelt use [25-27].
First, the booster seat use rate at each study location was calculated as shown here:

16
ij
ijij o
bg =
where:
gij = booster seat rate at location i in stratum j
bij = number of target age children restrained in booster seats at location i in stratum j
oij = total number of target age children observed at location i in stratum j
Then, the booster seat use rate within each stratum (rj) was determined as follows:
∑
∑=
jij
jij
j o
br
Once the booster seat use rates were determined within each stratum, the statewide booster seat
use rate was calculated using the following equation:
∑
∑=
jj
jjj
TOTAL p
rpr
where:
rTOTAL = statewide booster seat use rate
pj = population of target age children in stratum j
The p-values in the preceding equation are weighting factors that are necessary because strata
with higher populations of 4 to 7 year-old children will have a greater impact on the statewide
usage rate than strata with lower populations.
5.2 Statewide Booster Seat Use Variance Calculation
Upon obtaining estimates of the booster seat use rates for each of the four strata, the variance for
each stratum was determined using Cochran’s equation [38]:
( ) ( )i
jij
ii
ij
ij
j
jjij
ii
ij
ij
j
jj g
rgo
oNn
rgo
on
nVar
222
2
2
1−
∑⎟⎟⎟
⎠
⎞
⎜⎜⎜
⎝
⎛
∑+−∑
⎟⎟⎟
⎠
⎞
⎜⎜⎜
⎝
⎛
∑−≈
where:

17
Varj = variance for stratum j
nj = number of sampled observation locations in stratum j
Nj = number of available observation locations in stratum j
The second term in the above equation can be dropped from the equation with no significant
impact on the resulting estimate, providing the following formula where all variables are as
previously defined:
( )22
1 jiji
iij
ij
j
jj rg
oo
nn
Var −∑⎟⎟⎟
⎠
⎞
⎜⎜⎜
⎝
⎛
∑−≈
Given the variance of booster seat use within each stratum, the statewide variance in booster seat
use can then be calculated using the following formula:
∑=j
jjTOTAL VarpVar 2
where:
VarTOTAL = statewide variance in booster seat use
The calculated variances were used to construct 95-percent confidence intervals for the strata and
statewide booster seat use rates using the following equation:
Strata-level jj VarrCI 96.1%95 ±=
Statewide TOTALTOTAL VarrCI 96.1%95 ±=
6.0 RESULTS AND CONCLUSIONS
6.1 Statewide and Stratum-Level Booster Seat Use Rates
The overall weighted statewide booster seat use rates are shown in Table 6, along with a 95-
percent confidence interval for each estimate, as well as the associated standard error and relative
error. The overall weighted statewide booster seat use rates were calculated based upon the
procedure described in the previous section. These results are promising as the rate of booster
seat use has increased from 8.6 during the 2004 survey to 36.7 percent six months after
enactment of the booster seat legislation and 51.2 percent one year after enactment.

18
Table 6. Statewide Weighted Booster Seat Use Rate for 4-to-7 Year Old Child Passengers
Survey Period Safety Belt Use Rate Standard Error Relative Error 6-Month 36.7% ± 3.5% 1.8% 4.9% 12-Month 51.2% ± 2.7% 1.4% 2.7%
When examining each of the specific categories of child restraint use, it is found that 26.0
percent of children were observed in high-back boosters during the 6-month survey and 36.9
percent were in high-back boosters during the 12-month survey as shown in Table 7. The
percentage of target age child passengers in each type of booster seat increased significantly
between the two survey periods while the percentage of children restrained in only a safety belt
declined from 54.5 percent to 38.8 percent. The percentage of children in child safety seats and
the percentage completely unrestrained were not significantly different between the two survey
periods. However, it is encouraging to note that the percentage of children completely
unrestrained has decreased dramatically from the 2004 survey, which showed 37.5 percent of
children to travel completely unrestrained. These findings are consistent with other Michigan
restrain use surveys that have demonstrated persistent increases in recent years.
Table 7. Statewide Weighted Restraint Use Rates for 4-to-7 Year Old Child Passengers
Survey Period
Child Safety Seats
High Back Booster Seat
Backless Booster Seat
Safety Belt Only
Completely Unrestrained
6-Month 3.1% ± 1.2% 26.0% ± 2.8% 10.6% ± 1.8% 54.4% ± 3.2% 5.8% ± 1.2% 12-Month 2.2% ± 0.6% 36.9% ± 2.2% 14.3% ± 1.6% 38.8% ± 2.6% 7.7% ± 1.4%
When examining use by stratum, those strata that have historically exhibited higher belt use rates
by drivers and front seat passengers also exhibited higher rates of booster seat use as shown in
Table 8. Booster seat use was highest in strata 1 and 2, followed by stratum 3, and finally
stratum 4. While strata 3 and 4 exhibited lower use, all strata exhibited substantial
improvements in comparison to 2004, as well as between the periods six months and twelve
months after enactment of the booster seat legislation.

19
Table 8. Booster Seat Use Summary by Stratum
6-Month Post-Legislation 12-Month Post-Legislation
Stratum Booster Seat Use Rate
Standard Error
Booster Seat Use Rate
Standard Error
Stratum 1 44.3% ± 8.8% 4.5% 52.9% ± 5.9% 3.0% Stratum 2 38.4% ± 5.7% 2.9% 54.1% ± 5.1% 2.6% Stratum 3 34.0% ± 5.3% 2.7% 49.1% ± 5.1% 2.6% Stratum 4 29.4% ± 7.1% 3.6% 47.8% ± 6.3% 3.2%
6.2 Booster Seat Use Rates by Geographic, Vehicle, and Driver Characteristics
Table 9 presents booster seat use rates by type of site. Booster seat use was highest at day care
centers during both survey periods. Interestingly, use was higher in fast food restaurants than
shopping centers during the 6-month survey and the opposite was true during the 12-month
survey. The use rates were found to increase at each site type and these increases were most
pronounced at the day care centers, followed by the shopping centers and fast food restaurants.
The use rates at the roadside locations were approximately equal to that of the fast food
restaurants, though less than the other types of sites.
Table 9. Booster Seat Use Summary by Site Type
Booster Seat Use Rates by Site Type and Survey Period 6 Months Post-Legislation 12 Months Post-Legislation
Site Type
Children in Boosters
Children Observed
Use Rate
Children in Boosters
Children Observed
Use Rate
Fast Food Restaurants 183 432 42.4% 222 498 44.6% Shopping Centers 428 1181 36.2% 686 1305 52.6% Day Care Centers 77 160 48.1% 298 436 68.3% Elementary Schools 680 1983 34.3% - - - Roadside Locations - - - 353 820 43.0% Total 1368 3756 36.4% 1559 3059 51.0%
Booster seat use was highest among sport utility vehicles and vans as shown by Table 10. These
types of vehicles, particularly vans and minivans, are generally owned by larger families with
more children and this finding may be an indication of unobservable demographic or
socioeconomic characteristics that may influence restraint use, such as income or education. Use
was lowest among pickup trucks and passenger cars, consistent with results of the 2004 booster
seat study.

20
When examining seating position, booster seat use was highest in the second row of seating,
particularly in the outside seats. Use rates were substantially lower in the front seat, which is
particularly troubling due to the fact that children should not be seated in the front seat if other
seating options are available. Subsequent public awareness and educational campaigns targeted
toward this issue may be warranted.
Table 10. Booster Seat Use Summary by Vehicle Characteristics
Booster Seat Use Rates by Vehicle Type and Survey Period 6 Months Post-Legislation 12 Months Post-Legislation
Vehicle Type Children in Boosters
Children Observed
Use Rate
Children in Boosters
Children Observed
Use Rate
Passenger Car 494 1677 29.5% 558 1403 39.8% Sport Utility Vehicle 421 961 43.8% 504 773 65.2% Van/Minivan 405 911 44.5% 433 693 62.5% Pickup Truck 48 207 23.2% 64 190 33.7% Total 1368 3756 36.4% 1559 3059 51.0%
Booster Seat Use Rates by Seating Position and Survey Period 6 Months Post-Legislation 12 Months Post-Legislation
Child Passenger Seating Position
Children in Boosters
Children Observed
Use Rate
Children in Boosters
Children Observed
Use Rate
First Row – Center 6 19 31.6% 2 10 20.0% First Row – Right 31 804 3.9% 16 330 4.8% Second Row – Left 693 1526 45.4% 638 1211 52.7% Second Row – Center 151 326 46.3% 91 195 46.7% Second Row – Right 444 1001 44.4% 764 1231 62.1% Third Row – Left 25 43 58.1% 25 39 64.1% Third Row – Center 0 2 0.0% 3 7 42.9% Third Row – Right 18 35 51.4% 20 36 55.6% Total 1368 3756 36.4% 1559 3059 51.0%
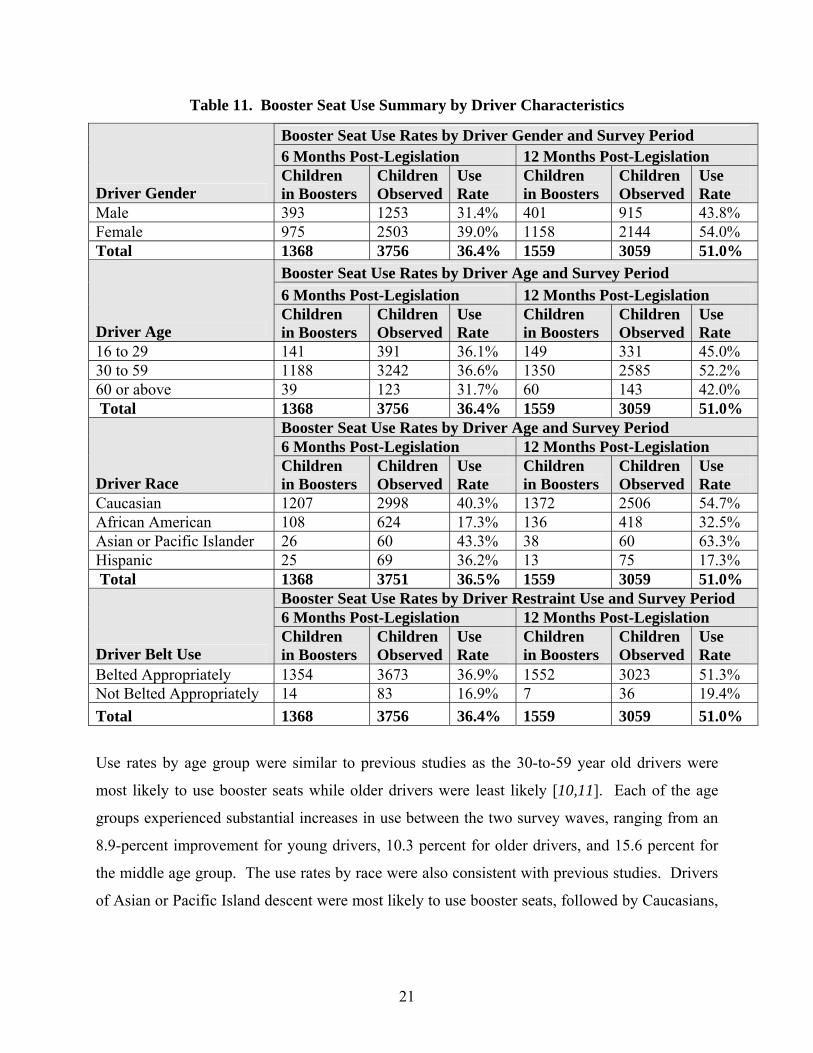
Tables 11 illustrates the rate of booster seat use by various driver characteristics. Use among
female drivers was 7.6 percent higher than among male drivers six months after enactment of the
booster seat legislation and 10.2 percent higher during the 12-month survey. This is in contrast
to the 2004 study, which did not find a substantial difference in booster use between male and
female drivers [10,11].
21
Table 11. Booster Seat Use Summary by Driver Characteristics
Booster Seat Use Rates by Driver Gender and Survey Period 6 Months Post-Legislation 12 Months Post-Legislation
Driver Gender Children in Boosters
Children Observed
Use Rate
Children in Boosters
Children Observed
Use Rate
Male 393 1253 31.4% 401 915 43.8% Female 975 2503 39.0% 1158 2144 54.0% Total 1368 3756 36.4% 1559 3059 51.0%
Booster Seat Use Rates by Driver Age and Survey Period 6 Months Post-Legislation 12 Months Post-Legislation
Driver Age Children in Boosters
Children Observed
Use Rate
Children in Boosters
Children Observed
Use Rate
16 to 29 141 391 36.1% 149 331 45.0% 30 to 59 1188 3242 36.6% 1350 2585 52.2% 60 or above 39 123 31.7% 60 143 42.0% Total 1368 3756 36.4% 1559 3059 51.0%
Booster Seat Use Rates by Driver Age and Survey Period 6 Months Post-Legislation 12 Months Post-Legislation
Driver Race Children in Boosters
Children Observed
Use Rate
Children in Boosters
Children Observed
Use Rate
Caucasian 1207 2998 40.3% 1372 2506 54.7% African American 108 624 17.3% 136 418 32.5% Asian or Pacific Islander 26 60 43.3% 38 60 63.3% Hispanic 25 69 36.2% 13 75 17.3% Total 1368 3751 36.5% 1559 3059 51.0%
Booster Seat Use Rates by Driver Restraint Use and Survey Period 6 Months Post-Legislation 12 Months Post-Legislation
Driver Belt Use Children in Boosters
Children Observed
Use Rate
Children in Boosters
Children Observed
Use Rate
Belted Appropriately 1354 3673 36.9% 1552 3023 51.3% Not Belted Appropriately 14 83 16.9% 7 36 19.4% Total 1368 3756 36.4% 1559 3059 51.0%
Use rates by age group were similar to previous studies as the 30-to-59 year old drivers were
most likely to use booster seats while older drivers were least likely [10,11]. Each of the age
groups experienced substantial increases in use between the two survey waves, ranging from an
8.9-percent improvement for young drivers, 10.3 percent for older drivers, and 15.6 percent for
the middle age group. The use rates by race were also consistent with previous studies. Drivers
of Asian or Pacific Island descent were most likely to use booster seats, followed by Caucasians,

22
African American, and Hispanic drivers. These trends are similar to those of the statewide safely
belt use surveys.
Finally, booster seat use was dramatically lower among drivers who were not belted
appropriately. The use rate among belted drivers was 36.9 percent during the 6-month survey
and increased to 51.3 percent during the 12-month survey. Conversely, drivers who were not
belted appropriately exhibited only 16.9 percent and 19.4 percent booster seat use rates during
the two survey periods.
6.3 Conclusions
The first statewide survey of booster seat use, conducted in 2004 for the Michigan Department of
Community Health, estimated a booster seat use rate of 8.6 percent. On July 1, 2008, legislation
was enacted requiring all children less than 8 years of age and less than 4 feet 9 inches in height
to be restrained in an appropriate child restraint device. The purpose of this study was to
determine the statewide booster seat use through two direct observation surveys conducted
approximately six months and one year after enactment of the legislation.
The first survey, conducted during January of 2009 at a sample of elementary schools, daycare
centers, fast foot restaurants, and shopping centers, showed the booster seat use rate had
increased to 36.7 percent. The second survey was conducted between June and July of 2009 at
daycare centers, fast food restaurants, and shopping centers, as well as roadside locations in
coordination with a statewide safety belt survey. This survey estimated a statewide booster seat
use rate of 51.2 percent. These increases were found to be consistent across geographic regions
of the state and by various population characteristics.
While the results are encouraging, there are several areas where booster seat use lagged behind
the statewide average. Booster seat use was lowest among non-daycare center sites, which may
be due to parents who bring their children to daycare having greater knowledge or concern
regarding appropriate child restraint devices. Booster seat use was lowest among pickup trucks
and passenger cars, particularly when children were seated in the front seat. Males and drivers
age 60 and above were less likely to use booster seats, as were African American and Hispanic

23
drivers. Finally, drivers who were not appropriately restrained themselves were significantly less
likely to appropriately restrain their children, as well. These findings are consistent with those
reported by Doyle and Levitt [39], who find that unrestrained children generally appear to be in
vehicles with riskier drivers, including those who are less likely to be properly restrained and
more likely to be crash-involved. These groups of drivers present the greatest area of
opportunity and should be the focus of future education and outreach programs aimed at
informing the public of the importance of appropriate child restraint device use. Similar
programs have proven particularly effective at increasing safety belt use among Michigan
drivers.

24
7.0 REFERENCES 1. Michigan 2007 Resident Death File. Vital Records & Health Data Development Section,
Michigan Department of Community Health, http://www.mdch.state.mi.us/pha/osr/Index.asp?Id=4, Accessed on August 24, 2009.
2. Michigan Traffic Crash Facts Data Query Tool, Michigan State Police, Office of Highway Safety Planning, http://www.michigantrafficcrashfacts.org/, Accessed on August 24, 2009.
3. Winston, F.K., Durbin, D.R., Kallan, M.J., and E.K. Moll, “The Danger of Premature Graduation to Seat Belts for Young Children”, Pediatrics, Vol. 105, pp. 1179-1183, 2000.
4. Durbin, D.R., Kallan, M.J., and F.K. Winston, “Trends in Booster Seat Use Among Young Children in Crashes”, Pediatrics, Vol. 108, No. 6, 2001.
5. Durbin, D.R., Elliott, M.R., and F.K. Winston, “Belt-Positioning Booster Seats and Reduction of Injury Among Children in Vehicle Crashes”, Journal of American Medical Association, Vol. 289, pp. 2835-2840, 2003.
6. Transportation Recall Enhancement, Accountability, and Documentation Act, Public Law 106-414 (AE 2.110:106-414), 2000.
7. National Highway Traffic Safety Administration, “Preliminary Data Indicate that Booster Seat Laws Increase Child Safety Seat Use”, Traffic Safety Facts, Traffic Tech – Technology Transfer Series, No. 331, 2007.
8. Winston, F.K., Kallan, M.J., Elliott, M.R., Xie, D., and D.R. Durbin, “Effect of Booster Seat Laws on Appropriate Restraint Use by Children 4 to 7 Years Old Involved in Crashes”, Archive of Pediatric Adolescent Medicine, Vol. 161, pp. 270-275, 2007.
9. Wayne State University Transportation Research Group, Child Restraint Device Use and Misuse, Final Report to Michigan Office of Highway Safety Planning, 2005.
10. Wayne State University Transportation Research Group, Child Restraint Device Use and Misuse, Final Report to Michigan Office of Highway Safety Planning, 2007.
11. Eby, D.W., Bingham, C.R., Vivoda, J.M. and T. Ragunathan, Use of Booster Seats by Michigan Children 4-8 Years of Age, UMTRI-2005-10, 2005.
12. Eby, D.W., Bingham, C.R., Vivoda, J.M., and T. Ragunathan, “Use of Booster Seats by Michigan Children 4–8 Years of Age”, Accident Analysis & Prevention, Vol. 37, No. 6, pp. 1153-1161, 2005.
13. Ramsey, A., Simpson, E., and F.P. Rivara, “Booster Seat Use and Reasons for Nonuse”, Pediatrics, Vol. 106, 2000.
14. Simpson, E.M., Moll, E.K., Kassam-Adams, N., Miller, G.J., and F.K. Winston, “Barriers to Booster Seat Use and Strategies to Increase Their Use”, Pediatrics, Vol. 110, pp. 729-736, 2002.
15. Ebel, B.E., Koepsell, T.D., Bennett, E.E., and F.P. Rivara, “Too Small for a Seatbelt: Predictors of Booster Seat Use by Child Passengers”, Pediatrics, Vol. 111, pp. 323-327, 2003.
16. Bingham, C.R., Eby, D.W., Hockanson, H.M., and A.I. Greenspan, Factors Influencing the Use of Booster Seats: A Statewide Survey of Parents, Report No. UMTRI-2005-14, 2005.
17. Vesentini, L. and B. Willems, “Premature Graduation of Children in Child Restraint Systems: An Observational Study”, Accident Analysis and Prevention, Vol. 39, pp. 867-872, 2007.
18. Charlton, J., Koppel, S., Fitzharris, M., Congiu, M., and B. Fildes, Factors That Influence Children’s Booster Seat Use, Report to Motor Accidents Authority of New South Wales, 2006.

25
19. Koppel, S., Charlton, J.L., Fitzharris, M., Congiu, M., and B. Fildes, “Factors Associated with the Premature Graduation of Children into Seatbelts”, Accident Analysis and Prevention, Vol. 40, pp. 657-666, 2008.
20. Partners for Child Passengers Safety, Fact and Trend Report, The Children’s Hospital of Philadelphia, 2005.
21. Partners for Child Passengers Safety, Fact and Trend Report, The Children’s Hospital of Philadelphia, 2006.
22. Partners for Child Passengers Safety, Fact and Trend Report, The Children’s Hospital of Philadelphia, 2007.
23. Partners for Child Passengers Safety, Fact and Trend Report, The Children’s Hospital of Philadelphia, 2008.
24. Boyle, J. and P. Vanderwolf Schulman, Motor Vehicle Occupant Safety Survey, Volume 5: Child Safety Seat Report, NHTSA DOT HS 809 858, Washington, DC: National Highway Traffic Safety Administration, 2005.
25. Wayne State University Transportation Research Group, Annual Direct Observation Survey of Safety Belt Use, Final Report to Michigan Office of Highway Safety Planning, 2005.
26. Wayne State University Transportation Research Group, Annual Direct Observation Survey of Safety Belt Use, Final Report to Michigan Office of Highway Safety Planning, 2006.
27. Wayne State University Transportation Research Group, Annual Direct Observation Survey of Safety Belt Use, Final Report to Michigan Office of Highway Safety Planning, 2007.
28. Wayne State University Transportation Research Group, Annual Direct Observation Survey of Safety Belt Use, Final Report to Michigan Office of Highway Safety Planning, 2008.
29. Cody, B.E., Mickalide, A.D., Paul, H.P. and J.M. Colella, Child Passengers at Risk in America: A National Study of Restraint Use, National SAFE KIDS Campaign, 2002.
30. Glassbrenner, D. and T.J. Ye, “Booster Seat Use in 2007”, Report No. DOT HS 810 894, 2008.
31. Glassbrenner, D. and T.J. Ye, “Child Restraint Use in 2007 – Use of Correct Restraint Types”, Report No. DOT HS 810 895, 2008.
32. Glassbrenner, D. and T.J. Ye, “Child Restraint Use in 2007 – Demographic Results”, Report No. DOT HS 810 897, 2008.
33. St. Louis, R.M., Eby, D.W., Bingham, C.R., Vivoda, J.M., Hockanson, H.M., and A.I. Greenspan, Community Based Booster Seat Promotion Programs: Baseline Results of a Direct Observation Survey, Report No. UMTRI-2005-28, 2005.
34. St. Louis, R.M., Parow, J.E., Eby, D.W., Bingham, C.R., Hockanson, H.M., and A.I. Greenspan, “Evaluation of Community-Based Programs to Increase Booster Seat Use”, Accident Analysis and Prevention, Vol. 40, pp. 295-302, 2008.
35. SchoolTree.org, “Find Elementary Schools in Michigan”, http://michigan.schooltree.org/elementary/counties-page1.html), Accessed on December 14, 2008.
36. Microsoft, “Live Search Maps”, http://maps.live.com/, Accessed on December 14, 2008. 37. Statewide Search for Child Day Care Centers and Homes, Michigan Department of Human
Services, http://www.dleg.state.mi.us/brs_cdc/sr_lfl.asp, Accessed on July 6, 2008. 38. Cochran, W.M., Sampling Techniques, 3rd Edition, John Wiley & Sons, 1977. 39. Doyle, J.J. and S.D. Levitt, Evaluating the Effectiveness of Child Safety Seats and Seat Belts
in Protecting Children from Injury, NBER Working Papers 12519, National Bureau of Economic Research, Inc., August 2006.

26
APPENDIX I – LIST OF DAYCARE CENTERS OBSERVED

27
Stratum County Name of Day Care Center Address 1 Ingham Educational Child Care Center 1715 W. Main St., Lansing, MI 48915 1 Ingham Helping Hands Day Care 2727 W. Holmes Rd., Lansing, MI 48911 1 Ingham Little Rainbows 2443 Olds Rd., Leslie MI, 492511 Ingham Small Folks Development Center 3140 S. Pennslyvania , Lansing, MI 489101 Ingham Spartan Child Development Center 1730 Crescent Rd., East Lansing, MI 488231 Kalamazoo Child Development Center - Borgess 1521 Gull Rd., Kalamazoo, MI 49048 1 Oakland Art Start Montessori Academy of Farmington Hills 31195 W. 13 Mile Rd., Farmington Hills, MI 48334 1 Oakland Brookfield Academy - Troy Campus 3950 Livernois, Troy, MI 480981 Oakland Carpenter School - Latch Key 2290 Flintridge, Orion, MI 48359 1 Oakland Farmington Hills Nursery School 25225 Middlebelt Rd, Farmington Hills, MI 48336 1 Oakland Goodison Child Care Center, Inc. 4461 Collins Rd., Rochester, MI 48306 1 Oakland Red Apple Pre-School 28117 Milford Rd., New Hudson, MI 48165 1 Oakland Rochester Hills Public Library 500 Olde Towne Rd., Rochester, MI 48307 1 Oakland Whitney Bloomfield Inc. 4500 Arline Dr., Orchard Lake, MI 48323 1 Washtenaw Chelsea Com. Hosp. Children's Center 14600 Old US 12, Chelsea, MI 481182 Allegan Appletree Learning Center 909 Dix St., Otsego, MI 49078 2 Jackson Spring Arbor Cherubs Preschool 120 E Main, Spring Arbor, MI 49283 2 Kent Appletree Christian Learning Center 732 52nd St., Kentwood, MI 49508 2 Livingston Garden Gate School 2100 Progressive Dr., Hartland, MI 48353 2 Livingston Lakeland Montessori School 5520 M-36, Lakeland, MI 481432 Macomb Kinder Care Learning Center#821 33300 Ryan Rd., Sterling Heights, MI 48310 2 Macomb Richmond Early Learning Center 68560 Stoecker Lane, Richmond, MI, 48062 2 Macomb Warren Woods Childcare 14000 Thirteen Mile, Warren, Mi 480882 Midland Heaven's Elect Day Care Suite B 3305 Ridgecrest, Midland, MI 486422 Midland Michigan Child Care Centers, Inc. 1184 James Savage Rd., Midland, MI 48640 2 Ottawa Appletree Christian Learning Center 11272 Edgewater Dr, Allendale, MI 49401 2 Ottawa Daily Shepherd Child Care 1481 Baldwin St., Jenison, MI 494288910 3 Berrien The Children's Center, Inc. 324 E. Dewey St., Ste. 107, Buchanan, MI 49107 3 Calhoun Child Development Center - Lakeview 55 Arbor St., Battle Creek, MI 49015 3 Calhoun Little Friends Day Care 1305 Olive St., Battle Creek, MI 49017 3 Genesee Bethel Child Care Center 6029 Lapeer Rd., Burton, MI 48509 3 Genesee Honey Bear Child Care 5171 S Linden Road, Swartz Creek, MI 48473 3 Genesee Mulberry Bush Child Care 5182 N Elms Rd., Flushing, MI 48433 3 Lapeer Family Circle Children's Learning Center 2266 N Lapeer Road, Lapeer, MI 48446 3 Monroe Carleton Country Day School 12707 Maxwell Rd., Carleton, MI 48117 3 Saginaw Adventure Land Day Care 3111 Barnard Road, Saginaw, MI 48603 3 Saginaw Kinder Kare Child Center 928 West Ardussi, Frankenmuth, MI 48734 3 St. Clair Kids Connection 301 N 6th Street, St. Clair, MI 48079 3 St. Clair Marysville Childrens Center 901 Michigan Ave, Marysville, MI 48040 3 St. Clair Nu-Nu'S Nursery and Daycare 1714 Holland Ave, Port Huron, MI 48060 4 Wayne Beard Early Chilhood Center 840 Waterman, Detroit, MI 482094 Wayne Blossoming Child Development Center 4919 Elmhurst, Detroit, MI 482044 Wayne Childrens Corner Center Learning II 16901 Schoolcraft, Detroit, MI 48227 4 Wayne Childtime Children's Center 34203 Ford Rd, Westland, MI 48185 4 Wayne Christ the King's Early Childhood Center 16700 Pennsylvania, Southgate, MI 481954 Wayne Henry Ford Kids Child Care Center 1110 Seward, Detroit, MI 482024 Wayne Meadow Bank Day Care 2122 Dix Hwy, Lincoln Park, MI 481464 Wayne Nanny's Nursery School 9529 Pardee Road, Taylor, MI 48180 4 Wayne Northville First Care 777 W. Eight Mile Rd., Northville, MI 48167 4 Wayne Order of the Fisherman Ministry Headstart 10025 Grand River, Detroit, MI 482044 Wayne Peter Rabbit Day Care Center, Inc. 5901 Cadieux, Detroit, MI, 482244 Wayne Plymouth/Canton Montessori 45245 Joy Rd., Canton, MI 48187 4 Wayne Sugar N Spice Nursery School 16555 Wyoming, Detroit, MI 482364 Wayne Sunrise 2 Sunset Child Development 18708 Telegraph Rd., Brownstown, MI 48174 4 Wayne The Learning Tree - South 32955 Plymouth Rd., Livonia, MI 48150

28
APPENDIX II – LIST OF ELEMENTARY SCHOOLS OBSERVED

29
Stratum County Name of Elementary School Address 1 Ingham Middle-Michigan Public School Academy 730 W. Maple Street, Lansing, MI 48906 1 Ingham Moores Park School 316 Moores River Dr, Lansing, MI 48910 1 Ingham St. Thomas Aquinas School 915 Alton Rd, East Lansing, MI 48823 1 Ingham Woodworth Elementary School 212 Pennsylvania St, Leslie, MI 49251 1 Kalamazoo Parchment Northwood Elementary School 600 Edison Street, Kalamazoo MI 49004 1 Oakland Alfred E. Upton Elementary School 4400 Mandalay Ave, Royal Oak, MI 48073 1 Oakland Carpenter Year Round Elementary School 2290 Flintridge St, Lake Orion, MI 48359 1 Oakland Green Elementary School 4500 Walnut Lake Rd, W. Bloomfield, MI 48323 1 Oakland Pleasant Lake Elementary School 4900 Halsted Road, West Bloomfield, MI 48323 1 Washtenaw North Creek Elementary School 699 McKinley St., Chelsea, MI 48118 1 Washtenaw South Meadows Elementary School 335 Pierce St, Chelsea, MI 48118 2 Grand Traverse Kingsley Area Elementary School 311 Clark Street, Kingsley, MI 49649 2 Jackson Bean Elementary School 3201 Noble Road., Spring Arbor, MI 49283 2 Kent Creston Christian School 1031 Page Street Ne, Grand Rapids, MI, 49505 2 Kent Dutton Elementary School 3820 68th Street SE., Caledonia, MI 49316 2 Kent Grand View Elementary School 3701 52nd Street SW, Grandville, MI 49418 2 Macomb Briarwood Elementary School 14100 Leisure Drive., Warren, MI 48088 2 Macomb Harwood Elementary School 4900 Southlawn Dr, Sterling Heights, MI 48310 2 Midland Adams Elementary School 1005 Adams Drive., Midland, MI 48642 2 Midland Siebert School 5700 Siebert Street, Midland, MI 48642 2 Ottawa Allendale Lower Elementary School 10690 Learning Lane, Allendale, MI, 49401 2 Ottawa Alward Elementary School 3811 Port Sheldon St., Hudsonville, MI 49426 2 Ottawa Rosewood School 2370 Tyler Street, Jenison, MI 49428 3 Genesee Dieck Elementary School 2239 Van Vleet Rd., Swartz Creek, MI 48473 3 Genesee Elms Elementary School 6125 N Elms Rd., Flushing, MI 48433 3 Genesee Hill Elementary School 404 Aloha St., Davison, MI 48423 3 Monroe St. Patrick Elementary School 2970 West Labo Road, Carleton, MI 48117 3 Saginaw Heavenrich School 2435 Perkins St., Saginaw, MI 48601 3 Saginaw Lorenz C. List School 805 E Genesee St., Frankenmuth, MI 48734 3 Saginaw Sherwood Elementary School 3870 Shattuck Rd., Saginaw, MI 48603 3 Saginaw Shields Elementary School 6900 Stroebel Rd., Saginaw, MI 48609 3 St. Clair Michigamme Elementary School 2855 Michigan Rd., Port Huron, MI 48060 3 St. Clair Theo V. Eddy Elementary School 301 N 9th St., St Clair, MI 48079 3 St. Clair Washington Elementary School 905 16th St., Marysville, MI 48040 4 Wayne Barton Elementary School 8530 Joy Road, Detroit, MI 48204 4 Wayne Birney Elementary School 4055 Richton Street, Detroit, Michigan 48204 4 Wayne Burns Elementary School 14350 Terry St., Detroit, MI 48227 4 Wayne Christ The Good Shepherd School 1590 Riverbank St., Lincoln Park, MI 48146 4 Wayne Garfield Elementary School 10218 Arthur St., Livonia, MI 48150 4 Wayne Henry Ruff School 30300 Maplewood St., Garden City, MI 48135 4 Wayne James Gallimore Elementary School 8375 N. Sheldon Rd, Canton, MI 48187 4 Wayne MacDowell Elementary School 4201 W. Outer Drive, Detroit, Michigan 48221 4 Wayne Myers Elementary School 16201 Lauren Drive, Taylor, MI 48180 4 Wayne Raupp School 1351 Ethel Ave, Lincoln Park, MI 48146

30
APPENDIX III – LIST OF FAST FOOD RESTAURANTS OBSERVED

31
Strata County Name of Site Address1 Kalamazoo McDonalds 3320 S Westnedge, Kalamazoo, MI, 49008 1 Kalamazoo McDonalds 6355 S Westnedge Ave, Portage, MI 49002 1 Kalamazoo McDonalds 224 W Kalamazoo Avenue, Kalamazoo, MI 490071 Kalamazoo McDonalds 830 Riverview Dr., Kalamazoo, MI 49001 1 Oakland McDonalds 808 Rochester Rd., Rochester, MI, 48307 1 Oakland McDonalds 2985 Walton Blvd., Rochester Hills, MI, 48309 1 Oakland McDonalds 141 N. Telegraph, Waterford, MI, 48328 1 Oakland McDonalds 22100 Pontiac Trail, South Lyon, MI 48178 1 Oakland McDonalds 22525 Woodward, Ferndale, MI 48220 1 Oakland McDonalds 423 W. 11 Mile, Royal Oak, MI 48067 1 Oakland McDonalds 1212 W. Maple Rd., Walled Lake, MI 48390 1 Oakland McDonalds 2829 W. 14 Mile Rd., Royal Oak, MI 48073 1 Washtenaw McDonalds 1535 S. Main St., Chelsea, MI 48118 1 Washtenaw McDonalds 5550 W. Michigan Ave, Ypsilanti, MI 48197 2 Eaton McDonalds 5225 N Grand River Ave, Lansing, MI 48917 2 Grand Traverse McDonalds 2468 S Airport Rd W, Traverse City, MI 49684 2 Kent McDonalds 3030 Walker Ave, Walker, MI, 49504 2 Kent McDonalds 417 Michigan St, Grand Rapids, MI 49503 2 Kalamazoo McDonalds 415 28th St., Kalamazoo, MI 49548 2 Macomb McDonalds 25900 Crocker, Mt. Clemens, MI 48045 2 Macomb McDonalds 15401 E. 12 Mile, Roseville, MI 48066 2 Macomb McDonalds 41500 Garfield Rd., Clinton Twp, MI 48038 2 Ottawa McDonalds 5371 Lake Michigan Dr., Allendale, MI 49401 2 Ottawa McDonalds 213 N River Rd., Holland, MI 49424 3 Berrien McDonalds 150 E. Ryno Rd., Coloma, MI 49038 3 Calhoun McDonalds 812 W. Columbia, Battle Creek, MI 49015 3 Genesee McDonalds 214 N State St., Otisville, MI 48463 3 Genesee McDonalds 213 N River Rd., Holland, MI 49424 3 Genesee McDonalds 3212 Clio Rd., Flint, MI 48504 3 Genesee McDonalds 3391 S Saginaw St., Burton, MI 48529 3 Lapeer McDonalds 486 S. Main St., Lapeer, MI 48446 3 Lenawee McDonalds 503 S Meridian St., Hudson, MI 49247 3 Monroe McDonalds 1001 S. Monroe St., Monroe, MI 48161 3 Muskegon McDonalds 3586 E Apple Ave., Muskegon, MI 49442 3 Muskegon McDonalds 1832 W. Sherman Blvd., Muskegon, MI 49444 3 Saginaw McDonalds 6331 Dixie Hwy, Bridgeport, MI 48722 3 Saginaw McDonalds 2745 Bay Rd., Saginaw, MI 48603 3 St. Clair McDonalds 1201 24th St, Port Huron, MI 48060 3 St. Clair McDonalds 4155 24th Ave, Fort Gratiot, MI 48095 4 Wayne McDonalds 15405 Southfield, Allen Park, MI 48101 4 Wayne McDonalds 1469 Fort St. Lincoln Park, MI 48146 4 Wayne McDonalds 3975 Conner, Detroit, MI 48215 4 Wayne McDonalds 17800 E. 8 Mile Rd., Harper Woods, MI 48225 4 Wayne McDonalds 39700 Five Mile, Plymouth, MI 48170 4 Wayne McDonalds 4145 S. Telegraph, Dearborn Heights, MI 48125 4 Wayne McDonalds 27255 Telegraph Rd., Flat Rock, MI 48134 4 Wayne McDonalds 1581 Van Horn, Trenton, MI 48183 4 Wayne McDonalds 23000 Eureka Rd., Taylor, MI 48180 4 Wayne McDonalds 38418 Ford Road, Westland, MI 48185 4 Wayne McDonalds 13158 Ford Rd, Dearborn, MI 48126 4 Wayne McDonalds 10236 S. Telegraph Rd., Taylor, MI 48180

32
APPENDIX IV – LIST OF SHOPPING CENTERS OBSERVED

33
Strata County Name of Shopping Center Address 1 Ingham Eastwood Town Center 1500 W. Lake Lansing Rd., Lansing, MI 48840 1 Ingham Meijer 5125 W Saginaw Hwy, Lansing, MI 48917 1 Ingham Target 4890 Marsh Rd, Okemos, MI 48864 1 Kalamazoo Felpausch Food Center 120 W Prairie St, Vicksburg, MI 49097 1 Kalamazoo Harding's Market 6330 S Westnedge, Portage, MI 49002 1 Kalamazoo Harding's Market 5161 W Main St, Kalamazoo, MI 49009 1 Kalamazoo K-Mart 6355 S Westnedge Ave, Portage, MI 49002 1 Kalamazoo K-Mart 4620 Stadium Dr, Kalamazoo, MI 49008 1 Kalamazoo Meijer 5800 Gull Rd, Kalamazoo, MI 49048 1 Oakland Ferndale Foods 600 W 9 Mile Rd, Ferndale, MI 48220 1 Oakland Great Lakes Crossing 4000 Baldwin Road, Auburn Hills, MI 48326 1 Oakland Holiday Food Center 1203 S Main, Royal Oak, MI 48067 1 Oakland Kmart 29101 John R Rd, Madison Heights, MI 48071 1 Oakland Kroger 6625 Dixie Highway, Clarkston, MI 48346 1 Oakland Kroger 25780 Middlebelt Rd, Farmington, MI 48336 1 Oakland Meijer 5150 Coolidge Hwy, Royal Oak, MI 48073 1 Oakland Walmart Supercenter 3301 N. Pontiac Trail, Commerce, MI 48382 1 Oakland Walmart Supercenter 30729 Lyon Center Dr. E, New Hudson, MI 48165 1 Oakland Walmart Supercenter 2500 S. Adams Rd., Rochester, MI 48309 1 Washtenaw Briarwood Mall 100 Briarwood Circle, Ann Arbor, MI 48108 1 Washtenaw Kroger 400 S Maple Rd, Ann Arbor, MI 48103 1 Washtenaw Meijer 5645 Jackson Rd, Ann Arbor, MI 48103 1 Washtenaw Meijer 3825 Carpenter Rd, Ypsilanti, MI 48197 2 Allegan Walmart Supercenter 412 Oaks Crossing, Plainwell, MI 49080 2 Bay Kroger 2910 Center Ave, Essexville, MI 48732 2 Bay Pinny Food Center 704 S Mable St, Pinconning, MI 48650 2 Grand Traverse Grand Traverse Mall 3200 S. Airport Road W, Traverse City, MI 49684 2 Grand Traverse Tom's Food Center 13940 S West Bay Shore Dr, Traverse City, MI 49684 2 Ingham Kroger 6430 W Saginaw Hwy, Lansing, MI 48917 2 Ingham Meijer 5225 N Grand River Ave, Lansing, MI, 48917 2 Ingham Village Market 5125 W Saginaw Hwy, Lansing, MI 48917 2 Jackson Frank’s Shoprite 400 Michigan Ave, Grass Lake 49240 2 Jackson Meijer 2777 Airport Rd, Jackson, MI 49202 2 Kent Century Park Treehouse 5710 Kenowa Avenue, SW Grandville, MI 49418 2 Kent Meijer 5500 Clyde Park Ave SW, Wyoming, MI 49509 2 Kent Rivertown Crossings Mall 3700 RiverTown Parkway, Grandville, MI 49418 2 Livingston Rosati's Market 130 S. Grand Rd., Fowlerville, MI 48836 2 Macomb Farmer Jack 50 N. Groesbeck Highway, Mount Clemens, MI 48043 2 Macomb Kroger 26130 Gratiot Ave, Roseville, MI 48066 2 Macomb Lakeside Mall 14000 Hall Road, Sterling Heights, MI 2 Macomb Shoppers Market 22800 Van Dyke, Warren, MI 48089 2 Macomb Walmart 44575 Mound Rd, Sterling Heights, MI 48314 2 Ottawa Meijer 746 E 16th St, Holland, MI 49423 2 Saginaw Glen's 2026 N Saginaw St, Midland, MI 49640 2 Saginaw Walmart 910 Joe Mann Blvd, Midland, MI 48642

34
Strata County Name of Shopping Center Address3 Berrien Target 960 Fairplain Dr., Benton Harbor, MI 49022 3 Berrien Walmart Super Center 1400 Mall Drive, Benton Harbor, MI 49022 3 Calhoun Lakeview Square Mall 5775 Beckley Rd, Battle Creek, MI 49015 3 Calhoun Meijer 2177 W Columbia Ave, Battle Creek, MI 49015 3 Calhoun Walmart Supercenter 6020 B Drive North, Battle Creek, MI 490143 Genesee First Friends Discovery Center Bldg 1 8031 E. Court Street, Davison, MI 484233 Genesee K-Mart 3083 Miller Rd, Flint, MI 48507 3 Genesee K-Mart 1145 N Belsay Rd, Burton, MI 48509 3 Genesee Kroger 7188 N Saginaw Rd, Mt. Morris, MI 484583 Genesee Kroger 2629 W Pierson Rd, Flint, MI 48504 3 Genesee Meijer 4333 W Pierson Rd, Flint, MI 48504 3 Genesee Meijer 2333 S Center Rd, Burton, MI 48519 3 Genesee Toys "R" Us 3250 S Linden Rd, Flint, MI 3 Lapeer Walmart 555 East Genesee, Lapeer, MI 48446 3 Lenawee Borchardt Brothers 628 W Adrian St, Blissfield, MI 49228 3 Lenawee Busch's Valu Land 1450 W Chicago Blvd, Tecumseh, MI 49286 3 Lenawee Meijer 217 E US Highway 223, Adrian, MI 49221 3 Monroe Walmart 2155 N Telegraph Rd, Monroe, MI 48162 3 Muskegon Lakeshore Market Place 5241 Harvey, Muskegon, MI 49444 3 Muskegon Meijer 700 W Norton Ave, Muskegon, MI 49440 3 Muskegon Target 1740 E Sherman Blvd, Muskegon, MI 49444 3 Saginaw Kroger 3430 State St, Saginaw, MI 48602 3 Saginaw Meijer 8400 Gratiot Rd, Saginaw, MI 48609 3 Saginaw Toys "R" Us 2772 Tittabawassee Rd, Saginaw, MI 48604 3 St. Clair Walmart 1621 E M 21, Owosso, MI 48867 3 Van Buren Village Market 407 N. State St., Gobles, MI 49055 3 Van Buren Wagoner's 24064 McGillen, Mattawan, MI 49071 3 Van Buren Walmart Supercenter 201 73rd Street, South Haven, MI 49090 4 Wayne Farmer's Food Center 2411 Central Ave, Detroit MI 48209 4 Wayne Food Pride 500 E. Warren Ave., Detroit, MI 48201 4 Wayne Harbortown Foods 3472 East Jefferson, Detroit MI 48207 4 Wayne Holiday Market 520 S. Lilley Rd., Canton, MI 48188 4 Wayne K-Mart 2095 Rawsonville Rd, Belleville, MI 48111 4 Wayne Kroger 23303 Michigan Ave, Dearborn, MI 48124 4 Wayne Kroger 1647 Merriman Rd., Westland, MI 48185 4 Wayne Kroger 2060 Dix Ave., Lincoln Park, MI, 48146 4 Wayne Kroger 37700 Six Mile Rd., Livonia, MI 48152 4 Wayne Kroger 45540 Michigan Ave, Canton, MI 48188 4 Wayne Kroger 1905 N Canton Center Rd, Canton, MI 48187 4 Wayne Meijer 45001 Ford Rd, Canton, MI 48187 4 Wayne Meijer 14640 Pardee Rd, Taylor, MI 48180 4 Wayne Sak n Save - Merriman 1647 S Merriman Rd, Westland, MI, 48186 4 Wayne Sears 2100 Southfield Road, Lincoln Park, MI 48146 4 Wayne Target 20100 Haggerty Rd, Livonia, MI 48152 4 Wayne Target 29859 Plymouth Road, Livonia, MI 48150 4 Wayne Toys "R" Us 29150 W. Seven Mile Rd, Livonia, MI 48152 4 Wayne Walmart 30007 Plymouth Rd., Livonia, MI 48150 4 Wayne Walmart 29555 Plymouth Rd, Livonia, MI 48150 4 Wayne Walmart 5851 Mercury Drive, Dearborn, MI 48126 4 Wayne Walmart Supercenter 7555 Telegraph Rd, Taylor, MI 48180

35
APPENDIX V – LIST OF ROADSIDE LOCATIONS OBSERVED

36
Strata County Roadside Location Strata County Roadside Location1 Ingham Barnes and Eden 2 Allegan 30th and 128th 1 Ingham Cavanaugh and Pennsylvania 2 Allegan M-89 and Main1 Ingham Haslett and Zimmer 2 Allegan M-89 and US-1311 Ingham I-496 and Dunkel 2 Allegan US-131 and US-1351 Ingham Lake Lansing and Hagadorn 2 Bay I-75 and Pinconning1 Ingham M-43 and Putnam 2 Bay M-15 and Munger1 Ingham M-52 and M-106 2 Eaton Battle Creek and Ainger Rd1 Ingham Michigan and Waverly 2 Eaton I-96 and Nash 1 Ingham Rossman and Onodaga 2 Eaton Kalamo and Battle Creek1 Ingham Tihart and Cornell 2 Eaton M-43 and Canal1 Ingham US-127 and Cedar 2 Eaton M-43 and M-501 Ingham US-127 and Saginaw 2 Eaton Nixon and Willow1 Kalamazoo G Avenue and 33rd 2 Eaton Royston and Island Hwy1 Kalamazoo G Avenue and Riverview 2 Eaton Wahington and Lawrence1 Kalamazoo H-Avenue and Sprinkle 2 Grand M-72 and US-311 Kalamazoo M-43 and 9th 2 Jackson Elm Road and Rosenhill1 Kalamazoo M-43 and M-89 2 Jackson Michigan and Lake1 Kalamazoo M-89 and 34th St. 2 Jackson US-127 and Michigan1 Kalamazoo Q Avenue and 8th 2 Jackson US-127 and Page1 Kalamazoo Sprinkle and Center 2 Jackson Wolflake and Cady1 Kalamazoo Sprinkle and Zylman 2 Kent 10 Mile and Wabasis1 Oakland 14 Mile and Main 2 Kent 4 Mile and Walker1 Oakland Baldwin and Clarkston 2 Kent Aberdeen and Diamond1 Oakland Dixie Hwy and Davisburg 2 Kent Myers Lake and 17 Mile1 Oakland Grange Hall and Holly 2 Kent Sparta and Ball Creek1 Oakland I-696 and Woodward 2 Kent US-131 and 10 Mile1 Oakland I-75 and Sashabaw 2 Kent US-131 and 68th1 Oakland M-10 and 8 Mile 2 Kent US-131 and 84th1 Oakland Northwestern and Middlebelt 2 Livingston Grand River and Kensington1 Oakland Orchard Lake and I-696 2 Livingston Grand River and Pleasant Valley1 Oakland Snell and Rochester 2 Livingston Old US-23 and M-591 Oakland Taft and 9 Mile 2 Livingston US-23 and Clyde1 Oakland Walton and Lapeer 2 Macomb 22 Mile and Heydenreich1 Washtenaw Ann Arbor/Saline and S Main 2 Macomb I-696 and Groesbeck Hwy1 Washtenaw Austin and Schneidr 2 Macomb Jefferson and Martin1 Washtenaw Geddes and Earhart 2 Macomb Moranian and Harrington1 Washtenaw I-94 and Huron 2 Macomb Romeo Plank and 27 Mile1 Washtenaw I-94 and Jackson 2 Macomb Van Dyke and 23 Mile1 Washtenaw I-94 and State 2 Macomb Van Dyke and 34 Mile1 Washtenaw Miller Ave and Maple 2 Midland Lake saford and Curtis1 Washtenaw Mooreville and Stoney Creek 2 Midland M-20 and Homer1 Washtenaw Saline Milan and Mooreville 2 Midland Pine River and Badour1 Washtenaw Zeeb and North Territorial 2 Midland Redstone and 11 Mile 2 Midland Redstone and Coleman 2 Ottawa Polk @ 104th 2 Ottawa US-131 and Lake Michigan

37
Strata County Roadside Location Strata County Roadside Location3 Berrien I-94 and M-139 4 Wayne 7 Mile and Van Dyke3 Berrien Lakeside and Union Pier 4 Wayne 8 Mile and Randolph3 Berrien Piperstone and Nickerson 4 Wayne Annapolis and Wayne3 Calhoun 15 Mile and Michigan 4 Wayne Eureka and Telegraph3 Calhoun Beckley and 5 Mile 4 Wayne Farmington and Plymouth3 Calhoun Evanston and Michigan 4 Wayne Ford and Sheldon3 Calhoun I-94 and 5 Mile 4 Wayne Fort and Goddard3 Clinton Clark and Upton 4 Wayne Geddes and Canton Center3 Clinton Clark and Upton 4 Wayne Grand River and 8 Mile3 Clinton M-21 and Lowell 4 Wayne Greenfield and 9 Mile3 Clinton M-21 and Shepherdville 4 Wayne Greenfield and M-103 Clinton Main and Westphalia 4 Wayne Greenfield and Plymouth3 Genesee Chavez and Court 4 Wayne Haggerty and Ecorse3 Genesee Grand Blanc and Duffield 4 Wayne Huron River and Haggerty3 Genesee Mt.Morris and I-75 4 Wayne I-75 and Southfield3 Genesee N Ballenger and Flushing 4 Wayne I-94 and Harper3 Genesee N Elms Rd and Beacher 4 Wayne I-96 and Livernois3 Lapeer M-24 and Coulter 4 Wayne I-96 and Middlebelt3 Lenawee M-50 and Pentecost Hwy 4 Wayne Inkster and Van Horn3 Lenawee US-12 and Brooklyn 4 Wayne Jefferson and Randolph3 Monroe Eureka and Telegraph 4 Wayne Michigan and Greenfield3 Monroe Hull and Dunbar 4 Wayne Middlebelt and Eureka3 Monroe Plank and Ostrander 4 Wayne Monroe and Ecorse3 Monroe Tecumseh and Ann Arbor 4 Wayne Northline and I-753 Monroe Telegraph and 7th 4 Wayne Outer Drive and Rotunda3 Monroe Telegraph and Northline 4 Wayne Palmer and Lilley3 Monroe US-23 and US-223 4 Wayne Rawsonville and Textile3 Muskegon Maple Island and Ravenna 4 Wayne Rawsonville and Willis3 Muskegon Moorland and Ravenna Hts 4 Wayne Schafer and Grand River3 Muskegon Ravanna Hts and Blackmer 4 Wayne Sumpter and Main3 Saginaw M-52 and Fergus 4 Wayne Sumpton and Oakville 3 St. Clair I-69 and Riley Center 4 Wayne Telegraph and Northline3 St. Clair M-19 and Lambs 4 Wayne Van Dyke and McNichols3 St. Clair M-29 and Palms 4 Wayne Vernier and Lake Shore3 St. Joseph Banker and Klinger 4 Wayne Vernier and Mack3 St. Joseph Millard and US-131 4 Wayne Waltz and Huron River 3 Van Buren CR-380 and CR-681 4 Wayne Waltz and Willow3 Van Buren CR-681 and CR-684 4 Wayne Warren and Southfield3 Van Buren I-196 and Phoenix 4 Wayne Wick and Wayne3 Van Buren M-51 and CR-352 4 Wayne Woodward and Warren