2010 global cold storage capacity reports3.amazonaws.com/zanran_storage/.../2457725868.pdf · 2010...
TRANSCRIPT

2010 Global Cold Storage Capacity Report
By Victoria Salin, Texas A&M University, for the International Association of Refrigerated Warehouses

Page 1 of 28
2010 Global Cold Storage Capacity Report
Second Edition 2010 Prepared by Victoria Salin, Texas A&M University
Page 2 of 28
Author This report was prepared by Victoria Salin under contract to the IARW. Salin is an Associate Professor in the Department of Agricultural Economics at Texas A&M University specializing in agribusiness management and finance. Dr. Salin is chief financial officer of the Agribusiness, Food & Consumer Economics Research Center (http://AFCERC.tamu.edu) and leads research and outreach projects relating to food safety, traceability, financial markets, and strategic management.
Disclaimer The information promulgated by IARW is not intended to be a comprehensive resource with respect to the refrigerated warehousing industry. While the material has been compiled with care, IARW have not validated all of the information contained herein and do not assume any responsibility for its use, accuracy, or applicability. All users of the information unconditionally agree: (1) not to hold IARW responsible in any manner or to any extent for the user's action(s) or the consequences of such action(s) relating to the use of the information provided and (2) to indemnify IARW for all expenses, fees, costs, damages, awards, or other amounts incurred related to or arising from the user's use of the information. As used above, IARW shall mean the organizations and each organization's directors, officers, employees, volunteers, members, and agents.
Copyright © Copyright 2010 by the International Association of Refrigerated Warehouses. All rights reserved. This publication may not be reproduced, stored in any information retrieval system, or transmitted in whole or part, in any form or by any means without permission of the International Association of Refrigerated Warehouses, 1500 King Street, Suite 201, Alexandria, Virginia 22314-2730. tel +1 703 373 4300, [email protected].

Page 3 of 28
Table of Contents
Introduction .................................................................................................................................................. 4
Growth in Emerging Markets ........................................................................................................................ 8
Growth Trends in Global Capacity .............................................................................................................. 10
Market Development Indicators ................................................................................................................. 13
Characteristics of Refrigerated Warehouses .............................................................................................. 16
Selected Key Markets .................................................................................................................................. 20
Technical Appendix ..................................................................................................................................... 25
References .................................................................................................................................................. 27

Page 4 of 28
Introduction
This report provides an update on global cold storage capacity using information collected from international offices of the Global Cold Chain Alliance. The primary data source was a survey administered in fall 2010. Official government surveys conducted in the United States and India were also key sources. Updated data on refrigerated warehouse capacity, and the numbers and types of facilities, is reported for 20 countries in 2010. Trends are analyzed based on the database of the International Association of Refrigerated Warehouses (IARW) and the 2008 IARW Global Cold Storage Capacity Report.
Total capacity of refrigerated warehouses is estimated at 458 million cubic meters worldwide in 2010, of which 310 million cubic meters is public warehouses (for hire). During the last two years, approximately 192 million cubic meters of additional refrigerated warehouse capacity has been added to the IARW database. Of the additional capacity since 2008, 55 million cubic meters are public refrigerated warehouse space. The increase of public refrigerated warehousing worldwide is 20% over the two years, or 10% compound annual growth rate. The largest cold storage industries are in the USA, India, and China (Figure 1). The following countries are newly added to the IARW database in 2010: Azerbaijan, Moldova, Nicaragua, Panama, Serbia, and South Korea. Data for these, along with the other countries reporting for 2010, are shown in Table 1, for public warehouses, and in Table 2, for all refrigerated space. The figures in this report are the most complete available to document the trends in this growing industry. Certain limitations should be noted when the aggregations and growth trends are interpreted, including the potential for error due to (1) using conversion factors on original responses that were provided in different units, and (2) the difficulty in distinguishing public warehouse space (for hire) from privately managed warehouses. Please refer to the appendix for more detail on assumptions and calculation methods.

Page 5 of 28
Figure 1: Capacity of Refrigerated Warehouses, Twenty Largest Country Markets, 2008 or 2010 as Available, in Million Cubic Meters.
Table 1: Public (for Hire) Refrigerated Warehouse Capacity, by Country, 2008 or 2010 as Available. 2010 2008
Country Million m3
Per urban resident
Million m3
Per urban resident
Azerbaijan 0.308 0.067
- - Brazil 5.429 0.032
4.500 0.028
Chile 1.01 0.066
0.872 0.059 China 54.076 0.085
15.000 0.025
Colombia 0.088 0.003
0.120 0.004 Costa Rica 0.053 0.018
0.090 0.031
El Salvador 0.033 0.009
- - Germany 15.300 0.254
13.400 0.221
Guatemala 0.0532 0.008
0.070 0.011 India 0.460 0.001
- -
Japan 28.809 0.338
28.381 0.334 Mexico 1.630 0.019
1.350 0.016
Nicaragua 0.013 0.004
- - Panama 0.046 0.018
- -
Peru 0.228 0.010
0.080 0.004 USA 82.144 0.331
70.741 0.291
107 105
61
34
2216 13 9 8 8 7 7 6 6 6 4 4 4 2 2
0
20
40
60
80
100
120U
SA
Indi
a
Chin
a
Japa
n
Ger
man
y
Russ
ia
Net
herl
ands
Fran
ce
Spai
n
Bang
lade
sh
Sout
h Ko
rea
Cana
da
Aus
tral
ia
Braz
il
Gre
at B
rita
in
Mex
ico
Chile
Ital
y
Trin
. & T
obag
o
Belg
ium
Page 6 of 28
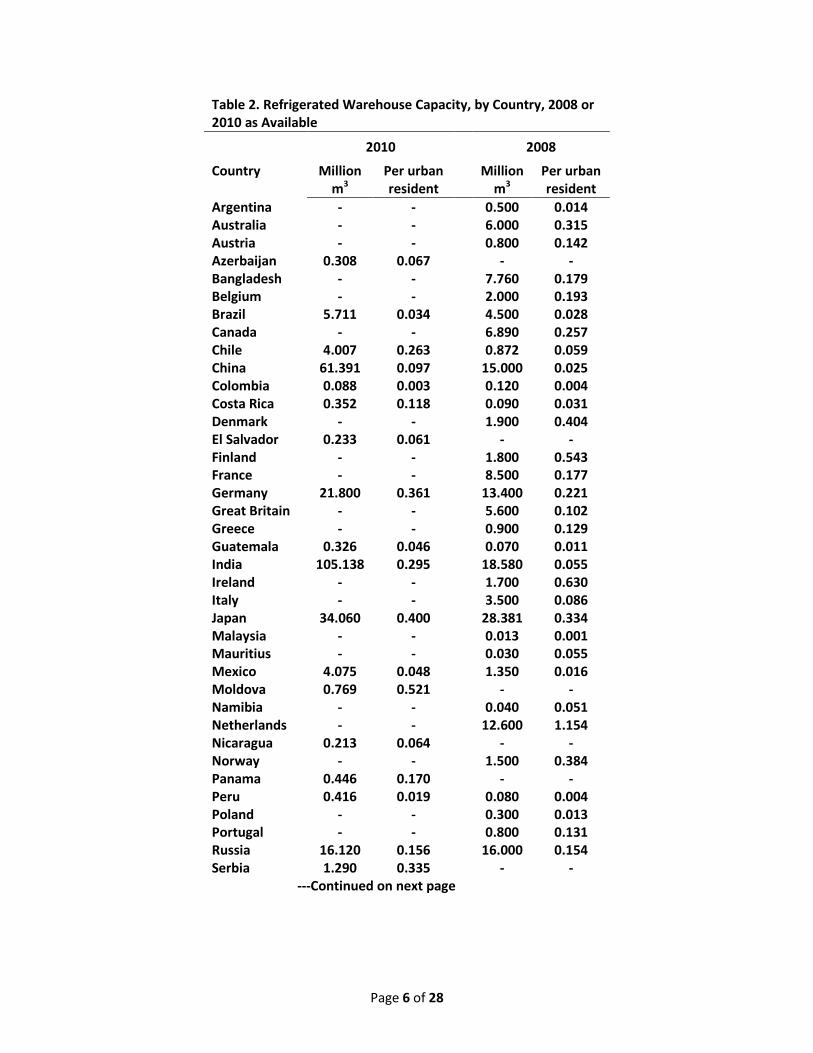
Table 2. Refrigerated Warehouse Capacity, by Country, 2008 or 2010 as Available 2010 2008
Country Million m3
Per urban resident
Million m3
Per urban resident
Argentina - -
0.500 0.014 Australia - -
6.000 0.315
Austria - -
0.800 0.142 Azerbaijan 0.308 0.067
- -
Bangladesh - -
7.760 0.179 Belgium - -
2.000 0.193
Brazil 5.711 0.034
4.500 0.028 Canada - -
6.890 0.257
Chile 4.007 0.263
0.872 0.059 China 61.391 0.097
15.000 0.025
Colombia 0.088 0.003
0.120 0.004 Costa Rica 0.352 0.118
0.090 0.031
Denmark - -
1.900 0.404 El Salvador 0.233 0.061
- -
Finland - -
1.800 0.543 France - -
8.500 0.177
Germany 21.800 0.361
13.400 0.221 Great Britain - - 5.600 0.102 Greece - -
0.900 0.129
Guatemala 0.326 0.046
0.070 0.011 India 105.138 0.295
18.580 0.055
Ireland - -
1.700 0.630 Italy - -
3.500 0.086
Japan 34.060 0.400
28.381 0.334 Malaysia - -
0.013 0.001
Mauritius - -
0.030 0.055 Mexico 4.075 0.048
1.350 0.016
Moldova 0.769 0.521
- - Namibia - -
0.040 0.051
Netherlands - -
12.600 1.154 Nicaragua 0.213 0.064
- -
Norway - -
1.500 0.384 Panama 0.446 0.170
- -
Peru 0.416 0.019
0.080 0.004 Poland - -
0.300 0.013
Portugal - -
0.800 0.131 Russia 16.120 0.156
16.000 0.154
Serbia 1.290 0.335
- - ---Continued on next page

Page 7 of 28
Table 2: Continued. Refrigerated Warehouse Capacity, by Country, 2008 or 2010 as Available. 2010 2008 Country Million
m3 Per urban resident
Million m3
Per urban resident
South Africa - -
0.440 0.015
South Korea 7.000 0.175
- - Spain - -
8.200 0.236
Sweden - -
0.900 0.118 Switzerland - -
1.000 0.193
Turkey - -
0.400 0.008 USA 107.476 0.433
70.741 0.291
Venezuela - -
0.350 0.013

Page 8 of 28
Growth in Emerging Markets
Two large emerging markets--India, and China--posted remarkable growth in cold storage warehousing. More than 68% of the growth in global capacity was in these two markets. In terms of volume of warehousing added, India and China account for 133 million cubic meters (m3) of new capacity. In India and China, short-term capacity growth rates exceeded 100% in each year over the last two years, on a compound annual basis. Refrigerated warehousing space more than doubled in each year. The boom in capacity occurred while these emerging economies continued to grow, despite the financial crisis and recessions in Europe and the USA. Real growth in household consumption expenditure was particularly impressive in China, at 19% from 2008-2009 (Table 3). This figure is after adjustment for inflation. Consumers in India increased expenditure at 5.6% real growth, over the same period. The sustained growth in these economies is consistent with the observed rapid investment in new capacity over the last two years. Although the emerging markets have growth in common, some distinctive characteristics of the cold storage industry are worth noting. India’s industry is characterized by a large number of smaller warehouses and, in terms of total capacity (at 105 million m3 as of 2010) is larger than China. China’s growth has been rapid (14% compound annual growth) but more moderate than India. The total capacity in China of 61 million m3 includes approximately 7 million m3 of private warehouses. Private warehouses are 12% of the total capacity in China. Of the reported capacity of refrigerated warehouses in China, none are government-owned. In India, there are relatively few public refrigerated warehouses, less than half a million m3. Government-owned refrigerated warehouses comprise 4 million m3 or 4% of the capacity in India. Cooperatively-owned warehouses are observed in India but not China. Cooperatives in India are classified as private facilities for the purposes of this report. The Russian economy is sometimes considered to be an important emerging market economy, along with Brazil, India and China, but in terms of the cold storage sector, Russia is not in a comparable growth position at this time. The capacity of the Russian refrigerated warehouse industry has been stable since 2008, with one new facility reported. Per capita GDP in Russia is higher than in India, China, or Brazil, but there was a major contraction of consumer spending in Russia (by 18%) from 2008 to 2009 (Table 3).
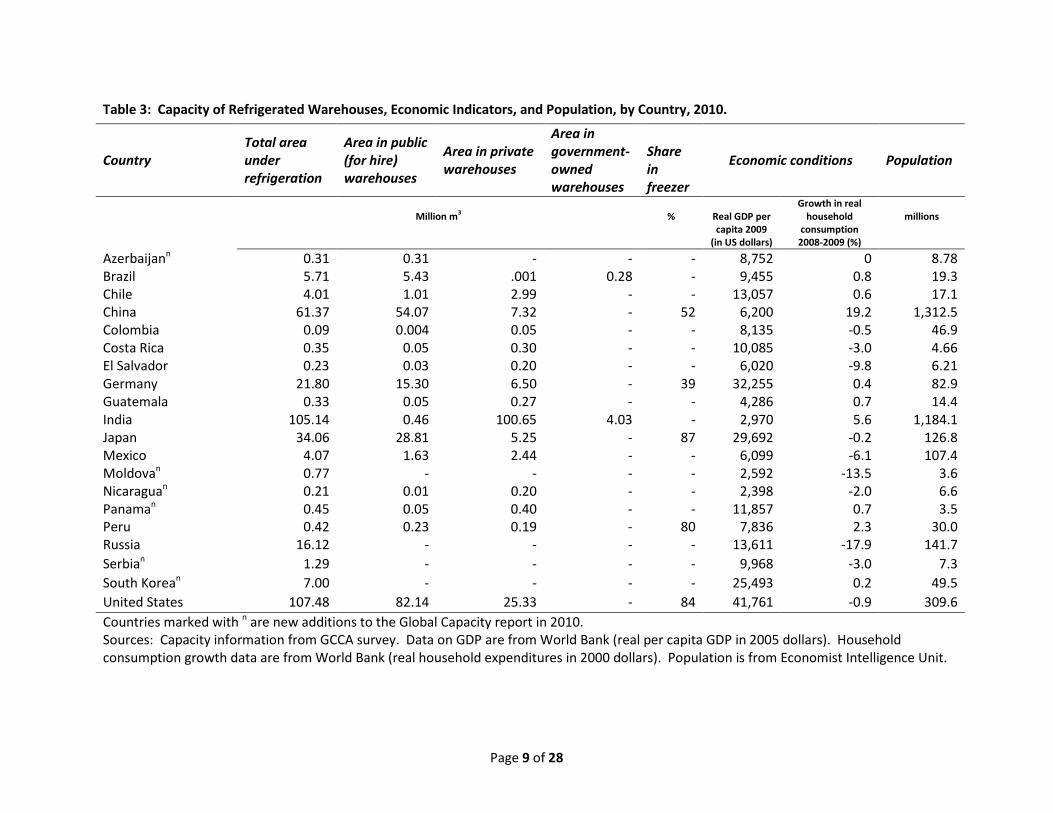
Page 9 of 28
Table 3: Capacity of Refrigerated Warehouses, Economic Indicators, and Population, by Country, 2010.
Country Total area under refrigeration
Area in public (for hire) warehouses
Area in private warehouses
Area in government-owned warehouses
Share in freezer
Economic conditions Population
Million m3
%
Real GDP per capita 2009
(in US dollars)
Growth in real household
consumption 2008-2009 (%)
millions
Azerbaijann 0.31 0.31 - - - 8,752 0 8.78 Brazil 5.71 5.43 .001 0.28 - 9,455 0.8 19.3 Chile 4.01 1.01 2.99 - - 13,057 0.6 17.1 China 61.37 54.07 7.32 - 52 6,200 19.2 1,312.5 Colombia 0.09 0.004 0.05 - - 8,135 -0.5 46.9 Costa Rica 0.35 0.05 0.30 - - 10,085 -3.0 4.66 El Salvador 0.23 0.03 0.20 - - 6,020 -9.8 6.21 Germany 21.80 15.30 6.50 - 39 32,255 0.4 82.9 Guatemala 0.33 0.05 0.27 - - 4,286 0.7 14.4 India 105.14 0.46 100.65 4.03 - 2,970 5.6 1,184.1 Japan 34.06 28.81 5.25 - 87 29,692 -0.2 126.8 Mexico 4.07 1.63 2.44 - - 6,099 -6.1 107.4 Moldovan 0.77 - - - - 2,592 -13.5 3.6 Nicaraguan 0.21 0.01 0.20 - - 2,398 -2.0 6.6 Panaman 0.45 0.05 0.40 - - 11,857 0.7 3.5 Peru 0.42 0.23 0.19 - 80 7,836 2.3 30.0 Russia 16.12 - - - - 13,611 -17.9 141.7 Serbian 1.29 - - - - 9,968 -3.0 7.3 South Korean 7.00 - - - - 25,493 0.2 49.5 United States 107.48 82.14 25.33 - 84 41,761 -0.9 309.6 Countries marked with n are new additions to the Global Capacity report in 2010. Sources: Capacity information from GCCA survey. Data on GDP are from World Bank (real per capita GDP in 2005 dollars). Household consumption growth data are from World Bank (real household expenditures in 2000 dollars). Population is from Economist Intelligence Unit.
Page 10 of 28
Growth Trends in Global Capacity
Compound annual growth rates (CAGRs) are shown in Table 4. First, the recent trend is shown for 20 countries, in the left columns of the table. Two longer-term CAGRs are shown for 24 countries, either the 12-year CAGR for countries for which we have data from 1998-2010 or a 10-year CAGR for countries that did not update beyond 2008. This approach allows the reader the most comprehensive view of the longer-term global trends, given that it was not possible to obtain updated data for many countries. While the CAGRs are annualized figures and thus fairly comparable, it should be kept in mind that the actual situation during the years covered may have differed, thus leading to different annualized results.
Another key consideration in the interpretation of growth trends is the classification of capacity into public and private warehouse space. The estimated growth rates for some markets may be the result of comparing total capacity in 2010 with public refrigerated warehouse space in earlier years. For the countries in which sources provide a reliable distinction between public and private cold storage, the short-term growth rate for public refrigerated warehouses is reported.
In 2010, the questionnaire explicitly requested differentiation of public from private warehouses. The IARW records for 2008 are predominantly public warehouses, but in some markets, the distinction may not have been made. Therefore, it is possible that apparent growth is due to capacity that was operational but not reported because it was not public refrigerated warehouse space. Growth rates are also shown under the assumption that the 2008 data are entirely from public refrigerated warehouses.
Trends Since 1998
In developing countries, annualized growth in cold storage capacity has been between 20 and 30 percent per year since 1998 (Figure 2). The most rapid growth was in India (25%), and Costa Rica (20%).
For the developed countries, growth tends to be much slower because refrigerated warehouse industries are well-established, having a large capacity baseline for growth to be measured against. Annualized growth has averaged 11% since 1998 for Germany, 5% for the USA and less than 2% in Japan (Table 4, Figure 2). These figures are CAGRs over 12 years, where the most recent period covers an economic recession.
Other European countries (except Germany) report growth of around 3% per year over the long term. Along with Germany, some European countries have grown rapidly over the last 10 years. In Ireland, growth was annualized at 9% per year for 1998-2008. Spain, Turkey, Netherlands and Italy are also relatively fast-growing among the European countries' cold storage industries.
Trends Since 2008
The period 2008-2010 was a time of significant expansion in cold storage capacity for most of the countries that reported in 2010. India is the fastest-growing refrigerated warehouse industry on the basis of short-term trends, growing at 138% compound annual rate. Refrigerated warehouse capacity roughly doubled each year in Peru, Guatemala, Chile, and Costa Rica.
Page 11 of 28
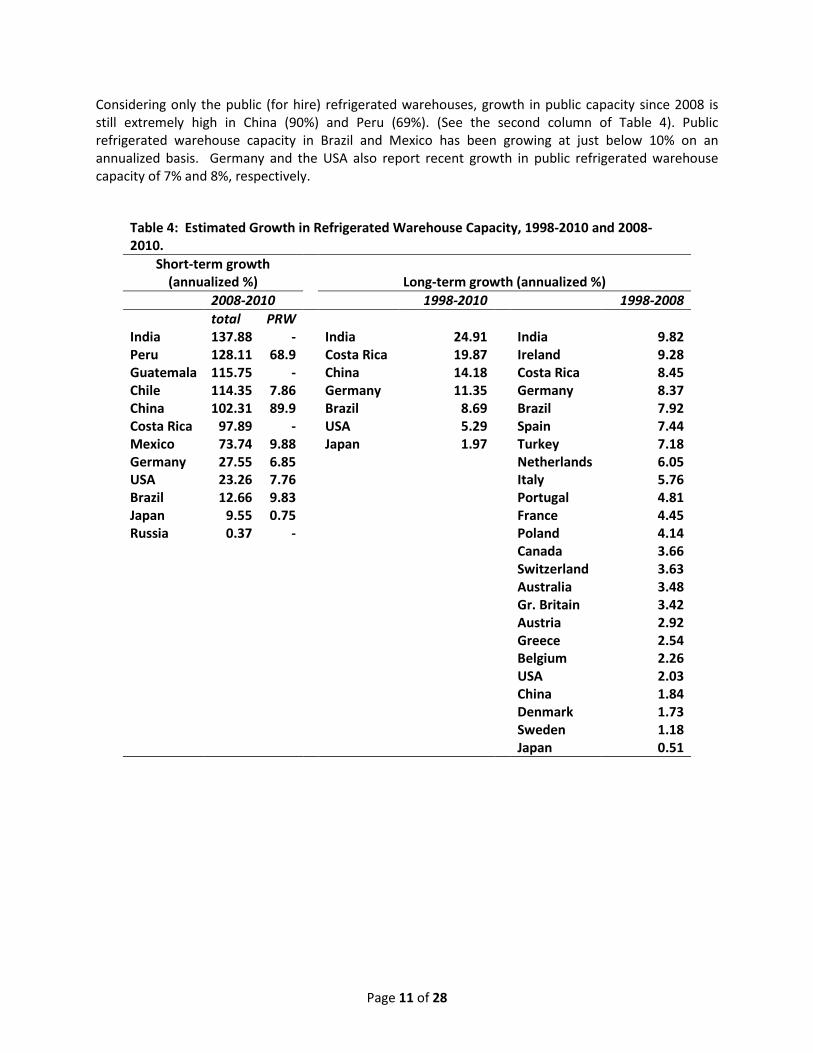
Considering only the public (for hire) refrigerated warehouses, growth in public capacity since 2008 is still extremely high in China (90%) and Peru (69%). (See the second column of Table 4). Public refrigerated warehouse capacity in Brazil and Mexico has been growing at just below 10% on an annualized basis. Germany and the USA also report recent growth in public refrigerated warehouse capacity of 7% and 8%, respectively.
Table 4: Estimated Growth in Refrigerated Warehouse Capacity, 1998-2010 and 2008-2010.
Short-term growth (annualized %)
Long-term growth (annualized %)
2008-2010 1998-2010 1998-2008 total PRW India 137.88 - India 24.91 India 9.82 Peru 128.11 68.9 Costa Rica 19.87 Ireland 9.28 Guatemala 115.75 - China 14.18 Costa Rica 8.45 Chile 114.35 7.86 Germany 11.35 Germany 8.37 China 102.31 89.9 Brazil 8.69 Brazil 7.92 Costa Rica 97.89 - USA 5.29 Spain 7.44 Mexico 73.74 9.88 Japan 1.97 Turkey 7.18 Germany 27.55 6.85 Netherlands 6.05 USA 23.26 7.76 Italy 5.76 Brazil 12.66 9.83 Portugal 4.81 Japan 9.55 0.75 France 4.45 Russia 0.37 - Poland 4.14 Canada 3.66 Switzerland 3.63
Australia 3.48
Gr. Britain 3.42
Austria 2.92
Greece 2.54
Belgium 2.26
USA 2.03
China 1.84
Denmark 1.73
Sweden 1.18
Japan 0.51

Page 12 of 28
Figure 2: Long-term Growth Rate in Refrigerated Warehouse Capacity, by Country, Annualized, 1998-2010 (*) or 1998-2008 as Available.
0 5 10 15 20 25 30
India*Costa Rica*
China*Germany*
IrelandBrazil*
SpainTurkey
NetherlandsItaly
USA*Portugal
FrancePolandCanada
SwitzerlandAustralia
Great BritainAustriaGreece
BelgiumDenmark
SwedenJapan*
Long-term CAGR (%)

Page 13 of 28
Market Development Indicators
A nation’s total refrigerated warehouse capacity depends largely on its population. In order to understand the relative level of development of the refrigerated warehouse industry across countries, a ratio that can be used for valid comparisons is needed. Specifically, a benchmark of market penetration calculated in this study is the ratio of refrigerated warehouse capacity to urban population. Forty-five countries are categorized as to the relative level of development of the cold storage industry on the basis of this ratio. (See Table 1 for the complete data by country.) The rationale for this index of market penetration is that middle class populations, who have the purchasing power to buy value-added food products, are concentrated in urban or metropolitan locations. It would be preferable to have an indicator that is specifically related to income of the population base in the market, but there is no available data source for the number in the middle class on a country-by-country basis.
The Netherlands has by far the largest ratio of capacity to urban population, at 1.15 m3 per capita in 2008. Other leading countries have more than 0.30 m3 of refrigerated warehouse space per urban resident (Figure 3). Countries in this group are: Netherlands, Ireland, Finland, Moldova, USA, Denmark, Norway, Germany, Serbia, Japan, and Australia. These top markets are significantly involved in foreign trade as well has having highly developed domestic economies.
Figure 3: Refrigerated Warehouse Market Penetration, for Countries in the High Range of the Market Index (m3/urban population), 2008 or 2010.
0 0.2 0.4 0.6 0.8 1 1.2 1.4
Netherlands
Ireland
Finland
Moldova
USA
Denmark
Japan
Norway
Germany
Serbia
Australia
Cubic meters per urban resident

Page 14 of 28
The group of countries categorized as mid-level in terms of cold storage market penetration includes three of the four large emerging market nations, Russia, India and China (Figure 4). Capacity of refrigerated warehouses per urban resident ranges from 0.10 to 0.30 m3 among the group of countries in the middle-range of the market penetration index. The urban population is only 45% of the total population in China, and smaller yet in India (30%). Urbanization in the two large emerging markets is well below the 70-to-80% urbanization rates for other countries in the middle range of the market penetration index.
The lowest reported level of refrigerated warehouse industry development is countries with fewer than 0.07 m3 of cold storage per urban resident (Figure 5). The list of low-index cold storage markets includes: Malaysia, Colombia, Turkey, Poland, Venezuela, Argentina, South Africa, Mexico, Brazil, Peru, Guatemala, Namibia, Mauritius, El Salvador, Nicaragua, and Azerbaijan. Some of these countries’ cold storage industries are fast-growing, such as Peru and Guatemala.
Figure 4: Refrigerated Warehouse Market Penetration, for Countries in the Middle Range of the Market Index (m3/urban population), 2008 or 2010.
0.000 0.050 0.100 0.150 0.200 0.250 0.300 0.350
India
Chile
Canada
Spain
Switzerland
Belgium
Bangladesh
France
South Korea
Panama
Russia
Austria
Portugal
Greece
Costa Rica
Sweden
Great Britain
China
Italy
Cubic meters per urban resident

Page 15 of 28
Figure 5: Refrigerated Warehouse Market Penetration, for Countries in the Low Range of the Market Index (m3/urban population), 2008 or 2010.
The market index proposed in this study is a starting point toward a comprehensive set of benchmarks for industry performance and business conditions that may lead to predictions of economic development in a given market area. There are no existing widely accepted industry indicators specifically for the refrigerated warehouse industry. Performance indicators that are commonly used in other commercial property sectors include commercial rents on industrial property, along with occupancy rates. In its evaluations of global trends in industrial property, Cushman & Wakefield report that the underlying drivers of industrial rents include: “…demand for manufacturing and industrial production” and “global export activity.” These industrial and commercial activities are ultimately driven by consumer demand for goods. Refrigerated warehouses are a specialized type of industrial property, linked closely with consumer demand for food products. Therefore, refrigerated warehousing capacity is linked with the following fundamentals:
• the size of a country's economy and population,
• the wealth of its people,
• its food industry, including trade, and
• its food culture.
These features should be studied in association with the market index to analyze trends and the outlook for development of the refrigerated warehousing industry in the future.
0.000 0.010 0.020 0.030 0.040 0.050 0.060 0.070 0.080
AzerbaijanNicaragua
El SalvadorMauritius
NamibiaMexico
GuatemalaBrazilPeru
South AfricaArgentinaVenezuela
PolandTurkey
ColombiaMalaysia
Cubic meters per urban resident

Page 16 of 28
Characteristics of Refrigerated Warehouses
Freezer space ranges from a low of 40% of the total market (in Germany) to more than 80% in USA, Japan, and Peru (Figure 6). In China, freezer space is reported at 52% of total refrigerated area.
The average size of refrigerated facilities varies considerably across country markets. In the USA, a 60,000 m3 size facility is average (Figure 7). Brazil has relatively large facilities within its 5.71 million m3 of refrigerated warehouse capacity. Other Latin American countries report larger facilities as well, but there may be differences among respondents in defining facilities as individual warehouses or as companies that operate multiple establishments.
Supporting infrastructure to the cold chain is expressed as an important constraint in a few developing country markets.
There is a distinction in the share of the market operated as warehouses for hire (public refrigerated warehouses) and warehouses that are privately managed for a particular food company’s use. Public refrigerated warehousing dominates market share over privately managed warehousing in Brazil, China, Colombia, Germany, Japan, and the USA (Figure 8). The exception is India, which is mainly a market for private warehouses including cooperatives, which are user-owned facilities. Few countries report significant capacity in government-owned refrigerated warehousing. Table 5 provides the share of warehouses in public, private, and government management, in the original units reported to the IARW in 2010.
Figure 6: Share of Capacity in Freezer Space, by Country, 2010.
0%
10%
20%
30%
40%
50%
60%
70%
80%
90%
100%
China Germany Japan Peru USA
Percent of area in freezer

Page 17 of 28
Figure 7: Average Size of Refrigerated Warehouses, by Country, 2010.
Figure 8: Public and Private Shares in Refrigerated Warehouse Industry, by Country, 2010.
- 20,000 40,000 60,000 80,000 100,000 120,000 140,000 160,000 180,000
Moldova
Japan
Azerbaijan
India
Peru
Germany
China
Brazil
USA
Guatemala
Chile
Mexico
Page 18 of 28
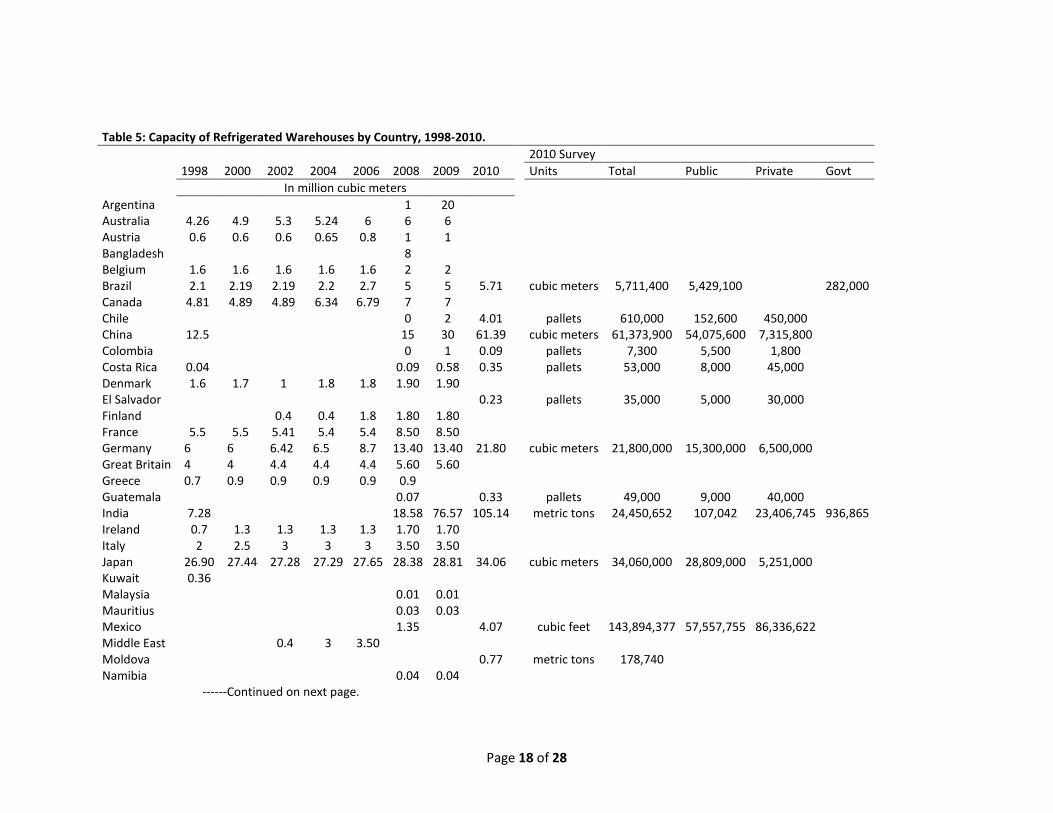
Table 5: Capacity of Refrigerated Warehouses by Country, 1998-2010.
2010 Survey
1998 2000 2002 2004 2006 2008 2009 2010 Units Total Public Private Govt
In million cubic meters Argentina 1 20 Australia 4.26 4.9 5.3 5.24 6 6 6 Austria 0.6 0.6 0.6 0.65 0.8 1 1 Bangladesh 8 Belgium 1.6 1.6 1.6 1.6 1.6 2 2 Brazil 2.1 2.19 2.19 2.2 2.7 5 5 5.71 cubic meters 5,711,400 5,429,100 282,000 Canada 4.81 4.89 4.89 6.34 6.79 7 7 Chile 0 2 4.01 pallets 610,000 152,600 450,000 China 12.5 15 30 61.39 cubic meters 61,373,900 54,075,600 7,315,800 Colombia 0 1 0.09 pallets 7,300 5,500 1,800 Costa Rica 0.04 0.09 0.58 0.35 pallets 53,000 8,000 45,000 Denmark 1.6 1.7 1 1.8 1.8 1.90 1.90 El Salvador 0.23 pallets 35,000 5,000 30,000 Finland 0.4 0.4 1.8 1.80 1.80 France 5.5 5.5 5.41 5.4 5.4 8.50 8.50 Germany 6 6 6.42 6.5 8.7 13.40 13.40 21.80 cubic meters 21,800,000 15,300,000 6,500,000 Great Britain 4 4 4.4 4.4 4.4 5.60 5.60 Greece 0.7 0.9 0.9 0.9 0.9 0.9 Guatemala
0.07 0.33 pallets 49,000 9,000 40,000
India 7.28
18.58 76.57 105.14 metric tons 24,450,652 107,042 23,406,745 936,865 Ireland 0.7 1.3 1.3 1.3 1.3 1.70 1.70 Italy 2 2.5 3 3 3 3.50 3.50 Japan 26.90 27.44 27.28 27.29 27.65 28.38 28.81 34.06 cubic meters 34,060,000 28,809,000 5,251,000 Kuwait 0.36
Malaysia
0.01 0.01 Mauritius
0.03 0.03
Mexico
1.35 4.07 cubic feet 143,894,377 57,557,755 86,336,622 Middle East
0.4 3 3.50
Moldova
0.77 metric tons 178,740 Namibia
0.04 0.04
------Continued on next page.

Page 19 of 28
Table 5: Capacity of Refrigerated Warehouses by Country, 1998-2010----Continued
2010 Survey
1998 2000 2002 2004 2006 2008 2009 2010 Units All Public Private Govt In million cubic meters
Netherlands 7 7.5 10 1.2 9 12.60 12.60
New Zealand 1
1.16
Nicaragua
pallets 32,000 2,000 Norway 1.5 1.5 1.5 1.5 1.5 1.50 1.50
Panama
0.45 pallets 67,000 7,000 60,000 Peru
0.08 0.40 0.42 pallets 62,600 34,300 28,300
Poland 0.2 0.3 0.3 0.3 0.3 0.30 0.30
Portugal 0.5 0.6 0.6 0.6 0.6 0.80 0.80
Russia
16.00 16.00 16.12 cubic meters 16,120,000 Serbia
1.29 metric tons 300,000
South Africa
0.44 0.44
South Korea
7.0 cubic meters 7,000,000
Spain 4 4 2.5 2.5 2.9 8.20 8.20
Sweden 0.8 1 0.9 0.9 0.9 0.90 0.90 Switzerland 0.7 0.7 0.5 0.5 0.5 1.00 1.00 Trinidad & Tobago 2.00 0.06 Turkey 0.2 0.3 0.3 0.3 0.3 0.40 0.40 USA 57.88 60.8 63.77 66.75 68.97 70.74 89.38 107.33 cubic feet 3,790,000,000 2,900,000,000 894,000,000 Venezuela 0.35 1.75 Source: GCCA Survey.

Page 20 of 28
Selected Key Markets
India
This special section on India is based on an official cold storage survey taken at year end 2009 and reported by the Department of Agriculture and Cooperation. According to the Indian government official data, cold storage capacity grew by more than four times in India since 2008, from 18.6 million cubic meters to 105 million cubic meters. The increase in storage capacity is 86.56 million cubic meters.
Most of the cold storage industry in India is under private management. There are 4,885 cold storage facilities under private ownership, which accounted for 90.78% of the total number of facilities. By capacity, the private sector was 100.65 million cubic meters, which was about 95.73% of the total capacity.
The cooperative sector is comprised of facilities owned in common by members who use the facility’s services. Cooperatives are a relatively small share of the refrigerated warehouses in India, at 6.6% of facilities and 3.8% of capacity (Figure 9, Table 6). Government-owned refrigerated warehouses are only 2.6% of the number of facilities and less than 1% of capacity.
Potatoes are the leading commodity stored in India’s refrigerated warehouses (Table 7). There were 2,862 facilities storing potatoes, 79.23 million cubic meters cold storage volume, which accounted for 53.19% of the total cold chain warehouse storage facilities and about 75.36% of the total capacity. Around one-third of India’s facilities are designated as “multipurpose,” 29.44% of the total number of refrigerated warehouse storage and about 23.09% of the total capacity. Fruits and vegetables, meat and fish, and dairy products are each less than 1% in terms of capacity shares in refrigerated warehouses.
Figure 9: Share of public (for-hire) and privately managed facilities in total refrigerated warehouse capacity in India, 2010.

Page 21 of 28
Table 6: Distribution of India Cold Storage by Ownership, 2010. Private Cooperative Government Total Number of facilities 4,885 356 140 5,381 Percent of facilities 90.8% 6.6% 2.6% 100% Capacity in: Metric tons 23,406,745 936,865 107,042 24,450,652 Cubic meters 100,649,004 4,028,520 460,281 105,137,804 Percentage by capacity 95.7% 3.8% 0.4% 100% Note: 1 MT = 4.3 cubic meters (Source: IARW, Conversion factors) Source: Government of India, directorate of marketing and inspection, Dept. of Agriculture and Cooperation http://india.gov.in/citizen/agriculture/crop_storage.php
Table 7. Commodities Stored in Refrigerated Warehouses in India, 2010.
Potatoes
Multi-purpose
Fruits & Veg.
Meat & Fish
Milk & Milk Products Other Total
No. of facilities 2,862 1,584 160 497 191 87 5,381
% of facilities 53.19% 29.44% 2.97% 9.24% 3.55% 1.62% 100%
Capacity in:
Metric tons 18,426,316 5,644,659 96,427 188,496 68,230 26,524 24,450,652
Cubic meters 79,233,158 24,272,033 414,636 810,532 293,389 114,053 79,233,158
% of capacity 75.36% 23.09% 0.39% 0.77% 0.28% 0.11% 100%
Note: 1 MT = 4.3 cubic meters (Source: IARW, Conversion factors) Source: Government of India, Directorate of marketing and inspection, Dept. of Agriculture and Cooperation http://india.gov.in/citizen/agriculture/crop_storage.php
China
This section is based on a report by Liu Longchang entitled “Current Situation Analysis and Prospect of Chinese Low-Temperature Storage.” Refrigerated warehouse capacity in China has increased rapidly in terms of volume. The quality of the recent construction is reported to be approaching the technology level of modern warehousing standards in developed countries. Features include automatic humidification, multi-layer shelf management, warehouse management systems, and other technologies that allow managers to track product flow at batch level. Lighting (LED) for environmental conservation and energy efficiency is being introduced.
Since 2007, investments in cold storage with international business partners have begun to open. Companies and facilities include: Igloo (Shanghai) in 2007, a venture of Preferred and Dalian Yida Group in 2009, Guangdong Swire in 2010 (186,000 m3), Sanquan in 2010 (252,000 m3), and refrigeration installation at the Wuhan Baishazhan wholesale market. The projects cover a range of levels of the cold chain—logistics, storage, food processing, and wholesale markets. The expected pace of construction is to grow by 10% each year.
Cold chain logistics is an explicit part of the Chinese national 12th 5-year plan, according to the US Department of Agriculture attache in Beijing (Pei, 2010). In the “Logistics Industry Adjustment and

Page 22 of 28
Development Plan,” the goal is stated to add an additional 10 million tons in capacity between 2010 and 2015. It appears that the new projects benefit from government funding (3.5 million yuan was stated as the investment in one new meat processing project), but they are not operated as state enterprises. They appear to be classified as public refrigerated warehouses. A total of 6 new refrigerated warehouse projects underway involve food/fisheries products and one is to distribute animal vaccines. Along with the official support for refrigerated warehousing projects, the government has issued new national standards for design specifications to be used in construction. The 2010 code replaces standards from 2001. Items covered by codes include building and insulation, electric power, water supply and drainage.
Public warehouses (for hire) comprise 64.8% of the facilities in China and an even larger share of capacity (88%). The nationwide statistics on refrigerated warehouses in China cover 31 provinces and municipalities. Hong Kong and Taiwan are not covered in the reports for China. The fastest-growing regions in China are reported in table 8.
Table 8: Growth Trends in Refrigerated Warehouse Capacity in China, by Province and Location, 2010.
Province
Growth rate (%) Nearby city Region
Hainan 31 Guongdong, Guangshou, Shenzen South
Tianjing 24 Beijing North Qinghai 16 Xining West Shanghai 11 Shanghai East Coast Fujian 11 Xiamen Southeast
Source: Liu Longchang, p. 14.
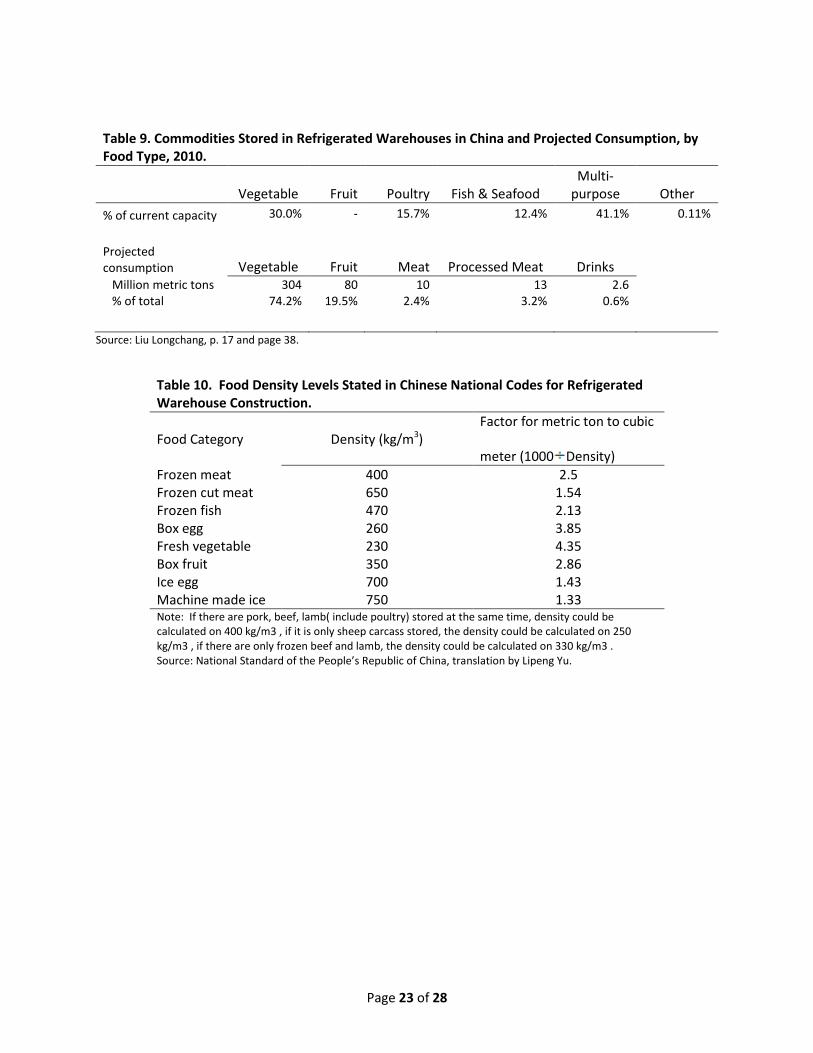
The wide variety of products stored in refrigerated warehouses in China is indicated by Table 9. Vegetables are dominant in terms of capacity utilization by commodity type. In the future, the Chinese industry expects that refrigerated warehouse capacity will be needed to accommodate additional product types. The foods that are expected to grow in consumer demand, and expected levels of household consumption are shown in the last two rows of Table 9. New special-purpose facilities are also being developed to freeze bulk rice, presumably for long-term storage near agricultural production regions.
The government-issued codes for construction of cold storages report factors to be used for conversion between weight measurement and volume measurement, differentiated by food product type (National Standard of the People’s Republic of China, 2010). The suggested conversion factors are shown in Table 10.
Page 23 of 28
Table 9. Commodities Stored in Refrigerated Warehouses in China and Projected Consumption, by Food Type, 2010.
Vegetable Fruit Poultry Fish & Seafood
Multi-purpose Other
% of current capacity 30.0% - 15.7% 12.4% 41.1% 0.11%
Projected consumption Vegetable Fruit Meat Processed Meat Drinks
Million metric tons 304 80 10 13 2.6 % of total 74.2% 19.5% 2.4% 3.2% 0.6%
Source: Liu Longchang, p. 17 and page 38.
Table 10. Food Density Levels Stated in Chinese National Codes for Refrigerated Warehouse Construction. Food Category
Density (kg/m3)
Factor for metric ton to cubic
meter (1000 Density) Frozen meat 400 2.5 Frozen cut meat 650 1.54 Frozen fish 470 2.13 Box egg 260 3.85 Fresh vegetable 230 4.35 Box fruit 350 2.86 Ice egg 700 1.43 Machine made ice 750 1.33 Note: If there are pork, beef, lamb( include poultry) stored at the same time, density could be calculated on 400 kg/m3 , if it is only sheep carcass stored, the density could be calculated on 250 kg/m3 , if there are only frozen beef and lamb, the density could be calculated on 330 kg/m3 . Source: National Standard of the People’s Republic of China, translation by Lipeng Yu.

Page 24 of 28
United States of America
At 107 million m3, the USA has the largest cold storage capacity of any single country in the world. Between 2008 and 2010, the US refrigerated warehouse industry grew at an annual compound rate of 23%, according to the U.S. Department of Agriculture’s survey (NASS). This figure represents general cold storages and excludes apple and pear storage facilities. The majority of the increment in capacity in the USA since 2008 is public warehousing (available for hire). This is a continuation of a 20-year trend of increasing share of public cold storage over privately managed warehouses (Figure 9).
Figure 9: Public and Private Refrigerated Warehouse Capacity in USA, 1955-2010.
-
500,000,000
1,000,000,000
1,500,000,000
2,000,000,000
2,500,000,000
3,000,000,000
3,500,000,000
'55'57'59'61'63'65'67'69'71'73'75'77'79'81'83'85'87'89'91'93'95'97'99'01'03'05'07'09
Cubi
c fe
et
Pub…Priv…

Page 25 of 28
Technical Appendix
The methodology and technical details of the calculations are shown in the following sections. Finally, the questionnaire used to collect information from respondents worldwide is reproduced.
Method of Calculation of Growth Rates
Compounding is a smoothing method that converts a series of values over time to an annualized figure. The smoothing approach is appropriate for comparisons made over time, particularly over long periods. For capital investments such as warehouses, investments come on line in fairly large increments that would produce discontinuity in growth trends if analyzed year-to-year. CAGRs are calculated as:
Where Vt0 is the initial historical observation, Vtn is the observation n periods later. For the 12-year annualized results, for example, Vt0 is the 1998 capacity level and Vtn is the reported capacity in 2010.
Conversion Factors
There are various ways to measure refrigerated warehouse capacity; the key difference is weight basis compared with volume basis. The conversion from weight-based units (metric tons) to volume units (cubic meters) depends on the product in storage, and we lack specific information on products for many countries. As a result, approximations of capacity in volume were made for certain countries. The conversions that were used in this report are:
1 Pallet = 6.65 cubic meters, for countries in the Americas. European pallets are converted at 1 Pallet = 1.944 cubic meters.
1 Metric ton = 4.3 cubic meters
1 Cubic meter = 35.31 cubic feet
It should be noted that the data for 1998-2008 have been converted to cubic meters by IARW staff and it has not been possible to verify that the conversion factors used in 2010 are the same as conversions used in the past. Therefore, readers need to interpret the long-term trends carefully.
Further, it is possible that part of the growth recorded in 2010 is from the addition of information about capacity in private warehouses, which had been excluded in the previous years’ records. Where possible, the data presented in this report distinguish total capacity and public shares.
The official survey of refrigerated warehouse capacity in the USA suggests that the reported growth is partly due to improved survey coverage of the industry; enhanced survey coverage may explain part of the reported growth in other countries as well.
Page 26 of 28
Economic Indicators
In this study, we measure economic growth with the percentage change in household consumption expenditures, collected by the World Bank (Table 3). The most recent data available are for 2009. This growth rate measures the trend in the consumer sectors of an economy. By definition, total national income, or GDP (Gross Domestic Product) is the sum of economic activity in four areas:
• Consumption by households, • Investment by businesses or households, • Government expenditures (net of taxes), and • Foreign sector (net exports).
The food sector is a portion of household consumption, and its relative position varies with the development of an economy. At higher levels of wealth, consumers spend a smaller share of their total income on food.
The relative strength of one country’s economy compared with another is measured by GDP per capita (table 3), also from World Bank sources. The broader GDP indicator will partly account for the role of traded goods as a driver of refrigerated warehouse utilization.
Both economic indicators have been adjusted for inflation by the World Bank. The base year for the per capita GDP is 2005. The interpretation is that the value of the GDP reported does not include any increases that are purely due to inflation from 2005 to 2009. The consumption data that we use are indexed on 2000 as the base year. The growth rate between 2008 and 2009 is in percentage terms and it indicates the change in actual purchasing power of the households.

Page 27 of 28
References
Agribusiness Development Project (concluded in September, 2009), John Ogonowski Farmer-to-Farmer Program (currently under implementation), the US Agency for International Development (USAID). Moldovan Fridge Truck Transportation Survey. Retrieved on Dec 21, 2010 from ftp://ftp.moldova.cnfa.org/surveys/Transportation.ppt
Bledsoe, Gleyn (2009). Cold Chain and Storage Action Plan, for Azerbaijan, May 2009. Retrieved on Feb 20, 2010 from http://pdf.usaid.gov/pdf_docs/PNADT141.pdf
Bond, Chris. Cushman & Wakefield Global Real Estate Solutions, (2010). “Falling Industrial Rents Reflect Global Slump in Demand for Goods,” http://www.cushwake.com/cwglobal/jsp/newsDetailPRinter.jsp, accessed March 23, 2010 and Cushman & Wakefield Research, “Industrial Space Across the World 2010,” 16 March 2010.
Cool People, The interview with Dr. Ravinder Kumar Sharma. Cold Facts May-Jun 2009: 30. Retrieved on Feb 21, 2011 from http://www.gcca.org/hq/bulletins/cf/2009-03_May-Jun.pdf
Corado, Debbie (2009). Cold Chain Growth in Central America, Cold Facts Sept-Oct. 2009: 16-18. Retrieved on Feb 21, 2011 from http://www.gcca.org/hq/bulletins/cf/2009-05_Sep-Oct.pdf
CNFA Moldova. Package Availability Survey. Retrieved on Dec 21, 2010 from ftp://ftp.moldova.cnfa.org/SURVEYS/Packaging.ppt
Euromonitor international 2011 - population and homes. Database. Retrieved 2/07/2011, from http://www.portal.euromonitor.com/Portal/Magazines/Welcome.aspx
Evdokimova, Ksenia (2009). Food Industry and Cold Chain Challenges In Russia, Cold Facts (July-August 2009), 19-21. Retrieved on Feb 20th, 2010 from http://www.iarw.org/hq/bulletins/cf/2009-04_Jul-Aug.pdf
Government of India, Directorate of Marketing and Inspection, Dept. of Agriculture and Cooperation. Cold Storages in India. Retrieved on Dec. 22, 2010 from http://india.gov.in/citizen/agriculture/crop_storage.php
Jorgensen, Nora (2010). Finding Formulas for Success in China, Cold Facts (Nov-Dec 2010), 20-23. Retrieved on Feb 19th, 2010 from http://gcca.org/hq/bulletins/cf/2010-06_Nov-Dec.pdf
Jorgensen, Nora (2010). India by the Numbers, Cold Facts (September-October 2010), 24-25. Retrieved on Feb 20th, 2010 from http://www.gcca.org/hq/bulletins/cf/2010-05_Sep-Oct.pdf
Khanna, Atul & Miller, Tori (2009). Incredible India, Cold Facts (May-June 2009), 8-12. Retrieved on Feb 19th, 2010 from http://www.iarw.org/hq/bulletins/cf/2009-03_May-Jun.pdf
Leahu, Viorel & Zubatîi, Alexandr, (2008). Current State of Moldovan Cold Storages for Fruits and Vegetables (February 2008). Retrieved on Dec 21, 2010 from http://www.cnfa.md/report/847/index.html
Liu, Longchang. (2010) Current situation analysis and prospect of Chinese low-temperature storage. Presented at the 4th Refrigerated Warehouse Construction and Operations Seminar.
Moldova Ministry of Agriculture and Food Industry (2008). A Program to Revitalize the PostHarvest Handling System for Fresh Fruits, Table Grapes and Vegetables (2008-2015), July 2008. Retrieved on Dec 22, 2010 from http://moldova.usaid.gov/lib/Cold_Storage_Program.pdf
National Agricultural Statistics Service, (NASS), U.S. Department of Agriculture. Capacity of Refrigerated Warehouses, (01.28.2010). Retrieved on Dec. 17, 2010 from http://usda.mannlib.cornell.edu/MannUsda/viewDocumentInfo.do;jsessionid=E8594A6BDF9131B17866093F4D19B626?documentID=1424
Page 28 of 28
National Refrigeration Association of Republic of Moldova (Chisinau, November, 2004). Cold Chain Study in Moldova: The Condition of the Refrigeration Warehouses Built for Chilling, Storing and Export of Fruits and Vegetables in the Republic of Moldova. Retrieved on Dec 21, 2010 from http://www.cnfa.md/report/282/index.html
National Standard of the People’s Republic of China, Code for design of cold store GB50071-2001, Issued by State Bureau of Quality and Technical Supervision and Ministry of Construction of the People's Republic of China on April 17th, 2001, Implementation date: June 1st, 2001. Chief Development Department: State Bureau of Internal Trade. Retrieved on March 1st, 2011
National Standard of the People’s Republic of China, Code for design of cold store GB50071-2010, Issued by General Administration of Quality Supervision, Inspection and Quarantine of the People's Republic of China and Ministry of Housing and Urban-Rural Development of the People’s Republic of China on January 18th, 2010, Implementation date: July 1st, 2010. Chief Development Department: Ministry of Commerce of the People’s Republic of China. Retrieved on March 1st, 2011
Neel, Stephen & Bonar II, Henry. (April 2009). Cold Chain Strategy for Serbia -Final Assessment Report. World Food Logistics Organization for USAID Agribusiness Project. Retrieved on Dec 21, 2010 from http://www.agrobiznis.net/documents/ RS_Cool%20Chain%20Strategy%20for%20Serbia.pdf
Pei, Zhiyong, Cold Chain Standards Conference (Beijing ATO_ Peoples Republic of China) USDA-FAS (foreign agricultural service), GAIN (Global Agricultural Information Network) report, Nov 17, 2010. Retrieved on March 1st, 2011 from http://gain.fas.usda.gov/Recent%20GAIN%20Publications/Cold%20Chain%20Standards%20Conference_Beijing%20ATO_China%20-%20Peoples%20Republic%20of_11-17-2010.pdf
Rickard, Al (2010). Serbia: A Story of Cold Chain Potential, Cold Facts (Jan-Feb 2010), 20-21, Global Cold Chain Alliance. Retrieved on Dec 21, 2010 from http://www.gcca.org/hq/bulletins/cf/2010-01_Jan-Feb.pdf
Ventura, Ernesto Lopez & Miller, Tori (2009). Out of Africa: Challenges and Opportunities in Ghana, Cold Facts (March-April 2009), 10-14. Retrieved on Feb 20th, 2010 from http://www.iarw.org/hq/bulletins/cf/2009-02_March-April.pdf
World Food Logistics Organization (2004).Cold Chain Strategic Plan for Moldova (November 2004). Retrieved on Dec 21, 2010 from http://www.iarw.org/hq/Intl_Programs/Moldova%20ADP%20Cold%20Chain%20Strategic%20Plan%20Eng.pdf
