2010 pew internet study, government online. · government online the internet gives ... pew...
TRANSCRIPT

Government OnlineThe internet gives citizens new paths to government services and information
Aaron Smith, Research Specialist
April 27, 2010
View online:http://pewinternet.org/Reports/2010/Government-Online.aspx
Pew Internet & American Life ProjectAn initiative of the Pew Research Center1615 L St., NW – Suite 700Washington, D.C. 20036202-419-4500 | pewinternet.org

page 2
Summary of FindingsAs government agencies at all levels bring their services online, Americans are turning in large numbers to government websites to access information and services. Fully 82% of internet users (representing 61% of all American adults) looked for information or completed a transaction on a government website in the twelve months preceding this survey. Some of the specific government website activities in which Americans take part include:
• 48% of internet users have looked for information about a public policy or issue online with their local, state or federal government
• 46% have looked up what services a government agency provides
• 41% have downloaded government forms
• 35% have researched official government documents or statistics
• 33% have renewed a driver’s license or auto registration
• 30% have gotten recreational or tourist information from a government agency
• 25% have gotten advice or information from a government agency about a health or safety issue
• 23% have gotten information about or applied for government benefits
• 19% have gotten information about how to apply for a government job
• 15% have paid a fine, such as a parking ticket
• 11% have applied for a recreational license, such as a fishing or hunting license
Throughout this report, we refer to anyone who did one or more of these activities in the preceding twelve months as an online government user, and most of these online government users exhibit a rela-tively wide range of behaviors: the typical online government user engaged in four of these activities in the last year.
The way we ask about the use of government services has changed over the years, making direct com-parisons to our prior findings difficult. However, even accounting for these methodological changes it is clear that going online to complete basic transactions with government (such as renewing a license or paying a fine) is now much more commonplace than it was earlier in the decade. Conversely, online informational activities (looking up services, downloading forms, etc.) are roughly as common within the online population as they were the last time we asked about these activities in 2003.
In this report, we identify several other common characteristics regarding citizens’ interactions with gov-ernment. Specifically, these interactions are frequently:
• Data driven – Efforts by government agencies to post their data online are resonating with citizens. Fully 40% of online adults went online in the preceding year to access data and information about government (for instance, by looking up stimulus spending, political campaign contributions or the text of legislation). These “government data users” are discussed in more detail in Part 4.
• Organized around new online platforms – Citizen interactions with government are moving beyond the website. Nearly one third (31%) of online adults use online platforms such as blogs, social net-working sites, email, online video or text messaging to get government information. These “govern-ment social media users” are discussed in Part 2.
• Participatory – Americans are not simply going online for data and information; they want to share their personal views on the business of government. Nearly one quarter (23%) of internet users participate in the online debate around government policies or issues, with much of this discussion

page 3
occurring outside of official government channels. These “online government participators” are also discussed in more detail in Part 2 of this report.
These are among the key findings of a Pew Internet and American Life Project survey of how Americans interact with government online. Some of the other findings from this research:
40% of online Americans have gone online for data about the business of gov-ernmentRecently, many government agencies have begun making data such as agency spending, visitor logs or political donations available to citizens as a way to encourage openness and transparency in government. Indeed, Americans appear to have a fairly healthy appetite for such information, as 40% of internet users took at least one of the following actions in the twelve months preceding our survey:
• 23% of online adults looked online to see how money from the recent stimulus package was being spent
• 22% downloaded or read the text of legislation
• 16% visited a site that provides access to government data, such as data.gov, recovery.gov or usas-pending.gov
• 14% looked for information on who contributes to the campaigns of their elected officials
At least when it comes to the federal government, these government data users tend to have more posi-tive attitudes towards government openness and accountability. However, political ideology and partisan affiliations tend to outweigh this effect. Specifically, Democrats (and Democratic-leaning independents) tend to have more positive attitudes towards the federal government’s openness compared with two years ago if they go online for government data. On the other hand, Republican voters tend to cast a skeptical eye towards government openness whether they get this type of data online or not.
More information about government data users can be found in Part 4.
Use of government services and information online is most common among Americans with high incomes and education levelsWhile many Americans interact with government using online channels, this engagement is not evenly distributed across the online population—particularly when it comes to income and education. High-in-come and well-educated internet users are much more likely than those with lower levels of income and education to interact with government using many of the online channels we evaluated in our survey.

page 4
$50,000 or more/yearLess than $50,000/year
Some college, college gradsHigh school grad or less
Get info or complete transac-
tions on gov’twebsite(s)
Use tools like blogs, email, texts,
or SNS to get gov't info
Participate in online debate
about gov’t policies/issues
Go online for data about gov’t
activities
Get info or complete transac-
tions on gov’twebsite(s)
Use tools like blogs, email, texts,
or SNS to get gov't info
Participate in online debate
about gov’t policies/issues
Go online for data about gov’t
activities
By in
com
eBy
edu
catio
n
76
91
24
39
1829 31
50
70
89
21
36
12
29 26
47
High-income and well-educated internet users are much more likely to use government services and information onlineThe % of internet users who have used the following online channels to interact with the government, by education and household income
Source: Pew Research Center's Internet & American Life Project, November 30-December 27, 2009 Tracking Survey. N=2,258 adults 18 and older. Margin of error for the total sample is +/-2%. For smaller subgroups, the margin of error may be larger. Please see the Methodology section for details.
page 5
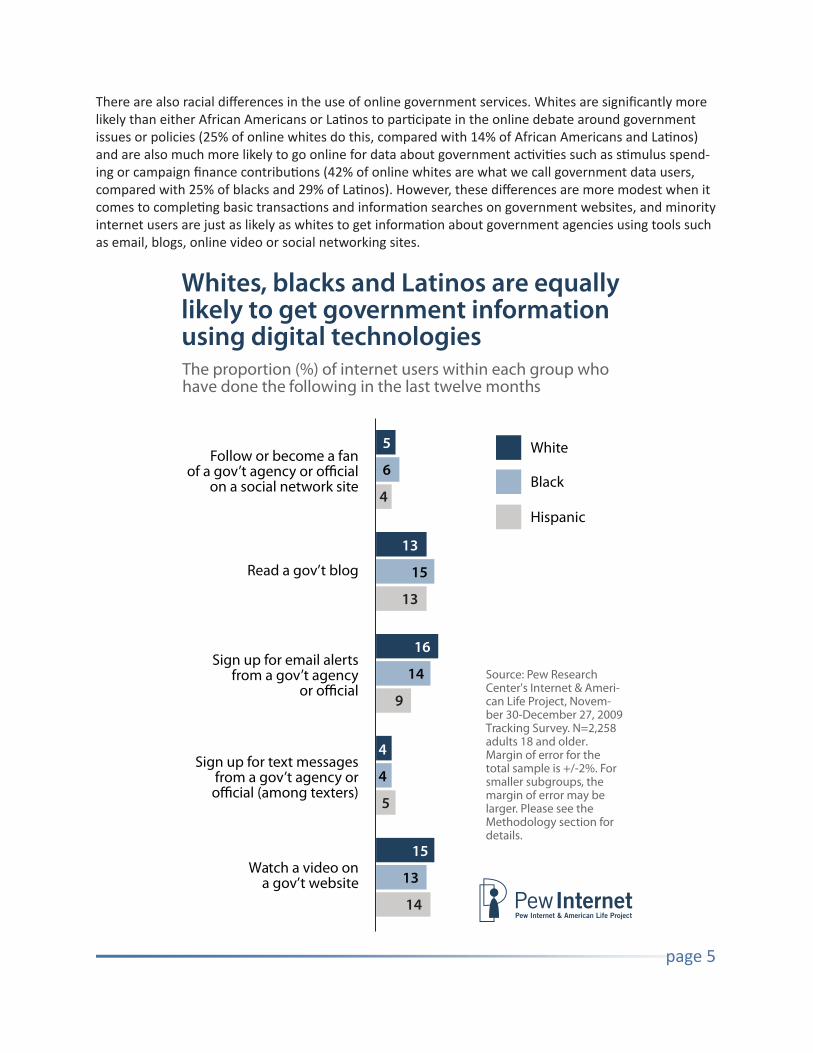
There are also racial differences in the use of online government services. Whites are significantly more likely than either African Americans or Latinos to participate in the online debate around government issues or policies (25% of online whites do this, compared with 14% of African Americans and Latinos) and are also much more likely to go online for data about government activities such as stimulus spend-ing or campaign finance contributions (42% of online whites are what we call government data users, compared with 25% of blacks and 29% of Latinos). However, these differences are more modest when it comes to completing basic transactions and information searches on government websites, and minority internet users are just as likely as whites to get information about government agencies using tools such as email, blogs, online video or social networking sites.
Whites, blacks and Latinos are equally likely to get government information using digital technologiesThe proportion (%) of internet users within each group who have done the following in the last twelve months
Watch a video ona gov’t website
Read a gov’t blog
Hispanic
Black
White 5
6
4
13
15
13
16
14
9
4
4
5
15
13
14
Source: Pew Research Center's Internet & Ameri-can Life Project, Novem-ber 30-December 27, 2009 Tracking Survey. N=2,258 adults 18 and older. Margin of error for the total sample is +/-2%. For smaller subgroups, the margin of error may be larger. Please see the Methodology section for details.

page 6
Government use of social media offers the potential to reach currently under-served populations, such as minority groups As noted above, African Americans and Latinos are just as likely as whites to use tools such as blogs, social networking sites and online video to keep up with the workings of government. They also have very different attitudes towards the use of social media tools by government agencies and officials. Minority Americans are significantly more likely than whites to agree strongly with the statement that government outreach using tools such as blogs, social networking sites or text messaging “helps people be more informed about what the government is doing” and “makes government agencies and officials more accessible”.
page 7
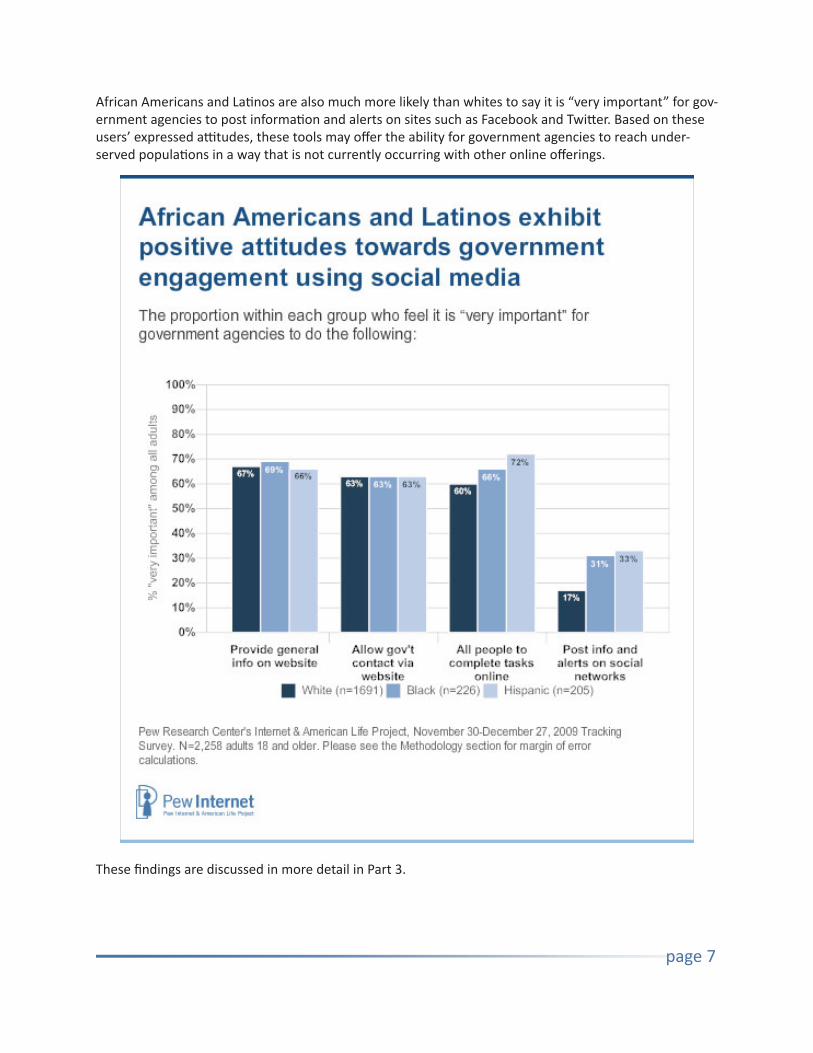
African Americans and Latinos are also much more likely than whites to say it is “very important” for gov-ernment agencies to post information and alerts on sites such as Facebook and Twitter. Based on these users’ expressed attitudes, these tools may offer the ability for government agencies to reach under-served populations in a way that is not currently occurring with other online offerings.
These findings are discussed in more detail in Part 3.

page 8
Online Americans typically rely on search engines to guide them to their destina-tion when seeking government information onlineAs we found in our previous studies on this topic, search engines are frequently the first option when Americans need to find government information or services online. Fully 44% of those who could re-member the last government website they visited found that site by conducting an online search. This is much higher than the percentage who visited a site they had used before (16% did this) or who relied on a friend or family member (14%), a government publication or notice (11%) or a general government website such as usa.gov (4%).
The majority of online government interactions lead to a successful outcomeGovernment website visitors are also generally successful in solving their problems once they reach their online destination. Half of government website visitors said that they accomplished everything they set out to do in their last government website interaction, and an additional 28% were able to do most of what they wanted to do. Just 5% said that their most recent government website interaction was com-pletely unsuccessful.
Americans tend to interact with government using a mix of online and offline methods. Internet users prefer contacting government online, but the telephone remains a key resource for government problem-solvingIn this survey, we found that 44% of all Americans had contacted a government agency or official in the preceding twelve months via the telephone, a letter or in-person contact, and that these traditional methods are frequently used as a supplement to online information-seeking behavior. More than half of online government users have contacted government using offline as well as online methods.
The continued relevance of offline channels can also be seen in the way Americans prefer to interact with government agencies. Among the population as a whole, Americans are somewhat divided on their preferred method of contact when they have a problem or question that requires them to get in touch with government. Being able to call someone on the telephone is the most preferred option overall (35% said this) followed by contact via email or a website (28%) and in-person visits (20%). However, internet users prefer online contact to the telephone—although not by a large margin (37% vs. 33%). The techno-logically proficient (those with a home broadband connection and mobile internet users) and those who engage in a wide range of online government interactions more strongly prefer online contact to other means.
About This SurveyThis report is based on the findings of a telephone survey conducted between November 30 and De-cember 27, 2009, among a sample of 2,258 adults, age 18 and older. Interviews were conducted in both English (n=2,197) and Spanish (n=61) and a total of 565 interviews were conducted using the respon-dent’s cell phone. For results based on the total sample, one can say with 95% confidence that the error attributable to sampling and other random effects is plus or minus 2.4 percentage points. For results based Internet users (n=1,676), the margin of sampling error is plus or minus 2.8 percentage points.

page 9
Part One: Introduction: How Americans use government websitesOn Barack Obama’s first full day in office, the administration released an executive order establishing an Open Government Directive. The order offered a vision for government organized around three prin-ciples:
• Government should be transparent, with information about agency operations and decisions avail-able to the public online.
• Government should be participatory, tapping the collective expertise of the American public in gov-ernment decision-making processes.
• Government should be collaborative, using technology to share and cooperate with other agencies, businesses and nonprofits, and the public at large.
Throughout 2009, a number of federal agencies produced innovative products in support of this strategy. Agencies such as NASA have used social media tools to promote interest in their missions among new demographics, and the State Department used text messaging and Twitter to send highlights of the pres-ident’s June 4, 2009 speech in Cairo to more than 200 countries in 13 different languages, posting many of the best responses on its website.1 The FCC’s broadband.gov site allowed citizens to track the develop-ment of the agency’s broadband plan online, to share key findings with their friends, and to interact with the agency in real time using tools such as Twitter. The recovery.gov site helped citizens track projects funded by the Recovery Act (the “stimulus bill”) and report potential instances of fraud or waste.
These federal projects represent some of the most visible manifestations of the new online govern-ment culture, but state and local agencies are also getting into the act. The District of Columbia’s Apps for Democracy--which offered a cash prize to the developer who could produce the most user-friendly applications based on government data—ultimately led to the development of 47 different applica-tions (with an estimated value to the city of $2.3 million) at a cost of just $50,000 in prize money. The City of Santa Cruz, California used collaborative online tools to enlist the help of citizens in closing a $9 million budget gap. Other politicians and agencies—from Newark Mayor Corey Booker to the Bay Area Rapid Transit Agency—have used social media tools to communicate and interact with constituents in real time. Ultimately, e-government advocates such as Tim O’Reilly envision an era of “government as a platform”, where citizens can use open government data to build their own tools and collaborate directly in the process of governing.2
The report that follows represents the Pew Internet & American Life Project’s attempt to quantify and contextualize these recent developments, and to evaluate the current state of online government. In this chapter, we examine the current state of online government transactions and information seeking on government websites. In Part Two, we examine the extent to which Americans are using tools such as blogs, social networking sites and text messaging to interact with government agencies and with the broader community around government policies. Part Three takes a look at Americans’ attitudes towards online government—specifically, the online offerings that resonate most profoundly with the Ameri-can public, and how they view attempts by government agencies to interact with citizens in new online spaces. Finally, in Part Four we examine the extent to which Americans are going online for the raw data
1 See http://news.cnet.com/Next-NASA-mission-Twitter-and-Facebook/2100-11397_3-6193493.html and http://the-lede.blogs.nytimes.com/2009/06/03/multiple-channels-for-obamas-cairo-speech/2 See http://techcrunch.com/2009/09/04/gov-20-its-all-about-the-platform/

page 10
of government, and whether this has any relevance to their attitudes towards government openness and accountability.
Most internet users have visited a government website to get information or complete a transaction in the preceding yearDespite the range of options available for interacting with government agencies, most citizen interac-tions with government involve obtaining information or completing essential tasks. In order to gain a more detailed understanding of how Americans interact with government online, we asked internet us-ers how many of eleven specific activities they had done in the preceding year on a local, state or federal government website. Their responses illustrate the range of government services used by the online population, as eight in ten had visited a government website for at least one of these reasons:
• 48% of internet users have looked for information about a public policy or issue online with their lo-cal, state or federal government. The college-educated, those under age 65 and those with relatively high household incomes are especially likely to look for this type of government information online.
• 46% have looked up what services a government agency provides. Young adults (those ages 18-29) and seniors (those 65 and older) are much less likely than 30-64 year olds to go online to look up government services, and this activity is also relatively uncommon among those earning less than $30,000 per year. Additionally, males and those with college experience are more likely than women and those with a high school education to look up government services online.
• 41% have downloaded government forms. This activity is particularly common among whites, 50-64 year olds, college graduates and those with high household incomes.
• 35% have researched official government documents or statistics. As with downloading government forms, this activity is most common among whites, college graduates and those with a household income of $75,000 or more per year.
• 33% have renewed a driver’s license or auto registration. A range of different online demographic groups participate in this activity, although those earning less than $30,000 per year and those with-out a high school degree are relatively unlikely to do so.
• 30% have gotten recreational or tourist information from a government agency. This activity is espe-cially common among parents, whites, college graduates and those with annual household incomes of $75,000 or more.
• 25% have gotten advice or information from a government agency about a health or safety issue. College graduates are particularly likely to look for this type of information on a government website.
• 23% have gotten information about or applied for government benefits. There are few major demo-graphic differences on this question.
• 19% have gotten information about how to apply for a government job. This type of information seeking is particularly common among African-Americans, the college-educated and those younger than 65.
• 15% have paid a fine, such as a parking ticket. Young adults, African-Americans and Latinos are espe-cially likely to have done this in the last year.
• 11% have applied for a recreational license, such as a fishing or hunting license. Men, whites and those under age 65 are particularly likely to go online for a recreational license.
Fully 82% of internet users took at least one of these actions online in the preceding year—throughout this report, we refer to these individuals as online government users. Most internet users take part in a relatively wide range of activities on government websites. Nearly seven in ten internet users (69%)

page 11
did more than one of these activities online, and the typical online government user took part in four of these activities in the preceding twelve months.
We previously asked a subset of these questions in 2001 and 2003, and while participation in some of these activities has grown over that time, others have not changed appreciably. Our 2001 survey was a callback survey of individuals who had interacted with government online in the past year, so those figures are not directly comparable to this particular survey. However, even accounting for those meth-odological differences it is clear that many more Americans are now completing simple transactions with government than was the case in 2001. At that time, just 2% of online government users had paid a government fine online—now, 15% of all internet users have done so. Similarly, 4% of online government users had applied for a recreational license online in 2001, a figure that has now grown to 11% of all internet users. Renewing driver’s licenses and auto registrations has also become much more common—from 12% of online government users in 2001 to one-third of all internet users today.
As these transactional interactions with government have become more common over the years, other types of online government activities are no more or less common than they were in the early part of this decade. The proportion of internet users who go online to get health or safety information from a government agency, get recreational or tourist information, research government documents or statis-tics, or get information about government benefits have not changed significantly since the last time we asked about these activities in 2003. With that said, while the incidence of these activities within the online population has not grown appreciably over the last six years, the growth of the size of the online population (from roughly six in ten adults to three-quarters of all adults now) means that these activities are now more common within the entire US population (taking both internet users and non-users into account) than they were in 2003.
Usage of government websites to get information or complete transactions is relatively common among internet users in all major demographic groups, although it is especially prevalent among those who have attended college, as well as those with a household income of $50,000 or more per year. Addition-ally, African Americans are slightly less likely to be online government users than whites. Those with a high-speed home internet connection as well as those who go online wirelessly are also more likely than average to use online government services. Fully 85% of home broadband and mobile internet users have accessed information or completed a transaction on a government website in the last year, com-pared with 68% of home dial-up users and 75% of stationary internet users.

page 12

page 13
Online Americans prefer to contact government using digital means, but the telephone remains popular among the population as a wholeAs we found in our last survey of e-government in August 2003, telephone contact is the overall most preferred contact method when people have a problem, question or task involving the government. Currently, 35% of Americans say they prefer using the telephone in these circumstances, a figure that is relatively unchanged from the 38% who said so in 2003. Similarly, online contact (either sending an email or visiting a website) is the preferred method of contact of 28% of Americans, a figure that is again un-changed from the 26% who cited sending an email or visiting a website five years ago. Among the popu-lation as a whole, when faced with a question, problem or task that requires contact with government:
• 35% prefer calling on the phone
• 28% prefer online contact (either visiting a website or sending an email)
• 20% prefer visiting in person
• 11% prefer writing a letter
Interestingly, although the total proportion of Americans who prefer online communication when con-tacting government has remained unchanged since our last government survey, in that time the relative popularity of sending an email and visiting a website has reversed. In 2003, 17% of respondents said they preferred to visit a website and 9% preferred sending an email; in our current survey, those who prefer email contact rose to 18% and those who prefer visiting a website fell to 10%.
Although the telephone is the preferred means of contact among the population as a whole, a focus on how internet users prefer to interact with government yields much different results. When we examine only internet users and exclude non-users, online contact is the most preferred mode when attempting to reach government, just ahead of calling on the phone. A total of 37% of internet users prefer using online means when trying to contact government, compared with 33% who prefer using the telephone, 17% who prefer to visit in person and 8% who prefer writing a letter.
Broadband and wireless internet users are largely responsible for these differences between internet users and non-users. Two in five home broadband users (39%) prefer online contact when trying to reach government, compared with 23% of home dial-up users. Similarly, 40% of those who access the mobile web prefer online contact, a figure that is slightly higher than the 30% of non-mobile internet users who do so. Online contact does not replace any particular method of offline contact—compared to the population as a whole, internet users (as well as broadband and mobile users more specifically) are slightly less likely to prefer all forms of offline contact relative to non-users. Even so, it is notable that the telephone remains relatively popular even among the technologically proficient, as one-third of home broadband (32%) and wireless internet users (32%) say that the telephone is their favorite means of contact when they need to get in touch with government.
Americans mention a wide range of entities when asked where they went in their most recent visit to a government websiteIn addition to asking respondents about their online government activities in the preceding twelve months, we also asked all internet users whether or not they could remember the last government website they visited, regardless of when that interaction occurred. Roughly two-thirds of internet users (64%) and three-quarters of online government users (73%) could indeed recall the last site they vis-ited, and we asked these individuals to tell us which site it was that they went to. Their responses were far-ranging, and provide an interesting insight into the spectrum of government agencies and specific
page 14
government-related tasks in which Americans take part. Among respondents who could remember the last government website they visited:
• One-third (32%) said that their most recent government website interaction was with a specific federal agency. Within this group, the two most common mentions were the website for the Social Security Administration (cited by 21% of those whose last visit was to a federal agency website) and the website of the IRS (15% of federal agency visitors mentioned going to the IRS for information about their federal taxes). Other mentions included immigration/naturalization and customs (6%); the FBI, CIA or Department of Homeland Security (5%); the CDC or NIH (4%); and the Veteran’s Ad-ministration (4%).
• One in five (18%) said that they last visited a state government agency website. Among these re-spondents, state government portal sites (such as Michigan.gov or MyFlorida.com) were the most common destination, cited by 36% of state government visitors. Other common destinations includ-ed websites for the state tax office or department of revenue (9%), state employment commission or workforce development department (8%), and state departments of transportation (6%), natural resources (5%) and health and human services (5%).
• One in ten (11%) said that their last online government destination was a local government site. Most of these respondents were visiting the main portal website for their city (39%) or county (30%) government.
• One quarter (27%) said that they last visited a government website to accomplish a specific task. The most commonly mentioned task in this category was related to a driver’s license or auto registration, which was cited by 32% of such respondents. Other common themes included information about recreational or tourist information (13%), unemployment or disability insurance (11%) and infor-mation about government jobs (8%). We included these activities in their own separate category because the level of government was often indeterminate in the responses supplied (for instance, a “government jobs site” might be federal, state or local in nature) and to distinguish those who men-tioned specific information or task-oriented needs from those who mentioned general government agencies.
• An additional 7% said that they went to the website of an elected official such as Barack Obama, a US Congressperson, a state representative or the governor of their state.
The remaining 5% of responses were those that we were unable to categorize under any of the labels above. A small number of these responses were clearly not government websites, while others were simply too vague to classify into a meaningful category.
Visitors to government websites rely heavily on search engines to guide them to their destinationSearch engines are the most common entry point for government website interactions. Among those who could recall the government website they visited most recently, 44% used a general search engine to figure out where they needed to go. This reliance on search is similar to what we found in our 2003 e-government survey. Using a slightly different question wording, we found that 37% of those whose last government contact involved visiting a web site arrived at that site via a search engine query.3
3 Different respondents got this question in 2003 and 2009. In 2003, we asked this question of respondents whose last government contact involved a website; in 2009, this question was asked of internet users who could recall the last government website they visited.

page 15
Other methods for finding gov-ernment websites made an ap-pearance in our survey, although none were nearly as common as search. Again among those who recalled the last time they visited a government website:
• 16% went to a site they had used before
• 14% found out about the site from a friend, family member or advertisement
• 11% went to a site listed in a government publication or notice
• 4% found the site through a general government website such as usa.gov
• 9% found the site some other way
Search engines are the most common starting point for ob-taining online government infor-mation among all major demo-graphic groups, although there is some minor variation based on income and age. Those with an annual household income of less than $30,000, for example, are more likely to rely on recom-mendations from friends, fam-ily members or advertisements while those at higher levels of in-come are more likely to say they went to a site they had visited before. Additionally, those ages 18-29 are significantly less likely than those in other age groups to go to a site listed in a government publication or notice. Otherwise, there are few differences on this question relating to age, educational attainment, gender or race.
Government web users are largely successful in accomplishing what they set out to do onlineDespite the wide range of sites that Americans visit as they seek out government information and ser-vices, government website users are generally successful in achieving most or all of what they set out to do online. We asked respondents who could remember the government website they visited last,
Search engines are the most common entry point forgovernment website interactionsHow government website users arrived at the most recent government website they visited
(based on internet users who recall the last govern-ment website they visited)
Source: Pew Research Center's Internet & American Life Project, November 30-December 27, 2009 Track-ing Survey. N=2,258 adults 18 and older. Margin of error for the total sample is +/-2%. For smaller subgroups, the margin of error may be larger. Please see the Methodology section for details.
Some other way
Gov't website like usa.gov
Gov't publication/notice
Site you'd used before
Friend, family member,or advertisement
Search engine
44%
16%
14%
11%
4%11%

page 16
whether or not they were successful in achieving what they set out to do when they visited the website. Half (51%) said that they accomplished everything they set out to do, while an additional 28% said they accomplished most of what they were trying to do. A total of one in five said that they accomplished either just some (16% said this) or none (5%) of what they wanted to do.
Everything
Most of it
Some of it
None of it
Americans generally accomplish most or all of what they want to do on government websites
How much of what you were trying to do on a government website did you succeed in doing?
(based on internet users who recall the last government website they visited)
Source: Pew Research Center's Internet & American Life Project, November 30-December 27, 2009 Track-ing Survey. N=2,258 adults 18 and older. Margin of error for the total sample is +/-2%. For smaller subgroups, the margin of error may be larger. Please see the Methodology section for details.
51%
28%
16%
5%
Overall, there is surprisingly little demographic variation when it comes to whether or not someone is successful in accomplishing their goals on a government website. Technology ownership also plays a
page 17
minimal role—there are no differences on this question between broadband and dialup owners, and wireless internet users are only slightly more likely to find success on government websites than are stationary internet users.
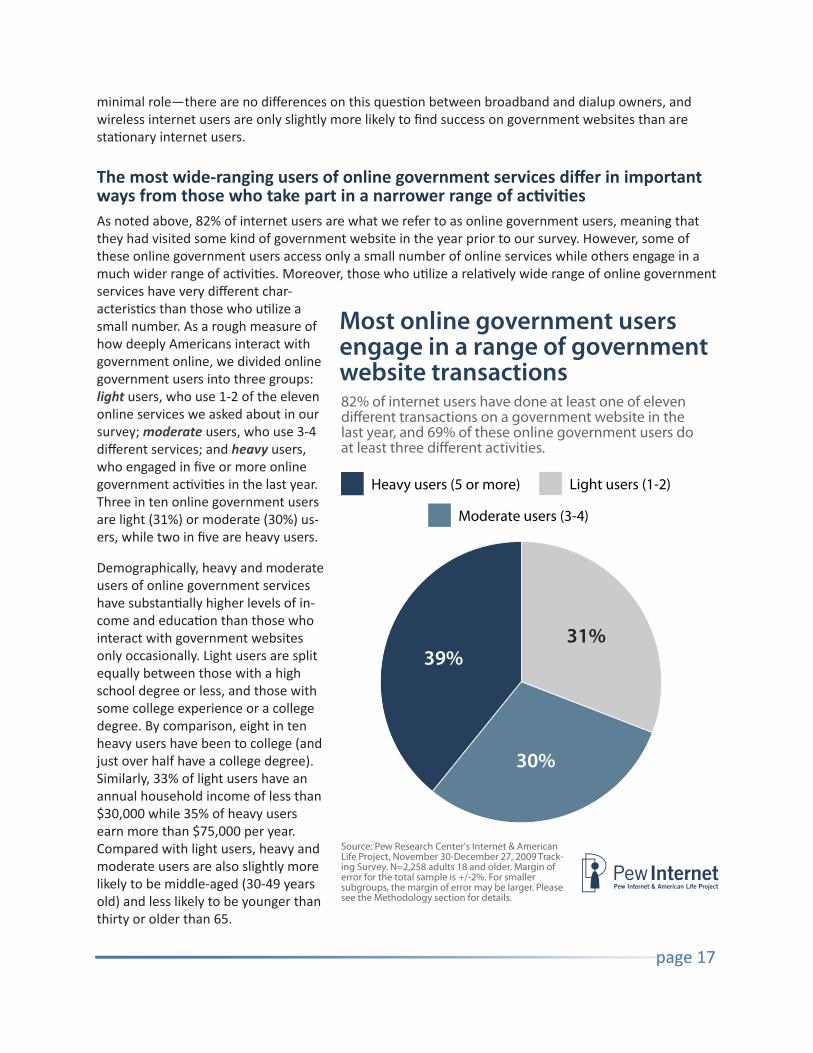
The most wide-ranging users of online government services differ in important ways from those who take part in a narrower range of activitiesAs noted above, 82% of internet users are what we refer to as online government users, meaning that they had visited some kind of government website in the year prior to our survey. However, some of these online government users access only a small number of online services while others engage in a much wider range of activities. Moreover, those who utilize a relatively wide range of online government services have very different char-acteristics than those who utilize a small number. As a rough measure of how deeply Americans interact with government online, we divided online government users into three groups: light users, who use 1-2 of the eleven online services we asked about in our survey; moderate users, who use 3-4 different services; and heavy users, who engaged in five or more online government activities in the last year. Three in ten online government users are light (31%) or moderate (30%) us-ers, while two in five are heavy users.
Demographically, heavy and moderate users of online government services have substantially higher levels of in-come and education than those who interact with government websites only occasionally. Light users are split equally between those with a high school degree or less, and those with some college experience or a college degree. By comparison, eight in ten heavy users have been to college (and just over half have a college degree). Similarly, 33% of light users have an annual household income of less than $30,000 while 35% of heavy users earn more than $75,000 per year. Compared with light users, heavy and moderate users are also slightly more likely to be middle-aged (30-49 years old) and less likely to be younger than thirty or older than 65.
Most online government users engage in a range of government website transactions
Source: Pew Research Center's Internet & American Life Project, November 30-December 27, 2009 Track-ing Survey. N=2,258 adults 18 and older. Margin of error for the total sample is +/-2%. For smaller subgroups, the margin of error may be larger. Please see the Methodology section for details.
Heavy users (5 or more)
Moderate users (3-4)
Light users (1-2)
39%
30%
31%

page 18

page 19
Not surprisingly, the most intense online government users also tend to be fairly technologically ad-vanced. Among heavy online government users (those who did five or more activities in the last year) nine in ten (91%) have a home broadband connection, eight in ten (78%) connect to the mobile inter-net, and 90% get political news online (with 43% doing so on a typical day). Compared with light and moderate online government users they report somewhat higher levels of trust in government, and are more likely than light or moderate users to deal primarily with the federal government rather than local government agencies.

page 20
44% of all adults have had an offline interaction with government in the last year, and Americans frequently use multiple channels to access government ser-vices and informationWhile the primary purpose of this survey was to measure online interactions with government, we also asked a series of questions dealing with more traditional offline forms of government engagement as well. In the twelve months preceding our survey, 44% of all Americans contacted their local, state or fed-eral government via offline means. Roughly one in three (29%) called a government office or agency on the phone, one-quarter (24%) visited an office or agency in person and 17% wrote a letter to a govern-ment office, agency or official.4 Since we last asked about offline government contact in August 2003, the proportion of Americans who contact government via telephone or in-person contact has risen by seven and six percentage points respectively, while the proportion of Americans who contact government via letter is comparable to what we found in 2003. In total, the proportion of Americans who contacted any level of government via letter, telephone or in-person visits in the preced-ing twelve months rose five percentage points, from 39% of all adults in 2003 to 44% of all adults in 2009.
Demographically, contact with government via offline means is most common among whites, those with higher levels of income and education, and those between the ages of 30 and 64. Minority groups, young adults, seniors, those who have not attended college and those with household incomes under $30,000 per year are much less likely to have been in contact with government in the last year using offline channels. Gen-erally speaking, those who contact government using offline means are demo-graphically similar to online
4 It is important to note that our questions about online and offline interactions with government were asked using very different question wordings and are not directly comparable to each other. Our online government user definition is based on eleven specific transactions on government websites; our offline contact definition is based on a more general question about contacting government agencies for any reason using offline means.

page 21
government users. The primary difference involves age—online government users are younger, with a median age of 39 (those who contact government offline have a median age of 47).
Americans often use online as well as offline channels to access government services and information. Among all adults, one third (34%) had an online interaction on a government website and also contacted a government agency or official using offline means (via telephone, letter or in person). One quarter (27%) had an online interaction only, while one in ten had only offline interactions. The remaining 29% said that they had not interacted with government using any of the different platforms we asked about in our survey. Looking only at those adults who had some sort of interaction with a government agency or official in the twelve months preceding our survey (in other words, excluding the 29% with no govern-ment interactions) nearly half (48%) had both an online and offline interaction with government in the preceding twelve months.
38%
48%
14%
No contact with gov't Online only
Adults with some gov’t contactAll adults
27%
34%10%
29%
Source: Pew Research Center's Internet & American Life Project, November 30-December 27, 2009 Tracking Survey. N=2,258 adults 18 and older. Margin of error for the total sample is +/-2%. For smaller subgroups, the margin of error may be larger. Please see Methodology section for details.
Looking specifically at online government users, it is clear that online contact is for these Americans a supplement to, rather than a replacement for, contact with government through more traditional means. The majority of online government users interact with government agencies using multiple channels—both online and offline. Compared with those who use the internet but have not gotten information or completed a transaction on a government website in the last year, or to those who do not go online at all, online government users are much more likely to have recently engaged in offline interactions

page 22
with government. Overall, more than half of online government users have also gotten in touch with a government office or agency in the last year using offline means—either in person, using the phone or writing a letter. This is well above the overall average for all adults (44% of whom have done this in the last year).
A similar story emerges when we analyze offline government contact by the light, moderate and heavy online government users we defined earlier in this report. Fully 69% of heavy online government users (those who engage in five or more types of online government transactions) contacted government via offline means in the last year, compared with 53% of moderate users (those who engage in 3-4 online government activities) and 42% of light users (those who engage in 1-2 different online activities).

page 23
The more government websites an individual visits, the more likely that person is to prefer contacting government agencies and officials using online tools. While 28% of light online government users prefer contacting government agencies or officials via email or visiting a website, that rises to 36% among mod-erate online government users and to more than half (54%) for heavy users.

page 24
Online (web+email)
Letter
In person
Phone
How online government users prefer to get in touch with government
The preferred means of contacting government by light, heavy and moderate online government users
(% of each group)
Source: Pew Research Center's Internet & American Life Project, November 30-December 27, 2009 Track-ing Survey. N=2,258 adults 18 and older. Margin of error for the total sample is +/-2%. For smaller subgroups, the margin of error may be larger. Please see the Methodology section for details.
Heavy users (n=540)
Moderate users (n=425)
Light users (n=410)
38 22 9 28
34 16 8 36
26 13 7 54
Online government users who visit a range of government websites are also much more likely than light or moderate users to use new tools such as email, blogs, social networking sites or online video to get information or keep in touch with government, and to take part in the online discussion around govern-ment issues or policies. These findings will be discussed in more detail in Parts Two and Three of this report.
Interestingly, heavy online government users are actually less likely than light or moderate users to have accomplished everything they wanted to do on their last visit to a government website. More than half (57%) of light online government users accomplished everything they were trying to do on their last visit to a government website, compared with 46% of heavy users. Heavy users were more likely to say that they accomplished “most” of what they were trying to do—34% said this, compared with 23% of light users. It is unclear why heavy users are less likely to accomplish all of what they need to do, although it is possible that these users are attempting to perform more complex tasks that require both online and offline contact—as noted above, the heaviest online users were especially likely to contact government offline as well.

page 25
Everything
Most
Some
None
The most intense online government users are not always the most successful
Source: Pew Research Center's Internet & American Life Project, November 30-December 27, 2009 Track-ing Survey. N=2,258 adults 18 and older. Margin of error for the total sample is +/-2%. For smaller subgroups, the margin of error may be larger. Please see the Methodology section for details.
Heavy users (n=540)
Moderate users (n=425)
Light users (n=410)
4 15 23 57
5 17 25 52
4 16 34 46

page 26
Part Two: Government engagement using social media and the government participatory classAs government interactions move beyond the website, citizens are increasingly being offered the chance to learn about and communicate with government agencies and officials in a wide range of online spaces such as blogs, social networking sites and mobile devices. These new tools also offer citizens the oppor-tunity to participate in the broader online debate surrounding government policies and issues, whether by communicating directly with government entities online or by organizing with others to push for changes in government policy.
Nearly one-third of online adults use digital tools other than websites to get information from government agencies or officialsIn examining the intersection of social media and engagement with government, we first asked about the use of these services for informational purposes—in other words, using online tools such as text messaging, online social networks or blogs to keep up-to-date with what government agencies or of-ficials are doing.
Many of these tools have only been adopted by government agencies relatively recently, and as a result fewer Americans get government information using these tools than by visiting more traditional govern-ment websites as discussed in Part One of this report. In the twelve months preceding this survey:
• 15% of internet users watched a video on a government website
• 15% of email users signed up to receive email alerts from a government agency or official
• 13% of internet users read the blog of a government agency or official
• 5% of internet users followed or became a fan of a government agency or official on a social net-working site (this represents 9% of social networking site profile owners)
• 4% of cell phone owners who use text messaging signed up to receive text messages from a govern-ment agency or official
• 2% of internet users followed a government agency or official on Twitter (this represents 7% of Twitter users)
In total, 31% of internet users did at least one of these six activities—throughout this report, we will refer to these individuals as government social media users. Among those who access government infor-mation in this way, a majority (56%) do so using one channel or technology, while 44% took part in two or more of the above activities.
Demographically, government social media users look fairly similar to the internet population as a whole, with the main differences centering on income and education. Government social media users are somewhat more affluent than the overall online population (36% have a household income of $75,000 or more per year, compared with 27% of the online population). They also have relatively high levels of education—nearly half of government media social media users (46%) have graduated from college, compared with around one third of all adult internet users (35%). From the standpoint of race, age and gender government social media users look just like internet users as a whole. Three-quarters of govern-ment social media users (76%) access the mobile internet and nearly nine in ten (88%) have a broadband connection at home.

page 27
Government social media users take advantage of a range of online and offline government platforms. Fully 95% of government social media users visited a government website in the preceding twelve months, with the typical government social media user visiting five such websites. Additionally, two-thirds (66%) contacted a government agency or official in person, by phone or by letter in the last year.
Analysis of specific activities – usage of digital tools for government information by different demographic groupsWith this profile of the typi-cal government social media user in mind, we can look individually at the different digital platforms that make up our definition of government social media users, with an eye towards which demographic cohorts are especially likely to use these different tools.
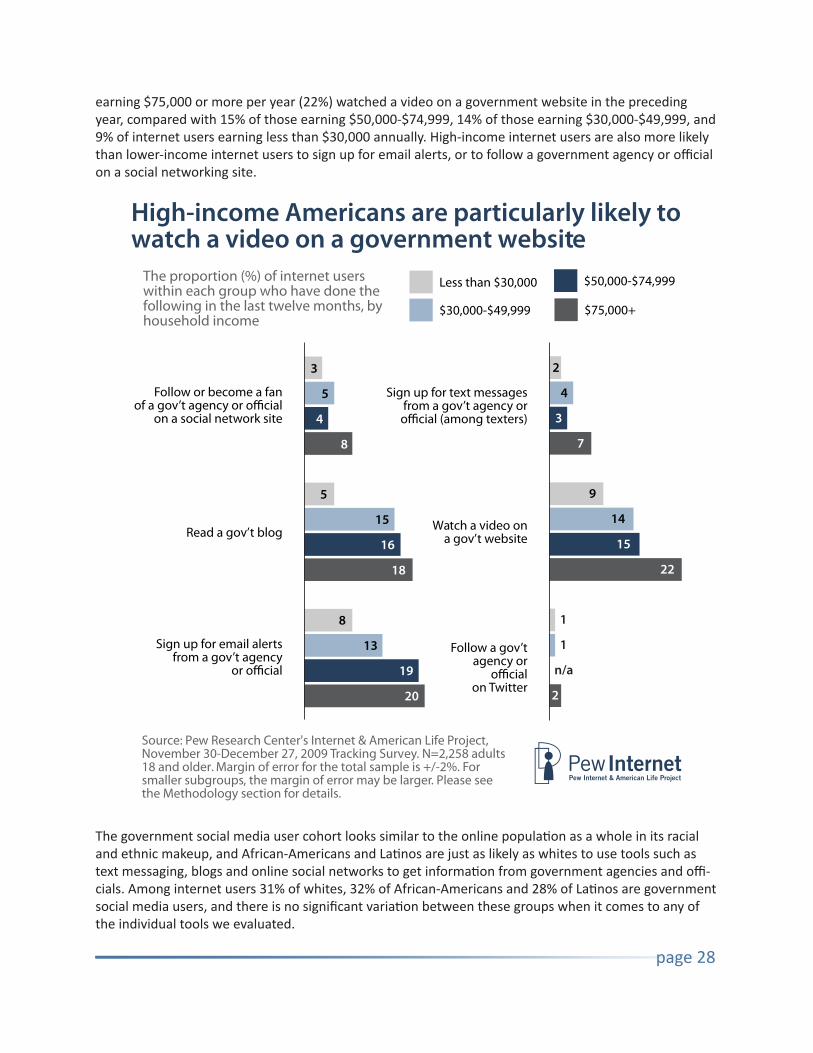
As noted above, government social media users tend to be more affluent and well-educat-ed than the internet population at large. Compared with those who have only attended high school or who have attended college but not graduated, those with a college diploma are significantly more likely to follow a government agency or official on a social networking site (14% of such profile own-ers have done so, representing 8% of online college graduates) and to sign up for email or text message alerts from an agency or official (22% of online college graduates have signed up for email alerts, while 8% of college graduates who use text messag-ing have signed up to receive government information in this way).
In terms of income, watch-ing videos on a government website is particularly popular with high-income internet us-ers. One in five internet users
College graduates lead the way in online engagement with governmentThe proportion (%) of internet users within each group who have done the following in the last twelve months
Watch a video ona gov’t website
Read a gov’t blog
College graduate
Some college
High school grad or less 2
5
8
9
14
18
7
14
22
3
2
8
12
15
18
0
1
3
Source: Pew Research Center's Internet & Ameri-can Life Project, November 30-December 27, 2009 Tracking Survey. N=2,258 adults 18 and older. Margin of error for the total sample is +/-2%. For smaller subgroups, the margin of error may be larger. Please see the Methodology section for details.
page 28
earning $75,000 or more per year (22%) watched a video on a government website in the preceding year, compared with 15% of those earning $50,000-$74,999, 14% of those earning $30,000-$49,999, and 9% of internet users earning less than $30,000 annually. High-income internet users are also more likely than lower-income internet users to sign up for email alerts, or to follow a government agency or official on a social networking site.
High-income Americans are particularly likely to watch a video on a government website
The proportion (%) of internet users within each group who have done the following in the last twelve months, by household income
Source: Pew Research Center's Internet & American Life Project, November 30-December 27, 2009 Tracking Survey. N=2,258 adults 18 and older. Margin of error for the total sample is +/-2%. For smaller subgroups, the margin of error may be larger. Please see the Methodology section for details.
Read a gov’t blog Watch a video ona gov’t website
3
5
4
8
5
15
16
18
8
13
19
20
2
4
3
7
9
14
15
22
1
1
n/a
2
$30,000-$49,999
Less than $30,000 $50,000-$74,999
$75,000+
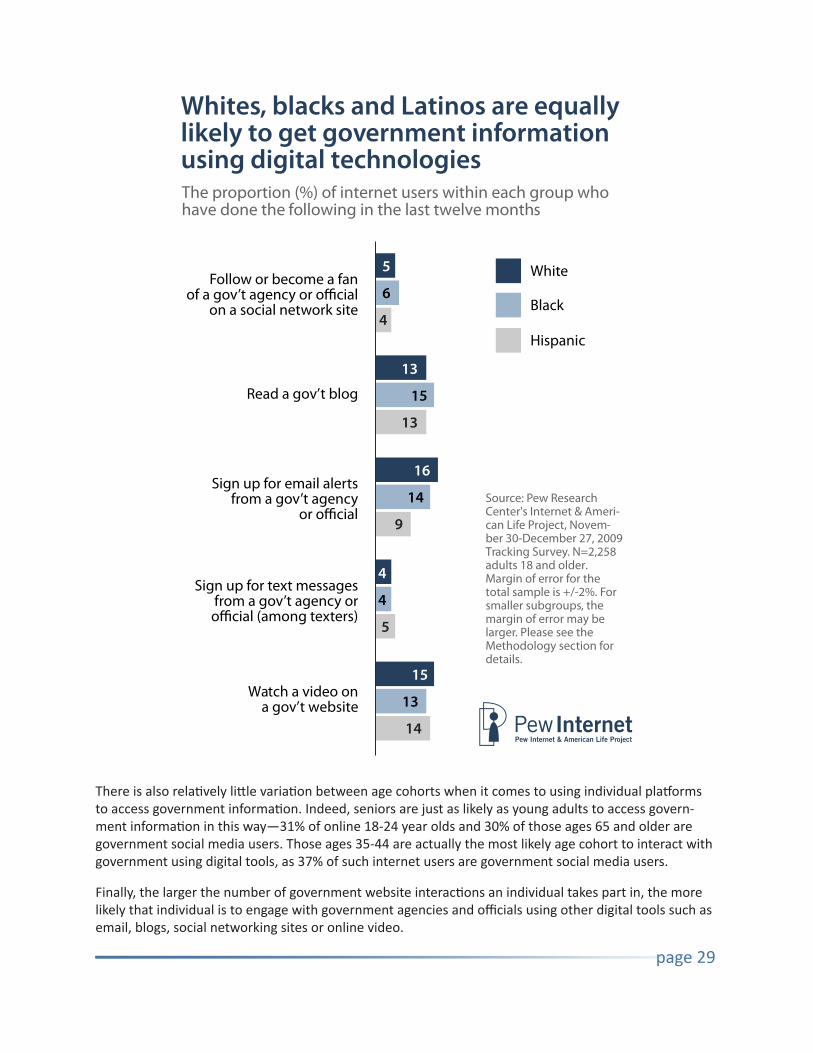
The government social media user cohort looks similar to the online population as a whole in its racial and ethnic makeup, and African-Americans and Latinos are just as likely as whites to use tools such as text messaging, blogs and online social networks to get information from government agencies and offi-cials. Among internet users 31% of whites, 32% of African-Americans and 28% of Latinos are government social media users, and there is no significant variation between these groups when it comes to any of the individual tools we evaluated.
page 29
Whites, blacks and Latinos are equally likely to get government information using digital technologiesThe proportion (%) of internet users within each group who have done the following in the last twelve months
Watch a video ona gov’t website
Read a gov’t blog
Hispanic
Black
White 5
6
4
13
15
13
16
14
9
4
4
5
15
13
14
Source: Pew Research Center's Internet & Ameri-can Life Project, Novem-ber 30-December 27, 2009 Tracking Survey. N=2,258 adults 18 and older. Margin of error for the total sample is +/-2%. For smaller subgroups, the margin of error may be larger. Please see the Methodology section for details.
There is also relatively little variation between age cohorts when it comes to using individual platforms to access government information. Indeed, seniors are just as likely as young adults to access govern-ment information in this way—31% of online 18-24 year olds and 30% of those ages 65 and older are government social media users. Those ages 35-44 are actually the most likely age cohort to interact with government using digital tools, as 37% of such internet users are government social media users.
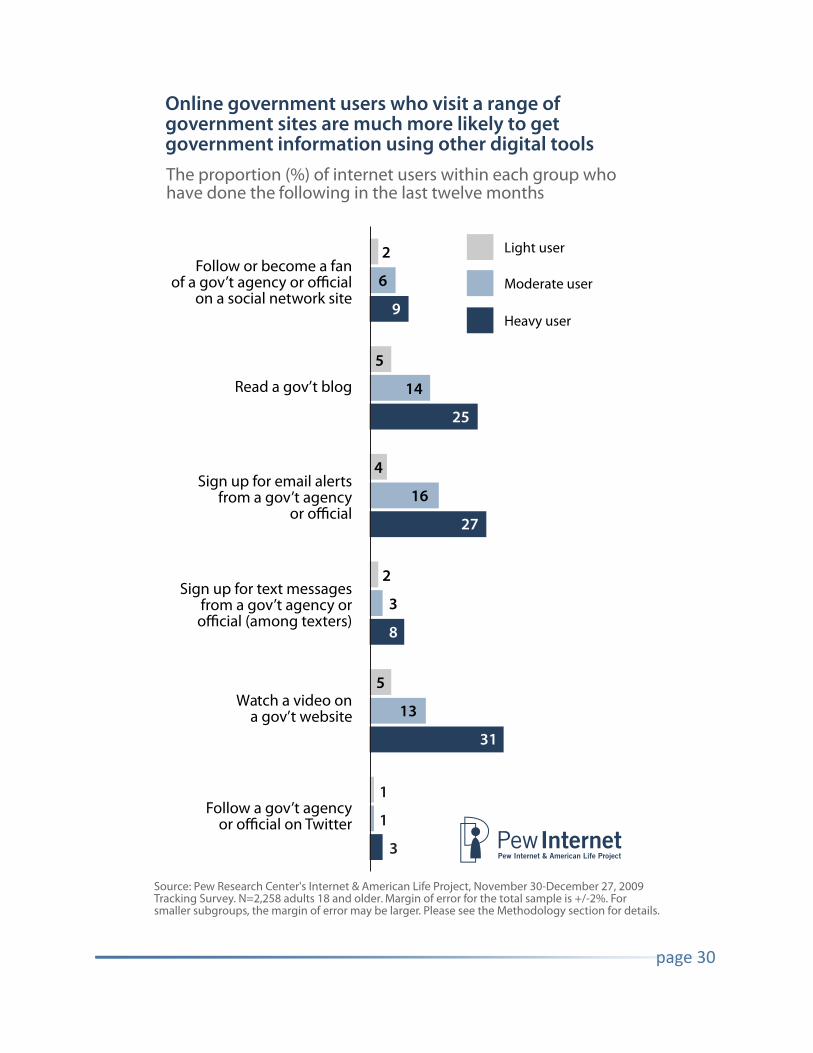
Finally, the larger the number of government website interactions an individual takes part in, the more likely that individual is to engage with government agencies and officials using other digital tools such as email, blogs, social networking sites or online video.
page 30
Online government users who visit a range of government sites are much more likely to get government information using other digital toolsThe proportion (%) of internet users within each group who have done the following in the last twelve months
Watch a video ona gov’t website
Read a gov’t blog
Heavy user
Moderate user
Light user 2
6
9
5
14
25
4
16
27
2
3
8
5
13
31
1
1
3
Source: Pew Research Center's Internet & American Life Project, November 30-December 27, 2009 Tracking Survey. N=2,258 adults 18 and older. Margin of error for the total sample is +/-2%. For smaller subgroups, the margin of error may be larger. Please see the Methodology section for details.

page 31
Nearly one quarter of internet users are members of the “government participa-tory class”Thus far we have discussed digital communication tools such as blogs, email and text messaging in the context of information seeking. In the remainder of this section, we will examine the extent to which Americans are going online to communicate directly with government agencies and participate in the online debate over government issues and policies.
Based on the results of this survey, individuals who follow government officials or agencies on social media platforms are at this time mostly engaged in information-seeking as opposed to interaction with the agencies they follow. For example, 11% of those who read the blog of a government agency or of-ficial have posted their own comments on that blog for others to read. Since 13% of internet users read government blogs, that works out to only 2% of all internet users who have commented on the blog of a government official or agency.
Posting comments is somewhat more common among those who follow government agencies or officials on an online social network: 20% of those who follow an agency or official on such a site have posted comments on the agency’s fan page or profile. However, because a relatively small number of people fol-low government agencies or officials on social networking sites, that works out to just 1% of all internet users who have done this. We also asked about government interaction using Twitter, but the number of Twitter users who follow a government agency or official is too small to report these findings.
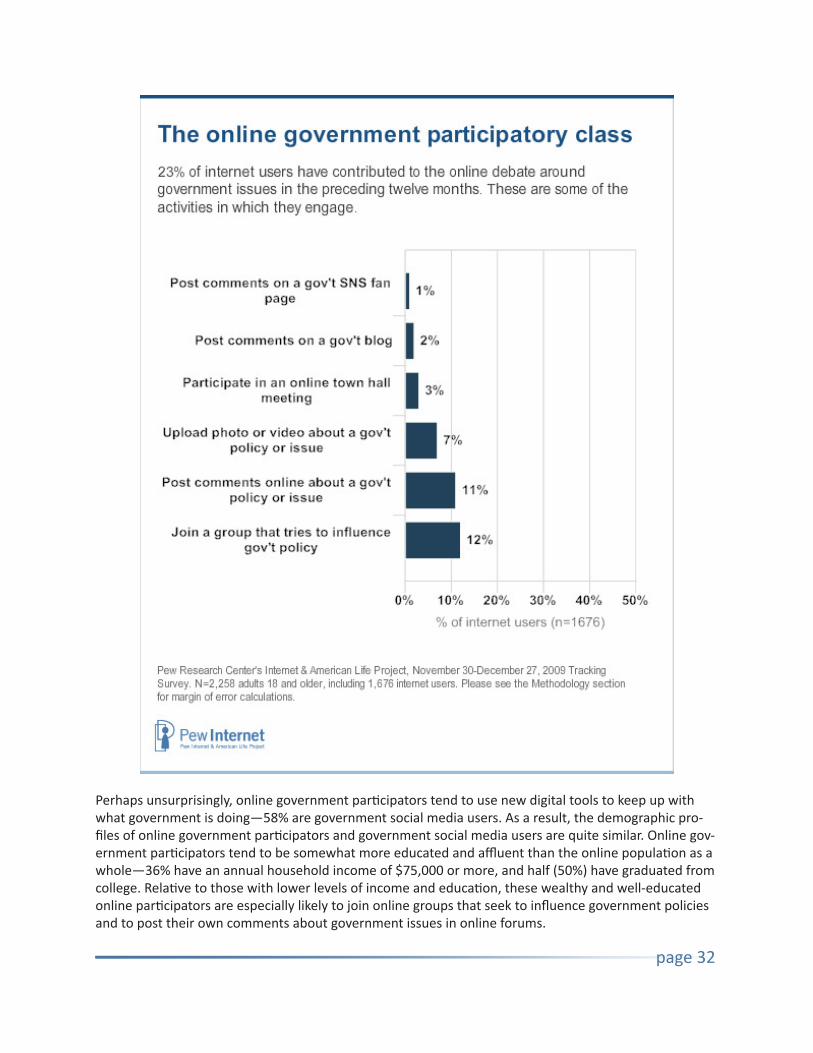
These results should not imply that Americans are not involved in online discussions around government issues or policies—these conversations are simply taking place within the broader online environment rather than on “official” government blogs or fan pages. In the twelve months preceding this survey, one in ten internet users (11%) posted comments, queries or other information related to government poli-cies online, while 7% of internet users uploaded videos or photos online related to a government policy or issue. An additional 12% of internet users joined a group online that tries to influence government policies, and 3% participated in an online town hall meeting.
Taking all of these activities together, nearly one quarter of internet users (23%) have posted comments or interacted with others online around government policies or public issues. Throughout this report, we will refer to these individuals as online government participators.
page 32
Perhaps unsurprisingly, online government participators tend to use new digital tools to keep up with what government is doing—58% are government social media users. As a result, the demographic pro-files of online government participators and government social media users are quite similar. Online gov-ernment participators tend to be somewhat more educated and affluent than the online population as a whole—36% have an annual household income of $75,000 or more, and half (50%) have graduated from college. Relative to those with lower levels of income and education, these wealthy and well-educated online participators are especially likely to join online groups that seek to influence government policies and to post their own comments about government issues in online forums.

page 33
Online government participators are also highly engaged in a range of other online government activi-ties. Nearly all government participators (98%) visited a government website in the preceding twelve months, and more than half (56%) visited five or more different government websites. On a typical day, 44% of online government participators look online for news or information about politics and 17% look for information on a local, state or federal government website on a daily basis. Despite (or perhaps because of) their involvement in the debate over government issues, they do not exhibit greater levels of trust in government institutions than other internet users.
Unlike government social media users—who mirror the overall internet population in terms of their racial makeup—the online government participator population is more heavily composed of whites. Whites make up 69% of internet users but 78% of online govern-ment participators; meanwhile, African Americans and Latinos to-gether comprise 23% of the online population but 14% of government participators.
This racial imbalance is clearly visible when we examine indi-vidually the different activities that comprise our definition of online government participators. Online whites are significantly more likely than Latinos to post their own comments online about a government policy or issue (12% vs. 4%), upload photos or videos relating to government policies (8% vs. 2%) and participate in an online townhall meeting (3% vs. 1%). They are also more likely than African Americans to join a group online with the goal of influencing government policies (14% of online whites have done so, compared with 5% of online blacks). For the other activities in our government participator definition (posting comments on a government blog or social networking site fan page) the sample size of respondents who take part in those activities is too small to provide meaning-ful comparisons beyond the total population level.
Whites are much more likely than blacks or Latinos to be online government participatorsThe proportion (%) of internet users within each group who have done the following in the last twelve months
Hispanic
Black
White 14
5
9
12
8
4
8
5
2
3
4
1
25
14
14
Source: Pew Research Center's Internet & American Life Project, November 30-December 27, 2009 Tracking Survey. N=2,258 adults 18 and older. Margin of error for the total sample is +/-2%. For smaller subgroups, the margin of error may be larger. Please see the Method-ology section for details.
Have doneany of these
Participate in anonline town hall
Upload photo orvideo about a gov't
policy or issue
Post commentsonline about a gov't
policy or issue
page 34
Part Three: Attitudes towards online government ser-vicesThe preceding analysis has been devoted to examining what Americans do online, and how they inter-act with government using digital tools. In this section, we examine their views towards different online government services—which ones they find most important, and how they view recent movements by government agencies towards citizen engagement on social media sites.
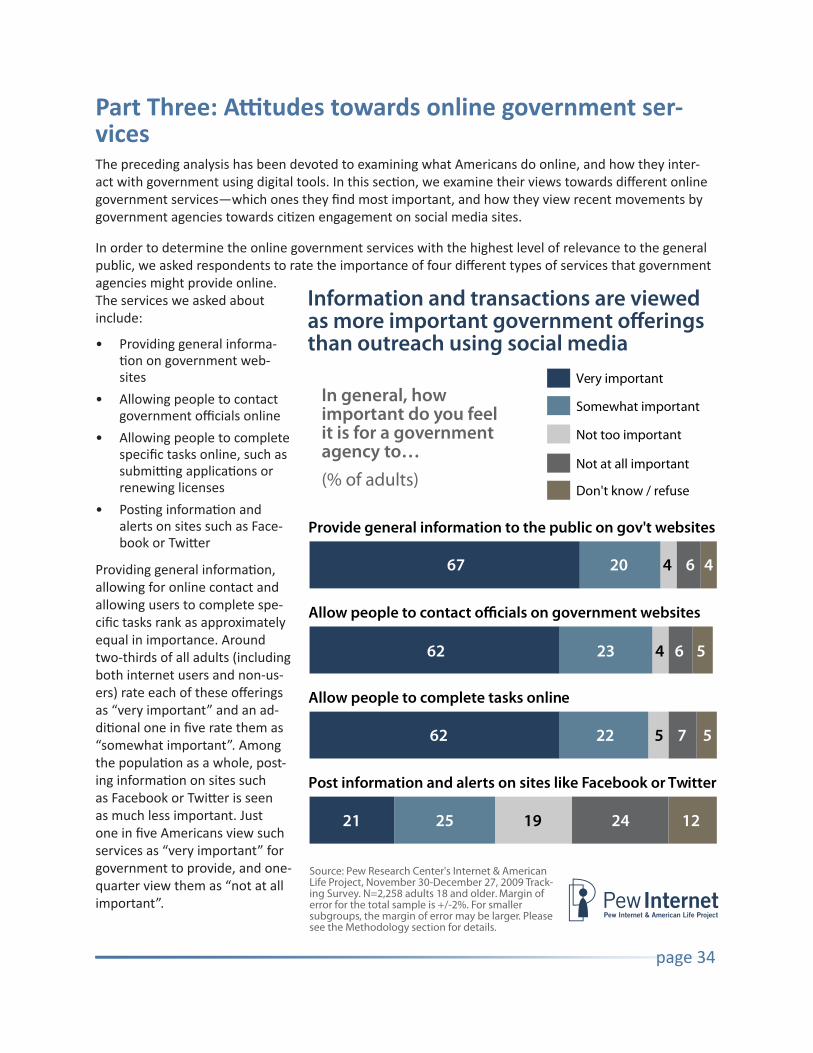
In order to determine the online government services with the highest level of relevance to the general public, we asked respondents to rate the importance of four different types of services that government agencies might provide online. The services we asked about include:
• Providing general informa-tion on government web-sites
• Allowing people to contact government officials online
• Allowing people to complete specific tasks online, such as submitting applications or renewing licenses
• Posting information and alerts on sites such as Face-book or Twitter
Providing general information, allowing for online contact and allowing users to complete spe-cific tasks rank as approximately equal in importance. Around two-thirds of all adults (including both internet users and non-us-ers) rate each of these offerings as “very important” and an ad-ditional one in five rate them as “somewhat important”. Among the population as a whole, post-ing information on sites such as Facebook or Twitter is seen as much less important. Just one in five Americans view such services as “very important” for government to provide, and one-quarter view them as “not at all important”.
Post information and alerts on sites like Facebook or Twitter
Allow people to complete tasks online
Provide general information to the public on gov't websites
Don't know / refuse
Not at all important
Not too important
Somewhat important
Very importantIn general, howimportant do you feelit is for a government agency to…(% of adults)
Source: Pew Research Center's Internet & American Life Project, November 30-December 27, 2009 Track-ing Survey. N=2,258 adults 18 and older. Margin of error for the total sample is +/-2%. For smaller subgroups, the margin of error may be larger. Please see the Methodology section for details.
67 20 4 6 4
62 23 4 6 5
62 22 5 7 5
21 25 19 24 12

page 35
Information- and task-oriented online government services are particularly relevant to those with high levels of income and education. Compared to Americans with low levels of income and education, those with some college experience or a college degree, as well as those earning more than $50,000 per year, are much more likely to say it is “very important” for government agencies to do things such as provide general information on its website, allow people to contact agency officials online and allow people to complete general tasks on its website. These results are in line with our findings from Part One that the wealthy and well-educated tend to use a wider range of information- and transaction-oriented govern-ment websites than those at the lower end of the socio-economic scale.
Allow peopleto completetasks online
Allow gov'tcontact via
website
Providegeneral infoon website
58
75
55
70
54
71
Allow peopleto completetasks online
Allow gov'tcontact via
website
Providegeneral infoon website
6376
5973
6071
$50,000 or more/yearLess than $50,000/year
Some college, college gradsHigh school grad or less
By in
com
eBy
edu
catio
n
The proportion (%) within each group who feel it is “very important” for government agencies to…
Source: Pew Research Center's Internet & American Life Project, November 30-December 27, 2009 Tracking Survey. N=2,258 adults 18 and older. Margin of error for the total sample is +/-2%. For smaller subgroups, the margin of error may be larger. Please see the Methodology section for details.

page 36
Men and women are equally likely to view these online government services as important, and there are few differences between whites, blacks and Hispanics on this question. There is some variation on this question based on age, as adults under the age of 50 tend to have much more positive views to-wards online government services than those ages 65 and up. Indeed, even within the online population seniors are the age group that is least likely to consider different online government services to be “very important.”
Government outreach on social media sites shows particular relevance for young adults and minority groupsAs noted above, posting government information and alerts on social media sites is generally seen as less important than providing basic information and services on government websites. One in five adults (21%) feel that it is “very important” for government to do this, while an additional 25% say it is “some-what important”. However, providing access to government information on these sites does seem to resonate with certain groups—in particular, ethnic minorities and those with low levels of income and education.

page 37
Minority and low-income voters feel that this form of government outreach is quite important com-pared with whites and those with higher incomes, a trend that was not apparent in our analysis of more traditional online government offerings. One-third (33%) of Latinos and 31% of African Americans feel that posting government information on social media sites is “very important”, while just 17% of whites agree. Indeed, fully one-quarter (26%) of whites feel that this type of outreach is “not at all important”, a figure that is significantly higher than that for blacks and Hispanics. In total, 60% of blacks and 53% of Hispanics feel that government outreach using social media is important, compared with 41% of whites.
Similarly, one in three Americans without a high school degree (30%) think it is “very important” to post government information on social media sites, significantly higher than the figure for high school gradu-ates (20%), those with some college experience (21%) or those with a college degree (18%). Again, this is quite different from what we found with more general information-oriented online government services, where the well-educated were much more likely to view these services as important.
Americans tend to view social media as a useful way to provide access to exist-ing informationIn addition to evaluating the importance of different online government offerings, we also used this sur-vey to measure people’s opinions of government engagement using social media sites such blogs, social networking sites or text messaging. To do this, we asked our survey respondents whether they agreed or disagreed with four separate statements about government agencies and officials allowing people to get information and submit feedback using new tools such as blogs, social networking sites, services like Twitter or text messaging.
The first two statements tested positive attitudes towards government outreach using social media, and our survey participants tended to agree relatively strongly with these propositions. Three-quarters (79%) agree with the statement that having the ability to follow and communicate online with government us-ing these tools “helps people be more informed about what the government is doing”, while 74% agree that it “makes government agencies and officials more accessible”. We asked this question of all respon-dents, and not surprisingly internet users tend to have more positive views of social media engagement than non-users: 78% of internet users agree that this type of engagement makes government more accessible (compared with 63% for non-users), while 82% of internet users and 68% of non-users agree that it helps people be more informed about what government is doing.
In addition to testing these positive impacts of government engagement using social media, we also asked our respondents to evaluate two less positive statements about government social media engage-ment—that this type of activity “is a waste of government money” and “just delivers the same govern-ment information in different ways”. Two in five Americans (41%) agree that such services are a waste of government money, although half (52%) disagree with this statement. By contrast, fully 72% of Ameri-cans feel that this type of engagement merely delivers the same government information in a new way.

page 38
Don't know / refuse
Strongly disagree
Somewhat disagree
Somewhat agree
Strongly agree
Is a waste of government money
Helps people be more informed about what gov't is doing
36 42 7 9 6
33 41 10 10 6
25 47 11 8 9
17 24 29 23 7
Americans have mixed attitudes towards government engagement using social media
Pew Research Center's Internet & American Life Project, November 30-December 27, 2009 Tracking Survey. N=2,258 adults 18 and older. Margin of error for the total sample is +/-2%. For smaller subgroups, the margin of error may be larger. Please see the Methodology section for details.
The proportion (%) of all adults who agree/disagree that having a way to follow and communicate online with government using tools such as blogs, social net-working sites, services like Twitter, or text messaging . . .
These attitudinal questions were asked of all adults, and it is instructive to look at how this type of out-reach is viewed by Americans who are already using new technologies to get government information (in other words, the government social media users we discussed in Part One). Perhaps not surprisingly, government social media users agree strongly with positive statements about this type of government engagement. Compared with those who go online but do not get government information using tools such as blogs or online social networks, government social media users are significantly more likely to agree that this type of engagement makes government agencies more accessible (46% “strongly agree” with this statement, compared with 31% of other internet users) and helps people be more informed about what the government is doing (45% vs. 33%). They are also more likely to disagree with the asser-tion that this type of activity is a waste of government money (33% of government social media users strongly disagree with this statement, compared with 21% of other internet users). On the other hand, having experience with these tools in a government context, these users are more likely than others to
page 39
put them in the “useful but not new” category—one third (33%) of government social media users also strongly agree that these tools just deliver the same information in different ways, compared with 24% of other internet users who feel the same way.
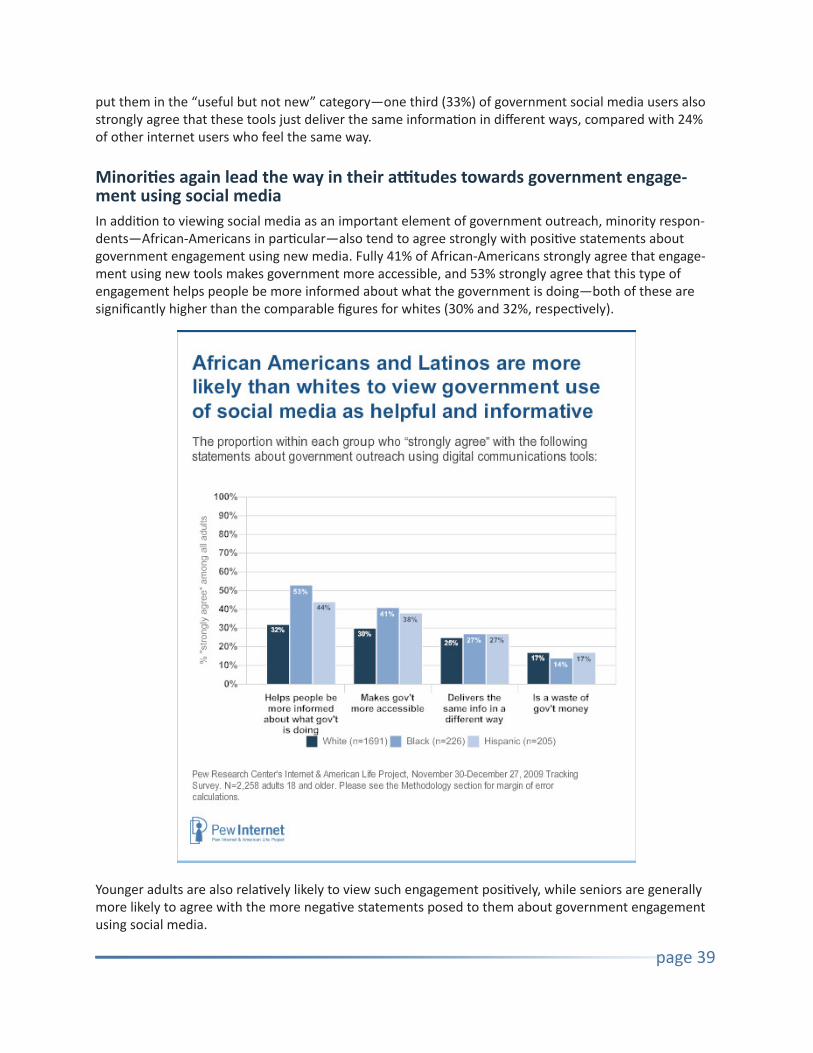
Minorities again lead the way in their attitudes towards government engage-ment using social mediaIn addition to viewing social media as an important element of government outreach, minority respon-dents—African-Americans in particular—also tend to agree strongly with positive statements about government engagement using new media. Fully 41% of African-Americans strongly agree that engage-ment using new tools makes government more accessible, and 53% strongly agree that this type of engagement helps people be more informed about what the government is doing—both of these are significantly higher than the comparable figures for whites (30% and 32%, respectively).
Younger adults are also relatively likely to view such engagement positively, while seniors are generally more likely to agree with the more negative statements posed to them about government engagement using social media.

page 40
Part Four: Online government data and informationFor many good government advocates, providing citizens with access to vast stores of previously-unavail-able government data represents the internet’s greatest promise for improving the relationship between the government and its constituents. To measure the extent to which citizens go online to access data on the business of government, we asked internet users whether they had visited any of four specific types of websites in the last year. Although these services do not necessarily comprise a comprehensive list of government data services, they cover a relatively broad spectrum of the activities considered important by advocates of transparency in government. The activities we asked about include:
• Looking online to see how money from the recent stimulus package is being spent
• Downloading or reading the text of any legislation
• Visiting a site that provides access to government data, such as data.gov, recovery.gov or usaspend-ing.gov
• Looking online for information on who contributes to the campaigns of their elected officials
In total, 40% of internet users have gone online in the past 12 months for one or more of these reasons. Throughout this section, we refer to these individuals as government data users. Looking into stimulus spending (23% of internet users have done this) and going online to read the text of legislation (22%) are the two most common of these activities.5 More than half of government data users (55%) have done two or more of these activities in the last year.
5 Note: This survey was fielded during the time period when the health care reform bill was being introduced and de-bated in Congress.

page 41
Much like the government participatory activities we discussed in the preceding section, these online government data services appeal especially to high income, highly educated white males. Nearly half (48%) of government data users have graduated from college, and more than a third (36%) earn $75,000 or more per year.
Government data users are also prolific users of various online technologies. Nine in ten (90%) have a high-speed home internet connection, three-quarters (74%) use the mobile web, 89% get political news online, 63% use social networking websites and 28% use Twitter or similar status update services. All these are significantly higher than for internet users who do not access government data online.
Interestingly, going online for data or information about government activities is not associated with greater or lesser levels of trust in government. Government data users are just as likely as internet users who do not use these services to say that they trust their federal or state government “always” or “most
page 42
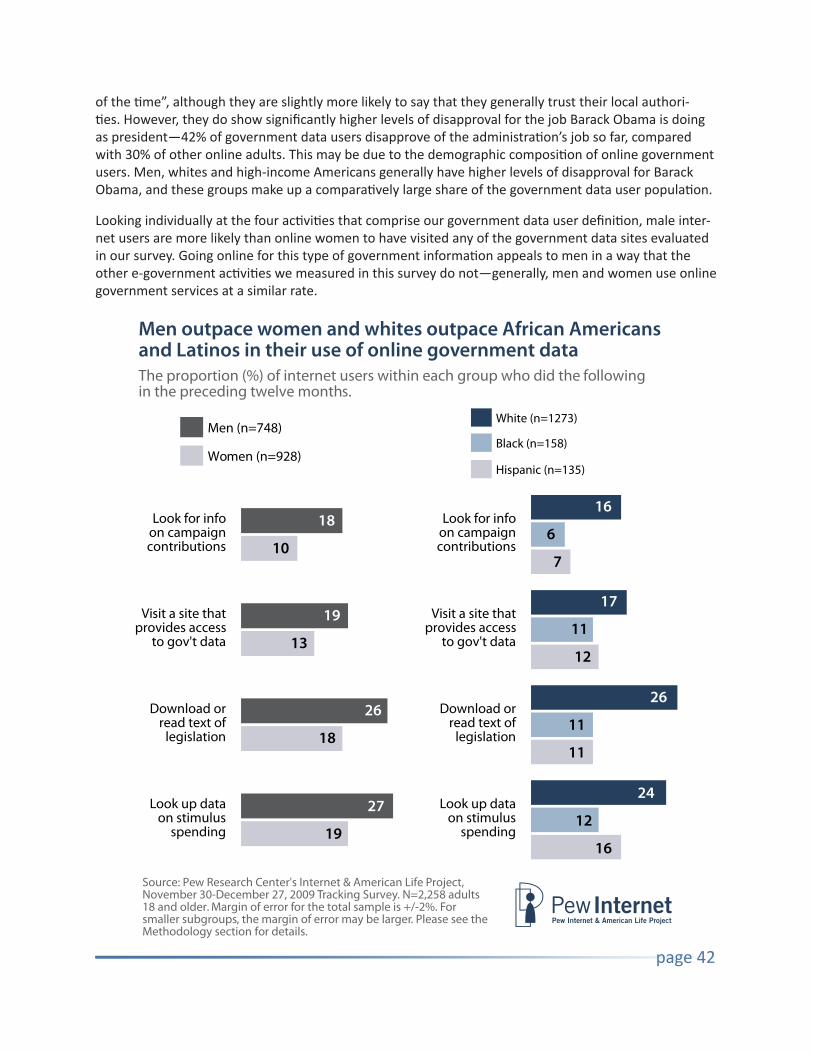
of the time”, although they are slightly more likely to say that they generally trust their local authori-ties. However, they do show significantly higher levels of disapproval for the job Barack Obama is doing as president—42% of government data users disapprove of the administration’s job so far, compared with 30% of other online adults. This may be due to the demographic composition of online government users. Men, whites and high-income Americans generally have higher levels of disapproval for Barack Obama, and these groups make up a comparatively large share of the government data user population.
Looking individually at the four activities that comprise our government data user definition, male inter-net users are more likely than online women to have visited any of the government data sites evaluated in our survey. Going online for this type of government information appeals to men in a way that the other e-government activities we measured in this survey do not—generally, men and women use online government services at a similar rate.
Men outpace women and whites outpace African Americans and Latinos in their use of online government dataThe proportion (%) of internet users within each group who did the following in the preceding twelve months.
Source: Pew Research Center's Internet & American Life Project, November 30-December 27, 2009 Tracking Survey. N=2,258 adults 18 and older. Margin of error for the total sample is +/-2%. For smaller subgroups, the margin of error may be larger. Please see the Methodology section for details.
Look up dataon stimulus
spending
Download orread text of
legislation
Visit a site thatprovides access
to gov't data
Look for infoon campaigncontributions
Look up dataon stimulus
spending
Download orread text of
legislation
Visit a site thatprovides access
to gov't data
Look for infoon campaigncontributions
Women (n=928)
Men (n=748)
Hispanic (n=135)
Black (n=158)
White (n=1273)
18
10
19
13
26
18
27
19
16
6
7
17
11
12
26
11
11
24
12
16

page 43
Among internet users, whites are also much more likely to have visited such websites in past twelve months compared with African-Americans or Latinos. The only exception is for sites such as data.gov that offer access to government data, for which there are no significant differences across racial boundaries.
Among internet users, the use of these services also varies somewhat by political ideology and party affiliation. Conservative Republicans and liberal Democrats are especially likely to go online to look up stimulus spending (29% of conservative Republicans and 28% of liberal Democrats have done this) and political contributions (24% and 20% respectively), while political independents (19%) and liberal Demo-crats (26%) are the groups that are most likely to go to sites such as data.gov that offer access to govern-ment data. Overall, liberal Democrats are most likely to access any type of government data online (54% of internet users in this group are government data users, compared with 43% of conservative Republi-cans and 41% of political independents).
Access to online government data is associated with positive attitudes towards the federal government’s openness and accountability, although this association depends heavily on party affiliation and political ideologyIn addition to asking internet users about their engage-ment with online services oriented around government data, we also asked all adults (both internet users and non-users) whether they feel that the federal government is now more or less open and accountable compared with two years ago.
In part, we asked this ques-tion to see whether govern-ment data users feel that the government is more open and accountable, and there is indeed some cor-relation between the use of these services and attitudes towards government open-ness. Two in five government data users (43%) say that the federal government is more open and accountable than it was two years ago, compared with 33% of internet users who are not government data users and 27% of those who do not go online.
Government data users
Online, not government data user
Not online
27 49 14 10
33 49 11 7
43 38 16 3
Don't know/refuse
Less open &accountable
Aboutthe same
More open &accountable
Use of government data is correlatedwith positive attitudes towards federal government opennessThe proportion (%) within each group who feel that the federal government is more or less open and accountable compared with two years ago.
Pew Research Center's Internet & American Life Project, November 30-December 27, 2009 Tracking Survey. N=2,258 adults 18 and older. Margin of error for the total sample is +/-2%. For smaller subgroups, the margin of error may be larger. Please see the Methodology section for details.

page 44
However, it is important to note that this association depends heavily on factors such as party identifi-cation and political ideology. Self-identified Democrats tend to have more positive views of the federal government’s openness and accountability if they also access government data online, while Republicans tend to have less positive views regardless of whether or not they are government data users. These as-sociations persist even when we control statistically for factors such as demographics, partisan ideology, technology ownership and usage of other online government offerings. The same relationship holds for independent voters who lean towards one party over another. Among Democratic-leaning independents, 59% of government data users feel that the federal government is more open and accountable com-pared with two years ago, compared with 45% of such voters who go online but do not use government data and 29% of Democratic-leaning independents who do not go online. Among Republican-leaning independents, 26% of government data users have positive views towards the federal government’s openness and accountability; this is little different from the 21% of such voters who go online but do not use government data services who feel the same way. Put simply, political concerns trump access to data when it comes to one’s attitudes towards government openness.
Methodology
This report is based on the findings of a daily tracking survey on Americans' use of the Internet. The results in this report are based on data from telephone interviews conducted by Princeton Survey Research Associates International between November 30 and December 27, 2009, among a sample of 2,258 adults, age 18 and older. Interviews were conducted in both English (n=2,197) and Spanish (n=61). Statistical results are weighted to correct known demographic discrepancies.
The margin of sampling error for the complete set of weighted data (n=2,258) is ±2 percentage points. Margins of error for subgroups may be larger than the margin of error for the total sample. For example, the findings for internet users are based on a subsample of 1,676 adults and have a margin of error of ±3 percentage points; the findings for online government users are based on a subsample of 1,375 adults and have a margin of error of ±3 percentage points. Sampling errors and statistical tests of significance in this study take into account the effect of weighting (described below).
A combination of landline and cellular random digit dial (RDD) samples was used to represent all adults in the continental United States who have access to either a landline or cellular telephone. Both samples were provided by Survey Sampling International, LLC (SSI) according to PSRAI specifications. Numbers for the landline sample were selected with probabilities in proportion to their share of listed telephone households from active blocks (area code + exchange + two‐digit block number) that contained three or more residential directory listings. The cellular sample was not list‐assisted, but was drawn through a systematic sampling from dedicated wireless 100‐blocks and shared service 100‐blocks with no directory‐listed landline numbers.
New sample was released daily and was kept in the field for at least five days. The sample was released in replicates, which are representative subsamples of the larger population. This ensures that complete call procedures were followed for the entire sample. At least 7 attempts were made to complete an interview at sampled telephone number. The calls were staggered over times of day and days of the week to maximize the chances of making contact with a potential respondent. Each number received at least one daytime call in an attempt to find someone available. For the landline sample, half of the time interviewers first asked to speak with the youngest adult male currently at home. If no male was at home at the time of the call, interviewers asked to speak with the youngest adult female. For the other half of the contacts interviewers first asked to speak with the youngest adult female currently at home. If no female was available, interviewers asked to speak with the youngest adult male at home. For the cellular sample, interviews were conducted with the person who answered the phone. Interviewers verified that the person was an adult and in a safe place before administering the survey. Cellular sample respondents were offered a post‐paid cash incentive for their participation. All interviews completed on any given day were considered to be the final sample for that day.
Non‐response in telephone interviews produces some known biases in survey‐derived estimates because participation tends to vary for different subgroups of the population, and these subgroups are likely to vary also on questions of substantive interest. In order to compensate for these known biases, the sample data are weighted in analysis. The demographic weighting parameters are derived from a special analysis of the most recently available Census Bureau’s March 2009 Annual Social and Economic Supplement. This analysis produces population parameters for the demographic characteristics of adults age 18 or older. These parameters are then compared with the sample characteristics to construct sample weights. The weights are derived using an iterative technique that simultaneously balances the distribution of all weighting parameters.

Effects of Sample Design on Statistical Inference Post‐data collection statistical adjustments require analysis procedures that reflect departures from simple random sampling. PSRAI calculates the effects of these design features so that an appropriate adjustment can be incorporated into tests of statistical significance when using these data. The so‐called “design effect” or deff represents the loss in statistical efficiency that results from systematic non‐response. The total sample design effect for this survey is 1.18. PSRAI calculates the composite design effect for a sample of size n, with each case having a weight, wi as:
In a wide range of situations, the adjusted standard error of a statistic should be calculated by multiplying the usual formula by the square root of the design effect (√deff ). Thus, the formula for computing the 95% confidence interval around a percentage is:
where p̂ is the sample estimate and n is the unweighted number of sample cases in the group being considered. The survey’s margin of error is the largest 95% confidence interval for any estimated proportion based on the total sample— the one around 50%. For example, the margin of error for the entire sample is ±3.8%. This means that in 95 out every 100 samples drawn using the same methodology, estimated proportions based on the entire sample will be no more than 3.8 percentage points away from their true values in the population. This margin of error takes into account the potential design effect of weighting. A multiplier of 1.2 (the square root of the typical design effect of the weight variable) is included in Pew Internet’s margin of error formula:
1.2*1.96*(SQRT(.5 * .5) / N)*100
It is important to remember that sampling fluctuations are only one possible source of error in a survey estimate. Other sources, such as respondent selection bias, questionnaire wording and reporting inaccuracy, may contribute additional error of greater or lesser magnitude.

Response Rate The disposition reports all of the sampled telephone numbers ever dialed from the original telephone number samples. The response rate estimates the fraction of all eligible respondents in the sample that were ultimately interviewed. At PSRAI it is calculated by taking the product of three component rates:1
Contact rate – the proportion of working numbers where a request for interview was made Cooperation rate – the proportion of contacted numbers where a consent for interview was at
least initially obtained, versus those refused Completion rate – the proportion of initially cooperating and eligible interviews that were
completed
Thus the response rate for the landline sample was 19.5 percent. The response rate for the cellular sample was 18.8 percent.
Table 1:Sample Disposition
Landline Cell
21990 8100 T Total Numbers Dialed
1263 183 OF Non‐residential 1068 6 OF Computer/Fax
10 0 OF Cell phone 9496 3132 OF Other not working 1130 140 UH Additional projected not working 9023 4639 Working numbers 41.0% 57.3% Working Rate
377 47 UH No Answer / Busy
1201 1101 UONC Voice Mail
40 8 UONC Other Non‐Contact 7405 3483 Contacted numbers 82.1% 75.1% Contact Rate
668 642 UOR Callback
4868 1940 UOR Refusal 1869 901 Cooperating numbers 25.2% 25.9% Cooperation Rate
66 27 IN1 Language Barrier 0 291 IN2 Child's cell phone
1803 583 Eligible numbers 96.5% 64.7% Eligibility Rate
110 18 R Break‐off
1693 565 I Completes
93.9% 96.9% Completion Rate 19.5% 18.8% Response Rate
1 PSRAI’s disposition codes and reporting are consistent with the American Association for Public Opinion Research standards.

December Tracking Survey 2009 Final Topline 1/4/10
Data for November 30 – December 27, 2009
Princeton Survey Research Associates International for the Pew Research Center’s Internet & American Life Project
Sample: n= 2,258 national adults, age 18 and older, including 565 cell phone interviews Interviewing dates: 11.30.09 – 12.27.09 Margin of error is plus or minus 2 percentage points for results based on Total [n=2,258] Margin of error is plus or minus 3 percentage points for results based on internet users [n=1,676]
Q1 Do you approve or disapprove of the way Barack Obama is handling his job as
president? [IF DON’T KNOW, ENTER AS DON’T KNOW. IF ”DEPENDS,” PROBE ONCE WITH: OVERALL do you approve or disapprove of the way Barack Obama is handling his job as president?] [IF STILL “DEPENDS,” ENTER AS DON’T KNOW]
CURRENT % 53 Approve 33 Disapprove 9 Don’t know 5 Refused
Q2 Now I’m going to ask you about various organizations and types of organizations.
How much of the time do you think you can trust [INSERT ITEM; RANDOMIZE] – just about always, most of the time, only some of the time or never?
JUST ABOUT
ALWAYS MOST OF THE TIME
SOME OF THE TIME NEVER
DON’T KNOW REFUSED
a. The federal government1 Current 6 25 50 16 3 1 November 2008 3 17 65 10 3 1 August 2003 7 33 56 n/a 4 -- February 2001 5 26 62 n/a 6 --
b. Your state government Current 6 29 48 14 2 1
c. Your local government Current 8 32 44 12 2 *
d. Large corporations Current 3 14 54 24 4 1
1 Trends were standalone questions with the following question wording: “How much of the time do you think you can trust the government in Washington to do what is right?” In Nov 2008, “Never” was a volunteered category. Prior to Nov. 2008, “Never” was not offered as either an explicit or volunteered category.

September 2009i 2 18 55 20 5 1
There are no questions Q3 thru Q5.

Q6a Do you use the internet, at least occasionally? Q6b Do you send or receive email, at least occasionally?2
USES INTERNET DOES NOT USE
INTERNET
Current 74 26 September 2009 77 23
April 2009ii 79 21 December 2008iii 74 26 November 2008iv 74 26
August 2008v 75 25 July 2008vi 77 23 May 2008vii 73 27
April 2008viii 73 27 January 2008ix 70 30
December 2007x 75 25 September 2007xi 73 27
February 2007xii 71 29 December 2006xiii 70 30 November 2006xiv 68 32
August 2006xv 70 30 April 2006xvi 73 27
February 2006xvii 73 27 December 2005xviii 66 34 September 2005xix 72 28
June 2005xx 68 32 February 2005xxi 67 33 January 2005xxii 66 34
Nov 23-30, 2004xxiii 59 41 November 2004xxiv 61 39
June 2004xxv 63 37 February 2004xxvi 63 37
November 2003xxvii 64 36 August 2003xxviii 63 37
June 2003xxix 62 38 May 2003xxx 63 37
March 3-11, 2003xxxi 62 38 February 2003xxxii 64 36
December 2002xxxiii 57 43 November 2002xxxiv 61 39
October 2002xxxv 59 41 September 2002xxxvi 61 39
July 2002xxxvii 59 41 March/May 2002xxxviii 58 42
January 2002xxxix 61 39 Q6a/b continued…
2 Prior to January 2005, question wording was “Do you ever go online to access the Internet or World Wide Web or to send and receive email?”
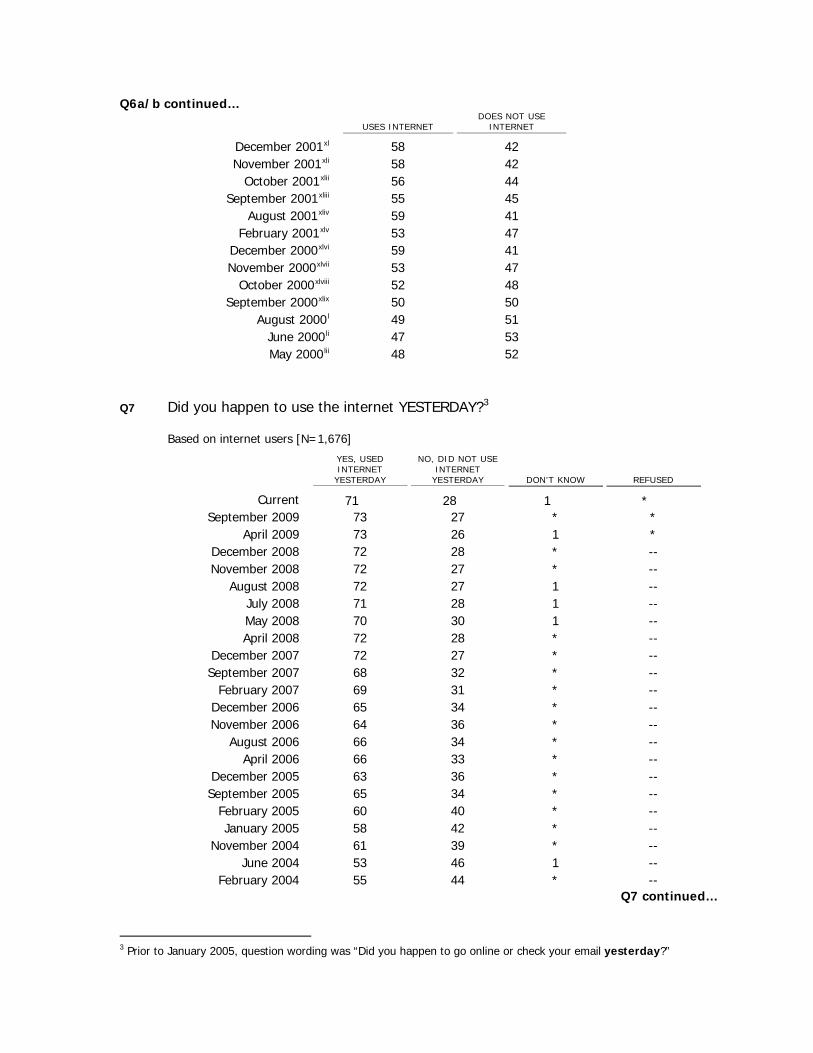
Q6a/b continued…
USES INTERNET DOES NOT USE
INTERNET
December 2001xl 58 42 November 2001xli 58 42
October 2001xlii 56 44 September 2001xliii 55 45
August 2001xliv 59 41 February 2001xlv 53 47
December 2000xlvi 59 41 November 2000xlvii 53 47
October 2000xlviii 52 48 September 2000xlix 50 50
August 2000l 49 51 June 2000li 47 53 May 2000lii 48 52
Q7 Did you happen to use the internet YESTERDAY?3
Based on internet users [N=1,676]
YES, USED INTERNET
YESTERDAY
NO, DID NOT USE INTERNET
YESTERDAY DON’T KNOW REFUSED
Current 71 28 1 * September 2009 73 27 * *
April 2009 73 26 1 * December 2008 72 28 * -- November 2008 72 27 * --
August 2008 72 27 1 -- July 2008 71 28 1 -- May 2008 70 30 1 -- April 2008 72 28 * --
December 2007 72 27 * -- September 2007 68 32 * --
February 2007 69 31 * -- December 2006 65 34 * -- November 2006 64 36 * --
August 2006 66 34 * -- April 2006 66 33 * --
December 2005 63 36 * -- September 2005 65 34 * --
February 2005 60 40 * -- January 2005 58 42 * --
November 2004 61 39 * -- June 2004 53 46 1 --
February 2004 55 44 * -- Q7 continued…
3 Prior to January 2005, question wording was “Did you happen to go online or check your email yesterday?”

Q7 continued…
YES, USED INTERNET
YESTERDAY
NO, DID NOT USE INTERNET
YESTERDAY DON’T KNOW REFUSED
November 2003 54 45 * -- July 2003 52 47 1 --
June 2003 55 44 * -- May 2003 58 42 * --
March 3-11, 2003 60 40 0 -- February 2003 60 40 * --
December 2002 56 44 * -- November 2002 57 43 * --
October 2002 57 43 0 -- September 2002 58 42 * --
July 2002 53 47 * -- March/May 2002 57 43 * --
January 20024 59 41 * -- Dec. 17-23, 2001 58 42 * --
Nov. 19-Dec. 16 2001 60 40 * -- Oct. 19-Nov. 18 2001 61 39 * --
Oct. 8-18 2001 51 49 1 -- October 2-7 2001 56 43 1 --
Sept 20-Oct 1 2001 57 42 1 -- Sept 12-19 2001 51 49 * --
August 2001 56 44 * -- February 20015 59 41 * --
Fall 2000liii 56 44 * -- August 2000 50 50 * --
June 2000 52 48 * -- April 2000liv 55 45 0 --
March 2000lv 60 40 * --
4 Internet user defined as Q5=1 and Q6=1 from Aug. 2001 until Jan 2002. 5 Internet user for Feb. 2001 defined as Q5=1 and (Q6=1 or Q6A=1-7).

Q8 About how often do you use the internet or email from … [INSERT IN ORDER] – several times a day, about once a day, 3-5 days a week, 1-2 days a week, every few weeks, less often or never?
Based on internet users [N=1,676]
SEVERAL TIMES A
DAY
ABOUT ONCE A
DAY
3-5 DAYS A WEEK
1-2 DAYS A WEEK
EVERY FEW
WEEKS LESS
OFTEN NEVER DON’T KNOW REFUSED
a. Home Current 38 21 13 13 4 4 6 * *
September 2009 37 21 13 13 4 4 6 * * April 2009 37 22 15 11 3 3 8 * *
December 2008 35 22 15 13 4 3 6 * * November 2008 34 23 15 12 4 5 7 * *
August 2008 35 22 15 13 5 3 7 * -- July 20086 29 25 17 14 4 4 7 * -- May 2008 37 21 15 11 5 6 6 * --
December 2007 36 22 14 11 5 6 7 * -- September 2007 34 21 15 12 5 6 6 * --
February 2007 31 24 15 12 6 7 5 * -- November 2006 30 24 16 13 5 5 7 * -- February 2006 29 25 17 12 5 6 6 * --
June 2005 27 22 15 13 6 7 10 * -- July 2004lvi 27 27 17 13 5 5 7 * --
March 2004lvii 29 24 15 13 6 5 8 * -- b. Work
Current 33 6 4 3 1 2 49 * * September 2009 34 7 4 4 2 3 46 * *
April 2009 36 8 6 4 1 2 41 * 1 December 2008 36 9 5 4 2 2 40 * * November 2008 36 7 4 4 2 3 44 * *
August 2008 37 7 5 5 2 2 42 1 -- July 2008 32 8 4 3 1 2 48 2 -- May 2008 36 8 5 5 1 7 37 1 --
December 2007 37 9 3 4 1 5 40 1 -- September 2007 35 9 5 4 1 4 42 * --
February 2007 38 9 5 3 2 5 38 1 -- November 2006 31 9 5 5 2 4 43 1 -- February 2006 35 8 5 3 2 7 40 1 --
June 2005 35 9 5 4 2 6 39 * -- July 2004 28 12 5 4 1 5 44 * --
March 2004 28 10 5 6 2 4 44 * --
6 Beginning in July 2008, “Never” is offered as an explicitly read category. Prior to July 2008, it was a volunteered category.

Q9 As I read the following list of items, please tell me if you happen to have each one, or not. Do you have… [INSERT ITEMS IN ORDER]?
YES NO DON’T KNOW REFUSED
a. A desktop computer
Current 58 42 * * September 2009 62 37 0 * April 2009 64 36 * * April 2008 65 34 * -- Dec 2007 65 35 * -- April 2006 68 32 * --
b. A laptop computer [includes netbook] Current 46 53 * * September 2009 47 53 * * April 2009 47 53 * * April 2008 39 61 * -- Dec 2007 37 63 * -- April 2006 30 69 * --
c. A cell phone or a Blackberry or iPhone or other device that is also a cell phone7 Current 83 17 0 * September 2009 84 15 * * April 2009 85 15 * * April 2008 78 22 * -- Dec 2007 75 25 * -- Sept 2007 78 22 * -- April 2006 73 27 * -- January 20058 66 34 * -- November 23-30, 2004 65 35 * --
7 Prior to April 2009, item wording was “A cell phone.” Beginning December 2007, this item was not asked of the cell phone sample, but results shown here reflect Total combined Landline and cell phone sample. 8 Through January 2005, question was not asked as part of a series. Question wording as follows: “Do you happen to have a cell phone, or not?”

Q9d Does anyone in your household have a working cell phone?
Based on non-cell phone users [N=339]
CURRENT % 31 Yes 68 No * Don’t know * Refused
Q10 On your laptop computer, do you ever use [INSERT IN ORDER]?
Based on internet users who have a laptop
YES NO DON’T KNOW REFUSED
a. WiFi or wireless connection to access the internet [IF NECESSARY: WiFi is a short-range wireless internet connection.] Current [N=1,000] 83 16 1 * September 2009 [N=965] 82 17 1 * April 2009 [N=937] 80 19 1 *
b. Wireless broadband, such as an AirCard, to access the internet [IF NECESSARY: Wireless broadband is a longer-range wireless connection, offered by many telephone companies and others.] Current 28 69 2 * September 2009 31 64 5 * April 2009 37 57 6 *

Q11 Please tell me if you ever use your cell phone or Blackberry or other device to do any of the following things. Do you ever use it to [INSERT ITEMS; ALWAYS ASK a-b FIRST in order; ROTATE c-e.]?
Based on cell phone users
YES, DO
THIS NO, DO NOT
DO THIS
(VOL.) CELL PHONE CAN’T
DO THIS DON’T KNOW REFUSED
a. Send or receive email Current [N=1,919] 29 70 * * * September 2009 [N=1,868] 27 72 * * 0 April 2009 [N=1,818] 25 75 n/a * 0 December 2007 [N=1,704] 19 81 n/a 0 --
b. Send or receive text messages Current 68 32 * * 0 September 2009 65 35 * * 0 April 2009 65 35 n/a * 0 December 2007 58 42 n/a 0 --
c. Send or receive pictures Current 56 44 1 * 0 September 2009 52 47 * * *
d. Send or receive Instant Messages Current 31 68 * 1 0 September 2009 27 71 1 1 * April 2009 20 79 n/a * * December 2007 17 83 n/a * --
e. Access the internet9 Current 32 67 1 * 0 September 2009 29 71 1 * 0 April 2009 25 74 n/a * * December 2007 19 81 n/a 0 --
WIRELESS Wireless internet use10
WIRELESS
INTERNET USER INTERNET USER
BUT NOT WIRELESS ALL OTHERS
Current 55 24 21 September 2009 54 25 21
April 2009 56 23 20 December 2008 43 30 26 November 2008 37 37 26
9 In December 2007, item wording was “Access the internet for news, weather, sports, or other information” 10 Definitions for wireless internet use may vary from survey to survey.
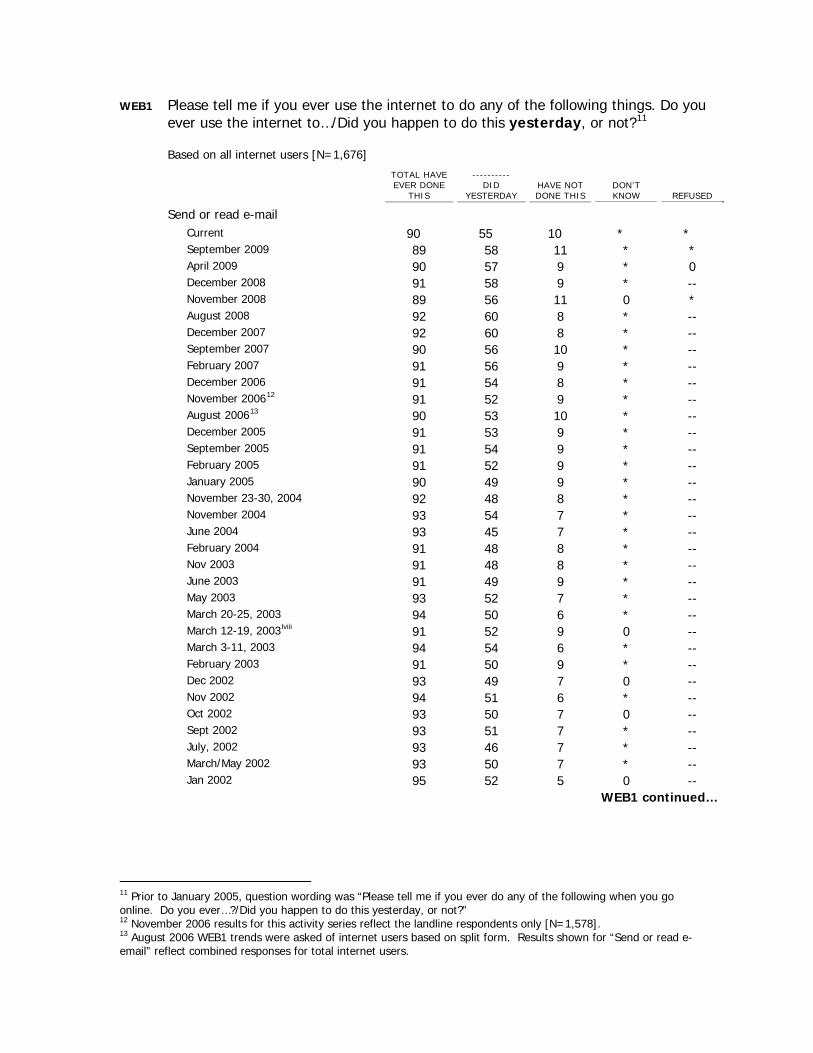
WEB1 Please tell me if you ever use the internet to do any of the following things. Do you ever use the internet to…/Did you happen to do this yesterday, or not?11
Based on all internet users [N=1,676]
TOTAL HAVE EVER DONE
THIS
---------- DID
YESTERDAY HAVE NOT DONE THIS
DON’T KNOW REFUSED
Send or read e-mail Current 90 55 10 * * September 2009 89 58 11 * * April 2009 90 57 9 * 0 December 2008 91 58 9 * -- November 2008 89 56 11 0 * August 2008 92 60 8 * -- December 2007 92 60 8 * -- September 2007 90 56 10 * -- February 2007 91 56 9 * -- December 2006 91 54 8 * -- November 200612 91 52 9 * -- August 200613 90 53 10 * -- December 2005 91 53 9 * -- September 2005 91 54 9 * -- February 2005 91 52 9 * -- January 2005 90 49 9 * -- November 23-30, 2004 92 48 8 * -- November 2004 93 54 7 * -- June 2004 93 45 7 * -- February 2004 91 48 8 * -- Nov 2003 91 48 8 * -- June 2003 91 49 9 * -- May 2003 93 52 7 * -- March 20-25, 2003 94 50 6 * -- March 12-19, 2003lviii 91 52 9 0 -- March 3-11, 2003 94 54 6 * -- February 2003 91 50 9 * -- Dec 2002 93 49 7 0 -- Nov 2002 94 51 6 * -- Oct 2002 93 50 7 0 -- Sept 2002 93 51 7 * -- July, 2002 93 46 7 * -- March/May 2002 93 50 7 * -- Jan 2002 95 52 5 0 --
WEB1 continued…
11 Prior to January 2005, question wording was “Please tell me if you ever do any of the following when you go online. Do you ever…?/Did you happen to do this yesterday, or not?” 12 November 2006 results for this activity series reflect the landline respondents only [N=1,578]. 13 August 2006 WEB1 trends were asked of internet users based on split form. Results shown for “Send or read e-email” reflect combined responses for total internet users.
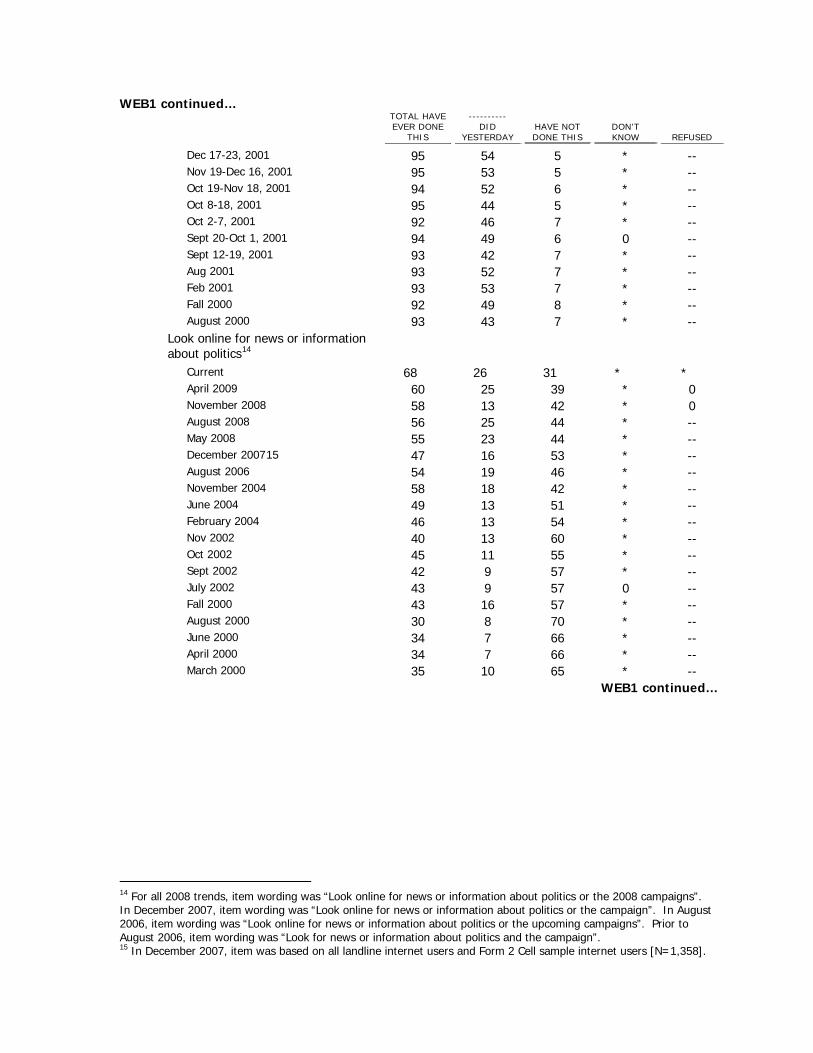
WEB1 continued…
TOTAL HAVE EVER DONE
THIS
---------- DID
YESTERDAY HAVE NOT DONE THIS
DON’T KNOW REFUSED
Dec 17-23, 2001 95 54 5 * -- Nov 19-Dec 16, 2001 95 53 5 * -- Oct 19-Nov 18, 2001 94 52 6 * -- Oct 8-18, 2001 95 44 5 * -- Oct 2-7, 2001 92 46 7 * -- Sept 20-Oct 1, 2001 94 49 6 0 -- Sept 12-19, 2001 93 42 7 * -- Aug 2001 93 52 7 * -- Feb 2001 93 53 7 * -- Fall 2000 92 49 8 * -- August 2000 93 43 7 * --
Look online for news or information about politics14
Current 68 26 31 * * April 2009 60 25 39 * 0 November 2008 58 13 42 * 0 August 2008 56 25 44 * -- May 2008 55 23 44 * -- December 200715 47 16 53 * -- August 2006 54 19 46 * -- November 2004 58 18 42 * -- June 2004 49 13 51 * -- February 2004 46 13 54 * -- Nov 2002 40 13 60 * -- Oct 2002 45 11 55 * -- Sept 2002 42 9 57 * -- July 2002 43 9 57 0 -- Fall 2000 43 16 57 * -- August 2000 30 8 70 * -- June 2000 34 7 66 * -- April 2000 34 7 66 * -- March 2000 35 10 65 * --
WEB1 continued…
14 For all 2008 trends, item wording was “Look online for news or information about politics or the 2008 campaigns”. In December 2007, item wording was “Look online for news or information about politics or the campaign”. In August 2006, item wording was “Look online for news or information about politics or the upcoming campaigns”. Prior to August 2006, item wording was “Look for news or information about politics and the campaign”. 15 In December 2007, item was based on all landline internet users and Form 2 Cell sample internet users [N=1,358].
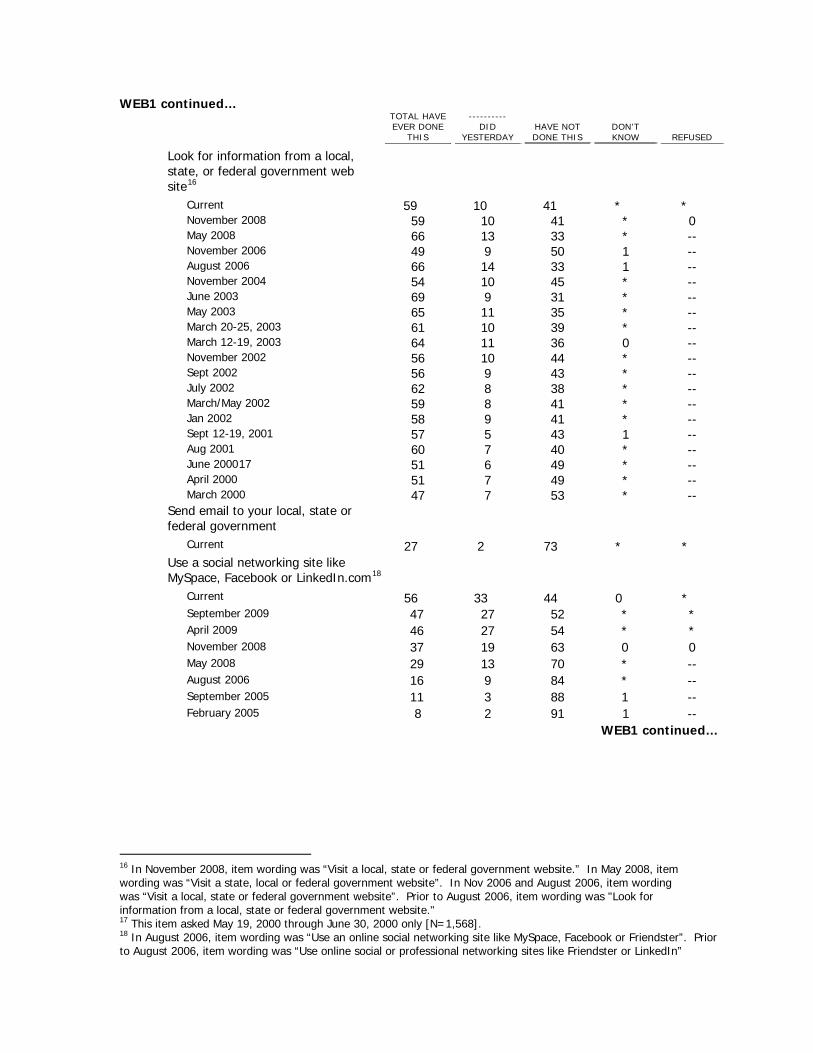
WEB1 continued…
TOTAL HAVE EVER DONE
THIS
---------- DID
YESTERDAY HAVE NOT DONE THIS
DON’T KNOW REFUSED
Look for information from a local, state, or federal government web site16
Current 59 10 41 * * November 2008 59 10 41 * 0 May 2008 66 13 33 * -- November 2006 49 9 50 1 -- August 2006 66 14 33 1 -- November 2004 54 10 45 * -- June 2003 69 9 31 * -- May 2003 65 11 35 * -- March 20-25, 2003 61 10 39 * -- March 12-19, 2003 64 11 36 0 -- November 2002 56 10 44 * -- Sept 2002 56 9 43 * -- July 2002 62 8 38 * -- March/May 2002 59 8 41 * -- Jan 2002 58 9 41 * -- Sept 12-19, 2001 57 5 43 1 -- Aug 2001 60 7 40 * -- June 200017 51 6 49 * -- April 2000 51 7 49 * -- March 2000 47 7 53 * --
Send email to your local, state or federal government
Current 27 2 73 * * Use a social networking site like MySpace, Facebook or LinkedIn.com18
Current 56 33 44 0 * September 2009 47 27 52 * * April 2009 46 27 54 * * November 2008 37 19 63 0 0 May 2008 29 13 70 * -- August 2006 16 9 84 * -- September 2005 11 3 88 1 -- February 2005 8 2 91 1 --
WEB1 continued…
16 In November 2008, item wording was “Visit a local, state or federal government website.” In May 2008, item wording was “Visit a state, local or federal government website”. In Nov 2006 and August 2006, item wording was “Visit a local, state or federal government website”. Prior to August 2006, item wording was "Look for information from a local, state or federal government website." 17 This item asked May 19, 2000 through June 30, 2000 only [N=1,568]. 18 In August 2006, item wording was “Use an online social networking site like MySpace, Facebook or Friendster”. Prior to August 2006, item wording was “Use online social or professional networking sites like Friendster or LinkedIn”
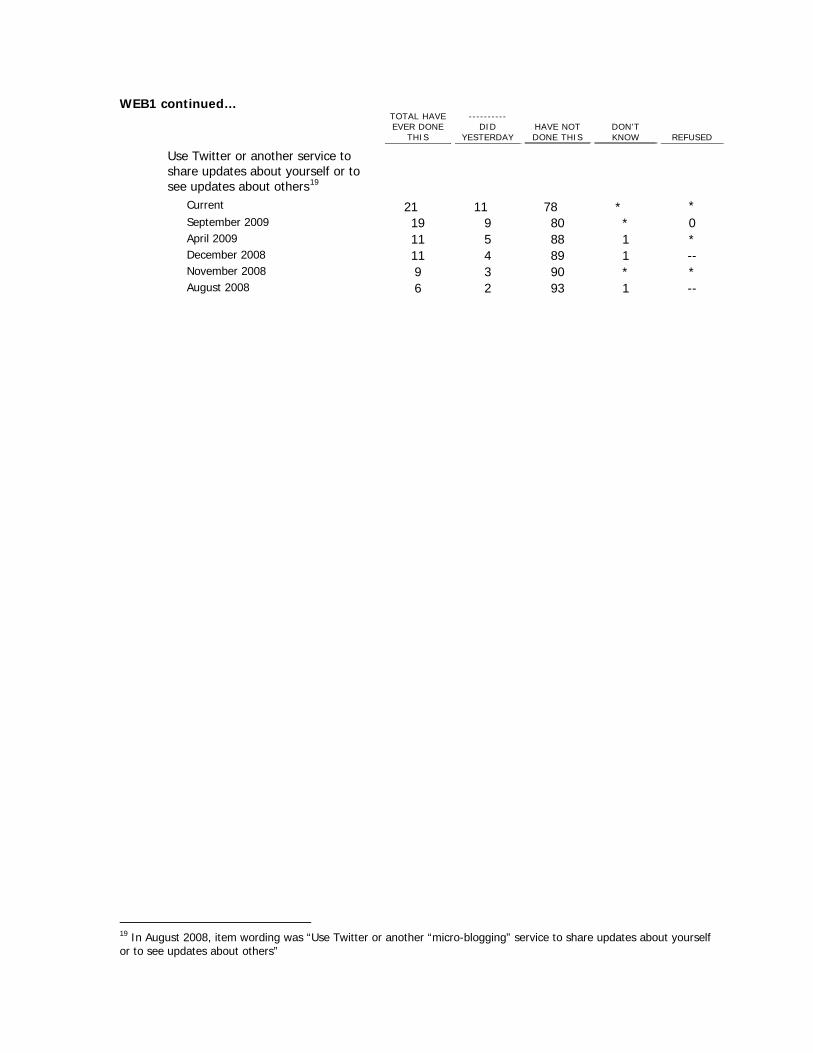
WEB1 continued…
TOTAL HAVE EVER DONE
THIS
---------- DID
YESTERDAY HAVE NOT DONE THIS
DON’T KNOW REFUSED
Use Twitter or another service to share updates about yourself or to see updates about others19
Current 21 11 78 * * September 2009 19 9 80 * 0 April 2009 11 5 88 1 * December 2008 11 4 89 1 -- November 2008 9 3 90 * * August 2008 6 2 93 1 --
19 In August 2008, item wording was “Use Twitter or another “micro-blogging” service to share updates about yourself or to see updates about others”

Q13 In the past 12 months, have you contacted your local, state or federal government by… [INSERT IN ORDER]?
YES NO DON’T KNOW REFUSED
a. Calling a government office or agency on the phone Current 29 70 1 * August 2003 22 77 * --
b. Visiting a government office or agency in person Current 24 76 * * August 2003 18 81 * --
c. Writing a letter to a government office, agency or official20 Current 17 83 * * September 2005 13 87 * -- August 2003 20 79 * --
‘Yes’ to at least one: Current 44 August 2003 39
Q14 OVERALL, when you have a question, problem, or task that requires contact with
your local, state or federal government, which method of contact do you prefer MOST? (READ 1-5)21
CURRENT
AUGUST 2003
% 35 Calling on the phone 38 20 Visiting in person 15 11 Writing a letter 15 10 Visiting a web site 17 18 Sending email 9 1 Some other way (VOL./SPECIFY) 1 4 Never contact government (VOL.) 4 1 (DO NOT READ) Don’t know 1 * (DO NOT READ) Refused --
20 In August 2003, item wording was “Writing a letter to a government office or agency” 21 In August 2003, question wording was “Overall, when you have a question, problem, or task that requires contact with the government, what is the method you prefer MOST?”

Q15 Just in general, which level of government would you say you deal with most often… local government, state government or the federal government?
CURRENT % 52 Local government 22 State government 15 Federal government 2 (VOL.) All equally/A combination 6 (VOL.) None of them 2 Don’t know * Refused
Q16 In general, how important do you feel it is today for a government agency to
[INSERT IN ORDER] … very important, somewhat important, not too important or not important at all?
VERY SOME-WHAT NOT TOO
NOT AT ALL
DON’T KNOW REFUSED
a. Provide general information to the public on its website 67 20 4 6 3 1
b. Allow people to contact agency officials through the website 62 23 4 6 4 1
c. Allow people to complete tasks on the website, such as submitting applications or renewing licenses 62 22 5 7 4 1
d. Post information and alerts on sites such as Facebook or Twitter 21 25 19 24 10 2
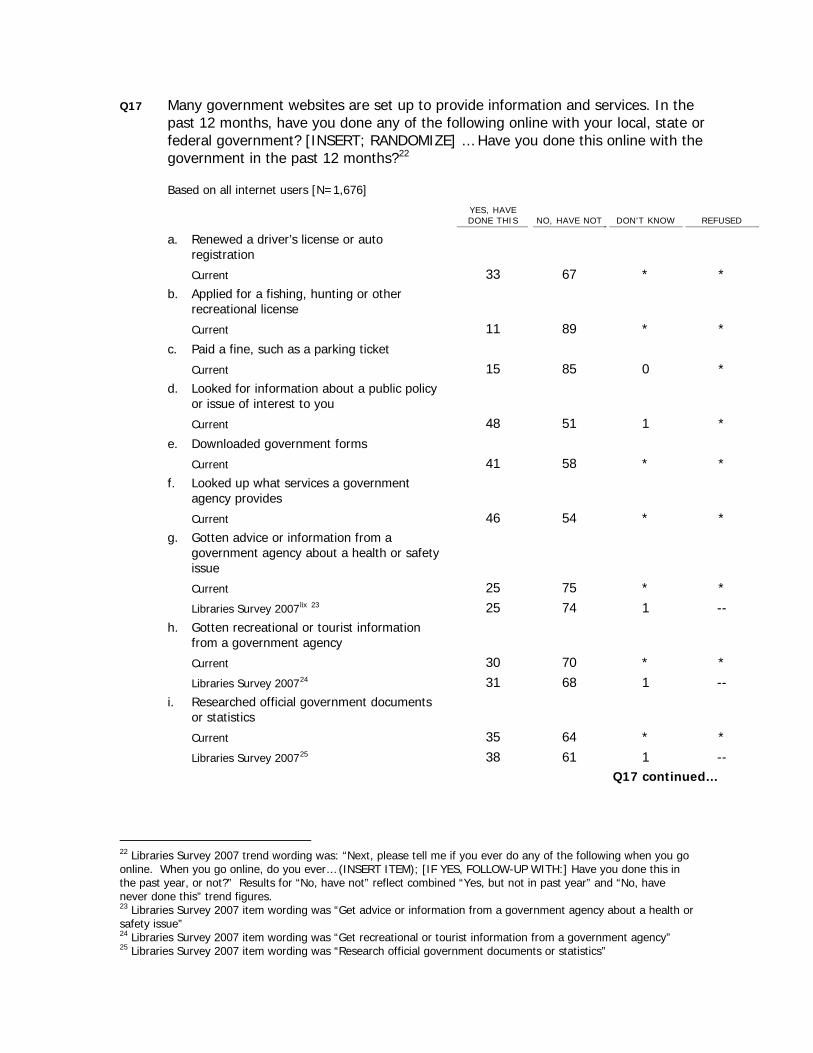
Q17 Many government websites are set up to provide information and services. In the past 12 months, have you done any of the following online with your local, state or federal government? [INSERT; RANDOMIZE] … Have you done this online with the government in the past 12 months?22
Based on all internet users [N=1,676]
YES, HAVE DONE THIS NO, HAVE NOT DON’T KNOW REFUSED
a. Renewed a driver’s license or auto registration
Current 33 67 * * b. Applied for a fishing, hunting or other
recreational license Current 11 89 * *
c. Paid a fine, such as a parking ticket Current 15 85 0 *
d. Looked for information about a public policy or issue of interest to you Current 48 51 1 *
e. Downloaded government forms Current 41 58 * *
f. Looked up what services a government agency provides Current 46 54 * *
g. Gotten advice or information from a government agency about a health or safety issue Current 25 75 * * Libraries Survey 2007lix 23 25 74 1 --
h. Gotten recreational or tourist information from a government agency Current 30 70 * * Libraries Survey 200724 31 68 1 --
i. Researched official government documents or statistics Current 35 64 * * Libraries Survey 200725 38 61 1 --
Q17 continued…
22 Libraries Survey 2007 trend wording was: “Next, please tell me if you ever do any of the following when you go online. When you go online, do you ever… (INSERT ITEM); [IF YES, FOLLOW-UP WITH:] Have you done this in the past year, or not?” Results for “No, have not” reflect combined “Yes, but not in past year” and “No, have never done this” trend figures. 23 Libraries Survey 2007 item wording was “Get advice or information from a government agency about a health or safety issue” 24 Libraries Survey 2007 item wording was “Get recreational or tourist information from a government agency” 25 Libraries Survey 2007 item wording was “Research official government documents or statistics”

Princeton Survey Research Associates International
Q17 continued…
YES, HAVE DONE THIS NO, HAVE NOT DON’T KNOW REFUSED
j. Gotten information about or applied for government benefits Current 23 77 * * Libraries Survey 200726 20 80 * --
k. Gotten information about how to apply for a government job Current 19 81 * *
Q18 Do you happen to recall the last government website you visited – that is, the one you
went to most recently? [IF YES: What site was that?] [IF NECESSARY: It’s okay if you don’t recall the exact name of the website. Could you tell me which office or agency whose website you visited?]
Based on all internet users [N=1,676]
CURRENT % 64 Yes (SPECIFY) 29 No, don’t recall 4 (VOL.) Have not visited any government websites 3 Don’t know * Refused
Q19 How did you know which government website to go to? Did you…[READ]
Based on internet users who recall the last government website they visited [N=1,084]
CURRENT % 44 Use a general search engine such as Google or Bing 14 Learn about the site from a friend, family member or advertisement 16 Go to a site you’d used before 11 Go to a site listed in a government publication or notice 4 Find the site through a general government site like usa.gov 9 Some other way (VOL./SPECIFY) 1 (DO NOT READ) Don’t know * (DO NOT READ) Refused
26 Libraries Survey 2007 item wording was “Get information about or apply for government benefits”

18
Princeton Survey Research Associates International
Q20 How much of what you were trying to do on the government site did you succeed in doing… everything you were trying to do… most of it… only some of it… or none of what you were trying to do?
Based on internet users who recall the last government website they visited [N=1,084]
CURRENT % 51 Everything 28 Most of it 16 Some of it 5 None of it * Don’t know 0 Refused
Q21 Here is another list of items. For each of the following, please tell me if you have done
this in the past 12 months, or not. In the past 12 months, have you…[INSERT; RANDOMIZE]?
YES, HAVE DONE THIS NO, HAVE NOT DON’T KNOW REFUSED
Item A: Based on SNS users [N=849] a. Followed or become a fan of a government
agency or official through their page on a social networking site 9 91 * 0
Item B: Based on all internet users [N=1,676] b. Read the blog of a government agency or
official 13 86 1 0 Item C: Based on email users [N=1,613] c. Signed up to receive EMAIL ALERTS from a
government agency or official 15 85 * 0 Item D: Based on texters [N=1,113] d. Signed up to receive TEXT MESSAGES from
a government agency or official 4 96 * 0 Item E: Based on all internet users [N=1,676] e. Watched a video online on a government
website 15 84 1 0 Item F: Based on Twitter users [N=307] f. Followed a government agency or official on
Twitter 7 93 0 0
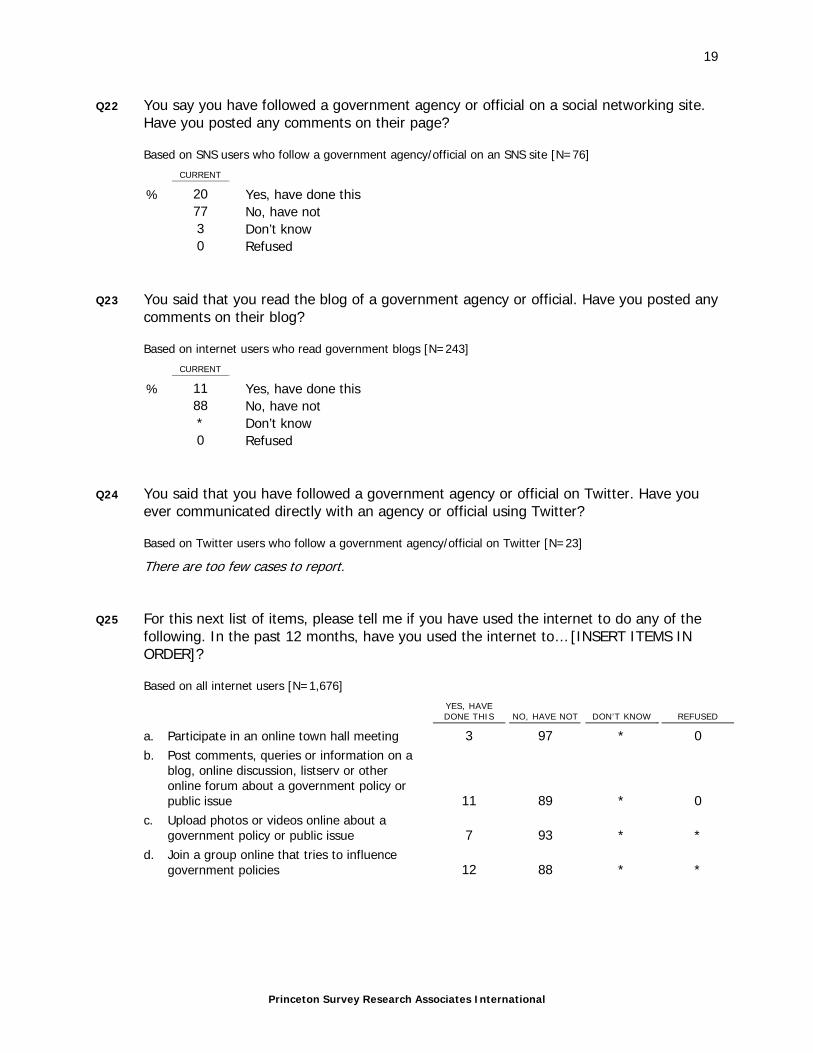
19
Princeton Survey Research Associates International
Q22 You say you have followed a government agency or official on a social networking site. Have you posted any comments on their page?
Based on SNS users who follow a government agency/official on an SNS site [N=76]
CURRENT % 20 Yes, have done this 77 No, have not 3 Don’t know 0 Refused
Q23 You said that you read the blog of a government agency or official. Have you posted any
comments on their blog?
Based on internet users who read government blogs [N=243]
CURRENT % 11 Yes, have done this 88 No, have not * Don’t know 0 Refused
Q24 You said that you have followed a government agency or official on Twitter. Have you
ever communicated directly with an agency or official using Twitter?
Based on Twitter users who follow a government agency/official on Twitter [N=23]
There are too few cases to report. Q25 For this next list of items, please tell me if you have used the internet to do any of the
following. In the past 12 months, have you used the internet to… [INSERT ITEMS IN ORDER]?
Based on all internet users [N=1,676]
YES, HAVE DONE THIS NO, HAVE NOT DON’T KNOW REFUSED
a. Participate in an online town hall meeting 3 97 * 0 b. Post comments, queries or information on a
blog, online discussion, listserv or other online forum about a government policy or public issue 11 89 * 0
c. Upload photos or videos online about a government policy or public issue 7 93 * *
d. Join a group online that tries to influence government policies 12 88 * *

20
Princeton Survey Research Associates International
Q26 As you may know, some government agencies and officials now allow people to get information and submit feedback using NEW tools such as blogs, social networking sites like Facebook, services like Twitter, or text messaging. Please tell me whether you agree or disagree with each of the following statements. Having a way to follow and communicate online with the government using these tools… [INSERT; RANDOMIZE] – Do you strongly agree, somewhat agree, somewhat disagree or strongly disagree?
STRONG.
AGREE
SOME-WHAT AGREE
SOME-WHAT
DISAGR. STRONG. DISAGR.
(VOL.) NEITHER
AGR./ DISAGR.
(VOL.) UN-FAMILIAR
WITH TOOLS
DON’T KNOW REF.
a. Makes government agencies and officials more accessible 33 41 10 10 1 1 3 1
b. Helps people be more informed about what the government is doing 36 42 7 9 2 1 2 1
c. Is a waste of government money 17 24 29 23 3 1 3 1 d. Just delivers the same government
information in different ways 25 47 11 8 1 2 4 1
Q31 There are many types of government information available online. In the past 12
months, have you used the internet to… [INSERT; RANDOMIZE]?
Based on all internet users [N=1,676]
YES NO DON’T KNOW REFUSED
a. Visit a site that provides access to government data, like data.gov or recovery.gov or usaspending.gov 16 83 1 *
b. Look for information on who contributes to the campaigns of your elected officials 14 86 * 0
c. Download or read the text of any legislation 22 78 * 0 d. Look to see how money from the recent
federal government stimulus package is being spent 23 77 * *
Q32 [READ TO NON-INTERNET USERS: On another topic,) Compared to two years ago,
would you say that the federal government is now more open and accessible, less open and accessible, or about the same as it was two years ago?
CURRENT % 34 More open and accessible 13 Less open and accessible 46 About the same 6 Don’t know 1 Refused

21
Princeton Survey Research Associates International
MODEMA At home, do you connect to the internet through a dial-up telephone line, or do you have some other type of connection, such as a DSL-enabled phone line, a cable TV modem, a wireless connection, a fiber optic connection such as FIOS or a T-1?
MODEMB At home, what type of connection do you have to the internet… a dial-up telephone line, a DSL line, a cable modem, satellite connection, a connection to a fixed wireless provider, a wireless connection such as an AirCard, a fiber optic connection such as FIOS or a T-1?27
Based on those who use the internet from home
DIAL-UP
TOTAL HIGH SPEED
---------
DSL
---------
CABLE MODEM
---------
WIRELESS
---------
FIBER OPTIC 28
---------
T-1 OTHER DK REF.
Current [N=1,582] 9 86 28 37 17 3 1 2 4 1 Sept 2009 [N=1,584] 7 87 30 37 15 4 * 2 3 2 April 2009 [N=1,567] 9 86 29 36 15 4 1 2 3 1 Dec 2008 [N=1,538] 13 80 30 32 15 3 * 1 5 -- Nov 2008 [N=1,481] 12 82 33 34 13 3 * 1 5 -- Aug 2008 [N=1,543] 13 81 37 30 10 3 1 1 5 -- July 2008 [N=1,797] 14 81 35 30 13 3 1 1 4 -- May 2008 [N=1,463] 15 79 36 31 9 2 * 1 5 -- Dec 2007 [N=1,483] 18 77 34 31 10 2 1 1 3 -- Sept 2007 [N=1,575] 20 73 34 30 8 2 n/a 1 6 -- Feb 2007 [N=1,406] 23 70 35 28 6 1 n/a 1 6 -- Aug 2006 [N=1,787] 28 68 34 30 3 1 n/a 1 3 -- Dec 2005 [N=1,715] 35 61 29 27 4 1 n/a 1 3 --
June 2005 [N=1,204] 44 53 24 25 3 1 n/a 1 1 -- Feb 2005 [N=1,287] 47 50 22 25 3 1 n/a 1 3 -- Jan 2005 [N=1,261] 48 50 21 26 2 1 n/a 1 1 -- Feb 2004 [N=1,241] 55 42 18 23 1 1 n/a 1 2 -- Nov 2003 [N=1,199] 62 35 13 21 1 * n/a 1 2 -- THANK RESPONDENT: That concludes our interview. The results of this survey are going to be used by a non-profit research organization called the Pew Research Center’s Internet & American Life Project, which is looking at the impact of the internet on people's lives. A report on this survey will be issued by the project in a few months and you can find the results at its web site, which is www.pewinternet.org [w-w-w dot pew internet dot org]. Thanks again for your time. Have a nice day/evening.
27 Beginning September 2009, the question asking about type of home internet connection (MODEM) was form split. MODEMA was asked of Form A respondents who use the internet from home. MODEMB was asked of Form B respondents who use the internet from home. Results shown here reflect combined MODEMA and MODEMB percentages. Form B respondents who answered “satellite,” fixed wireless provider,” or “other wireless such as an Aircard or cell phone” have been combined in the “Wireless” column in the table. 28 In Sept. 2007 and before, “Fiber optic connection” and “T-1 connection” were collapsed into one category. Percentage for “Fiber optic connection” reflects the combined “Fiber-optic/T-1” group.