2011 concrete cells reconstruction
TRANSCRIPT

United States Department of Transportation
SUMMARY REPORT
FHWA MCL Project # MN 1103
Federal Highway Administration Office of Pavement Technology HIPT-20 1200 New Jersey Avenue, SE Washington, DC 20590
2011 Concrete Cells Reconstruction
MnROAD, MN August, 2011

2
MnROAD 2011 Concrete Cells Reconstruction
INTRODUCTION This report summarizes the test results from limited field testing performed by the FHWA’s Mobile Concrete Laboratory (MCL) during a visit to MnROAD in August 2011. The MCL was invited to the project by Tim Clyne with MnROAD/Minnesota Department of Transportation (MNDOT). PROJECT DETAILS During the 2011 construction season, MnROAD reconstructed and repaired four Portland Cement Concrete (PCC) Mainline Cells (Cell 5, Cell 6, Cell 63, and Cell 96) and constructed Roller Compacted Concrete (RCC) shoulders. The MCL was present at MnROAD during reconstruction of Cells 5 and 6 and construction of the RCC test strip. Additionally, the MCL performed tensile bond strength testing on the Composite Pavement Test Sections built at MnROAD in 2010. Following is a brief description of the reconstruction efforts at Cells 5, 6 and RCC shoulders. Cell 5 (New-thin unbonded concrete overlay using non-woven geotextile) (1) A 5” unbonded concrete overlay with smaller panel size (6’ wide x 7.5’ long) was placed over an existing 5” and 4” concrete overlay that developed cracks. A non-woven geotextile was placed on the existing PCC prior to placing the 5”concrete overlay. The objective of this cell is to explore the performance characteristics of a thin unbonded overlay with smaller panel sizes on top of a geotextile interlayer. Also of interest is the ability of the geotextile interlayer to provide stress relief from the underlying joints in the existing concrete and to drain water from the overlay system. Cell 6 (Reconstruction using non 8-18 gradation band and longitudinal tining) (1) Cell 6 was a total reconstruction of an existing cracked PCC section using a non 8-18 graded concrete mixture. The surface of this pavement was longitudinally tined. Currently, MNDOT provides incentives for well graded aggregate in PCC meeting the 8-18 gradation band and is a requirement on high performance concrete projects. The primary reason for using the 8-18 gradation is to reduce the paste content of the mixture, improve workability and enhance pavement smoothness. However, well graded aggregates may not always be needed especially on low volume and municipal roads. Increased costs can result due to the use of well graded aggregates. The reconstruction efforts on Cell 6 will allow MnROAD to investigate a concrete mixture with a non 8-18 gradation band and evaluate its durability over time.
The purpose of longitudinal tining on Cell 6 is to support several national projects investigating pavement surface characteristics (noise, ride, texture, friction etc). This is a FHWA sponsored cell so that MnROAD can continue to be used for developing, testing, certifying, and training on various surface measurement devices such as profilers. The primary purpose of using longitudinal tining is to reduce the noise associated with tining.
Roller Compacted Concrete (RCC) shoulders (1) The shoulders of Cells 5 and 6 were constructed with RCC. RCC has many of the desirable properties of typical concrete pavements (i.e., high flexural and compressive strength, low permeability and long term durability) while at the same time its ease of construction (i.e., no

3
steel reinforcing or dowels, no forms or finishing ) puts RCC on par with constructing HMA pavements. If the roller compacted concrete performs well on the shoulders at MnROAD, the concrete paving industry will have another tool in their toolbox to use as an alternative to asphalt shoulders. MCL OBJECTIVES The MCL work at MnROAD had two objectives:
1. Supplement MnROAD/MNDOT testing during reconstruction of PCC Mainline Cells 5, 6, and the RCC test strip.
2. Perform tensile bond strength testing of PCC/PCC composite pavement test-sections that were constructed in 2010 as part of the Strategic Highway Research Program 2 (SHRP2) study (Background and details of this work are discussed in the later part of this report).
TIMELINE and TEST PLAN The MCL arrived to the MnROAD facility on August 17 and performed testing until August 26. It was parked on the Low Volume road at MnROAD. Due to scheduling issues, the MCL was not able to perform sampling during the RCC shoulder paving. Sampling was performed from the RCC test strip construction only. Table 1 shows the overall tests that were performed by the MCL during the visit to MnROAD.
Table 1: Overall Test Matrix
Cell 6
Cell 5
RCC Test Strip
Composite Pavement
(PCC/PCC) Sections # 1 #2 #3 #1 #2 #3
Fresh Concrete Properties X X X X X X
Compressive Strength, 7 and 28 Days X
X X
Flexural Strength, 7 and 28 Days X X X
Coefficient of Thermal Expansion Test X X X X X X X
Heat Signature X X X X X X
Surface Resistivity Meter X X X X X X X
Scan T2, Pavement Thickness X
Tensile Bond Strength Test
X
Sand Patch Test X
MATERIALS Table 2 shows the mixture proportions and gradation information of the concrete mixtures used in construction of Cells 5, 6 and RCC test strip/shoulders. Gradations for the three mixtures are shown in graphical format in Figure 1 on a 0.45 power gradation chart. Figures 2, 3, and 4 show the 8-18 aggregate gradation plots for concrete used in Cell 6, Cell 5, and RCC shoulders. The contractor submitted designs for the three mixtures are included in Appendix A.

4
Table 2: Mixture Designs for the three Concrete Mixtures
Cell 6 Cell 5 RCC Water (lbs/C.Y) 240 240 180 Cement (lbs/C.Y) 400 400 353 Fly ash (lbs/C.Y) 140 140 117 W/CM Ratio 0.44 0.44 0.38 Sand#1 (lbs/C.Y) 1223 1218 655 Sand#1 (lbs/C.Y) -- -- 982 CA#1 (lbs/C.Y) 612 914 -- CA#2(lbs/C.Y) 1223 914 1637 Slump Range, in 1-3 1-3 ½ -1 Air Content, % 7 7 7
Combined Aggregate Gradation, % Passing 1 1/2" 100 98 100 1" 92 82 100 3/4" 81 72 98 1/2" 66 60 82 3/8" 57 53 71 #4 42 41 52 #8 37 37 39 #16 30 30 30 #30 21 21 19 #50 7 7 6 #100 1 1 1 #200 0.1 0.1 0.1
Figure 1: Combined Aggregate Gradation for the three Mixtures on a 0.45 power chart
0102030405060708090
100
Per
cent
Pas
sing
Sieve Size(mm) Raised to 0.45 Power
0.45 Power Chart
Cell 6Cell 5RCC Shoulders

5
Figure 2: 8-18 Gradation Plot for the Concrete Mixture used in Cell 6
Figure 3: 8-18 Gradation Plot for the Concrete Mixture used in Cell 5
Figure 4: 8-18 Gradation Plot for the Concrete Mixture used in RCC
0
2
4
6
8
10
12
14
16
18
20
0 1 2 3 4 5 6 7 8 9 10 11 12 13 14
% R
etai
ned
Sieve Size
Cell 6
0
2
4
6
8
10
12
14
16
18
20
0 1 2 3 4 5 6 7 8 9 10 11 12 13 14
% R
etai
ned
Sieve Size
Cell 5
0
2
4
6
8
10
12
14
16
18
20
0 1 2 3 4 5 6 7 8 9 10 11 12 13 14
% R
etai
ned
Sieve Size
RCC

6
Sampling For Cells 5 and 6, a small loader brought samples from the paving location to the sampling area (which was also on grade). Sampling for the RCC test strip was performed at the test strip which was constructed in the stockpile area of the MnROAD facility. Figure 5 shows the sampling location used by the MnROAD and the MCL staff during the construction of cells 5 and 6.
Figure 5: Sampling Location
SAMPLE CURING and TESTING Specimens cast from each mixture were demolded the following day and put in curing tanks in the MCL immediately. The temperature of the water baths inside the MCL was monitored. Twenty eight day testing for some of the samples was performed during the MCL’s transit to the next field project location.
TEST RESULTS Fresh Concrete Property Tests Fresh concrete properties; unit weight (AASHTO T121/ASTM C138), temperature (AASHTO T309/ASTM C1064), slump (AASHTO T119/ASTM C143) and air content (AASHTO T 152/ASTM C231)) were measured from concrete samples from each mixture and are shown in Table 3. Air content and unit weight were relatively consistent between samples of the same mixture. Slump was also consistent and within specification limits. Air content of concrete used in Cell 5 was lower than air content of concrete used in Cell 6. All air content measurements were also within the specification limits.
Table 3: Fresh Concrete Properties
Cell 6 Cell 5 Spec Limits
Mixture ID 3A21WC35 3A21WC15 Sample ID 1-1 1-2 1-3 2-1 2-2 2-3
Sample Time 8:59 a.m. 9:39 a.m. 10:30 a.m. 8:37 a.m. 9:04 a.m. 10:13 a.m. Date 8/22/11 8/22/11 8/22/11 8/24/11 8/24/11 8/24/11
Slump " 2 --- 2 ¼ 2 1 ¾ 2 ½ 1”-3” Conc Temp, ⁰F 80 80 82 81 81 81 Unit Weight,
145.9 145.9 144.6 148.6 147.8 146.0
Air Content, % 6.4% 6.8% 7.4% 5.8% 5.8% 5.8% 5.5%-8.5%
Comments
First Truck, MCL and MnROAD beams & cylinders
MN State University beams for maturity
study
MnROAD beams & cylinders
MCL beams & cylinders
7
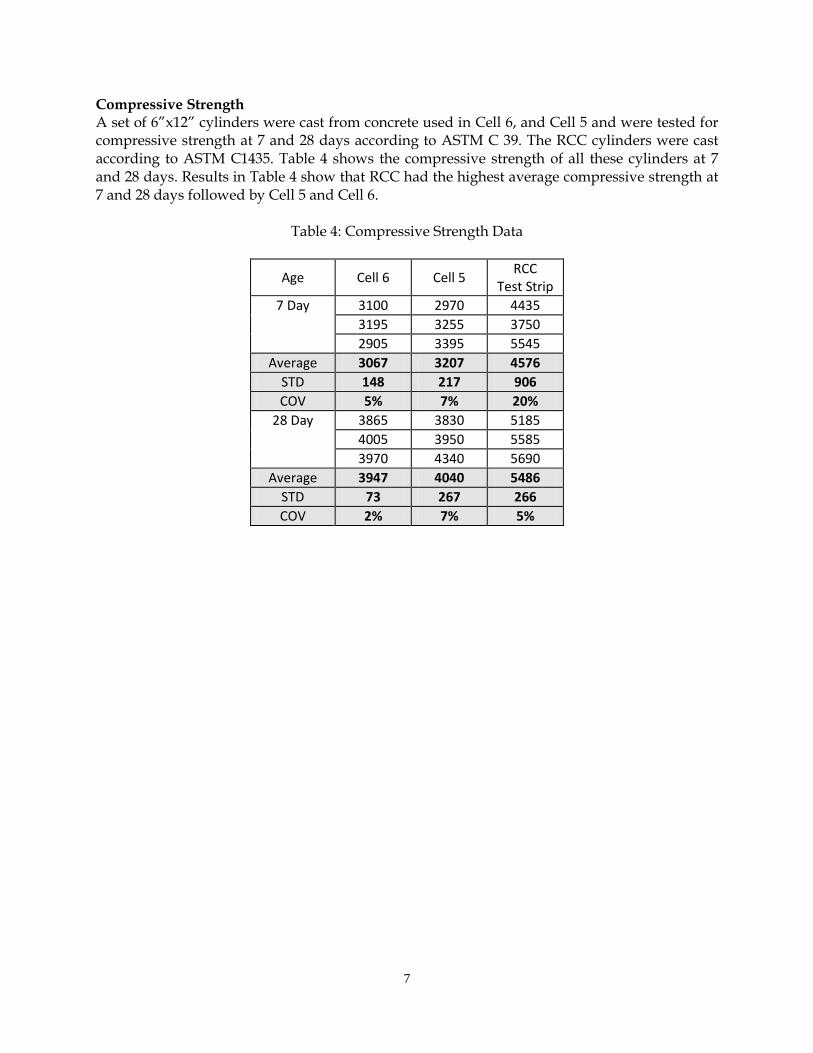
Compressive Strength A set of 6”x12” cylinders were cast from concrete used in Cell 6, and Cell 5 and were tested for compressive strength at 7 and 28 days according to ASTM C 39. The RCC cylinders were cast according to ASTM C1435. Table 4 shows the compressive strength of all these cylinders at 7 and 28 days. Results in Table 4 show that RCC had the highest average compressive strength at 7 and 28 days followed by Cell 5 and Cell 6.
Table 4: Compressive Strength Data
Age Cell 6 Cell 5 RCC Test Strip
7 Day 3100 2970 4435 3195 3255 3750 2905 3395 5545
Average 3067 3207 4576 STD 148 217 906 COV 5% 7% 20%
28 Day 3865 3830 5185 4005 3950 5585 3970 4340 5690
Average 3947 4040 5486 STD 73 267 266 COV 2% 7% 5%

8
Modulus of Rupture (Flexural Strength) A set of beams were cast according to ASTM C31 from Cell 5 and 6 and were tested in third point flexure according to ASTM C78 at 7 and 28 days. Since there is currently no test method to cast beams for RCC, beams were cast from RCC in two lifts after vibrating each lift for 20 seconds. Table 5 shows the flexural strength test results. Similar to the compressive strength results, the flexural strength of specimens from Cell 5 was higher than those of Cell 6 at 7 and 28 days. This could be due to the lower air content in Cell 5 compared to Cell 3 (Table 3). RCC had higher flexural strength than Cell 5 and Cell 6. Table 5: Modulus of Rupture Test Results, psi
Age Cell 6 Cell 5 RCC Test Strip
7 Day 462 599 652 483 565 627 467 565 702
Average 471 576 660 STD 11 20 38 COV 2.4% 3% 6%
28 Day 557 714 779 571 716 760 566 707 831
Average 564 712 790 STD 7 5 37 COV 1% 1% 5%
Since there was no test method to cast beams for RCC, the MnROAD and the MCL staff decided to cast extra RCC beams in one lift and used a vibrating hammer to vibrate for 40 seconds. Table 6 shows the average flexural test results of RCC beams that were cast in one and two lifts respectively. Table 6 suggests that RCC beams cast in two layers had significantly higher flexural strengths compared to those cast in only one lift. This is probably due to increased consolidation of RCC when cast in two lifts compared to casting in a single lift.
Table 6: RCC Flexural Strengths using One and Two Lifts
Lift Flexural Strength, Psi
7 Day Two Lifts 660 One Lift 457
28 Day Two Lifts 790 One Lift 550
Coefficient of Thermal Expansion The coefficient of thermal expansion (CTE) is a parameter that quantifies the extent with which a material changes length in response to changes in temperature. The CTE is the length change per unit length per unit temperature – microstrain/0C for example. CTE is important for

9
concrete pavements because a uniform temperature change will affect the opening of joints and a temperature gradient through the thickness of the slab will produce curling of the slab. Accurate measurement of CTE will allow for better estimates of slab movement and stress development due to temperature changes. The CTE of specimens from the three mixtures was determined according to AASHTO T 336 and the results are presented in Table 7. The CTE values ranged from 8.6 to 9.1 microstrain/⁰C. The results indicate that there was not a significant difference in CTE between the three mixtures. This is not surprising since the majority of the aggregates used in the three mixtures came from the same source (Elk River).
Table 7: Coefficient of Thermal Expansion
Specimen ID Cast Date
Approximate Age Tested CTE, microstrain/⁰C
Cell 6 – Sample 1
8/22/11
65 Days
8.9
Cell 6 – Sample 2 9.0
Cell 6 – Sample 3 9.1
Cell 5 – Sample 1 8/24/11
8.6 Cell 5– Sample 2 8.9 Cell 5 – Sample 3 9.0
RCC – Sample 1 8/26/11 8.7 Permeability (Surface Resistivity (SR) Meter) This test can be used to evaluate the electrical resistivity of water saturated concrete to provide a rapid indication of its resistance to chloride ion penetration. Measurements from this test have shown good correlations with other electrical indication tests, such as the Rapid Chloride Permeability Test (RCPT) (AASHTO T 277 /ASTM C 1202)(2). The primary advantage of this test is that it is fast (less than five minutes) and does not require any sample preparation unlike the RCPT test method. Table 8 shows the chloride ion penetration classification based on the readings from the RCPT and SR meter tests (3).
Table 8: Chloride Ion Penetration Classification
Chloride Ion Penetration
AASHTO T277 AASHTO TP 95 Surface Resistivity Test
RCP Test Charges Passed (Columbs)
4 in. X 8 in. Cylinder (KOhm-cm)
High > 4,000 < 12 Moderate 2000-4000 12 - 21
Low 1000-2000 21 - 37 Very Low 100-1000 37 - 254 Negligible <100 > 254

10
The MCL cast one 4”x 8” specimen from each sample for SR meter testing at multiple ages. Table 9 shows the average test results for the three mixtures. As expected, the Surface Resistivity (or resistance to chloride ion penetration) increased with age due to cement and fly ash hydration. The three mixtures were classified under the same category at the same ages. However, the SR meter results from RCC were higher than the other two mixtures at 28 and 56 days.
Table 9: Surface Resistivity Test Results
Cell 6 Cell 5 RCC SR Meter Chloride Ion Penetration Classification
7 Day 15.3 14.1 --- Moderate 28 Day 23.0 23.4 34.3 Low 56 Day 37.6 43.1 44.3 Very Low
Based on several published research studies (2,3), the SR meter results correlate extremely well with RCPT results. However, the major advantage of the SR meter is it takes less than 5 minutes to take readings. RCPT test (including the sample preparation) takes more than 2 days to perform. States such as Florida and Louisiana (3) have already realized the significant cost savings associated with the SR meter test and have started implementing it in their specifications. AASHTO recently published a provisional test method for this test: Surface Resistivity Indication of Concrete’s Ability to Resist Chloride Ions Penetration (AASHTO TP 95).
Heat Signature (Calorimeter) The hydration of cementitious materials results in a number of exothermic chemical reactions. These processes can be monitored by measuring the total heat liberated over time. The heat generated during early hydration reactions of cementitious materials can be measured using a calorimeter (4). Adiacal is a commercially available Semi-Adiabatic calorimeter that can be used in the field to monitor the hydration reaction. The amount of heat liberated by cement hydration greatly depends on the chemical and physical properties of the cementitious materials and admixtures used in the concrete mix. Other concrete mix proportions and curing conditions also play important roles, and deviations in the quantitiesor characteristics of the concrete materials can be detected by monitoring the heat of hydration. Figure 6 shows a picture of a commercially available calorimeter.
Figure 6: Semi-Adiabatic Calorimeter

Results One 4" x 8" specimen was cast from each sample from concrete mixtures used in Cell 5 and Cell 6. The results are presented in Figure 7 in which the x-axis shows time, and the y-axis shows the concrete specimen temperature. Generally, the heat signature curves are interpreted by visually comparing with each other. The area underneath the heat signature curve is indicative of strength gain. Mixtures with higher cement factors generate more heat (larger area underneath the heat signature curve) at early ages. Figure 7 indicates that the heat signature curves for each mixture were consistent. The peak times of hydration for Cell 6 and Cell 5 mixtures were close (about 8 hours). However, the Cell 6 mixture had a higher heat of hydration (104-106F) compared to Cell 5 mixture (98-101F). This is surprising since concrete mixtures from Cell 6 and Cell 5 had similar cement and fly ash contents. But that was not reflected in the heat signature curves.
Figure 7: Calorimeter Test Results (Heat Signature Curves)
Non Destructive Pavement Thickness (MIT Scan T2) MNDOT specifications requires the contractor to do probing during construction and perform coring and measure core lengths after construction to determine pavement thickness. MIT Scan T2 is a non destructive, easy to use device to determine pavement thickness accurately. The MIT Scan T2 requires a metal target to be pre-placed on the top of the base prior to taking any measurements. The MIT device detects the plate and pulse induction technology is utilized to determine the thickness of the concrete pavement. Before concrete was placed in Cell 6, three metal targets were placed on the open graded base at random locations (Figure 8). The targets were nailed (three nails each) to the base to prevent them from being displaced during concrete placement. After the concrete was placed, the pavement thickness measurements were taken using the MIT Scan T2 at the three locations. MnROAD staff took cores at the same locations to verify the MIT Scan T2 measurements. Due to

12
the smaller size panels in Cell 5, tie bars were placed at smaller intervals so targets were not placed in this cell (The Scan T2 does not work well if the targets are within 2 ft of any metal).
Figure 8: Metal target placed on the Open Graded Base.
Table 10 shows the MIT Scan T2 measurements and the actual core lengths measured at the same locations. There was an excellent correlation between the two measurements. The maximum difference between Scan T2 and core measurements was 0.07 inches. Even though pavement thickness was measured at only three locations during this field work, there is data published elsewhere which shows that the MIT Scan T2 is accurate over a wide variety of pavement thicknesses (5).
Table 10: Pavement Depth Measurements using MIT Scan T2
Date of Paving Core Length
Measurements, inches
MIT Scan T2 Pavement Thickness,
Inches
Difference, inches
Cell 6 (Non 8-18 Gradation)
6.03 5.96 0.07 6.52 6.47 0.05 6.17 6.18 -0.01
This data shows that MIT Scan T2 can be used in lieu of taking cores for measuring pavement thickness. MIT Scan T2 offers several benefits such as cost savings, faster measurements (can take measurements as soon as the pavement can be walked upon), a larger number of locations and finally, it eliminates the need to cut cores on new pavements and thereby reducing the need to patch the core holes. CONSTRUCTION ACTIVITIES Figure 9 and 10 show the construction activities during construction of Cell 6 and 5 respectively.
Metal Target

13
Figure 9: Cell 6 Construction
Figure 10: Cell 5 Construction

14
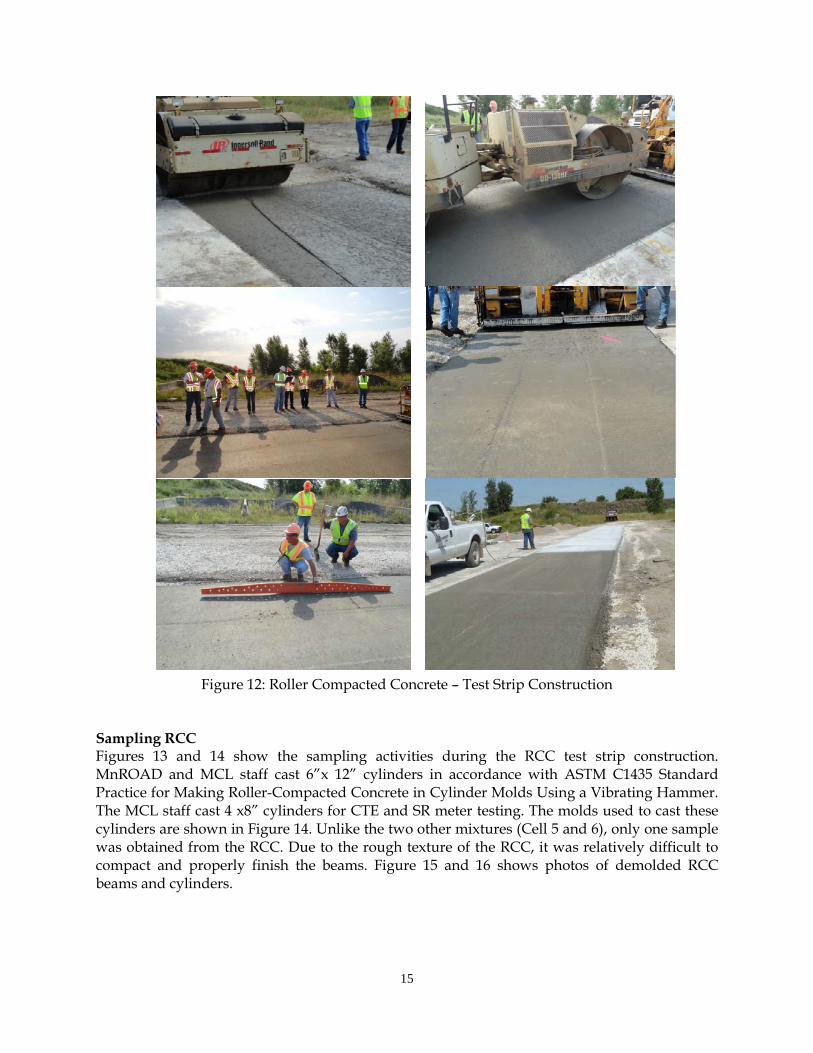
Roller Compacted Concrete Test Strip Figures 11 and 12 show the various activities that took place during the RCC test strip placement. There were several personnel from MNDOT, contractor and local testing laboratories to witness the RCC test strip placement. Asphalt equipment was used to pave a 4” RCC test strip. The paving part of the operation went well without any segregation issues. However, at the beginning, roller compaction did not give a smooth finish and there was variability in density of the pavement (measured using nuclear gage). After each pass, there was almost a wave like profile. At the beginning, the contractor tried using vibrating and pneumatic rollers. However, neither of them gave a good finish. Towards the middle of the test strip, a static roller was used to perform the compaction and it did a better job. It was decided to use the static roller to construct the RCC shoulders at MnROAD.
Figure 11: Roller Compacted Concrete – Test Strip Construction
15
Figure 12: Roller Compacted Concrete – Test Strip Construction
Sampling RCC Figures 13 and 14 show the sampling activities during the RCC test strip construction. MnROAD and MCL staff cast 6”x 12” cylinders in accordance with ASTM C1435 Standard Practice for Making Roller-Compacted Concrete in Cylinder Molds Using a Vibrating Hammer. The MCL staff cast 4 x8” cylinders for CTE and SR meter testing. The molds used to cast these cylinders are shown in Figure 14. Unlike the two other mixtures (Cell 5 and 6), only one sample was obtained from the RCC. Due to the rough texture of the RCC, it was relatively difficult to compact and properly finish the beams. Figure 15 and 16 shows photos of demolded RCC beams and cylinders.

16
Figure 13: Roller Compacted Concrete – Sampling and Preparing specimens
Figure 14: RCC Specimen Preparation
Figure 15: RCC - Beam (2 Lifts) Figure 16: RCC – Cylinder (4 Lifts)

17
COMPOSITE PAVEMENT TEST SECTIONS Three composite pavement test sections (cells) were constructed at MnROAD in 2010 to study/understand the behavior of composite pavements. This work was part of a SHRP 2 project titled “R21: Composite Pavement Systems”. The MCL performed testing on concrete from this project in 2010 and the results were documented in a MCL field report (6). Figure 17 shows the pavement design for the three composite pavement sections. In 2011, the MCL staff performed the tensile bond strength testing on the PCC/PCC test sections (Cell 71 and Cell 72). This section of the report details the test results from this testing.
Figure 17: Composite Pavements Project: Test Sections Typically, the tensile bond strength test is used to:
• Determine the near surface tensile strength of the substrate as an indicator of the adequacy of surface preparation before application of a repair or overlay material.
• Bond strength of a repair or an overlay materials to the substrate • The tensile strength of a repair of overlay material to the substrate.
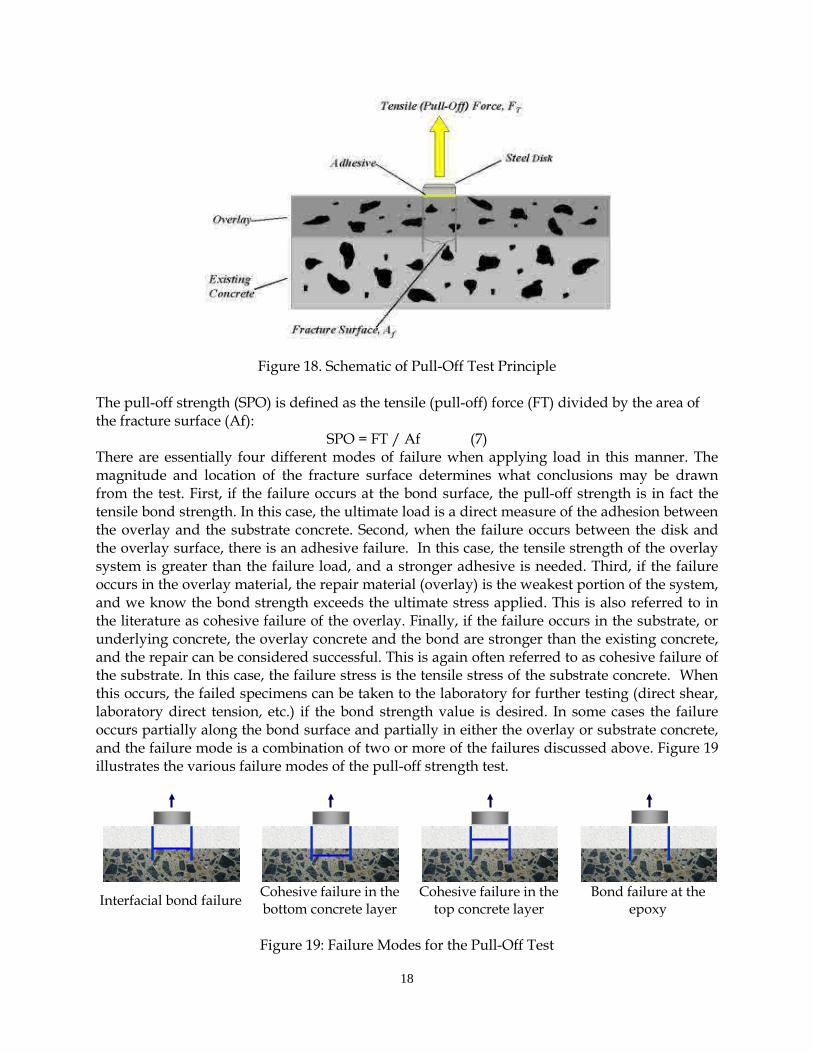
In this project, since both the PCC layers for the composite sections were placed at the same time (wet on wet), the goal was to ensure that a cold joint did not exist between the two layers and the layers acted as a composite section. It is essential for the longevity and good performance of the composite pavement that there is not a cold joint between the two layers. The ASTM standard test method for the Tensile Bond Strength test is ASTM C1583-04 (Standard Test Method for Tensile Strength of Concrete Surfaces and the Bond Strength or Tensile Strength of Concrete Repair and Overlay Materials by Direct Tension (Pull-off Method)). TENSILE BOND STRENGTH / PULL-OFF TEST (7) The pull-off test involves applying a direct tensile load to a partial core advanced through the overlay material and into the underlying concrete until failure occurs. The tensile load is applied to the partial core through the use of a metal disk with a pull pin, bonded to the overlay with an epoxy. A loading device with a reaction frame applies the load to the pull pin. The load is applied at a constant rate, and the ultimate load is recorded. Figure 18 illustrates the principle of the pull-off test.
Cell 70 Cell 71 Cell 72
3" HMA 3" PCC Exposed Agg
3" PCC Exposed Agg
6" PCC Recycled
6" PCC Recycled
6" PCC Low Cost
8" Class 5 8" Class 5 8" Class 5
Clay Clay Clay
18
Figure 18. Schematic of Pull-Off Test Principle The pull-off strength (SPO) is defined as the tensile (pull-off) force (FT) divided by the area of the fracture surface (Af):
SPO = FT / Af (7) There are essentially four different modes of failure when applying load in this manner. The magnitude and location of the fracture surface determines what conclusions may be drawn from the test. First, if the failure occurs at the bond surface, the pull-off strength is in fact the tensile bond strength. In this case, the ultimate load is a direct measure of the adhesion between the overlay and the substrate concrete. Second, when the failure occurs between the disk and the overlay surface, there is an adhesive failure. In this case, the tensile strength of the overlay system is greater than the failure load, and a stronger adhesive is needed. Third, if the failure occurs in the overlay material, the repair material (overlay) is the weakest portion of the system, and we know the bond strength exceeds the ultimate stress applied. This is also referred to in the literature as cohesive failure of the overlay. Finally, if the failure occurs in the substrate, or underlying concrete, the overlay concrete and the bond are stronger than the existing concrete, and the repair can be considered successful. This is again often referred to as cohesive failure of the substrate. In this case, the failure stress is the tensile stress of the substrate concrete. When this occurs, the failed specimens can be taken to the laboratory for further testing (direct shear, laboratory direct tension, etc.) if the bond strength value is desired. In some cases the failure occurs partially along the bond surface and partially in either the overlay or substrate concrete, and the failure mode is a combination of two or more of the failures discussed above. Figure 19 illustrates the various failure modes of the pull-off strength test.
Figure 19: Failure Modes for the Pull-Off Test
Interfacial bond failure Cohesive failure in the
bottom concrete layer Cohesive failure in the
top concrete layer Bond failure at the
epoxy

19
Pull-Off Testing On August 18th, MnROAD personnel drilled six cores each at Cell 71 and 72 for the pull-off tests. Cell 71 was constructed with 3” overlay with an Exposed Aggregate Concrete surface (EAC) over 6” of Recycled Concrete Aggregate (RCA) mixture and Cell 72 was constructed with 3” EAC overlay over 6” of Low Cost Concrete (LCC). On Cell 72, the Exposed Aggregate surface was left intact since last year. However, on Cell 71, the Exposed Aggregate surface was diamond ground to yield two different texture patterns; innovative diamond grind (referred to as the Next Generation Concrete Surface (NGCS)) on the driving lane and conventional diamond grind on the passing lane (Figure 20 and 21).
Figure 20: Surface Texture Cell 71 Figure 21: Surface Texture Cell 72
The MCL staff used Proceeq’s DYNA Z15 to perform all the pull-off Tests. Figures 22 to 27 show the various steps involved in performing the pull-off test. Detailed procedure to conduct the pull-off testing is included in the Appendix B. Pull off testing was performed on the passing lanes of Cell 71 and Cell 72. The weather conditions were windy and testing on both the cells was performed on the same day.
Figure 22: Drill a Partial Core Figure 23: Prepare the Surface

20
Figure 24: Apply Epoxy to the surface
of the Core Figure 25: Glue the Pull
Pins to the Core
Figure 26: Adjust the legs of the Tensile
Bond Tester so that it is level Figure 27: Apply Tensile Load at a constant rate
Pull-Off Test Results Tables 11 and 12 show the pull-off test results from Cell 72 and Cell 71 respectively. Figures 28 and 29 show the fractured cores of the pull-off tests from both the cells.
Table 11: Pull-Off Results for Cell 72
Cell 72 (Exposed Aggregate over Low Cost Concrete)
Core ID Tensile Strength, psi Location of Fracture/Comments Average Core
length, inches
A1 319 below interface in substrate concrete 3.4
A2 348 predominantly along the bond surface
and partially in the substrate 3.3
A3 435 in the top layer 2.0
A4 508 in the top layer
A5 334 partially along the interface between the
two layers and partially in the substrate 3.2
A6 261 below interface in substrate concrete 3.6
Note: Core Lengths are average of three readings

21
Table 12: Pull-Off Results for Cell 71
Cell 71 (Exposed Aggregate over Recycled Concrete Aggregate)
Core ID Tensile Strength, psi
Location of Fracture / Comments Average Core length, inches
B1 -- bond failure at the surface - epoxy --
B2 -- bond failure at the surface - epoxy ---
B3 290 below interface in substrate concrete 3.4
B4 189 below interface in substrate concrete 3.5
B5 261 below interface in substrate concrete - pulled off aggregate 3.8
B6 276 At the interface 3.3 Note: Core Lengths are average of three readings
Figure 28: Fractured cores– Cell 72- EAC/LCC Figure 29: Fractured cores - Cell 71 – EAC/RCA
Test Results Interpretation
• The tensile bond strength results of all the tests were higher than 150 psi, which is generally considered very good bond strength. In fact, except for test #B4 (Table 12), results of all the tests at both the cells were equal to or higher than 260 psi. Based on these results, it can be said that the composite pavement layers in Cell 72 and Cell 71 were well bonded and there was no cold joint between the layers.
• Except for A3 and A4, failures occurred either in the substrate concrete or partly at the interface and partly in the substrate concrete. This shows that the EAC concrete is stronger than the concrete in the bottom layers (either RCA or LCC). This is expected, since based on the testing from 2010, the EAC has significantly higher strength than the bottom layers.

22
• In the case of A3 and A4, fracture occurred in the EAC layer and the tensile strengths of both the tests were significantly higher (435 psi and 508 psi) than other tests shown in Table 11 and 12 (348 psi or lower). Based on this, it appears that the partial cores at A3 and A4 did not advance beyond the interface of the two layers. This could be due to the EAC layer having greater thickness at A3 and A4 locations. This is also supported by the fact that A3 and A4 were adjacent to each other. Therefore, at A3 and A4 tensile stress was only applied to the EAC layer, because the pavement was not cored deep enough, and so fracture took place at the weakest point in the EAC layer. The high tensile strength at A3 and A4 are due to the high strength of the EAC layer.
• The standard deviations of the four tests in Cell 72 (excluding the A3 and A4 tests) and the four tests in Cell 71 were low which shows good repeatability of the test. The average tensile strength of four tests of Cell 72 was 326 psi and that of the four tests in Cell 71 was 254 psi. This shows that LCC layer was slightly stronger than the RCA layer. The higher amount of flyash in the LCC mixture compared to the RCA mixture could be the reason for the higher strength.
• Tests B1 and B2 had epoxy failure. The diamond grind texture in this cell provided smaller surface area for the epoxy and may have contributed to the failure. Figure 30 shows photos related to these tests.
Figure 30: Cell 71 - Epoxy Failure due to the texture of the surface
SAND PATCH TEST MCL staff performed sand patch tests (ASTM E965) on the various surfaces at Cell 71 and 72 to measure the Mean Texture Depth (MTD). Table 13 shows the results of sand patch tests conducted at Cell 72. Three of the tests on Cell 72 were conducted close to the pull-off test locations in the passing lane and two were performed in the driving lane. In the driving lane, there was a lot of paste at the location of the tests and so the MTD was quite low. Figure 31 and 32 show the sand patch tests in Cell 72 in the passing and driving lanes respectively.

23
Table 13: Results of Sand Patch Test conducted at Cell 72
Section A (Cell 72) East Test
# Mean Texture Depth, inches
Comments
1 0.03 Exposed Aggregate Surface, Passing lane, Close to A2 Pull-Off test 2 0.02 Exposed Aggregate Surface, Passing lane, Close to A3 Pull-Off test 3 0.03 Exposed Aggregate Surface, Passing lane, Close to A6 Pull-Off test 4 0.02 Driving lane - considerable paste on the surface 5 0.02 Driving Lane
Figure 31: Sand Patch Test Cell 72,
Passing Lane Figure 32: Sand Patch Test Cell 72,
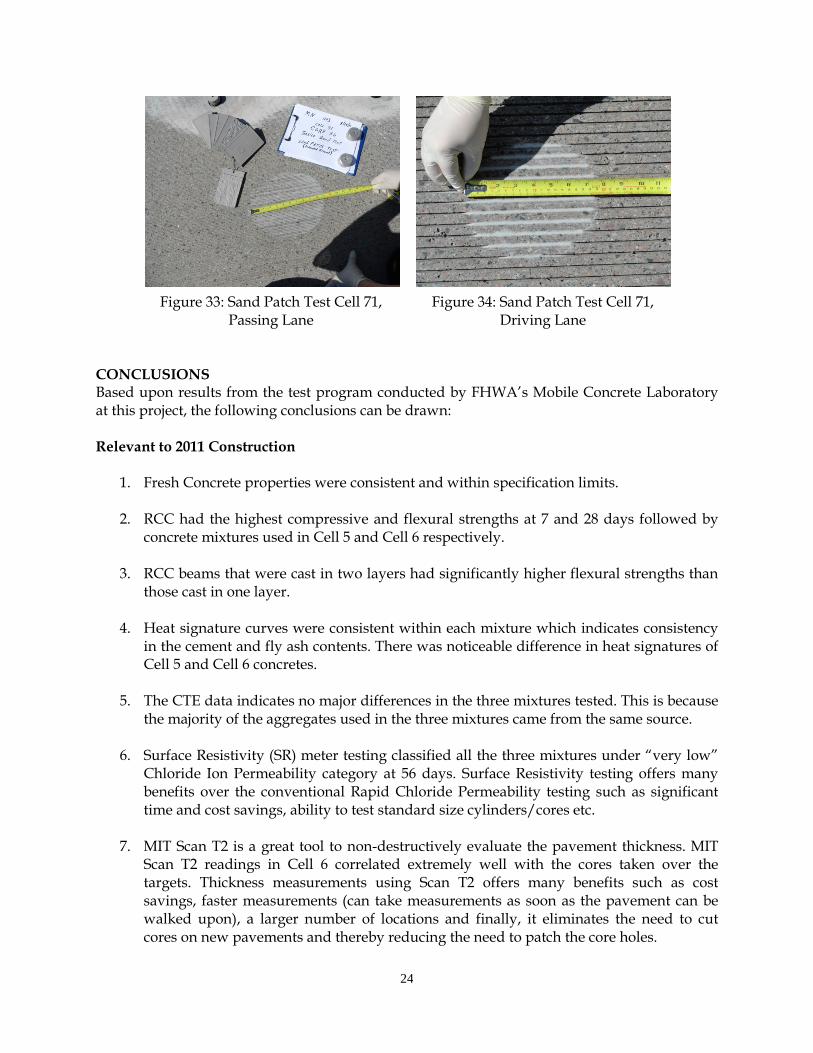
Driving Lane Table 14 shows the sand patch tests results from Cell 71. Due to the difference in surface texture between the two lanes, there was also quite a difference in the MTD. The NGCS in the driving lane had a considerably higher MTD compared to the conventional diamond ground surface on the passing lane in Cell 71 and the EAC surface in Cell 72. Figure 33 and 34 show the sand patch tests at Cell 71.
Table 14: Results of Sand Patch Test conducted at Cell 71
Section B (Cell 71) West Test # Mean Texture
Depth, inches Comments
1 0.02 Conventional diamond grind, Passing Lane, Close to B2 Pull-Off test 2 0.03 Conventional diamond grind, Passing Lane, Close to B2 Pull-Off test 3 0.02 Conventional diamond grind, Passing Lane, Close to B6 Pull-Off test 4 0.05 Innovative diamond grind (NGCS), Driving Lane 5 0.05 Innovative diamond grind (NGCS), Driving Lane
24
Figure 33: Sand Patch Test Cell 71,
Passing Lane Figure 34: Sand Patch Test Cell 71,
Driving Lane CONCLUSIONS Based upon results from the test program conducted by FHWA’s Mobile Concrete Laboratory at this project, the following conclusions can be drawn:
Relevant to 2011 Construction
1. Fresh Concrete properties were consistent and within specification limits. 2. RCC had the highest compressive and flexural strengths at 7 and 28 days followed by
concrete mixtures used in Cell 5 and Cell 6 respectively.
3. RCC beams that were cast in two layers had significantly higher flexural strengths than those cast in one layer.
4. Heat signature curves were consistent within each mixture which indicates consistency in the cement and fly ash contents. There was noticeable difference in heat signatures of Cell 5 and Cell 6 concretes.
5. The CTE data indicates no major differences in the three mixtures tested. This is because the majority of the aggregates used in the three mixtures came from the same source.
6. Surface Resistivity (SR) meter testing classified all the three mixtures under “very low” Chloride Ion Permeability category at 56 days. Surface Resistivity testing offers many benefits over the conventional Rapid Chloride Permeability testing such as significant time and cost savings, ability to test standard size cylinders/cores etc.
7. MIT Scan T2 is a great tool to non-destructively evaluate the pavement thickness. MIT Scan T2 readings in Cell 6 correlated extremely well with the cores taken over the targets. Thickness measurements using Scan T2 offers many benefits such as cost savings, faster measurements (can take measurements as soon as the pavement can be walked upon), a larger number of locations and finally, it eliminates the need to cut cores on new pavements and thereby reducing the need to patch the core holes.

25
Relevant to 2010 Construction
8. Based on the Pull-Off tests, it appears that there was not a cold joint between the PCC/PCC layers and they are acting as a composite pavement. The average bond strength for Cell 72 and Cell 71 were 326 psi and 254 psi. The Low Cost Concrete Mixture (Cell 72) has slightly stronger tensile strength than the Recycled Concrete Aggregate Mixture (Cell 71). This could be due to the higher fly ash content in the LCC mixture.
9. Based on the fracture locations and magnitude of the tensile strengths, the EAC layer was stronger than the bottom layers (both LCC and RCA).
ACKNOWLEDGEMENTS The MCL personnel would like to thank the following individuals from MnROAD/MNDOT for their assistance during the field project: Tim Clyne, Steve Olson, Jack Herndon, Melissa Cole, Bernard Izevbekhai, Alexandra Akkari, and John Pantelis. Note: Majority of the strength tests, CTE tests, SR meter tests were performed by Nicolai Morari, pull-off tests were performed by Jon Anderson, and heat signature tests were performed by Jagan Gudimettla. Other activities such as casting the specimens etc were performed by all the MCL personnel. REFERENCES
1. MnROAD 2011 Reconstruction and Repair of PCC Mainline Cells 5, 6, 63, & 96, Email communication from Tim Clyne, MnROAD.
2. Kessler, Powers, Vivas, Paredes, Virmani, “Surface Resistivity as an Indicator of Concrete Chloride Penetration Resistance”, 2008 Concrete Bridge Conference.
3. Rupnow, Icenogle, “Evaluation of Surface Resistivity Measurements as an Alternative to the Rapid Chloride Permeability Test for Quality Assurance and Acceptance”, Louisiana Transportation Research Center Project Report, July 2011.
4. Wang, Ge, Grove, Ruiz, Rasmussen, Developing a Simple and Rapid Test for Monitoring the Heat Evalution of Concrete Mixtures for Both Laboratory and Field Applications National Concrete Pavement Technology Center Report, January 2006.
5. Grove, Jones, Ye, Gudimettla, “Non-Destructive Pavement Thickness Measurement-It Really Works!” Transportation Research Board, 2012.
6. Composite Pavements Project, MnROAD 2010, FHWA MCL Field Project Report #MN1101.
7. Tensile Bond Strength of a High Performance Concrete Bridge Deck Overlay, FHWA MCL Project Report #SD9904.

26
APPENDIX A Concrete Mixture Design

27

28

29
APPENDIX B
Pull Off Test – Procedure The general procedure for performing a pull-off test can be summarized as follows: 1. Abraid the surface of the concrete in the test-area with a carbide stone or wire brush to remove any laitance and deposits. This aids in achieving sufficient bond between the steel disk and the overlay surface. 2. Advance a partial core (typically 50mm diameter) through the overlay, and a minimum of 25mm (or ½ core diameter) into the substrate concrete. Care should be taken to ensure that the core is advanced perpendicular to the overlay surface to minimize eccentricities during loading. 3. After the top of the partial core has been cleaned and dried (pressurized air is helpful), bond a metal disk (typically 50mm diameter) to the surface of the partial core with a fast-setting epoxy. Avoid applying too much epoxy, as excess will run down the sides of the core and possibly bond the core to the sides of the core-hole. Again, care should be taken to ensure that the disk is bonded to the middle of the partial core to minimize the potential for loading eccentricities. 4. After the epoxy has cured properly, attach the loading device to the metal disk. The loading device with its reaction frame should be adjusted to ensure that the load is applied parallel to the axis of the core. Some reaction frames have adjustable legs for this purpose. 5. Apply the tensile load to the core at approximately 0.1kN per second until the specimen fails. Record the failure load, as well as the failure mode and fracture location.