2011 fy financial results presentation · aciaria gusa nordeste brazil 1.2m tpy long products 2011...
TRANSCRIPT
2011 FY Financial Results Presentation April, 2012

Disclaimer
2
The materials contained in this document (together, the “Presentation”) has been prepared by OJSC KOKS (the “Company”) and are given in
conjunction with a live presentation and should not be taken out of context.
Some of the information in this Presentation may contain projections or other forward-looking statements regarding future events or the future financial
performance of the Company. You can identify forward looking statements by terms such as "expect", "believe", "anticipate", "estimate", "intend", "will",
"could," "may" or "might" the negative of such terms or other similar expressions. The Company wishes to caution you that these statements are only
predictions and that actual events or results may differ materially. The Company does not intend to update these statements to reflect events and
circumstances occurring after the date hereof or to reflect the occurrence of unanticipated events. Many factors could cause the actual results to differ
materially from those contained in projections or forward-looking statements of the Company, including, among others, general economic conditions, the
competitive environment, risks associated with operating in Russia, rapid technological and market change in the industries the Company operates in, as
well as many other risks specifically related to the Company and its operations.
Neither this Presentation nor any copy of it may be taken or transmitted, directly or indirectly, into the United States, Australia, Canada, Japan or the
Russian Federation. This Presentation does not constitute or form part of any offer or invitation to sell, or any solicitation of any offer to purchase or
subscribe nor shall it (or any part of it) or the fact of its distribution, form the basis of, or be relied on in connection with, any contract therefor. The offer
and the distribution of these materials and other information in connection with the listing and offer in certain jurisdictions may be restricted by law and
persons into whose possession any document or other information referred to herein comes should inform themselves about and observe any such
restriction. Any failure to comply with these restrictions may constitute a violation of the securities laws of any such jurisdiction.
This Presentation is not an offer for sale of any securities in the United States. Securities may not be offered or sold in the United States or to, or for the
account or benefit of, U.S. person (as defined in Regulation S under the Securities Act of 1933) absent registration or an exemption from registration
under the U.S. Securities Act of 1933. The Company has not registered and does not intend to register any portion of any offering in the United States or
to conduct a public offering of any securities in the United States.
The Presentation is only addressed to and directed at persons in member states of the European Economic Area who are “qualified investors” within the
meaning of Article 2(1)(e) of the Prospectus Directive (Directive 2003/71/EC) (“Qualified Investors”). In addition, in the United Kingdom, the Presentation
is being distributed only to, and is directed only at, Qualified Investors (i) who have professional experience in matters relating to investments falling
within Article 19(5) of the Financial Services and Markets Act 2000 (Financial Promotion) Order 2005 (the “Order”) and Qualified Investors falling within
Article 49(2)(a) to (d) of the Order, and (ii) to whom it may otherwise lawfully be communicated (all such persons together being referred to as “Relevant
Persons”). The Presentation must not be acted on or relied on (i) in the United Kingdom, by persons who are not Relevant Persons, and (ii) in any
member state of the European Economic Area other than the United Kingdom, by persons who are not Qualified Investors.
44,259
9,159
3,027 4,216
55,589
8,283
1,227
6,762
0
10 000
20 000
30 000
40 000
50 000
60 000
Revenue EBITDA Net income Capex
2010
2011
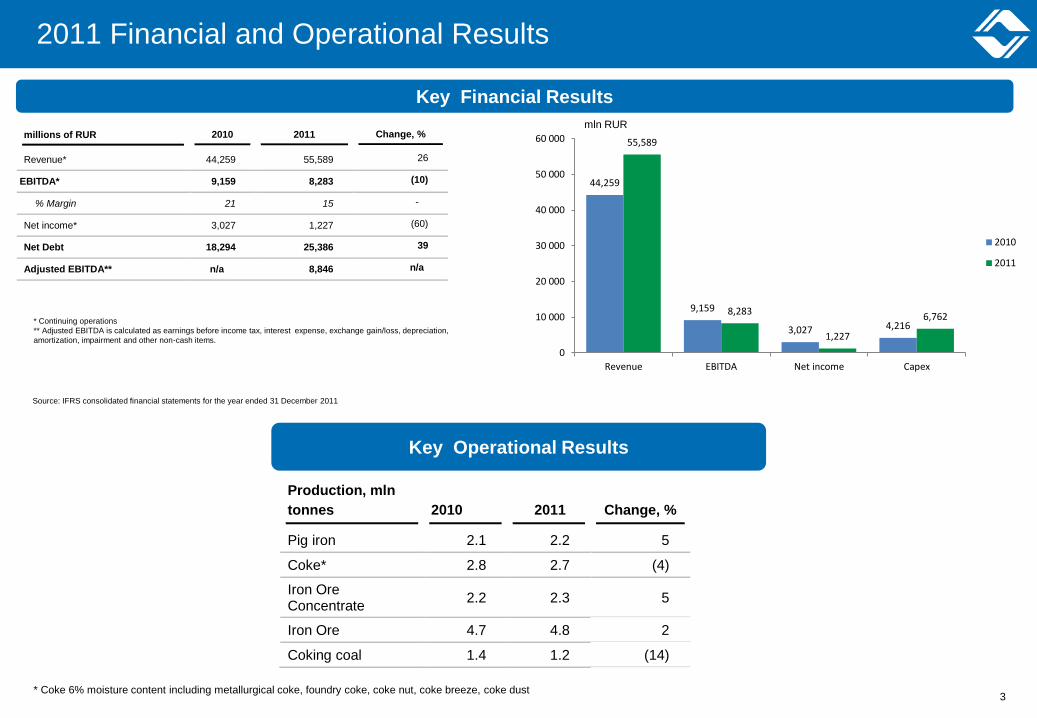
millions of RUR 2010 2011 Change, %
Revenue* 44,259 55,589 26
EBITDA* 9,159 8,283 (10)
% Margin 21 15 -
Net income* 3,027 1,227 (60)
Net Debt 18,294 25,386 39
Adjusted EBITDA** n/a 8,846 n/a
2011 Financial and Operational Results
Key Financial Results
mln RUR
Key Operational Results
Production, mln
tonnes
2010
2011
Change, %
Pig iron 2.1 2.2 5
Coke* 2.8 2.7 (4)
Iron Ore Concentrate
2.2 2.3 5
Iron Ore 4.7 4.8 2
Coking coal 1.4 1.2 (14)
* Continuing operations
** Adjusted EBITDA is calculated as earnings before income tax, interest expense, exchange gain/loss, depreciation,
amortization, impairment and other non-cash items.
* Coke 6% moisture content including metallurgical coke, foundry coke, coke nut, coke breeze, coke dust 3
Source: IFRS consolidated financial statements for the year ended 31 December 2011
9,159 8,283
266
17,901
10,885 1,789
24,748
30,301
4,711 1,058
6,003
5,233
0
10000
20000
30000
40000
50000
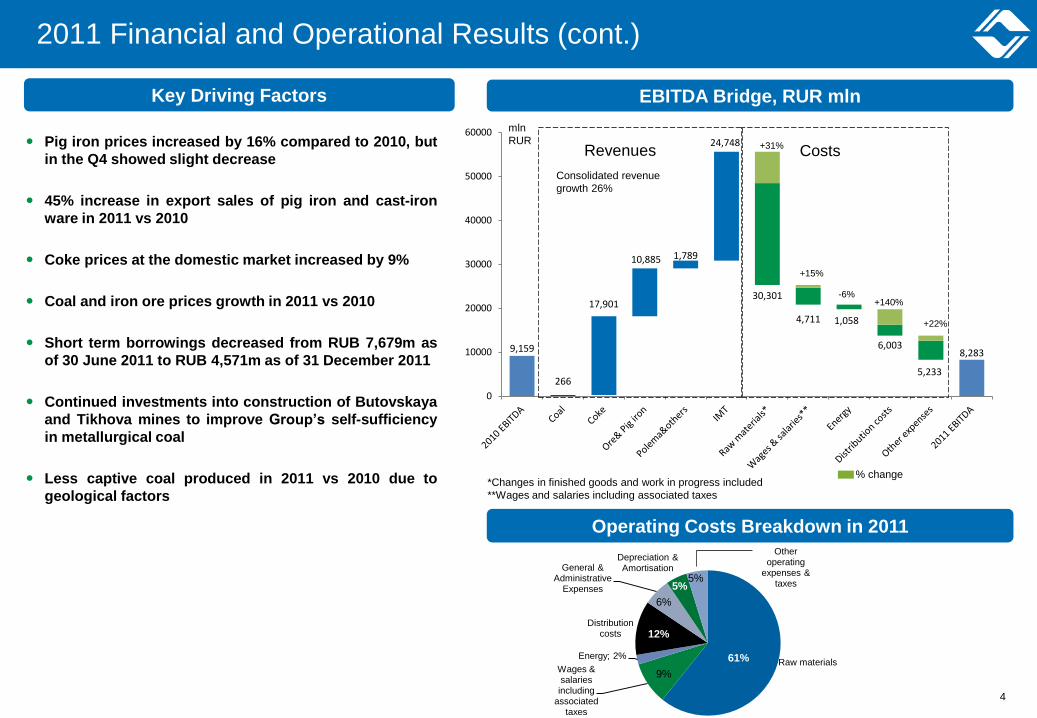
60000 Pig iron prices increased by 16% compared to 2010, but
in the Q4 showed slight decrease
45% increase in export sales of pig iron and cast-iron
ware in 2011 vs 2010
Coke prices at the domestic market increased by 9%
Coal and iron ore prices growth in 2011 vs 2010
Short term borrowings decreased from RUB 7,679m as
of 30 June 2011 to RUB 4,571m as of 31 December 2011
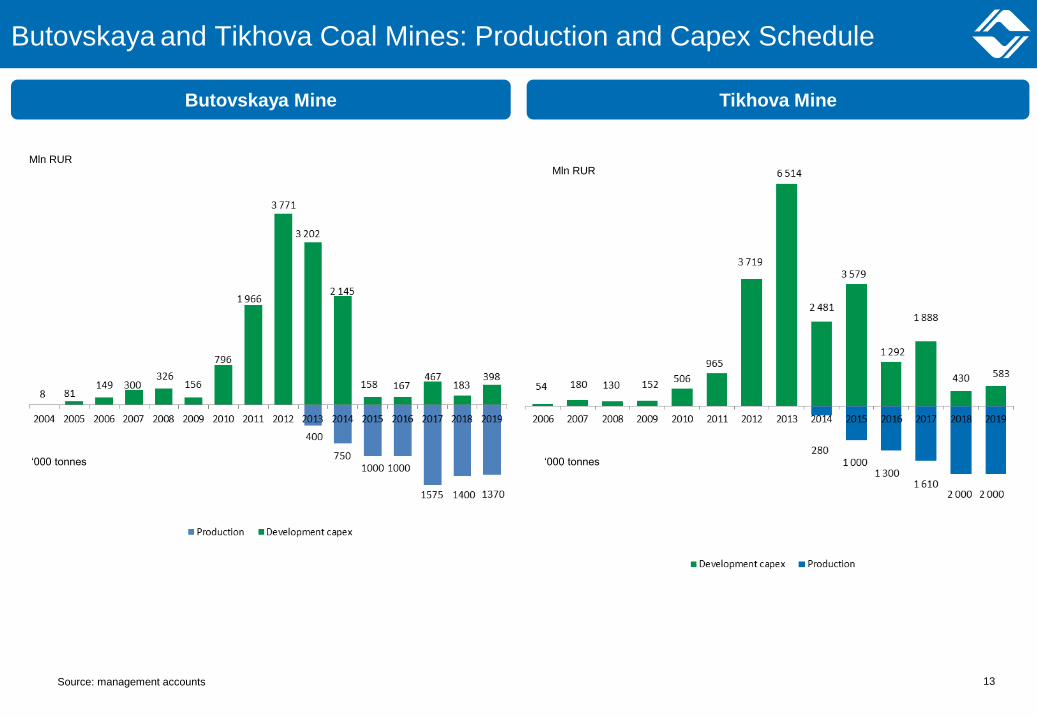
Continued investments into construction of Butovskaya
and Tikhova mines to improve Group’s self-sufficiency
in metallurgical coal
Less captive coal produced in 2011 vs 2010 due to
geological factors
2011 Financial and Operational Results (cont.)
4
Key Driving Factors
Consolidated revenue
growth 26%
EBITDA Bridge, RUR mln
Operating Costs Breakdown in 2011
*Changes in finished goods and work in progress included
**Wages and salaries including associated taxes
Revenues Costs
% change
+31%
+15%
+140%
+22%
-6%
mln
RUR
4
Raw materials Wages & salaries including
associated taxes
Energy; 2%
Distribution costs
General & Administrative
Expenses
Depreciation & Amortisation
Other operating
expenses & taxes
61%
5% 5%
6%
12%
9%

Segmental Overview
External revenue, % EBITDA by segments
2011 total: RUR 8,283 mln
2010 total: RUR 9,159 mln
EBITDA margin, %
2011 total:
55,589
2010 total:
44,259
5
32% 38%
20%
55%
4%
4%
44%
3%
0%
10%
20%
30%
40%
50%
60%
70%
80%
90%
100%
2011 2010
IMT
Polema & other
Ore & Pig iron
Coke22%
31%
44%
-1%
4%
-20
0
20
40
60
80
100
120
2011
Coal Coke Ore & Pig Iron Polema & other IMT
9.8%
50.8%
36.7%
2.7%
0,0
20,0
40,0
60,0
80,0
100,0
120,0
2010
Coal Coke Ore & Pig Iron Polema, IMT, & other
17
7
12 10
1 0
2
4
6
8
10
12
14
16
18
Coal Coke Ore & Pig Iron Polema IMT
0
20
40
60
80
100
120
2011 2010
Export Domestic
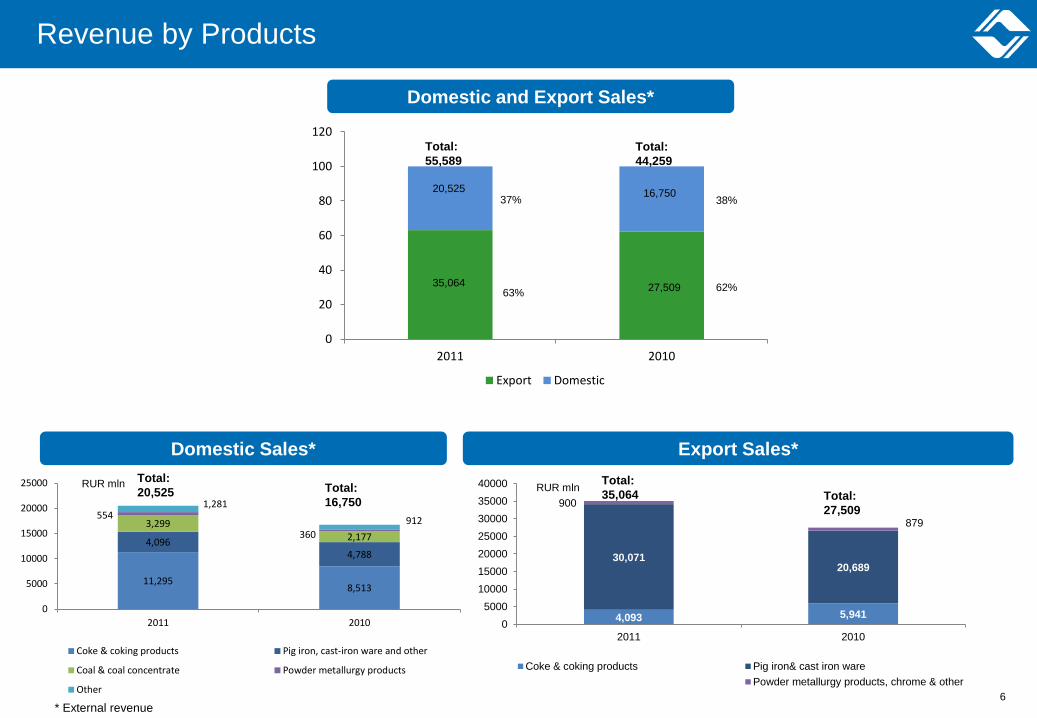
4,093 5,941
30,071 20,689
900
879
0
5000
10000
15000
20000
25000
30000
35000
40000
2011 2010
Coke & coking products Pig iron& cast iron ware
#REF! Powder metallurgy products, chrome & other
11,295 8,513
4,096 4,788
3,299
2,177
554
360
1,281
912
0
5000
10000
15000
20000
25000
2011 2010
Coke & coking products Pig iron, cast-iron ware and other
Coal & coal concentrate Powder metallurgy products
Other
Revenue by Products
Domestic Sales* Export Sales*
RUR mln RUR mln
Domestic and Export Sales*
* External revenue
35,064 27,509
20,525 16,750 37%
63%
38%
62%
Total:
55,589
Total:
44,259
Total:
35,064 Total:
27,509
Total:
20,525 Total:
16,750
6
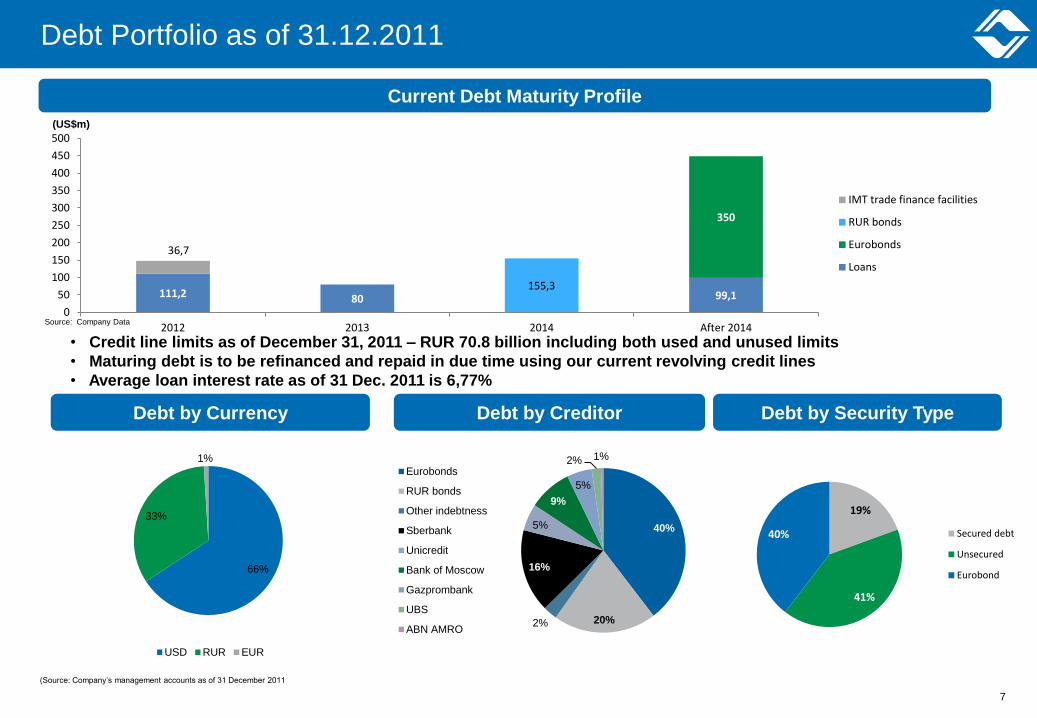
111,2 80 99,1
350
155,3
36,7
0
50
100
150
200
250
300
350
400
450
500
2012 2013 2014 After 2014
IMT trade finance facilities
RUR bonds
Eurobonds
Loans
Debt Portfolio as of 31.12.2011
Current Debt Maturity Profile
Debt by Currency
(Source: Company’s management accounts as of 31 December 2011
(US$m)
Source: Company Data
Debt by Creditor
• Credit line limits as of December 31, 2011 – RUR 70.8 billion including both used and unused limits
• Maturing debt is to be refinanced and repaid in due time using our current revolving credit lines
• Average loan interest rate as of 31 Dec. 2011 is 6,77%
66%
33%
1%
USD RUR EUR
40%
20% 2%
16%
5%
9%
5%
2% 1%
Eurobonds
RUR bonds
Other indebtness
Sberbank
Unicredit
Bank of Moscow
Gazprombank
UBS
ABN AMRO
Debt by Security Type
19%
41%
40% Secured debt
Unsecured
Eurobond
7

Overview of Key Financials
Income Statement Highlights Balance Sheet Highlights
millions of RUR 2010 2011
Revenue* 44,259 55,589
Cost of sales* (32,065) (39,570)
Gross profit* 12,194 16,019
Gross profit margin
28% 29%
Operating profit* 6,394 5,743
Operating profit margin
14% 10%
Net Income * 3,027 1,227
Adjusted EBITDA n/a 8,846
millions of RUR
December 31,
2010
December 31,
2011
Total Assets 52,022 56,618
Total Liabilities 31,974 35,033
Total Equity 20,048 21,585
Property Plant & Equipment 24,299 28,337
Total Debt 21,245 25,566
Cash & Cash Equivalents** 2,951 180
Net Debt 18,294 25,386
** Cash & cash equivalents including restricted cash
* Continuing operations
Cash Flow Highlights
millions of RUR 2010 2011
Profit before income tax 3,891 1,728
Operating cash flows before working capital changes
9,251 8,488
Net cash from operating activities of continuing operations
7,915 4,856
Net cash (used from)/ in investment activities
680 (6,251)
Net cash used in financing activities
(6,378) (1,623)
8
Source: IFRS consolidated financial statements for the year ended 31 December 2011
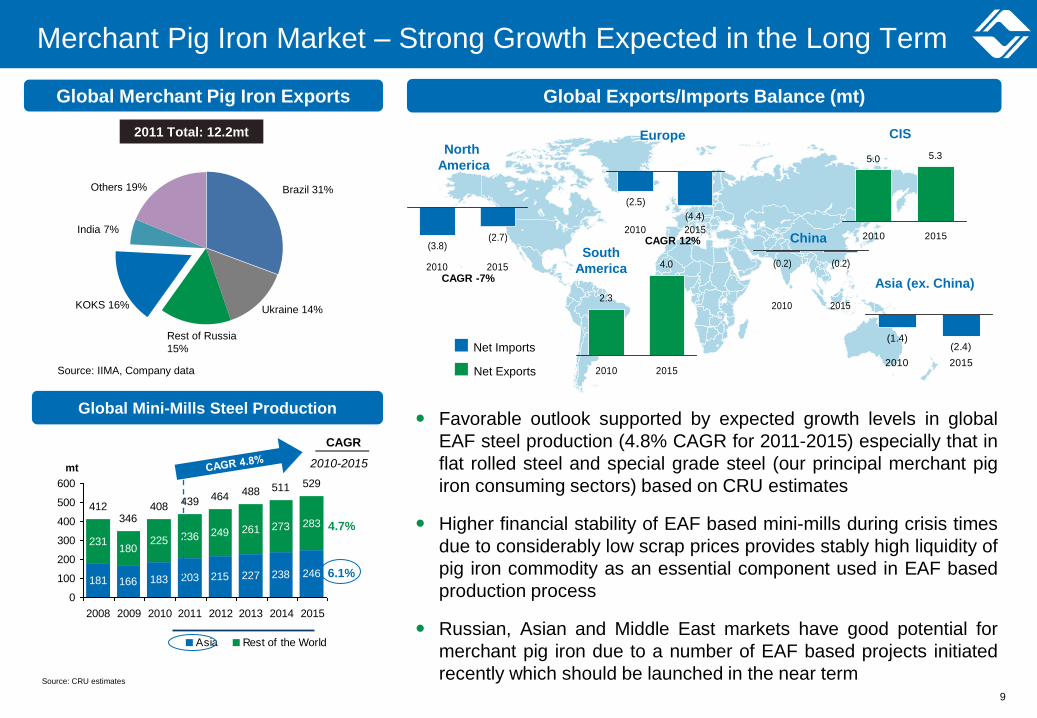
Source: CRU estimates
China (3.8)
(2.7)
2010 2015
2.3
4.0
2010 2015
5.0 5.3
2010 2015
(1.4)(2.4)
2010 2015
Europe
(2.5)
(4.4)
2010 2015
(0.2) (0.2)
2010 2015
Net Imports
Net Exports
South
America
CIS North
America
Asia (ex. China)
Favorable outlook supported by expected growth levels in global
EAF steel production (4.8% CAGR for 2011-2015) especially that in
flat rolled steel and special grade steel (our principal merchant pig
iron consuming sectors) based on CRU estimates
Higher financial stability of EAF based mini-mills during crisis times
due to considerably low scrap prices provides stably high liquidity of
pig iron commodity as an essential component used in EAF based
production process
Russian, Asian and Middle East markets have good potential for
merchant pig iron due to a number of EAF based projects initiated
recently which should be launched in the near term
CAGR -7%
CAGR 12%
Merchant Pig Iron Market – Strong Growth Expected in the Long Term
Global Exports/Imports Balance (mt)
181 166 183 203 215 227 238 246
231180
225 236 249 261 273 283
412346
408 439 464 488 511 529
0
100
200
300
400
500
600
2008 2009 2010 2011 2012 2013 2014 2015
Asia Rest of the World
4.7%
6.1%
CAGR
2010-2015
Global Mini-Mills Steel Production
mt
Global Merchant Pig Iron Exports
2011 Total: 12.2mt
KOKS 16% Ukraine 14%
Brazil 31% Others 19%
India 7%
Rest of Russia
15%
Source: IIMA, Company data
9
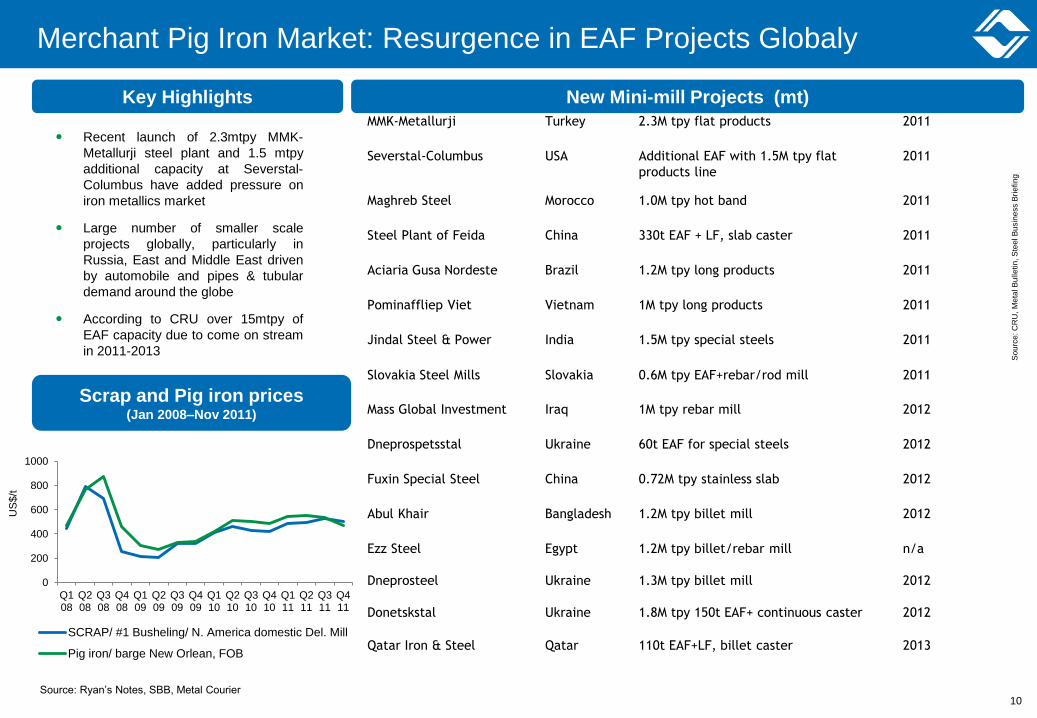
Steelmaker Location Main details Start-up
MMK-Metallurji Turkey 2.3M tpy flat products 2011
Severstal-Columbus USA Additional EAF with 1.5M tpy flat
products line
2011
Maghreb Steel Morocco 1.0M tpy hot band 2011
Steel Plant of Feida China 330t EAF + LF, slab caster 2011
Aciaria Gusa Nordeste Brazil 1.2M tpy long products 2011
Pominaffliep Viet Vietnam 1M tpy long products 2011
Jindal Steel & Power India 1.5M tpy special steels 2011
Slovakia Steel Mills Slovakia 0.6M tpy EAF+rebar/rod mill 2011
Mass Global Investment Iraq 1M tpy rebar mill 2012
Dneprospetsstal Ukraine 60t EAF for special steels 2012
Fuxin Special Steel China 0.72M tpy stainless slab 2012
Abul Khair Bangladesh 1.2M tpy billet mill 2012
Ezz Steel
Dneprosteel
Donetskstal
Egypt
Ukraine
Ukraine
1.2M tpy billet/rebar mill
1.3M tpy billet mill
1.8M tpy 150t EAF+ continuous caster
n/a
2012
2012
Qatar Iron & Steel
Qatar
110t EAF+LF, billet caster
2013
So
urc
e: C
RU
, M
eta
l B
ulle
tin
, S
tee
l B
usin
ess B
rie
fin
g
Recent launch of 2.3mtpy MMK-
Metallurji steel plant and 1.5 mtpy
additional capacity at Severstal-
Columbus have added pressure on
iron metallics market
Large number of smaller scale
projects globally, particularly in
Russia, East and Middle East driven
by automobile and pipes & tubular
demand around the globe
According to CRU over 15mtpy of
EAF capacity due to come on stream
in 2011-2013
Merchant Pig Iron Market: Resurgence in EAF Projects Globaly
New Mini-mill Projects (mt) Key Highlights
Scrap and Pig iron prices (Jan 2008–Nov 2011)
0
200
400
600
800
1000
Q108
Q208
Q308
Q408
Q109
Q209
Q309
Q409
Q110
Q210
Q310
Q410
Q111
Q211
Q311
Q411
SCRAP/ #1 Busheling/ N. America domestic Del. Mill
Pig iron/ barge New Orlean, FOB
US
$/t
Source: Ryan’s Notes, SBB, Metal Courier 10

So
urc
e: S
tee
l B
usin
ess B
rie
fin
g
Merchant Pig Iron Market: Resurgence in EAF Projects in Russia
Company/
Investor
Project
Region
EAF size; capacity
Main
products
Geographic
markets
Start‐up/ Status
Volga Electro-
metallurgical
Plant (VEMZ)
Volga
Electrometallurgi-
cal Plant (VEMZ)
Ivanovo 300,000 t/y Rebar Central federal
district
Q2 2012/ Under
Construction
NLMK Kaluga mini‐mill Kaluga 120t;
1.5m t/y
Rebar, light
sections
Central federal
district
2012/ Nearing
Completion
Ural Mining
and Metals (UGMK)
Tyumen
mill
Tyumen 70t;
0,55m t/y
Bars,
light sections
Regions of
Urals federal District
Early 2013/
Well Advanced
Severstal Balakovo
mini‐mill
Balakovo,
Saratov
120t; 1.1m
t/y
Rebar, light
sections
Volga + Central
federal districts
2013/
Construction ongoing
TMK Taganrog
Steel
Plant (Tagmet)
Taganrog,
Rostov
135t; 1m t/y Tube
rounds
Russia +
abroad
Q2 2013/
Construction ongoing
Novorosmetall Abinsk
Electrometallur-
gical Plant
Abinsk,
Krasnodar
territory
130t; 1.3m
t/y
Rebar Southern federal
district
Q4 2013/
Construction ongoing
Trabikum Ltd
(successor to
Maxi‐invest)
Tatstal Leninogorsk,
Tatarstan
120t; 1m t/y Rebar,
light sections
Tatarstan +
surrounding
regions
2014/
Construction underway
Investor unknown
(used to be Maxi‐
Invest)
Kovrov
plant
Kovrov,
Vladimir
120t;
1.2m t/y
Rebar, light
sections
Central + NW
federal districts
2014/ Construction yet
to begin
Ruspolymet Micro‐mill
Kulebaki,
Nizhny Novgorod
40t;
350,000 t/y
Rebar
Nizhny Novgorod
+ surrounds
Undecided
Stavropol
Steel
(Stavstal)
Rebar
rolling mill
Stavropol 350,000t/y Rebar, wire
rod
Southern +
North Caucasian
federal districts
Stage 1,
Q3 2012 //
500,000 t/y EAF
planned for stage 2
Moscow
government
Casting-rolling
plant
Yartsevo,
Smolensk
40t;
210,000 t/y
Rebar Regions of Central
federal district
Undecided
OMK Vyksa Steel Works Vyksa,Nizhny
Novgorod
160t; 1.5m
t/y
Thin slab for pipe
feed
All across Russia Undecided
Metallurgical Investment
Co
OHF replacement Chusovoy, Perm
territory
0.9‐1m t/y Spring steel All Russia Undecided
11
Source: Company data, RZhD statistics
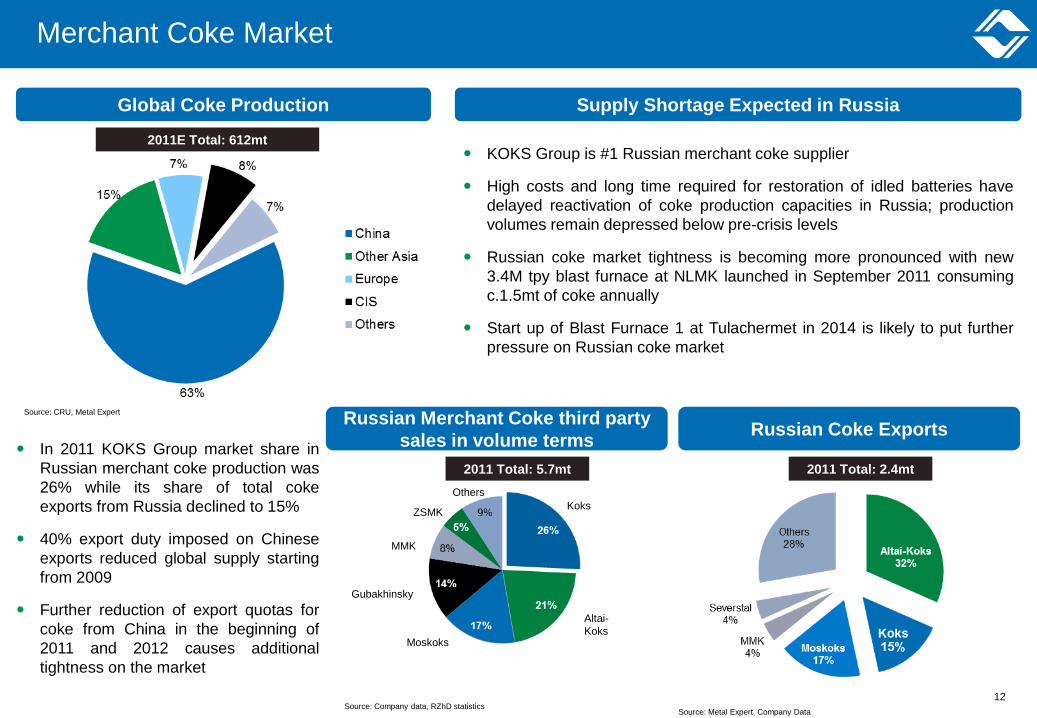
Merchant Coke Market
In 2011 KOKS Group market share in
Russian merchant coke production was
26% while its share of total coke
exports from Russia declined to 15%
40% export duty imposed on Chinese
exports reduced global supply starting
from 2009
Further reduction of export quotas for
coke from China in the beginning of
2011 and 2012 causes additional
tightness on the market
Russian Merchant Coke third party
sales in volume terms Russian Coke Exports
2011 Total: 5.7mt 2011 Total: 2.4mt
Source: CRU, Metal Expert
Global Coke Production
2011E Total: 612mt KOKS Group is #1 Russian merchant coke supplier
High costs and long time required for restoration of idled batteries have
delayed reactivation of coke production capacities in Russia; production
volumes remain depressed below pre-crisis levels
Russian coke market tightness is becoming more pronounced with new
3.4M tpy blast furnace at NLMK launched in September 2011 consuming
c.1.5mt of coke annually
Start up of Blast Furnace 1 at Tulachermet in 2014 is likely to put further
pressure on Russian coke market
Supply Shortage Expected in Russia
Koks
Gubakhinsky
Altai-
Koks
Others
Moskoks
MMK
Source: Metal Expert, Company Data
12
ZSMK
Цена
концентрата
Butovskaya and Tikhova Coal Mines: Production and Capex Schedule
Mln RUR
‘000 tonnes
Butovskaya Mine Tikhova Mine
Mln RUR
‘000 tonnes
Source: management accounts 13
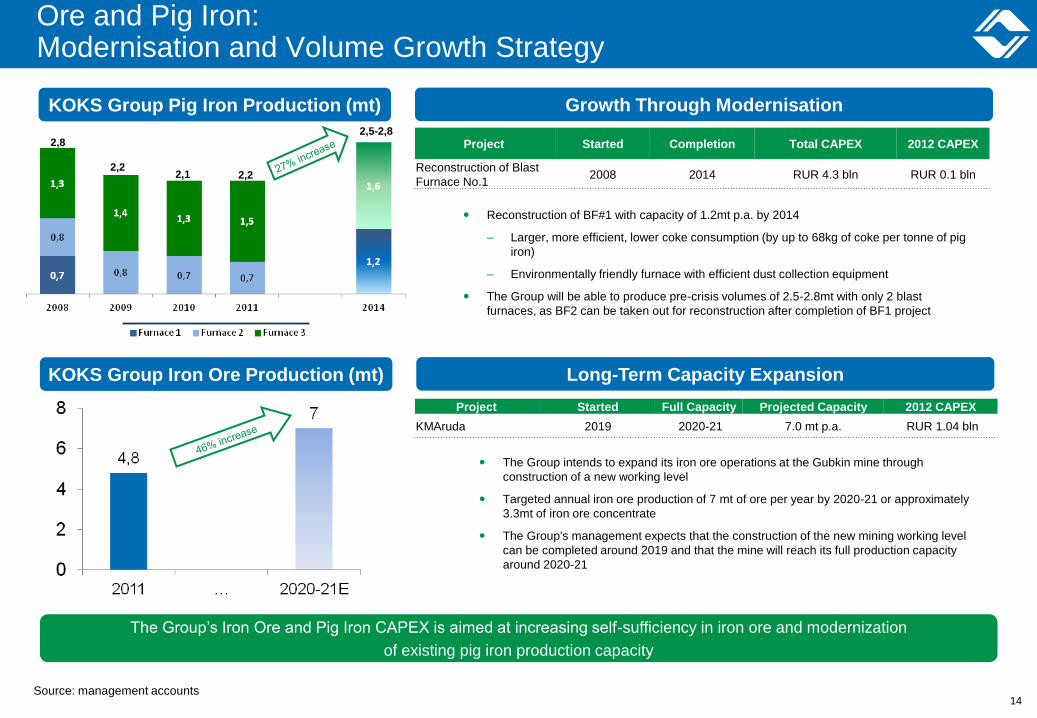
Ore and Pig Iron: Modernisation and Volume Growth Strategy
Growth Through Modernisation KOKS Group Pig Iron Production (mt)
Long-Term Capacity Expansion KOKS Group Iron Ore Production (mt)
The Group’s Iron Ore and Pig Iron CAPEX is aimed at increasing self-sufficiency in iron ore and modernization
of existing pig iron production capacity
Project Started Completion Total CAPEX 2012 CAPEX
Reconstruction of Blast
Furnace No.1 2008 2014 RUR 4.3 bln RUR 0.1 bln
Project Started Full Capacity Projected Capacity 2012 CAPEX
KMAruda 2019 2020-21 7.0 mt p.a. RUR 1.04 bln
14 Source: management accounts
2,5-2,8
2,2 2,2
2,1
2,8
Reconstruction of BF#1 with capacity of 1.2mt p.a. by 2014
– Larger, more efficient, lower coke consumption (by up to 68kg of coke per tonne of pig
iron)
– Environmentally friendly furnace with efficient dust collection equipment
The Group will be able to produce pre-crisis volumes of 2.5-2.8mt with only 2 blast
furnaces, as BF2 can be taken out for reconstruction after completion of BF1 project
The Group intends to expand its iron ore operations at the Gubkin mine through
construction of a new working level
Targeted annual iron ore production of 7 mt of ore per year by 2020-21 or approximately
3.3mt of iron ore concentrate
The Group's management expects that the construction of the new mining working level
can be completed around 2019 and that the mine will reach its full production capacity
around 2020-21
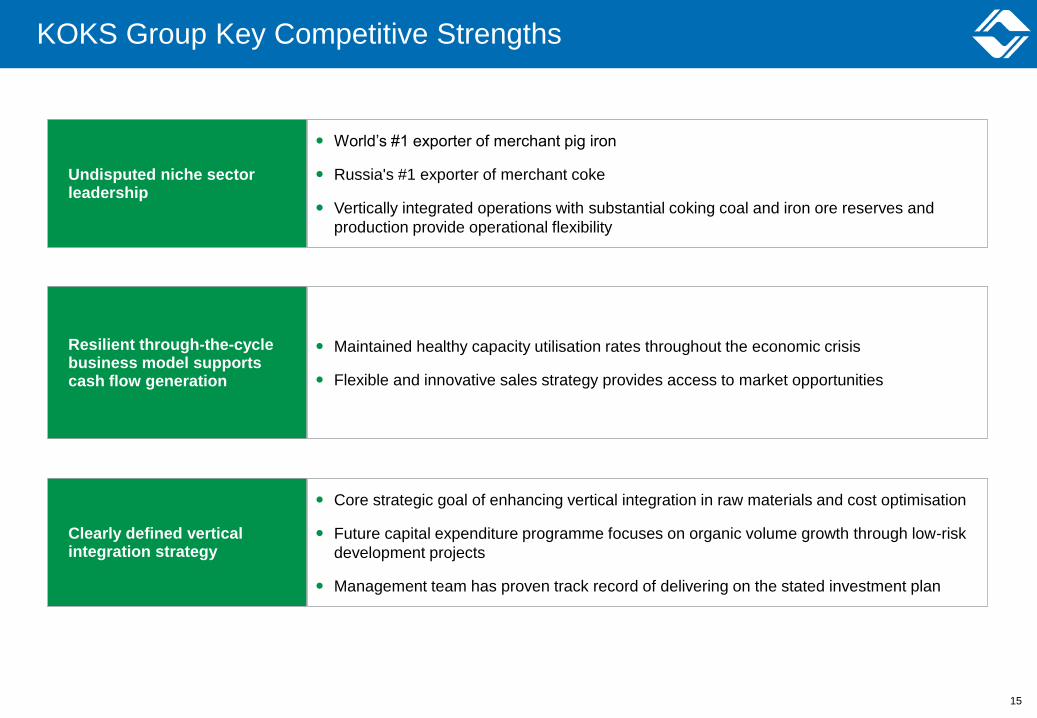
World’s #1 exporter of merchant pig iron
Russia's #1 exporter of merchant coke
Vertically integrated operations with substantial coking coal and iron ore reserves and
production provide operational flexibility
Undisputed niche sector leadership
Maintained healthy capacity utilisation rates throughout the economic crisis
Flexible and innovative sales strategy provides access to market opportunities
Resilient through-the-cycle business model supports cash flow generation
Core strategic goal of enhancing vertical integration in raw materials and cost optimisation
Future capital expenditure programme focuses on organic volume growth through low-risk
development projects
Management team has proven track record of delivering on the stated investment plan
Clearly defined vertical integration strategy
KOKS Group Key Competitive Strengths
15