2012 interim results - china mobile end-to-end quality control ... 1h 2011 1h 2012 61.8 58.8 mobile...
TRANSCRIPT

1

2
2012 Interim Results
China Mobile Limited
16 August 2012

3
Management Present
Executive Director & Chairman Mr. XI Guohua
Executive Director & CEO Mr. LI Yue
Executive Director, Vice President & CFO Mr. XUE Taohai

4
1
2
3
Agenda
Overall Results for 1H 2012
Operating Performance for 1H 2012
Financial Results for 1H 2012

5
1
Agenda
Overall Results for 1H 2012

6
Highlights
Customer Base Continued
Expanding while Voice
Business Maintained Growth
Customers over 680
million
Voice usage up 9.2%
Steady Growth in Operating
Performance despite
Various Challenges
Operating revenue up
6.6%
Net profit margin at
23.3%
Data services revenue
rose to 28.5% of total
revenue
Wireless data traffic
revenue up 51.6%
Accelerated Development in
3G and Good Progress in
TD-LTE Scale Trial
Experience of TD-LTE
featured businesses
received wide acclaim
3G customers reached 67
million, network utilization
up 4.7 ppt compared with
end of last year
Sustainable Development to
Create Shareholder Value
Dividend yield 3.9%
Note: Annualized dividend yield is calculated based on the closing share price as at 29 June, 2012
2012 interim dividend up
3.4% to HK$1.633 per
share
Fast Data Business
Development and Rapid Growth
in Wireless Data Traffic

7
Operating Revenue (RMB Billion) 250.080 266.530 6.6%
EBITDA (RMB Billion) 124.152 123.051 -0.9%
EBITDA Margin 49.6% 46.2% -3.4ppt
Net Profit (RMB Billion) 61.283 62.202 1.5%
Net Profit Margin 24.5% 23.3% -1.2ppt
Basic Earnings per Share (RMB) 3.05 3.10 1.4%
1H 2011 Change
Stable Growth in Operating Performance
1H 2012

8
Enlist Favorable Factors and Fare Changes in Environment
Changes in Business Environment
Rising mobile penetration with diminishing growth in traditional mobile
communications market
New focus of all-round competition for customer value
ICT industry integration brings business substitution and industry value transfer
Enlist Favorable Factors
Growing demand for information and communications across the society
Growth of data traffic and applications driven by Mobile Internet fuelled revenue
accretion
Government’s strong support and the accelerated development and maturity of
TD-LTE supply chain bring new impetus to future development
Advantages in years of operating experience, scale, network, brand, services
and talents, etc.

9
Network Build-out Market Operations
Strengthen Market Operations and Enhance Network Capability
Targeted response to market competition
Strengthen integrated marketing and improve
local marketing
Stabilize voice value and enhance value of data
traffic
Ensure reasonable share of volume growth and
commensurate targeted customer retention
Prudent and efficient investment in
marketing resources
Focus on high value and smartphone customers
Capitalize synergies of various channels
Co-ordinated business development, customer
retention and terminal sales
Improve marketing refinement
Precise segmentation of customer needs with
integrated marketing strategies
Implement end-to-end quality control
Enhance customer experience through “runways”
of network, platform and terminal, etc
Assure 2G network quality
Maintain voice advantage and alleviate
pressure of data traffic
Consummate 3G network build-out
Build premium network focusing on efficient use
of resources
Value WLAN network
Strengthen refined management to improve
efficiency and achieve traffic diversion
Focus on future TD-LTE
Promote industry maturity and get ready for
upgrade
Accelerate full service network reserves
Enhance metropolitan area network and
international transmission capabilities
Strengthen public Internet construction
Targeted and efficient support of business
development

10
Rational Investment Schedule
Scientific planning focusing on investment return and control of overall investment
Implement Four-Network Co-ordination strategy to assure leading network quality and improve
core competitiveness
Vigorous development of Mobile Internet and Internet of Things to foster new growth areas
Central planning and phased implementation to enhance infrastructure build-out and resource
reserve and to strengthen full service capabilities
CAPEX Structure CAPEX
1H 2011 1H 2012
2% 7%
6% 5%
19%
61%
2%
7% 6%
26%
49%
10%
(RMB Billion)
1H 2011 1H 2012
61.8 58.8
Mobile communications
networks Buildings &
infrastructure Support systems
Transmission Business
development
Others

11
Accelerated TD-LTE Scale Deployment
Terminal and Chipset Global Commercialization Deployment
Launched CPE (customer premise
equipment), MIFI and dongles, etc
Multi-mode terminals from various
manufacturers have passed trials, multi-
mode smartphone debut within this year
48 international operators and 30 equipment
manufacturers have joined the “Global TD-
LTE Initiative”
10 commercial networks and 52 trial
networks have officially launched worldwide
Successfully accomplished scale trial in “6+1” cities,
commenced expanded build-out
High acclaim for featured businesses such as high-definition
VOD, video surveillance and high-definition video
conferencing in Hangzhou and other cities
Realized two-way roaming between Hangzhou TD-LTE and
Hong Kong LTE FDD networks
Base stations will reach 20,000 with extended coverage to 13 cities. Over 90% effective coverage in key areas of Hangzhou, Shenzhen and Guangzhou
1H2012 2H2012 2013
High Acclaim and Strong Support from Government to Accelerate Development
Number of base stations will
reach 200,000 to realize
contiguous outdoor coverage in
data hotspots of prefectural level
and above cities

12
Execute Strategic Transformation and Promote Reform and Innovation
Reform and Innovation Strategic Transformation
Four-Network Co-ordination
Transform from voice-only to
“voice + data traffic + applications”
and operate the businesses at
reasonable network costs
Mobile Internet
Develop featured businesses,
forge capabilities and promote
professional operations to
ascertain achievements against
competition across the value
chain
Full Service
Construct high quality carrier
networks, adhere to wireless
broadband focusing on mobile
business to corner the new
market in information services
Organizational Reform
Establish organizational system
and new operational mechanism
commensurate with Mobile
Internet and full service
development
Talent Incentive
Focus on strategic objectives,
establish talent incentive
mechanism to meet development
needs
Innovation of Management
Promote centralization,
professional operations, market-
oriented mechanism, lean
organization and process
standardization to realize
scientific and refined
management
Strive to Create
Value for
Shareholders

13
2
Agenda
Operating Performance for 1H 2012

14
Innovation to Drive Enterprise
Sustainable Development “Customers, Our Priority;
Quality Service, Our Principle” “Quality is the Lifeline of a
Communications Company”
Enhanced Quality, Improved Services and Promoted Innovation
Successful voice call
connection rate well ahead
of competition
Considerable dip in
proportion of network quality
complaints
Significant improvement in
competitiveness of network
quality along railways
……
TD-LTE scale trial achieved
remarkable results
Continued expansion of
Mobile Market, “Wireless
City” and Internet of Things
applications
Construction of centralized
data center, call center, and
storage and logistics center
……
Launched anti-virus
software and measures to
block harmful messages
and spam SMS, etc
Continued to promote
services such as
transparent spending and
unified tariff plans
Customer complaints
remained lowest in the
industry
……

15
Total Customers Net Additional Customers
Continued Expanding Customer Base
(Million) (Million)
1H 2011 1H 2012
32.77
2.3%
14.33
33.51
15.87
3G
1H 2011 1H 2012
10.7%
616.79 683.08
35.03 67.08
3G
Net additional customer market share reached 47%, continued
to lead in the industry
Continued growth in customer base, medium and high-end
customer base remained stable
Corporate accounts increased to 3.34 million, where individual
customers took up 35% of total customers

16
Continued Growth of Voice Business
Exploited potential of segments such as long distance and
roaming to boost voice usage
Promoted Unified Go-tone Tariff to whet voice demand of
medium and high-end customers
Total Voice Usage Voice Services Revenue
(RMB Billion) (Billion Minutes)
1H 2011 1H 2012
177.128 2.2%
1H 2011 1H 2012
1,886.5 2,060.5
528 518
MOU (Minutes)
9.2% 173.231
17
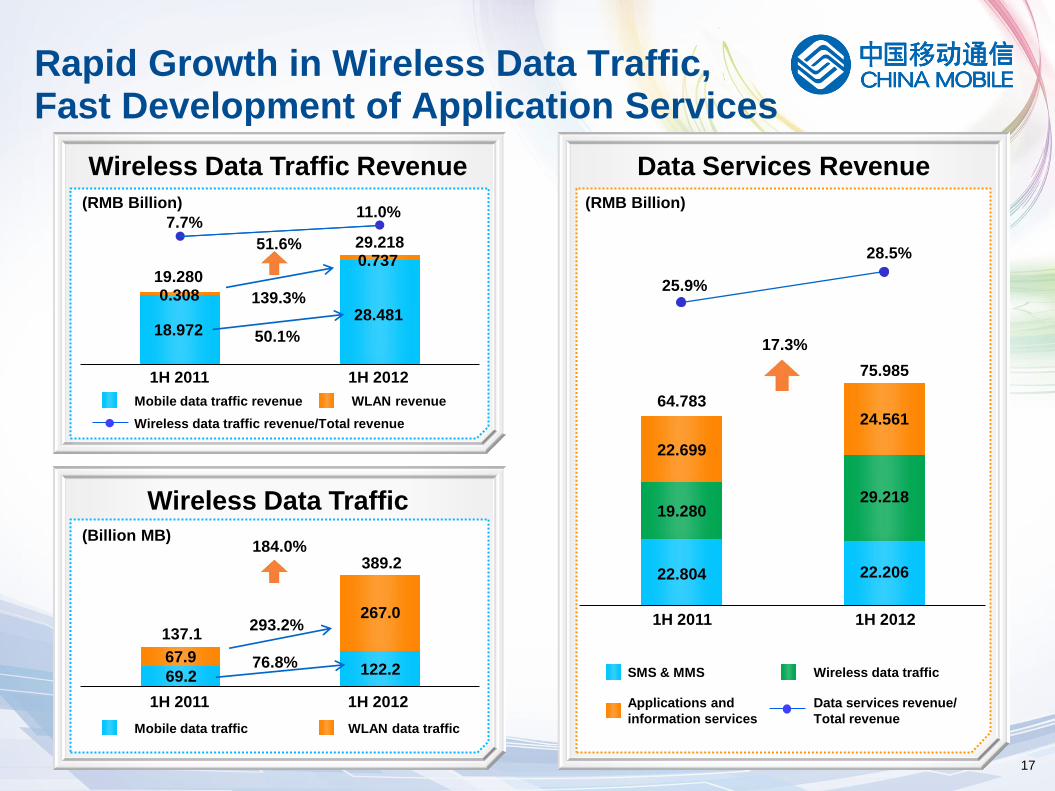
Rapid Growth in Wireless Data Traffic, Fast Development of Application Services
Data Services Revenue
(RMB Billion)
1H 2011 1H 2012
Applications and
information services
SMS & MMS Wireless data traffic
Data services revenue/
Total revenue
Wireless Data Traffic
Wireless Data Traffic Revenue
Wireless data traffic revenue/Total revenue
WLAN revenue Mobile data traffic revenue
1H 2011 1H 2012
1H 2011
0.308 19.280
29.218
7.7% 11.0%
0.737
1H 2012
18.972 28.481
51.6%
50.1%
(RMB Billion)
(Billion MB)
139.3%
WLAN data traffic Mobile data traffic
67.9
137.1
389.2
267.0
69.2 122.2
184.0%
293.2%
76.8%
17.3%
75.985
24.561
29.218
22.206
28.5%
64.783
22.699
19.280
22.804
25.9%

18
Build world-class wireless network –
wide and deep coverage, high quality and speed
Further Development of Four-Network Co-ordination
TD-SCDMA
TD-LTE WLAN
GSM
Essential component of wireless broadband
network, carry PC/handset Internet data
Constructed nearly 2.83 million APs which
carried 68.6% of total data traffic, effectively
offloaded the GSM network
Primarily carry voice traffic, moderately carry
handset data
Base stations reached 750,000 with network
utilization at ~72.4%. 2G network quality
leading edge
To carry high bandwidth, high quality wireless
broadband services in future, strive for
TDD/FDD integrated development
Good progress in scale trial, service
experience attained positive acclaim, strong
support from Government and industry
Primarily carry handset data, bolstering
existing and future networks
Built premium 3G network with nearly 240,000
base stations, network utilization reached
18.5%, handset data traffic up nearly 2.4 times

19
Steady Enhancement of
Network Capability
Expanding
Customer Base
Improving Competitiveness
of Terminals
Accelerated 3G Development
Net additional 3G customers
out-numbered 15 million to
reach a total of 67 million
Customer structure
optimized, proportion of
handset customers
continued to expand,
especially smartphone
customers
Early success in debut with
equitable quality, price and
schedule as handsets of
other 3G standards
Leapfrogged expansion in
the number of smartphone
models reaching 166, 126 of
which at ~RMB1,000
Nearly 70% of 3G handsets
sold were smartphones
Number of base stations
nearly 240,000, strengthened
contiguous coverage of large
and medium-sized cities and
effective coverage of hotspots
Network utilization enhanced
by 4.7 percentage points
compared with end of last
year
Wireless connection rate
stabilized at over 99.5%, call
drop rate remained below
0.6%

20
Satisfactory Development of “Wireless City”
Satisfactory Development
Portals in 321 cities online nationwide, with over
450 million cumulative clicks
Plan for 2012: 50 million active customers,
aggregate total of over 1 billion application
messages
Ample potential with Internet of Things, businesses
developing rapidly. Number of M2M terminals was
up >50% in 1H 2012, surpassing 17 million
Mobile
Internet
Internet of
Things “Wireless City”
Opportunity and platform to expand “Share of
Daily Life Services” for individual customers, and
“Share of Information Services” for companies
and industries
Conduit of industries
Anchor of Mobile Internet, Internet of Things and
cloud-based applications

21
Construct Smart Pipe, Build Open Platform,
Create Featured Businesses, Provide Integrated Interface
Rigorously Promote Development of Mobile Internet
Mobile Video Revenue
230
82.6% 420
(RMB Million)
Mobile Reading Revenue
284
76.8% 502
(RMB Million)
Mobile Mailbox Revenue
654
81.5% 1,187
(RMB Million)
Means to enhancing data traffic operation and
developing information services in the Mobile Internet
era, anchor for solidifying market share
The Company’s total terminal sales accounted for
RMB6.2 billion in 1H 2012, up by 2.8 times
Rapid growth of featured businesses
Mobile Gaming Revenue
(RMB Million)
1H 2011 1H 2012 1H 2011 1H 2012
1H 2011 1H 2012
Promote Professional Operations of Mobile Internet
Consumer-oriented sales platform,
developer-oriented service platform,
supply chain-oriented support platform
Cumulative registered customers over 200 million,
cumulative application downloads over 800 million
Mobile Market
Professional Terminal Operations
Lean organization
Market-oriented mechanism
Centralized resources
Professional operations
281
47.7% 415
1H 2011 1H 2012

22
International and Hong
Kong/Macau/Taiwan
Network Construction
Build Metropolitan
Area Network
Enhanced Full Service Capabilities
Plan and drive construction
of a number of submarine
cables including Fu-Dan
(福淡), Asia-Pacific, Middle
East, Western Europe,
Pacific Ocean
Drive construction of Hong
Kong/Guangdong, Zhuhai/
Macau, Sino-Vietnam,
Sino-Mongolia and other
cross-border transmission
systems on land
Drive establishment of
China Mobile Global
Network Center
Improve resource
capability and coverage
of metropolitan area
networks
Added 480,000 km of
metropolitan transmission
optical fiber cables
Coverage of municipal
roads and ducts further
enhanced
Focus on developing
dedicated line services for
corporate customers,
cumulative lines exceeded
635,000
Strengthen construction of
public Internet and reduce
interconnection costs
Actively promote IDC
construction and
development of web
cache business
Focus of Business
Development

23
Stepped forward in Professional Operations
Rapid establishment of global network
capability
Preliminary completion of international network
with core in Hong Kong, London and Los Angeles
Provided highly competitive products and
services
Leveraged on scale advantage to reduce
settlement costs and roaming charges, enhanced
customer experience and boosted voice usage
Added 15 new roaming discount zones, covering
key outbound routes
Actively expanded businesses such as
multinational corporation (MNC) customers and
international dedicated lines
Steady growth of international business
International business revenue reached ~RMB4
billion in 1H 2012, up 15%
Average cost of international outgoing calls down
by approximately 20%
China Mobile Group
Terminal Company Limited China Mobile International Limited
Growing influence over manufacturers
Basically achieved equitable quality, price and
schedule of debut between Samsung SIII and
models of other competing standards
Continued increase in the number of TD
terminals and chipset manufacturers, TD
handset inventory totaled 412 models
Continued enhancement in terminal
competitiveness
Duration of error-free functioning for products
significantly improved
3.5, 4-inch screen smartphones ahead of
competition, drubbed RMB500 and RMB800
price points respectively
Solid scale sales
Proprietary, social, and Internet channels
gradually strengthened
Centralized sales of 14 million TD handsets, of
which smartphones accounted for nearly 70%

24
Innovate on Energy-Saving Applications Promote Mature Technologies
Remarkable Results in “Energy Conservation & Emissions Reduction”
Strengthened new R&D pilots: completed pilot
applications for air conditioning smart control
over power-saving equipment and lithium iron
phosphate batteries, etc
Developed smart transportation and logistics,
and pursued precise scheduling to reduce
emissions
The Company’s power consumption
per frequency loading and per unit of
telecommunications traffic dipped 6%
and 12% YoY, respectively
Scale-promotion of “smart dormancy according
to frequency loading”, “compact base station
(with no equipment room)”, “natural resource
cooling” and other energy-saving technologies
Activated 7.43 million smart energy-saving
channels
Instated nearly 86,000 “natural resource cooling”
base stations
1H 2012 saved timber
27,400 m3

25
Looking to the Future
Growing penetration of mobile broadband and smart
terminals induce unlimited opportunities
Rapid growth of data traffic brings significant revenue
opportunities
Strive to establish a leading position in Mobile Internet
by constructing a smart pipe, building an open platform,
creating featured businesses and delivering an
integrated interface
Scope of communications extended to cover "People to
Things" and "Things to Things“, underpinning ample
potential
The >1 billion access points has expanded the scope of
development
Exploit advantages, provide cost-effective and
standardized products, serve various industries and
strive to become the industry leader in Internet of
Things
Mobile Internet to Continue Explosive Growth
Internet of Things to Bring about a New Techno-Economic Wave
Mobile
Changes Life

26
2
Agenda
Financial Results for 1H 2012 3

27
Wireless Data Traffic
Operating Revenue
Total Voice Usage
Total Customers
Steady Revenue Growth
1H 2011 1H 2012
137.1
389.2 184.0%
1H 2011 1H 2012
1,886.5 2,060.5 9.2%
1H 2011 1H 2012
616.79 683.08 10.7% (Million)
(Billion MB)
(Billion
Minutes)
(RMB Million)
1H 2011 1H 2012
250,080 266,530 6.6%

28
Basic EPS
EBITDA
Net Profit
Industry-leading Profitability
(RMB)
1H 2011 1H 2012
3.05 3.10 1.4%
(RMB Million)
61,283 62,202
24.5% 23.3%
1H 2011
1.5%
Note: Net profit for 1H 2012 included the share of profit of
Shanghai Pudong Development Bank (“SPD Bank”)
amounting to RMB2,867 million.
Net profit margin
1H 2012
(RMB Million)
1H 2011 1H 2012
124,152 123,051
49.6% 46.2%
-0.9%
EBITDA margin

29
Free Cash Flow
Net Cash Inflow from Operating Activities
Sound and Efficient
Capital Management
Strong cash flow
generating capability
Secure fund
management
Centralized fund
allocation
Strict and efficient
capital expenditure
management
Highly centralized
corporate financing
Prudent investment
strategies
Continued to
support favorable
business growth
Provided a solid
foundation for the
sustainable healthy
development of the
Company
Created value for
shareholders
Strong Cash Flow Continued
(RMB Million)
1H 2011 1H 2012
64,374 69,990
(RMB Million)
126,177 128,810
1H 2011 1H 2012

30
1H 2012
Operating Revenue Structure
Voice services revenue
Data services revenue
Other operating revenue Note: The above data are expressed as a percentage of
operating revenue
66.5%
28.5%
5.0%
2011
SMS & MMS
Revenue 8.3% 8.8% 9.1%
Wireless Data
Traffic Revenue 11.0% 8.4% 7.7%
Applications and
Information Services
Revenue
9.2% 9.2% 9.1%
Data Services
Revenue 28.5% 26.4% 25.9%
1H 2012 1H 2011
31
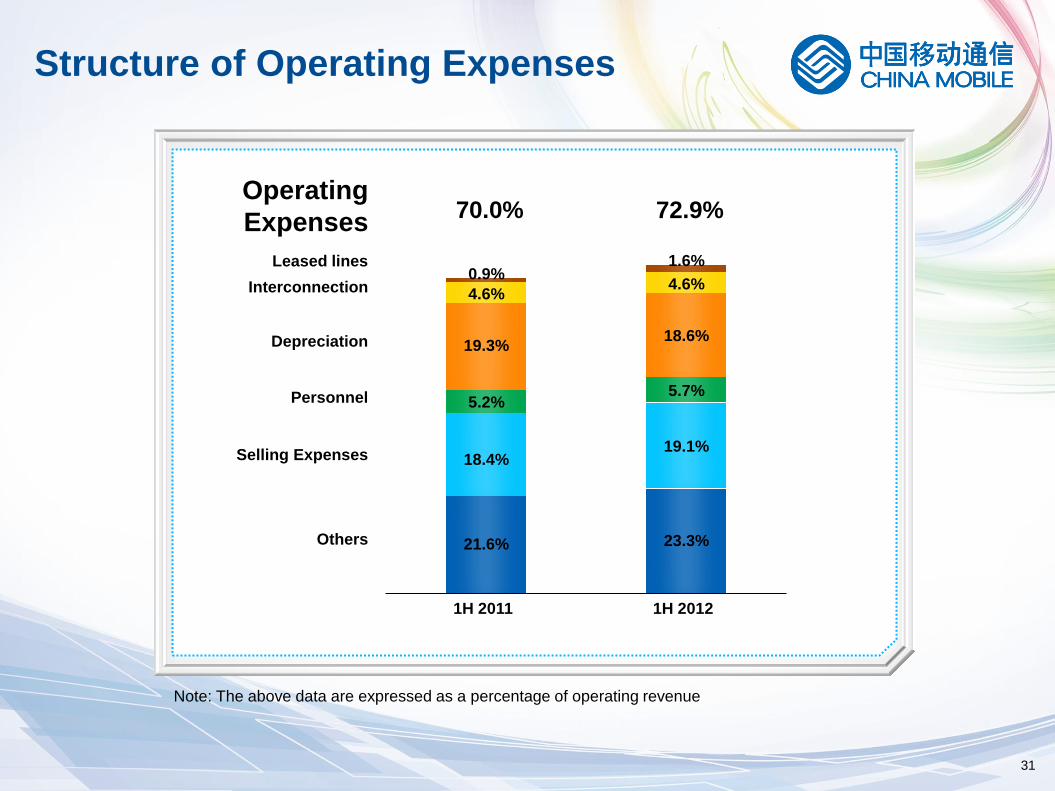
72.9% 70.0%
Structure of Operating Expenses
Note: The above data are expressed as a percentage of operating revenue
1H 2011 1H 2012
Operating
Expenses
Others
Personnel
Depreciation
Interconnection
Leased lines
Selling Expenses
4.6%
19.3%
5.2%
18.4%
21.6%
0.9% 4.6%
18.6%
5.7%
19.1%
23.3%
1.6%
32
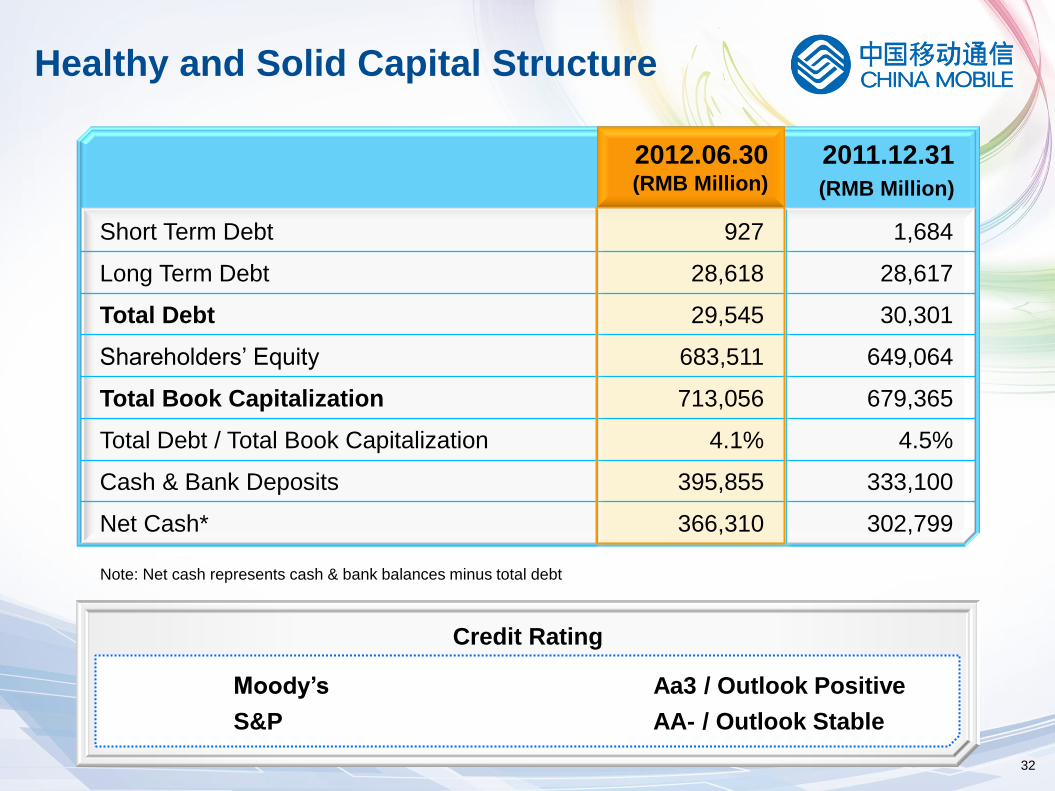
Credit Rating
Note: Net cash represents cash & bank balances minus total debt
Moody’s
S&P
Aa3 / Outlook Positive
AA- / Outlook Stable
Healthy and Solid Capital Structure
2011.12.31
(RMB Million)
Short Term Debt 927 1,684
Long Term Debt 28,618 28,617
Total Debt 29,545 30,301
Shareholders’ Equity 683,511 649,064
Total Book Capitalization 713,056 679,365
Total Debt / Total Book Capitalization 4.1% 4.5%
Cash & Bank Deposits 395,855 333,100
Net Cash* 366,310 302,799
2012.06.30 (RMB Million)

33
Thank You

34
Extracts from Unaudited Consolidated Statement of Comprehensive Income for the Six Months Ended 30 June 2012 – Appendix I
1H 2011 (RMB Million)
Operating Revenue
Voice Services 177,128 173,231
Data Services 75,985 64,783
Others 13,417 12,066
266,530 250,080
Operating Expenses
Leased Lines 4,208 2,295
Interconnection 12,298 11,379
Depreciation 49,652 48,361
Personnel 15,134 13,107
Selling Expenses 50,765 45,976
Other Operating Expenses 62,180 53,976
194,237 175,094
Profit from Operations 72,293 74,986
1H 2012 (RMB Million)
1H 2011 (RMB Million)
Profit from Operations
(cont’d) 72,293 74,986
Other Net Income 1,073 778
Non-operating Net Income 244 222
Interest Income 5,916 3,563
Finance Costs (221) (339)
Share of Profit of
Associates 2,867 2,016
Share of Profit / (Loss) of
Jointly Controlled Entity 1 (2)
Taxation (19,933) (19,854)
Profit for the Period 62,240 61,370
Attributable to:
Equity Shareholders of the
Company 62,202 61,283
Non-controlling Interests 38 87
Profit for the Period 62,240 61,370
1H 2012 (RMB Million)

35
Re-categorization of Revenue Components (1H 2010 - 1H 2012) – Appendix II
Operating Revenue 266,530 250,080 229,818
Voice Services 177,128 173,231 164,108
Data Services 75,985 64,783 56,098
SMS & MMS Revenue 22,206 22,804 22,656
Wireless Data Traffic Revenue 29,218 19,280 13,499
Applications and Information
Services Revenue 24,561 22,699 19,943
Others 13,417 12,066 9,612
1H 2012 (RMB Million)
1H 2011 (RMB Million)
1H 2010 (RMB Million)
Note: The Group re-categorized the presentation of revenue components in the consolidated statement of comprehensive income for the year ended
2011. The new presentation categorizes operating revenue into voice services revenue, data services revenue and other operating revenue.
Voice services revenue mainly includes the revenue derived from voice usage services and voice value-added services which were categorized
in value-added services fees in prior years' presentation. Data services revenue mainly includes revenue derived from SMS & MMS, wireless
data traffic and applications and information services.
This change in presentation has no effect on reported profit or loss, total income and expense or net assets, for any of the periods presented.

36
Extracts from Unaudited Consolidated Balance Sheet as at 30 June 2012 – Appendix III
2011.12.31
(RMB Million)
Current Assets 436,777 382,685
Non-current Assets 585,132 569,873
Total Assets 1,021,909 952,558
Current Liabilities (307,686) (273,244)
Non-current Liabilities (28,919) (28,895)
Total Liabilities (336,605) (302,139)
Net Assets 685,304 650,419
2012.06.30
(RMB Million)

37
2011
Operating Data – Appendix IV
Total Customers (Million) 683.08 649.57
MOU (Minutes) 518 525
ARPU (RMB) 67 71
Average Voice Services Revenue per Minute (RMB) 0.086 0.094
Total Voice Usage (Billion Minutes) 2,060.5 3,887.2
Wireless Data Traffic (Billion MB) 389.2 361.4
Including: Mobile Data Traffic (Billion MB) 122.2 161.0
SMS Usage (Billion Messages) 374.2 736.1
Average Monthly Churn Rate 3.21% 3.21%
1H 2012

38
Forward-looking Statement
Certain statements contained in this document may be viewed as “forward-looking statements” within the
meaning of Section 27A of the U.S. Securities Act of 1933, as amended, and Section 21E of the U.S.
Securities Exchange Act of 1934, as amended. Such forward-looking statements involve known and
unknown risks, uncertainties and other factors, which may cause the actual performance, financial
condition or results of operations of China Mobile Limited (the “Company”) to be materially different from
any future performance, financial conditions and results of operations implied by such forward-looking
statements. Further information regarding these risks, uncertainties and other factors is included in the
Company’s most recent Annual Report on Form 20-F filed with the U.S. Securities and Exchange
Commission (the “SEC”) and in the Company’s other filings with the SEC.