2012 sedc edd nc ceds final
TRANSCRIPT
7/30/2019 2012 Sedc Edd Nc Ceds Final
http://slidepdf.com/reader/full/2012-sedc-edd-nc-ceds-final 1/101
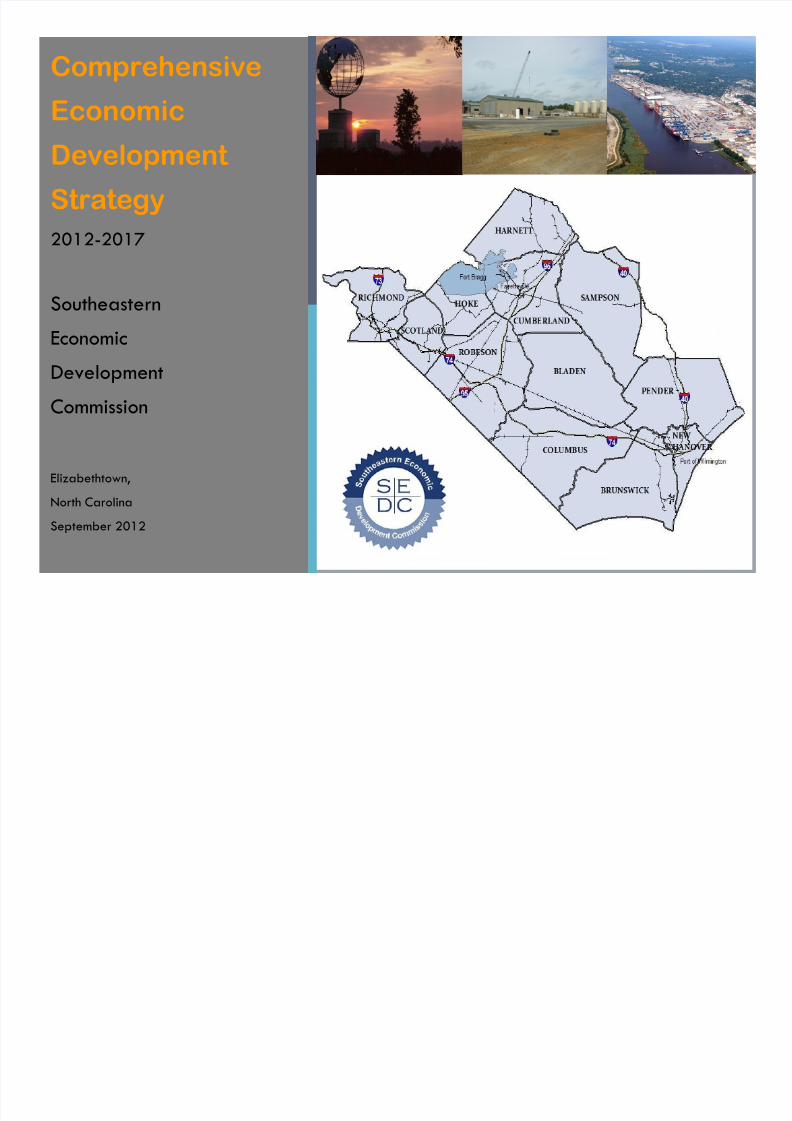
Comprehensive
Economic
Development
Strategy2012-2017
Southeastern
Economic
Development
Commission
Elizabethtown,
North Carolina
September 2012

7/30/2019 2012 Sedc Edd Nc Ceds Final
http://slidepdf.com/reader/full/2012-sedc-edd-nc-ceds-final 2/101
2
ACKNOWLEDGEMENTS
This document was prepared by the Southeastern Economic Development Commission in collaborationwith the three regional Councils of Government—Cape Fear Council, Lumber River Council and
Mid-Carolina Council—located within the SEDC Region.
Edited by Klein Consulting.

7/30/2019 2012 Sedc Edd Nc Ceds Final
http://slidepdf.com/reader/full/2012-sedc-edd-nc-ceds-final 3/101
3
Southeastern Economic Development Commission
Pamela H. Bostic, Executive Director
707 West Broad Street ● Post Office Box 921
Elizabethtown, North Carolina 28337
910.862.6985 Telephone910.862.1482 Fax
www.sedcnc.org

7/30/2019 2012 Sedc Edd Nc Ceds Final
http://slidepdf.com/reader/full/2012-sedc-edd-nc-ceds-final 4/101
4
T A B
L E
OF
C O NT E
NT S
T A B
L E
OF
C O NT E
NT S
T A B
L E
OF
C O NT E
NT S
T A B
L E
OF
C O NT E
NT S
Executive Summary 6
Community and Private Sector Participation 8
Regional Profile 10
Population and Labor Force Characteristics 10
Housing 18
Infrastructure: Transportation, Telecommunications and Water/Sewer 19
Community Colleges and Universities 25
Agricultural Economy 26
Environment 28
Medical Facilities and Healthcare 30
Film 33
Tourism 34
Military Presence 35
Analysis of Economic Development Challenges and Opportunities 36
Results of Our Visioning Meetings and Online Survey 36
Recent Strategic Investments in the Region 39
Economic Clusters: Competitive Advantages, Opportunities and Challenges to Success 40
Advanced Manufacturing 40
Agribusiness 41
Biotechnology 41
Healthcare 42
Film 42
Tourism 43
7/30/2019 2012 Sedc Edd Nc Ceds Final
http://slidepdf.com/reader/full/2012-sedc-edd-nc-ceds-final 5/101
5
T A B
L E
O F
C O N T E N T S
T A B
L E
O F
C O N T E N T S
T A B
L E
O F
C O N T E N T S
T A B
L E
O F
C O N T E N T S
Transportation and Logistics 43
Military Defense 44
Plan of Action 45
Goals, Objectives and Strategies 46
Goal One: Build on Region’s Competitive Advantages 46
Goal Two: Establish and Maintain a Robust Regional Infrastructure 59
Goal Three: Create Revitalized and Vibrant Communities 73
Goal Four: Develop Healthy and Innovative People 79
Goal Five: Encourage Entrepreneurs and Small Business Growth 83
List of Vital Projects 85
Performance Measures 91
Appendices: 93
I. SEDC CEDS Advisory Committee Members 94
II. Regional Advisory Committee Members 95
III. SEDC Board of Directors 96
References 97

7/30/2019 2012 Sedc Edd Nc Ceds Final
http://slidepdf.com/reader/full/2012-sedc-edd-nc-ceds-final 6/101
6
The Southeastern Economic Development
Commission (SEDC) Region consists of the
twelve counties in the extreme southeastern cor-
ner of North Carolina. These counties include
Bladen, Brunswick, Columbus, Cumberland, Har-
nett, Hoke, New Hanover, Pender, Richmond,
Robeson, Sampson and Scotland. The western-
most county, Richmond, has joined the SEDC Re-gion since the last Comprehensive Economic De-
velopment Strategy was prepared in 2007.
This region is the largest Economic Development
District in North Carolina. It’s size and geographic
location make it a hugely diverse region extend-
ing from the coastal plain to the piedmont. The
local economies range from the two metropoli-tan areas—Fayetteville which includes Fort
Bragg—and Wilmington on the coast. The coun-
ties in between these two designated metro ar-
eas are more rural in nature.
Economic Shifts
In the period between 1990 and 2010, this re-
gion was decimated by job losses—over 38,000 in
manufacturing alone—as a structural shift in the
region’s economy took place as companies down-
sized and shifted production offshore to coun-
tries with lower wages, and less business and
environmental protection regulation. Smalltowns once dependent on textiles and apparel
lost their only major employer and the existing
labor force was left with few, if any, options for
reemployment at the wage and benefit level of
their former jobs.
Simultaneously, the shift toward “knowledge
jobs” began in the nation, our State and region.Recognizing this structural shift in the economy,
the State and Federal governments stepped in
with strategic investments in workforce training
programs geared to the adult and dislocated
workers. Thousands of dislocated and adult
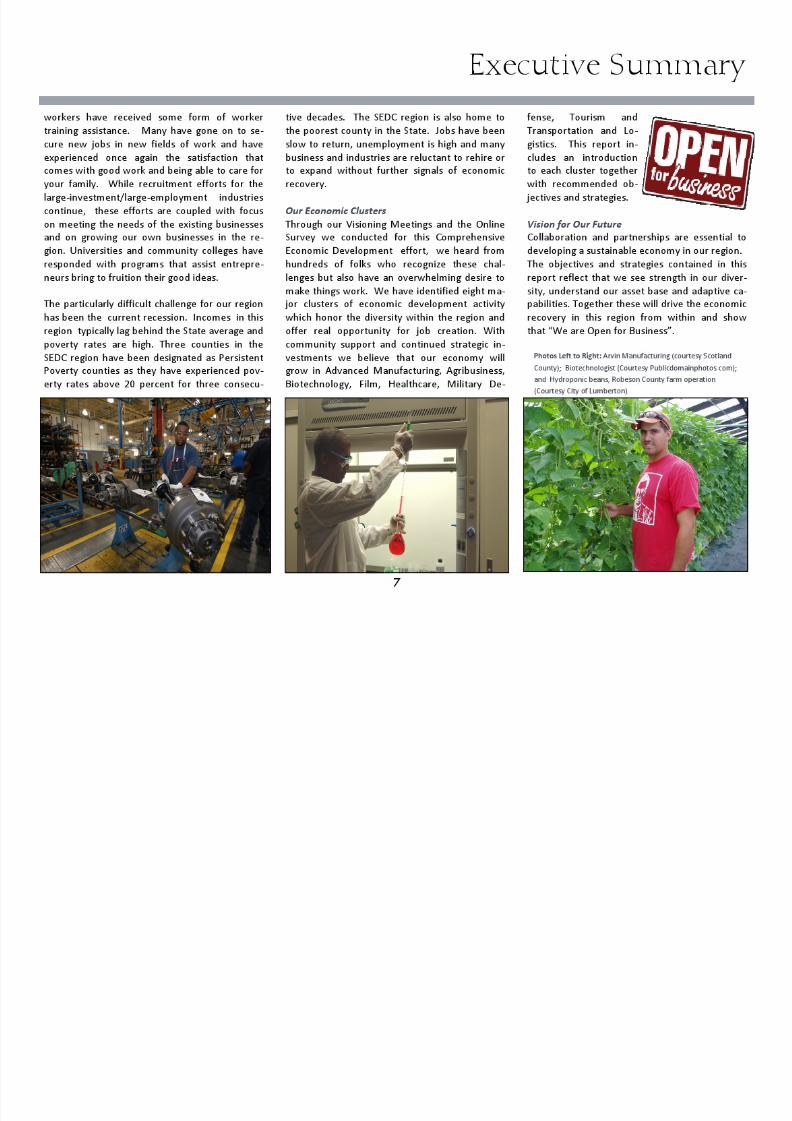
Executive Summary
Above – Map: SEDC Region
Below (left to right): Soldiers await airdrop (Courtesy Fort Bragg
Airborne Corp); Container ship, Wheat harvesting, (Courtesy Pub-
licdomainphotos.com).
7/30/2019 2012 Sedc Edd Nc Ceds Final
http://slidepdf.com/reader/full/2012-sedc-edd-nc-ceds-final 7/101

7/30/2019 2012 Sedc Edd Nc Ceds Final
http://slidepdf.com/reader/full/2012-sedc-edd-nc-ceds-final 8/101

7/30/2019 2012 Sedc Edd Nc Ceds Final
http://slidepdf.com/reader/full/2012-sedc-edd-nc-ceds-final 9/101

7/30/2019 2012 Sedc Edd Nc Ceds Final
http://slidepdf.com/reader/full/2012-sedc-edd-nc-ceds-final 10/101
10
Regional Profile
Map 1: SEDC Region
Table 1: Population Growth Comparisons 2000-2010 By County
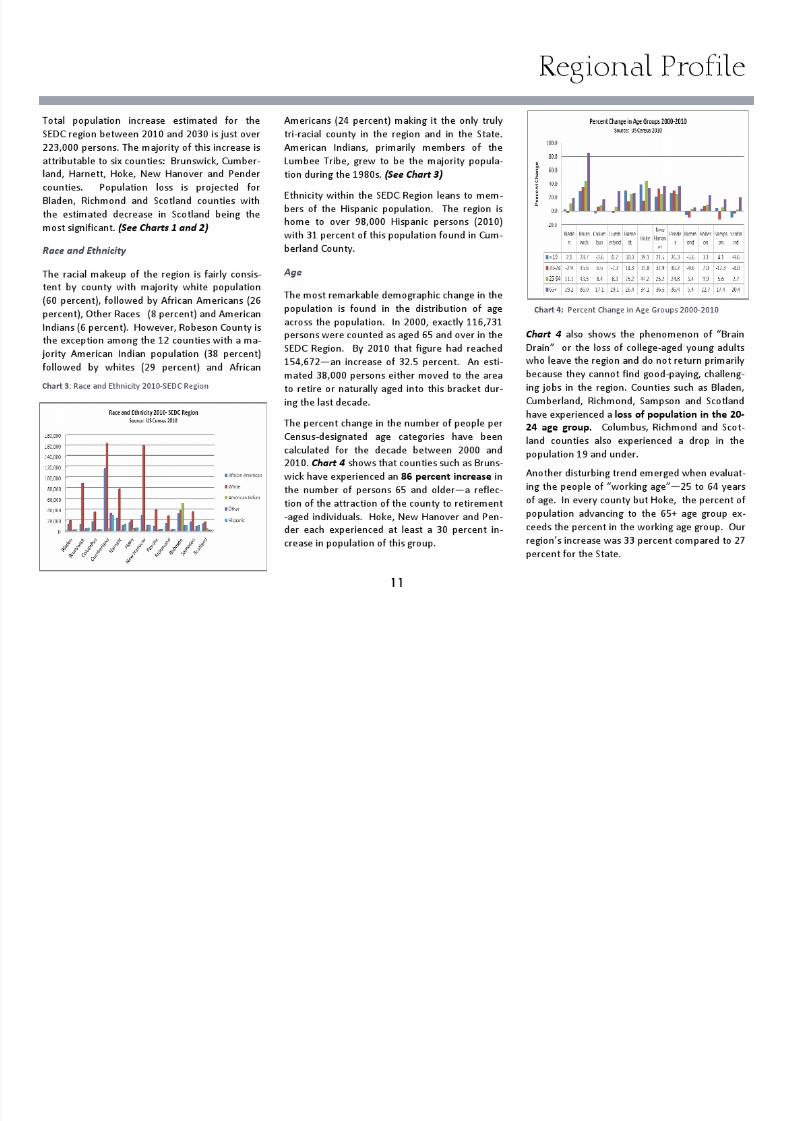
Population and Labor Force Charac-
teristics
By the most recent population count (2010
Census) about 1.2 million persons call the
SEDC Region “home”. This is an increase of
15.4 percent over the last decade, almost at
pace with the Statewide growth rate of 18.5percent.
Growth, however, has not been even across
the region. Brunswick, a coastal county in the
Wilmington Metropolitan Statistical Area
(MSA), experienced the largest rate of growth
at 47 percent—almost a doubling of the
county population within a ten year period.The counties of Harnett, Hoke, New Hanover
and Pender followed with rates of increase
over 20 percent. Not coincidentally, each of
these counties is located within either the Fa-
yetteville or Wilmington MSA where growth
has been strongest. Table 1 illustrates growth
by county in the last decade.
Conversely, rates of growth in most of the
rural, interior counties have been negligible.
Richmond and Scotland grew by less than one
percent. In all, seven of the 12 counties within
the SEDC Region grew by less than 10 percent
—just about half of the State’s rate of growth
in that same period. Map 1 provides an illus-
tration of the varied urban and rural nature of the SEDC region counties. Projected popula-
tion growth estimates continue this trend.
County Percent Growth
2000-2010
Increased NumberPersons
2000-2010
Bladen 9.1% 2,938
Brunswick 46.9% 34,310
Columbus 6.1% 3,340
Cumberland 5.4% 16,453Harnett 26.1% 23,700
Hoke 39.3% 13,244
New Hanover 26.4% 42,352
Pender 27.1% 11,146
Richmond 0.1% 42
Robeson 8.9% 10,998
Sampson 5.4% 3,274
Scotland 0.6% 205
North Carolina 18.5% 1,486,170SEDC RegionTotal 15.4% 162,002
Chart 1: SEDC Region Population
Chart 2: SEDC Region Population 1980-2030
-20%
0%
20%
40%
B l a d e n
B r u n s w i c k
C o l u m b u s
C u m b e r l …
H a r n e t t
H o k e
N e w
P e n d e r
R i c h m o n d
R o b e s o n
S a m p s o n
S c o t l a n d
Projected Population Change SEDC RegionSource: NC State Office of Budget and Management
20 10-2 020 2 02 0-20 30
SEDC
Region,
1,451,523
-
200,000
400,000
600,000
800,000
1,000,000
1,200,000
1,400,000
1,600,000
1980 1990 2000 2010 2020 2030
T o t a l P o p u l a t i o n
SEDC Region Population 1980-2030Source: NC State Office of Budget and Management
7/30/2019 2012 Sedc Edd Nc Ceds Final
http://slidepdf.com/reader/full/2012-sedc-edd-nc-ceds-final 11/101

7/30/2019 2012 Sedc Edd Nc Ceds Final
http://slidepdf.com/reader/full/2012-sedc-edd-nc-ceds-final 12/101
12
Regional Profile
Educational Attainment
Advancing the level of education in the popula-
tion has been linked to better economic out-
comes for individuals and the communities in
which they live by numerous studies and by the
Census Bureau itself. The level of education has
an integral link to the wage-earning capacity of
individuals. According to an analysis conducted
by the US Census for their Current Population
Reports series, “Higher levels of educational
attainment are associated with higher earnings.
In 2009, adults with professional degrees
earned more than any other education level,
with mean monthly earnings of $11,900 for full-
time workers. On average, adults with a mas-
ter’s degree earned $6,700 per month and
those with a bachelor’s degree earned $5,400
per month. Adults with an associate’s degree
earned $4,200 per month on average while
those with some college but no degree earned
$3,600 monthly.” (Current Population Reports,
2011).
Changes 2000-2010
Educational attainment in the SEDC region is
advancing. As shown in the Chart 5, the per-
centage of the population 25 years and older
with less than a high school education and with-
out a diploma has declined over the last decade.
On the other end of the educational attainment
spectrum, the percentage of population withAssociate’s, Bachelor’s and Graduate degrees
has also increased.
Referring to Chart 6 we see that efforts within
the region to increase the number of youth with
college exposure and degrees is rising. In 2010
across the SEDC region there were 133,068 per-
sons aged 25 and over counted as having less
than a high school education; 33,951 with a
high school diploma or GED; 165,293 with somecollege but no degree (a 10 percent increase
over 2000 and the largest group by sheer num-
ber); 66,659 with an associate’s degree (36 per-
cent increase over 2000); and 146,365 with a
bachelor’s degree or higher (a 28 percent in-
crease over 2000). These increases are likely
connected to the push in the North Carolina
Public School System to move high school stu-dent towards a college education, particularly
the traditional, four-year institutions.
Chart 7: High School Dropout Rates 2007-2011
0%
10%
20%
30%
Educational Attainment 2000-2010 SEDC Region and
North Carolina Population 25 Years and OlderSource: US Census, ACS
SEDC Region 2000 North Carolina 2000
SEDC Region 2010 North Carolina 2010
Chart 5: Educational Attainment 2000-2010
Chart 6: Percent Increase in College Exposure and Degrees
7/30/2019 2012 Sedc Edd Nc Ceds Final
http://slidepdf.com/reader/full/2012-sedc-edd-nc-ceds-final 13/101

7/30/2019 2012 Sedc Edd Nc Ceds Final
http://slidepdf.com/reader/full/2012-sedc-edd-nc-ceds-final 14/101

7/30/2019 2012 Sedc Edd Nc Ceds Final
http://slidepdf.com/reader/full/2012-sedc-edd-nc-ceds-final 15/101

7/30/2019 2012 Sedc Edd Nc Ceds Final
http://slidepdf.com/reader/full/2012-sedc-edd-nc-ceds-final 16/101
7/30/2019 2012 Sedc Edd Nc Ceds Final
http://slidepdf.com/reader/full/2012-sedc-edd-nc-ceds-final 17/101
7/30/2019 2012 Sedc Edd Nc Ceds Final
http://slidepdf.com/reader/full/2012-sedc-edd-nc-ceds-final 18/101
18
Regional Profile
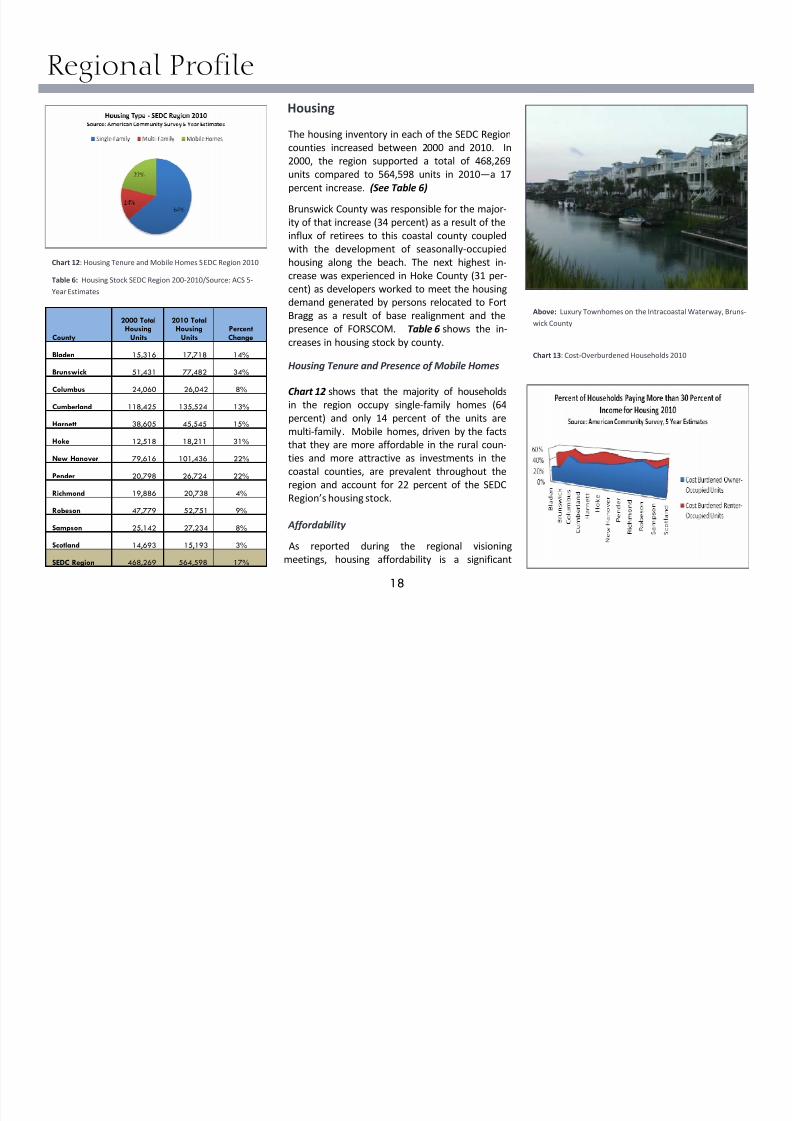
Housing
The housing inventory in each of the SEDC Region
counties increased between 2000 and 2010. In
2000, the region supported a total of 468,269
units compared to 564,598 units in 2010—a 17
percent increase. (See Table 6)
Brunswick County was responsible for the major-
ity of that increase (34 percent) as a result of the
influx of retirees to this coastal county coupled
with the development of seasonally-occupied
housing along the beach. The next highest in-
crease was experienced in Hoke County (31 per-
cent) as developers worked to meet the housing
demand generated by persons relocated to Fort
Bragg as a result of base realignment and the
presence of FORSCOM. Table 6 shows the in-
creases in housing stock by county.
Housing Tenure and Presence of Mobile Homes
Chart 12 shows that the majority of households
in the region occupy single-family homes (64
percent) and only 14 percent of the units are
multi-family. Mobile homes, driven by the factsthat they are more affordable in the rural coun-
ties and more attractive as investments in the
coastal counties, are prevalent throughout the
region and account for 22 percent of the SEDC
Region’s housing stock.
Affordability
As reported during the regional visioning
meetings, housing affordability is a significant
County
2000 TotalHousing
Units
2010 TotalHousing
Units PercentChange
Bladen 15,316 17,718 14%
Brunswick 51,431 77,482 34%
Columbus 24,060 26,042 8%
Cumberland 118,425 135,524 13%
Harnett 38,605 45,545 15%
Hoke 12,518 18,211 31%
New Hanover 79,616 101,436 22%
Pender 20,798 26,724 22%
Richmond 19,886 20,738 4%
Robeson 47,779 52,751 9%
Sampson 25,142 27,234 8%
Scotland 14,693 15,193 3%
SEDC Region 468,269 564,598 17%
Chart 12: Housing Tenure and Mobile Homes SEDC Region 2010
Table 6: Housing Stock SEDC Region 200-2010/Source: ACS 5-
Year Estimates
Above: Luxury Townhomes on the Intracoastal Waterway, Bruns-
wick County
Chart 13: Cost-Overburdened Households 2010
7/30/2019 2012 Sedc Edd Nc Ceds Final
http://slidepdf.com/reader/full/2012-sedc-edd-nc-ceds-final 19/101

7/30/2019 2012 Sedc Edd Nc Ceds Final
http://slidepdf.com/reader/full/2012-sedc-edd-nc-ceds-final 20/101
7/30/2019 2012 Sedc Edd Nc Ceds Final
http://slidepdf.com/reader/full/2012-sedc-edd-nc-ceds-final 21/101

7/30/2019 2012 Sedc Edd Nc Ceds Final
http://slidepdf.com/reader/full/2012-sedc-edd-nc-ceds-final 22/101

7/30/2019 2012 Sedc Edd Nc Ceds Final
http://slidepdf.com/reader/full/2012-sedc-edd-nc-ceds-final 23/101
23
In the spring of 2012, a second major regional
facility owned by the Lower Cape Fear Water
and Sewer Authority was placed online in
Bladen County to provide a surface water al-
ternative for the Smithfield Foods plant in Tar
Heel (Bladen County). The world’s largest hog
processing facility, the Smithfield Plant utilizes
3 MGD of the plant’s 4 MGD capacity and em-
ploys over 5,000 persons in the region. The
Bladen Bluffs facility responded to the State of
North Carolina’s demand that the Smithfield
Plant move to a surface water supply as
groundwater sources in the region were being
noticeably depleted. A cone of depression was
developing in the county and threatened the
viability of the region’s groundwater supply for
the future. (See Map 4) The groundwatermonitoring effort which revealed this cone was
partially funded by a grant from EDA to the
Lumber River Council of Governments, a re-
gional planning organization that has devel-
oped a 30-year history in supporting water
management in the region.
The Bladen Bluffs facility (see photo at right)was a win-win for economic development and
the region’s environment. The facility is ex-
pandable under a permit which allows 30 MGD
to be withdrawn from the river at this location.
• Sewer Systems
Within the SEDC Region there are 73 publicsewer systems. Ownership of these systems
resides primarily with municipalities—about 86
percent. Chart 15 shows the distribution by
ownership.
The current permitted capacity or purchase
volume of these systems is 160 MGD. The av-
erage daily demand taken over a yearly period
is 54 MGD, and the maximum daily demand is
86 MGD across all facilities. Excess capacity is
available in each of the systems in varying
amounts.
Over half of the sewer systems are regional in
nature. The Cape fear Public Utilities Authority
and the Harnett County Regional Water Sys-
tem are the largest of the regional systems
within the SEDC Region.
Regional Profile
Map 4: Cone of Groundwater Depression at Smithfield Foods
Plant in Tar Heel, NC Source: GeoResources.
Photo: Bladen Bluffs Regional Water Facility. Source: LCFWSA.
86%
7%3% 3% 1%
SEDC Region S ewer SystemsSource: NCDENR Local Water Supply Plans 2011
Municipal County-Owned Authority District Other
Chart 15: Sewer Systems by Ownership Type. Source: NCDENR
Local Water Supply Plans.
Cone of Depression

7/30/2019 2012 Sedc Edd Nc Ceds Final
http://slidepdf.com/reader/full/2012-sedc-edd-nc-ceds-final 24/101

7/30/2019 2012 Sedc Edd Nc Ceds Final
http://slidepdf.com/reader/full/2012-sedc-edd-nc-ceds-final 25/101
7/30/2019 2012 Sedc Edd Nc Ceds Final
http://slidepdf.com/reader/full/2012-sedc-edd-nc-ceds-final 26/101

7/30/2019 2012 Sedc Edd Nc Ceds Final
http://slidepdf.com/reader/full/2012-sedc-edd-nc-ceds-final 27/101

7/30/2019 2012 Sedc Edd Nc Ceds Final
http://slidepdf.com/reader/full/2012-sedc-edd-nc-ceds-final 28/101

7/30/2019 2012 Sedc Edd Nc Ceds Final
http://slidepdf.com/reader/full/2012-sedc-edd-nc-ceds-final 29/101
7/30/2019 2012 Sedc Edd Nc Ceds Final
http://slidepdf.com/reader/full/2012-sedc-edd-nc-ceds-final 30/101

7/30/2019 2012 Sedc Edd Nc Ceds Final
http://slidepdf.com/reader/full/2012-sedc-edd-nc-ceds-final 31/101
7/30/2019 2012 Sedc Edd Nc Ceds Final
http://slidepdf.com/reader/full/2012-sedc-edd-nc-ceds-final 32/101

7/30/2019 2012 Sedc Edd Nc Ceds Final
http://slidepdf.com/reader/full/2012-sedc-edd-nc-ceds-final 33/101
33
Regional Profile
Film
According to the NC Film Office and an article
published July 25, 2012 by the Raleigh News and
Observer, July 25, the North Carolina film indus-
try is booming. North Carolina film production
for 2012 at $300 million already exceeds the
2011 record setting number—$220 million. The
record 35 production companies also accountedfor a nearly 15,000 job opportunities. (NC Film
Office, Raleigh News and Observer, July 25,
2012)
Currently under production in various NC coun-
ties are three television series, including the new
series, Revolution, and the award winning series,
One Tree Hill. Big-budget feature films include
The Hunger Games, which was filmed entirely in
North Carolina and Iron Man 3, which was
filmed, in part, in Wilmington (New Hanover
County). Production companies specializing in
commercials are also flocking to North Carolina.
Commercials for Mountain Dew, Verizon, Bank
of America and Under Armour, among others,
have been filmed here in the last year. (Raleigh
News and Observer, July 25, 2012)
Economic Incentives
As divided as the NC Legislature has been on
most issues in the past two session, supporting
the NC film industry has been one topic they
have agreed upon. North Carolina now has
some of the most attractive film incentives avail-able in the country.
A new 25 percent film incentive was signed into
law by Governor Beverly Perdue. It provides a
refundable tax credit based on the direct in-
state spending by film companies on goods, ser-
vices and labor. The spending floor is $250,000
and the cap has been raised from $7.5 million to
$20 million. The 6.9 percent corporate income
tax on the incentive has been eliminated.
The Effect on Rural Counties
Southeastern NC, specifically New Hanover andBrunswick counties, have the longest standing
market for the film industry in the state, and
have been the industry anchor. However, film
locations today span over 30 counties. The NC
Film Office has 3,286 locations in the 12 coun-
ties of the SEDC Region listed as potential loca-
tions for productions. The television series,
Revolution, is being filmed in several countieswithin the SEDC Region in addition to New
Hanover.
Photo: Film location in Harrells—Sampson County. Photo
Courtesy of NC Film Office.Photo Above: Film
locations Weyman
Chapel– Columbus
County
Photo: Town of
Dundarrach –Hoke
County.
Photo: NC-11 Bridge,
Bladen County.
Photos courtesy of NC
Film Office.

7/30/2019 2012 Sedc Edd Nc Ceds Final
http://slidepdf.com/reader/full/2012-sedc-edd-nc-ceds-final 34/101
7/30/2019 2012 Sedc Edd Nc Ceds Final
http://slidepdf.com/reader/full/2012-sedc-edd-nc-ceds-final 35/101

7/30/2019 2012 Sedc Edd Nc Ceds Final
http://slidepdf.com/reader/full/2012-sedc-edd-nc-ceds-final 36/101

7/30/2019 2012 Sedc Edd Nc Ceds Final
http://slidepdf.com/reader/full/2012-sedc-edd-nc-ceds-final 37/101

7/30/2019 2012 Sedc Edd Nc Ceds Final
http://slidepdf.com/reader/full/2012-sedc-edd-nc-ceds-final 38/101
7/30/2019 2012 Sedc Edd Nc Ceds Final
http://slidepdf.com/reader/full/2012-sedc-edd-nc-ceds-final 39/101
7/30/2019 2012 Sedc Edd Nc Ceds Final
http://slidepdf.com/reader/full/2012-sedc-edd-nc-ceds-final 40/101

7/30/2019 2012 Sedc Edd Nc Ceds Final
http://slidepdf.com/reader/full/2012-sedc-edd-nc-ceds-final 41/101
7/30/2019 2012 Sedc Edd Nc Ceds Final
http://slidepdf.com/reader/full/2012-sedc-edd-nc-ceds-final 42/101

7/30/2019 2012 Sedc Edd Nc Ceds Final
http://slidepdf.com/reader/full/2012-sedc-edd-nc-ceds-final 43/101
E i Cl t

7/30/2019 2012 Sedc Edd Nc Ceds Final
http://slidepdf.com/reader/full/2012-sedc-edd-nc-ceds-final 44/101
44
Economic Clusters
Military DefenseThe benefits of military spending are evident
through the defense contracts valued at more
than $371 million that were awarded in the SEDC
Region in 2011—impacting at least one business
in every county in the district. Businesses in the
region have received over $3.4 billion in military
contacts since 2000. (Source: GovernmentCon-
tractsWon.com).
Companies based in Cumberland County, which is
home to Fort Bragg, won 50.9% of these con-
tracts. Those in neighboring Harnett County re-
ceived 26.3% of the region’s total awards, while
defense contractors in Robeson County captured
11.3%. In 2011, more than 1,300 contracts wereawarded in the region. Military spending leads to
more production that ultimately creates more
jobs. Defense agencies rely on the private sector
to build and manufacturer its equipment and
goods. The result is increased jobs and employ-
ment in the private sector. Meanwhile, military
personnel learn new skills they may apply to later
civilian life. Therefore, military spending also im-proves human capital in the region.
Competitive Advantages: The SEDC Region main-
tains a competitive advantage over other regions
of the state due to the following factors:
1) Fort Bragg is located in the region.
2) 10,000+ exiting military personnel entering
civilian life annually.
3) Defense contractors looking to locate nearFort Bragg.
Threats: Major threats to continued viability of
the Military Defense cluster include:
1) Potential Defense budget cuts.
2) Possible 2015 Base Realignment and Closing
plan (BRAC).3) Growth limitations Fort Bragg.
Opportunities: Opportunities for continued
growth of this cluster include:
1) Ongoing growth and sustainability resulting
from the 2005 BRAC.
2) Defense growth at Fort Bragg and CampMacKall resulting from potential 2015 BRAC.
3) Rail improvements—Fort Bragg Connectorand Pembroke Turn.
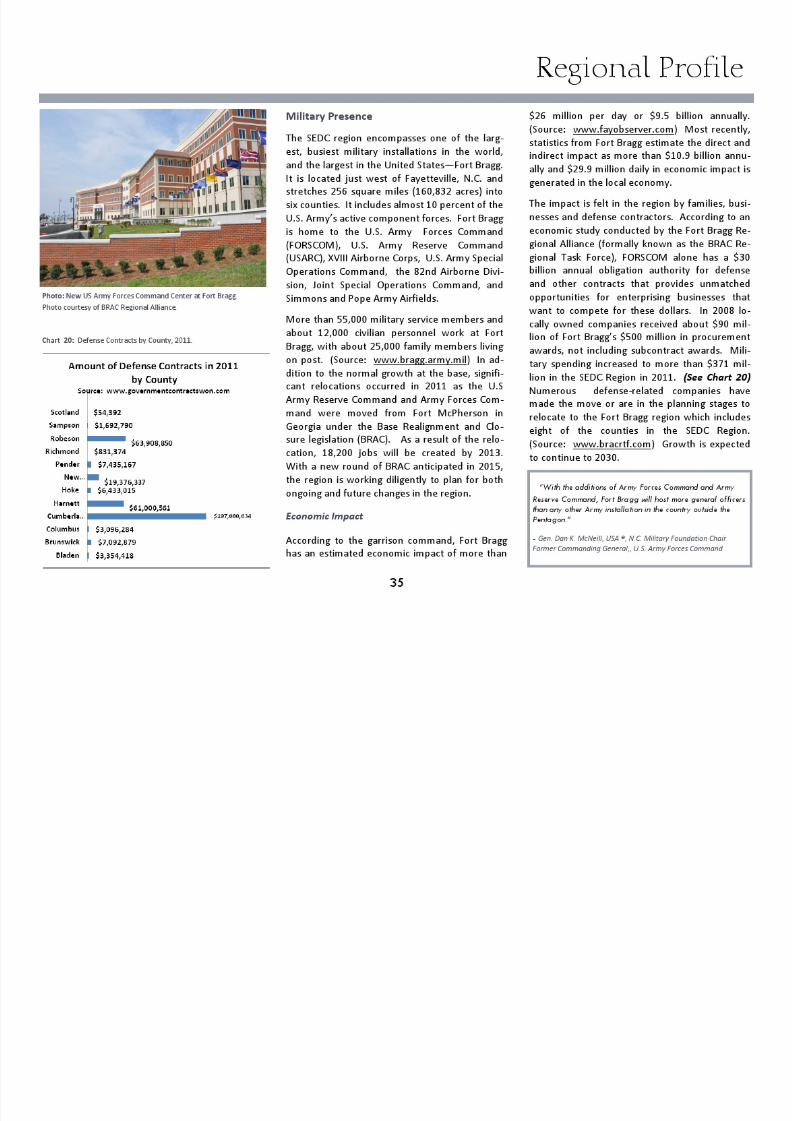
Photo: Above—Dedication of the Forces Command Building.
Photos courtesy of BRAC Regional Alliance.
Photo: Below—New Forces Command Building at Fort Bragg,
7/30/2019 2012 Sedc Edd Nc Ceds Final
http://slidepdf.com/reader/full/2012-sedc-edd-nc-ceds-final 45/101

7/30/2019 2012 Sedc Edd Nc Ceds Final
http://slidepdf.com/reader/full/2012-sedc-edd-nc-ceds-final 46/101

7/30/2019 2012 Sedc Edd Nc Ceds Final
http://slidepdf.com/reader/full/2012-sedc-edd-nc-ceds-final 47/101

7/30/2019 2012 Sedc Edd Nc Ceds Final
http://slidepdf.com/reader/full/2012-sedc-edd-nc-ceds-final 48/101

7/30/2019 2012 Sedc Edd Nc Ceds Final
http://slidepdf.com/reader/full/2012-sedc-edd-nc-ceds-final 49/101

7/30/2019 2012 Sedc Edd Nc Ceds Final
http://slidepdf.com/reader/full/2012-sedc-edd-nc-ceds-final 50/101

7/30/2019 2012 Sedc Edd Nc Ceds Final
http://slidepdf.com/reader/full/2012-sedc-edd-nc-ceds-final 51/101

7/30/2019 2012 Sedc Edd Nc Ceds Final
http://slidepdf.com/reader/full/2012-sedc-edd-nc-ceds-final 52/101

7/30/2019 2012 Sedc Edd Nc Ceds Final
http://slidepdf.com/reader/full/2012-sedc-edd-nc-ceds-final 53/101

7/30/2019 2012 Sedc Edd Nc Ceds Final
http://slidepdf.com/reader/full/2012-sedc-edd-nc-ceds-final 54/101
7/30/2019 2012 Sedc Edd Nc Ceds Final
http://slidepdf.com/reader/full/2012-sedc-edd-nc-ceds-final 55/101
7/30/2019 2012 Sedc Edd Nc Ceds Final
http://slidepdf.com/reader/full/2012-sedc-edd-nc-ceds-final 56/101

7/30/2019 2012 Sedc Edd Nc Ceds Final
http://slidepdf.com/reader/full/2012-sedc-edd-nc-ceds-final 57/101

7/30/2019 2012 Sedc Edd Nc Ceds Final
http://slidepdf.com/reader/full/2012-sedc-edd-nc-ceds-final 58/101

7/30/2019 2012 Sedc Edd Nc Ceds Final
http://slidepdf.com/reader/full/2012-sedc-edd-nc-ceds-final 59/101
Goals, Objectives and Strategies

7/30/2019 2012 Sedc Edd Nc Ceds Final
http://slidepdf.com/reader/full/2012-sedc-edd-nc-ceds-final 60/101
60
Goal #2: Establish and Maintain a Robust Regional Infrastructure
I-74/US 74 Upgrade to Interstate Standards–(New Hanover
County, Brunswick County, Columbus County, Robeson
County and Scotland County) Improvements are needed to
add capacity, improve safety.
NC Department of
Transportation
TBD NC Dept. of Transporta-
tion
Cape Fear Area RPO,
Lumber River Area, Wil-
mington Urban Area MPO
Complete all sections of I-73/74 that are missing or below
interstate standards. (Most immediate needs are TIP pro-
jects R-3421 in Richmond County and I-3801 in Scotland
County.
NC Department of Trans-
portation
$223,618,000 US DOT and NC Depart-
ment of Transportation
Local RPOs, Region’s Local
Governments
Widen I-95 and upgrade deficient interchanges NC Department of Trans-
portation
$94,115,000 USDOT and NC Depart-
ment of Transportation
Local RPOs, Region’s Local
Governments
Widen US 1 to four lanes from Rockingham north to exist-
ing four lane section. This project (TIP Project R-2501) com-
pletes the widening of US 1 in Richmond County from
south of Hoffman to the South Carolina line.
NC Department of Trans-
portation
$168,730,000 NC Department of Trans-
portation
Local RPOs and Local
Governments
Continue Progress of Interstate 295 (Fayetteville Outer
Loop)—$100 million recently approved for I-295.
NC Department of Trans-
portation
$600,000,000 NC Department of Trans-
portation
Mid Carolina and Lumber
RPOs, Fayetteville MPO
And Local Governments
Name Lead Agency Estimated Cost Resource Partners
NC 24 – Construct a four-lane divided facility, part on newlocation, connecting Maxwell/Clinton Road in Cumberland
County to I-40 in Duplin County.
NC Department of Trans-portation
$410,189,000 NC Department of Trans-portation
Mid-Carolina RPO andFayetteville MPO
NC 87 – Widen to multi-lanes from US 74/76 in Columbus
County to the Elizabethtown Bypass in Bladen County.
NC Department of Trans-
portation
$234,407,000 NC Department of Trans-
portation
Mid-Carolina RPO and
Fayetteville MPO
US 401: Widen to multi-lanes North of Fayetteville in Cum-
berland County to Fuquay-Varina in Wake County
NC Department of Trans-
portation
$223,851,000 NC Department of Trans-
portation
Mid-Carolina RPO, Fa-
yetteville MPO and the
Capital Area MPO
HIGHWAYS (continued)

7/30/2019 2012 Sedc Edd Nc Ceds Final
http://slidepdf.com/reader/full/2012-sedc-edd-nc-ceds-final 61/101
Goals, Objectives and Strategies
7/30/2019 2012 Sedc Edd Nc Ceds Final
http://slidepdf.com/reader/full/2012-sedc-edd-nc-ceds-final 62/101
62
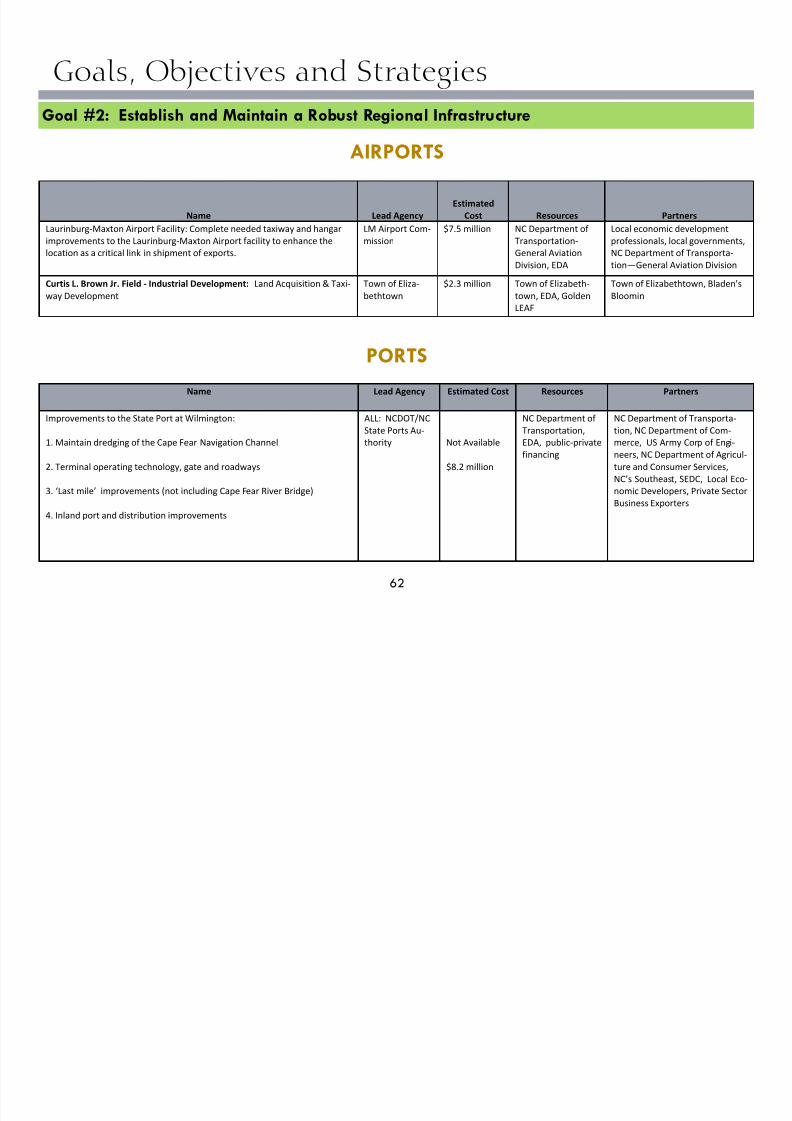
Goal #2: Establish and Maintain a Robust Regional Infrastructure
Name Lead Agency
Estimated
Cost Resources Partners
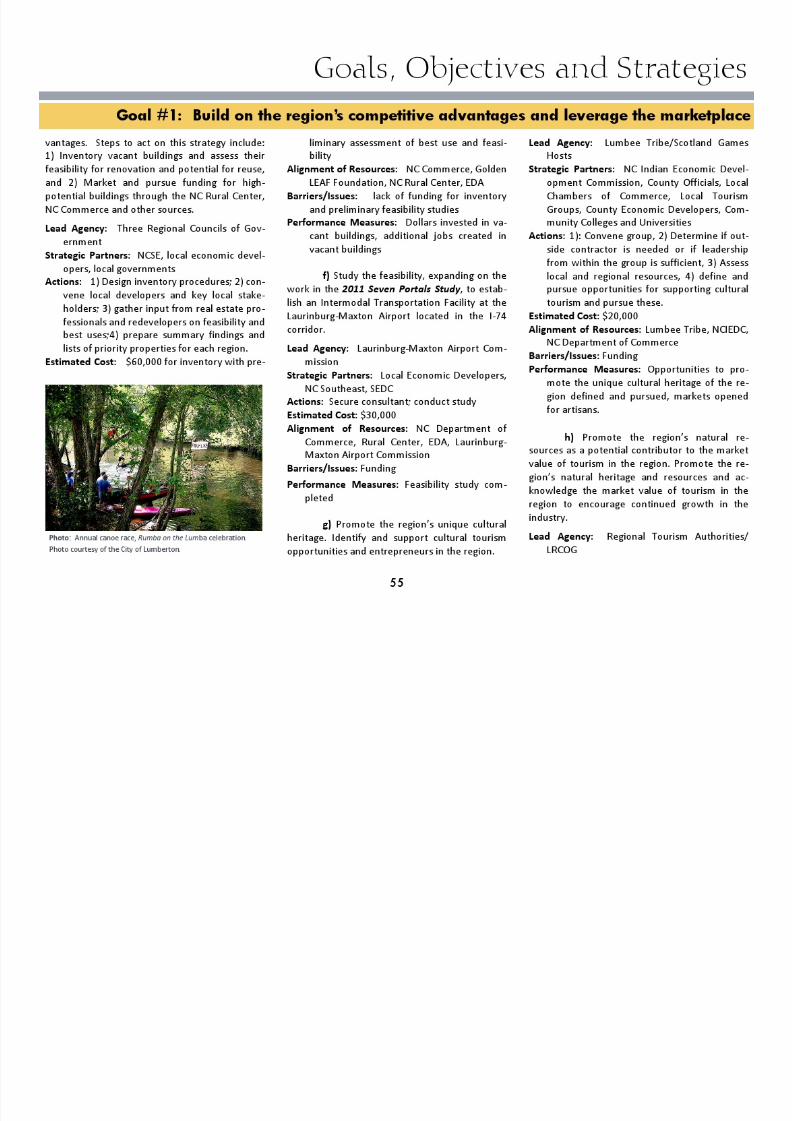
Laurinburg-Maxton Airport Facility: Complete needed taxiway and hangarimprovements to the Laurinburg-Maxton Airport facility to enhance the
location as a critical link in shipment of exports.
LM Airport Com-mission
$7.5 million NC Department of Transportation-
General Aviation
Division, EDA
Local economic developmentprofessionals, local governments,
NC Department of Transporta-
tion—General Aviation Division
Curtis L. Brown Jr. Field - Industrial Development: Land Acquisition & Taxi-
way Development
Town of Eliza-
bethtown
$2.3 million Town of Elizabeth-
town, EDA, Golden
LEAF
Town of Elizabethtown, Bladen's
Bloomin
Name Lead Agency Estimated Cost Resources Partners
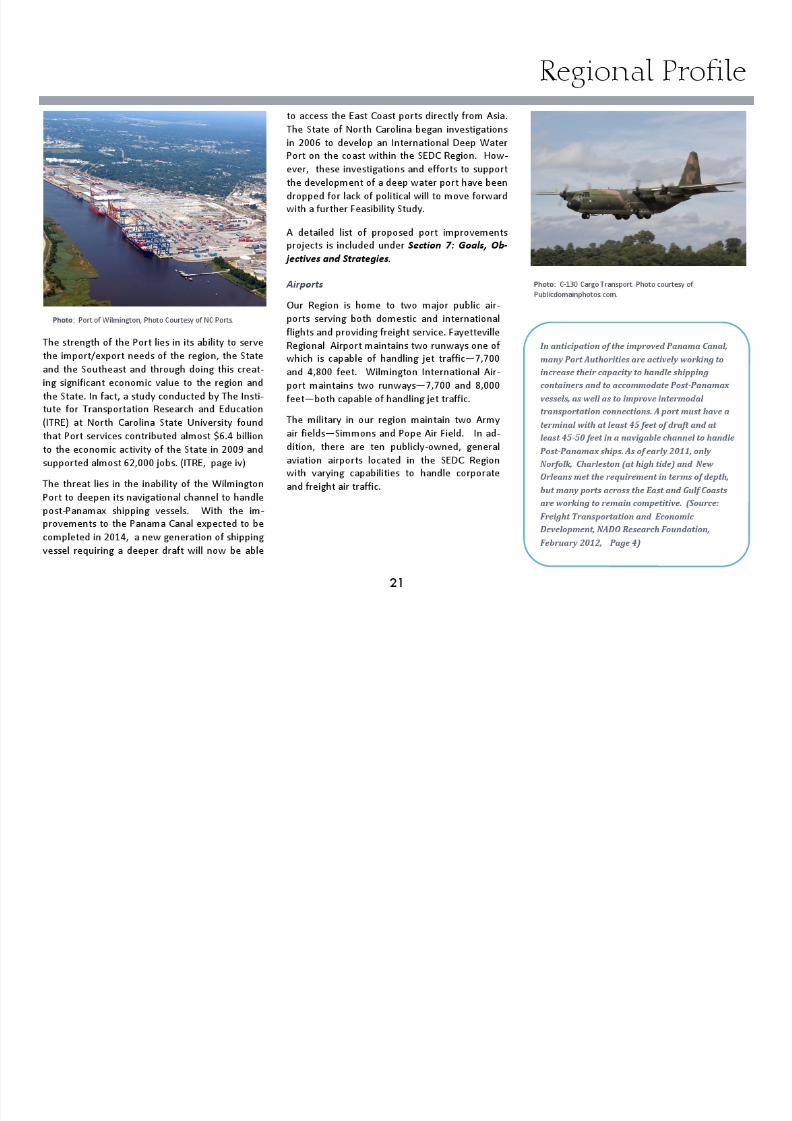
Improvements to the State Port at Wilmington:
1. Maintain dredging of the Cape Fear Navigation Channel
2. Terminal operating technology, gate and roadways
3. ‘Last mile’ improvements (not including Cape Fear River Bridge)
4. Inland port and distribution improvements
ALL: NCDOT/NC
State Ports Au-
thority Not Available
$8.2 million
NC Department of
Transportation,
EDA, public-privatefinancing
NC Department of Transporta-
tion, NC Department of Com-
merce, US Army Corp of Engi-neers, NC Department of Agricul-
ture and Consumer Services,
NC’s Southeast, SEDC, Local Eco-
nomic Developers, Private Sector
Business Exporters
PORTS
AIRPORTS
Goals, Objectives and Strategies

7/30/2019 2012 Sedc Edd Nc Ceds Final
http://slidepdf.com/reader/full/2012-sedc-edd-nc-ceds-final 63/101
63
Goal #2: Establish and Maintain a Robust Regional Infrastructure
Name Lead Agency
Estimated
Cost Resources Partners
Hoke County Regional Sewer System: Phase 1-B to support and promote qualitygrowth occurring in close proximity to Fort Bragg, and between Raeford and Fa-
yetteville. Phase 1-A will serve the US401 corridor, including two new medical
facilities - First Health of the Carolinas and Cape Fear Valley - creating 300 new jobs
in Hoke County over the next five years. Hoke County will complete phase 1-A of
the regional sewer system project by fall of 2012.
Hoke County $1.6 million(Phase 1-A)
$14.6 million
(Phase 1-B)
Hoke County, NC RuralCenter, CDBG, Golden
LEAF, EDA, Lumber
River Electric Member-
ship Corporation
Hoke County, First Health of theCarolinas, Cape Fear Valley
Linden Water & Sewer District Cumberland County $8 million USDA, NCDENR Cumberland County, Town of Linden
Vander Water & Sewer District Cumberland County $7 million USDA, NCDENR Town of Vander, Cumberland County
Grays Creek Water & Sewer District Cumberland County $10 million USDA, NCDENR Cumberland County
Cedar Creek Water & Sewer District Cumberland County $10 million USDA, NCDENR Cumberland County
Town of Elizabethtown: Water and sewer improvements to serve new hospital
facility between Mercer Mill Road and Executive Drive
Town of Elizabeth-
town
$1.18 million Town of Elizabeth-
town, EDA, NCDOC,
USDA
Town of Elizabethtown, Bladen
County, Hospital, Bladen's Bloomin
Water & Sewer Improvements Pender County $5 million Pender County
Town of Elizabethtown: Sewer Plant Expansion and Upgrade Town of Elizabeth-
town
$5 million USDA, EDA, NC Rural
Center
Bladen County
Industrial Park Infrastructure Robeson County $3 million USDA, NCDOC, Golden
LEAF, NC Rural Center,
Robeson County
Town of St. Pauls, Robeson County
Town of Pembroke Wastewater Treatment Upgrades Town of Pembroke $2 million USDA, Golden LEAF,
NC One Fund, Town of
Pembroke, EDA, Robe
on County
Robeson County, Town of Pembroke
WATER AND SEWER
7/30/2019 2012 Sedc Edd Nc Ceds Final
http://slidepdf.com/reader/full/2012-sedc-edd-nc-ceds-final 64/101
Goals, Objectives and Strategies

7/30/2019 2012 Sedc Edd Nc Ceds Final
http://slidepdf.com/reader/full/2012-sedc-edd-nc-ceds-final 65/101
65
Goal #2: Establish and Maintain a Robust Regional Infrastructure
Name Lead Agency
Estimated
Cost Resources Partners
I-40 Exit 355 Industrial Park Sampson County $9 million Sampson County, NCRural Center, Golden
LEAF, CDBG, USDA,
NCDOC
Sampson County, Sampson CountyEDC
I-40 Exit 364/NC-24 Industrial Corridor Sampson County $10 million Sampson County, NC
Rural Center, Golden
LEAF, CDBG, USDA,
NCDOC, EDA
Sampson County, Sampson County
EDC
UNCP Entrepreneuship Incubator University of NC at
Pembroke
$ 1.9 million UNCP Foundation,
Golden LEAF, EDA
UNCP, SEDC, Town of Pembroke
Columbus Alternative Energy and Biotechnology Center: infrastructure Columbus County $100,000 EDA, Columbus County Columbus County EDC, NC Biotech-
nology Center - SE Office
Natural Gas to the Elizabethtown Industrial Park Bladen's Bloomin'
Agri-Industrial, Inc.
$5 million Bladen County, Town
of Elizabethtown,
State & Federal Fund-
ing
Bladen County, Bladen's Bloomin',
Town of Elizabethtown
Industrial Park Improvements: US 421 Pender County $1.5 million Pender County, EDA,Golden LEAF Wilmington Development, Inc., Pen-der County
INDUSTRIAL PARKS AND BUSINESS INCUBATORS (continued)

7/30/2019 2012 Sedc Edd Nc Ceds Final
http://slidepdf.com/reader/full/2012-sedc-edd-nc-ceds-final 66/101
7/30/2019 2012 Sedc Edd Nc Ceds Final
http://slidepdf.com/reader/full/2012-sedc-edd-nc-ceds-final 67/101
7/30/2019 2012 Sedc Edd Nc Ceds Final
http://slidepdf.com/reader/full/2012-sedc-edd-nc-ceds-final 68/101
7/30/2019 2012 Sedc Edd Nc Ceds Final
http://slidepdf.com/reader/full/2012-sedc-edd-nc-ceds-final 69/101

7/30/2019 2012 Sedc Edd Nc Ceds Final
http://slidepdf.com/reader/full/2012-sedc-edd-nc-ceds-final 70/101
7/30/2019 2012 Sedc Edd Nc Ceds Final
http://slidepdf.com/reader/full/2012-sedc-edd-nc-ceds-final 71/101
Goals, Objectives and Strategies

7/30/2019 2012 Sedc Edd Nc Ceds Final
http://slidepdf.com/reader/full/2012-sedc-edd-nc-ceds-final 72/101
72
Performance Measures: Number of businesses
locating in region as a result of Logistics Vil-
lage, number of jobs created in region
h) Pursue completion of a Feasibility
Study on a deep water port in North Carolina as
recommended by the US Army Corp of Engi-neers. This assessment should look at the long-
term challenges facing North Carolina Ports in
light of changes in international shipping, espe-
cially the size of post-Panamax container ships,
and future prospects for the Port of Wilmington.
Lead Agency: NC Department of Transportation
Strategic Partners: County economic develop-ers, NC’s Southeast Economic Development
Partnership, Regional Councils of Govern-
ment, Brunswick County, City of Wilmington
and other local governments in vicinity of
alternate sites
Estimated Cost: $10 million
Alignment of Resources: NC Department of
Transportation, EDA Actions: 1) Form steering committee to oversee
assessment and coordinate with NCDOT
Barriers/Issues: Other ports along the Atlantic
and Gulf Coasts have a head start in prepar-
ing for new vessels and may have competitive
advantages.
Performance Measures: NC Department of
Transportation decision on course of action
Goal #2: establish and maintain a robust regional infrastructure
Photo courtesy of Publicdomainphotos.com.
7/30/2019 2012 Sedc Edd Nc Ceds Final
http://slidepdf.com/reader/full/2012-sedc-edd-nc-ceds-final 73/101
7/30/2019 2012 Sedc Edd Nc Ceds Final
http://slidepdf.com/reader/full/2012-sedc-edd-nc-ceds-final 74/101
7/30/2019 2012 Sedc Edd Nc Ceds Final
http://slidepdf.com/reader/full/2012-sedc-edd-nc-ceds-final 75/101
Goals, Objectives and Strategies
Goal #3: Create Revitalized and Vibrant Communities
7/30/2019 2012 Sedc Edd Nc Ceds Final
http://slidepdf.com/reader/full/2012-sedc-edd-nc-ceds-final 76/101
76
Objective 3: Invest in healthy, safe
and walkable neighborhoods
a) Ensure that each county within the
region has in place a Comprehensive Transporta-
tion Plan that addresses healthy, safe and walk-
able communities.
Lead Agency: Region’s Metropolitan and Rural
Transportation Planning Organizations
Strategic Partners: County and municipal plan-
ners, North Carolina Department of Com-
merce, NC Department of Transportation
Estimated Cost: None Known
Alignment of Resources: None Needed
Actions: Request Comprehensive Transportation
Plans for each county through NCDOT and
Apply for Bicycle and Pedestrian PlanningGrant Funds from NCDOT
Barriers/Issues: Availability of NCDOT Staff
Performance Measures: Pedestrian and Bike
Plans included in County Comprehensive
Transportation Plans.
b) Encourage the region’s small cities to
participate in the NC Certified Retirement Com-munity Program and provide support for Lumber-
ton’s active certification. In 2010, the North Caro-
lina Legislature designated Lumberton as THE
FIRST Certified Retirement Community in the
state.
Lead Agency: Area Agencies on Aging
Strategic Partners: City leaders, retirement andhealth services providers, NC Department of
Commerce, Area COGs
Actions: Identify potential communities
Estimated Cost: None Known
Alignment of Resources: None needed
Barriers/Issues: None Known
Performance Measures: Communities identified
c) Assist local governments as needed in
developing sidewalk ordinances and conducting
sidewalk inventories. Encourage local govern-
ments to provide for sidewalks and greenways
in their development standards. Under this
strategy the COGs will review ordinances and
highlight best practices as models within the
region.
Goal #3: Create Revitalized and Vibrant Communities
Strategies
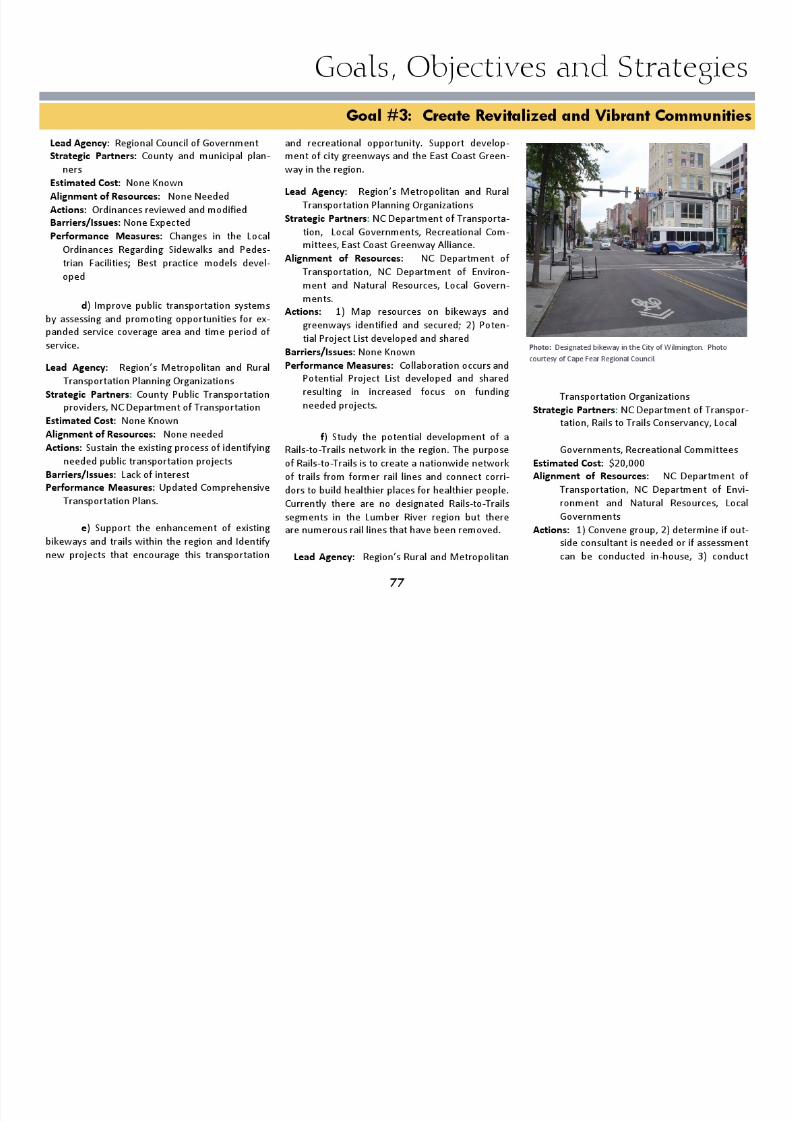
Photo: New downtown renovations, Elizabethtown . Photo
courtesy of Klein Consulting.
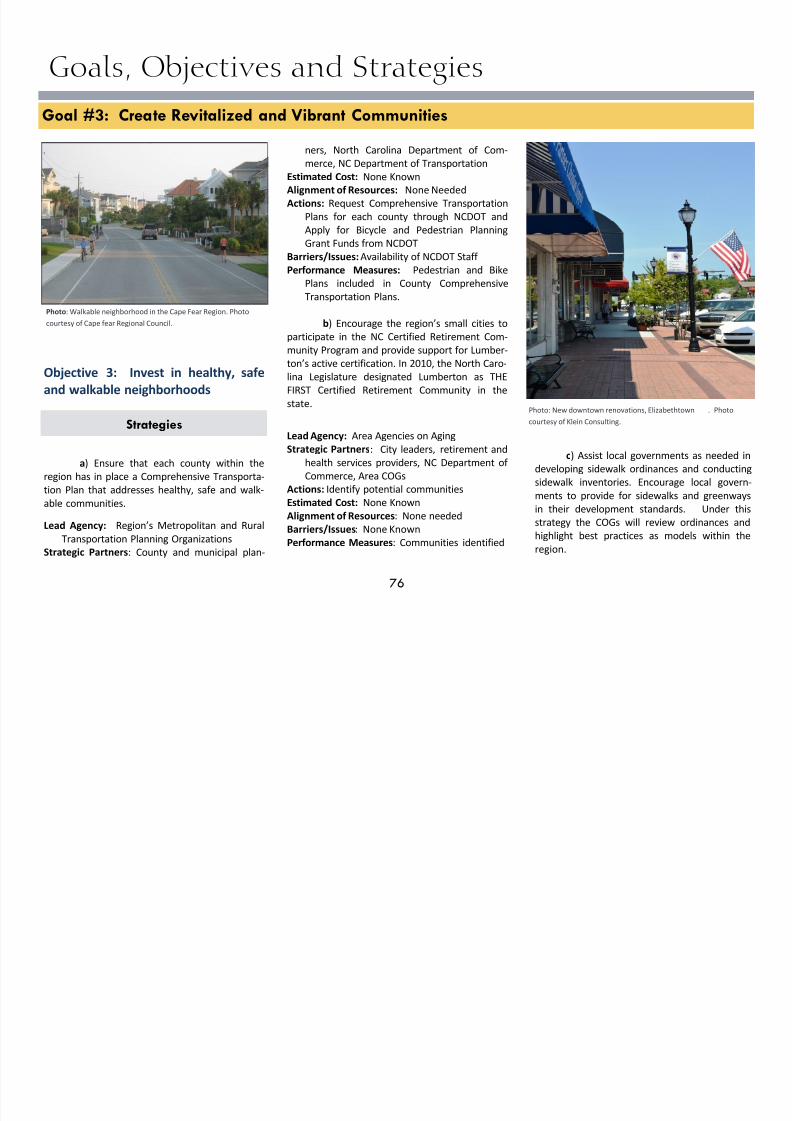
Photo: Walkable neighborhood in the Cape Fear Region. Photo
courtesy of Cape fear Regional Council.
7/30/2019 2012 Sedc Edd Nc Ceds Final
http://slidepdf.com/reader/full/2012-sedc-edd-nc-ceds-final 77/101

7/30/2019 2012 Sedc Edd Nc Ceds Final
http://slidepdf.com/reader/full/2012-sedc-edd-nc-ceds-final 78/101

7/30/2019 2012 Sedc Edd Nc Ceds Final
http://slidepdf.com/reader/full/2012-sedc-edd-nc-ceds-final 79/101

7/30/2019 2012 Sedc Edd Nc Ceds Final
http://slidepdf.com/reader/full/2012-sedc-edd-nc-ceds-final 80/101

7/30/2019 2012 Sedc Edd Nc Ceds Final
http://slidepdf.com/reader/full/2012-sedc-edd-nc-ceds-final 81/101
7/30/2019 2012 Sedc Edd Nc Ceds Final
http://slidepdf.com/reader/full/2012-sedc-edd-nc-ceds-final 82/101

7/30/2019 2012 Sedc Edd Nc Ceds Final
http://slidepdf.com/reader/full/2012-sedc-edd-nc-ceds-final 83/101
Goals, Objectives and Strategies
Goal #5: Encourage Entrepreneurs and Small Business Growth
7/30/2019 2012 Sedc Edd Nc Ceds Final
http://slidepdf.com/reader/full/2012-sedc-edd-nc-ceds-final 84/101
84
merce, US Department of Commerce,
SBTDCs:
Estimated Cost: $25,000 per year (included in
Objective 1 above)
Alignment of Resources: private contributions,
NC Department of Commerce, US Depart-
ment of Commerce
Actions: Conduct seminars, arrange consulta-tions with state and federal experts, connect
inexperienced entrepreneurs with veteran
entrepreneurs doing global trade
Barriers/Issues: Funding
Performance Measures: Increased business
activity, increased exports, increased jobs
b) Help companies understand the gov-
ernment procurement process and recognize theopportunities that government contracting can
provide.
Lead Agency: NC Military Business Center
Strategic Partners: NCSE, Entrepreneurship Cen-
ter, Small Business Centers, county economic
developers.
Estimated Cost: Unknown, to be determined by
NC Military Business Center
Alignment of Resources: NC Military Business
Center, NC Department of Commerce
Actions: Arrange seminars, conduct workshops,
connect entrepreneurs to companies experi-
enced in military procurement
Barriers/Issues: Funding
Performance Measures: Increased business ac-
tivity.
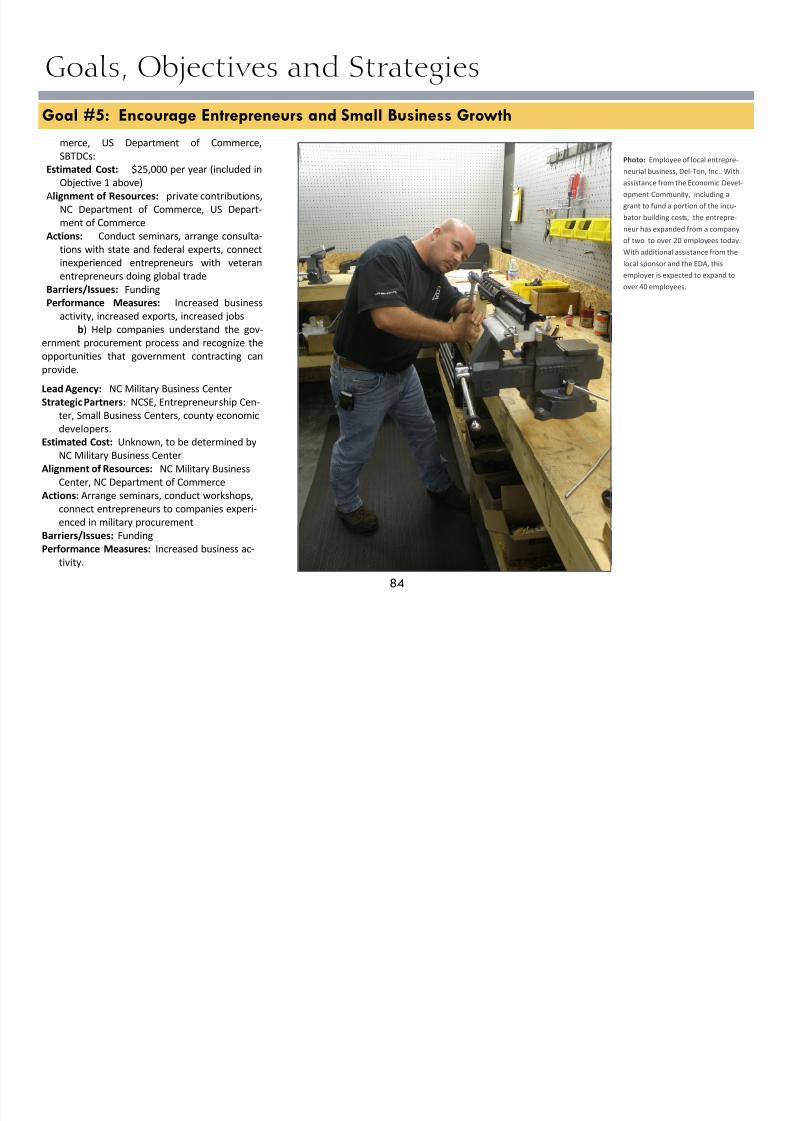
Photo: Employee of local entrepre-
neurial business, Del-Ton, Inc.. With
assistance from the Economic Devel-
opment Community, including a
grant to fund a portion of the incu-
bator building costs, the entrepre-
neur has expanded from a company
of two to over 20 employees today.
With additional assistance from the
local sponsor and the EDA, this
employer is expected to expand to
over 40 employees.

7/30/2019 2012 Sedc Edd Nc Ceds Final
http://slidepdf.com/reader/full/2012-sedc-edd-nc-ceds-final 85/101
List of Vital Projects

7/30/2019 2012 Sedc Edd Nc Ceds Final
http://slidepdf.com/reader/full/2012-sedc-edd-nc-ceds-final 86/101
86
Name Lead Agency Estimated
Cost Resource Partners Pembroke Northeast Connector Project. This project will involve the acquisition of
new right of way and construction of new tracks north of Pembroke, NC to create a
direct connection between the CSXT’s A-line and its SE-line to the Port of Wilmington.
The connection is needed to support rail transport from Fort Bragg to the Wilmington
Port (Bragg now using Charleston, SC), and expansion of exports from North Carolina
businesses including agricultural products.
NC Department
of Transporta-
tion
$14 million NC Department
of Transporta-
tion
Regions’ Regional Trans-
portation Planning Organi-
zations, Local Govern-
ments
Creating dual use of rail lines by CSX and Norfolk Southern to provide improved access
and competitive rates for businesses shipping goods by rail.
NC Department
of Transporta-
tion
TBD NC Department
of Transporta-
tion
Governor’s Logistics Task
Force, Cape Fear Area
RPO, Wilmington Urban
Area MPO, East Carolina
RPO, Goldsboro MPO
Re-establishing rail service between Whiteville, Tabor City & Conway, SC (Columbus
County) Carolina Southern Railroad suspend its service due to unsafe bridges. This rail
line provides a critical link between Columbus County industries and Horry County,
SC, and is the subject of Horry County’s unsuccessful application for 2012 TIGER IV
funds for track and bridge rehabilitation.
NCDOT coordi-
nating with
Horry County, SC
$23.2 million USDOT TIGER
funds, NCDOT
Columbus County EDC,
Cape Fear Area RPO, NCSE
Restoration of rail lines between Wallace and Castle Hayne (New Hanover County and
Pender County) About 27 miles of rail line was taken up in the early 1980’s. Restora-
tion would provide rail access from the Wilmington area to the northeast as well asanother transportation mode for the region’s agricultural products.
NC Department
of Transporta-
tion
$65,000,000 NC Department
of Transporta-
tion
Cape Fear Area RPO, Wil-
mington Urban Area MPO,
East Carolina RPO, Golds-boro MPO, NC Ports
Extend a rail spur to serve the Pender Commerce Park and other industrial sites on the US 421
corridor.
Pender County $1,032,000 NC Department of
Commerce, EDA,
NC Department of
Transportation
NC Southeast, SEDC, NC State
Ports
RAIL
List of Vital Projects
S
7/30/2019 2012 Sedc Edd Nc Ceds Final
http://slidepdf.com/reader/full/2012-sedc-edd-nc-ceds-final 87/101
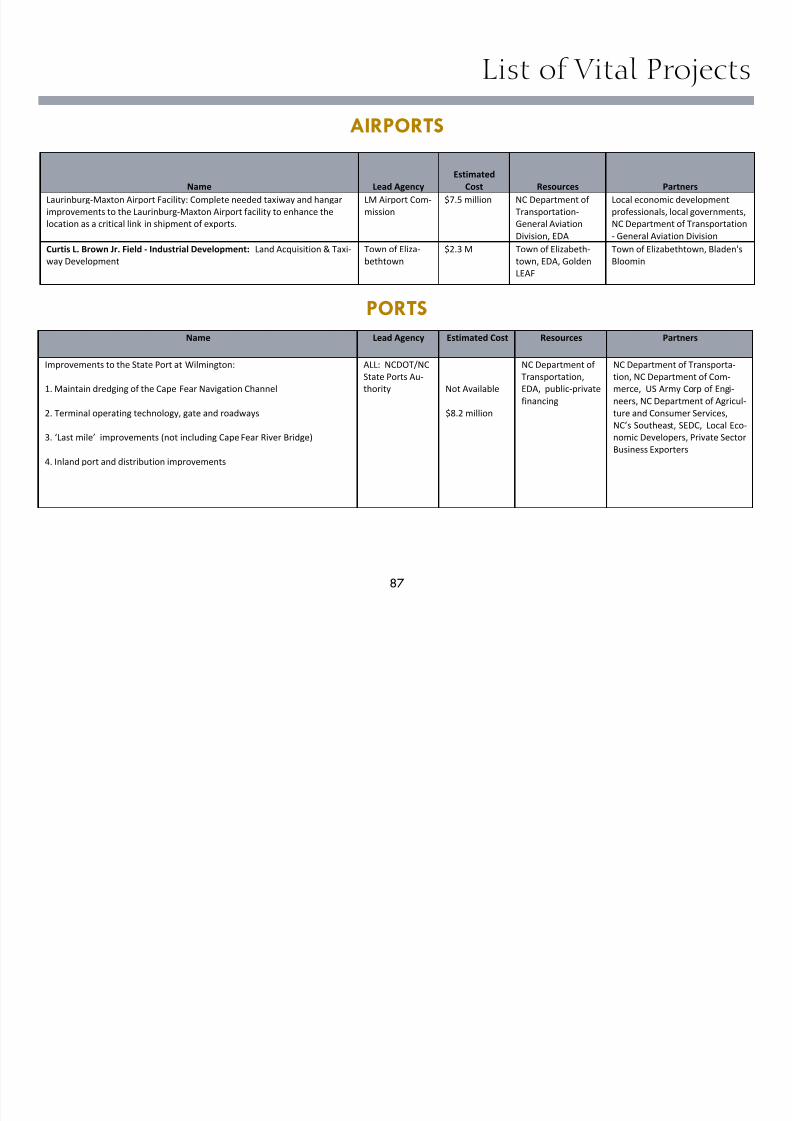
87
Name Lead Agency
Estimated
Cost Resources Partners
Laurinburg-Maxton Airport Facility: Complete needed taxiway and hangar
improvements to the Laurinburg-Maxton Airport facility to enhance the
location as a critical link in shipment of exports.
LM Airport Com-
mission
$7.5 million NC Department of
Transportation-
General Aviation
Division, EDA
Local economic development
professionals, local governments,
NC Department of Transportation
- General Aviation DivisionCurtis L. Brown Jr. Field - Industrial Development: Land Acquisition & Taxi-
way Development
Town of Eliza-
bethtown
$2.3 M Town of Elizabeth-
town, EDA, Golden
LEAF
Town of Elizabethtown, Bladen's
Bloomin
AIRPORTS
PORTS
Name Lead Agency Estimated Cost Resources Partners
Improvements to the State Port at Wilmington:
1. Maintain dredging of the Cape Fear Navigation Channel
2. Terminal operating technology, gate and roadways
3. ‘Last mile’ improvements (not including Cape Fear River Bridge)
4. Inland port and distribution improvements
ALL: NCDOT/NC
State Ports Au-
thority Not Available
$8.2 million
NC Department of
Transportation,
EDA, public-private
financing
NC Department of Transporta-
tion, NC Department of Com-
merce, US Army Corp of Engi-
neers, NC Department of Agricul-
ture and Consumer Services,
NC’s Southeast, SEDC, Local Eco-
nomic Developers, Private Sector
Business Exporters
WATER AND SEWER
List of Vital Projects
7/30/2019 2012 Sedc Edd Nc Ceds Final
http://slidepdf.com/reader/full/2012-sedc-edd-nc-ceds-final 88/101
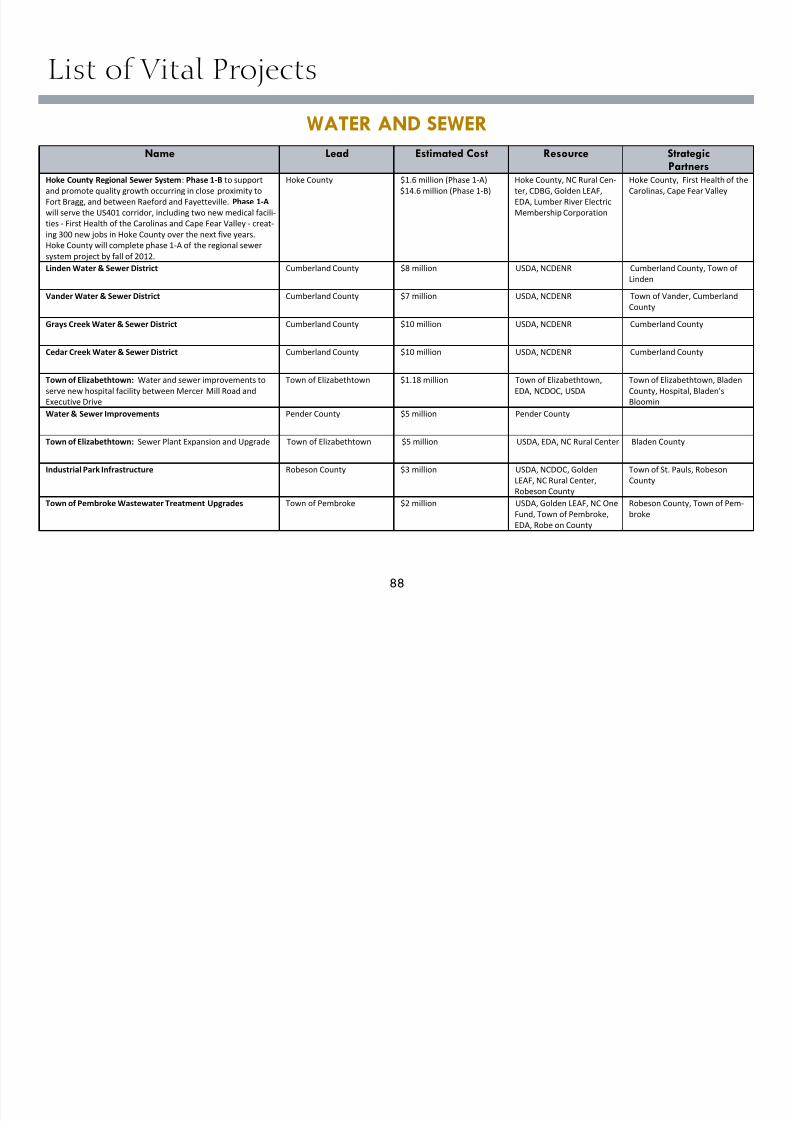
88
Name Lead Estimated Cost Resource StrategicPartners
Hoke County Regional Sewer System: Phase 1-B to support
and promote quality growth occurring in close proximity to
Fort Bragg, and between Raeford and Fayetteville. Phase 1-A
will serve the US401 corridor, including two new medical facili-
ties - First Health of the Carolinas and Cape Fear Valley - creat-
ing 300 new jobs in Hoke County over the next five years.Hoke County will complete phase 1-A of the regional sewer
system project by fall of 2012.
Hoke County $1.6 million (Phase 1-A)
$14.6 million (Phase 1-B)
Hoke County, NC Rural Cen-
ter, CDBG, Golden LEAF,
EDA, Lumber River Electric
Membership Corporation
Hoke County, First Health of the
Carolinas, Cape Fear Valley
Linden Water & Sewer District Cumberland County $8 million USDA, NCDENR Cumberland County, Town of
Linden
Vander Water & Sewer District Cumberland County $7 million USDA, NCDENR Town of Vander, Cumberland
County
Grays Creek Water & Sewer District Cumberland County $10 million USDA, NCDENR Cumberland County
Cedar Creek Water & Sewer District Cumberland County $10 million USDA, NCDENR Cumberland County
Town of Elizabethtown: Water and sewer improvements to
serve new hospital facility between Mercer Mill Road and
Executive Drive
Town of Elizabethtown $1.18 million Town of Elizabethtown,
EDA, NCDOC, USDA
Town of Elizabethtown, Bladen
County, Hospital, Bladen's
Bloomin
Water & Sewer Improvements Pender County $5 million Pender County
Town of Elizabethtown: Sewer Plant Expansion and Upgrade Town of Elizabethtown $5 million USDA, EDA, NC Rural Center Bladen County
Industrial Park Infrastructure Robeson County $3 million USDA, NCDOC, Golden
LEAF, NC Rural Center,
Robeson County
Town of St. Pauls, Robeson
County
Town of Pembroke Wastewater Treatment Upgrades Town of Pembroke $2 million USDA, Golden LEAF, NC One
Fund, Town of Pembroke,
EDA, Robe on County
Robeson County, Town of Pem-
broke
WATER AND SEWER
List of Vital Projects
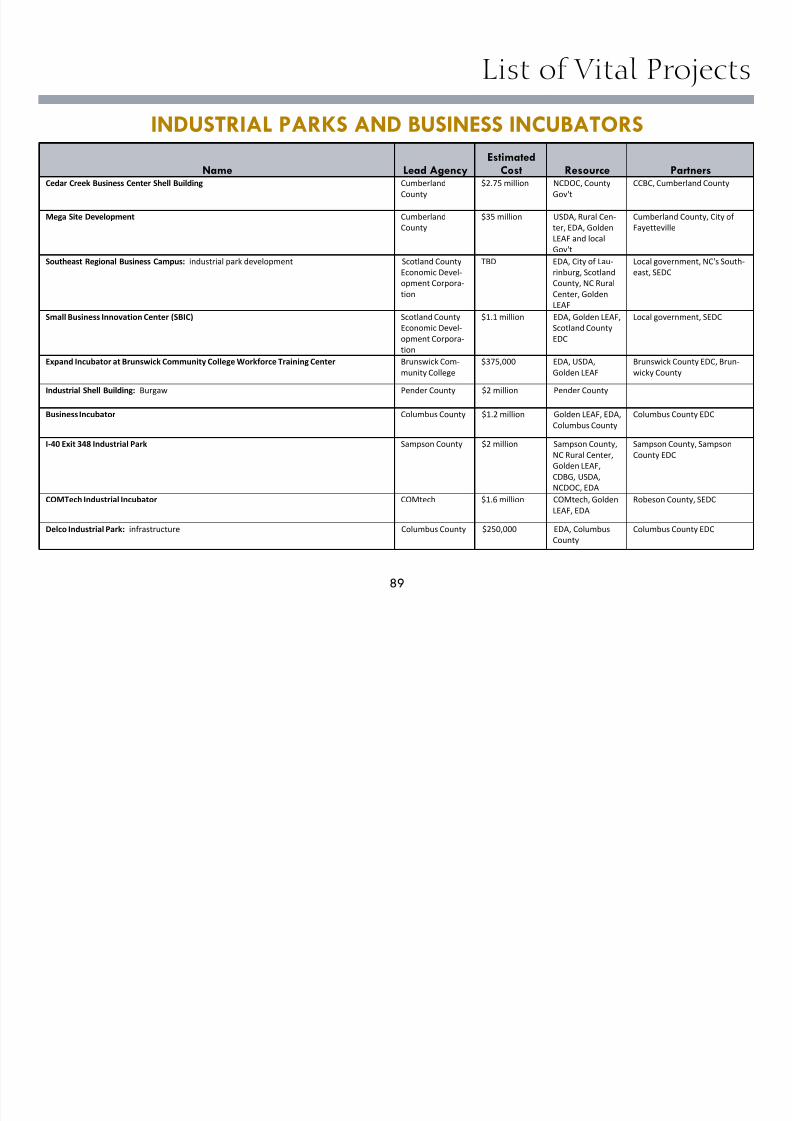
INDUSTRIAL PARKS AND BUSINESS INCUBATORS
7/30/2019 2012 Sedc Edd Nc Ceds Final
http://slidepdf.com/reader/full/2012-sedc-edd-nc-ceds-final 89/101
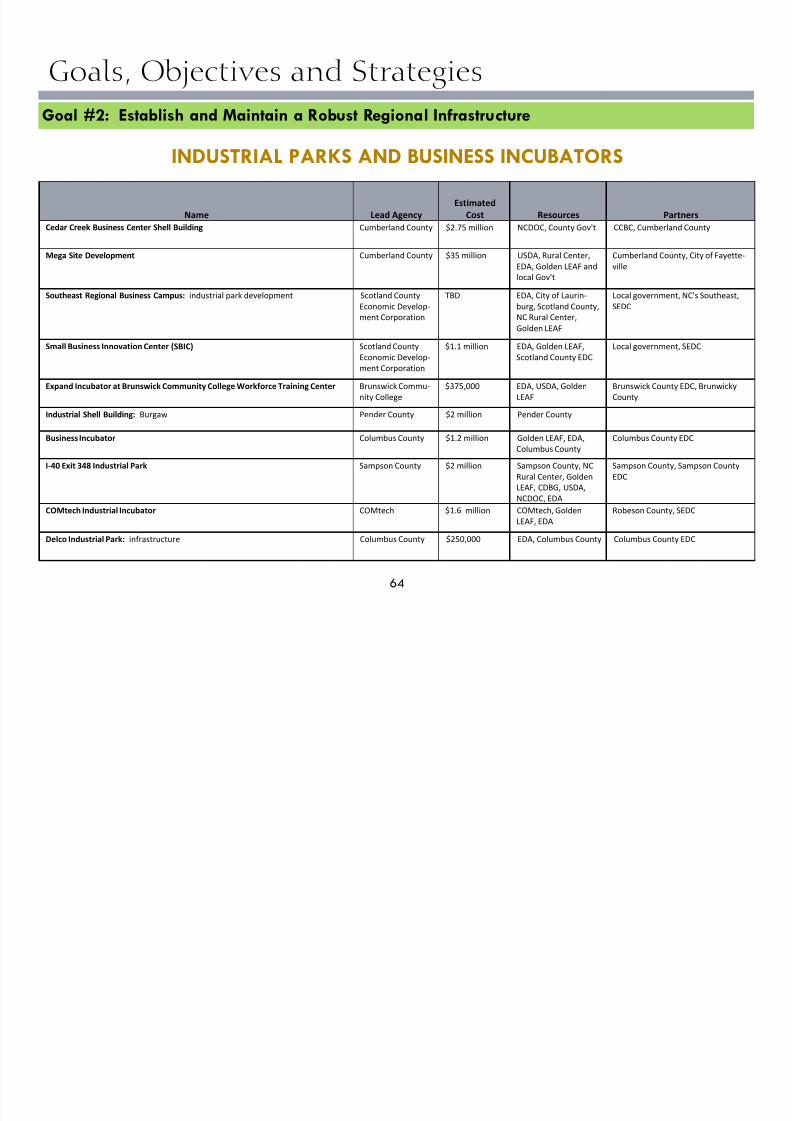
89
Name Lead Agency Estimated
Cost Resource Partners Cedar Creek Business Center Shell Building Cumberland
County
$2.75 million NCDOC, County
Gov't
CCBC, Cumberland County
Mega Site Development Cumberland
County
$35 million USDA, Rural Cen-
ter, EDA, Golden
LEAF and localGov't
Cumberland County, City of
Fayetteville
Southeast Regional Business Campus: industrial park development Scotland County
Economic Devel-
opment Corpora-
tion
TBD EDA, City of Lau-
rinburg, Scotland
County, NC Rural
Center, Golden
LEAF
Local government, NC's South-
east, SEDC
Small Business Innovation Center (SBIC) Scotland County
Economic Devel-
opment Corpora-
tion
$1.1 million EDA, Golden LEAF,
Scotland County
EDC
Local government, SEDC
Expand Incubator at Brunswick Community College Workforce Training Center Brunswick Com-
munity College
$375,000 EDA, USDA,
Golden LEAF
Brunswick County EDC, Brun-
wicky County
Industrial Shell Building: Burgaw Pender County $2 million Pender County
Business Incubator Columbus County $1.2 million Golden LEAF, EDA,
Columbus County
Columbus County EDC
I-40 Exit 348 Industrial Park Sampson County $2 million Sampson County,
NC Rural Center,
Golden LEAF,
CDBG, USDA,
NCDOC, EDA
Sampson County, Sampson
County EDC
COMTech Industrial Incubator COMtech $1.6 million COMtech, Golden
LEAF, EDA
Robeson County, SEDC
Delco Industrial Park: infrastructure Columbus County $250,000 EDA, Columbus
County
Columbus County EDC
INDUSTRIAL PARKS AND BUSINESS INCUBATORS
List of Vital Projects
INDUSTRIAL PARKS AND BUSINESS INCUBATORS (continued)

7/30/2019 2012 Sedc Edd Nc Ceds Final
http://slidepdf.com/reader/full/2012-sedc-edd-nc-ceds-final 90/101
90
Name Lead Estimated Cost Resource StrategicPartners
I-40 Exit 355 Industrial Park Sampson County $9 M Sampson County, NC Rural
Center, Golden LEAF, CDBG,
USDA, NCDOC
Sampson County, Sampson
County EDC
I-40 Exit 364/NC-24 Industrial Corridor Sampson County $10 M Sampson County, NC Rural
Center, Golden LEAF, CDBG,
USDA, NCDOC, EDA
Sampson County, Sampson
County EDC
UNCP Entrepreneurship Incubator University of NC at Pem-
broke
$ 1.9 M UNCP Foundation, Golden
LEAF, EDA
UNCP, SEDC, Town of Pembroke
Columbus Alternative Energy and Biotechnology Center:
infrastructure
Columbus County $100,000 EDA, Columbus County Columbus County EDC, NC Bio-
technology Center - SE Office
Natural Gas to the Elizabethtown Industrial Park Bladen's Bloomin' Agri-
Industrial, Inc.
$5 M Bladen County, Town of
Elizabethtown, State &
Federal Funding
Bladen County, Bladen's
Bloomin', Town of Elizabeth-
town
Industrial Park Improvements: US 421 Pender County $1.5 M Pender County, EDA,
Golden LEAF
Wilmington Development, Inc.,
Pender County
INDUSTRIAL PARKS AND BUSINESS INCUBATORS (continued)

7/30/2019 2012 Sedc Edd Nc Ceds Final
http://slidepdf.com/reader/full/2012-sedc-edd-nc-ceds-final 91/101

7/30/2019 2012 Sedc Edd Nc Ceds Final
http://slidepdf.com/reader/full/2012-sedc-edd-nc-ceds-final 92/101

7/30/2019 2012 Sedc Edd Nc Ceds Final
http://slidepdf.com/reader/full/2012-sedc-edd-nc-ceds-final 93/101
93
Appendices Appendices Appendices Appendices
Appendix I
Members of the SEDC Comprehensive Economic Development Strategy Advisory Committee

7/30/2019 2012 Sedc Edd Nc Ceds Final
http://slidepdf.com/reader/full/2012-sedc-edd-nc-ceds-final 94/101
94
2012 Southeastern Economic Development Commission CEDS Advisory Committee
Private Representation (14)
Leon Martin, Senior Vice President, First Citizens Bank (Bladen)Henry Edmund, President, Security Savings (Brunswick)Don Hughes, Vice President of Operations, Brunswick EMC (Brunswick)Dean Hilton, Vice President, Hilton Action & Realty (Bladen)Paul Barnes, Vice President of Sales & Marketing, Aberdeen & Rockfish RR Co.Brett Bostic, President, Bostic Building (New Hanover)Jimmy Smith, Director of Economic & Community Development (Pender)Glen Walters, Senior VP, Regional Executive, Lumbee Guaranty Bank (Robeson)Randall Jones, Public Relations, Lumber River EMC (Robeson)Barbara Knight, Human Resources Director, DuPont Fayetteville Works (Cumberland)Jay Todd, Chief Operating Officer, Service Thread (Scotland)Wade Dunbar, President, Dunbar Insurance (Scotland)Jerry Milton, Vice President, Southeastern Interiors (Harnett)Jill Smith, Director, Safety, Campbell Oil Company (Bladen)
Public and Non-Profit Representation (12)
Chuck Heustess, Director, Bladen’s Bloomin’ Agri-Industrial, Inc. (Bladen)Gary Lanier, Director, Columbus County EDC (Columbus)Amy Cannon, Deputy County Manager, County of Cumberland (Cumberland)
Linda Revels, Board Clerk, County of Hoke (Hoke)Randall Johnson, Executive Director, NC Biotechnology Center (New Hanover)Mark Lanier, Chancellor’s Office, University of NC at Wilmington (New Hanover)Rick Sago, County Manager & Economic Developer, County of Richmond (Richmond)Jimmy Tate, County Commissioner, County of Pender (Pender)Blondell McIntyre, Administrator, Lumber River Workforce Development BoardJohn Swope, Executive Director, Sampson County EDC (Sampson)Charles Chrestman, President, Robeson Community College (Robeson)Greg Taylor, Executive Director, Fort Bragg Regional Alliance (Cumberland)

7/30/2019 2012 Sedc Edd Nc Ceds Final
http://slidepdf.com/reader/full/2012-sedc-edd-nc-ceds-final 95/101
Appendix III
Southeastern Economic Development Commission 2012 Board of DirectorsSoutheastern Economic Development Commission 2012 Board of DirectorsSoutheastern Economic Development Commission 2012 Board of DirectorsSoutheastern Economic Development Commission 2012 Board of Directors

7/30/2019 2012 Sedc Edd Nc Ceds Final
http://slidepdf.com/reader/full/2012-sedc-edd-nc-ceds-final 96/101
96
Mr. Chuck Heustess, Vice Chairman, Bladen County
• Executive Director, Bladen County EDC
Mr. Don Hughes, Brunswick County
• VP Operations, Brunswick EMC
Mr. Gary Lanier, Columbus County
• Executive Director, Columbus County EDC
Ms. Amy Cannon, Cumberland County
• Deputy County Manager, County of Cumberland (Cumberland)
Mr. Carnell Robinson, Harnett County
• Mayor Pro Tem, Town of Dunn
Ms. Linda Revels, Hoke County
• Clerk, County of Hoke Board of Commissioners
Mr. Randall Johnson, New Hanover County
• Executive Director, NC Biotechnology Center—Southeast Office
Mr. Jimmy Tate, Pender County
• County Commissioner, County of Pender
Mr. Rick Sago, Richmond County
• County Manager & Economic Developer, County of Richmond
Mr. Hubert Sealey, Robeson County
• County Commissioner, County of Robeson
Mr. John Swope, Chairman, Sampson County
• Executive Director, Sampson County EDC
Mr. Greg Icard, Secretary-Treasurer, Scotland County
• Executive Director, Scotland County EDC

7/30/2019 2012 Sedc Edd Nc Ceds Final
http://slidepdf.com/reader/full/2012-sedc-edd-nc-ceds-final 97/101
97
ReferencesReferencesReferencesReferences
References
Battelle Memorial Institute’s Technology Partnership Practice (August 2010). Evidence and Opportunity: Biotechnology Impacts in North Carolina.

7/30/2019 2012 Sedc Edd Nc Ceds Final
http://slidepdf.com/reader/full/2012-sedc-edd-nc-ceds-final 98/101
98
attelle Memorial Institute s Technology Partnership Practice (August 0 0). vidence and Opportunity: iotechnology Impacts in North Carolina.
Bhadruy and Troy. (December 2011). An Investigation of Economic Development in North Carolina Through Logistics Villages- Southeast Region Report
Fort Bragg Regional Alliance. Economic Transformation. Retrieved at http://www.bracrtf.com/transformation.php.
Frank, Riverman and Company. (August 2011) The Economic Impact of Wine and Grapes in the State.
Institute for Transportation Research and Education, NC State University (2009). Economic Value of North Carolina Ports. Retrieved from http://www.ncports.com/elements/old/userfiles/Economic%20Contribution%20Final%20Report%20ITRE.pdf
NADO Research Foundation. (February 2012). Freight Transportation and Economic Development: Planning for the Panama Canal Expansion.
NADO Research Foundation. (December 2011). Growing Your Region's Economy with Small Business and Entrepreneurs.
NADO Research Foundation. (September 2011). Regional Approaches to Sustainable Development: Linking Economic, Transportation, and Environmental In-
frastructure in Rural and Small Metropolitan America.
NCBiofuels. (2012). Energy grasses as feedstock crops. Retrieved at www/biofuelscenter.org/index.php/feedstocks/energy-grasses.
NC Department of Commerce. (May 2003). Robeson County I-95/US-74 Commerce and Industrial Park Master Plan.
NC Employment Security Commission. (2012). Quarterly Census of Employment and Wages- 2000 through 2011. Retrieved at http://esesc23.esc.state.nc.us/
d4.
NC Department of Public Instruction. (2012). 2010-2011 Consolidated Data Report: Table D5: High School Dropout Counts and Rates 2006-2007 through 2010-
2011, pages 129-132.
NC Forest Service. (2011). NC Forest Assessment Report. Retrieved from www.ncforestassessment.com.
References
NC Regional Councils. (2012). 2012 North Carolina Tomorrow Manual.

7/30/2019 2012 Sedc Edd Nc Ceds Final
http://slidepdf.com/reader/full/2012-sedc-edd-nc-ceds-final 99/101
99
NC State Board of Education, NC Department of Public Instruction. (2012). North Carolina's Science, Technology, Engineering and Mathematics (STEM) Educa-
tion Strategic Plan.
NCDOT Rail Division. (2012) North Carolina Railroad Directory. Retrieved at www.bytrain.org.
NCDOT Research Division. (2010) Seven Portals Study- Southeastern North Carolina Report. Retrieved at www.ncdot.gov/doh/preconstruct/tpb/research/
download/2010-34-3southeastregionreport.pdf.
North Carolina Commission on Workforce Development .(2012). Preparing North Carolina's Workforce and Businesses for the Global Economy. Retrieved at
www.nccommerce.com/workforce/report.
North Carolina Department of Agriculture and Consumer Services. (2012) NC Agricultural Export Statistics. Retrieved at: http://www.ncagr.gov/markets/ international/NCAgExportStatistics.htm
North Carolina Governor's Logsitics Task Force. (August 2011) Commerce Subcommittee Report. Retrieved at www.ncdot.gov.
North Carolina Health Professionals Data System. (2000). 2000 Health Professionals per 10,000 Population. Cecil G. Sheps Center for Health Services Research,
UNC-Chapel Hill.
North Carolina Health Professionals Data System. (2010). 2010 Health Professionals per 10,000 Population. Cecil G. Sheps Center for Health Services Research,
UNC-Chapel Hill.
North Carolina Health Professionals Data System. (2010). 2010 Total and Primary Care Physicians (by County). Cecil G. Sheps Center for Health Services Re-
search, UNC-Chapel Hill.
References
North Carolina Housing Finance Agency. (December 2010). County Housing Facts. Retrieved from www.nchfa.org.
North Carolina's Southeast. (2012) Strategic Marketing Plan 2012-2013.
7/30/2019 2012 Sedc Edd Nc Ceds Final
http://slidepdf.com/reader/full/2012-sedc-edd-nc-ceds-final 100/101
100
North Carolina s Southeast. (2012) Strategic Marketing Plan 2012 2013.
North Carolina's Southeast. (2012). Regional Profile. Retrieved at www.ncse.org/regional-clusters/regional-profile.
North Carolina's Southeast. (2011). 2011 State of the Region: Annual Economic Indicators Report.
Porter, Michael. (2012) The Institute for Strategy and Competitiveness, Harvard Business School. Competition and Economic Development. Retrieved at
http://www.isc.hbs.edu/econ-clusters.htm
STATS America - USA Counties IN Profile. (2010). Retrieved at www.statsamerica.org/profiles/.
The PILOT, Chamber Program Highlights Military Impact. Retrieved at http://www.thepilot.com/news/2011/apr/13/chamber-program-highlights-military-
impact/
US Census Bureau. (2010). North Carolina QuickFacts (by County). Retrieved at http://quickfacts.census.gov/qfd/states/37000.html.
US Census Bureau, American Factfinder2. (2010). General Housing Characteristics 2010 (by County). Retrieved at http://factfinder2.census.gov.
US Census Bureau, American Factfinder2. (2010). Selected Economic Characteristics 2006-2010 American Community Survey 5-Year Estimates (by County).
Retrieved at http://factfinder2.census.gov.
US Census Bureau, American Factfinder2. (2000). Profile of Selected Economic Characteristics:2000. Retrieved at http://factfinder2.census.gov.
US Census Bureau, American FactFinder2. (2010). Selected Social Characteristics in the United States, 2006-2010 American Community Survey 5-Year Esti-
mates. Retrieved at http://factfinder2.census.gov.
Rollins, Wayne. (2010). Vision East Regional Overview: Allied Health Occupation Report.
Vision East. (2010) Rank Clusters Report-Projected. Retrieved at www.ncvisioneast.org.

7/30/2019 2012 Sedc Edd Nc Ceds Final
http://slidepdf.com/reader/full/2012-sedc-edd-nc-ceds-final 101/101
101
This report was prepared under an award
from the U.S. Department of Commerce, Economic Development Administration.
Investment Award Number
04-83-06654