ceds 2018-2023 110117
TRANSCRIPT
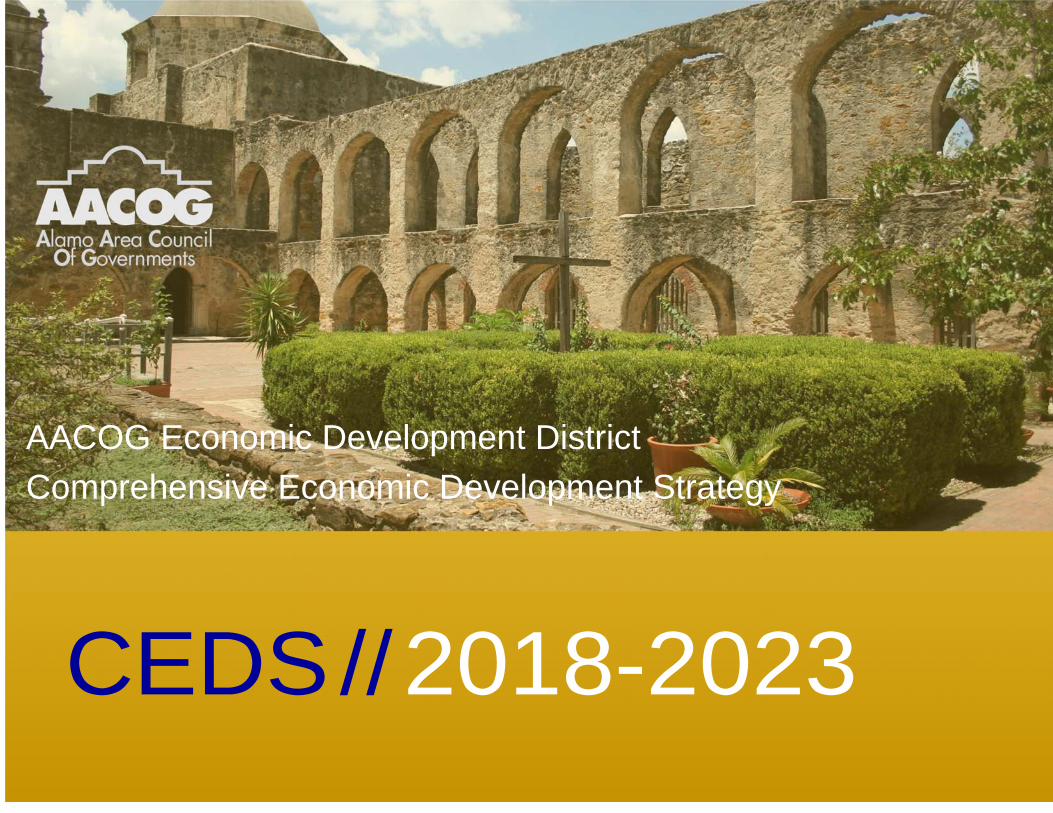
AACOG Economic Development District Comprehensive Economic Development Strategy
CEDS // 2018-2023
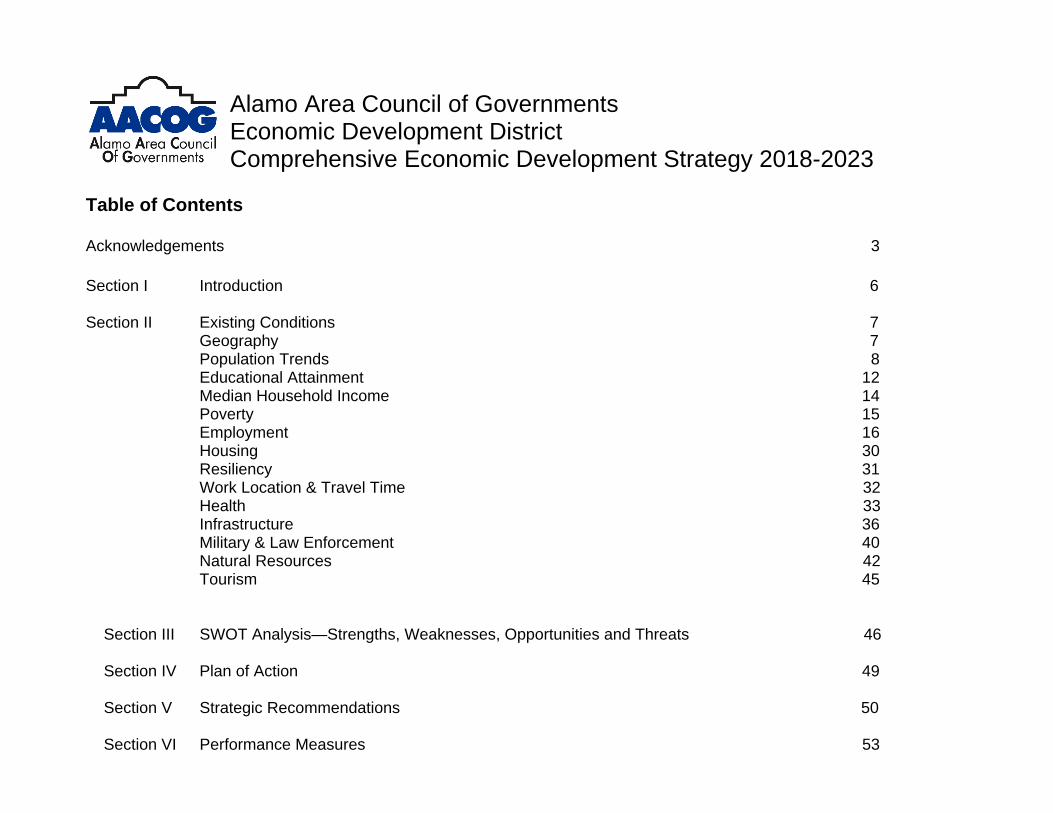
Alamo Area Council of Governments Economic Development District Comprehensive Economic Development Strategy 2018-2023
Table of Contents Acknowledgements 3 Section I Introduction 6 Section II Existing Conditions 7 Geography 7 Population Trends 8 Educational Attainment 12 Median Household Income 14 Poverty 15 Employment 16 Housing 30 Resiliency 31 Work Location & Travel Time 32 Health 33 Infrastructure 36 Military & Law Enforcement 40 Natural Resources 42 Tourism 45
Section III SWOT Analysis—Strengths, Weaknesses, Opportunities and Threats 46 Section IV Plan of Action 49 Section V Strategic Recommendations 50
Section VI Performance Measures 53

ACKNOWLEDGEMENTS Alamo Area Council of Governments (AACOG) Economic Development District (EDD) makes a concerted effort to ensure the region’s diversity is reflected in the membership of the Comprehensive Economic Development Strategy (CEDS) Committee.
The CEDS Committee includes: Allison Blazosky, Alamo Area MPO Rusty Brockman, New Braunfels EDC Tracey Campos, San Antonio EDF Art Crawford, Bandera EDC Mayor James Danner, City of Hondo Arnie Dollase, Castroville Area EDC Yvonne Griffin, City of La Vernia Johnny Huizar, City of Pleasanton Kyle Kinateder, Schertz EDC Ray Kroll, Karnes County EDC Tim Lehmberg, Gillespie County EDC Mark Luft, Cibolo EDC Misty Mayo, Boerne Kendall County EDC Sherry Mosier, Bulverde/Spring Branch EDF Mayor Mary Ann Obregon, City of Dilley Brian O’Connor, Kerr County EDC Col. Jesse Perez, Hondo EDC Mindy Riley, City of Floresville Dora Rodriguez, City of Devine Josh Schneuker, Seguin EDC Melissa Shannon, Bexar County ED Skadi Tirpak, City of San Antonio ED Mayor Robert Williams, City of Jourdanton
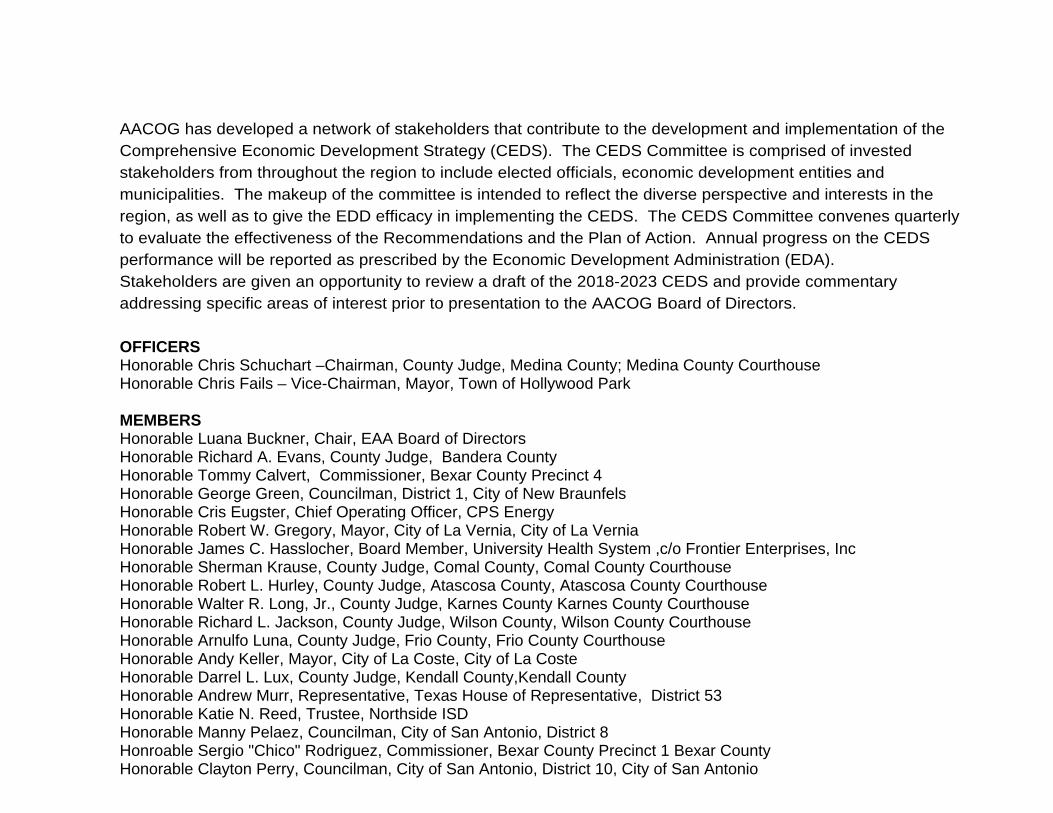
AACOG has developed a network of stakeholders that contribute to the development and implementation of the Comprehensive Economic Development Strategy (CEDS). The CEDS Committee is comprised of invested stakeholders from throughout the region to include elected officials, economic development entities and municipalities. The makeup of the committee is intended to reflect the diverse perspective and interests in the region, as well as to give the EDD efficacy in implementing the CEDS. The CEDS Committee convenes quarterly to evaluate the effectiveness of the Recommendations and the Plan of Action. Annual progress on the CEDS performance will be reported as prescribed by the Economic Development Administration (EDA). Stakeholders are given an opportunity to review a draft of the 2018-2023 CEDS and provide commentary addressing specific areas of interest prior to presentation to the AACOG Board of Directors. OFFICERS Honorable Chris Schuchart –Chairman, County Judge, Medina County; Medina County Courthouse Honorable Chris Fails – Vice-Chairman, Mayor, Town of Hollywood Park MEMBERS Honorable Luana Buckner, Chair, EAA Board of Directors Honorable Richard A. Evans, County Judge, Bandera County Honorable Tommy Calvert, Commissioner, Bexar County Precinct 4 Honorable George Green, Councilman, District 1, City of New Braunfels Honorable Cris Eugster, Chief Operating Officer, CPS Energy Honorable Robert W. Gregory, Mayor, City of La Vernia, City of La Vernia Honorable James C. Hasslocher, Board Member, University Health System ,c/o Frontier Enterprises, Inc Honorable Sherman Krause, County Judge, Comal County, Comal County Courthouse Honorable Robert L. Hurley, County Judge, Atascosa County, Atascosa County Courthouse Honorable Walter R. Long, Jr., County Judge, Karnes County Karnes County Courthouse Honorable Richard L. Jackson, County Judge, Wilson County, Wilson County Courthouse Honorable Arnulfo Luna, County Judge, Frio County, Frio County Courthouse Honorable Andy Keller, Mayor, City of La Coste, City of La Coste Honorable Darrel L. Lux, County Judge, Kendall County,Kendall County Honorable Andrew Murr, Representative, Texas House of Representative, District 53 Honorable Katie N. Reed, Trustee, Northside ISD Honorable Manny Pelaez, Councilman, City of San Antonio, District 8 Honroable Sergio "Chico" Rodriguez, Commissioner, Bexar County Precinct 1 Bexar County Honorable Clayton Perry, Councilman, City of San Antonio, District 10, City of San Antonio
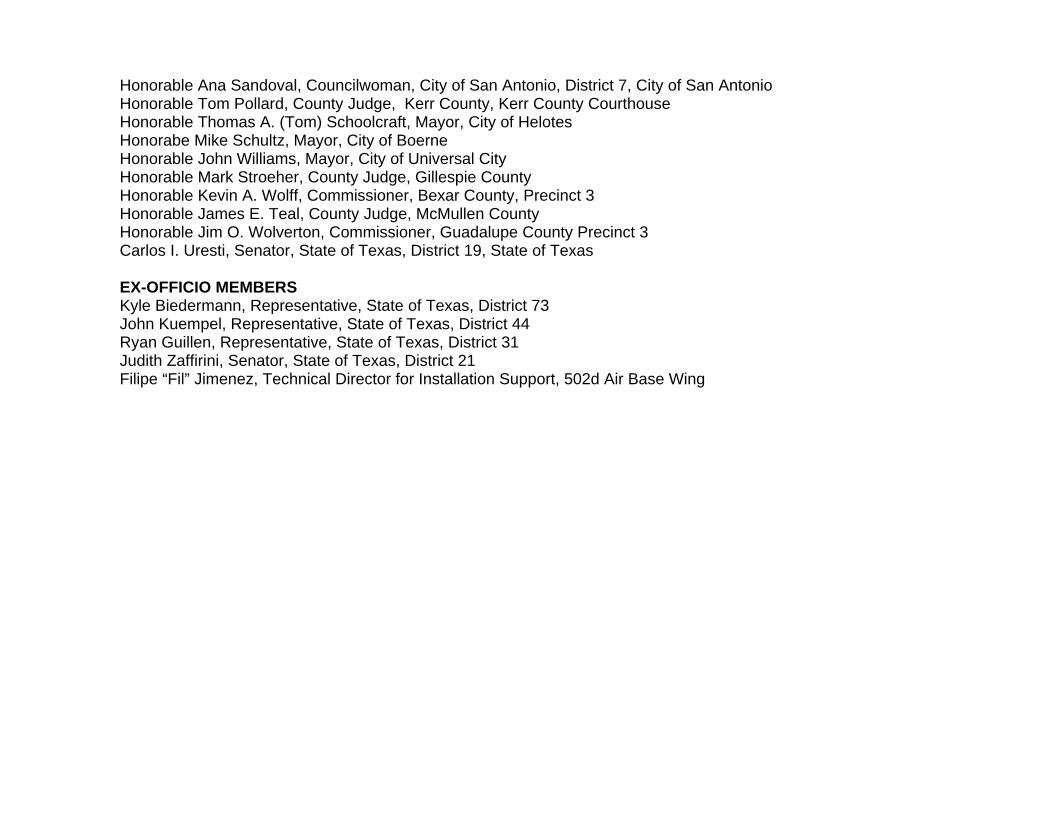
Honorable Ana Sandoval, Councilwoman, City of San Antonio, District 7, City of San Antonio Honorable Tom Pollard, County Judge, Kerr County, Kerr County Courthouse Honorable Thomas A. (Tom) Schoolcraft, Mayor, City of Helotes Honorabe Mike Schultz, Mayor, City of Boerne Honorable John Williams, Mayor, City of Universal City Honorable Mark Stroeher, County Judge, Gillespie County Honorable Kevin A. Wolff, Commissioner, Bexar County, Precinct 3 Honorable James E. Teal, County Judge, McMullen County Honorable Jim O. Wolverton, Commissioner, Guadalupe County Precinct 3 Carlos I. Uresti, Senator, State of Texas, District 19, State of Texas EX-OFFICIO MEMBERS Kyle Biedermann, Representative, State of Texas, District 73 John Kuempel, Representative, State of Texas, District 44 Ryan Guillen, Representative, State of Texas, District 31 Judith Zaffirini, Senator, State of Texas, District 21 Filipe “Fil” Jimenez, Technical Director for Installation Support, 502d Air Base Wing
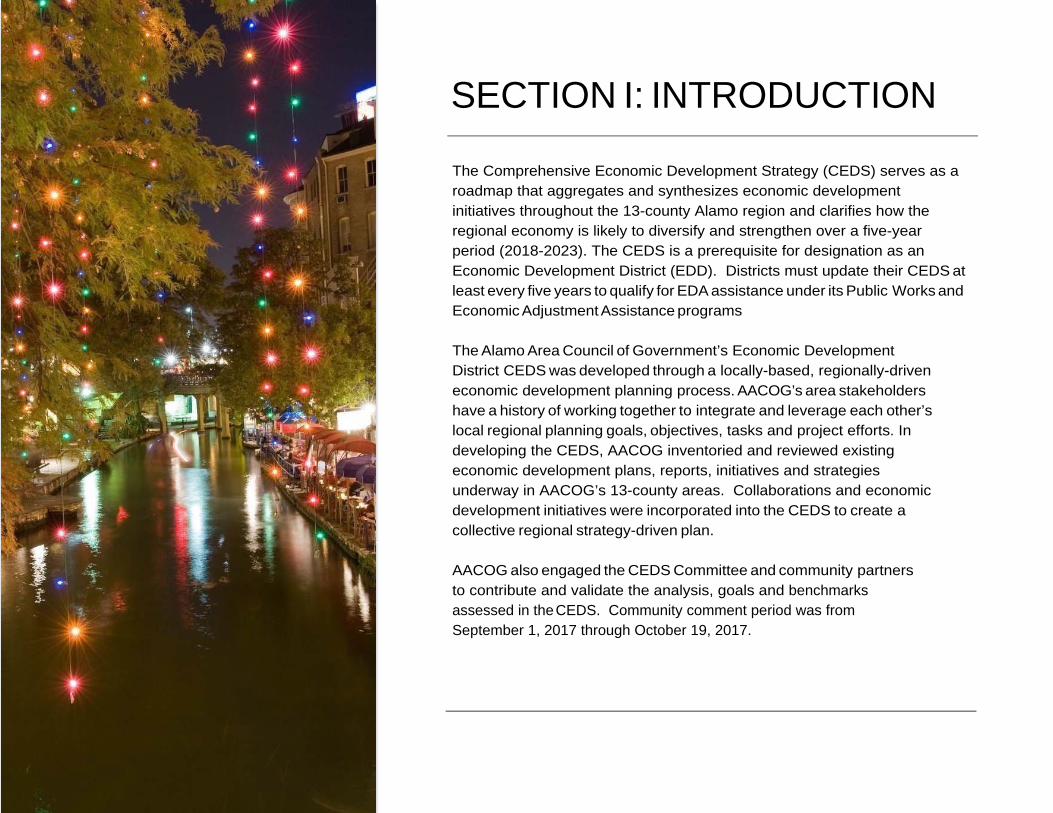
SECTION I: INTRODUCTION
The Comprehensive Economic Development Strategy (CEDS) serves as a roadmap that aggregates and synthesizes economic development initiatives throughout the 13-county Alamo region and clarifies how the regional economy is likely to diversify and strengthen over a five-year period (2018-2023). The CEDS is a prerequisite for designation as an Economic Development District (EDD). Districts must update their CEDS at least every five years to qualify for EDA assistance under its Public Works and Economic Adjustment Assistance programs
The Alamo Area Council of Government’s Economic Development District CEDS was developed through a locally-based, regionally-driven economic development planning process. AACOG’s area stakeholders have a history of working together to integrate and leverage each other’s local regional planning goals, objectives, tasks and project efforts. In developing the CEDS, AACOG inventoried and reviewed existing economic development plans, reports, initiatives and strategies underway in AACOG’s 13-county areas. Collaborations and economic development initiatives were incorporated into the CEDS to create a collective regional strategy-driven plan.
AACOG also engaged the CEDS Committee and community partners to contribute and validate the analysis, goals and benchmarks assessed in the CEDS. Community comment period was from September 1, 2017 through October 19, 2017.

SECTION II: EXISTING CONDITIONS
Land Density Table 1 GEOGRAPHY The Alamo Area Council of Governments (AACOG) region is comprised of thirteen counties: Atascosa, Bandera, Bexar, Comal, Frio, Gillespie, Guadalupe, Karnes, Kendall, Kerr, Medina, McMullen and Wilson.
The 13-county region consists of approximately 12,494.70 square miles. Based on 2010 U.S. Census data, the regional area has a population density of approximately 180 residents per square mile compared to a statewide density of approximately 97 residents per square mile.
The largest counties in the region are Medina County (approximately 1,325 square miles), Bexar County (approximately 1,239 square miles) and Atascosa County (approximately 1,219 square miles) of land.
Approximately 17% of McMullen County and approximately 16% of Bexar County is covered by surface water (rivers, reservoirs, etc.). The land topography for the 13-county region is a variation described as irregular plains and plains with high and open hills.
Area
Population density
Population
Land Area
Water Area
Atascosa 36.8 44,911 1,219.50 1.90
Bandera 25.9 20,485 791 6.70
Bexar 1383.1 1,714,773 1,239.80 16.30
Comal 193.9 108,472 559.50 15.40
Frio 15.2 17,217 1,133.50 0.90
Gillespie 23.5 24,837 1,058.20 3.50
Guadalupe 184.9 131,533 711.30 3.50
Karnes 19.8 14,824 747.60 6.00
Kendall 50.4 33,410 662.5 0.60
Kerr 45 49,625 1,103.30 4.00
McMullen 0.6 707 1,139.40 17.40
Medina 34.7 46,006 1,325.40 9.20
Wilson 53.4 42,918 803.7 4.70
Total 13-Counties 179.99 2,249,018 12,494.70 90.10
Source: 2010 U. S. Census Bureau
POPULATION TRENDS
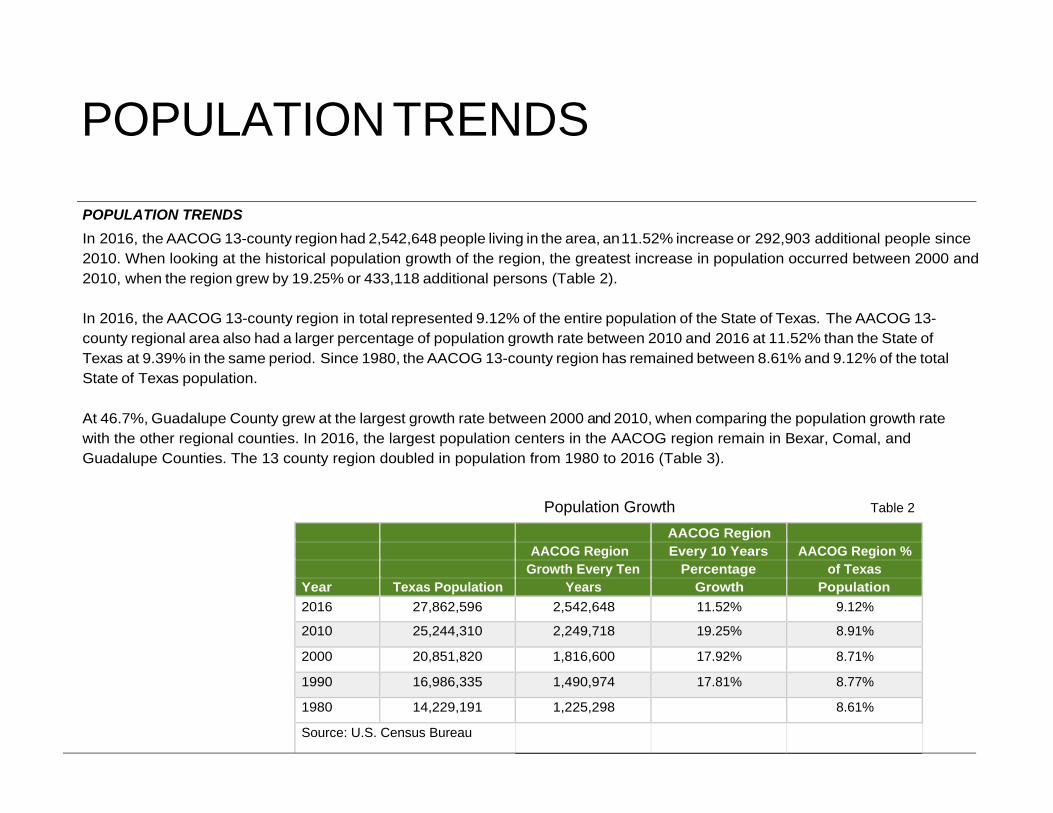
POPULATION TRENDS In 2016, the AACOG 13-county region had 2,542,648 people living in the area, an 11.52% increase or 292,903 additional people since 2010. When looking at the historical population growth of the region, the greatest increase in population occurred between 2000 and 2010, when the region grew by 19.25% or 433,118 additional persons (Table 2).
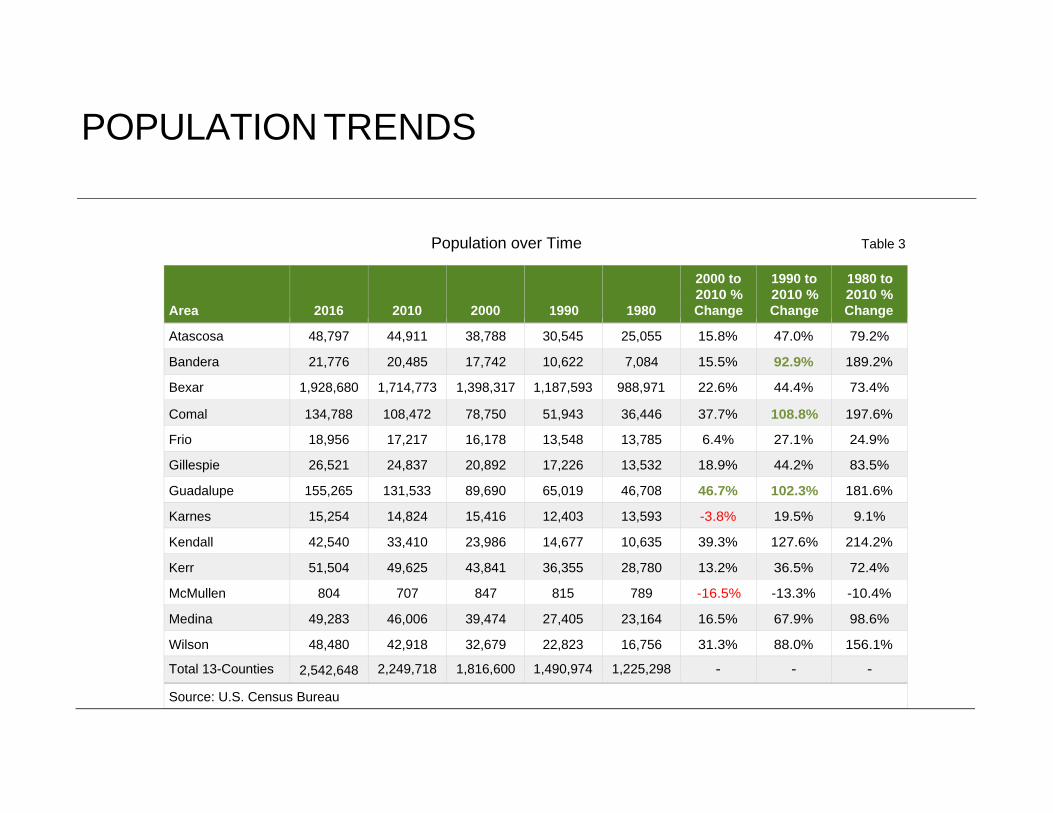
In 2016, the AACOG 13-county region in total represented 9.12% of the entire population of the State of Texas. The AACOG 13- county regional area also had a larger percentage of population growth rate between 2010 and 2016 at 11.52% than the State of Texas at 9.39% in the same period. Since 1980, the AACOG 13-county region has remained between 8.61% and 9.12% of the total State of Texas population. At 46.7%, Guadalupe County grew at the largest growth rate between 2000 and 2010, when comparing the population growth rate with the other regional counties. In 2016, the largest population centers in the AACOG region remain in Bexar, Comal, and Guadalupe Counties. The 13 county region doubled in population from 1980 to 2016 (Table 3).
Population Growth Table 2
AACOG Region AACOG Region Every 10 Years AACOG Region % Growth Every Ten Percentage of Texas Year Texas Population Years Growth Population
2016 27,862,596 2,542,648 11.52% 9.12%
2010 25,244,310 2,249,718 19.25% 8.91%
2000 20,851,820 1,816,600 17.92% 8.71%
1990 16,986,335 1,490,974 17.81% 8.77%
1980 14,229,191 1,225,298 8.61%
Source: U.S. Census Bureau
POPULATION TRENDS
Population over Time Table 3
Area
2016
2010
2000
1990
1980
2000 to 2010 % Change
1990 to 2010 % Change
1980 to 2010 % Change
Atascosa 48,797 44,911 38,788 30,545 25,055 15.8% 47.0% 79.2%
Bandera 21,776 20,485 17,742 10,622 7,084 15.5% 92.9% 189.2%
Bexar 1,928,680 1,714,773 1,398,317 1,187,593 988,971 22.6% 44.4% 73.4%
Comal 134,788 108,472 78,750 51,943 36,446 37.7% 108.8% 197.6%
Frio 18,956 17,217 16,178 13,548 13,785 6.4% 27.1% 24.9%
Gillespie 26,521 24,837 20,892 17,226 13,532 18.9% 44.2% 83.5%
Guadalupe 155,265 131,533 89,690 65,019 46,708 46.7% 102.3% 181.6%
Karnes 15,254 14,824 15,416 12,403 13,593 -3.8% 19.5% 9.1%
Kendall 42,540 33,410 23,986 14,677 10,635 39.3% 127.6% 214.2%
Kerr 51,504 49,625 43,841 36,355 28,780 13.2% 36.5% 72.4%
McMullen 804 707 847 815 789 -16.5% -13.3% -10.4%
Medina 49,283 46,006 39,474 27,405 23,164 16.5% 67.9% 98.6%
Wilson 48,480 42,918 32,679 22,823 16,756 31.3% 88.0% 156.1%
Total 13-Counties 2,542,648 2,249,718 1,816,600 1,490,974 1,225,298 - - -
Source: U.S. Census Bureau
POPULATION TRENDS
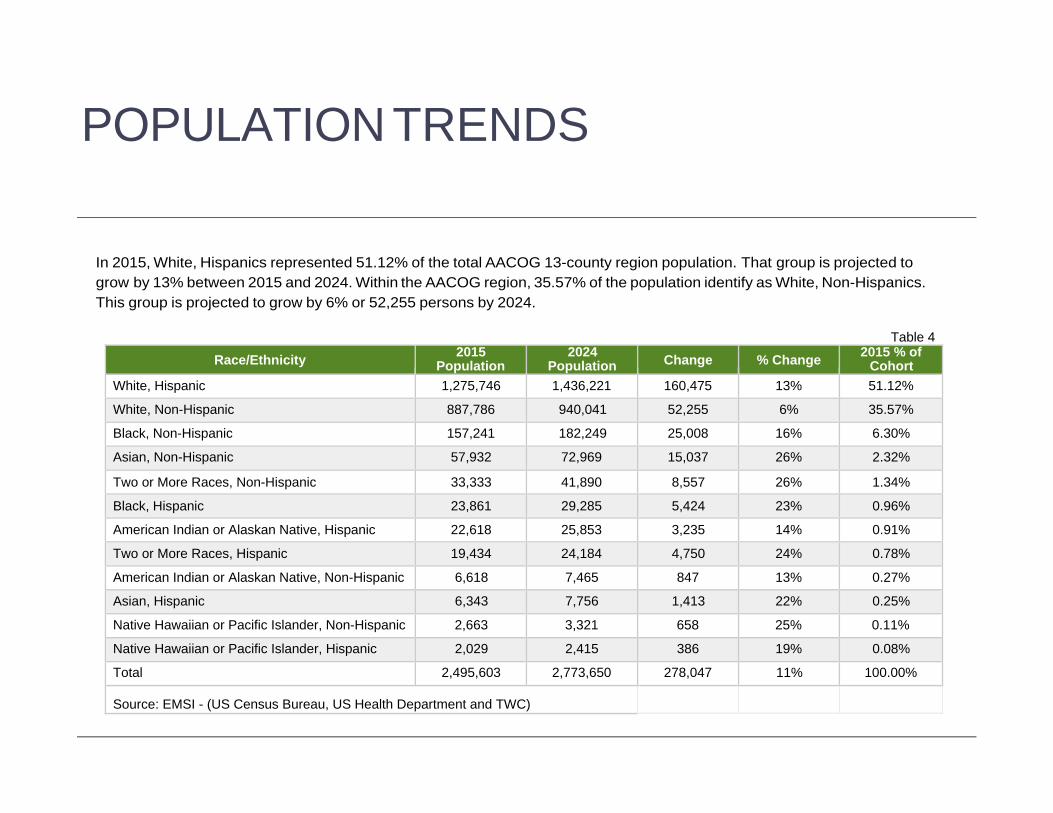
In 2015, White, Hispanics represented 51.12% of the total AACOG 13-county region population. That group is projected to grow by 13% between 2015 and 2024. Within the AACOG region, 35.57% of the population identify as White, Non-Hispanics. This group is projected to grow by 6% or 52,255 persons by 2024.
Table 4
Race/Ethnicity 2015Population
2024Population Change % Change 2015 % of
Cohort White, Hispanic 1,275,746 1,436,221 160,475 13% 51.12%
White, Non-Hispanic 887,786 940,041 52,255 6% 35.57%
Black, Non-Hispanic 157,241 182,249 25,008 16% 6.30%
Asian, Non-Hispanic 57,932 72,969 15,037 26% 2.32%
Two or More Races, Non-Hispanic 33,333 41,890 8,557 26% 1.34%
Black, Hispanic 23,861 29,285 5,424 23% 0.96%
American Indian or Alaskan Native, Hispanic 22,618 25,853 3,235 14% 0.91%
Two or More Races, Hispanic 19,434 24,184 4,750 24% 0.78%
American Indian or Alaskan Native, Non-Hispanic 6,618 7,465 847 13% 0.27%
Asian, Hispanic 6,343 7,756 1,413 22% 0.25%
Native Hawaiian or Pacific Islander, Non-Hispanic 2,663 3,321 658 25% 0.11%
Native Hawaiian or Pacific Islander, Hispanic 2,029 2,415 386 19% 0.08%
Total 2,495,603 2,773,650 278,047 11% 100.00%
Source: EMSI - (US Census Bureau, US Health Department and TWC)

POPULATION TRENDS
In 2015, the 13-county region had an estimated 343,219 persons’ age 30 to 39 years representing 13.75% of the total regional population, the age group is projected to grow by 57,724 and be the largest age cohort at 14.50% of the total regional population by 2024. The AACOG region is projected to decrease by 1,567 persons in the 50 to 59 years of age cohort. The age group 70 to 79 years is projected to show the largest increase of the total population growth by 2024, at 30.91% or 59,160 persons. The AACOG regional population will be concentrated with population ranging in the 20 to 49 years of age representing 1,134,749 persons or 40.91% of the total projected population in 2024.
Population by Age Table 5
Age Cohort 2015
Population2024
Population Change
% Increase
2015 % of Cohort
2024 % of Cohort
Under 5 years 170,984 197,041 26,057 13.22% 6.85% 7.10%
5 to 14 years 356,531 377,457 20,926 5.54% 14.28% 13.60%
15 to 19 years 178,935 192,718 13,783 7.15% 7.17% 6.99%
20 to 29 years 370,572 382,256 11,684 3.05% 14.84% 13.78%
30 to 39 years 343,219 402,365 57,724 14.34% 13.75% 14.50%
40 to 49 years 314,605 350,128 35,523 10.14% 12.60% 12.62%
50 to 59 years 308,932 307,365 -1,567 -0.50% 12.37% 11.08%
60 to 69 years 241,131 285,618 44,487 15.57% 9.66% 10.29%
70 to 79 years 132,222 191,382 59,160 30.91% 5.29% 6.90%
80 years+ 78,472 87,321 8,849 10.13% 3.14% 3.14%
Total 2,495,603 2,773,651 276,626 9.97% 100.00% 100.00%
Source: U. S. Census Bureau
] ]

EDUCATIONAL ATTAINMENT
EDUCATIONAL ATTAINMENT In 2015, persons over the age of 25 who completed high school was estimated at 26.2%, collectively in the 13-County region, which is higher when compared with the State of Texas at 25.3% (see Table 6). The AACOG 13-county region has a higher percentage of persons, at 23.6% that have some college credits but did not complete their education than the State of Texas at 21.8%. Persons over the age of 25 residing in the 13-county region that hold Bachelors or Graduate Degrees is slightly lower at 26.5% when compared to the State of Texas at 28.4%.
The percentage of the population for each educational attainment category in each respective County is shown in Table 6. When comparing the percentage of persons in the 13-county area who have less than a high school diploma to Texas at 17.6%, there are five counties who have a higher percent of their county population falling in this category – Frio at 34.4%, Karnes at 26.2%, Atascosa at 24.2%, McMullen at 23.7% and Medina at 18.3%. The State of Texas has 35.3% of the population over the age of 25 holding an Associate’s – Graduate and Higher Degrees. In comparison, there are three counties that have a higher percentage of their population holding Associate’s – Graduate and higher Degrees – Kendall at 48.3%, Comal at 41.5%, and Gillespie at 38.4%.
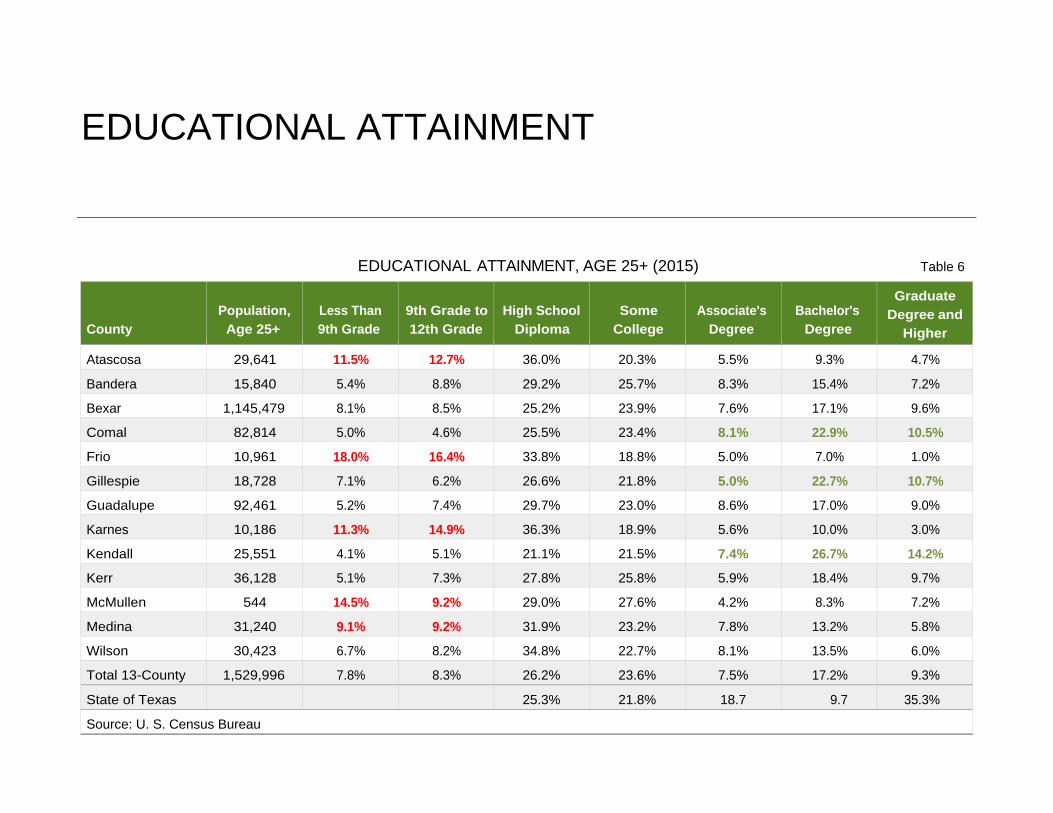
EDUCATIONAL ATTAINMENT
EDUCATIONAL ATTAINMENT, AGE 25+ (2015) Table 6
County
Population,
Age 25+
Less Than 9th Grade
9th Grade to 12th Grade
High School
Diploma
Some
College
Associate's
Degree
Bachelor's
Degree
Graduate Degree and
Higher
Atascosa 29,641 11.5% 12.7% 36.0% 20.3% 5.5% 9.3% 4.7%
Bandera 15,840 5.4% 8.8% 29.2% 25.7% 8.3% 15.4% 7.2%
Bexar 1,145,479 8.1% 8.5% 25.2% 23.9% 7.6% 17.1% 9.6%
Comal 82,814 5.0% 4.6% 25.5% 23.4% 8.1% 22.9% 10.5%
Frio 10,961 18.0% 16.4% 33.8% 18.8% 5.0% 7.0% 1.0%
Gillespie 18,728 7.1% 6.2% 26.6% 21.8% 5.0% 22.7% 10.7%
Guadalupe 92,461 5.2% 7.4% 29.7% 23.0% 8.6% 17.0% 9.0%
Karnes 10,186 11.3% 14.9% 36.3% 18.9% 5.6% 10.0% 3.0%
Kendall 25,551 4.1% 5.1% 21.1% 21.5% 7.4% 26.7% 14.2%
Kerr 36,128 5.1% 7.3% 27.8% 25.8% 5.9% 18.4% 9.7%
McMullen 544 14.5% 9.2% 29.0% 27.6% 4.2% 8.3% 7.2%
Medina 31,240 9.1% 9.2% 31.9% 23.2% 7.8% 13.2% 5.8%
Wilson 30,423 6.7% 8.2% 34.8% 22.7% 8.1% 13.5% 6.0%
Total 13-County 1,529,996 7.8% 8.3% 26.2% 23.6% 7.5% 17.2% 9.3%
State of Texas 25.3% 21.8% 18.7 9.7 35.3%
Source: U. S. Census Bureau
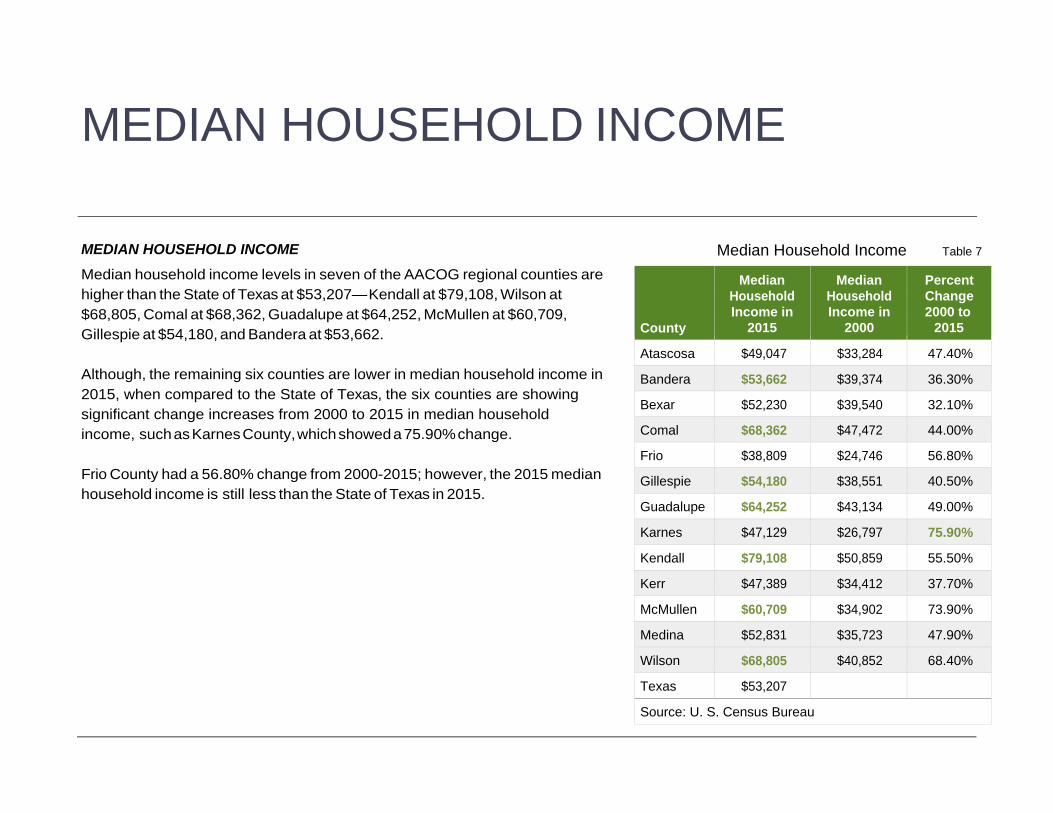
MEDIAN HOUSEHOLD INCOME
MEDIAN HOUSEHOLD INCOME Median household income levels in seven of the AACOG regional counties are higher than the State of Texas at $53,207— Kendall at $79,108, Wilson at $68,805, Comal at $68,362, Guadalupe at $64,252, McMullen at $60,709, Gillespie at $54,180, and Bandera at $53,662.
Although, the remaining six counties are lower in median household income in 2015, when compared to the State of Texas, the six counties are showing significant change increases from 2000 to 2015 in median household income, such as Karnes County, which showed a 75.90% change.
Frio County had a 56.80% change from 2000-2015; however, the 2015 median household income is still less than the State of Texas in 2015.
Median Household Income Table 7
County
Median Household Income in
2015
Median Household Income in
2000
Percent Change 2000 to
2015
Atascosa $49,047 $33,284 47.40%
Bandera $53,662 $39,374 36.30%
Bexar $52,230 $39,540 32.10%
Comal $68,362 $47,472 44.00%
Frio $38,809 $24,746 56.80%
Gillespie $54,180 $38,551 40.50%
Guadalupe $64,252 $43,134 49.00%
Karnes $47,129 $26,797 75.90%
Kendall $79,108 $50,859 55.50%
Kerr $47,389 $34,412 37.70%
McMullen $60,709 $34,902 73.90%
Medina $52,831 $35,723 47.90%
Wilson $68,805 $40,852 68.40%
Texas $53,207
Source: U. S. Census Bureau
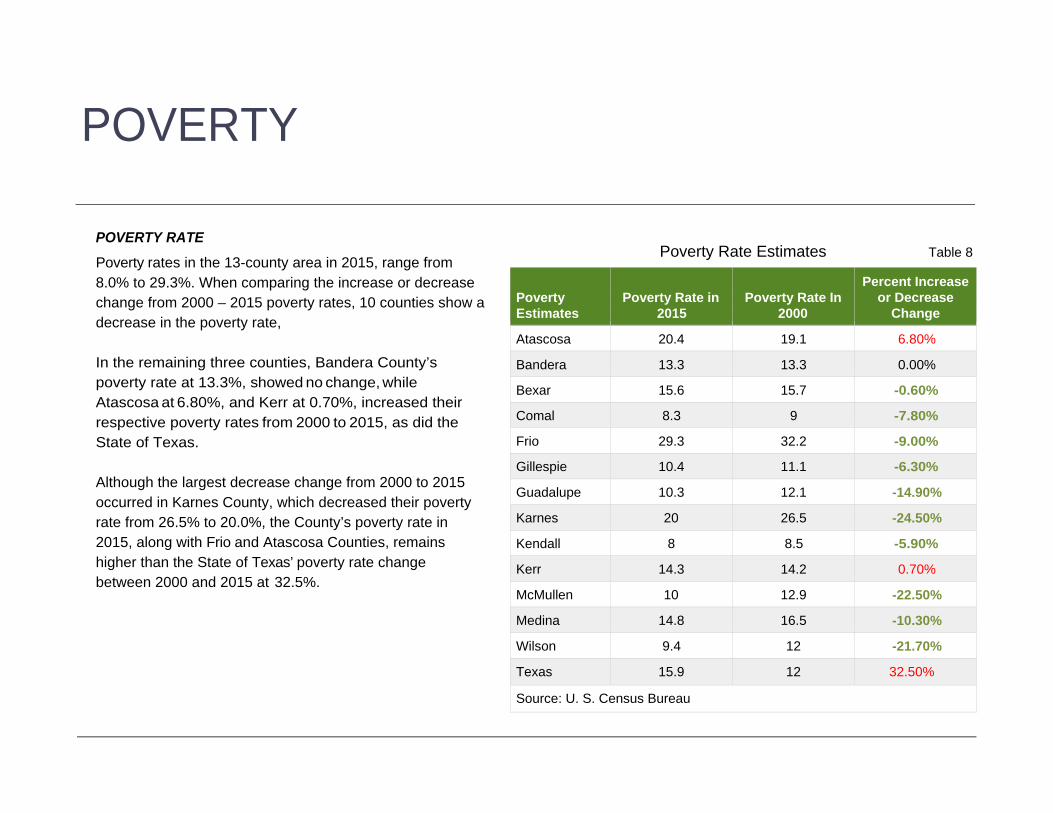
POVERTY
POVERTY RATE Poverty rates in the 13-county area in 2015, range from 8.0% to 29.3%. When comparing the increase or decrease change from 2000 – 2015 poverty rates, 10 counties show a decrease in the poverty rate, In the remaining three counties, Bandera County’s poverty rate at 13.3%, showed no change, while Atascosa at 6.80%, and Kerr at 0.70%, increased their respective poverty rates from 2000 to 2015, as did the State of Texas. Although the largest decrease change from 2000 to 2015 occurred in Karnes County, which decreased their poverty rate from 26.5% to 20.0%, the County’s poverty rate in 2015, along with Frio and Atascosa Counties, remains higher than the State of Texas’ poverty rate change between 2000 and 2015 at 32.5%.
Poverty Rate Estimates Table 8
Poverty Estimates
Poverty Rate in
2015
Poverty Rate In
2000
Percent Increase or Decrease
Change
Atascosa 20.4 19.1 6.80%
Bandera 13.3 13.3 0.00%
Bexar 15.6 15.7 -0.60%
Comal 8.3 9 -7.80%
Frio 29.3 32.2 -9.00%
Gillespie 10.4 11.1 -6.30%
Guadalupe 10.3 12.1 -14.90%
Karnes 20 26.5 -24.50%
Kendall 8 8.5 -5.90%
Kerr 14.3 14.2 0.70%
McMullen 10 12.9 -22.50%
Medina 14.8 16.5 -10.30%
Wilson 9.4 12 -21.70%
Texas 15.9 12 32.50%
Source: U. S. Census Bureau

EMPLOYMENT
WAGES AND ESTABLISHMENTS According to Texas Workforce Commission, there were 53,119 business establishments located in the 13-County AACOG region in 2016, which represents a 6.0% increase from 2014. The average employment also showed an increase of 59,039 people or 5.78% average employment between 2014 and 2016. The total amount of wages paid in the 13-County region has also increased from 2014 to 2016 by $1.3 billion and average weekly wages increased by 2.4%
Table 9 Table 9
Year
Establishments
Average Employment
Total Wages
Average Weekly Wages
2016 53,119 1,020,687 $11,865,596,308 $822
2015 51,494 990,631 $11,029,620,034 $799
2014 49,923 961,648 $10,484,148,102 $802
Source: TWC TRACER 2 - 3rd Quarter
EMPLOYMENT
JOB GROWTH—see Table 10 According to the U.S. Bureau of Labor Statistics (BLS), the AACOG 13-County area has shown significant increases in the number of jobs in the period between 2005 and 2015. Frio at 74.40% and McMullen at 186.20% had the highest number of jobs increase change in comparison; however, Atascosa, Frio and McMullen Counties are showing decreases in jobs from 2014 to 2015. Within the 10-year period 2005 to 2015, the largest concentration of jobs increase occurred in Bexar at 145,232, Comal at 15,533, Guadalupe at 7,647, and Kendall at 4,693 more jobs.
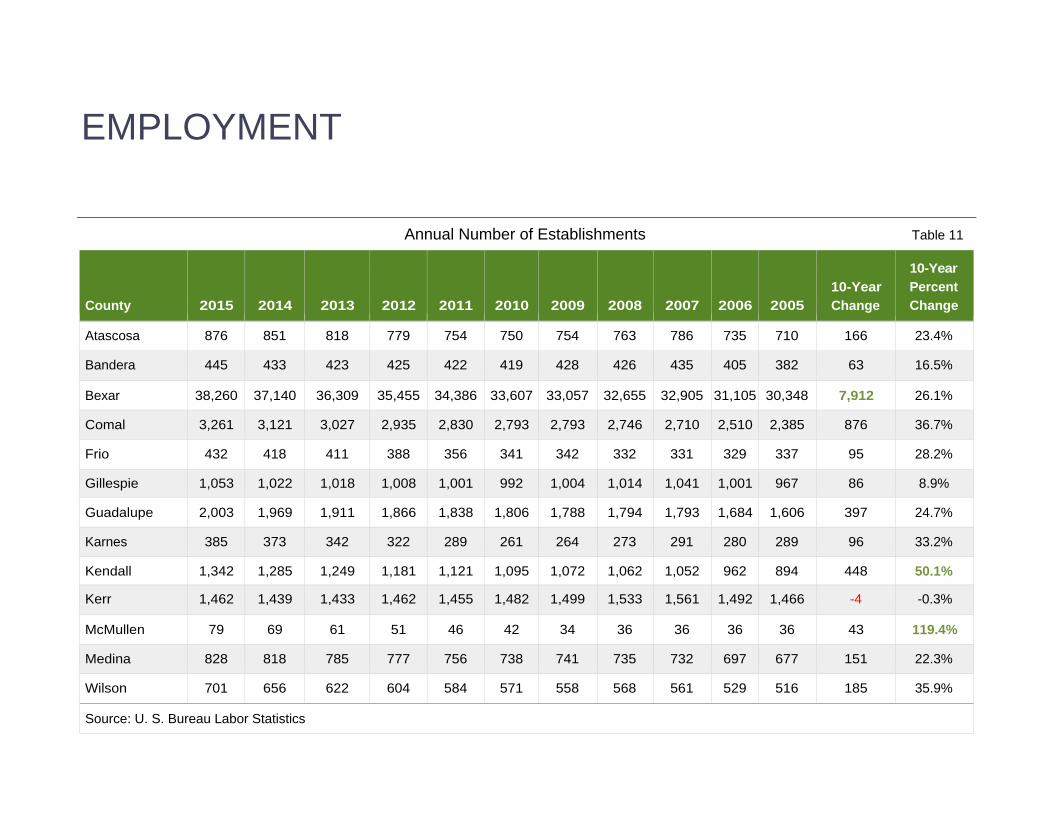
ESTABLISHMENTS—see Table 11 The AACOG 13-County region from 2005 to 2015, has shown a steady increase in the number of establishments, McMullen at 119.40% and Kendall at 50.10% had the greatest 10 year percent change. Bexar County at 7,912 is showing the largest number of added establishments in the 2005 – 2015 period. Kerr County is showing a slight decrease from 2005 to 2015, in the number of establishments located in the county.
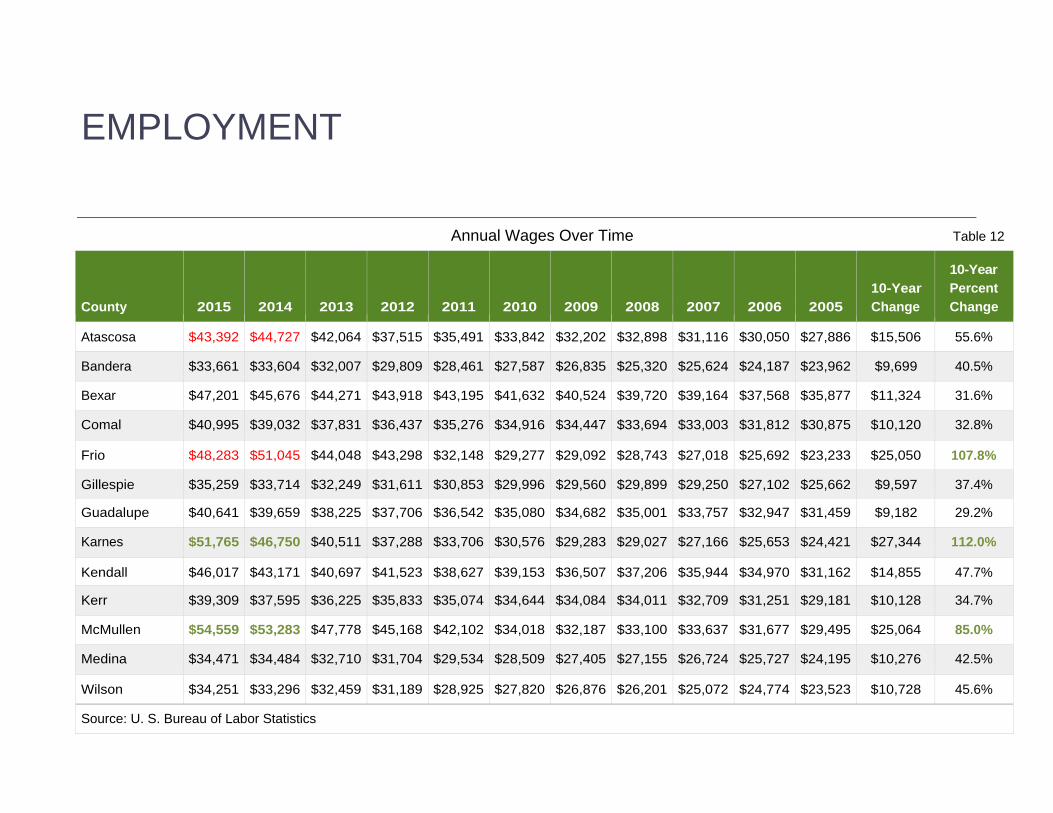
WAGES OVER TIME—see Table 12 The AACOG 13 Counties average wages show a steady increase from 2005 to 2015. Average wages over the period had a 112.00% change increase in Karnes, a 107.80% average wage increase for Frio, and an 85.0% increase in McMullen County. Frio and Atascosa Counties are showing a decrease in average wages from 2014 to 2015. According to the Bureau of Labor Statistics, McMullen at $54,559 and Karnes at $51,765 have the highest average annual wages within the 13-County region.

EMPLOYMENT
Annual Job Growth Table 10
County
2015
2014
2013
2012
2011
2010
2009
2008
2007
2006
2005
10-Year Change
10-Year Percent Change
Atascosa 12,811 13,381 13,021 10,704 9,760 9,346 9,430 9,580 9,289 9,169 8,810 4,001 45.4%
Bandera 3,117 2,995 2,965 2,952 2,939 2,890 2,926 3,105 3,042 2,969 2,854 263 9.2%
Bexar 818,499 793,727 770,531 749,534 732,527 722,147 715,292 730,302 716,666 699,345 673,267 145,232 21.6%
Comal 48,500 44,951 42,800 42,249 41,073 39,332 39,173 39,034 36,955 35,209 32,967 15,533 47.1%
Frio 7,085 7,452 6,087 5,954 5,190 4,859 4,667 4,371 4,287 4,206 4,063 3,022 74.4%
Gillespie 10,133 9,828 9,560 9,359 9,340 9,122 9,133 9,066 8,939 8,736 8,535 1,598 18.7%
Guadalupe 34,125 33,021 31,484 30,602 29,983 28,932 28,825 29,887 28,787 27,645 26,478 7,647 28.9%
Karnes 5,839 5,643 4,768 4,177 3,781 3,716 3,726 3,781 3,798 3,856 3,927 1,912 48.7%
Kendall 14,020 12,668 12,081 11,675 11,243 10,654 10,755 10,674 10,176 9,846 9,327 4,693 50.3%
Kerr 17,603 17,438 17,144 17,232 16,967 17,151 17,436 18,112 17,890 17,379 17,200 403 2.3%
McMullen 664 754 572 465 399 256 219 207 200 203 232 432 186.2%
Medina 9,363 9,285 8,749 8,564 8,238 8,015 8,072 8,363 8,649 8,344 8,009 1,354 16.9%
Wilson 7,663 7,447 7,072 6,683 6,645 6,490 6,419 6,546 6,400 6,250 6,099 1,564 25.6%
Source: U. S. Census Bureau
EMPLOYMENT
Annual Number of Establishments Table 11
County
2015
2014
2013
2012
2011
2010
2009
2008
2007
2006
2005
10-Year Change
10-Year Percent Change
Atascosa 876 851 818 779 754 750 754 763 786 735 710 166 23.4%
Bandera 445 433 423 425 422 419 428 426 435 405 382 63 16.5%
Bexar 38,260 37,140 36,309 35,455 34,386 33,607 33,057 32,655 32,905 31,105 30,348 7,912 26.1%
Comal 3,261 3,121 3,027 2,935 2,830 2,793 2,793 2,746 2,710 2,510 2,385 876 36.7%
Frio 432 418 411 388 356 341 342 332 331 329 337 95 28.2%
Gillespie 1,053 1,022 1,018 1,008 1,001 992 1,004 1,014 1,041 1,001 967 86 8.9%
Guadalupe 2,003 1,969 1,911 1,866 1,838 1,806 1,788 1,794 1,793 1,684 1,606 397 24.7%
Karnes 385 373 342 322 289 261 264 273 291 280 289 96 33.2%
Kendall 1,342 1,285 1,249 1,181 1,121 1,095 1,072 1,062 1,052 962 894 448 50.1%
Kerr 1,462 1,439 1,433 1,462 1,455 1,482 1,499 1,533 1,561 1,492 1,466 -4 -0.3%
McMullen 79 69 61 51 46 42 34 36 36 36 36 43 119.4%
Medina 828 818 785 777 756 738 741 735 732 697 677 151 22.3%
Wilson 701 656 622 604 584 571 558 568 561 529 516 185 35.9%
Source: U. S. Bureau Labor Statistics
EMPLOYMENT
Annual Wages Over Time Table 12
County
2015
2014
2013
2012
2011
2010
2009
2008
2007
2006
2005
10-Year Change
10-Year Percent Change
Atascosa $43,392 $44,727 $42,064 $37,515 $35,491 $33,842 $32,202 $32,898 $31,116 $30,050 $27,886 $15,506 55.6%
Bandera $33,661 $33,604 $32,007 $29,809 $28,461 $27,587 $26,835 $25,320 $25,624 $24,187 $23,962 $9,699 40.5%
Bexar $47,201 $45,676 $44,271 $43,918 $43,195 $41,632 $40,524 $39,720 $39,164 $37,568 $35,877 $11,324 31.6%
Comal $40,995 $39,032 $37,831 $36,437 $35,276 $34,916 $34,447 $33,694 $33,003 $31,812 $30,875 $10,120 32.8%
Frio $48,283 $51,045 $44,048 $43,298 $32,148 $29,277 $29,092 $28,743 $27,018 $25,692 $23,233 $25,050 107.8%
Gillespie $35,259 $33,714 $32,249 $31,611 $30,853 $29,996 $29,560 $29,899 $29,250 $27,102 $25,662 $9,597 37.4%
Guadalupe $40,641 $39,659 $38,225 $37,706 $36,542 $35,080 $34,682 $35,001 $33,757 $32,947 $31,459 $9,182 29.2%
Karnes $51,765 $46,750 $40,511 $37,288 $33,706 $30,576 $29,283 $29,027 $27,166 $25,653 $24,421 $27,344 112.0%
Kendall $46,017 $43,171 $40,697 $41,523 $38,627 $39,153 $36,507 $37,206 $35,944 $34,970 $31,162 $14,855 47.7%
Kerr $39,309 $37,595 $36,225 $35,833 $35,074 $34,644 $34,084 $34,011 $32,709 $31,251 $29,181 $10,128 34.7%
McMullen $54,559 $53,283 $47,778 $45,168 $42,102 $34,018 $32,187 $33,100 $33,637 $31,677 $29,495 $25,064 85.0%
Medina $34,471 $34,484 $32,710 $31,704 $29,534 $28,509 $27,405 $27,155 $26,724 $25,727 $24,195 $10,276 42.5%
Wilson $34,251 $33,296 $32,459 $31,189 $28,925 $27,820 $26,876 $26,201 $25,072 $24,774 $23,523 $10,728 45.6%
Source: U. S. Bureau of Labor Statistics
EMPLOYMENT
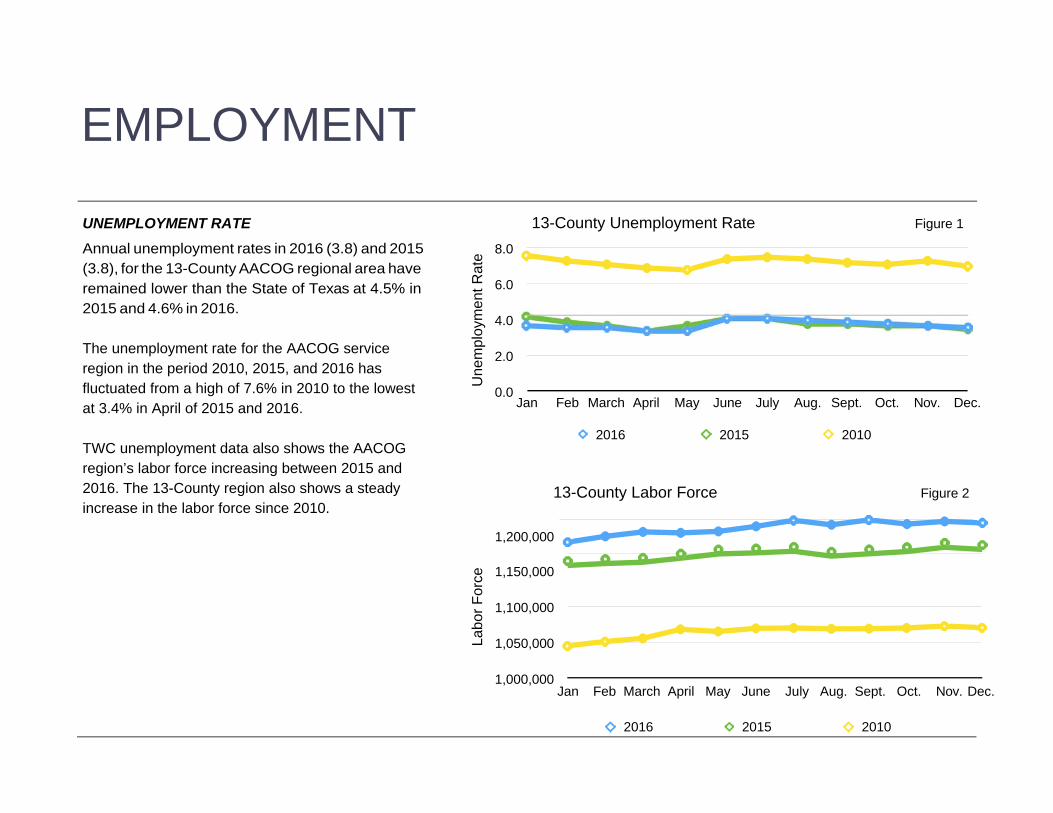
UNEMPLOYMENT RATE Annual unemployment rates in 2016 (3.8) and 2015 (3.8), for the 13-County AACOG regional area have remained lower than the State of Texas at 4.5% in 2015 and 4.6% in 2016.
The unemployment rate for the AACOG service region in the period 2010, 2015, and 2016 has fluctuated from a high of 7.6% in 2010 to the lowest at 3.4% in April of 2015 and 2016.
TWC unemployment data also shows the AACOG region’s labor force increasing between 2015 and 2016. The 13-County region also shows a steady increase in the labor force since 2010.
8.0
6.0
4.0
2.0
0.0
13-County Unemployment Rate Figure 1
Jan Feb March April May June July Aug. Sept. Oct. Nov. Dec.
2016 2015 2010
13-County Labor Force Figure 2
1,200,000
1,150,000
1,100,000
1,050,000
1,000,000
Jan Feb March April May June July Aug. Sept. Oct. Nov. Dec.
2016 2015 2010
Labo
r For
ce
Une
mpl
oym
ent R
ate
EMPLOYMENT
Average Employment by Industry Table 13
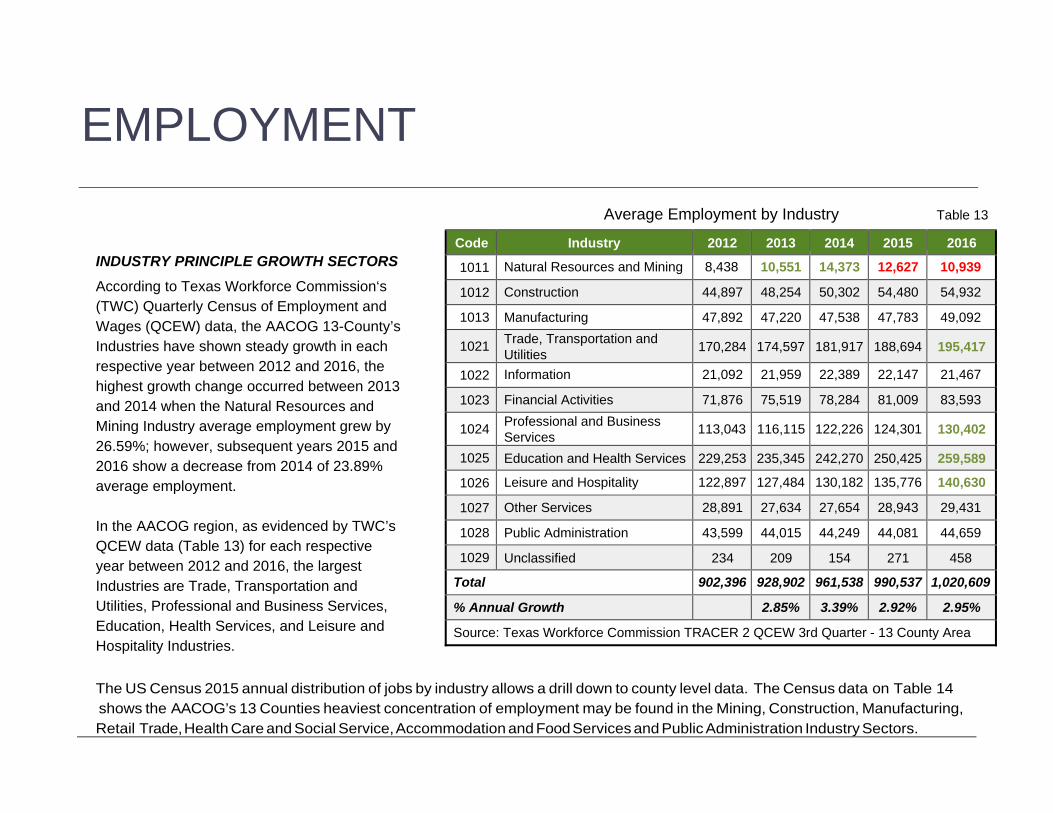
INDUSTRY PRINCIPLE GROWTH SECTORS According to Texas Workforce Commission‘s (TWC) Quarterly Census of Employment and Wages (QCEW) data, the AACOG 13-County’s Industries have shown steady growth in each respective year between 2012 and 2016, the highest growth change occurred between 2013 and 2014 when the Natural Resources and Mining Industry average employment grew by 26.59%; however, subsequent years 2015 and 2016 show a decrease from 2014 of 23.89% average employment.
In the AACOG region, as evidenced by TWC’s QCEW data (Table 13) for each respective year between 2012 and 2016, the largest Industries are Trade, Transportation and Utilities, Professional and Business Services, Education, Health Services, and Leisure and Hospitality Industries.
The US Census 2015 annual distribution of jobs by industry allows a drill down to county level data. The Census data on Table 14 shows the AACOG’s 13 Counties heaviest concentration of employment may be found in the Mining, Construction, Manufacturing, Retail Trade, Health Care and Social Service, Accommodation and Food Services and Public Administration Industry Sectors.
Code Industry 2012 2013 2014 2015 2016
1011 Natural Resources and Mining 8,438 10,551 14,373 12,627 10,939
1012 Construction 44,897 48,254 50,302 54,480 54,932
1013 Manufacturing 47,892 47,220 47,538 47,783 49,092
1021 Trade, Transportation and Utilities 170,284 174,597 181,917 188,694 195,417
1022 Information 21,092 21,959 22,389 22,147 21,467
1023 Financial Activities 71,876 75,519 78,284 81,009 83,593
1024 Professional and Business Services 113,043 116,115 122,226 124,301 130,402
1025 Education and Health Services 229,253 235,345 242,270 250,425 259,589
1026 Leisure and Hospitality 122,897 127,484 130,182 135,776 140,630
1027 Other Services 28,891 27,634 27,654 28,943 29,431
1028 Public Administration 43,599 44,015 44,249 44,081 44,659
1029 Unclassified 234 209 154 271 458
Total 902,396 928,902 961,538 990,537 1,020,609
% Annual Growth 2.85% 3.39% 2.92% 2.95%
Source: Texas Workforce Commission TRACER 2 QCEW 3rd Quarter - 13 County Area
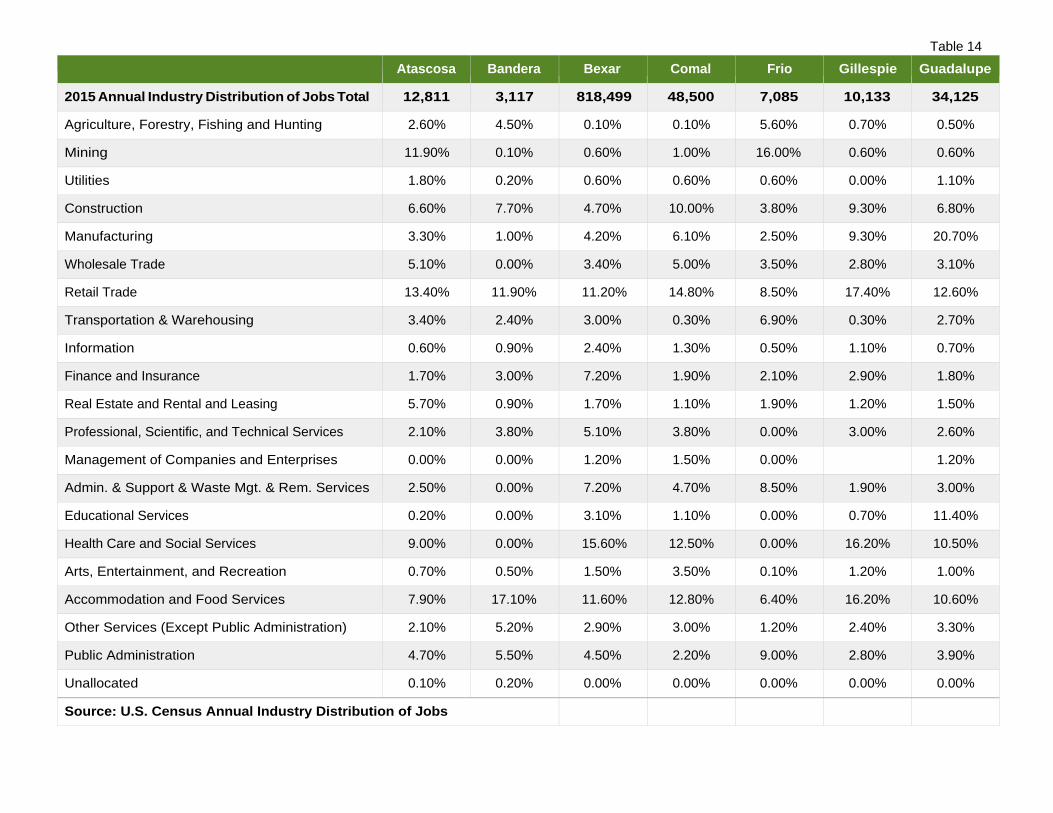
Table 14 Atascosa Bandera Bexar Comal Frio Gillespie Guadalupe
2015 Annual Industry Distribution of Jobs Total 12,811 3,117 818,499 48,500 7,085 10,133 34,125
Agriculture, Forestry, Fishing and Hunting 2.60% 4.50% 0.10% 0.10% 5.60% 0.70% 0.50%
Mining 11.90% 0.10% 0.60% 1.00% 16.00% 0.60% 0.60%
Utilities 1.80% 0.20% 0.60% 0.60% 0.60% 0.00% 1.10%
Construction 6.60% 7.70% 4.70% 10.00% 3.80% 9.30% 6.80%
Manufacturing 3.30% 1.00% 4.20% 6.10% 2.50% 9.30% 20.70%
Wholesale Trade 5.10% 0.00% 3.40% 5.00% 3.50% 2.80% 3.10%
Retail Trade 13.40% 11.90% 11.20% 14.80% 8.50% 17.40% 12.60%
Transportation & Warehousing 3.40% 2.40% 3.00% 0.30% 6.90% 0.30% 2.70%
Information 0.60% 0.90% 2.40% 1.30% 0.50% 1.10% 0.70%
Finance and Insurance 1.70% 3.00% 7.20% 1.90% 2.10% 2.90% 1.80%
Real Estate and Rental and Leasing 5.70% 0.90% 1.70% 1.10% 1.90% 1.20% 1.50%
Professional, Scientific, and Technical Services 2.10% 3.80% 5.10% 3.80% 0.00% 3.00% 2.60%
Management of Companies and Enterprises 0.00% 0.00% 1.20% 1.50% 0.00% 1.20%
Admin. & Support & Waste Mgt. & Rem. Services 2.50% 0.00% 7.20% 4.70% 8.50% 1.90% 3.00%
Educational Services 0.20% 0.00% 3.10% 1.10% 0.00% 0.70% 11.40%
Health Care and Social Services 9.00% 0.00% 15.60% 12.50% 0.00% 16.20% 10.50%
Arts, Entertainment, and Recreation 0.70% 0.50% 1.50% 3.50% 0.10% 1.20% 1.00%
Accommodation and Food Services 7.90% 17.10% 11.60% 12.80% 6.40% 16.20% 10.60%
Other Services (Except Public Administration) 2.10% 5.20% 2.90% 3.00% 1.20% 2.40% 3.30%
Public Administration 4.70% 5.50% 4.50% 2.20% 9.00% 2.80% 3.90%
Unallocated 0.10% 0.20% 0.00% 0.00% 0.00% 0.00% 0.00%
Source: U.S. Census Annual Industry Distribution of Jobs

Table 14 Continued
Karnes Kendall Kerr McMullen Medina Wilson 13-County
Total 2015 Annual Industry Distribution of Jobs Total 5,839 14,020 17,603 664 9,363 7,663 989,422
Agriculture, Forestry, Fishing and Hunting 0.80% 0.70% 0.90% 9.20% 2.30% 0.90% 28.90%
Mining 14.60% 1.00% 0.00% 27.70% 5.10% 4.60% 83.80%
Utilities 1.60% 0.20% 0.10% 0.00% 0.00% 0.60% 7.40%
Construction 2.10% 12.40% 6.40% 0.00% 8.60% 8.60% 87.00%
Manufacturing 4.50% 6.50% 5.60% 0.00% 1.60% 4.60% 69.90%
Wholesale Trade 3.70% 3.70% 1.40% 0.00% 2.90% 1.20% 35.80%
Retail Trade 14.20% 18.80% 17.80% 0.00% 13.80% 17.20% 171.60%
Transportation & Warehousing 4.00% 1.00% 1.20% 13.30% 0.40% 2.50% 41.40%
Information 0.00% 0.80% 1.30% 0.00% 0.60% 0.80% 11.00%
Finance and Insurance 2.00% 4.80% 2.70% 0.00% 3.50% 2.40% 36.00%
Real Estate and Rental and Leasing 1.60% 1.20% 1.40% 0.00% 0.40% 0.70% 19.30%
Professional, Scientific, and Technical Services 0.00% 7.00% 3.30% 0.00% 3.80% 2.90% 37.40%
Management of Companies and Enterprises 0.00% 0.40% 0.30% 0.00% 0.00% 4.60%
Admin. & Support & Waste Mgt. & Rem. Services 5.90% 3.40% 2.90% 0.00% 2.10% 0.00% 42.10%
Educational Services 10.20% 1.60% 3.00% 0.00% 0.00% 0.30% 31.60%
Health Care and Social Services 3.20% 9.30% 19.20% 0.00% 0.00% 10.60% 106.10%
Arts, Entertainment, and Recreation 0.00% 2.30% 1.30% 0.00% 0.80% 1.20% 14.10%
Accommodation and Food Services 0.00% 9.60% 12.70% 3.00% 10.20% 6.60% 124.70%
Other Services (Except Public Administration) 1.20% 3.30% 3.80% 1.10% 2.00% 2.10% 33.60%
Public Administration 4.00% 0.20% 3.30% 0.20% 9.30% 4.30% 53.90%
Unallocated 0.00% 0.10% 0.00% 0.00% 0.00% 0.10% 0.50%
Source: U.S. Census Annual Industry Distribution of Jobs
EMPLOYMENT
TOP OCCUPATIONS BY NUMBER OF JOBS AND WAGES To identify the top occupations for the 13 Counties, AACOG utilized Texas Workforce Commission’s (TWC) long term projections of occupations that will likely (1) grow the fastest, (2) add the most jobs and/or have the (3) largest job openings over the projected 2014-2024 period.
The 13-County area has 49 occupations falling in one or more of the categories listed on pages 23-26. The 49 top occupations identified, represent 463,330 jobs or 43.50% of the 1,067,800 total occupations identified for the area in 2014. TWC projects the AACOG region will grow by 241,730 total jobs by 2024, with the 49 top occupations representing 119,920 or 49.77% of the total projected new jobs between 2014 and 2024.
Median hourly wages for the top occupations compared to the State of Texas, are higher for fourteen of the 49 occupations, three of the occupations have no identified wages and one occupation remained neutral. For the 49 top occupations, when median hourly wages are compared to the State of Texas, the total wages represent $42.30 less in median hourly wage compensation. Top Occupations that are paying the most in hourly wages include: Management, Business Financial Operations, Computer & Mathematical, Healthcare Practitioners & Technical and Healthcare Support Occupations.

Table 15
Occ Code
Occupational Title
2014 Employment
2024
Projected Employment
Change %
Change Annual Openings due to Growth
Annual Openings
due to Replace-
ments
Total Annual
Average Openings
AACOGMean
Hourly Wage 2015
Texas Mean Hourly Wage 2015
AACOG vs
Texas
Management Occupations
11-3021 Computer & Information Systems Managers 1,180 1,570 390 33.1% 40 15 55 $69.96 $71.45 -$1.49
11-9013
Farmers, Ranchers, & Other Agricultural Managers
20,160
22,040
1,880
9.3%
190
345
535
$24.03
$27.75
-$3.72
11-1021 General & Operations Managers
13,540 16,600 3,060 22.6% 305 345 650 $55.56 $61.99 -$6.43
Business Financial Operations & Computer & Mathematical Occupations
13-2011 Accountants & Auditors 8,830 11,130 2,300 26.0% 230 235 465 $34.40 $37.73 -$3.33
15-1121 Computer Systems Analysts
2,620 3,570 950 36.3% 95 35 130 $44.98 $45.21 -$0.23
15-1122 Information Security Analysts 1,190 1,700 510 42.9% 50 15 65 $41.10 $43.49 -$2.39
15-1132 Software Developers, Applications 4,740 6,560 1,820 38.4% 185 70 255 $48.40 $47.99 $0.41
15-1134 Web Developers 850 1,190 340 40.0% 35 10 45 $30.99 $33.08 -$2.09
15-2031 Operations Research Analysts
1,010 1,470 460 45.5% 45 20 65 $42.87 $40.49 $2.38
Community/Social Service Occupations & Education, Training & Library Occupations
21-1022 Healthcare Social Workers
760 1,010 250 32.9% 25 20 45 $26.69 $26.69 $0.00
25-2021
Elementary School Teachers, Ex. Special Education
12,540
16,540
4,000
31.9%
400
275
675
-
-
-
25-2031
Secondary School Teachers, Ex Special/ Career/Technical Ed
8,650
11,390
2,740
31.7%
275
205
480
-
-
-
25-3021 Self-Enrichment Education Teachers
1,490 1,990 500 33.6% 50 30 80 $16.50 $19.04 -$2.54
25-9041 Teacher Assistants 8,180 10,640 2,460 30.1% 245 195 440 - - -
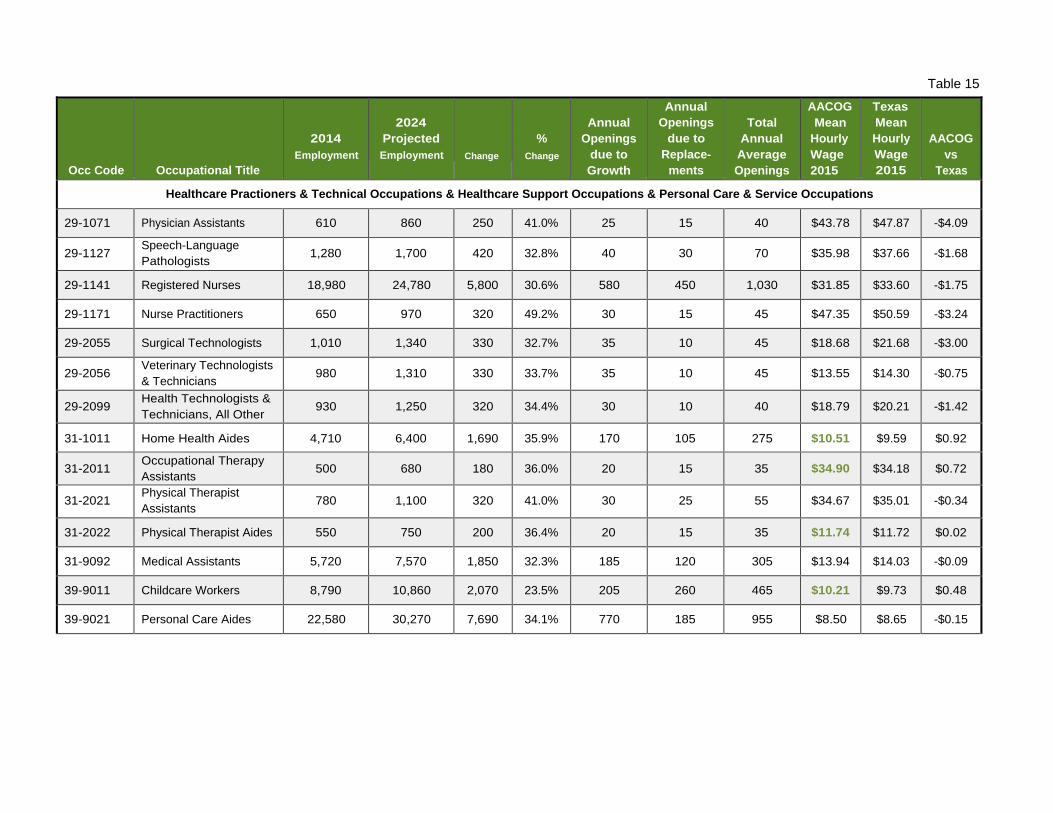
Table 15
Occ Code
Occupational Title
2014 Employment
2024
Projected Employment
Change
% Change
Annual
Openings due to Growth
Annual Openings
due to Replace-
ments
Total
Annual Average Openings
AACOG Mean
Hourly Wage 2015
Texas Mean Hourly Wage 2015
AACOG vs
Texas
Healthcare Practioners & Technical Occupations & Healthcare Support Occupations & Personal Care & Service Occupations
29-1071 Physician Assistants 610 860 250 41.0% 25 15 40 $43.78 $47.87 -$4.09
29-1127 Speech-Language Pathologists 1,280 1,700 420 32.8% 40 30 70 $35.98 $37.66 -$1.68
29-1141 Registered Nurses 18,980 24,780 5,800 30.6% 580 450 1,030 $31.85 $33.60 -$1.75
29-1171 Nurse Practitioners 650 970 320 49.2% 30 15 45 $47.35 $50.59 -$3.24
29-2055 Surgical Technologists 1,010 1,340 330 32.7% 35 10 45 $18.68 $21.68 -$3.00
29-2056 Veterinary Technologists & Technicians
980 1,310 330 33.7% 35 10 45 $13.55 $14.30 -$0.75
29-2099 Health Technologists & Technicians, All Other
930 1,250 320 34.4% 30 10 40 $18.79 $20.21 -$1.42
31-1011 Home Health Aides 4,710 6,400 1,690 35.9% 170 105 275 $10.51 $9.59 $0.92
31-2011 Occupational Therapy Assistants 500 680 180 36.0% 20 15 35 $34.90 $34.18 $0.72
31-2021 Physical Therapist Assistants 780 1,100 320 41.0% 30 25 55 $34.67 $35.01 -$0.34
31-2022 Physical Therapist Aides 550 750 200 36.4% 20 15 35 $11.74 $11.72 $0.02
31-9092 Medical Assistants 5,720 7,570 1,850 32.3% 185 120 305 $13.94 $14.03 -$0.09
39-9011 Childcare Workers 8,790 10,860 2,070 23.5% 205 260 465 $10.21 $9.73 $0.48
39-9021 Personal Care Aides 22,580 30,270 7,690 34.1% 770 185 955 $8.50 $8.65 -$0.15

Table 15
Occ Code
Occupational Title
2014 Employment
2024
Projected Employment
Change
% Change
Annual
Openings due to Growth
Annual Openings
due to Replace-
ments
Total
Annual Average Openings
AACOG Mean
Hourly Wage 2015
Texas Mean Hourly Wage 2015
AACOG vs
Texas
Food Preparation and Service Related and Building & Grounds Cleaning & Maintenance Occupations
35-1012
First-Line Supervisors of Food Preparation & Serving Workers
7,720
10,380
2,660
34.5%
265
230
495
$16.59
$17.06
-$0.47
35-2014 Cooks, Restaurant 9,330 13,100 3,770 40.4% 375 245 620 $10.65 $11.08 -$0.43
35-3021
Combined Food Preparation & Serving Workers, Incl. Fast Food
27,640
37,470
9,830
35.6%
980
895
1,875
$8.82
$8.97
-$0.15
35-3031 Waiters & Waitresses 19,810 24,790 4,980 25.1% 500 955 1,455 $11.02 $10.43 $0.59
37-2011
Janitors & Cleaners, Ex. Maids & Housekeeping Cleaners
17,280
22,240
4,960
28.7%
495
345
840
$10.71
$10.52
$0.19
Construction & Extraction Occupations & Installation, Maintenance & Repair Occupations
47-2061 Construction Laborers 8,290 10,560 2,270 27.4% 225 165 390 $13.34 $14.07 -$0.73
49-3031
Bus & Truck Mechanics & Diesel Engine Specialists
2,270
3,130
860
37.9%
85
40
125
$21.73
$21.34
$0.39
49-9041 Industrial Machinery Mechanics 1,830 2,580 750 41.0% 75 50 125 $24.42 $25.05 -$0.63
49-9071 Maintenance & Repair Workers, General
9,720 11,980 2,260 23.3% 225 255 480 $15.78 $16.97 -$1.19
Transportation & Material Moving Occupations
53-3032 Heavy & Tractor-Trailer Truck Drivers
13,720 16,480 2,760 20.1% 275 235 510 $20.79 $19.85 $0.94
53-7062
Laborers & Freight, Stock, & Material Movers, Hand
11,430
13,830
2,400
21.0%
240
340
580
$12.01
$12.70
-$0.69
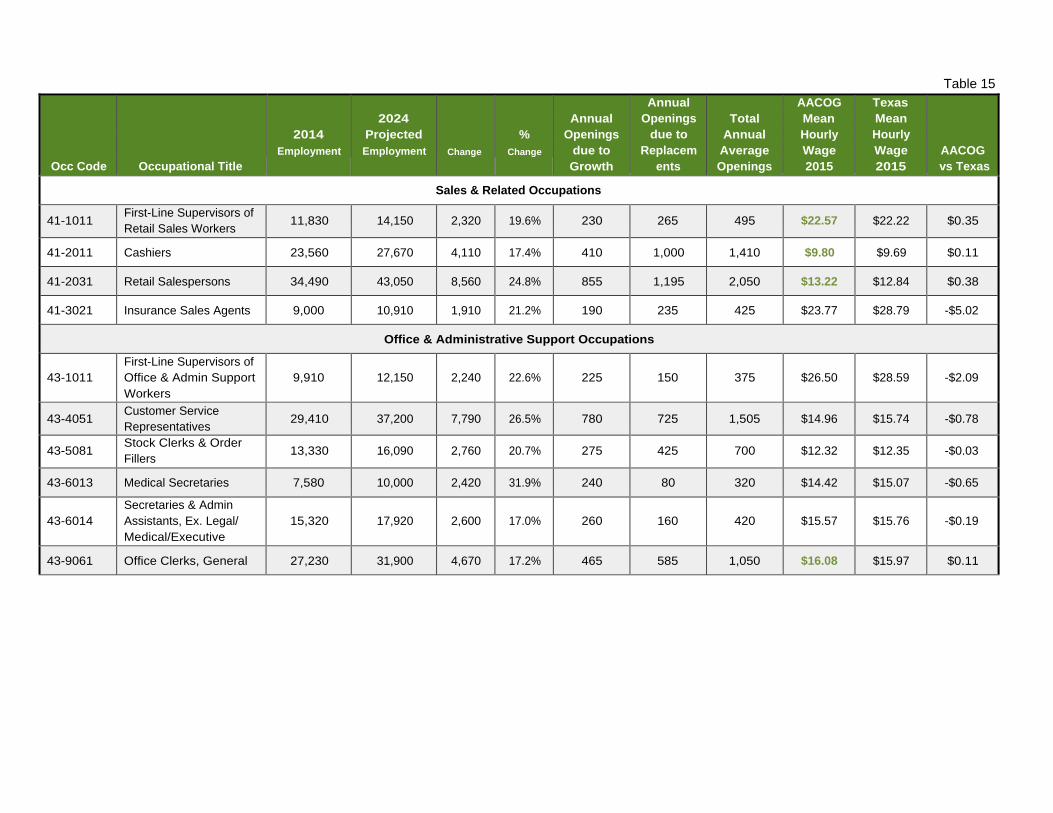
Table 15
Occ Code
Occupational Title
2014 Employment
2024
Projected Employment
Change
% Change
Annual Openings
due to Growth
Annual Openings
due to Replacem
ents
Total Annual
Average Openings
AACOGMean Hourly Wage 2015
Texas Mean Hourly Wage 2015
AACOG vs Texas
Sales & Related Occupations
41-1011 First-Line Supervisors of Retail Sales Workers 11,830 14,150 2,320 19.6% 230 265 495 $22.57 $22.22 $0.35
41-2011 Cashiers 23,560 27,670 4,110 17.4% 410 1,000 1,410 $9.80 $9.69 $0.11
41-2031 Retail Salespersons 34,490 43,050 8,560 24.8% 855 1,195 2,050 $13.22 $12.84 $0.38
41-3021 Insurance Sales Agents 9,000 10,910 1,910 21.2% 190 235 425 $23.77 $28.79 -$5.02
Office & Administrative Support Occupations
43-1011
First-Line Supervisors of Office & Admin Support Workers
9,910
12,150
2,240
22.6%
225
150
375
$26.50
$28.59
-$2.09
43-4051 Customer Service Representatives 29,410 37,200 7,790 26.5% 780 725 1,505 $14.96 $15.74 -$0.78
43-5081 Stock Clerks & Order Fillers
13,330 16,090 2,760 20.7% 275 425 700 $12.32 $12.35 -$0.03
43-6013 Medical Secretaries 7,580 10,000 2,420 31.9% 240 80 320 $14.42 $15.07 -$0.65
43-6014
Secretaries & Admin Assistants, Ex. Legal/ Medical/Executive
15,320
17,920
2,600
17.0%
260
160
420
$15.57
$15.76
-$0.19
43-9061 Office Clerks, General 27,230 31,900 4,670 17.2% 465 585 1,050 $16.08 $15.97 $0.11
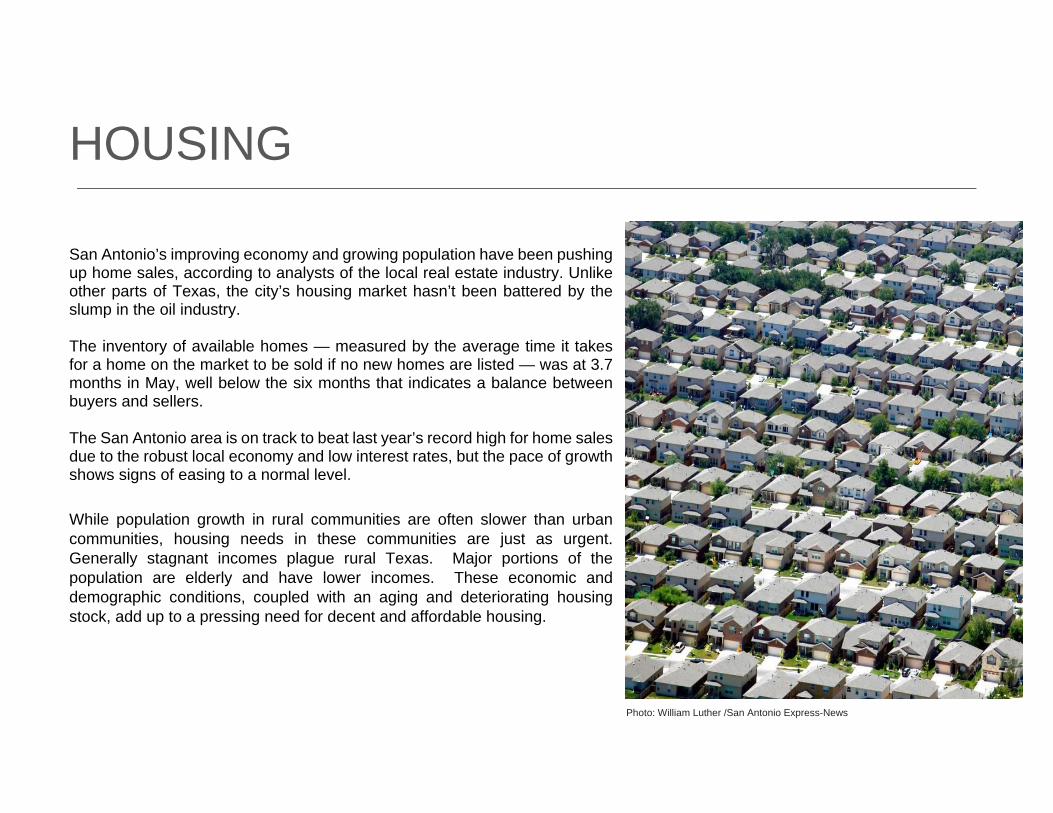
HOUSING San Antonio’s improving economy and growing population have been pushing up home sales, according to analysts of the local real estate industry. Unlike other parts of Texas, the city’s housing market hasn’t been battered by the slump in the oil industry. The inventory of available homes — measured by the average time it takes for a home on the market to be sold if no new homes are listed — was at 3.7 months in May, well below the six months that indicates a balance between buyers and sellers. The San Antonio area is on track to beat last year’s record high for home sales due to the robust local economy and low interest rates, but the pace of growth shows signs of easing to a normal level. While population growth in rural communities are often slower than urban communities, housing needs in these communities are just as urgent. Generally stagnant incomes plague rural Texas. Major portions of the population are elderly and have lower incomes. These economic and demographic conditions, coupled with an aging and deteriorating housing stock, add up to a pressing need for decent and affordable housing.
Photo: William Luther /San Antonio Express-News

ECONOMIC RESILIENCY The goal of the AACOG region and its partners is to plan for a resilient region that will anticipate threats and economic risk, develops resources to reduce their impact, responds appropriately, and ultimately leads the region to recovery. This resilient approach extends beyond emergency responsiveness by utilizing available resources for planning and utilizing regional leadership to address vulnerabilities and to build and support vibrant, healthy communities. The capacity to recover from an economic shock can be strengthened by addressing the following capacity measures:
1. Economic diversification: Economic diversification measures the degree to which economic activity is spread across sectors of an economy. When economic activity is concentrated in relatively few sectors, the overall regional economy is more vulnerable to problems in any of those sectors.
2. Improved Business climate and improving access to jobs through affordable housing to include transportation choices. Strong support of entrepreneurship that will take advantage of new market trends and demographic needs; revitalizing downtowns and anchors for development.
3. Regional affordability/Housing: Considering housing affordability including comparing the cost of housing to the level of income available to pay for that housing.
4. Income equality: Income equality measures how evenly income is distributed across a population and considers how helping localities link assets throughout the region can improve equality.
Through innovation, adaptation, investing in local assets and connecting people, the AACOG region can enhance economic stability and competitiveness which will result in long-term success, viability and durability of the region's economy.
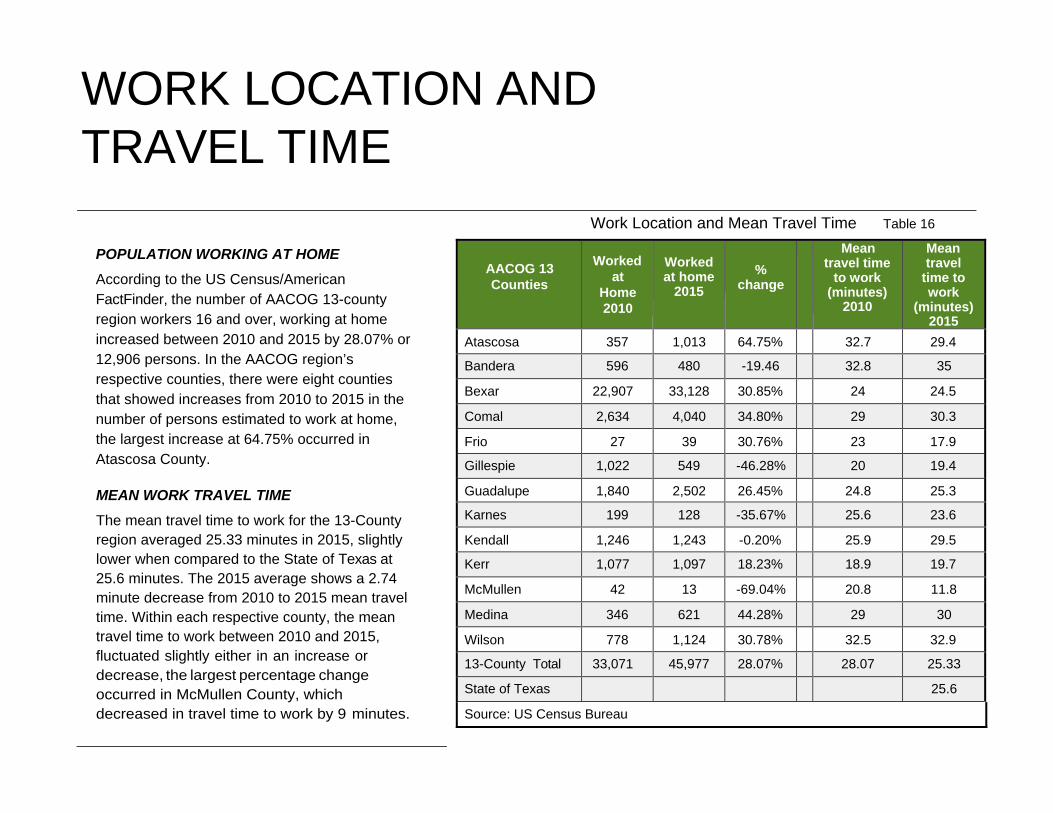
WORK LOCATION AND TRAVEL TIME
Work Location and Mean Travel Time Table 16
POPULATION WORKING AT HOME According to the US Census/American FactFinder, the number of AACOG 13-county region workers 16 and over, working at home increased between 2010 and 2015 by 28.07% or 12,906 persons. In the AACOG region’s respective counties, there were eight counties that showed increases from 2010 to 2015 in the number of persons estimated to work at home, the largest increase at 64.75% occurred in Atascosa County.
MEAN WORK TRAVEL TIME The mean travel time to work for the 13-County region averaged 25.33 minutes in 2015, slightly lower when compared to the State of Texas at 25.6 minutes. The 2015 average shows a 2.74 minute decrease from 2010 to 2015 mean travel time. Within each respective county, the mean travel time to work between 2010 and 2015, fluctuated slightly either in an increase or decrease, the largest percentage change occurred in McMullen County, which decreased in travel time to work by 9 minutes.
AACOG 13 Counties
Worked
at Home 2010
Worked at home
2015
%
change
Mean travel time
to work (minutes)
2010
Mean travel
time to work
(minutes) 2015
Atascosa 357 1,013 64.75% 32.7 29.4
Bandera 596 480 -19.46 32.8 35
Bexar 22,907 33,128 30.85% 24 24.5
Comal 2,634 4,040 34.80% 29 30.3
Frio 27 39 30.76% 23 17.9
Gillespie 1,022 549 -46.28% 20 19.4
Guadalupe 1,840 2,502 26.45% 24.8 25.3
Karnes 199 128 -35.67% 25.6 23.6
Kendall 1,246 1,243 -0.20% 25.9 29.5
Kerr 1,077 1,097 18.23% 18.9 19.7
McMullen 42 13 -69.04% 20.8 11.8
Medina 346 621 44.28% 29 30
Wilson 778 1,124 30.78% 32.5 32.9
13-County Total 33,071 45,977 28.07% 28.07 25.33
State of Texas 25.6
Source: US Census Bureau

HEALTH
HEALTH According to a 2016 Healthcare and Bioscience Economic Impact Study published by the Greater San Antonio Chamber of Commerce, the Bioscience and Healthcare Cluster includes both direct and indirect healthcare services and continues to be one of the region’s biggest industries. Indeed, one out of every six residents works either directly or indirectly in the Bioscience and Healthcare industry. Direct healthcare services are those that provide care directly to patients. These services include hospitals, physicians' offices, nursing homes, offices and clinics of other healthcare providers, and various other outpatient and ambulatory care settings.
Indirect related components complement and support the provision of medical and healthcare. These indirect services are provided by health insurance carriers, pharmaceutical companies, medical equipment producers and manufacturers, civilian and military medical education, biomedical research organizations, residential care and social service providers, and a variety of related endeavors.
For the region, the estimated total economic impact of both direct and indirect healthcare services was $37 billion in 2015. This estimate shows significant growth from years past. In 2009, the comprehensive estimate of overall economic impact was $24.5 billion, a 51% increase. This comprehensive estimate includes the salaries of 172,084 employees in 2015. This estimate shows an increase of 49,355 jobs over the past decade, an increase of 46%. Additionally, jobs in this cluster, on average, have an annual salary that is 11.5% higher than the average amongst other employment sectors in the region.
HEALTH
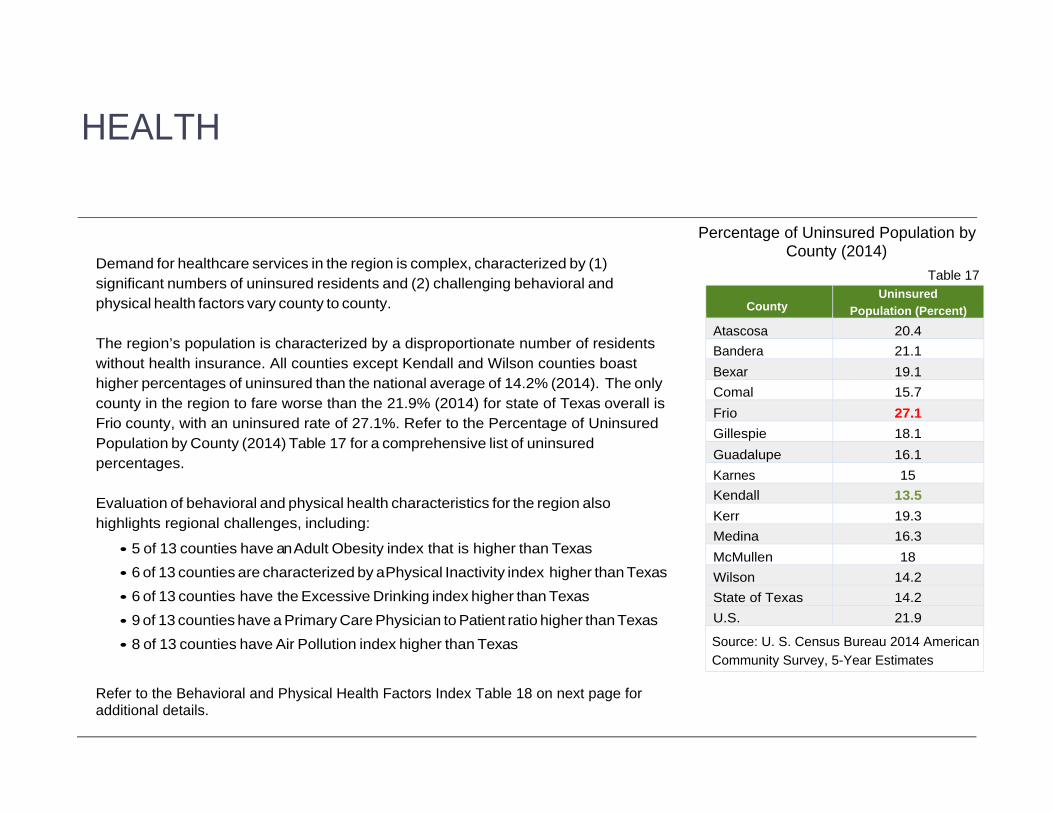
Demand for healthcare services in the region is complex, characterized by (1) significant numbers of uninsured residents and (2) challenging behavioral and physical health factors vary county to county.
The region’s population is characterized by a disproportionate number of residents without health insurance. All counties except Kendall and Wilson counties boast higher percentages of uninsured than the national average of 14.2% (2014). The only county in the region to fare worse than the 21.9% (2014) for state of Texas overall is Frio county, with an uninsured rate of 27.1%. Refer to the Percentage of Uninsured Population by County (2014) Table 17 for a comprehensive list of uninsured percentages.
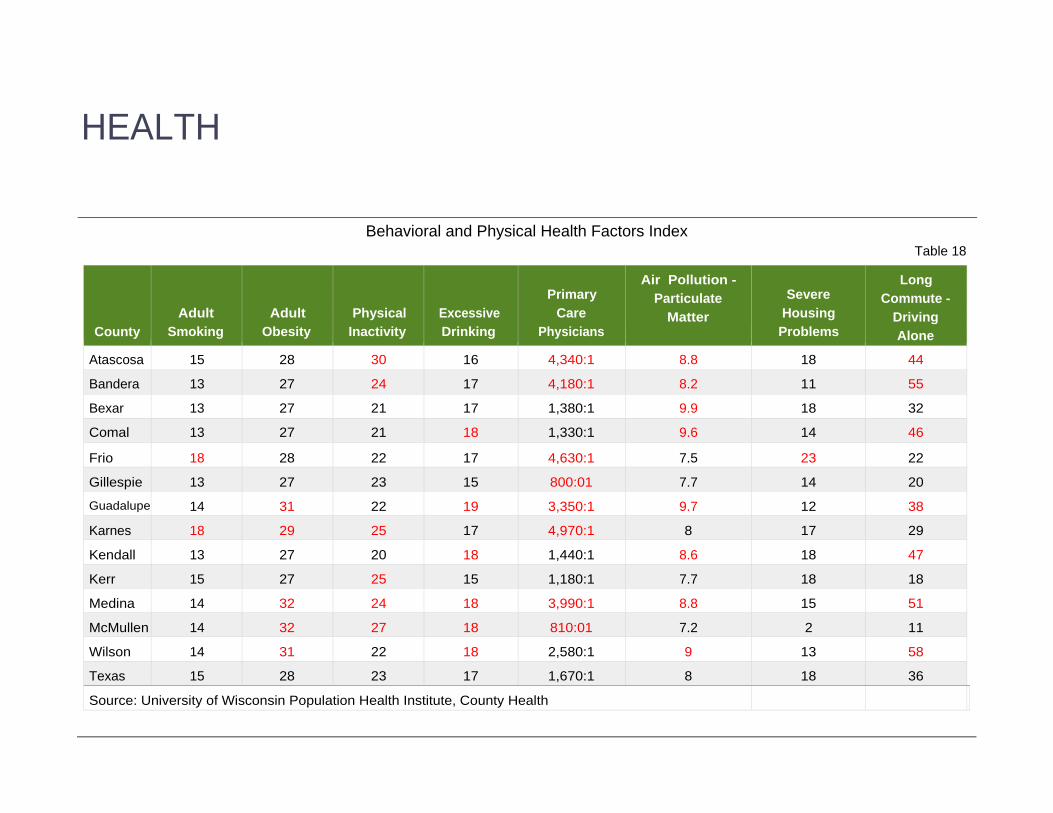
Evaluation of behavioral and physical health characteristics for the region also highlights regional challenges, including:
• 5 of 13 counties have an Adult Obesity index that is higher than Texas
• 6 of 13 counties are characterized by a Physical Inactivity index higher than Texas
• 6 of 13 counties have the Excessive Drinking index higher than Texas
• 9 of 13 counties have a Primary Care Physician to Patient ratio higher than Texas
• 8 of 13 counties have Air Pollution index higher than Texas
Refer to the Behavioral and Physical Health Factors Index Table 18 on next page for additional details.
Percentage of Uninsured Population by County (2014)
Table 17
County Uninsured
Population (Percent) Atascosa 20.4 Bandera 21.1 Bexar 19.1 Comal 15.7 Frio 27.1 Gillespie 18.1 Guadalupe 16.1 Karnes 15 Kendall 13.5 Kerr 19.3 Medina 16.3 McMullen 18 Wilson 14.2 State of Texas 14.2 U.S. 21.9
Source: U. S. Census Bureau 2014 American Community Survey, 5-Year Estimates
HEALTH
Behavioral and Physical Health Factors Index Table 18
County
Adult Smoking
Adult Obesity
Physical Inactivity
Excessive Drinking
Primary
Care Physicians
Air Pollution - Particulate
Matter
Severe
Housing Problems
Long Commute -
Driving Alone
Atascosa 15 28 30 16 4,340:1 8.8 18 44
Bandera 13 27 24 17 4,180:1 8.2 11 55
Bexar 13 27 21 17 1,380:1 9.9 18 32
Comal 13 27 21 18 1,330:1 9.6 14 46
Frio 18 28 22 17 4,630:1 7.5 23 22
Gillespie 13 27 23 15 800:01 7.7 14 20
Guadalupe 14 31 22 19 3,350:1 9.7 12 38
Karnes 18 29 25 17 4,970:1 8 17 29
Kendall 13 27 20 18 1,440:1 8.6 18 47
Kerr 15 27 25 15 1,180:1 7.7 18 18
Medina 14 32 24 18 3,990:1 8.8 15 51
McMullen 14 32 27 18 810:01 7.2 2 11
Wilson 14 31 22 18 2,580:1 9 13 58
Texas 15 28 23 17 1,670:1 8 18 36
Source: University of Wisconsin Population Health Institute, County Health

INFRASTRUCTURE
INFRASTRUCTURE Infrastructure of the region continues to be one of the area’s largest advantages. Being located at the junction of the state’s two largest corridors, IH 35 and IH 10, provides a dramatic advantage to the trade industry. The presence of both an international airport and a large multimodal trade facility located near to the US-Mexico border, makes San Antonio a very important hub for dispersion of goods both to and from the United States. Total trade between the U.S. and Mexico was $525 billion in 2016; $294 billion in imports and $231 billion in exports. https:// www.census.gov/foreign-trade/statistics/highlights/top/ top1612yr.html
INTERSTATE AND STATE HIGHWAYS There are 8 major interstate and state highways that service the Alamo area. These include IH 35, IH 10, IH 37, US Highway 90, US Highway 181, US Highway 281, Loop 410 and Loop 1604. These highways serve to transport both goods and commuters throughout the region and as the population grows, so does the need for upgrades to this infrastructure. Many of the major highways in the region are currently experiencing enhancement projects or have projects scheduled to begin this fiscal year. US Highway 281, LP 1604 and Loop 410, will have construction of a partial frontage road, ramps, and intersection improvements.
Source: Texas Wide Open for Business
Figure 3

INFRASTRUCTURE
Figure 4
PUBLIC TRANSIT There are two main providers of public transit in the region, VIA Metropolitan Transit (VIA) (www.viainfo.net) and Alamo Regional Transit (ART) operated by the Alamo Area Council of Governments (www.aacog.com/art).
VIA provides affordable transportation to 98% of Bexar County, including unincorporated parts of Bexar County and the following municipalities: Alamo Heights, Balcones Heights, Castle Hills, China Grove, Converse, Elmendorf, Kirby, Leon Valley, Olmos Park, San Antonio, Shavano Park, St. Hedwig, Terrell Hills, and portions of Cibolo within Bexar County. In 2016, VIA had a total ridership of 38,334,650 on the scheduled lines and 1,174,104 on VIATrans.
Alamo Regional Transit (ART) provides public transit services to the rural counties of the region in an on- demand basis. ART provides services to Atascosa, Bandera, Comal, Frio, Gillespie, Guadalupe, Karnes, Kendall, Kerr, Medina, McMullen, and Wilson. In 2016, ART provided 89,878 rides to rural residents.
INFRASTRUCTURE
AIRPORTS San Antonio International Airport (SAT) was ranked 45th in commercial airports in 2013 by the Federal Aviation Administration with a total of 4,005,874 enplanements. The Economic output for this airport in 2011 was nearly $6 billion and it employed roughly 62,000 people.
Stinson Municipal Airfield is the primary airfield for light aircraft in the region. The Economic output for this airfield in 2011 was nearly $24 million and it employed approximately 240 people.
Economic Contributions of Regional Airfields (2011)
Table 19
Airfield Economic Labor Income JobsCastroville Municipal $2,319,937 $657,319 17.8Devine Municipal $1,300,293 $220,786 8.6Gillespie County $2,469,137 $1,049,059 32.4South Texas Regional (Hondo) $31,491,584 $8,211,611 298.8Kerrville Municipal / L. Schreiner $44,988,676 $12,093,356 309.6New Braunfels Municipal $25,631,652 $7,077,190 120McKinley Field (Pearsall) $4,824,935 $1,462,517 26.8Stinson Municipal (San Antonio) $23,850,456 $8,941,676 240.4San Antonio International $6,434,683,363 $2,055,624,658 61,654
Source Economic Impact 2011: General Aviation in Texas, Texas Department of Transportation, www.txdot.gov/business/aviation/eco_impact_aviation.htm
Port San Antonio is a multimodal trade facility that is centrally located near 3 major highways (IH35, IH 10 and IH 37 in Bexar County). It spans 1,900 acres and possesses a 350-acre rail-served site and a 11,500-foot runway capable of handling large aircraft. The Port allows for the importation of trade goods via three modes of transportation, added $2.9 billion to the Gross Domestic Product (GDP) in Texas and employed 27,000 people in 2015. (Texas Comptroller: Port of Entry: San Antonio - Port San Antonio Impact to the Texas Economy, 2015)
INFRASTRUCTURE
BROADBAND
There is increasing evidence that access to broadband internet has positive impacts on economic growth of a region. Impressively, San Antonio was ranked 10th in the U.S. and 35th in the world for fastest internet speeds by Nomad List; however, broadband internet access is most heavily concentrated in the areas of the Alamo region that are more urbanized and affluent. (https://nomadlist.com/ cities-in-north-america#sort=internet_speed&view=list)
Access to high speed internet is no longer a luxury. It has become a necessity in the modern world and a challenge in rural areas. Only 55 percent of people living in rural areas have access to speeds that qualify as broadband, compared to 94 percent of the urban population. It is still more efficient for telecommunications companies to install new communications lines in areas with high population density. This is basic economics related to how many customers there are to share fixed installation costs. There are typically around 2,000 people per square mile in urban areas versus 10 in some rural areas.
Broadband Internet Access: Maximum Advertised Speed Available 25+ Mbps (2014) Source: National Broadband Map
Figure 5
MILITARY AND LAW ENFORCEMENT The Alamo Region is home to a very large military and law enforcement community. There is no question as to why San Antonio is referred to as Military City USA. The region has one of the largest active and retired military populations in the country. San Antonio Military Medical Center (SAMMC) serves as the largest and most robust Tier 1 military healthcare organization within the Department of Defense (DOD)
MILITARY This region is home to three major military installations; Randolph Air Force Base, Lackland Air Force Base, and Fort Sam Houston, which comprise Joint Base San Antonio (JBSA). The economic impact of Joint Base San Antonio is very important to the region.
JBSA has a total output of $48.7 billion and employs 282,995 people. These 282,995 employees, while not considered civilian employees of the region, bring with them a disposable personal income of more than $17 billion that contributes to the overall economy of the region.
Joint Base San Antonio; Estimated Contribution to the Texas Economy
Table 20
Estimated Contributions of Joint Base San Antonio to the Texas Economy, 2015 Total Output
$48,700,000,000
Total Employment 282,995 Gross Domestic Product $28,799,441,000 Disposable Personal Income $17,081,991,000
Source: Texas Comptroller of Public Accounts Data Analysis and Transparency Division
MILITARY AND LAW ENFORCEMENT
Police Officers per Capita (2011) Table 21 LAW ENFORCEMENT The Alamo Region has a large law enforcement presence, with the largest concentration being in the San Antonio Metropolitan Area. The San Antonio Police Department was ranked 2nd in the list of top 25 cities for police officers by Police Link in 2015. The main qualifiers used for this ranking were the cities growth rate, average salaries, cost of living and average commute time. The starting salary for academy graduates is $55,000 annually, which is the second highest starting salary in the state.
BORDER PATROL While the counties in the Alamo Region do not lie directly on the border between the U.S. and Mexico, the region, more specifically the San Antonio Metropolitan Area, serves as a major hub for undocumented persons seeking to travel further into the United States. IH 10 is a major corridor for undocumented persons from Del Rio, Laredo, and Eagle Pass to come into the region, at which point they can continue on to Houston or use one of the other major highways in the region to access other parts of the state and country. Due to this, the Border Patrol has a strong presence in this area.
County
Population
2010
Total Law Enforcement Employees
Total
Officers
Total
Civilians
Atascosa 44,911 79 32 47
Bandera 20,485 66 26 40
Bexar 1,714,774 1,675 527 1148
Comal 108,472 247 124 123
Frio 17,271 20 12 8
Gillespie 24,837 42 28 14
Guadalupe 131,533 210 85 125
Karnes 14,824 20 11 8
Kendall 33,410 74 48 26
Kerr 49,625 94 45 49
Medina 46,006 70 27 43
McMullen 707 6 5 1
Wilson 42,918 69 26 43
Source: Federal Bureau of Investigations
NATURAL RESOURCES
NATURAL RESOURCES Air Quality Air quality is a health concern in the San Antonio area that requires a shared commitment from local agencies, businesses, and individuals to ensure the region meets national air quality standards and to protect the community and the environment. The U.S. Environmental Protection Agency (EPA) sets thresholds for ozone and five other air pollutants considered harmful to public health and the environment as required by the Clean Air Act. Collectively, these thresholds are referred to as the National Ambient Air Quality Standards (NAAQS). The standards are subject to periodic review and may be modified if it is determined that they do not provide adequate protection of health and the environment. In 2015, the United States Environmental Protection Agency (EPA) issued a final rule to revise the primary 8-hour national ambient air quality standard (NAAQS) for ground-level ozone at 0.075 parts per million (ppm) (2008 standard) to 0.070 or 70 parts per billion. The final rule became effective on December 28, 2015. In addition to health and environmental issues, the consequences of failing to meet the NAAQS threshold for ozone include the addition of mobility conformity, additional permitting, and control strategy requirements that impact would economic growth in the area’s industry and manufacturing sectors. According a report commissioned by AACOG, economic costs of a nonattainment designation may range from $3.2 billion to $27.5 billion per year under the lowest level marginal designation and could increase to levels ranging from $7.1 billion to $36.2 billion if the region is given a moderate nonattainment classification. Eagle Ford Shale Of the 14 oil and natural gas-producing counties, five are in the AACOG region: Atascosa, Frio, Karnes, McMullen, and Wilson with Bexar County serving as a staging area for the oil and gas play. The Eagle Ford Shale play produced $123 billion in economic impact and created more than 191,000 jobs in Bexar and 20 other counties during the height of the oil boom in 2014 when prices peaked above $100 per barrel. Despite the fall of oil prices in January 2106, the Eagle Ford held on to $49.8 billion of economic impact and 108,000 jobs during that lean period.
NATURAL RESOURCES
NATURAL RESOURCES The Alamo region sits on the cusp of four of Texas’ twelve Level III Eco-regions; the Edward’s Plateau, the Texas Blackland Prairie, the East Texas Central Plains, and the Southern Texas Plains regions. Each of these eco-regions possess a unique makeup of flora, fauna, and geological features, which makes them unique from one another. The unique beauty and close proximity of each of these eco-regions is attractive to nature lovers of all kinds. From hikers, to fisherman, to birders, to hunters, to naturalists, each of these eco-regions possess something unique for all.
The Alamo Region contains only one national park, the San Antonio Missions National Park, but has a wealth of state parks and regional parks that perfectly display and embody the natural beauty of this region. The natural beauty and history of these parks draws visitors from all over the state and country into the region. The presence of these visitors serves to stimulate the local economy of the region via direct visitor spending at parks and other businesses in the area and through tax revenue.
The Alamo, the region’s most famous mission, is the number one tourist attraction in Texas and attracts roughly 3 million visitors a year. This patronage helps fuel the ever-growing hospitality industry that has an estimated impact of $13 billion annually.
Visitor Spending Effects National Parks Table 22
Effect 2012 2013 2014 2015 2016 Visitor Spending $33.1 M $28.8 M $78.3 M $75.7 M $79.5 M
Jobs to Local Gateway Economies
480K 412K 1.3M 1.2M 1.3M
Labor Income $14.1 M $12.2 M $38.1 M $36.1 M $38.6 M
Economic Output $41.9 M $36.4 M $108.3 M $105.1 M $110.7 M
Source: U.S. National Park Service

NATURAL RESOURCES
The region also contains a wealth of water resources that support the ecosystem. The Edwards Aquifer is a unique groundwater system and one of the most prolific artesian aquifers in the world. It is one of the greatest natural resources on Earth, serving the diverse agricultural, industrial, recreational, and domestic needs of almost two million users in south central Texas.
The Economic Contributions of State Parks Table 23
Park
Labor Income
Value Added
Output
Job
Sales Tax
Enchanted Rock State Park $1,999,083 $3,877,591 $6,579,385 88.8 $244,245 Guadalupe River State Park/ Honey Creek State Natural Area
$1,268,347 $2,298,378 $3,696,253 45.1 $118,396
Government Canyon State Natural Area
$384,558 $749,241 $1,209,477 10.9 $18,857
Old Tunnel State Park $253,047 $491,997 $846,583 11.2 $33,258 Hill Country - Louise Merrick Unit State Natural Area
$173,302 $363,682 $655,939 7 $12,744
Lyndon B. Johnson State Park/ State Historic Site
$1,076,616 $2,184,179 $3,798,326 46.7 $127,769
Lost Maples State Natural Area $623,104 $1,111,962 $1,925,374 23.4 $65,003
Choke Canyon $272,981 $707,166 $1,258,478 12 $20,973
Source: Texas Parks and Wildlife
TOURISM
TOURISM Another local attraction that draws a large number of visitors into the region is the beautiful San Antonio Riverwalk. The San Antonio Riverwalk is a series of walkways and bridges that line the banks along 2.5 miles of the San Antonio River. The Riverwalk is brimming with shopping, dining and unique entertainment opportunities. It displays the natural beauty and intoxicating culture of the region and contributes significantly to the overall economic health of the Alamo Region.
Annual Economic Impact of the River Walk (2014) tjkdjflkdjfl;kjd;lfjlskd;ajfl;kdsjfl;kjsd;lkfjl;kdsjflk;j Table 24
Impact Type Employment Income Output Direct Effect 21,294 $571,718,279 $1,807,908,085
Indirect Effect 5,086 $231,329,203 $690,928,900
Induced Effect 4,698 $198,146,016 $597,066,199
Total Effect 31,077 $1,001,193,524 $3,095,903,185
Source: San Antonio River Authority
The region is home to many festivals the largest and most famous being Fiesta San Antonio. Fiesta San Antonio is an annual festival held each April. The festival spans 10 days and has over 100 events including the world- famous Battle of Flowers Parade and Night in Old San Antonio. The economic impact of Fiesta San Antonio as a whole is $284 million annually from approximately 3.5 million patrons. Wurstfest is an annual festival held in New Braunfels that celebrates the rich German heritage. Wurstfest was voted the 2nd best Octoberfest in the nation by USA Today, and attracts over 100,000 patrons annually and $3 million impact.

SECTION III: SWOT Strengths, Weaknesses, Opportunities, and Threats
The SWOT analysis is a useful framework for analyzing an organization's strengths and weaknesses, and the opportunities and threats that it encounters. The analysis helps focus on the agency’s strengths, minimize threats, and take the greatest possible advantage of opportunities available. It is an on-going process that is monitored and updated by the EDD CEDS Committee. The following SWOT Analysis was comprised of information from economic development partners in the region over a one year period.
STRENGTHS
• Diversified regional economy
• Strong local economies in rural counties that strengthen region (i.e. Fredericksburg, New Braunfels, Kerrville, etc.) – micro-cluster economies
• Region is home to crossroads of IH-35, IH-10, and IH-37
• Strong military presence
• San Antonio Medical Center (SAMMC), home of military medicine
• Strong corporate headquarter presence (USAA, HEB, Rackspace, Whataburger, Valero, Tesoro, SWBC, Canadian General Tower, etc.)
• Port SA intermodal port and Hondo Airport are transportation and logistics assets
• Eagle Ford Shale oil and gas reserves (concentrated in rural AACOG region counties)
• Positioning of San Antonio as regional headquarters for Eagle Ford Shale production companies
• Growing local manufacturing cluster led by Toyota and Caterpillar plants and including Martin Marietta and Vulcan Materials
• Strong local healthcare cluster

SECTION III: SWOT Strengths, Weaknesses, Opportunities, and Threats
STRENGTHS (CONTINUED) • Growing Bioscience cluster, championed by BioMed SA
• Regional competency in biomedical research, including Southwest Research Institute and UT Health Science Center
• Availability of developable land (rural counties)
• Strong Collaboration / Communities, Economic Development Corporations (EDCs), Workforce Solutions, Education, etc.
• Post-Secondary Education Infrastructure (Alamo Colleges, UTSA, Texas A&M San Antonio, and numerous private universities)
• Public transportation capacity
• Emerging Cybersecurity industry leader WEAKNESSES
• Low unemployment, limited talent pool for growth
• Low educational attainment levels relative to state and nation
• Eagle Ford Shale production has deleterious impact on local and county roadways
• Transportation access to support economy and workforce
• Highway capacity taxed in keeping up with economic and population growth
• Competing economic development interests regionally between municipalities and economic development groups
• Broadband and connectivity issues for rural residents
• Rural vs. Urban needs and capacity

SECTION III: SWOT Strengths, Weaknesses, Opportunities, and Threats
OPPORTUNITIES • Improved economic development coordination region-wide
• Leverage economic potential of San Antonio to Austin corridor
• Increase airport capacity region wide anchored by San Antonio International Airport and Stinson Airfield
• Increased economic coordination with Austin to build complementary industry clusters
• Continued development of competencies in emerging clusters, i.e. IT, manufacturing, and biosciences
• Enhance Business Retention and Expansion Initiatives with local partners
• Improve secondary/post-secondary collaboration to promote educational attainment and credentialing (i.e. dual credit, articulation, stackable credentials, etc.)
• Invest in Research & Development and venture capital assets in the region
• Strengthening of entrepreneurship assets (low barriers to global competition)
• Continue to build "Quality of Life" assets region-wide THREATS
• Military reductions in force and reduction of additional federal funds
• Volatility in Oil and Gas Prices (supply and demand changes)
• Non-attainment designation of Air Quality Standards
• Competition with other regions for skilled workforce
• Resource constraints (public transit, air quality, water)
SECTION IV: PLAN OF ACTION
AACOG will continue to leverage resources and align interdependent planning and development components including economic development, workforce development, transportation, environmental-air quality, housing, and more. The Workforce Solutions Alamo Comprehensive Local Workforce Plan and AACOG’s CEDS are aligned with the local workforce plan to meet employer needs, and to support initiatives identified as key drivers of future economic growth in the Alamo region. http://www.workforcesolutionsalamo.org/about-us/ workforce-development-board-plan
AACOG, as the regional economic development district and lead agency for implementation of the CEDS, will play several key roles to ensure support of the recommended Plan of Action to include:
1. Promote regionalism in economic development to ensure communities throughout the region are fully capitalizing on
regional assets and building regional competencies.
2. Promote local economic development initiatives that leverage the unique assets of communities within the region.
3. Supply timely and actionable economic and labor market data to regional decision makers.
4. Provide technical assistance as needed to ensure communities within the Alamo region have knowledge of and access to the resources needed for their communities to prosper.
5. Promote collaboration and coordination among economic development stakeholders by facilitating relationships and bringing together key players with common interests.
The CEDS committee will meet quarterly to establish a framework to monitor/track activity towards these recommendations, including but not limited to establishing subgroups or taskforces for each of the five areas.
SECTION V: STRATEGIC RECOMMENDATIONS
As a result of the information shared by economic development stakeholders in the AACOG region and the SWOT Analysis, the following recommendations are outlined as strategic direction for the Economic Development District.
Recommendation 1: Work on improving the competitiveness of the region’s key economic clusters.
Key Actions:
A. Assist the Alamo region’s communities in implementing economic development strategies that attract and grow businesses in key economic clusters.
B. Assist smaller communities in developing smaller micro-clusters that capitalize on their unique community assets C. Support initiatives that focus on growing industries that generate wealth for the region.
D. Provide economic development partners and municipalities learning opportunities and networking opportunities through a series of economic development workshops and trainings.
E. Provide assistance to regional municipalities and other economic development stakeholders in applying for funds from the Economic Development Administration and other Federal and State funding agencies.
SECTION V: STRATEGIC RECOMMENTATIONS
Recommendation 2: Monitor and assist in the educational attainment and training of the workforce, incentivizing businesses to locate and expand in the Alamo region.
Key Actions:
A. Coordinate with regional education and workforce development agencies to better align regional curricula to meet employer needs.
B. Support the region’s human capital development by accessing resources for a well-prepared, skilled professional and technical workforce.
C. Secure and provide resources for an economic database of regional statistics, including labor pool, to attract businesses.
Recommendation 3: Through collaborative efforts, build a strong Innovation Infrastructure that promotes entrepreneurship and small business development.
Key Actions:
A. Support programs that develop entrepreneurial skills in the workforce.
B. Coordinate with regional Small Business Development Centers to improve access of resources throughout the region for entrepreneurs and small business owners.
C. Encourage incentive programs that will foster entrepreneurship and small business development

SECTION V: STRATEGIC RECOMMENTATIONS Recommendation 4: Guide and assist in the development of the region’s economic strength
Key Actions:
A. Assist the Alamo region’s communities in implementing economic development strategies that capitalize on their unique characteristics and economic opportunity.
B. Identify unique industries that can be replicated throughout the region.
C. Coordinate marketing opportunities within the region to highlight each community’s assets.
Recommendation 5: Coordinate and promote the economic resiliency within the AACOG region in conjunction with regional partners to minimize threats and hazards. A. Identify persistent economic deficiencies and challenges.
B. Monitor economic indicators to mitigate impact of economic disasters and respond to potential economic shocks.
C. Assist distressed communities affected by economic collapse.
D. Identify capacity of income equality, economic diversification, regional affordability and business climate as capacity measures.
SECTION VI: PERFORMANCE MEASURES
AACOG and the CEDS Committee will use the following performance measures to evaluate performance and compliance with the 2018-2023 CEDS.
Competitiveness of Economic Clusters
1. Number of jobs created 2. Number of new business formations by industry cluster
3. Annual report of business investments in the region
Educational Attainment
1. Increase of overall educational attainment of population age 25+ 2. Support network of education and business stakeholders
3. Foster apprenticeship programs that provide career pathways
SECTION VI: PERFORMANCE MEASURES
Support of Entrepreneurship and Small Business: 1. Create, develop and manage a business alliance for new or expanding businesses.
2. Support the need for improving infrastructure and capacity in the region.
3. Monitor number of jobs created by businesses with >5 employees.
Strategic Community Support: 1. Number of participants and workshops by the Economic Development District.
2. Number of requests for assistance completed by EDD.
3. Number of Economic Development presentations in the region.
Economic Resiliency: 1. Identify and leverage resources to respond to potential economic shocks.
2. Incorporate regional plans and strategies to aid and mitigate recovery.
3. Collaboration with federal, state and local partners to assist in recovery.

ALAMO AREA COUNCIL OF GOVERNMENTS 8700 Tesoro Drive, Suite 160 San Antonio, TX 78217 Phone: 210-362-5200 Fax: 1-866-332-3252