2014, 6, 601-608 601 open access reliability analysis ... · tained as the prior probabilities of...
TRANSCRIPT
Send Orders for Reprints to [email protected]
The Open Automation and Control Systems Journal, 2014, 6, 601-608 601
1874-4443/14 2014 Bentham Open
Open Access Reliability Analysis Method Study of Multi-state System Based on Fuzzy Bayesian Network
Zhai Sheng*,1, Shi Wuxi2 and Xiu Chunbo2
1School of Mechanical Engineering, Tianjin Polytechnic University, Tianjin, 300387, P.R. China 2School of Electrical Engineering and Automation, Tianjin Polytechnic University, Tianjin, 300387, P.R. China
Abstract: To deal with fuzzy and uncertain information in reliability analysis of multi-state systems, an approach based on fuzzy Bayesian networks is proposed. In this approach the fuzzy set theory and Bayesian networks methodology are applied. The fuzzy assessment information from different experts is described by triangular fuzzy numbers, which denotes the fuzzy probabilities of different states of root nodes. The depended uncertain ordered weighted averaging (DUOWA) operator is used to aggregate assessments information. Through defuzzification calculation, the crisp probabilities are ob-tained as the prior probabilities of the root nodes. Bayesian network (BN) is used to handle the uncertainty of logical rela-tionship between nodes and to compute system reliability. A case study concerning the reliability analysis in cell produc-tion line is provided and conducted using the proposed approach to illustrate its effectivity and practicability.
Keywords: Bayesian networks, fuzzy number, multi-state system, reliability analysis.
1. INTRODUCTION
The traditional reliability theories including Reliability Block Diagram (RBD), Binary Decision Diagram (BDD), Fault Tree Analysis (FTA), etc. have been applied extensive-ly in reliability analysis of systems [1-3]. Faced with increas-ingly complex systems and work environments, the require-ments for systems reliability analysis are getting stringent, which makes the application of these traditional reliability theories restricted a lot [4]. The uncertainty and fuzziness are inherent to complex systems.
In recent years, originated in the field of artificial intelli-gence, Bayesian Network (BN) as the representative of de-scribing uncertain knowledge and advanced inference tech-nology has been widely applied in reliability analysis [5, 6], risk analysis [7, 8] and fault diagnosis [9, 10]. Due to its rep-resentation ability of multi-state characteristic and uncertain-ty of logical relationship between nodes, Mahadevan [11] and Wilson [12] established reliability analysis models of two-state and multi-state system using BN technique. And through BN bidirectional inference, the marginal probability and posterior probability were obtained to analyze the weak-nesses in the system, which provided decision-making basis of design and maintenance of the system.
BN model above is based on the condition that the ele-mentary events probabilities are the exact values, but in practical cases, due to the lack of historical data, systems and environments complexity, the exact values of the ele-mentary events probabilities are difficult to obtain. To this
end, in the risk forecast of subway fire Lu [13] used fuzzy numbers in fuzzy set theory to represent the fuzzy probabili-ties of elementary events, by defuzzification, the crisp values of fuzzy probabilities of elementary events were obtained, but failed to establish a reliability analysis modeling of a multi-state system. Chang et al. [14] considered both fuzzy states and fuzzy information. Simon [15] and Weber devel-oped a Bayesian network model for determining reliability of the system with fuzzy states and imprecise probabilities.
In the process of synthesizing multiple expert judgments, Lu [13] integrated the multiple expert assessments using arithmetic average method, ignoring the different experts’ weights. And in many cases, due to the policy-makers’ lim-ited expertise in related problem areas, it is difficult to speci-fy the experts’ weights, which makes experts’ weights uncer-tain. And determining the experts’ weights is mostly subjec-tive, which may also cause a large deviation and affect the final evaluation.
A reliability analysis method of multi-state system based on fuzzy Bayesian networks is proposed to handle the fuzzi-ness of data and uncertainty of logical relationship between events. The fuzzy uncertainty of the elementary events prob-abilities is described using fuzzy numbers in fuzzy set theo-ry, the uncertainty of experts’ weights is determined using depended uncertain ordered weighted averaging (DUOWA) [16] operator, the BN model is used to express the uncertain causal relationship between events and to compute system reliability.
The rest of this paper is organized as follows: Section 2 introduces the representation and integration of the experts’ assessments. Section 3 briefly reviews the Bayesian network and introduces how to model multi-state system reliability based on BN. Section 4 illustrates the proposed approach
602 The Open Automation and Control Systems Journal, 2014, Volume 6 Sheng et al.
application in a cell production line. Section 5 draws the conclusion.
2. REPRESENTATION AND AGGREGATION OF THE EXPERTS’ ASSESSMENTS
2.1. Representation of the Experts’ Assessments
Under the conditions of being difficult to obtain exact events probabilities, the results are drawn from the experts’ experience through the method of group decision-making. As the experts’ assessments are often fuzzy information, in order to objectively describe the experts’ assessments, in this paper the fuzzy numbers in fuzzy set theory is used to repre-sent the experts’ assessments, i.e. the fuzzy probabilities of events. Using fuzzy numbers to describe the occurrence probabilities of events may reduce the difficulty of obtaining the exact values.
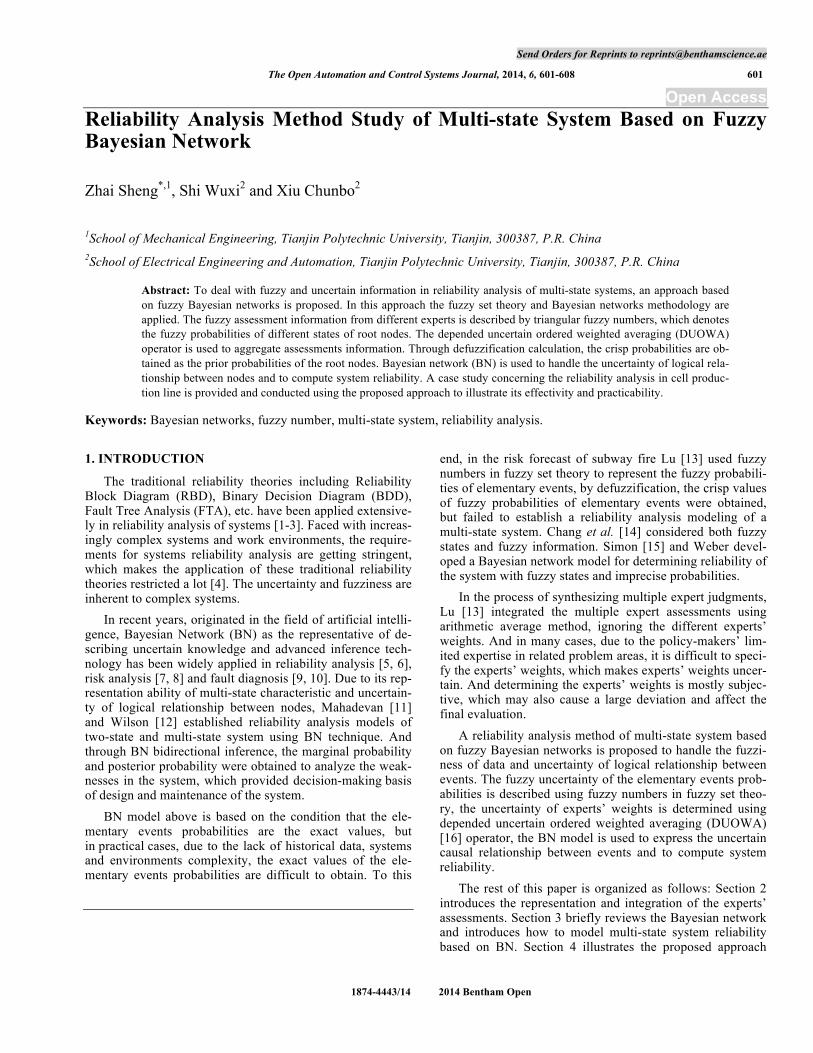
There are many forms of fuzzy number, such as the in-terval fuzzy number, triangular fuzzy number, trapezoidal fuzzy number, normal fuzzy number and LR fuzzy number. This paper takes the form of triangular fuzzy number to rep-resent the experts’ assessments. The fuzzy probability may be expressed in the form of fuzzy set, shown in Fig. (1).
The triangular fuzzy number may be denoted as !R
k=
( R
k
L , R
k
M , R
k
U ). The triangle membership function µ!R
(x) is
expressed as:
µ!R
(x) =
x ! R
k
L
Rk
M! R
k
L, R
k
L " x " Rk
M
Rk
U ! x
Rk
U! R
k
M, R
k
M " x " Rk
U
0, otherwise
#
$
%%%%
&
%%%%
(1)
2.2. Aggregation of the Experts’ Assessments
In the case of being difficult to determine the experts’ weights, in order to achieve the objective evaluation of the results, this paper relies on DUOWA operator to integrate the experts’ assessments, that is, by calculating the similarity degree between individual values and the average assessed value to determine the experts’ weights. The more similar it is, the bigger the weight is. The less similar it is, the smaller the weight is.
Suppose an expert panel composed of n experts makes events probabilities assessments. The triangular fuzzy num-ber of assessment value of k-th expert is
!R
k= (
R
k
L , R
k
M ,
R
k
U ), the average value is
!Ra
= ( R
a
L , R
a
M , R
a
U ), and
Ra
L=
1
nR
k
L
k=1
n
! ,
Ra
M=
1
nR
k
M
k=1
n
! ,
Ra
U=
1
nR
k
U
k=1
n
! ,
k = 1, 2, …, n.
The distance d( !R
k, !R
a) between
!R
kand
!Ra
is:
d( !R
k, !R
a) =
1
3| R
k
L! R
a
L |+ |Rk
M! R
a
M |+ |Rk
U! R
a
U |( )
(2)
The similarity degree s (Rk, Ra) between !R
kand
!Ra
is:
s( !Rk, !R
a) = 1!
d( !Rk, !R
a)
d( !Rk, !R
a)
k=1
n
"
(3)
Using DUOWA operators to integrate the experts’ as-sessments, the group assessment value !R is obtained as:
!R = (R
L , RM , R
U ) = DUOWA( !R1, !R
2,…, !R
n)
=
s( !Rk, !R
a)! !R
k
s( !Rk, !R
a)
k=1
n
"k=1
n
"
(4)
Using the mean area method to defuzzify, the group as-sessment value !R is transformed into the crisp group assess-ment value R. The defuzzification formula of the mean area method is:
24
L M UR R RR + +=
(5)
3. MULTI-STATE SYSTEMS RELIABILITY MODEL-ING BASED ON BN
3.1. Bayesian Network
BN is a Directed Acyclic Graph (DAG) of statistical de-pendence between random variables, which can be expressed as B = {G, P} = {X, E, P}, where G is a DAG representing variable domain, P represents a group of the corresponding
¦ Ì
0 0.1 0.2 0.3 0.4 0.5 0.6 0.7 0.8 0.9 1.0
1.0
0.5
kRL
kRU
kRM
Fig. (1). Expert assessment in the form of triangular fuzzy number.
Reliability Analysis Method Study of Multi-state System The Open Automation and Control Systems Journal, 2014, Volume 6 603
set of conditional probabilities, X is a random variable set, X={x1, x2,…, xl}, each node in G represents a random varia-ble, and each node corresponds to a conditional probability table (CPT), E is the set of directed edges, each edge in G represents the dependency between variables. Each node xi in a BN predetermined graph is independent of any child nodes consisted of xi non descendant nodes given by xi par-ent node.
If A (xi) represents a subset of any node consisted of non-descendant nodes, indicating the direct parent node of xi with π (xi), then according to the conditional independence as-sumptions, there is:
P(x
i|A(x
i),! (x
i))=P(x
i|! (x
i)) (6)
Assuming x1, x2… xl are the nodes of BN, the joint prob-ability of all nodes in the network as follows:
P(x1,x
2,…,x
l)= P(x
i|! (x
i))
i=1
k
"
(7)
So, BN can express joint probability distribution of the variables, and greatly simplify the solving of joint probabil-ity of variables.
3.2. Multi-state Systems Reliability Modeling Based on BN
Procedure for modeling multi-state system reliability based on BN is as follows:
1. Determining the nodes of BN, the root node of net-work representing the elementary events in the sys-tem, leaf nodes representing the system.
2. According to the causal relationship between the nodes determining the parent node, the child node, and establishing DAG which expresses the interde-pendence relationship between the nodes.
3. Determining the distribution parameters of priori probability of the root node and CPT.
In this paper, the BN model is established using method of Fault Tree (FT) mapping. FT model is established based on logical relationships between variables, and then the FT model is mapped into a BN model. A mapping algorithm includes graphical and numerical tasks. In graphical map-ping, primary events, intermediate events, and the top event of the FT are represented as root nodes, intermediate nodes, and the leaf node in the corresponding BN, respectively. In numerical mapping, the occurrence probabilities of the pri-mary events are assigned to the corresponding root nodes as prior probabilities [11].
In BN model, the root node variable of BN is xi (i = 1, 2, …, l), its state is vi (vi= 0, 1, …, r-1); intermediate node vari-able is yj (j = 1, 2, …, m), its state is wj (wj = 0, 1, …, s-1); the leaf node variable is T, and its state is QT (QT = 0, 1, …, n-1), Where in the normal state is state 0. Given occurrence probability of various fault states of each root is P (xi = vi), using the bucket elimination method, the occurrence proba-bility P (T =QT) is obtained when the leaf node T =QT:
( )TP T Q=
1 2 1 2
1 2 1 2, , , ,y ,y , ,y
( , , , , y , y , , y , )l m
l m Tx x x
P x x x T Q= =∑L L
L L
= P(T = QT
! (T )
" |! (T ))# P( y1 |! ( y1))!# P( yj |! ( yj))!#! ( yj )
"! ( y1)
"
P( ym |! ( ym))! ( ym)
" P(x1= v
1)!P(x
i= v
i)!P(x
l= v
l)
(8)
When the root node xi = vi, the probability of leaf node T =QT is:
P(T = QT
|xi= v
i) =
P(T = QT,x
i= v
i)
P(xi= v
i)
=
P(x1,x
2,!,x
l, y
1,y
2,!,
ym
,T = QT,x
i= v
i)x
1,x
2,!,x
l,y
1,y
2,!,y
m
!
P(xi= v
i)
(9)
When a leaf node T =QT, the state probability (posterior probability) of root node xi = vi is:
P(xi= v
i|T = Q
T) =
P(xi= v
i,T = Q
T)
P(T = QT
)
=
P(x1,x
2,!,x
l, y
1,y
2,!, y
m,T = Q
T,x
i= v
i)
x1, x
2,!,x
l,y
1,y
2,!,y
m
!
P(T = QT
) (10)
According to Bayes’ theorem:
P(xi= v
i|T = Q
T) =
P(xi= v
i)P(T = Q
T| x
i= v
i)
P(T = QT
) (11)
In order for the reliability analysis of multi-state system, importance analysis is indispensable. Next, the state im-portance and the probability importance of the node will be defined.
Definition 1: When the root node xi is in the fault state vi, the state importance
I
QT
Pr (xi= v
i) of the leaf node T =QT in
this state is defined as:
I
QT
Pr (xi= v
i) = P(T = Q
T| x
i= v
i)! P(T = Q
T| x
i= 0)
(12)
It represents the effective degree on the leaf nodes T =QT when root node xi = vi.
Definition 2: when the leaf node T is in the state QT, the probability importance
I
QT
Pr (xi) of root node xi is defined as:
1Pr Pr
1
1( ) ( )1T T
i
r
Q i Q i iv
I x I x vr
−
=
= =− ∑
[ ]1
1
1 ( | ) ( | 0)1
i
r
T i i T ivP T Q x v P T Q x
r
−
=
= = = − = =− ∑ (13)

604 The Open Automation and Control Systems Journal, 2014, Volume 6 Sheng et al.
It represents the effective degree of the root node xi on the leaf node T =QT.
Thus calculating the state importance and probability im-portance of each root node in the different fault states of sys-tem, we can know their impact on the system and find out the weak link of system. Calculating the posterior probabili-ties, we can identify the occurrence probability of each root node when the system is in fault state, and find out the cause of system fault. Finally, we provide reliable decision support for the design and maintenance of the system.
4. CASE STUDY
The following will be the reliability analysis of a cell production line for an enterprise. The main task of the pro-duction line is: putting the lithium-chip, the separator paper and the manganese cathode soaked by electrolyte into the negative electrode with set nets, and supplementing with volatile electrolyte in cathode film. Under the premise to ensure complete penetration of electrolyte, there are some other processes such as stamping cathode casing, sealing etc.
4.1. Establishment of BN Reliability Modeling According to the function of the system, the system is di-
vided into five working subsystems, namely the subsystem
of feeding negative shell and lithium, subsystem of dividing the paper into negative shell, subsystem of feeding MnO2, subsystem of assembling positive steel shell, sealing subsys-tem. Among them the subsystem of feeding MnO2 is select-ed for analysis.
According to the logical relationship between events, FT model which top event is subsystem fault of feeding MnO2 is established, shown in Fig. (2).
Specification between the events and the notations is shown in Table 1.
The FT model being built is mapped to the BN model (omitted CPT due to space reason) as shown in Fig. (3), so the reliability model based on BN is established.
According to the practical situation, the components and the system are set in three states 0, 1, 2, that is, QT = 0, 1, 2 and vi = 0, 1, 2. Where 0 is normal operation state, 1 is a state of slight fault state, 2 is serious fault state.
4.2. Reliability Analysis System
1) Experts’ assessments. First, a panel of 4 experts is established, according to
their experience the experts assess the occurrence probability of each fault mode and the state, and then give the corre-sponding triangular fuzzy numbers. Using DUOWA operator
x2 x3 x4 x5 x6 x7 x8 x9 x10 x11 x12 x13x1
T
y2 y3y1
y4 y5
Fig. (2). Fault Tree Model of Feeding MnO2 Subsystem.
x1
T
y1 y2 y3y4 y5
x2 x3 x4 x5 x6 x7 x8 x9 x10 x11 x12 x13
Fig. (3). BN model of subsystem feeding MnO2.

Reliability Analysis Method Study of Multi-state System The Open Automation and Control Systems Journal, 2014, Volume 6 605
Table 1. Nodes description.
Node Event Node Event
T Subsystem feeding MnO2 fault x5 Sensor fault
y1 Device feeding negative shell fault x6 Cylinder feeding MnO2 jam
y2 Device feeding MnO2 fault x7 Defective MnO2
y3 Out-feeding device fault x8 Solenoid valve fault
y4 Cylinder feeding negative shell fault x9 Conveyor belt fault
y5 Cylinder feeding MnO2 fault x10 Sensor fault
x1 Cylinder feeding negative shell jam x11 Solenoid valve fault
x2 Negative shell deformation x12 Out-feeding cylinder jam
x3 Solenoid valve fault x13 Sensor fault
x4 Conveyor belt fault
Table 2. Expert assessment value and the exact value of the fault probability of the root node.
(2-1)
Title x1=1 x2=1 (x3, x8, x11) =2 x4=1 x4=2 (x5,x10,x13) =1
Expert 1 (0.15,0.22,0.3) (0.1,0.16,0.22) (0.38,0.43,0.52) (0.22,0.26,0.32) (0.1,0.15,0.2) (0.05,0.1,0.15)
Expert 2 (0.18,0.25,0.32) (0.08,0.18,0.25) (0.35,0.45,0.55) (0.24,0.28,0.32) (0.08,0.16,0.22) (0.08,0.15,0.2)
Expert 3 (0.2,0.25,0.3) (0.1,0.18,0.22) (0.4,0.45,0.5) (0.2,0.25,0.3) (0.09,0.14,0.19) (0.06,0.1,0.17)
Expert 4 (0.16,0.2,0.25) (0.08,0.13,0.20) (0.37,0.42,0.47) (0.22,0.28,0.33) (0.08,0.13,0.18) (0.1,0.15,0.2)
Group (0.173,0.231,0.295) (0.092,0.164,0.223) (0.377,0.437,0.509) (0.220,0.268,0.323) (0.089,0.145,0.197) (0.072,0.125,0.180)
Exact value 0.232 0.161 0.44 0.270 0.144 0.126
(2-2)
Title x6=1 x7=1 x9 =1 x9 =2 x12=1
Expert 1 (0.18,0.24,0.3) (0.12,0.18,0.24) (0.24,0.28,0.34) (0.1,0.15,0.2) (0.28,0.35,0.4)
Expert 2 (0.2,0.25,0.3) (0.1,0.18,0.25) (0.26,0.3,0.34) (0.08,0.16,0.22) (0.25,0.3,0.35)
Expert 3 (0.22,0.26,0.32) (0.1,0.15,0.22) (0.23,0.28,0.35) (0.09,0.14,0.19) (0.26,0.32,0.36)
Expert 4 (0.2,0.26,0.3) (0.12,0.18,0.25) (0.24,0.3,0.25) (0.08,0.13,0.18) (0.27,0.33,0.38)
Group (0.200,0.253,0.304) (0.111,0.174,0.241) (0.242,0.290,0.345) (0.089,0.145,0.197) (0.265,0.325,0.372)
Exact value 0.252 0.175 0.292 0.144 0.322
method, according to Eq. (2-4) the estimation information of experts are integrated, the results of group assessment are obtained, after defuzzification by Eq. (5) the exact value of occurrence probability of each fault mode in different states is obtained, as shown in Table 2.
2) Calculation of the importance.
The exact values gained after defuzzification as priori probabilities are used to conduct inference calculation. Next we take node x4 for example.
As the fault state of node x4 is 1, i.e. v4 =1, the state im-portance Pr
1 4( 1)I x = when T =1 can be obtained by Eq. (12) as follows:

606 The Open Automation and Control Systems Journal, 2014, Volume 6 Sheng et al.
I
1
Pr (x4= 1) = P(T = 1| x
4= 1)! P(T = 1| x
4= 0)
= 0.99372
The state importance of node x4 I
1
Pr (x4= 1) when T =1
can be obtained by Eq. (13) as follows:
I
1
Pr (x4) = ( )Pr Pr
1 4 1 41 ( 1) ( 2)2I x I x= + =
=1
2P(T = 1| x
4= v
i)! P(T = 1| x
4= 0)"# $%
vi=1
2
&
= 0.49686
The state importance and the probability importance of other nodes can be obtained as shown in Table 3 and Table 4.
3) The posterior probability calculation. Taking the node x4 for example, the posterior probability
of node x4 can be obtained using Eq. (10) when system fault state T=1:
4( 1, 1)
( 1| 1)( 1)iP x T
P x TP T= =
= = ==
=
P(x1,x
2,!,x
13, y
1,y
2,!, y
5,T = 1,x
4= 1)
x1,x
2,!,x
13,y
1,y
2,!,y
5
!
P(T = 1)
= 53.0 4) Reliability analysis. The weaknesses of the system can be identified through
the importance of the root node, and by increasing the relia-bility of links the system reliability can also be improved.
Table 3 shows that the effect of the current fault status of the root node on the system is as follows: in the state of slight fault, the node x7 has the greatest impact; in the state of serious fault, the nodes x3, x8, x11 have the greatest impact.
Table 4 shows that the effect of the root node on the sys-tem is as follows: in the state of slight fault, the node x7 has the greatest impact; in the state of serious fault, the nodes x3, x8, x11 have the greatest impact.
Table 3. State Importance of Nodes.
Node State Importance
Node State Importance
I
1
Pr (xi=1)
I
2
Pr (xi=1)
I
1
Pr (xi=2)
I
2
Pr (xi=2)
I
1
Pr (xi=1)
I
2
Pr (xi=1)
I
1
Pr (xi=2)
I
2
Pr (xi=2)
x1 0.99353 0 0 0 x8 0 0 0 0.99883
x2 0.9949 0 0 0 x9 0.99374 0 0 0.99520
x3 0 0 0 0.99883 x 10 0.99343 0 0 0
x4 0.99372 0 0 0.99854 x 11 0 0 0 0.99883
x5 0.99343 0 0 0 x 12 0.99362 0 0 0
x6 0.99355 0 0 0 x 13 0.99343 0 0 0
x7 0.99504 0 0 0
Table 4. Probability Importance of Nodes.
Node Probability Importance
Node Probability Importance
I
1
Pr (xi)
I
2
Pr (xi)
I
1
Pr (xi)
I
2
Pr (xi)
x1 0.49677 0 x8 0 0.49942
x2 0.49745 0 x9 0.49687 0.49760
x3 0 0.49942 x 10 0.49672 0
x4 0.49686 0.49927 x 11 0 0.49942
x5 0.49672 0 x 12 0.49681 0
x6 0.49678 0 x 13 0.49672 0
x7 0.49752 0

Reliability Analysis Method Study of Multi-state System The Open Automation and Control Systems Journal, 2014, Volume 6 607
These nodes mentioned above are needed to be paid at-tention to and to be improved.
According to the posterior probability of each root node, fault probability of each node can be gained after a system fault, and thus fault diagnosis for system can be made, that is according to the posterior probability, the corresponding root nodes are detected top down.
Table 5 summarizes when the slight system fault occurs, the order of checking slight fault nodes is x7, x2, x12, x9, x4, x6, x1, (x5, x10, x13); when serious system fault occurs, the order of checking serious fault nodes is (x5, x10, x13) , x4, x9, the order of checking slight fault nodes is x7, x2, x12, x9, x6, x4, x1, ( x5, x10, x13).
5. CONCLUSION
The proposed method combines the advantages of fuzzy set theory and BN technology to solve the problem of the uncertainty and fuzziness in reliability analysis of complex system.
In this paper, the triangular fuzzy number is adopted to describe the fuzzy probability of the event, which solves the problem of being difficult to obtain precise data; through the method of group decision, using DUOWA operator, the as-sessments of experts with uncertain weights are integrated, which solves the problem of the influence of uncertain weights to the results of assessment.
Bayesian network model is used to handle the uncertainty of logical relationship between events and to compute sys-tem reliability. Through the calculation of importance of node and posterior probabilities, a more effective decision support is offered for the design and maintenance of com-plex systems.
The analysis of cases has proved that this method pro-vides a powerful analytical tool for the reliability analysis of complex systems in a complex environment.
CONFLICT OF INTEREST
The authors confirm that this article content has no con-flict of interest.
ACKNOWLEDGEMENTS
This research was partially supported by the National Na-ture Science Foundation of China (No. 61203302).
REFERENCES [1] S. P. Wang, Engineering reliability, Beihang University Pess:
Beijing, 2000. [2] L. D. Xing, and G. Levitin, “BDD-based reliability evaluation of
phased-mission systems with internal/external common-cause fail-ure”, Reliability Engineering and System Safety, vol. 84, no. 2, pp. 145-153, 2013.
[3] R. X. Duan, J. L. Tu, and D. C. Dong, “A novel hybrid approach of fault tree and Bayesian networks for fault diagnosis”, Journal of Computational Information System, vol. 6, no. 11, pp. 3605-3612, 2010.
[4] H. Langseth, and L. Portinale, “Bayesian networks in reliability”, Reliability Engineering System Safety, vol. 92, no.1, pp. 92-108, 2007.
[5] Y. Jiang, H. Zhang, X. Y. Song, X. Jiao, H. N. N. Hung, M. Gu, and J. Sun, “Bayesian-network-based reliability analysis of plc sys-tems”, IEEE transactions on industrial electronics, vol. 60, no. 11, pp. 5325-5336, 2013.
[6] B. P. Cai, Y. Liu, Z. Liu, X. Tian, X. Dong, and S. Yu, “Using Bayesian networks in reliability evaluation for subsea blowout pre-venter control system”, Reliability Engineering and System Safety, vol. 108, no. 2, pp. 32-41, 2012.
[7] K. Nima, K. Faisal, and A. Paul, “Safety analysis in process facili-ties: Comparison of fault tree and Bayesian network approaches”, Reliability Engineering System Safety, vol. 96, no. 8, pp. 925-932, 2011.
[8] M. R. Martins, and M. C. Maturana, “Application of Bayesian Belief networks to the human reliability analysis of an oil tanker operation focusing on collision accidents”, Reliability Engineering and System Safety, vol. 110, pp. 89-109, 2013.
[9] R. X. Duan, J. L. Tu, and D. C. Dong, “A novel hybrid approach of fault tree and Bayesian networks for fault diagnosis”, Journal of Computational Information System, vol. 6, no.11, pp. 3605-3612, 2010.
[10] X. Y. Wang, and Y. H. Qiu, “Software dependability evaluation based on linguistic Bayesian network and OWA operator”, Journal
Table 5. Priori & Posterior Probability of Nodes (10-3/h).
Node
Priori Probability
Posterior Probability
T= 1
Posterior Probability
T=2 Node
Priori Probability
Posterior Probability
T= 1
Posterior Probability
T= 2
vi =1, vi =2 vi =1, vi =2 vi =1, vi =2 vi =1, vi =2 vi =1, vi =2 vi =1, vi =2
x1 0.232, 0 45.5, 0 0.232, 0 x8 0, 0.44 0, 0 0, 273.8
x2 1.61, 0 315.9, 0 1.61, 0 x9 0.292, 0.144 57.3, 0 0.26, 89.6
x3 0, 0.44 0, 0 0, 273.8 x 10 0.126, 0 24.7, 0 0.126, 0
x4 0.270, 0.144 53.0, 0 0.24, 89.6 x 11 0, 0.44 0, 0 0, 273.8
x5 0.126, 0 24.7, 0 0.126, 0 x 12 0.322, 0 63.2, 0 0.322, 0
x6 0.252, 0 49.4, 0 0.252, 0 x 13 0.126, 0 24.7, 0 0.126, 0
x7 1.75, 0 343.4, 0 1.75, 0

608 The Open Automation and Control Systems Journal, 2014, Volume 6 Sheng et al.
of Computational Information System, vol. 9, no. 7, pp. 2889-2896, 2013.
[11] S. Mahadevan, R. Zhang, and N. Smith, “Bayesian networks for system reliability reassessment”, Structural Safety, vol. 23, pp. 231-251, 2001.
[12] A. G. Wilson, and A. V. Huzurbazar, “Bayesian networks for mul-tilevel system reliability”, Reliability Engineering and System Safe-ty, vol. 92, no. 10, pp. 1413-1420, 2007.
[13] Y. Lu, Q. M. Li, and Z. P. Zhou, “Safety risk prediction of subway operation based on fuzzy Bayesian network”, Chinese Journal of Southeast University, vol. 40, no. 5, pp. 1110-1114, 2010.
[14] C. C. Chang, R. S. Chen, and P. R. Sun, “Applying fuzzy Bayesian maximum entropy to extrapolating deterioration in repairable sys-tems”, (Y. Zhaf, ed.), Machine learning, Intech, 2010, pp. 217-238.
[15] C. Simon, and P. Weber, “Evidential networks for reliability analy-sis and performance evaluation of systems with imprecise knowledge”, IEEE Transactions on Reliability, vol. 58, no.1, pp. 69-87, 2009.
[16] Z. S. XU, “Dependent uncertain ordered weighted aggregation operators”, Information Fusion, vol. 9, no. 2, pp. 310-316, 2008.
Received: November 19, 2014 Revised: January 07, 2015 Accepted: January 21, 2015
© Sheng et al.; Licensee Bentham Open.
This is an open access article licensed under the terms of the Creative Commons Attribution Non-Commercial License (http://creativecommons.org/licenses/by-nc/3.0/) which permits unrestricted, non-commercial use, distribution and reproduction in any medium, provided the work is properly cited.