2014 graham centre beef forum - charles sturt university€¦ · · 2014-12-082014 graham centre...
TRANSCRIPT

2014 Graham Centre Beef forum

2014 Graham Centre | Beef Forum 1
ContentsProgram ........................................................................................................ 3
Sponsors ...................................................................................................... 4
Welcome ...................................................................................................... 5
Speaker biographies ............................................................................... 6
Understanding the challenges of volatile seasons, markets and finance in beef production ................................... 8 Associate Professor Bill Malcolm and Dr Alex Sinnett Agriculture Research Division, Department of Primary Industries, Parkville, Victoria
Online processing technologies predicting carcass and meat quality traits - what this means for producers .......................18 Ms Edwina Toohey NSW Department of Primary Industries
Opportunity and drought feedlots .........................................20 Mr Brett Littler Local Land Services, Central Tablelands
Don’t fence me in? The welfare of cattle in feedlots .............22 Dr Rebecca Doyle Animal Welfare Science Centre, University of Melbourne
Working with cattle to build better stockyards .....................26 Mr Bill Thomas ProWay
A study of Pestivirus in Eastern Australia: farmers’ understanding of the disease, and approach to control .....29 Dr Alistair Smith, Dr Marta Hernandez-Jover and Mr Steve Exton School of Animal and Veterinary Sciences, Charles Sturt University
2014 Graham Centre Beef Forum
2014 Graham Centre | Beef Forum2

2014 Graham Centre | Beef Forum 3
8.30 - 8.55am Registration and coffee
8.55 - 9.00am Welcome and outline of the day Ms Toni Nugent, Industry Partnerships and Communications Manager, Graham Centre
9.00 - 9.30am Managing the challenges of volatile seasons and markets in beef production Professor Bill Malcolm (The University of Melbourne)
9.30 - 9.50am Online processing technologies predicting carcass and meat quality traits – what this means for producers Ms Edwina Toohey (NSW DPI)
9.50 -1 0.10am Opportunity and drought feedlots – practical experience and examples of making it work Mr Brett Littler (Local Land Services)
10.10 - 10.30am Targeting customers requirements Mr Graeme Flynn (Producer)
10.30 - 11.00am Panel Session (all session speakers)
11.00 - 11.30am MORNING TEA
11.30- 11.50am Don’t fence me in – animal welfare issues in cattle feedlots Dr Rebecca Doyle (The University of Melbourne)
11.50 - 12.10am Working with cattle to build better stockyards Mr Bill Thomas (Proway)
12.10 - 12.30pm Pestivirus in eastern Australia; farmers’ understanding of the disease and approach to control Dr Alistair Smith (CSU)
12.30 - 1.00pm Panel Session (all session speakers)
1.00 - 1.15pm Forum summary and wrap up and evaluation Ms Toni Nugent, Industry Partnerships and Communications Manager, Graham Centre
1.15pm LUNCH (sponsored by Teys Australia)
Graham Centre Beef Forum15 August 2014 - CSU Convention Centre, Wagga Wagga
An alliance between

2014 Graham Centre | Beef Forum4
Sponsors
AUSTRALIA

2014 Graham Centre | Beef Forum 5
This year our Beef Forum addresses how to manage the challenges of volatile seasons and markets in beef production, online processing technologies predicting carcass and meat quality traits and what this means for producers, animal welfare issues in cattle feedlots, working with cattle to build better stockyards, practical experience and examples of making opportunity and drought feedlots work and farmers understanding and their approach to control of pestivirus in eastern Australia.
Increasing costs are putting considerable pressure on growers to manage complex mixed farming systems, to ensure profitability, viability and sustainability into the future. Our research focuses on improving profitability for the livestock industries through the development of efficient feedbase options, including pastures, crops and annual legumes, and fodder conservation. Reducing the impacts of diseases, parasites and other factors impacting on animal productivity by improving feedbase management, on-farm bio-security and animal welfare practices are also key research areas to ensure increased productivity and profitability of our livestock industries.
The latest research from the Graham Centre and our partners is showcased at our forum today, to assist producers to develop and maintain robust and profitable beef production systems. This also provides an opportunity for you to meet and network with industry experts.
We look forward to some robust discussion about the drivers, opportunities, challenges and research needs facing our livestock production systems.
Regards,
Professor Deirdre Lemerle Director Graham Centre for Agricultural Innovation
Welcome to our 2014 Beef Forum

2014 Graham Centre | Beef Forum6
Speaker biographiesDr Rebecca Doyle
Rebecca initially studied animal science at Sydney University and graduated with honours following a project in crocodile endocrinology. After graduating, Rebecca started a PhD with the CSIRO in Armidale investigating novel measures of welfare and cognition in sheep. During this time she collaborated with INRA in France.
After completing her PhD, Rebecca was employed as a lecturer at Charles Sturt University where she continued her research in animal welfare. Her research projects have included animal cognition and cognitive bias, correlating stress physiology with behavioural and cognitive welfare measures, and how to make practical animal welfare improvements in the live export industry.
Rebecca’s current appointment with the AWSC includes a continuation of her work focusing on welfare improvements in the sheep and beef industries. Along with research and teaching, she is the Australasian / African regional secretary of the International Society of Applied Ethology. In 2011, Rebecca was the Animal Welfare Science and Innovation award recipient.
Mr Graeme Flynn
Graeme has 22 years experience in the feedlot industry, working his way up through the ranks at Rockdale Feedlot to Assistant Manager, before starting his own feedlot on his property ‘Glenfyne’ at Narrandera, NSW in 2011. Graham is also Director of Advanced Feedlot Systems, consulting to the feedlot industry in Indonesia. He was a Council Member of the Australian Lotfeeders Society from 2008-2012.
Mr Brett Littler
Brett is a livestock industry professional with 20 years experience in livestock production, breeding and management as an extension officer and other positions within the livestock industry. Brett was a beef cattle officer for NSW Agriculture for 17 years, and during this time worked in Japan and Korea, and conducted livestock training in all states of Australia. He assisted in the development of the BeefSpecs Calculator and was responsible for the validation work and development of the industry training package of BeefSpecs. Brett is responsible for the training and skills audit of the National Livestock Reporting Service (NLRS) staff in beef cattle and is one of the authors of the recently released publication ‘A National Guide to Describing and Managing Beef Cattle in Low Body Condition’.
Associate Professor Bill Malcolm
Bill works in the Faculty of Veterinary and Agriculture Sciences, University of Melbourne and is a Principal Scientist Farm Economics with the Victorian Department of Environment and Primary Industries. Bill has worked in farm economics with farmers, agriculturalists and agricultural scientists since 1977.
Dr Alistair Smith
Alistair graduated from the Royal (Dick) School of Veterinary Studies, Edinburgh in 1982 and gained a Diploma in Bovine Reproduction, University of Liverpool in 1994. He received recognition as a Royal College of Veterinary Surgeons Specialist in Cattle Reproduction in 2000.
In his early years, Alistair worked in mixed practice before being employed with Genus Breeding and moving to Aberdeen, Scotland in 1990 and secondment to the Scottish Agricultural College’s research program in cattle reproduction. In 1994 he left this post to co-found Ovaflo, a cattle embryo transfer company based in Scotland. His core activities were in cattle embryo transfer, but also included consultancy on reproductive problems and herd health advice.
Alistair joined the School of Animal and Veterinary Science at CSU in 2012 as a Senior Lecturer in Ruminant Health and Production. His research interests lie in the area of Pestivirus and copper deficiency in cattle and the reproductive impact of these conditions.
Mr Bill Thomas
Bill is a stockyard designer working with ProWay Livestock. He is a founding partner of the business that started from scratch 15 years ago.
After leaving school, Bill went jackarooing for a few years on various grazing properties from family owned farms to corporate stations. During this time Bill became aware of different stockyard designs, what worked and what didn’t, recognising their traits. Bill then went on to study Agricultural Commerce and afterwards managed a farm for an owner who was more interested in steel fabrication than farming. The fabrication side of things rubbed off on Bill and so a career in designing and constructing stockyards was ignited.
Bill now spends his time designing and managing the construction of animal handling facilities for farm, feedlot, abattoir and saleyard applications. More recently he has taken on the role as a consultant to help train operators within the abattoir industry about livestock handling and stockyard design principles.

2014 Graham Centre | Beef Forum 7
Ms Edwina Toohey
Edwina is a NSW Department of Primary Industries Beef Development Officer based in Dubbo. She joined NSW DPI in 2003 as a Research Officer (Meat Science) after completing her Bachelor of Applied Science (Agriculture) (Honours) at Charles Sturt University’s Wagga Wagga Campus. Edwina’s honours project was part of a larger NSW DPI and Beef CRC project which looked at the genotype and growth rate effects on meat quality of feedlot finished beef carcases.
Edwina has experience in both cattle and sheep research and has authored 55 scientific papers / reports. In CRC1 Edwina was the key researcher in the validation and optimisation of new generation electrical technologies across Australia, with this work extended to the goat industry. Her expertise and industry credibility was important to address the performance of electrical stimulation units being used at the abattoirs that slaughter Sheep CRC IN lambs, and more recently into the development of electrical stimulation training manuals for processors.
She has also undertaken research on methods to alleviate dehydration in sheep under lairage conditions and has recently completed working on the SmartShape™ /SmartStretch™ technology in beef and sheep meat, fully funded by MLA. Associated with this work Edwina completed her Masters degree through the University of New England. Edwina’s focus more recently has been on carcase measurement technologies.
2014 Graham Centre | Beef Forum8
Associate Professor Bill Malcolm and Dr Alex Sinnett Agriculture Research Division, Department of Primary Industries, Parkville, Victoria
T: 0428 499 266 E: [email protected]
Take home messages:
• to judge how well a business is performing or might perform, producers need to look at a range of measures of performance including profit, net cash flow available to service debt, growth in equity, debt to equity, amount of revenue that turns into profit, and how hard assets are working
• price volatility is the major contributor (total volatility of profit and cashflow) in this beef grazing operation
• having too few or too many breeders is less profitable than having the stocking rate ‘just right’.
Farm business just purchased - how to run it?The situation dealt with in this paper is that of the buyer of a farm to produce beef thinking about how best to run their farm business over the next decade, weighing up the possible effects of the different types of risk that will bedevil, and create opportunities for this beef business. The farm buyer intends to produce beef because that is what they know, like best and do best. Risk for this business comes from the price the beef will bring when it is sold. Risk for this business comes from the volatility of the supply of the key input the business needs to produce beef - rain and the feed that can be grown with it. Risk for this business comes from the amount of debt the business has to service.
The farmThe property consists of 1,500 hectares in a high rainfall region, comprising a majority of basalt-derived soils, with the balance made up of heavy grey clay flats, with low fertility, shallow, acid soils on the hilly areas. Long term average annual rainfall is 750 millimetres. This annual rainfall is reasonably reliable, as are the autumn rains. The property is reasonably well developed, with a good standard of fencing and water supplies, and excellent, modern cattle handling infrastructure. The property has sound improvements (cattle handling facilities, fencing, sheds, water supply) and a well-maintained, medium-sized, brick house that was built in the 1970s. The nearest major business centre is 30 kilometres away. The property has a history of regular annual applications of superphosphate. Lime has been applied regularly to the arable land. The average Olsen P status is maintained at around 12.
Understanding the challenges of volatile seasons, markets and finance in beef production
Average soil acidity is pH 5.8 and the pastures are a mix of sown perennial and annual grasses and clovers, with regular renovations, and lightly supered native grass pastures on the hills.
Wet and cold winters are the usual feed limiting period, though feed supply in autumn can be limiting if the annual autumn break is delayed past late April. The majority of total annual feed supply is produced from late August to mid-January. The farm buyer formed the conclusion that, with grazing managed well, this property would be able feed an average of around 14 dry sheep equivalents per hectare (DSE/ha) annually across the whole farm in most years, with additional supplementary feed supplied in 33 percent of years. This is eight megajoules of metabolizable energy (MJ ME) a day, or around 250 MJ ME/month and 3,000 MJ ME/year. The 14 DSE/ha supply of home grown feed in most years would amount to an annual feed supply consumed of 3,000MJ ME x 14 x 1500 hectares = 63,000,000MJ ME. At an average of 10 MJ ME per kg of Dry Matter (DM) of pasture produced, this would be 6,300,000kg DM or 6300t DM feed supply, expected to be available over a year in many, but not all, years in the future planning period.
The feed supply and demand within a year can be explored in terms of the energy required to maintain a livestock unit (48kg wether) for a month, called a Livestock Month (LSM). Energy supplied by a pasture during a year can be assessed in the same way. The feed demand of one LSM with a 35% exercise allowance is 25-30kg of good quality pasture (i.e. an average of 8 - 10 MJ ME/kg DM). The LSM’s supplied by a tonne of good quality pasture is around 10,000 MJ ME/250 = 40 LSMs. If 6,300 tonnes of pasture was available on the farm in a year, this would amount to 6,300 x 40 = 252,000 LSM’s, divided by 12, gives an estimate of 21,000 DSE carrying capacity – in the average and better years at least.
The beef production system planned is a herd of moderate sized good genetic potential Angus breeders producing steers and heifers, most of which are grown to around an average of 380kg liveweight (an average across the whole turnoff), and sold at around 13 months of age. The within year pattern of feed demand determines the timing and magnitude of feed surpluses and deficits. The feed requirement per month (in LSM’s) of a breeding unit rearing seven month old weaners and carrying them through to 13-15 months month old steers and heifers averaging 380kg, and selling last year’s calves at 13-15 months, plus 20% replacement heifers and 1/30th of a bull, is shown in Table 1.

2014 Graham Centre | Beef Forum 9
What are significant risks of farming beef in this environment, and of these risks, which risks matter most?
Risk matters because it has consequences. The consequences of risk ultimately determine whether farm owners achieve their goals or not. A buyer of a beef farm, like any investor, has to make decisions and take actions in the present, in the anticipation that particular happenings will occur in future which, taken together, deliver the goals the farm owner is striving to achieve. To make good decisions now to create a good chance of achieving the aimed-for future circumstances, farmers use information, intuition and judgement. Good decisions use all the information that can be obtained about the question at hand at the time, weighing up the chances of possible events and outcomes. Whether it will be the right decision or not depends on what eventuates. The future rainfall, beef prices, feed supply and costs, and interest rates the business will encounter cannot be known with certainty. What has happened in the past is one guide to the rain, beef prices, feed supply, feed and costs, and interest rates that can happen, simply because they have happened.
What has happened though does not indicate everything that could happen. Thinking about the future requires imagining what could happen and using available information to weigh up the likelihood of the happenings. While the past is a guide to the rain, prices, costs, and interest rates that have happened, and because the natural and economic environments in the near future planning period are not going to be greatly different to the past, it can be presumed the natural and economic forces that created the past rain, prices and interest rates, will prevail in the future. Even if information from the past gives the size of many of the things that could happen in the future planning period, when these things might occur remains unknown.
Farmers need to imagine, and analyse, what it might mean for their business ‘if this happens’ and ‘if that happens’, and, importantly, ‘if these several things happen at the same time’. A starting point is to look at information about the rain, prices and interest rates that beef farmers in similar areas running similar operations have had dealt to them recently.
Figures 1, 2, 3 and 4 show the regional rainfall over the past 60 years, prices and interest rates over the past 20 years. Prices have been adjusted to 2014 dollars so the full range of past prices can be compared. Interest rates shown are the nominal (include inflation) rates farmers have paid for borrowing to buy land.
Figure 1. Business risk-rainfall 1960-2008.
Historical rainfall data can be combined with information about pastures and their requirements to make estimates of the pasture that would likely be grown on a property comprising these particular soils and the range of likely regional temperatures (Figure 2).
Figure 2. Business Risk - annual pasture dry matter associated with different historical annual rainfall.
Table 1. Monthly feed demand per hectare for a breeding unit (in LSM’s).
Sept Oct Nov Dec Jan Feb Mar April May June July Aug
25.2 26.9 26.9 17.4 17.5 18.1 18.1 16.8 18.3 18.4 19.22 21.16
1960
19
62
1964
19
66
1968
19
70
1972
19
74
1976
19
78
1980
19
82
1984
19
86
1988
19
90
1992
19
94
1996
19
98
2000
20
02
2004
20
06
2008
1200
1000
800
600
400
200
0
Rainfall Ra
infa
ll m
m
1960
19
63
1966
19
69
1972
19
75
1978
19
81
1984
19
87
1990
19
93
1996
19
99
2002
20
05
2008
12000
10000
8000
6000
4000
2000
0
Dry Ma�er (pasture growth)
kg D
M/h
a

2014 Graham Centre | Beef Forum10
Figure 3. Business risk - price of product (c/kg dressed weight over the period 1972-2008) in 2014 dollars.
Figure 4. Business risk - interest rates.
Including risk in analyses of farm performance
It is instructive to investigate the implications of risk for this case study beef business by considering the range of values that key business risk factors could have on business performance, as well as looking at the effect the major financial risk factor, debt to equity ratio, has on performance of a business and of farmers achieving their goals. The key to risk analysis is using probabilities about future events happening in the relevant planning period. In this case, the focus is on how the business might perform in the next decade and the likelihood of different levels of performance occurring. The risk evaluation tool @Risk, is one way to incorporate into budget analyses of prospective business performance, the full range of possible rainfall, beef prices, feed supply, feed costs, and interest rates, and the probabilities of different levels of these factors occurring.
The past 60 years of rainfall in the region is taken as the possible rain that could happen in the planning period. (NB. The planning period is the next 10 years, so if there are recent trends to drier weather, the more recent decades of rain may be a better indicator of the near future than the longer past. On the other hand, if decade-long runs of wet and dry are real and a recurring phenomenon, considering the longer past may also have value.)
If the business is analysed with the breeder herd maintained by purchasing supplementary feed under the full range of rain and pasture supply, this gives an indication of the possible impacts of variability of feed supply on the performance of the business. When annual feed demand exceeds annual feed supply, the deficit is made up by purchasing megajoules of ME at the market price of ME’s in the economy, such as indicated by a standard price of ME, as shown by the price of fodder or grain. The price of ME in the economy is assumed to be higher than average in lower than average rain years and less in high rain years.
The way a farmer will manage a feed shortage in practice will involve using a range of strategic and tactical steps, and the performance of the business will be affected by shortages of feed relative to livestock demand. The cost of feed shortages will not be avoided whatever is done, though some ways of managing feed shortages will be less costly than others. The cost of meeting feed demand when supply is short by purchasing ME is used here as proxy for all the various opportunities farmers will exploit to manage and minimise the cost of the feed deficit. Whole farm performance under risk can be assessed using @Risk farm budgeting, with the following condition assumed:
Even though rain, prices of beef or interest rates may be markedly higher or lower than the ‘usual range’, the farm is analysed as if the farm continues to be run in the same way, with the only response being to buy in more feed when it is short. In practice, the farmer will respond to changes in prices and seasons that are outside some range considered the ‘usual’. In the analysis extra costs are incurred, or saved, when feed supply is in abundance or extremely short. The gains or losses estimated to occur under these circumstances are ‘proxies’ for changes the farmer will make in practice under severely changed seasonal or market conditions. That is, even though the farmer will not likely feed through a severe drought, they will incur costs of a drought one way or another, however they respond to it. Treating in this way the operation of the farm business in the circumstances that require the farmer to change how it is run is simply one approximate way to account for the practical reality that when circumstances dictate that the system be run differently, extra costs or benefits will be incurred, one way or another. This is a better way to handle the dynamics of the real world than to ignore the fact that changes will be required and the costs and benefits and effects on farm performance of responding to changed circumstances are not incurred.
1977
19
79
1981
19
83
1985
19
87
1989
19
91
1993
19
95
1997
19
99
2001
20
03
2005
20
07
2009
20
11
2013
300
250
200
150
100
50
0
$/ kg dressed weight
c/kg
dre
ssed
wei
ght
c/kg dressed weight

2014 Graham Centre | Beef Forum 11
How might the business perform, running 20,000 DSE as breeders plus followers and turning off yearlings, using supplementary feed as required?
Measures of performance
The measures that are most informative about how efficiently the business is performing in any year are of an economic, financial and risk nature. The criteria for analysing the performance of a farm business are profit, cash, growth and the risk associated with achieving different levels of performance. A further set of ratios that are informative are the DuPont measures: operating profit margin that tell how well the business is converting gross revenue into profit, management of costs and turnover that shows how hard the total capital is being worked, and gearing that tells the scope for growth.
Economic measures of performance are:
• mean annual operating profit (OP or EBIT) and the risk associated with it
• mean annual operating profit expressed as a return on total capital managed, and associated risk
• return to equity (own capital) and associated risk. This is net profit after tax (net profit is operating profit minus interest)
• operating profit margin (OP/Total Revenue)
• turnover (Total Revenue/Total Capital).
The measures that are most informative about whether the business is financially feasible or liquid as it is set up, on an annual basis, are:
• mean annual net cashflow after servicing debt, and associated risk
• equity percentage
• form of debt - short, medium and long-term.
A measure that combines economic and financial considerations is growth, which is the measure that tells the most about achieving the important goal of farmers, that being building wealth. Growth comes from the operating profit and return to total capital from all assets managed, combined with the effects of interest on debt that is paid. The ratio of debt to equity, combined with the return to capital minus interest costs determines the rate of growth in wealth.
The importance of the role of return on total capital and interest on debt, and the interaction between them, should not be underestimated. First, there is the operation of the principle of increasing financial risk. The operation of this principle means that when things go well and returns to capital are good, equity grows faster with debt than without it. But when things go poorly equity declines faster than the rate it grows at when things went well ( i.e. equity travels backwards faster than it goes forwards). The relationship between rate of return on capital and rate of interest is shown in the Table 2, for a hypothetical example, with the implications of increased borrowings in a business on growth in equity shown.
Table 2. Hypothetical example demonstrating the principle of increasing risk.
Base farm Increase lambing percentage
Increase stocking rate Increase land area Increase land area and stocking rate
Profit made Loss made Profit made Loss made Profit made Loss made Profit made Loss made Profit made Loss made
Business structure
Total assets managed
$3.713 m $3.713 m $3.785 m $3.785 m $4.057 m $4.057 m $5.061 m $5.061 m $5.553 m $5.553 m
Debt $80,000 $80,000 $152,000 $152,000 $424,000 $424,000 $1.428 m $1.428 m $1.920 m $1.920 m
Equity $3.633 m $3.633 m $3.633 m $3.633 m $3.633 m $3.633 m $3.633 m $3.633 m $3.633 m $3.633 m
Proportion of equity in total assets
98% 98% 96% 96% 90% 90% 72% 72% 65% 65%
Business returns
Operating profit $371,000 -$371,000 $379,000 -$379,000 $406,000 -$406,000 $506,000 -$506,000 $555,000 -$555,000
Return on assets 10% -10% 10% -10% 10% -10% 10% -10% 10% -10%
Interest rate on debt asset
7% 7% 7% 7% 7% 7% 7% 7% 7% 7%
Interest costs $5,600 $5,600 $10,600 $10,600 $29,700 $29,700 $100,000 $100,000 $134,400 $134,400
Net farm income $365,000 -$377,000 $368,000 -$390,000 $376,000 -$436,000 $406,000 -$606,000 $421,000 -$689,000
Growth / decline in equity
$365,000 -$377,000 $368,000 -$390,000 $376,000 -$436,000 $406,000 -$606,000 $421,000 -$689,000
Return on equity 10% -10.4% 10.1% -10.7% 10.3% -12.0% 11.2% -16.7% 11.6% -19.0%

2014 Graham Centre | Beef Forum12
The advantage of borrowing is that when annual return on total capital is greater than the interest rate, a higher return to equity is earned than would be the case with less debt. But when the annual return on total capital is less than the interest rate on the debt, the annual return to equity falls below the return on total capital (Table 3).
Assumptions
With the available information suggesting a herd of 1,000 breeders could probably be run with some annual supplementary feed in some years, initial analysis was done using risk analysis (@Risk budgeting) for scenarios where the business runs either 750, 1,000 or 1,250 cows. The key assumptions that applied to this farm business for this analysis were as follows.
Farm size 1500 hectares
• spring calving, self-replacing beef breeding herd
• three scenarios of number of stock carried:
• 750 breeders
• 1,000 breeders
• 1,250 breeders
• 12-14 month yearlings produced, average weight 380kg liveweight, which go to feedlot to be finished for the domestic beef market (steers heavier, heifers lighter, range over all turnoff 340-410kg, dressing out at 52% of liveweight)
• cows culled each year 20%
• mortality rate of adult stock 1%
• average annual calving percentage 90% +/- a few %
• prices based on a probability distribution with a minimum of $1.30/kg/liveweight, a maximum of $3.10/kg/liveweight and a mean of $2/kg/liveweight
• typical annual variable costs per breeder is $200:
• fertiliser and pasture costs of $75/breeder
• husbandry costs of $25/breeder
• transport to abattoir at 5.5c/kg dressed weight
• supplementary feed varies depending on how high / low the stocking rate is and the deficit or surplus supply of home grown pasture, fuel and other machinery running costs $15,000 per annum
• selling costs (3% commission, $5/hd MLA levy, and $2.90/hd for NLIS tags)
• annual overheads are expected to be $210,000, made up of:
• 1,250 breeders owner-operator allowance for labour and management of $85,000
• part-time permanent labour costs of $65,000
• administration, rates, insurances, registrations, power amounting to $20,000
• repairs and maintenance of fencing and water supply and other costs of $20,000
• depreciation of plant, equipment and structures $20,000
• (NB. If 1,250 breeders were run on this farm, it would be expected that an additional $80,000 would be spent on infrastructure, and thus depreciation would be $8,000 more. In addition repairs and maintenance is expected to be greater with 1,250 breeders and the owner-operator would be paid an additional $15,000 to manage a more complex operation.)
• land and improvements are valued at $4,000 per hectare (land in the area has increased in value at around 3–5% per annum over the past five years and is expected to continue to do so)
• debt is $1,500,000, with the loan being a 15 year amortised loan. Interest rate for the loan on average is 8 % per annum, ranging from 4–12%.
Mean opening balance sheet
The businesses mean opening balance sheet is shown in Table 4. The land and improvements have been purchased for $4000/ha.
Economic analysis
Activity Gross Margin
The Activity Gross Margin (GM) for the above-described beef activity, at different stocking levels, is shown in Figure 5.
The 750 breeder model looks to generate the highest mean GM/DSE and per breeder. The GM/DSE increases because the farm is expected to have a feed surplus in most years that is not utilised and supplementary feed costs are minimal, and a slightly better average turnoff weight is achievable.
Table 3. Percentage annual return to equity capital for returns to total capital, for a range of debt and equity levels, with 8% interest on borrowed capital.
Percentage return on total capital 100% 90% 80% 70%
15% 15.0% 16% 17% 18%
10% 10.0% 10% 11% 11%
5% 5.0% 5% 4% 3%
3% 3.0% 2% 2% 0.6%
Equity percent

2014 Graham Centre | Beef Forum 13
0.00%
0.50%
1.00%
1.50%
2.00%
2.50%
3.00%
3.50%
4.00%
Mea
n an
nual
ret
urn
to ca
pita
l %
750 Cows 1000 Cows 1250 Cows
Figure 5. Mean annual activity Gross Margin for 750, 1,000 and 1,250 cow herds.
Mean annual profit and return on total capital managed
Activity GM though is only part of the story, analysis of the performance of a farm business requires consideration of the balance sheet, profit, growth and cashflows.
The mean whole farm annual profit and annual return on capital for the business operating under most likely conditions is shown in Figures 6, 7 and 8. Running 1,000 breeders is likely to produce the most profit of the three options for herd size. As shown in Figure 6, running 1,000 breeders is the best option once risk is considered, offering higher profit and less risk than either of the other two options. The mean annual profit of the 1,000 cow operation has a Standard Deviation (SD) of $116,000 and a Coefficient of Variation (CV) of 43%, compared with the 750 cow SD of $86,000 and CV of 41% for mean annual profit, and the 1250 cow option with SD $188,000 and CV of 83% for mean annual profit.
This means the 1,000 cow operation is most likely to have an annual operating profit of around $275,000 on average, plus or minus nearly $120,000 two thirds of the time. The same applies to return on capital; running 1,000 cows is the most economically efficient choice, giving the highest return on total capital. The 1,000 cow operation also promises the best chance of growing equity (Figure 7).
Figure 6 . Mean annual operating profit.
Table 4. Opening balance sheet.
Assets 750 breeders 1,000 breeders 1,250 breeders
Owned land area
Total livestock value
Plant and equipment
Cash
6,000,000
990,000
200,000
-
6,000,000
1,320,000
200,000
-
6,000,000
1,650,000
280,000
-
Total 7,190,000 7,520,000 7,930,000
Liabilities
Loan (15 year amortised loan)
Other
1,500,000
-
1,500,000
-
1,580,000
-
Total 1,500,000 1,500,000 1,580,000
Assets 7,190,000 7,520,000 7,930,000
Liabilities 1,500,000 1,500,000 1,580,000
Equity ($) 5,690,000 6,020,000 6,350,000
Equity (%) 79% 80% 80%
0
5
10
15
20
25
30
Gros
s Mar
gin
/DSE
$
750 Cows 1000 Cows 1250 Cows
0
50000
100000
150000
200000
250000
300000
1 2 3
Mea
n An
nual
Ope
ra�n
g Pr
ofit $
750 Cows 1000 Cows 1250 Cows
Figure 7. Mean annual return to capital.

2014 Graham Centre | Beef Forum14
Figure 8. Profit and risk.
When both profit and risk are considered, the choice becomes clearer. The 1,000 cow operation promises greater mean annual profit for the same risk as the 750 cow option, and the 1,250 cow activity produces less mean annual profit than the 1,000 cow operation, and has more risk (Figure 8).
Financial measures of performance
The whole farm mean annual cash budget for the business operating is shown in Figure 10.
Figure 10. Mean annual net cashflow after debt servicing.
Figure 11. Years the business can service debt.
0
10000
20000
30000
40000
50000
60000
70000
80000
90000
100000
1 2 3
Mea
n $
NCF
aft
er d
ebt s
ervi
cing
750 cows 1000 cows 1250 cows
The 1,000 cow operation with 80% equity has the highest chance of servicing a 15 year, mean 8% interest, term loan debt of $1.5m, doing so in approximately 80% of years. The 750 cow operation has slim margins and can service the debt in 70% of years, while the 1,250 cow herd has higher supplementary feed costs and lower annual profit than the 1,000 cow herd, and thus lower net cashflow and debt servicing capacity. The largest sized herd, at 80% equity, can service a debt of $1.5m in only 65 % of years (Figure 11).
Growth
Annual growth in equity (wealth)
The 1,000 cow herd offers the most annual growth in wealth on average of $127,000, plus or minus $105,000 in two thirds of years, while the 750 cow herd offers an average annual growth of $78,000 plus or minus $72,000 in two thirds of years. The 1,250 cow herd offers an average growth of $83,000 plus or minus $166,000 in two thirds of years (Figure 12).
Figure 12. Mean annual growth in wealth.
The DuPont analysis of business performance
The DuPont system of analysis allows further investigation of what is producing the return on total capital and return on equity. The measures are:
• the operating profit margin (OPMR), measured as operating profit divided by gross revenue, and sometimes called the ‘Earnings lever’ (reference). It measures the efficiency of the business regardless of debt structure. It measures how efficiently the manager turns the gross revenue of the dollars coming into the business into operating profit and net profits that are kept in the business after all expenses are paid
• the Turnover measure, measured as gross revenue divided by total capital is called the ‘Turnings lever’. It measures how well the business is turning the investment in total capital or assets into sales of product
• the third measure considers financial structure, which is called the ‘leverage’ or ‘gearing’ lever, measured as total assets divided by total equity. The higher this ratio the higher the debt component of total assets.
Table 5 shows the DuPont method of analysis, based on different scenarios involving 750, 1,000 or 1,250 breeders,
0%10%20%30%40%50%60%70%80%90%
1 2 3750 cows 1000 cows 1250 cows
Year
s of d
ebt s
ervi
cing
%

2014 Graham Centre | Beef Forum 15
but with same debt level. The 1,000 breeder operation has the highest annual return on assets (ROA) and annual return on equity (ROE), because this herd size is making the most efficient use of the assets involved, as indicated by the highest operating profit margin. The 1,250 breeder herd has a higher asset turnover ratio compared to the 1,000 cow operation, so would use the assets well to turn off saleable product, but the operating profit margin shows this size herd does so less efficiently than the other two options.
Table 5. The DuPont analysis.
750 breeders
1000 breeders
1250 breeders
ROE 1.49% 2.53% 0%
ROA 2.99% 3.7% 3%
OPMR 0.4% 0.4% 0.29%
Turnings (ATO) 0.07% 0.09% 0.11%
Leverage or gearing (Equity Multiplier)
1.26 1.25 1.26
Performance of the 1,000 cow operation
In the next section we take a closer look at the prospective performance of the 1,000 cow operation.
Given the information from the first look business analysis, it would be recommended the farmer run 1,000 breeders. The remainder of the analysis is based on this farm running 1,000 breeders.
The distributions of whole farm annual operating profit, return to total capital managed, and growth in wealth for the full range of rain and home grown, and purchased feed and prices received for beef are shown in Figures 13-20.
Operating profit is expected to range from $108,000 to $568,000 in any given year, with the most likely operating profit being around $275,000 (Figure 13).
Figure 13. Annual operating profit.
The annual return on the assets managed (Figure 14) is expected to range from a negative return to almost 8% annual return, with a most likely return of around 3.7%.
Figure 14. Annual return on total capital (excludes capital appreciation).
The change in equity (Figure 15) for the farmer ranges from a loss to an annual growth in equity of $370,000, with the most likely equity growth being around $120,000.
Figure 15. Mean annual growth in equity.
The distributions of annual net cashflow after interest and principle, before tax, is shown in Figure 16. Annual net cashflows, after principle and interest but before tax are expected to range from a loss through to around $400,000, with the most likely net cashflow being $56,000.
Figure 16. Distribution of annual net cashflows after interest and principle, before tax.

2014 Graham Centre | Beef Forum16
Which risk matters most?
The variability of events around the average of the full distribution is measured by the size of one SD, (the range that accounts for 67% of all events) or by the CV (the SD expressed as a percentage of the average of the distribution). As shown in Figures 1 and 3, the past annual rain distributions have a SD of 114mm and a CV of 16%, while past annual prices have a distribution with a SD of 49 c/kg and a CV of 22%.
The distribution of annual operating profit has a SD of $116,000 and a CV of 43%, and net cashflow after interest and principle has a SD of $92,000 and a CV of 106%. The distribution of supplementary feed purchases has a SD of $41,000 and a CV of 62%.
Another way to look at the contribution to total risk of various risk elements is using the ‘tornado graph’ output of @Risk that uses regression to estimate which element contributes how much to total risk (Figures 17, 18 and 19). The major contributor to variability of all indicators of the performance of the beef business is the price per kilogram liveweight of yearlings. The price received by culls has a similar effect as the price of yearlings and culls are correlated. For all measures of performance, the price and quantity of supplementary feed, the weight of yearlings produced and the calving percentage all contribute similarly to total risk, and around one fifth as much as the price received for the beef produced contributes to variability around the mean of the performance measures.
Figure 17. The inputs ranked by effect on mean growth in equity.
Figure 18. The inputs ranked by effect on mean annual operating profit.
Figure 19. Inputs ranked by effect on mean net cashflow after tax.
Total risk of the business can be distinguished as business risk or financial risk, and the size of the relative contributions of the two components identified, are shown in Figure 20. The effect of increasing gearing on total risk of the business is evident.
Figure 20. Business and financial risk components of total risk.
Managing the risks?
If the above described situation accurately represented the case for this beef farm business, what would such results mean for the farm family striving for the best chance of achieving their goals?
In this analysis, where the effects of the risks of feed supply variability is captured by buying feed when it is short and making feed when it is in surplus, and so, in theory, maintaining a constant stocking rate, the biggest contributor to volatility of annual profits and net cashflow is the volatility of the price received per kilogram of liveweight of beef. Reducing the exposure to the volatility of prices received for turnoff will have a bigger effect on reducing volatility of annual profit and net cashflow, compared to reducing the exposure to the variability of annual feed supply. So, how can exposure to the volatility of beef prices be reduced?
Price risk
Viewing risk as a commodity that can be sold by people who do not want to bear it, to people who are willing to bear it, is a useful way to think about risk. Exposure to price risk can be reduced by using futures contracts on well-functioning futures markets, if such markets operate. Even better, if a good

2014 Graham Centre | Beef Forum 17
options market exists, then options can be used to reduce the downside volatility while keeping the upside volatility open; at a price of course. Establishing a strong medium-term forward contracting relationship with a buyer who manages price risk can avoid the worst of the downside prices, albeit while also eliminating access to the best upside prices.
Feed cost
Animal efficiency has feeding, growing, and breeding dimensions. The major costs of livestock operations are labour and feed. These costs vary quite directly with the size of the business. That is, there is little scope for spreading these costs over increased output and reducing the average cost per unit of output. But even a 10% change in these costs can have a significant effect on gross margin and profit.
The beef producer’s major challenge is to grow feed and utilise it; pasture production and management. Of course the major determinant of the cost of feed is the price paid for the land it grows on. A close look at businesses producing beef reveals a wide range of implied feed production and consumption per hectare, suggesting a wide range of management capacity in managing feed supply.
The most profitable beef businesses are those that are operated by the managers who are highly skilled at producing and grazing feed. Exploiting good genetic potential to produce the product the markets demand is important, though this is only possible once the environmental limits to production are lifted (i.e. feed is grown and grazed efficiently, by animals that reproduce efficiently, grow well, are healthy, and have moderate maintenance requirements).
Scale matters in that overhead costs matter. The 1,000 cow operation spreads the overhead costs of owner operator labour and management and depreciation over greater output, reducing average overhead cost per unit of output. As well, the 1,000 cow herd in this example, has struck a balance between making the best use of feed grown in most years and carrying over surpluses in occasional very good years, and managing the feed deficit years efficiently, compared with the 750 and 1250 head options. If supplementary feed is bought in, a relationship with the supplier and using forward contracting can smooth out some of the volatility in bought in feed costs.
Increasing labour use efficiency is trickier. Both timing and quality of operations is critical. Identifying the tasks to carry out using employed staff and the tasks to contract out, with due weight given to timeliness and quality of operation, is the key.
Financial risk
The analysis so far has been conducted as if the business was set up with a debt of $1,500,000 on the balance sheet. It is useful to investigate a number of different debt and equity structures to gain insights about the implications of financial risk for the business.
The probability that the business will meet annual debt servicing obligations is useful to know. In this analysis, it appears that running 1,000 breeders, the business can service debt 97% of the time when there is 90% equity, around 83% of the time when there is 80% equity, and only 58% when there is 70% equity.
One strategy for the inevitable years when debt cannot be serviced from annual cashflow is to have some of the total assets in a reasonably liquid form that can be used to fill an annual cash deficit. A strategy that always works is to have some surplus borrowing capacity for the tough times. This is achieved by not having an excessively high a gearing ratio for the business. Otherwise, when too highly geared, and when debt cannot be serviced, there is nowhere to go, at least at reasonable commercial interest rates. Having a gearing ratio that enables debt to be serviced in the majority of years, and having a good relationship with financiers, works. Most importantly, respect the operation of the principle of increasing financial risk.
A final word
There are a number of further well proven general methods of managing risk in farming. Among these, the most important are:
• be technically good at farming, especially timing and quality of key operations
• have the portfolio principle working for the business. That is, activities and investments whose performances are not affected in the same way by the same risky phenomena (i.e. perfectly correlated as seasons and markets change)
• use insurance
• act countercyclically, setting up the business to be able to strike when the inevitable opportunities arise as a result of the volatility of prices, yields, interest rates
• do not pay too much for land, nor gear to high – that is the path to ruin.
Understanding the challenges of volatile seasons, markets and finance in beef production means identifying the nature of the risks and appreciating the possible negative and positive consequences that flow from the different types of risks, and being in a position to manage the inevitable adverse consequences, and exploit the inevitable opportunities.
References
Barry PJ, Ellinger PN, Hopkin JA and Baker CB (2000). Financial Management in Agriculture. Interstate publishers, Danville, Illionis.
Barnard FL and Boehlje M (2004). Using Farm Financial Standards Council recommendations in the profitability linkage model: The ROA dilemma. Australian Farm Business Management Journal 67 (1): 7-11. The web address for this paper is: http://portal.asfmra.org/userfiles/file/journal/barnard7_11.pdf
Malcolm B, Makeham J and Wright V (2005). The Farming Game Now. Cambridge University Press, Melbourne, Australia.
Osburn DD and Schneeberger KC (1978). Modern Agriculture Management. Reston Publishing Company Inc, Reston, Virginia
Rickards PA and Passmore AL (1977). Planning for profit in livestock grazing systems, Professional Farm Management Guidebook No.7, Agricultural Business Research Institute, UNE.

2014 Graham Centre | Beef Forum18
Ms Edwina TooheyNSW Department of Primary Industries
T: 02 6881 1214 E: [email protected]
Take home messages:
• online measurement technologies can be used as a tool to better meet market specifications and customer satisfaction
• producers could be rewarded more accurately for producing higher quality product
• development of online technologies is ongoing, but improved adoption strategies are required for them to be successful.
Australian producers generally sell cattle on liveweight (e.g. through the saleyards) or on carcass weight (e.g. livestock sold over the hook). The price paid for animals sold on liveweight is derived from a predetermined c/kg rate (cattle) or $/head (lamb / sheep). This rate is based on the buyer’s subjective judgement on traits that are exhibited in the live animal such as, frame, muscling / shape, age, estimated weight and fatness and additional background information that can be obtained such as breed.
The price paid for animals that are sold on carcass weight is generally determined by price grids. Cattle price grids have various rates (c/kg) depending on grade (vealer, yearling – heifer / steer, grown steer, cow, bull, MSA yearling - heifer / steer), dentition, muscle score (subjective), fat score (objective - determined by fat depth at P8 site mm) and carcass weight (objective).
Irrespective of selling method sheep and cattle are predominately sold on indicators of meat yield as it is the major component of carcass value.
How will we sell in the future?
Value based marketing is in principle where a producer is paid on the inherent value (including quality and quantity traits) of the product to the buyer and the end user. This method provides clear feedback from the customer (processor) to the producer and has pricing systems that support these signals (MLA, 2014).
The use of value based marketing is limited in Australia, especially when it comes to meat quality characteristics. Meat quality traits such as tenderness are currently not used to differentiate price, as there is currently no definitive measure that can differentiate this trait, only indicators, (i.e. pH and marble score). However, with the extensive research in Australia and around the world into the development of online measures to predict beef carcass quality and yield characteristics over the past few decades, there is greater
potential for change. Research into online measure technology has largely been driven by the need to satisfy consumer demand, provide more accurate feedback to producers and potentially reduce labour requirements at the processing level.
The ultimate aim of online measurement technologies has been to maintain or increase the profitability and consumption of red meat. Although some online technologies have proven to be successful, it is considered the adoption rate has been low amongst processors.
What is an online measure?
Online measurement technology can be defined as a technology designed to capture carcass yield and/or meat quality traits at production speed, either on the kill floor or in the chiller.
The measurement of carcass traits and meat quality attributes needs to be reliable, quick and able to be carried out during the production process, enabling the information to be used in real time and hence maximise economic benefits. The method must ensure the quality / quantity of the meat / meat products satisfies consumer demand. Hence, we need methods /technologies that are fast, non-destructive (and/or non-invasive), accurate, cost-effective and ideally have multiple uses (i.e. be able to predict more then one characteristic).
Types of online technologies (current and emerging)
There are several technologies appropriate to evaluate meat properties based on video image analysis, spectroscopic methods (UV-visible, near infrared, mid-infrared, raman and fluorescence spectroscopy), optical probes (Hennessy Grading probe, the Swedish FTC lamb probe), mechanical probes (AUSMeat sheep probe, Ruakura GR Lamb probe), magnetic resonance methods (nuclear magnetic resonance spectroscopy, magnetic resonance imaging, magnetic resonance elastrography), X-ray methods (computed tomography, MicroCT, Dual X-ray absorptiometry), Dielectric methods (impedance, microwave) and ultrasound (Damez and Clerjon, 2008; Kirton, Mercer, Duganzich and Uljee, 1995).
These methods / technologies have been used in different species to determine meat quality and quantity attributes such as fat and muscle depth, yield predictions (whole carcass and by cut), eye muscle area, marbling, intramuscular fat, shear force (tenderness), pH, instrumental meat and fat colour (L*, a*, b*, chroma, hue), age, eating quality attributes (tenderness, juiciness, flavour, acceptability), water holding capacity, drip loss, cooking loss, nutritional quality (fatty acids composition, protein, minerals), salt content, ash and other chemical characteristics.
Online processing technologies predicting carcass and meat quality traits - what this means for producers
2014 Graham Centre | Beef Forum 19
Current research
In order to gain an understanding why adoption rates of some technologies have been low, NSW Department of Primary Industries has been contracted by Australian Meat Processing Corporation and Meat and Livestock Australia to get a processor perspective of the value of online measure technologies. The first objective is to outline the advantages and disadvantages from a scientific perspective of the more commonly examined online technologies, while the second objective is to survey processors to gain an understanding of where they see the value of online technologies and how they would use them in their business.
The aim is to then identify what have been the barriers in the past, what might be barriers in the future and what traits they deem most important, to ensure higher rates of adoption of future technologies.
Preliminary findings based on scientific literature have shown there are only five commercially available online technologies in Australia; (1) VIAScan® beef carcass system, (2) VIAScan® chiller assessment system, (3) VIAScan® sheep carcass system, (4) AUSMEAT sheep probe and (5) Hennessy Grading Probe.
VIAScan® technology first became commercially available in Australia in the 1990’s, but the reasons reported for low adoption rates may be a result of, not only the upfront cost, but the ongoing fee (per carcass) to have the machines installed (Hopkins, 2011).
The AUSMEAT sheep probe was widely used in the 1990s in sheep abattoirs, but is no longer commercially available as it is no longer manufactured.
The Hennessy Grading Probe has been used for beef but only to measure P8 fat, and based on the literature does not appear to be widely used in Australia.
If adoption rates of online technologies could be increased, what will it mean for producers?
It is forecast that increased adoption of online technologies will increase the productivity and hence profitability for beef producers. This could be achieved through the increased feedback to producers on important meat quality and yield traits, enabling producers to:
• supply livestock that better meet market specifications
• increase the demand in beef supply through greater consumer satisfaction by better meeting consumer demands on product quality
• make more educated decisions on breeding programs
• increase productivity
• gain the opportunity to implement value based marketing systems based on objective measures rather than subjective measures
• be rewarded for producing higher quality product.
Conclusion
As part of the need to meet consumer demand and increase red meat consumption, the need to change from subjective to objective evaluation of carcass yield and quality traits has been identified in the literature over the past 20-30 years, and as a result there has been extensive research in this area.
It is clear there are several measurement technologies that have the capacity to accurately measure carcass yield and meat quality traits, but there are very few that have proven to function online in challenging abattoir environments (i.e. moisture, sound, space, safety). The progression from a proof of concept prototype to an effective commercial technology is challenging and seldom successful. It appears that despite the significant amount of research in this area, there is limited work on the commercial application.
A greater understanding of Australian processor views is paramount to understand how research can have a strategic approach to the adoption of old and development of new technologies for the red meat industry, and ultimately enhance feedback to producers increasing profitability of the whole supply chain.
References
Clarke RD, Kirton AH, Bartle CM and Dobbie PM (1999). Application of dual-energy X-ray absorptiometry for ovine carcass evaluation. In Proceedings New Zealand Society of Animal Production, 272–274.
Craigie CR, Navajas EA, Purchas RW, Maltin CA, Bünger L, Hoskin SO, Ross DW, Morris ST and Roehe R (2012). A review of the development and use of video image analysis (VIA) for beef carcass evaluation as an alternative to the current EUROP system and other subjective systems. Meat Science 92: 307-318.
Craigie CR, Ross DW, Maltin CA, Purchas RW, Bünger L (2013). The relationship between video image analysis (VIA), visual classification, and saleable meat yield of sirloin and fillet cuts of beef carcasses differing in breed and gender. Livestock Science 158: 169-178.
Damez JL and Clerjon S (2008). Meat quality assessment using biophysical methods related to meat structure. Meat Science 80: 132-149.
Hopkins DL (2011). Processing technology changes in the Australian sheep meat industry: an overview. Animal Production Science 51: 399-405.
Kirton AH, Mercer GJK, Duganzich DM and Ulgjee AE (1995). Use of electronic probes for classifying lamb carcasses. Meat Science 39: 167-176.

2014 Graham Centre | Beef Forum20
Opportunity and drought feedlots
Mr Brett LittlerLocal Land Services, Central Tablelands
T: 02 6372 4044 E: [email protected]
Take home messages:
• a little time spent planning and doing the sums before you start can save unwelcome surprises during and at the end of the feeding period
• source independent advice and visit other farms that have feedlots / drought lots already set up. Find out what are the good and bad aspects experienced by other producers
• consider the location of the feedlot (proximity to yards, loading facilities, feed storage and sheds).
Opportunity feedlots have been around for a long time and are a regular sight in most mixed farming zones in NSW. Over the last decade funding and assistance for setting up drought lots has increased, and the less than ideal conditions have assisted in seeing the development of many drought lots on farms.
The purpose of drought lots and opportunity feedlots are slightly different, but the same assessment needs to be made whenever you put stock in them. Are you finishing the cattle for a specific market or feeding them to maintain liveweight?
Do your sums
Before you do anything, you need to do your budgets. It is an essential tool in lotfeeding and is something you need to put some serious time into. Be realistic regarding performance and the prices you will receive. A budget should be completed before any stock or feeds are purchased. Important elements of the budget include:
• cattle value - weight, condition and price. Use the National Livestock Reporting Services reports to give an indication of prices for stock class and type
• costs - feed (expect your cattle to eat about 2.8-3% of their liveweight. Do your sums at 3% as this will allow for some wastage), overheads, labour, animal treatments, interest, losses, freight and selling charges
• expected animal performance - daily weight gain (cattle will not grow at 2-3kg/head/day, expect 1.2-1.6 kg/head/day), rate of improvement in finish (the BeefSpecs Calculator is an extremely useful tool to help do this beefspecs.agriculture.nsw.gov.au)
• slaughter cattle price - look for seasonal price trends, talk to processors / livestock buyers to ensure stock will meet their requirements and specifications. Also, investigate to see if there are forward contracting opportunities.
Site
There are large variations in sites and correct site placement is vital to avoid issues. Incorrect sites can affect stock performance, overall profitability and result in poor welfare outcomes.
When locating the feedlot, the main factors to consider include being close to existing yards and cattle loading facilities, and access for moving cattle in and out of the feedlot. Proximity to feed storage, machinery sheds and all weather access for regular feeding of cattle must also be considered. Remember the yards need to include drafting facilities, a crush or bail-head, scales and good loading facilities.
All-weather access for trucks, whether delivering feed or store cattle, and taking cattle to slaughter, is another important consideration.
The site should be well-drained, with a slight slope to assist runoff, but not on the side of a hill. Avoid hollows that could lead to ponding and the possible development of boggy conditions. Optimum slope is about 3-4%. Also avoid drainage lines, creeks and waterways.
If the site can be sheltered from prevailing winds this is an advantage. Shade can be an advantage, but remember if you are using trees for shade there is a high probability stock will ringbark them if they are inside the yard. It is recommended trees are on the western perimeter of the feedlot.
A reliable supply of good quality water is essential for the feedlot. Reduced water intake reduces feed intake and weight gain. Water troughs should be long enough to allow about 10-15% of cattle in the pen to drink at any one time. Allow 300mm length of trough for every 10 head in the pen. It is important to consider if there is enough volume and water pressure to keep the trough filled, around 10 L/head/hour. Shallow or low volume troughs are good to reduce water waste when cleaning them, but they can heat up, causing stock to drink less and reduce performance.
Do not put water next to feed troughs or feeders, and avoid having them in the centre of the pen. Allow troughs to drain outside pens to avoid boggy conditions developing when troughs are emptied for cleaning. Troughs should be cleaned regularly.
Feed and feeders
There are large variations in troughs and bunks used to feed stock, and observations show that producers can make do, and make most things work, with some practical thinking. If using feeders in the pen, it is essential that you plan for the pen getting wet and boggy while you are feeding, so be mindful that you need to access them regularly. Avoid putting feeders or feed troughs on the low side of the pen.

2014 Graham Centre | Beef Forum 21
If you are using feeders in a pen the biggest issue is bridging in the feeder. This causes feed to be held up leaving stock without feed. There are simple ways around this issue, for example, running a length of chain down through the feeder into its opening, making sure the chain is long enough that it sits in the feed and can be moved by the cattle. The movement of the chain helps prevent bridging.
Feed should be mixed (i.e. includes grain, roughage and additives), but if producers are unable to mix feed, cattle must be introduced more slowly to the feed and producers must accept a lower average daily gain in the feedlot.
There are various machines available to mix rations and feed them out to cattle. There are pro’s and con’s with most but it is essential the feed is not over processed and the grain is not powdered up as this increases the risk of grain poisoning.
Any feedlot ration should contain roughage (hay or silage), grain, minerals and additives. How quickly you introduce the grain is dependent on a number of factors. Cattle should be started on roughage only to fill them up, and then introduced to the mix. The proportion of grain in the ration is then gradually increased over 21-25 days.
It is important to observe the cattle closely as the grain level is increased. The easiest way to note any problem is to monitor faeces as this is where any problems will first show up. If there are any signs of problems, the grain level should be held constant or decreased. Cattle that are severely affected should be taken to a separate area and fed roughage only.
While monitoring the cattle for digestive issues it is also good to note shy feeders. These are ones that hold off the feeder and are the ones to most likely have health issues while in the feedlot. Make a note of them and move them into a smaller group or a hospital pen.
Grains are not grains
Over the years there has been a lot of investigation into poor performing stock in confined feeding situations. Most times the feed mix looks alright, but on questioning producers, the feed quality has not been tested and the producer has assumed its quality.
There are large variations in grain quality, both in energy and protein. Oats is a great example of this. Oats samples have been sent for testing, to find a range in metabolisable energy (ME) of 8.5-12.8 ME and protein levels from 8-15.3%. These large ranges can dramatically affect cattle performance. This is further complicated by variety effects. Some oats varieties can have high hull lignin content that makes the oat almost indigestible.
When feeding stock, stop and think what variety of grain is being fed. Do not guess. Do a feed test, it is a cheap investment that can save a lot of issues. It will ensure that performance is as good as it can be and will stop any nasty surprises.
Buying feeds
When buying feeds always buy on a weight basis (kg DM), rather than by volume or per unit. This allows more accurate price evaluation of feeds and ration formulation to meet animal feed requirements.
Where feedstuffs have to be purchased, a decision on which one to buy should be based on the landed cost per unit of ME or crude protein (CP), as appropriate. The Feed Cost Calculator www.dpi.nsw.gov.au/agriculture/livestock/nutrition/values/feed-cost-calculator on the DPI website is a great way of doing this simply. It will also enable rations and mixes to be worked out, and balance the ME and CP of the ration for better performance.
Conclusion
A feedlot / drought lot can have uses other than just being used in periods of feed shortage. Confining cattle in small areas such as a feedlot can decrease stocking pressure on the remainder of the property. Other uses include:
• allowing stocking rates to be maintained or increased
• releasing land for other uses such as cropping
• assisting with early weaning
• managing fat scores in cows
• yard weaning
• improving heifer joining performance in poor seasons
• simplifying management of artificial breeding programs
• ensuring cattle better meet market specifications.
A little time spent planning and doing the sums before you start can save unwelcome surprises during and at the end of the feeding period. Source independent advice and visit other farms that have feedlots / drought lots already set up. Find out what are the good and bad aspects other producers have experienced and the things they would change. Finally check your sums and work on the leaner side, and remember to be realistic in your assumptions.

2014 Graham Centre | Beef Forum22
Dr Rebecca DoyleAnimal Welfare Science Centre, University of Melbourne
T: 03 9035 7535 E: [email protected]
Take home messages:
• cattle are exposed to a large number of stressful events on arrival to the feedlot, potentially compromising their welfare
• managing animals and the environment can help limit stress experiences by cattle
• high quality handling in the feedlot and on-farm is crucial for welfare and performance in the feedlot.
Feedlotting cattle raises a variety of potential welfare concerns associated with the inability of cattle to express their full repertoire of natural behaviours, such as grazing when confined in a feedlot environment. Some specific issues have already been well investigated. For example, it is known that the appropriate provision of space and feed are crucial. Inadequate space allowance at feed troughs results in reduced feed intake and average daily gain (ADG), high levels of aggression and poor feed conversion (FCR) (Ingvartsen and Andersen, 1993), and so facilities and feed delivery are specially designed to address this (Gottardo et al., 2004). Similarly insufficient space allowance is linked to increased physical damage to cattle including increased bone and joint issues and tail lesions (Cozzi et al., 2009).
How to best manage and limit the effects of heat stress have also been investigated, with feed management and shelter provision both being effective ways to reduce the effects of hot weather and microclimates (Mader, 2003; Mader et al., 2006). Understanding effective ration feeding to maximise growth and reduce the risks of acidosis is also well investigated (Owens et al., 1998; Stock and Smith, 2000), as are management practices to reduce the effects of subclinical acidosis on the health and welfare of cattle (Rushen et al., 2007).
Other welfare risks associated with feedlotting are less easy to address. Behavioural traits of cattle that influence their welfare in feedlots are detailed below. When cattle enter the feedlot environment for the first time they are exposed to a significant number of changes in a short period. Following arrival, it is common for cattle to be mixed with unfamiliar animals. Mixing groups of cattle, and subsequent regrouping, can result in a more than 10-fold increase in agonistic interactions in the period that follows (Bouissou et al., 2001). In the feedlot cattle continue to reside in much closer proximity to each other than they would naturally, further exacerbating these social changes. In addition, the ability of cattle to remember social structure in large populations and at increased densities is reduced, thus increasing the frequency and duration of agonistic interactions (Stricklin et al., 1980; Bouissou et al., 2001). Not only do disrupted social dynamics create a
Don’t fence me in? The welfare of cattle in feedlots
significant psychological stress, but they can negatively affect weight gain (Nakanishi et al., 1991).
The feedlot environment introduces cattle to a variety of novel situations. Prior to arrival, cattle are handled in yards and then transported, both of which are likely to be experiences they are unfamiliar with. Induction processes at the feedlot are also novel (Petherick et al., 2002). Upon entry to the feedlot, not only does the type of feed change, but cattle have to learn to eat from troughs that are likely to be unfamiliar to them. As common to all prey species, novelty provides a source of fear, and these multiple novel situations combine to create a stressful environment for cattle.
Temperament
How an individual animal reacts to these social and environmental changes is partly driven by their temperament. Cattle with a good temperament repeatedly demonstrate a superior ADG and FCR compared with cattle with poor temperament, highlighting the importance of this trait on feedlot performance (Petherick et al., 2002; Cafe et al., 2011). There is a school of thought that slowly introducing these changes can improve the transition into the feedlot by reducing stress. Temperament, however, is considered to be a constant and genetically relatable characteristic, and is relatively inflexible (Mills and Marchant-Forde, 2010). So regardless of the situation, cattle that have a highly reactive temperament will continue to display these traits, and cattle with a calmer temperament will continue to be calm. Indeed, studies have shown that time in the feedlot environment does not affect flight speed (a common measure of temperament) (Petherick et al., 2002). The inflexibility of temperament highlights the importance of selecting animals that adjust to the feedlot environment, thus reducing the likelihood of them experiencing a negative welfare state and the associated productivity effects.
Livestock handling
While temperament itself can only be modified through genetic selection, the type of handling and frequency of exposure to situations can influence the behaviour of cattle. In this sense, the process of backgrounding or acclimation has been trialled as a way to improve feedlot performance (e.g. Francisco et al., 2012). One way this has successfully been done is through repeated exposure to novel conditions. Repeated interactions with humans through handling have been shown to reduce the reactivity of cattle, preparing them for the more intensive management of the feedlot.
Of particular note is a study by Petherick et al. (2009a) that indicated, that good handling produced the greatest reduction in reactivity, no handling produced minimal change, and, interestingly, poor handling produced an intermediate rate of change. The result of poor handling resulting in less responsive animals than those not exposed to handling indicates that it

2014 Graham Centre | Beef Forum 23
was the repeated exposure, and so a reduction in the novelty of the situation, that affected the reactivity of cattle. Petherick et al. (2009b) also demonstrated that the type of handling cattle experienced when they were on pasture affected the stress experienced on entry into the feedlot. Stress was lowest in the well-handled animals and poorly handled cattle displayed the lowest productivity (liveweight gains). These findings support a variety of research describing the influence of the behaviour of stock people on livestock. There is a well-documented relationship between poor animal handling and high levels of fearfulness, flowing on to reduced productivity (Hemsworth, 2003; Hemsworth and Coleman, 2011). In support of this, the stockperson relationship is commonly identified as the most important factor influencing the welfare of cattle (Cozzi et al., 2009). This highlights the importance of high quality handling in the feedlot and on farm for productivity, as well as the influence the background of the animal will have on its welfare and performance once in the feedlot.
Understanding animal behaviour
While there is no guarantee of good welfare in extensive environments, intensive environments restrict the space available to animals, limiting their natural behaviour. This restriction in natural behaviours can affect an animal’s psychological welfare by preventing the performance of behaviours they are naturally motivated to do (Mason and Burn, 2011). Confinement of cattle to feedlots restricts their ability to perform their full repertoire of natural behaviours, such as grazing (Lee et al., 2013).
Rightly or wrongly, intensive farming is often viewed as ‘unnatural’ and is associated with reduced animal welfare. While this may be the public perception, we do not actually know how the cow ‘feels’ about the feedlot environment. By determining what environments and requirements animals need to make them comfortable, we can ensure the situations they are housed in contribute positively to their welfare.
Preference testing allows scientists to assess what values animals assign to what resource, giving valuable insight into what resources an animal desires when given a choice (Dawkins, 1990; Kirkden and Pajor, 2006). Recent research has investigated the preferences beef cattle have for pasture or feedlot environments over a period of time and at different levels of pasture availability. Research by Lee et al. (2013) showed cattle have a preference for pasture over a feedlot environment, spending an average of 18 h/day and 6 h/day in the respective environments. Peak ingestion of the ration occurred in the morning, with the cattle returning to the feedlot intermittently to feed in the middle of the day and again in the afternoon. Cattle met all their dietary requirements from the feedlot ration alone, indicating that pasture was only used as a supplementary feed. Cattle showed a strong preference for lying in pasture, and spent most of their evenings out at pasture. Importantly, pasture quality did not influence lying time at pasture. Caveats do exist with
this result; even the lowest level of pasture coverage was still within critical herbage mass recommendations for cattle. While this is only initial research, further research may be able to determine what, if any, factors in the feedlot need modification in order to make it more desirable to the cattle.
Through new research and understanding human animal interactions, the welfare of cattle in feedlots can be thoroughly assessed and continually improved. These changes may be associated with gains in productivity, and will ensure a high level of welfare for cattle, and improved public perception of feedlots.
References
Bouissou M, Boissy A, Le Neindre P and Veissier I (2001). The social behaviour of cattle. Social behaviour in farm animals, 406.
Cafe L, Robinson D, Ferguson D, McIntyre B, Geesink G and Greenwood P (2011). Cattle temperament: persistence of assessments and associations with productivity, efficiency, carcass and meat quality traits. Journal of Animal Science 89(5): 1452-1465.
Cozzi G, Brscic M and Gottardo F (2009). Main critical factors affecting the welfare of beef cattle and veal calves raised under intensive rearing systems in Italy: a review. Italian Journal of Animal Science 8(1s): 67-80.
Dawkins MS (1990). From an animal’s point of view: motivation, fitness, and animal welfare. Behavioural and Brain Sciences 13: 1-61.
Francisco C, Cooke R, Marques R, Mills R and Bohnert D (2012). Effects of temperament and acclimation to handling on feedlot performance of Bos taurus feeder cattle originated from a rangeland-based cow–calf system. Journal of Animal Science 90(13): 5067-5077.
Gottardo F, Ricci R, Preciso S, Ravarotto L and Cozzi G (2004). Effect of the manger space on welfare and meat quality of beef cattle. Livestock Production Science 89(2): 277-285.
Hemsworth PH (2003). Human-animal inteactions in livestock production. Applied Animal Behaviour Science 81: 185-198.
Hemsworth PH and Coleman GJ (2011). Human-Livestock Interactions: The Stockperson and the Productivity and Welfare of Farmed Animals (2 ed.). Oxon, UK: CAB International.
Ingvartsen KL and Andersen HR (1993). Space allowance and type of housing for growing cattle: A review of performance and possible relation to neuroendocrine function. Acta Agriculturae Scandinavica A-Animal Sciences 43(2): 65-80.

2014 Graham Centre | Beef Forum24
Kirkden RD and Pajor EA (2006). Using preference, motivation and aversion tests to ask scientific questions about animals’ feelings. Applied Animal Behaviour Science 100(1): 29-47.
Lee C, Fisher AD, Colditz IG, Lea JM andFerguson DM (2013). Preference of beef cattle for feedlot or pasture environments. Applied Animal Behaviour Science 145(3): 53-59.
Mader TL (2003). Environmental stress in confined beef cattle. Journal of Animal Science 81(14 suppl 2): E110-E119.
Mader TL, Davis M and Brown-Brandl T (2006). Environmental factors influencing heat stress in feedlot cattle. Journal of Animal Science 84(3): 712-719.
Mason GJ and Burn CC (2011). Behavioural restriction. Animal Welfare, 98-119.
Mills DS and Marchant-Forde JN (2010). The encyclopedia of applied animal behaviour and welfare: CABI.
Nakanishi Y, Mutoh Y, Umetsu R, Masuda Y and Goto I (1991). Changes in social and spacing behaviour of Japanese black cattle after introducing a strange cow into a stable herd. Journal of the Faculty of Agriculture, Kyushu University 36(1): 1-11.
Owens F, Secrist D, Hill W and Gill D (1998). Acidosis in cattle: a review. Journal of Animal Science 76(1): 275-286.
Petherick J, Holroyd R, Doogan V and Venus B (2002). Productivity, carcass and meat quality of lot-fed Bos indicus cross steers grouped according to temperament. Animal Production Science 42(4): 389-398.
Petherick JC, Doogan VJ, Holroyd RG, Olsson P and Venus BK (2009a). Quality of handling and holding yard environment, and beef cattle temperament: 1. Relationships with flight speed and fear of humans. Applied Animal Behaviour Science 120(1): 18-27.
Petherick JC, Doogan VJ, Venus BK, Holroyd RG and Olsson P (2009b). Quality of handling and holding yard environment, and beef cattle temperament: 2. Consequences for stress and productivity. Applied Animal Behaviour Science 120(1): 28-38.
Rushen J, de Passillé AM, von Keyserlingk MA and Weary DM (2007). The welfare of cattle (Vol. 5): Springer.
Stock R and Smith R (2000). Acidosis in cattle: an overview. Paper presented at the Proceedings of the Thirty-Third Annual Conference, American Association of Bovine Practitioners, Rapid City, South Dakota, USA, September 21-23, 2000.
Stricklin W, Graves H, Wilson L and Singh R (1980). Social organization among young beef cattle in confinement. Applied Animal Ethology 6(3): 211-219.

2014 Graham Centre | Beef Forum 25
Ancare technical helpline
1800 001 973
Genesis™ Ultra Pour-on controls all 3 stages of liver fluke
Get it from:Another smart solution from:
A POUR-ON THATKILLS FLUKES
WHEN THEY’RE THIS BIG
(Early immature)
AND THIS BIG
(Immature)
AND THIS BIG
(Adult)
• Broad spectrum activity - all major gastro-intestinal roundworms, lungworm and biting and sucking lice. • Pour-on convenience – treat animals in a fraction of the time.• Low stress and safe application – minimize stress and injury to you and your animals.• Accuracy of dosing – see the whole dose go on and stay on, avoid having to retreat some of the herd.
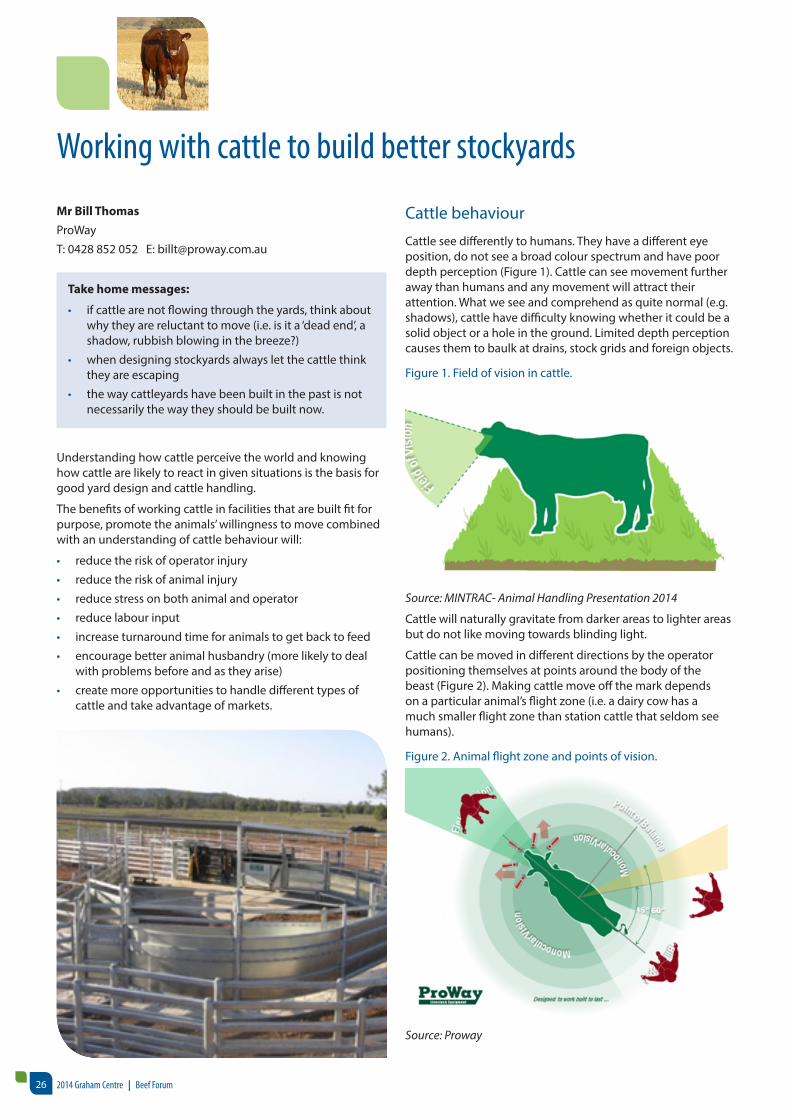
2014 Graham Centre | Beef Forum26
Mr Bill ThomasProWay
T: 0428 852 052 E: [email protected]
Take home messages:
• if cattle are not flowing through the yards, think about why they are reluctant to move (i.e. is it a ‘dead end’, a shadow, rubbish blowing in the breeze?)
• when designing stockyards always let the cattle think they are escaping
• the way cattleyards have been built in the past is not necessarily the way they should be built now.
Understanding how cattle perceive the world and knowing how cattle are likely to react in given situations is the basis for good yard design and cattle handling.
The benefits of working cattle in facilities that are built fit for purpose, promote the animals’ willingness to move combined with an understanding of cattle behaviour will:
• reduce the risk of operator injury
• reduce the risk of animal injury
• reduce stress on both animal and operator
• reduce labour input
• increase turnaround time for animals to get back to feed
• encourage better animal husbandry (more likely to deal with problems before and as they arise)
• create more opportunities to handle different types of cattle and take advantage of markets.
Working with cattle to build better stockyards
Cattle behaviour
Cattle see differently to humans. They have a different eye position, do not see a broad colour spectrum and have poor depth perception (Figure 1). Cattle can see movement further away than humans and any movement will attract their attention. What we see and comprehend as quite normal (e.g. shadows), cattle have difficulty knowing whether it could be a solid object or a hole in the ground. Limited depth perception causes them to baulk at drains, stock grids and foreign objects.
Figure 1. Field of vision in cattle.
Source: MINTRAC- Animal Handling Presentation 2014
Cattle will naturally gravitate from darker areas to lighter areas but do not like moving towards blinding light.
Cattle can be moved in different directions by the operator positioning themselves at points around the body of the beast (Figure 2). Making cattle move off the mark depends on a particular animal’s flight zone (i.e. a dairy cow has a much smaller flight zone than station cattle that seldom see humans).
Figure 2. Animal flight zone and points of vision.
Source: Proway

2014 Graham Centre | Beef Forum 27
Cattle are herd and prey animals and perceive the stock handler as a predator. When cattle feel threatened they mob together and when moving tend to mill. Cattle do not like being singled out and will want to return to the mob sometimes regardless of where the operator (predator) is positioned. The milling instinct is thought to occur so they can see both the predator and the mob at the same time.
Cattle walk best on level ground, then up an incline, then down. Cattle have only a moderate ability to judge distance and find uneven surfaces and steep slopes difficult. Cattle are easily stressed if they slip over or the surface is slippery.
Cattle have sensitive hearing and tend to avoid excessive, loud, high-pitched and unfamiliar noises. These noises stress cattle, making them baulk and difficult to handle.
Stock will become lame if they stand on hard surfaces for long intervals.
Cattle remember bad experiences. They also remember the way out and will readily move through a set of yards if they know it is the path to get back to a less stressful environment.
Cattleyard design
The best principles to think about when designing cattleyards is to let the cattle think they are escaping, not going to be trapped, and do not run them towards areas that look scary and unfamiliar until absolutely necessary.
Use the milling instinct. Design races that are curved to promote stock flow and lesson the amount of walking the operator has to do. For cattle that are not often handled and are more agitated, use a bigger radius so the operator can avoid the flight zone of the cattle, reducing the amount of stress on the animal while in the race. The entrance to the curved race does not want to look like a dead end; you do not want cattle that have started to go down the race to disappear too quickly.
Strategic sheeting in the single file race helps stock flow. Distractions should be sheeted off and spaces where you want cattle to see the operator should be left open. The operator can then make the cattle move without being right over them. Figure 3 shows how to move cattle by positioning yourself correctly.
Figure 3. Moving cattle by positioning your body.
Source: Proway
A sliding gate one beast back from the crush helps draw cattle behind it but also makes getting them into the crush quicker and easier.
The transition from the forcing yard to the entrance of the single file race needs to be heading to the ‘openness’, back towards the mob and where animals think they can escape. It does not want to be heading towards the movement, noise, solid objects (sheds) and other threatening things. The angle of the throat to the single file race works well at about 30 degrees (Figure 4).
Figure 4. Entry to single file race do’s and don’t’s.
Source: Proway
2014 Graham Centre | Beef Forum28
The forcing yard should be viewed as a ‘through’ yard. Avoid filling the forcing yard without the first sliding gate being open.
If the race, forcing yard or stockyards are covered, do not allow shadows to cast at the transition zones.
Consider the sun and its interference with stock walking directly into it. Load to the south if possible, then the north.
Use materials that are animal friendly. Curved rails and pipe are better products than railway iron and square pipe.
The size of one yard to the next is important for efficiency. A general rule of thumb is not to have the next yard any smaller than 25% of the one you are exiting (i.e. 100m2 to 25m2).
Cattleyards should be free of unnecessary distractions. Do the housekeeping, clean up and be pro-active with maintenance and improvements in and around stockyards.
Acknowledgements
MINTRAC- Animal Handling Presentation 2014
Temple Grandin, Professor of Animal Science, Colorado State University
Secure your farm
farmbiosecurity.com.au
secure your farm: secure your future
...against diseases, pests and weeds
Watch two short videos to find out how at
People, vehicles and equipment can bring diseases, pests and weeds onto your property. Watch our latest videos to find out what steps you can take and see how others are protecting their farms.
Good farm biosecurity covers a range of practices which help keep Australia’s livestock and crops free of diseases, pests and weeds. The Farm Biosecurity program helps producers secure their farms and their futures through providing a range of information, tools and news about how to implement good on-farm biosecurity.
Implementing biosecurity practices on your property, no matter what you farm or what size business you run, doesn’t have to be difficult or expensive. There are simple to implement, day-to-day measures you can take to protect your property.
Farm biosecurity helps protect producersPeople who visit your property, including staff, suppliers, vets, agronomists, stock agents, contractors, itinerant workers and even your family and friends, can accidentally bring diseases, pests and weeds with them every time they drive through the farm gate.
Diseases, pests and weeds can also enter a farm and be spread by equipment and vehicles, either directly or in plant material, soil or manure. It is important to maintain equipment hygiene and ensure all vehicles that visit your property are clean and well maintained.
To help producers identify good on-farm biosecurity actions and take steps to reduce the risks people
pose, Farm Biosecurity has produced two short videos on people movement, vehicles and equipment, which you can view on our website. They include practical advice and tips on how to reduce the biosecurity risk to your farm and feature interviews with real-life farmers about why biosecurity is important to them.
Producers play a key role in protecting Australian plant and livestock industries from pests and diseases by implementing sound biosecurity measures on their farms.
If a new pest or disease becomes established on your farm, it will affect your business through increased costs, reduced productivity or loss of markets.
Early detection and reporting of an exotic pest or disease increases the chance of effective and efficient eradication. If you suspect you have an exotic pest or disease on your property, call the Emergency Animal Disease Watch Hotline 1800 675 888 or the Exotic Plant Pest Hotline on 1800 084 881.
Farm Biosecurity is jointly funded and supported by Animal Health Australia and Plant Health Australia.
For more information on Farm Biosecurity and to watch our videos, visit our website farmbiosecurity.com.au.
EXOTIC PLANT PEST HOTLINE
1800 084 881
EMERGENCY ANIMAL
DISEASE WATCH HOTLINE
1800 675 888
ADVERTISEMENT
2014 Graham Centre | Beef Forum 29
A study of Pestivirus in eastern Australia: farmers’ understanding of the disease, and approach to controlDr Alistair Smith1,2, Dr Marta Hernandez-Jover1,2
and Mr Steve Exton3
1School of Animal and Veterinary Sciences, Charles Sturt University2Graham Centre for Agricultural Innovation3NSW Department of Primary Industries
T: 02 6933 4263 E: [email protected]
Take home messages:
• pestivirus causes a range of disease manifestations, not just poor fertility and the production of a persistently-infected (PI) animal
• transmission of the virus can be from all animal secretions infected with Pestivirus
• protection, for previously unvaccinated animals, requires a primary vaccination course of two injections at an appropriate interval, and this vaccination course must be completed at least two weeks before joining commences.
Pestivirus or Bovine Viral Diarrhoea (BVDV) is a virus that many, but not all, Australian farmers have heard of. The genus Pestivirus not only incorporates the virus that is responsible for ‘Pesti’ in cattle but also includes the viruses that cause Classical Swine Fever in pigs and Border Disease in sheep. Intriguingly, although the various clinical manifestations of the disease were only first documented about 70 years ago, (Olafson, McCallum and Fox, 1946), the virus is now recognised to have affected animal populations for several centuries.
BVDV is a virus that many recognise as being implicated in poor fertility (McGowan, Kirkland, Richards and Littlejohns, 1993) and abortion, but it also has effects on foetal development (deformities), the immune system (immunosuppression, allowing secondary infections), and calf viability (dead or weak calves around birth).
The virus spreads primarily through viral shedding from persistently infected (PI) individuals that arise as a consequence of their mothers, which having never previously been exposed to the virus are immunologically naive, being infected in the early part of pregnancy. It is commonly accepted the window of opportunity for the creation of a PI calf means the dam must be exposed between days 18-125 of pregnancy. At this time the foetuses immune system has not started to develop, but when it does (usually between days 120-180 of gestation) it ‘ticks-off’ those proteins that it considers part of the ‘normal’ make-up of the calf. Consequently the immune system does not attack those ‘normal’ proteins, except in particular situations such as autoimmune disease, and the virus is permitted to survive and replicate. This occurs very successfully with large volumes of virus particle being excreted by these PI animals for their
whole life. The timing of gestational exposure determines the potential outcome from that insult, be it poor fertility (from infection around joining), the creation of a PI calf (from infection during early pregnancy), the occurrence of deformities (after mid-pregnancy infection) or abortions (infection in first two-thirds of pregnancy).
There are other opportunities for virus shedding to occur from animals that have never previously met the virus but have functional immune systems. They can excrete for a period of time between initial infection and the development of protective antibodies. This short window exists for about 7-14 days, but the volume of virus shed by these transiently-infected animals is considerably less than from a PI animal.
Scientifically a lot has been learned about this virus since the description of its clinical effects by Olafson et al. (1946). The virus has been classified into two genetically separate groups: Type 1, within which there are various sub-groups (1a – 1k) and Type 2. In Australia, Type 1c predominates, with some occurrences of Type 1a. Type 1 viruses typically present a clinical picture in the infected pregnant animal as described above. The Type 2 virus, which occurs predominantly in North America, has been recognised as being particularly virulent, and has been associated with acute haemorrhagic enteritis and death in affected individuals.
Sometimes the virus in the PI animal can mutate to form a different biotype that attacks and destroys cells in the body. This allows the development of the clinical syndrome known as Mucosal disease, where massive cell damage occurs to the gastrointestinal mucosa from the muzzle to the anus, leading to the diarrhoeic manifestation of the disease and death of animals.
Many countries worldwide have adopted eradication schemes, both nationally and regionally. The Scandinavian countries and Austria have successfully eradicated the disease. Scotland is in the third year of an eradication program, and Germany, Spain, France, Italy, Greece and the Netherlands have undertaken, either large or sometimes smaller, time-limited regional programs (Lindberg et al., 2006). Meanwhile control in the USA and Canada is undertaken by routine and widespread use of vaccines. In Australia, a vaccine (Pestigard®, Zoetis) has been available since 2003, but the level of uptake is undocumented. Prior to the release of Pestigard some producers undertook deliberate exposure of their future breeding young stock to a PI animal to endeavour to ensure exposure, and immunity, to the virus before these animals became pregnant. It was assumed that once immune, those animals would be afforded long-term protection.
Many researchers have tried to evaluate the cost of this disease to the industry and the numbers vary depending on whether a herd that has never previously been exposed ($30- $195/cow) or one

2014 Graham Centre | Beef Forum30
that has an ongoing endemic disease continually circulating in the background ($13-$49/calving) (Lindberg et al , 2006) are considered. Limited information is available on the economic impact of Pestivirus in southern Australian cattle herds. A Meat and Livestock Australia (MLA) report (2006) concluded that data on prevalence was incomplete, and the impact of the disease could not be validated. In addition they observed there were difficulties in quantifying whether vaccination was cost-effective for any given herd, and concluded that most producers who knowingly had BVDV on their property would prefer to achieve control through the use of a PI calf by deliberately exposing the immunologically-naive members of the herd to it.
Recent anecdotal evidence gathered in discussion with producers, shows that some, despite their involvement in the cattle industry for 40 years, are unaware of the existence of this virus, its effects, and what can be done to control it.
So eight years after the MLA report was published, it seemed appropriate to attempt to fill this knowledge gap. However, before any investigation can start into the economic impact of Pestivirus in Australian herds it is important to first gain an understanding of farmers’ knowledge about the infection, and how they approach applying control measures. A survey was conducted in eastern Australia in early 2014. This paper summarises how this was conducted and some of the early results. These results have previously been reported at the World Buiatrics (cattle diseases) conference 2014 in Cairns (Smith, Hernandez-Jover and Exton, 2014).
Method
A survey was conducted among 1,500 eastern Australian cattle breeders from southern Queensland to Victoria. An expectation of a 25-30% response was used, which would create a sample-size of 400, allowing a 95% confidence level in the results assuming 50% would conduct the practice. Two mail-outs were used to send a total of 76, 951 and 473 questionnaires to cattle producers in Queensland, New South Wales and Victoria, respectively.
Information was gathered about property size, location and herd type. Farmers’ were also asked about their understanding of the disease manifestations of Pestivirus. They were asked to identify factors from a list which they believed were; outcomes associated with Pestivirus infection; factors involved in Pestivirus spread; how the timing of infection may result in a PI calf; whether veterinary advice was sought in relation to this disease; and whether, and how, testing for Pestivirus occurred. Farmers were also asked about their approach to controlling and preventing infection by Pestivirus. Those that vaccinated were asked to indicate where they sourced the vaccine, how long they had been vaccinating, and to describe the vaccination protocol they follow. Similar questions were asked of those respondents who conducted deliberate exposure to a PI animal.
Results
A total of 108 responses were received from the first mailing of the survey (Victoria (36), NSW (67) and Queensland (5)). The range in breeding cow herd size was 50-1950 adult cows. Twenty-six respondents were involved in dairying, and the remainder were beef producers. Herds were described as being; ‘closed’ (38%), having ‘occasional introductions’ (50%), or ‘regular introductions’ (12%).
Understanding of Pestivirus
Ninety-two producers responded when asked to identify the outcomes that they would recognise to be a consequence of a Pestivirus infection in a susceptible animal, and the most likely routes of transmission of the virus.
Table 1 summarises the percentage of respondents who identified each outcome as a possibility, with 25% of producers correctly identifying that all of the outcomes are possible.
Table 2 reports the percentage of producers who identified each of the possible methods of spread as a likely option for transmission of Pestivirus. Only 15% of all respondents correctly identified all routes as potential risks.
Table 1. Percentage of respondents (n=92) that identified each of the listed outcomes as possible outcomes from a Pestivirus infection in a susceptible animal.
Outcome Abortion Birth of PI calf Poor fertility Suppressed immunity
Weak neonates
Calf deaths Deformities
Percentage response 80.4% 78.3% 77.2% 66.3% 66.3% 53.8% 46.7%
Table 2. Percentage of respondents (n=92) that identified each of the listed routes as possible ways that Pestivirus can be transmitted.
Method of spread
via a PI calf via saliva and nasal secretions
via abortion material
via transiently-infected animals
immunity
via faeces via semen
Percentage response 90.3% 62% 55.4% 50.5% 40.2% 34.1%
2014 Graham Centre | Beef Forum 31
Eighty-one producers answered a question relating to the timing of infection that may result in the formation of a PI calf with 86.4%, 22.2% and 21% replying foetal infection, suckling-calf infection and post-weaning infection, respectively. Foetal infection in the first third of pregnancy is the time when this outcome occurs.
Advice on Pestivirus and testing
Respondents reported they sought veterinary advice for different aspects of Pestivirus as; general advice (76.6%), BVDV testing (67.5%) and vaccination (65.9%). The proportion of producers seeking veterinary advice was significantly higher in NSW than Victoria.
Overall, antibody testing (for historic exposure) and antigen testing (for current viral presence), was conducted by 36% and 34.7% of respondents respectively, with 17% undertaking both. Regionally, NSW respondents performed more testing than Victorian participants.
Control of Pestivirus
Control of BVDV was only conducted by 35.3% respondents with 83.3% vaccinating and 16.7% using deliberate exposure to a PI animal. Reported sources of vaccines were, retailers (86.2%), online (3.4%) and local veterinarian (10.3%).
Respondents had been vaccinating their herds for varying periods with a median period of five years. The timing for completion of a vaccination course prior to the commencement of joining varied between one week and four months. The most common interval was 4-6 weeks (33.3%) before joining, with the next most reported interval being two weeks (20.8%). Some respondents reported only completing the vaccination course after the breeding season commenced. Nearly two-thirds of producers (65.5%) confirmed they also vaccinated their bulls.
Respondents (96.3%) vaccinating animals for the first time reported giving two injections on two occasions. The most commonly reported injection interval was 4-8 weeks (19 producers), however one respondent extended the interval beyond six months, and another reduced it to two weeks. Most producers (80%) reported vaccinating annually but only 56.7% actually confirmed doing so in the past 12 months. Many respondents (83.3%) gave additional treatments with the BVDV vaccine.
All respondents keep the purchased vaccine chilled until the day-of-use, with most (85.7%) using a cool-box and ‘ice-brick’ on that day to maintain cooling.
Of the six farms (NSW (4) and Victoria (2)) that reported undertaking deliberate exposure to a PI animal, five of these try to source the PI animal from within their own herd, and one routinely purchases their PI animals from other properties. The duration of exposure used ranged from three months to ‘all year’, with six months being the most commonly used duration. The timing for removal of the PI animal prior to commencement of the breeding season ranged from two weeks to one month, with one respondent never removing the PI animal, allowing it run with the herd all year round.
Conclusion
These preliminary results suggest that respondents have varying levels of understanding in relation to the spread of Pestivirus and its outcomes. The role of the PI calf as a major source of virus-shedding, and how it arises, seems to be well-understood. But it is poorly understood that all secretions from a virus-shedding animal, be that one that is persistently-infected or one that is undergoing transient infection before its immune system develops antibodies against the virus, are a potential threat.
Of particular concern is the low ranking given to the potential risk posed by the faeces and semen of these animals. The impact on fertility and abortion is well-acknowledged but the other possible outcomes are not so well recognised. The limited appreciation of the impact of the virus on the immune system, and consequently the reduced ability of an animal infected with the virus to fight off other pathogens, is of concern as this is a phase in the infection when otherwise apparently healthy animals can suffer ill-thrift and loss of productivity, or even death.
Currently the veterinary profession appear to be under-utilised as a source of advice and education, both for general advice and also specific advice on testing and vaccination for Pestivirus, and there are potential opportunities for producers to utilise this resource more effectively.
Respondents indicated varying levels of engagement with preventative measures against Pestivirus infection. Prevention of infection through vaccination appears to be gaining greater traction in comparison to deliberate exposure to a PI animal. This is in contrast to previous Australian reports (Sackett et al., 2006). Compliance with the recommendations on the vaccine datasheet are generally good with most respondents understanding the requirement for two injections of the vaccine, with an interval between four weeks and six months, as being necessary to achieve adequate protection. Some respondents however, undertake high-risk behaviour such as failing to achieve good immune-protection prior to the start of breeding (i.e. failing to complete vaccination courses prior to the fortnight before breeding commences). Similar concerns are raised when reviewing some of the actions undertaken by those participants who conduct deliberate exposure to a PI animal (i.e allowing the PI animal to run with the herd all year round).
Many producers demonstrate a reasonable working knowledge of how disease caused by BVDV manifests itself, how it can be spread, and what can be done to control it. But only a third of producers are implementing any control programme, and these are not always implemented effectively. Further study is required to assess why many producers are choosing not to implement protective programmes and whether there will be a cost-benefit under Australian conditions for them to do so.

2014 Graham Centre | Beef Forum32
References
Lindberg A, Brownlie J, Gunn GJ, Houe H, Moenning V, Saatkamp WW and Valle PS (2006). The control of bovine viral diarrhoea virus in Europe: today and in the future. Revue Scientifique et Technique(International Office of Epizootics) 25 (3): 961-979.
McGowan MR, Kirkland PD, Richards SG and Littlejohns IR (1993). Increased reproductive losses in cattle infected with bovine pestivirus around the time of insemination. Veterinary Record 133: 39-43.
Olafson P, McCallum A and Fox F (1946). An apparently new transmissible disease of cattle. Cornell Vet 36: 205-213.
Sackett D, Holmes P, Abbott K, Jephcott S and Barber M (2006). Assessing the economic cost of endemic disease on the profitability of Australian beef cattle and sheep producers. MLA Report AHW.087, Sydney, Australia, Meat & Livestock Australia Limited.
Smith AK, Hernandez-Jover M and Exton S (2014). Proceedings of the 28th World Buiatrics Conference, Cairns, Australia.

Contacts Deirdre Lemerle Phone: + 61 2 6933 4398 Director Mobile: 0419 816 267 Email: [email protected]
Toni Nugent Phone: + 61 2 6933 4402 Industry Partnerships and Mobile: 0418 974 775 Communications Manager Email: [email protected] Graham Centre for Agricultural Innovation Locked Bag 588 Wagga Wagga NSW 2678
www.grahamcentre.net © Charles Sturt University, 2014. JB F3900
AUSTRALIA
Sponsors