2014 state of manufacturing- pollster's powerpoint
TRANSCRIPT

Helping Manufacturing Enterprises Grow Profitably
Presents

On behalf of Enterprise Minnesota, Public Opinion
Strategies is pleased to present the key findings from the
sixth annual survey of manufacturing executives in
Minnesota.
The survey was conducted February 28-March 13, 2014,
among 400 manufacturing executives; it has a margin of
error of +4.9%. Respondent titles included owners, CEOs,
CFOs, COOs, presidents, vice presidents, and managing
officers.
Rob Autry is a Partner of Public Opinion Strategies, a
national political and public affairs survey research firm
based in Alexandria, VA.

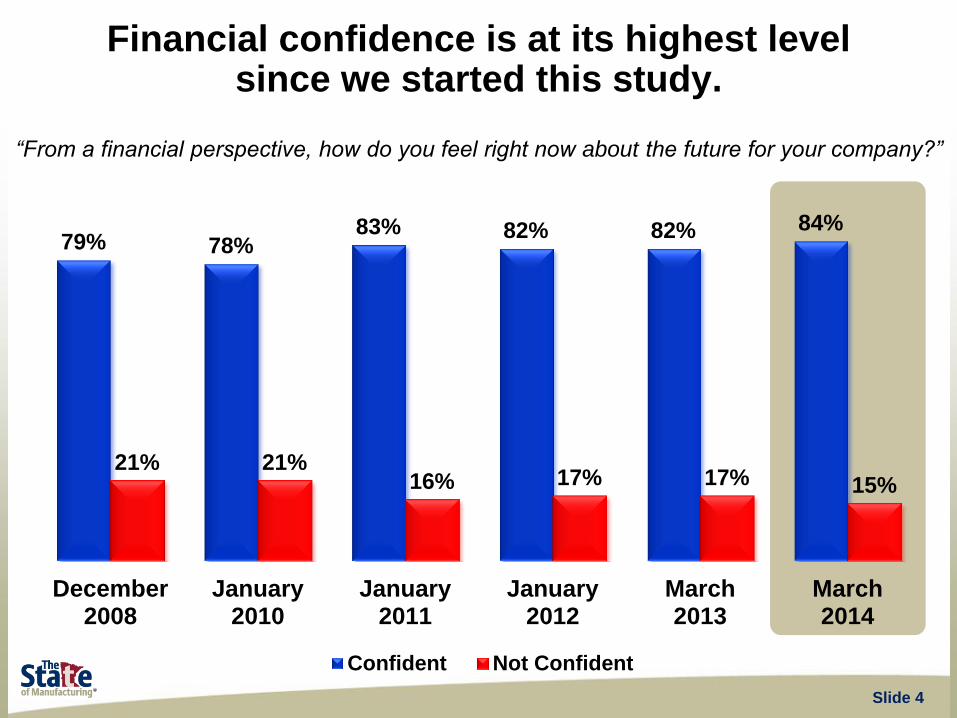
79% 78% 83% 82% 82% 84%
21% 21% 16% 17% 17% 15%
December2008
January2010
January2011
January2012
March2013
March2014
Confident Not Confident
“From a financial perspective, how do you feel right now about the future for your company?”
Slide 4
Financial confidence is at its highest level since we started this study.

8%
26%
40%
32% 34% 37%
34%
53% 49%
55%
46%
54% 56%
19%
9% 10% 15%
7%
December2008
January2010
January2011
January2012
March2013
March2014
Economic Expansion Flat Economy Recession
“Thinking about the upcoming year, in 2014, do you anticipate economic expansion,
a flat economy, or a recession?”
Slide 5
Manufacturing executives are more economically hopeful than in previous years; recessionary
concerns are at their lowest.

30% 33%
41% 40% 39% 41%
55% 54%
47% 47% 49% 51%
December2008
January2010
January2011
January2012
March2013
March2014
Right Direction Wrong Track
“Generally speaking, in regard to being a competitive business location, would you say that things in
Minnesota are going in the right direction, or have they pretty seriously gotten on the wrong track?”
Those who say the state’s business climate is on the wrong track is at its highest level since 2010.
Slide 6

23%
17% 19%
44%
36%
24%
51%
39%
32%
47%
31%
27%
41%
32%
28%
45%
35%
27%
Gross Revenues Profitability Capital Expenditures
2008 2010 2011 2012 2013 2014
Percent Expecting Increases Per Year
Slide 7
We also see a slight uptick in expected gross revenues and profitability for 2014, but not with capital expenditures.

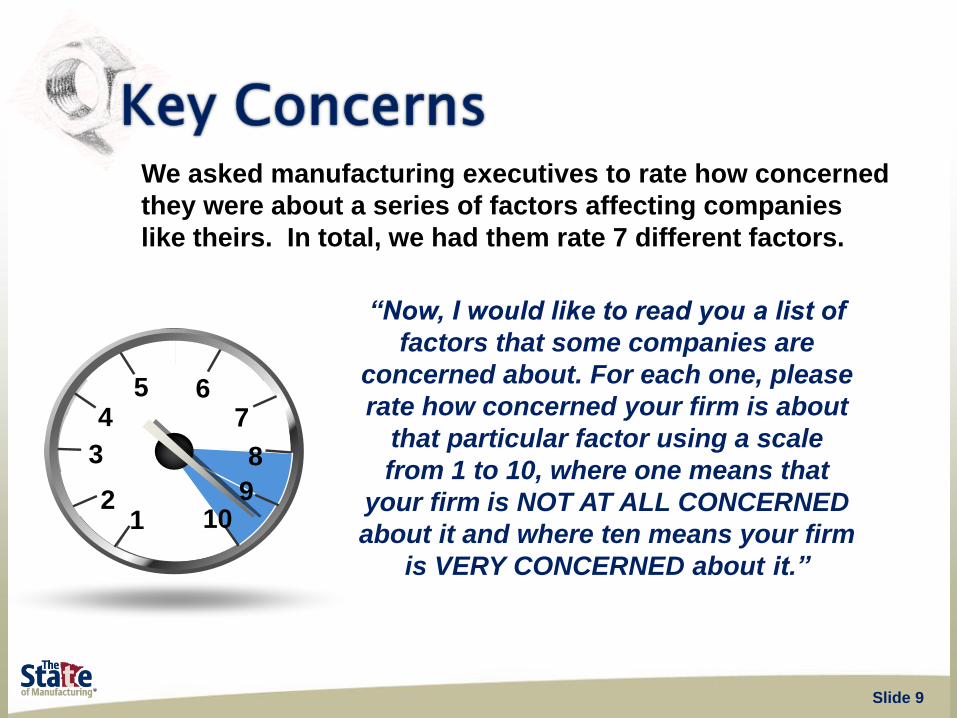
We asked manufacturing executives to rate how concerned
they were about a series of factors affecting companies
like theirs. In total, we had them rate 7 different factors.
“Now, I would like to read you a list of
factors that some companies are
concerned about. For each one, please
rate how concerned your firm is about
that particular factor using a scale
from 1 to 10, where one means that
your firm is NOT AT ALL CONCERNED
about it and where ten means your firm
is VERY CONCERNED about it.”
1 2
3
4 5
80
90
100
110
6 7
8
9 10
Slide 9

59%
55%
34%
31%
18%
16%
11%
Concerns Ranked By % Concern (8-10)
Slide 10
The costs of health care coverage
Government policies and regulations
The ability to attract and
retain qualified workers
Economic and global uncertainty
Costs of employee salaries and
benefits, not including health insurance
Increased competition from
foreign sources
Managing supply chain relationships
Health care costs and government policies and regulations top the list of concerns.

48%
31%
31%
29%
21%
“What would you say are the one or two biggest challenges your firm is facing that
might negatively impact future growth?” (Ranked By % Combined Choice)
Slide 11
Unfavorable business climate,
such as taxes, regulations,
and policy uncertainties
Rising health care and
insurance costs
Weak economy and lower
sales for your products
Rising costs of energy and
materials for your products
Attracting and retaining a
qualified workforce
The business climate and government policies are seen as the biggest obstacle to growth.


2010 2011 2012 2013 2014
The costs of health care coverage 68% 71% 68% 67% 59%
Government policies and regulations 57% 61% 56% 58% 55%
The ability to attract and retain
qualified workers 19% 14% 31% 30% 34%
Economic and global uncertainty n/a n/a n/a n/a 31%
Costs of employee salaries and
benefits, not including health
insurance
16% 15% 13% 19% 18%
Increased competition from foreign
sources 27% 20% 21% 17% 16%
Managing supply chain relationships n/a n/a 15% 10% 11%
Slide 13
Concerns Among Manufacturing Executives (% Concern 8-10)
We have seen a consistent rise in concern about finding and keeping qualified workers.

We asked manufacturing executives to rate how important a
series of factors were in helping them to attract and recruit
new employees to their firm.
“Changing the focus somewhat to
attracting and recruiting new employees
to your firm...I am going to read a series
of factors and, after I read each one,
please tell me how important that
particular factor is to your firm in
attracting workers, using a one to ten
scale where one means that factor is
NOT IMPORTANT AT ALL and where ten
means that factor is VERY IMPORTANT.”
1 2
3
4 5
80
90
100
110
6 7
8
9 10
Slide 14

55%
40% 45%
58% 60%
67%
43%
55% 50%
39% 36%
32%
December2008
January2010
January2011
January2012
March2013
March2014
Difficult Not Difficult
“How difficult is it to attract qualified candidates for your firm’s vacancies?”
Slide 15
Two-thirds now say it is difficult to attract new workers, the highest margin in six years.

54%
61% 55%
75%
43% 37%
43%
25%
December 2008 March 2014 December 2008 March 2014
Difficult Not Difficult
“How difficult is it to attract qualified candidates for your firm’s vacancies?”
Slide 16
Difficulty in filling vacancies has noticeably soared with non-Metro area manufacturers.
Metro Firms Non-Metro Firms

20%
19%
49%
6%
22%
21%
47%
6% 2013 Data 2014 Data
“When looking to hire new employees, where is your need greatest?”
Slide 17
Entry-level employees
Employees with
technical training
Employees with technical
training and experience
Employees with four-year
college degrees
Nearly half of all manufacturers say they’re looking for employees with training and experience.

27% 22% 23%
16% 16% 14%
56% 60% 62%
January 2012 March 2013 March 2014
Grow Shrink About The Same
“Looking back on the last 12 months, did your company’s workforce grow,
shrink, or stay about the same?”
Slide 18
Sixty-two percent of firms say their workforce has stayed about the same in the past year.

29% 25%
30%
2% 5%
2%
68% 69% 67%
January 2012 March 2013 March 2014
Grow Shrink About The Same
“In the next 12 months, does your company expect to grow or shrink the size
of its workforce, or will it stay about the same?”
Slide 19
And, two-thirds expect their workforces to stay about the same for the next year, too.

2013 2014
Metro Firms 25% 30%
Non-Metro Firms 26% 30%
Less than $1 million in revenue 20% 21%
$1-5 million in revenue 31% 33%
Over $5 million in revenue 33% 41%
50 or fewer employees 23% 27%
Over 50 employees 39% 42%
Been in operation 1-15 years 25% 27%
Been in operation over 15 years 25% 31%
Slide 20
Percent Expect Their Firm To Grow In Next 12 Months
We are starting to see some interesting differences on workforce growth by firm type.

66%
48%
41% 43% 43%
54%
6%
13% 14% 9% 10%
5%
27%
38%
44% 46% 44% 39%
December2008
January2010
January2011
January2012
March2013
March2014
Increased Decreased Stayed About the Same
“On average, over the last two years, have your firm’s wages increased,
decreased, or stayed about the same?”
Slide 22
A majority of executives report increasing wages for the first time since the recession.

41% 45%
53% 54%
48%
62%
7% 4% 2% 2% 4% 2%
51% 49% 44% 43%
46%
35%
December2008
January2010
January2011
January2012
March2013
March2014
Increase Decrease Stay About the Same
“Do you expect the average wages to increase or decrease over
the next two years, or will they stay about the same?”
Slide 23
The highest percentage since 2008 expect wages to rise over the next two years.

2008 2010 2011 2012 2013 2014
Affordable Health Care 39% 39% 45% 50% 54% 51%
Salary and Wage Expectations 43% 38% 29% 22% 25% 32%
Competitive Benefits Package 35% 32% 31% 22% 27% 25%
Flexible Work Schedules 32% 30% 20% 14% 12% 13%
The Need to Accommodate
Part-Time Workers n/a n/a n/a n/a n/a 7%
Top Recruitment Factors Ranked By Importance (8-10)
Slide 24
And, we have also seen a significant rise in salary and wage expectations since 2012.

16% 19% 18% 17% 18%
25%
13% 10% 8% 8%
12% 7%
69% 67% 71% 72%
68% 67%
December2008
January2010
January2011
January2012
March2013
March2014
Will Invest More Will Invest Less Will Stay the Same
“Generally speaking, would you say that as a percentage of payroll your company will
invest MORE in employee development or LESS next year compared to 2013,
or will it stay about the same?”
Slide 25
And, now a quarter of firms predict investing more in employee development in the coming year.

Yes No
Metro Firms 34% 65%
Non-Metro Firms 27% 71%
Less than $1 million in revenue 8% 90%
$1-5 million in revenue 36% 63%
Over $5 million in revenue 55% 44%
50 or fewer employees 24% 76%
Over 50 employees 62% 34%
Been in operation 1-15 years 23% 76%
Been in operation over 15 years 33% 66%
Slide 26
“Does your company have an employee development and retention program
for your less-experienced employees?”
Larger firms are more likely to have employee development and retention programs.

Yes No
Metro Firms 27% 72%
Non-Metro Firms 32% 68%
Less than $1 million in revenue 11% 89%
$1-5 million in revenue 26% 74%
Over $5 million in revenue 57% 41%
50 or fewer employees 20% 79%
Over 50 employees 66% 33%
Been in operation 1-15 years 18% 82%
Been in operation over 15 years 32% 68%
Slide 27
“Does your firm have a recruiting relationship with one or more vocational,
technical, or community colleges or universities?”
Non-Metro firms and firms that expect to grow are forming relationships with educational institutions.


“How much of your product did you ship internationally in the last year?”
2008 2010 2011 2012 2013 2014
None 58% 58% 56% 52% 56% 51%
10% or Less 31% 29% 28% 29% 29% 23%
11% - 25% 5% 7% 8% 9% 8% 14%
26% - 50% 4% 4% 6% 7% 4% 4%
51% or More 1% 1% 2% 2% 2% 5%
Slide 29
We see a bump up in the percentage of firms that ship more than 11% of their product aboard.
11% or More 10% 12% 16% 18% 14% 23%

24%
66%
"Home Sourcing"
Yes No
Slide 30
“Have you gained new business because of ‘home sourcing’
(or re-shoring) by your OEM customers?”
About one fourth of firms have gained new business due to “home sourcing.”
Yes
Metro Area Firms 23%
Non-Metro Firms 26%
Less than $1 million revenue 12%
$1-5 million in revenue 35%
Over $5 million revenue 34%
50 or fewer employees 23%
Over 50 employees 32%
Been in operation 1-15 years 19%
Been in operation over 15 yrs 26%

Slide 31
Shorter lead times and costs are the main reasons why supply chain relationships have changed.
AMONG THOSE WHO GAINED NEW BUSINESS: “And, what would you say is
the main reason why your supply chain relationships changed?”
31%
26%
18%
12%
11%
Shorter lead times
Total costs vs. only
product costs
Closer relationships/regional
suppliers
Better inventory management
Don’t know/Not sure

87%
56%
44%
81%
33% 27%
Confident In Firm'sFinancial Future
Expect Increase In GrossRevenues
Expect Increase InProfitability
Have Formal Planning Process Do NOT
Slide 32
Firms with formal planning processes are more likely to expect increases in gross revenues and
profitability for the coming year.

87%
60%
46%
82%
31% 26%
Confident In Firm'sFinancial Future
Expect Increase In GrossRevenues
Expect Increase InProfitability
Have Formal Marketing Process Do NOT
Slide 33
And, we find the same differences exist between firms that have formal marketing processes
and those that don’t.

50% 48%
37%
48% 52%
62%
Formal PlanningProcess
Formal MarketingProcess
Formal QualityManagement System
Yes No
Slide 34
Half of firms have marketing and planning processes in place, and two thirds do not have
ISO or a similar quality standard. “Does your firm have a formal
planning process?”
“Does your company have a
formal quality management
system, such as ISO?”
“Does your firm have a formal
marketing process?”


I. Health care remains the most important issue facing
manufacturers for the fifth year in a row.
II. We are seeing a rise in concern about finding, recruiting and
retaining qualified and experienced workers.
III. And, concern is soaring with firms that are located outside of
the metro area.
IV. While confidence in the financial future is at its highest level
yet and recessionary fears are at their lowest, a majority still
believe the state’s business climate is on the wrong track.
V. Firms that have strategic planning processes in place are
noticeably more optimistic about their future growth and
prosperity.

Helping Manufacturing Enterprises Grow Profitably
The 2014 State of Manufacturing Poll was sponsored by:
Full results can be viewed at
www.enterpriseminnesota.org