2015 annual report - snl · · 2015-08-282015 annual report. financial highlights ... after...
TRANSCRIPT

2015Annual Report
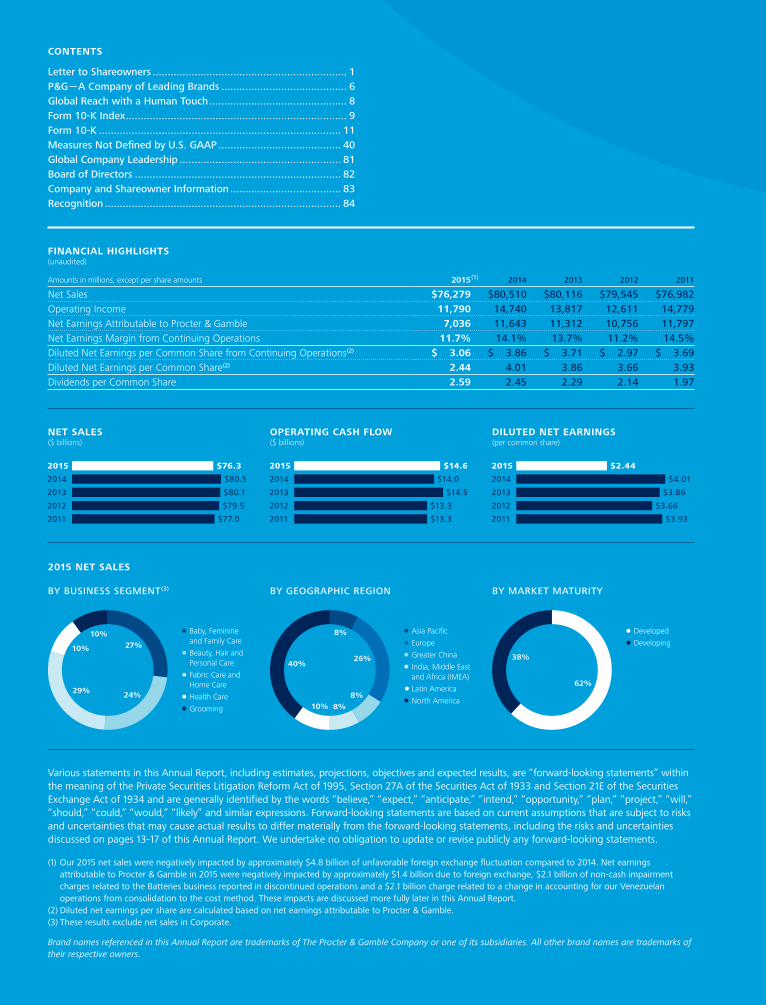
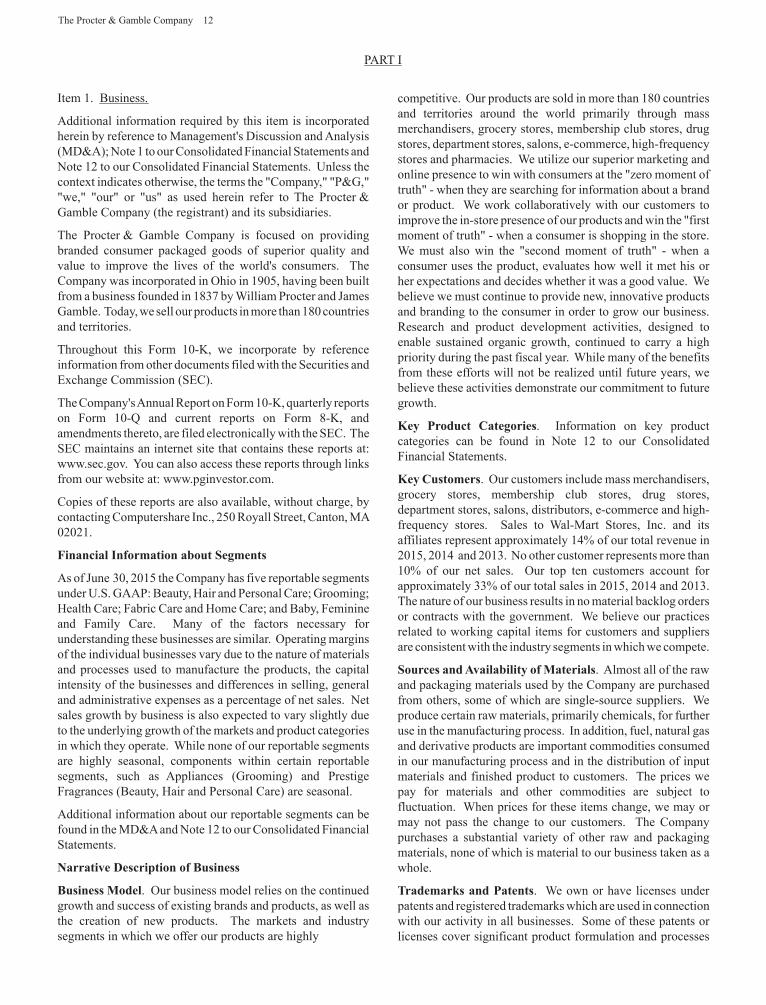
FINANCIAL HIGHLIGHTS(unaudited)
Amounts in millions, except per share amounts 2015 (1) 2014 2013 2012 2011
Net Sales $76,279 $80,510 $80,116 $79,545 $76,982 Operating Income 11,790 14,740 13,817 12,611 14,779 Net Earnings Attributable to Procter & Gamble 7,036 11,643 11,312 10,756 11,797 Net Earnings Margin from Continuing Operations 11.7% 14.1% 13.7% 11.2% 14.5%Diluted Net Earnings per Common Share from Continuing Operations (2) $ 3.06 $ 3.86 $ 3.71 $ 2.97 $ 3.69Diluted Net Earnings per Common Share (2) 2.44 4.01 3.86 3.66 3.93Dividends per Common Share 2.59 2.45 2.29 2.14 1.97
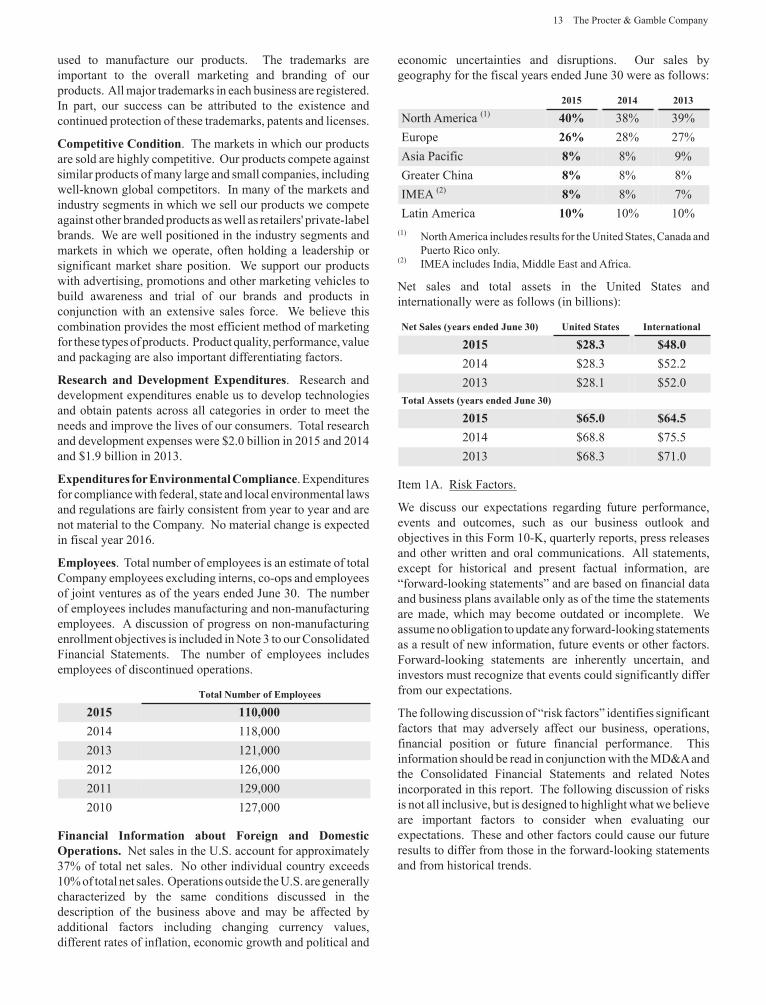
NET SALES($ billions)
OPERATING CASH FLOW($ billions)
DILUTED NET EARNINGS(per common share)
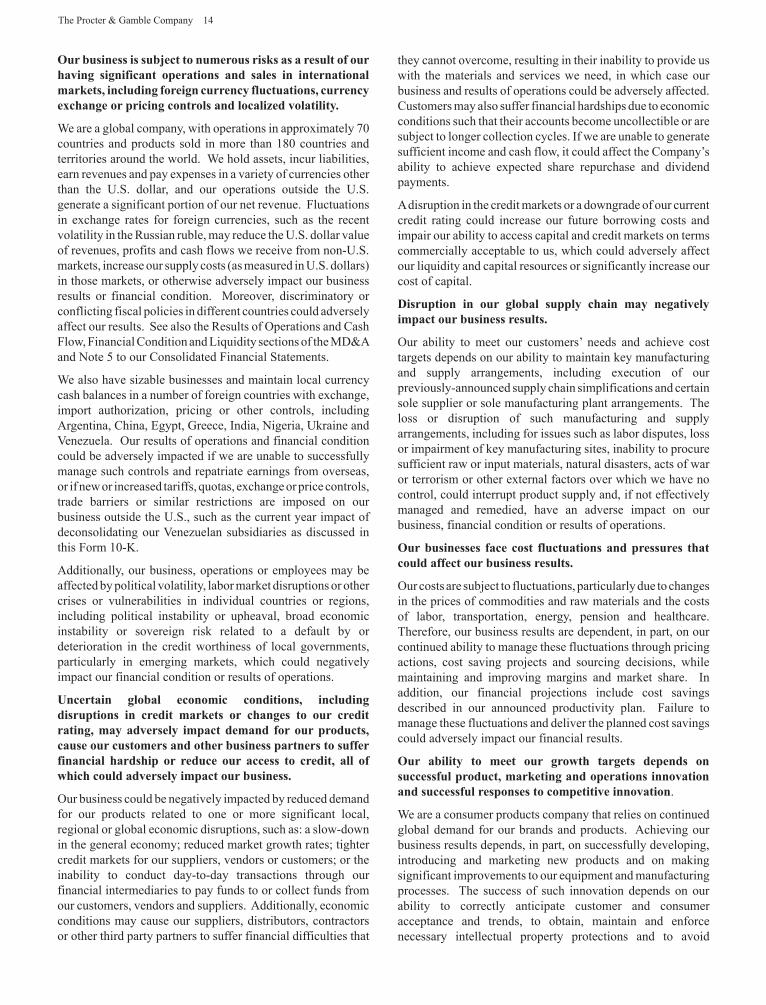
2015 NET SALES
BY BUSINESS SEGMENT(3) BY GEOGRAPHIC REGION BY MARKET MATURITY
10%
10%27%
24%29%
Baby, Feminineand Family Care
Beauty, Hair andPersonal Care
Fabric Care andHome Care
Health Care
Grooming
40%
8%
26%
8%
8%10%
Asia Pacific
Europe
Greater China
India, Middle Eastand Africa (IMEA)
Latin America
North America
38%
62%
Developed
Developing
CONTENTS
Letter to Shareowners ................................................................. 1P&G — A Company of Leading Brands .......................................... 6Global Reach with a Human Touch .............................................. 8 Form 10-K Index .......................................................................... 9Form 10-K ................................................................................. 11Measures Not Defined by U.S. GAAP ......................................... 40Global Company Leadership ...................................................... 81Board of Directors ..................................................................... 82Company and Shareowner Information ..................................... 83Recognition ............................................................................... 84
(1) Our 2015 net sales were negatively impacted by approximately $4.8 billion of unfavorable foreign exchange fluctuation compared to 2014. Net earnings attributable to Procter & Gamble in 2015 were negatively impacted by approximately $1.4 billion due to foreign exchange, $2.1 billion of non-cash impairment charges related to the Batteries business reported in discontinued operations and a $2.1 billion charge related to a change in accounting for our Venezuelan operations from consolidation to the cost method. These impacts are discussed more fully later in this Annual Report.
(2) Diluted net earnings per share are calculated based on net earnings attributable to Procter & Gamble. (3) These results exclude net sales in Corporate.
Brand names referenced in this Annual Report are trademarks of The Procter & Gamble Company or one of its subsidiaries. All other brand names are trademarks of their respective owners.
Various statements in this Annual Report, including estimates, projections, objectives and expected results, are “forward-looking statements” within the meaning of the Private Securities Litigation Reform Act of 1995, Section 27A of the Securities Act of 1933 and Section 21E of the Securities Exchange Act of 1934 and are generally identified by the words “believe,” “expect,” “anticipate,” “intend,” “opportunity,” “plan,” “project,” “will,” “should,” “could,” “would,” “likely” and similar expressions. Forward-looking statements are based on current assumptions that are subject to risks and uncertainties that may cause actual results to differ materially from the forward-looking statements, including the risks and uncertainties discussed on pages 13–17 of this Annual Report. We undertake no obligation to update or revise publicly any forward-looking statements.
A.G. LAFLEY
Chairman of the Board, President and
Chief Executive Officer
Dear Shareowners,Fiscal 2015 was a tough year due to weakening developing market economics and the unprecedented negative impact of foreign exchange. Because we are a dollar-denominated company headquartered in the U.S., and given the reality of the geographic footprint of our business — with significant exposures in markets such as Brazil, Japan and Russia — Company worldwide sales and profits were negatively impacted by foreign exchange.
All-in sales were down 5%, including the negative 6-point impact of foreign exchange.
Organic sales grew 1%. Organic sales for our 10 core categories grew 2%, about one point below underlying market growth.
On an all-in GAAP basis, earnings per share were $2.44, down due to significant one-time charges and restructuring costs. Core earnings per share were $4.02, down 2%, including a 13-point, $1.5 billion negative impact of foreign exchange. On a constant currency basis, core earnings per share were up 11%.
Despite the sales and earnings pressures, we continued to generate strong adjusted free cash flow of $11.6 billion, increased the dividend for the 59th year in a row, and returned $11.9 billion to shareowners — $7.3 billion in dividends and $4.6 billion in share repurchase. Over the past five years, we’ve returned $60 billion to shareowners — $12 billion a year on average. We have announced our intention to return up to $70 billion to shareowners over the next four years through a combination of dividend payments, share retirement and share repurchase.
Building a Better CompanyThis year, P&G will be 178 years old. A company does not last for that long if its management is not willing to change anything and everything, except for its purpose and core values, to serve consumers and create value for shareowners.
We are leading the most comprehensive series of changes in the Company’s history. We are putting the strategies and capabilities in place to transform P&G into a faster-growing, more profitable and far simpler company.
We are recommitting ourselves to putting the consumer at the center of everything we do. The purpose of any business is to create a consumer and to serve that consumer better than anyone else can. That’s why we’re investing in capabilities to understand consumer needs better than ever. That’s why we’re investing in creating and building brands that consumers prefer. And that’s why we’re investing in innovative products that deliver better performance, quality, experiences and value.
As we rededicate ourselves to the fundamentals of consumer-preferred brands and products, what has changed at P&G? What’s different, and how are we building a better P&G?
A More Focused Business Portfolio We conducted a comprehensive diagnosis to answer a fundamental strategic question: Which businesses should P&G be in? We chose 10 business categories where P&G understands consumers and has leading market positions, strong brands, differentiated products and business models proven to grow and create value. These 10 categories have been growing faster, and their operating margins are higher than those of the total Company. Their sales and profits are highly concentrated in the top consumer markets around the world. Yet they have significant growth opportunity in big, developed countries such as the U.S.,
We are putting the strategies and capabilities in place to transform P&G into a faster-growing, more profitable and far simpler company.
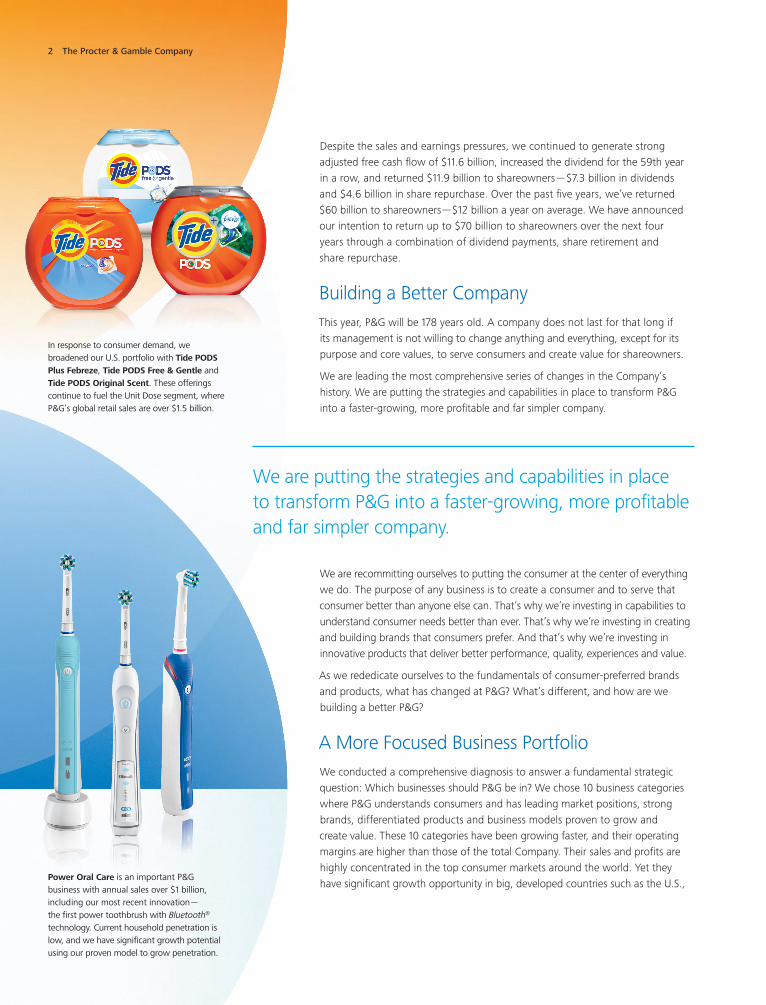
In response to consumer demand, we broadened our U.S. portfolio with Tide PODS Plus Febreze, Tide PODS Free & Gentle and Tide PODS Original Scent. These offerings continue to fuel the Unit Dose segment, where P&G’s global retail sales are over $1.5 billion.
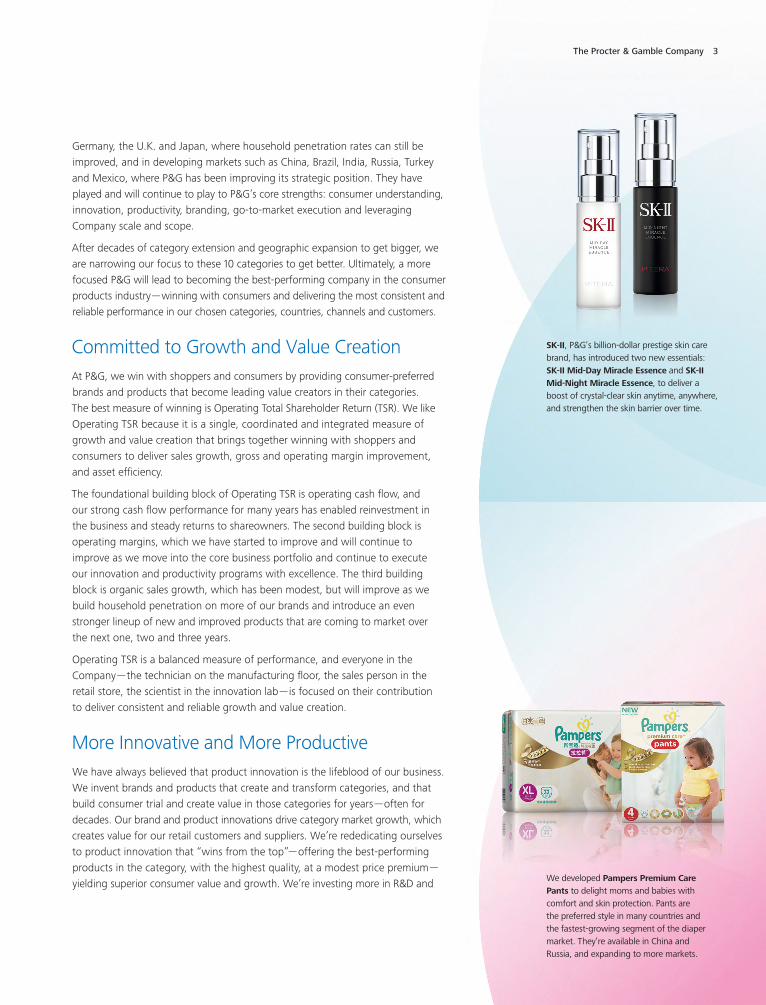
Power Oral Care is an important P&G business with annual sales over $1 billion, including our most recent innovation — the first power toothbrush with Bluetooth® technology. Current household penetration is low, and we have significant growth potential using our proven model to grow penetration.
2 The Procter & Gamble Company
Germany, the U.K. and Japan, where household penetration rates can still be improved, and in developing markets such as China, Brazil, India, Russia, Turkey and Mexico, where P&G has been improving its strategic position. They have played and will continue to play to P&G’s core strengths: consumer understanding, innovation, productivity, branding, go-to-market execution and leveraging Company scale and scope.
After decades of category extension and geographic expansion to get bigger, we are narrowing our focus to these 10 categories to get better. Ultimately, a more focused P&G will lead to becoming the best-performing company in the consumer products industry — winning with consumers and delivering the most consistent and reliable performance in our chosen categories, countries, channels and customers.
Committed to Growth and Value Creation At P&G, we win with shoppers and consumers by providing consumer-preferred brands and products that become leading value creators in their categories. The best measure of winning is Operating Total Shareholder Return (TSR). We like Operating TSR because it is a single, coordinated and integrated measure of growth and value creation that brings together winning with shoppers and consumers to deliver sales growth, gross and operating margin improvement, and asset efficiency.
The foundational building block of Operating TSR is operating cash flow, and our strong cash flow performance for many years has enabled reinvestment in the business and steady returns to shareowners. The second building block is operating margins, which we have started to improve and will continue to improve as we move into the core business portfolio and continue to execute our innovation and productivity programs with excellence. The third building block is organic sales growth, which has been modest, but will improve as we build household penetration on more of our brands and introduce an even stronger lineup of new and improved products that are coming to market over the next one, two and three years.
Operating TSR is a balanced measure of performance, and everyone in the Company — the technician on the manufacturing floor, the sales person in the retail store, the scientist in the innovation lab — is focused on their contribution to deliver consistent and reliable growth and value creation.
More Innovative and More ProductiveWe have always believed that product innovation is the lifeblood of our business. We invent brands and products that create and transform categories, and that build consumer trial and create value in those categories for years — often for decades. Our brand and product innovations drive category market growth, which creates value for our retail customers and suppliers. We’re rededicating ourselves to product innovation that “wins from the top”— offering the best-performing products in the category, with the highest quality, at a modest price premium — yielding superior consumer value and growth. We’re investing more in R&D and
SK-II, P&G’s billion-dollar prestige skin care brand, has introduced two new essentials: SK-II Mid-Day Miracle Essence and SK-II Mid-Night Miracle Essence, to deliver a boost of crystal-clear skin anytime, anywhere, and strengthen the skin barrier over time.
We developed Pampers Premium Care Pants to delight moms and babies with comfort and skin protection. Pants are the preferred style in many countries and the fastest-growing segment of the diaper market. They’re available in China and Russia, and expanding to more markets.
The Procter & Gamble Company 3
meaningful product innovation. Early examples include Pampers Swaddlers and Pants, Tide and Ariel PODS, Downy Unstopables, Pantene conditioners with advanced Pro-V science, Gillette FlexBall and Venus Swirl, and Oral-B Powerbrush. Each of these product innovations is building or is expected to build its category and brand sales — and there are more to come.
Innovation is our lifeblood, but what has changed is the realization that we cannot deliver consistent and reliable growth and value creation without continuous improvement in productivity. We are implementing the biggest supply chain redesign in the Company’s history. We are moving to fewer categories, brands, initiatives, product lines and SKUs. We are consolidating to fewer plants, agencies, suppliers and organizations. We are focusing on fewer priorities and activities. This is leading to lower costs in overhead, cost-of-goods-sold, marketing and trade spending. In turn, this is driving more focus and more savings to reinvest in accelerating growth of the leading brands, the most significant product innovations, and the countries and customers with the highest potential for sales, profit and cash growth.
Better ExecutionWe are rededicating ourselves to the power of execution. We are raising our standards to be the best at execution. We are renewing focus on gaining trial among consumers at the point of market entry. We are recommitting to superior advertising to create awareness and sampling clearly superior-performing products to attract consumers to our brands. We are investing in our sales force to build profitable distribution and shelf assortment. We are investing in a more agile, flexible and faster distribution network to reduce out-of-stocks and optimize inventory. And we are renewing our manufacturing operations to improve quality and to accelerate innovation at lower cash, capital and operating costs. Execution is the only strategy a consumer sees, and we intend to be the best.
Better BalanceP&G is a company that needs balance to win. Whenever we get out of balance, we underperform. We win when we deliver balanced sales growth and profit growth. We win when we leverage both innovation and productivity. We win when we have clear strategies and execute with excellence. Consumers and shareowners expect balance from P&G. We are making changes to achieve this balance, to deliver consistent and reliable growth and value creation for the short-, mid- and long-term.
Stronger OwnershipPersonal leadership, accountability and ownership have always been core values for P&G people. But as a company becomes bigger, more global and more complex, it can become more difficult for individuals to feel strong personal ownership in their connection to business unit success. We have simplified the organization to bring a higher level of business ownership to each business leader and to
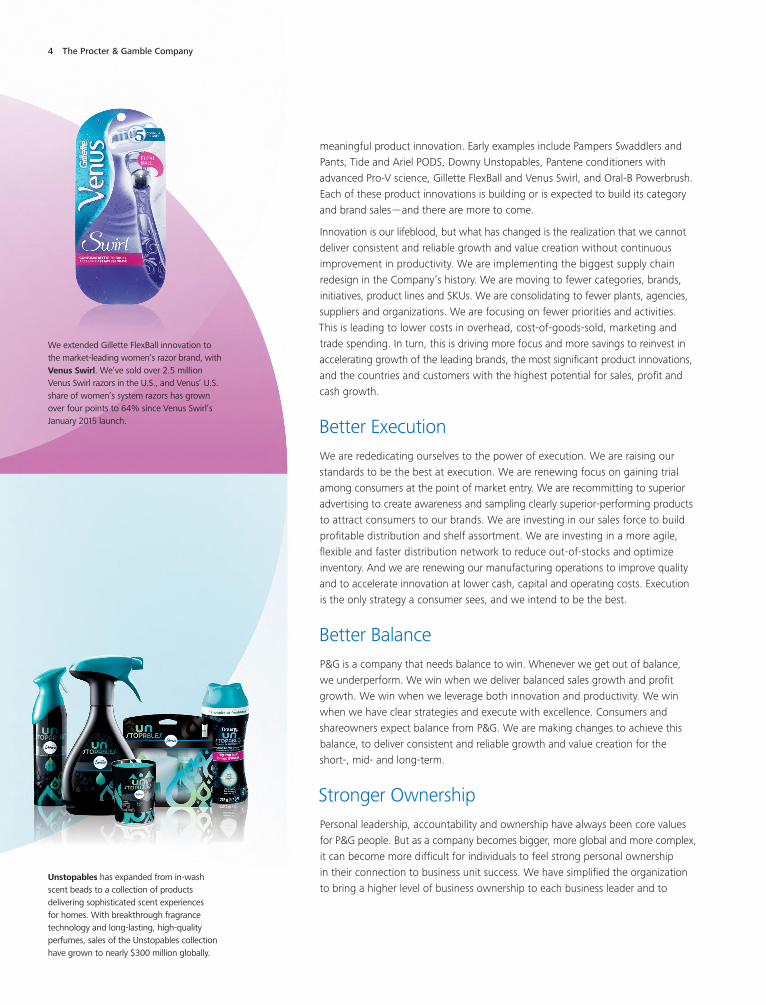
We extended Gillette FlexBall innovation to the market-leading women’s razor brand, with Venus Swirl. We’ve sold over 2.5 million Venus Swirl razors in the U.S., and Venus’ U.S. share of women’s system razors has grown over four points to 64% since Venus Swirl’s January 2015 launch.
Unstopables has expanded from in-wash scent beads to a collection of products delivering sophisticated scent experiences for homes. With breakthrough fragrance technology and long-lasting, high-quality perfumes, sales of the Unstopables collection have grown to nearly $300 million globally.
4 The Procter & Gamble Company
every P&G person. We have linked individual performance to each person’s contribution to Operating TSR at every level of the Company. The intent is for P&G people to be engaged in serving consumers and shoppers, driving product innovation and productivity, sourcing and distributing brands and products, and executing programs to win with consumers and shareowners — many of whom are P&G employees.
Strong LeadershipOn November 1, David Taylor will become P&G’s next CEO. David is an accomplished leader with 35 years of proven results in many of P&G’s businesses and functions in multiple markets around the world. His breadth of experience and track record of success are strong. He is hands-on, with deep knowledge of consumers and categories. He is focused and strategic, with strong operational leadership to take action and execute with excellence. David has played a central role in working with P&G leadership, the Board and me on developing the strategies and business portfolio to win with consumers and deliver balanced growth and value creation.
As CEO, David will focus on leading P&G’s transformation with excellence. As Executive Chairman, I look forward to supporting David, the leadership team and you. I will continue to chair the Board of Directors and provide advice and counsel to David and P&G leadership on Company and business unit strategies, portfolio choices and organization decisions.
A Better P&GWe are transforming into a better P&G. The foundation is based on P&G’s Purpose, Values and Principles. The consumer is at the center of everything we do. We will win consistently with about 65 leading brands organized into 10 businesses in industry-based sectors. We will go to market in six regions through about 30 country clusters. We will create value through consumer-preferred brands and products that win at the zero, first and second moments of truth. We will play P&G’s game to our core strengths — positioned to grow again through the power of P&G brands, products and people. It won’t all happen immediately, and some quarters will be better than others — but the choices we’ve made matter. The new P&G will grow sales, profit and cash more consistently and more sustainably to create value more reliably for P&G shareowners.
A.G. LAFLEYChairman of the Board, President and Chief Executive Officer
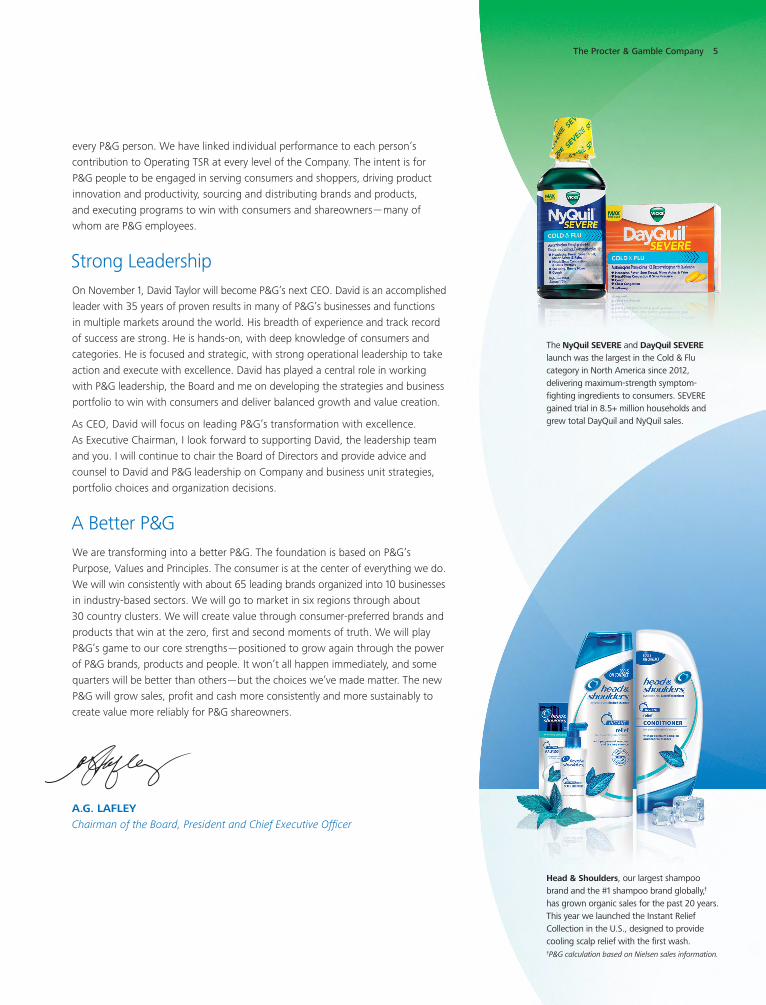
Head & Shoulders, our largest shampoo brand and the #1 shampoo brand globally,† has grown organic sales for the past 20 years. This year we launched the Instant Relief Collection in the U.S., designed to provide cooling scalp relief with the first wash.†P&G calculation based on Nielsen sales information.
The NyQuil SEVERE and DayQuil SEVERE launch was the largest in the Cold & Flu category in North America since 2012, delivering maximum-strength symptom-fighting ingredients to consumers. SEVERE gained trial in 8.5+ million households and grew total DayQuil and NyQuil sales.
The Procter & Gamble Company 5
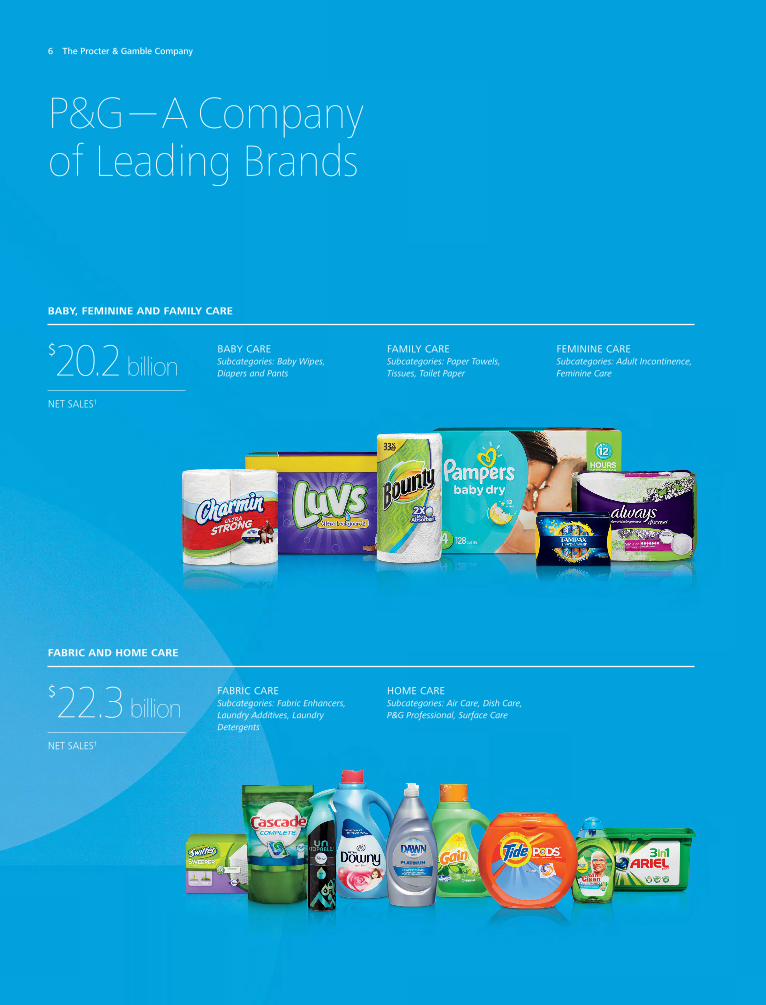
P&G — A Company of Leading Brands
$20.2 billionNET SALES†
$22.3 billionNET SALES†
BABY, FEMININE AND FAMILY CARE
BABY CARESubcategories: Baby Wipes, Diapers and Pants
FAMILY CARESubcategories: Paper Towels, Tissues, Toilet Paper
FEMININE CARESubcategories: Adult Incontinence, Feminine Care
FABRIC CARE Subcategories: Fabric Enhancers, Laundry Additives, Laundry Detergents
HOME CARESubcategories: Air Care, Dish Care, P&G Professional, Surface Care
FABRIC AND HOME CARE
6 The Procter & Gamble Company
P&G is focusing on 10 product categories with about 65 brands. These 10 categories have been growing faster, and their operating margins are higher than those of the total Company. P&G is the leader in seven of these categories and is #2 in the remaining three, with significant growth potential in all of them. They play to P&G’s core strengths: consumer understanding, innovation, productivity, branding, go-to-market execution and leveraging Company scale and scope.
We are well positioned to build consumer trial and create value in these categories, and drive category market growth, which creates value for our retail customers and suppliers.
Across the 10 categories, P&G has 21 brands with annual sales of $1 billion to about $10 billion, and 11 brands with sales of $500 million to $1 billion — many of those with billion- dollar potential.
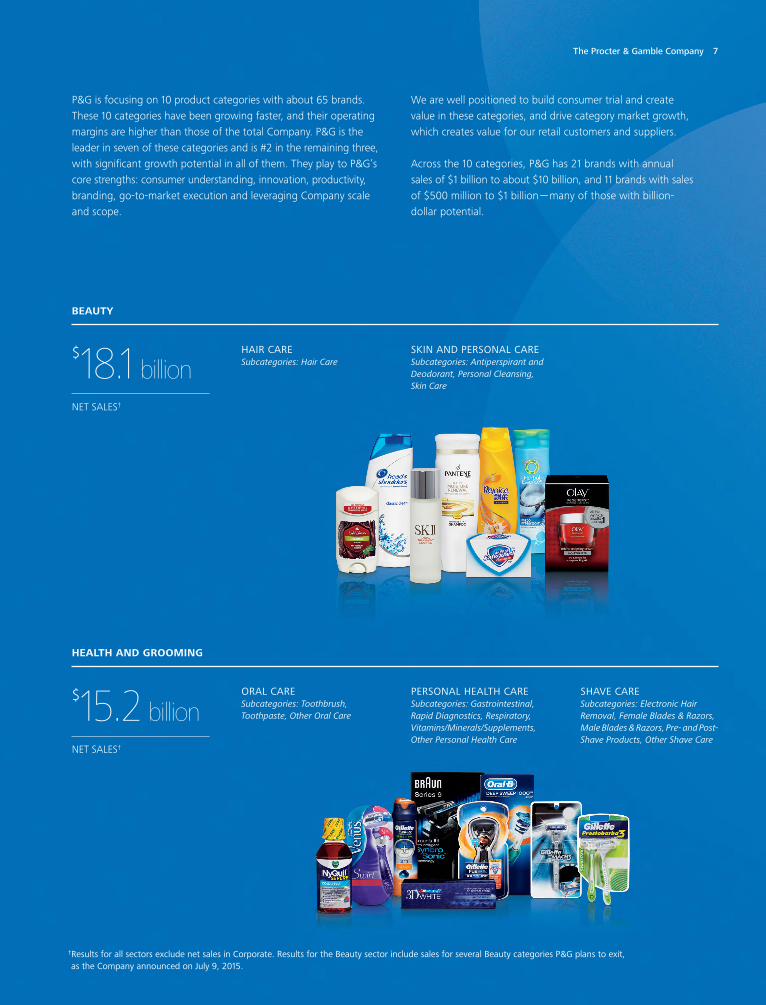
† Results for all sectors exclude net sales in Corporate. Results for the Beauty sector include sales for several Beauty categories P&G plans to exit, as the Company announced on July 9, 2015.
$18.1 billionNET SALES†
$15.2 billionNET SALES†
BEAUTY
HAIR CARESubcategories: Hair Care
SKIN AND PERSONAL CARE Subcategories: Antiperspirant and Deodorant, Personal Cleansing, Skin Care
HEALTH AND GROOMING
ORAL CARESubcategories: Toothbrush, Toothpaste, Other Oral Care
PERSONAL HEALTH CARESubcategories: Gastrointestinal, Rapid Diagnostics, Respiratory, Vitamins/Minerals/Supplements, Other Personal Health Care
SHAVE CARESubcategories: Electronic Hair Removal, Female Blades & Razors, Male Blades & Razors, Pre- and Post- Shave Products, Other Shave Care
The Procter & Gamble Company 7
ASIA PACIFIC
EUROPE
GREATER CHINA
INDIA, MIDDLE EAST AND AFRICA (IMEA)
LATIN AMERICA
NORTH AMERICA
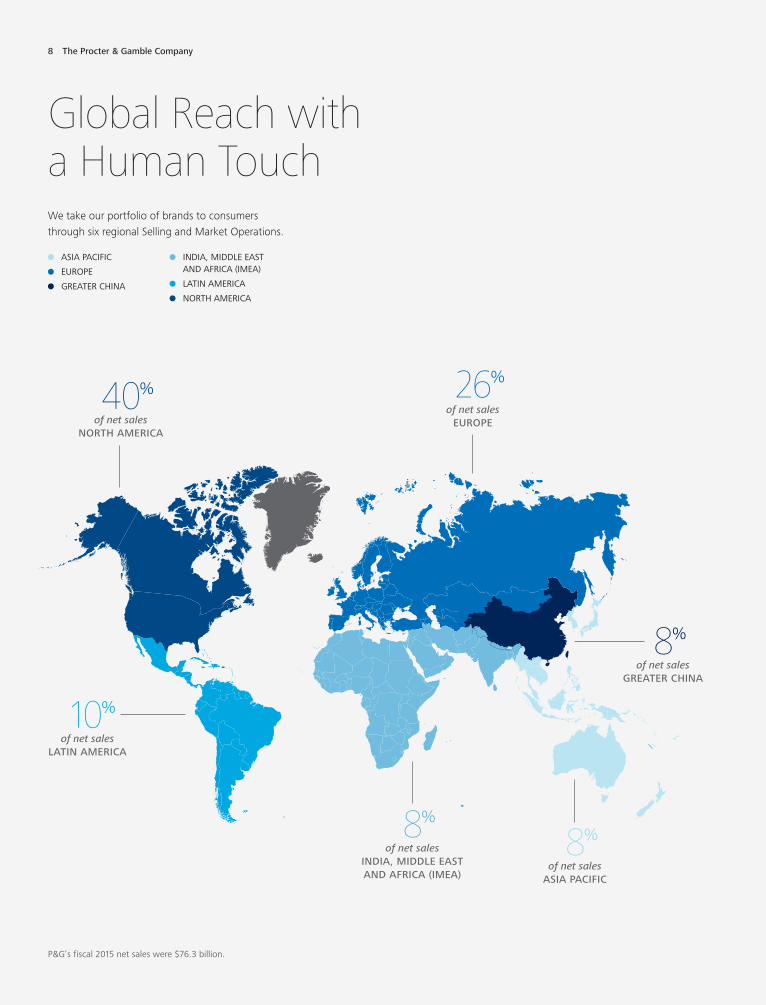
We take our portfolio of brands to consumers through six regional Selling and Market Operations.
Global Reach with a Human Touch
of net sales LATIN AMERICA
10%
of net sales INDIA, MIDDLE EAST AND AFRICA (IMEA)
8%
of net sales ASIA PACIFIC
of net sales EUROPE
26%
of net sales NORTH AMERICA
40%
of net sales GREATER CHINA
8%
P&G’s fiscal 2015 net sales were $76.3 billion.
8%
8 The Procter & Gamble Company
9 The Procter & Gamble Company
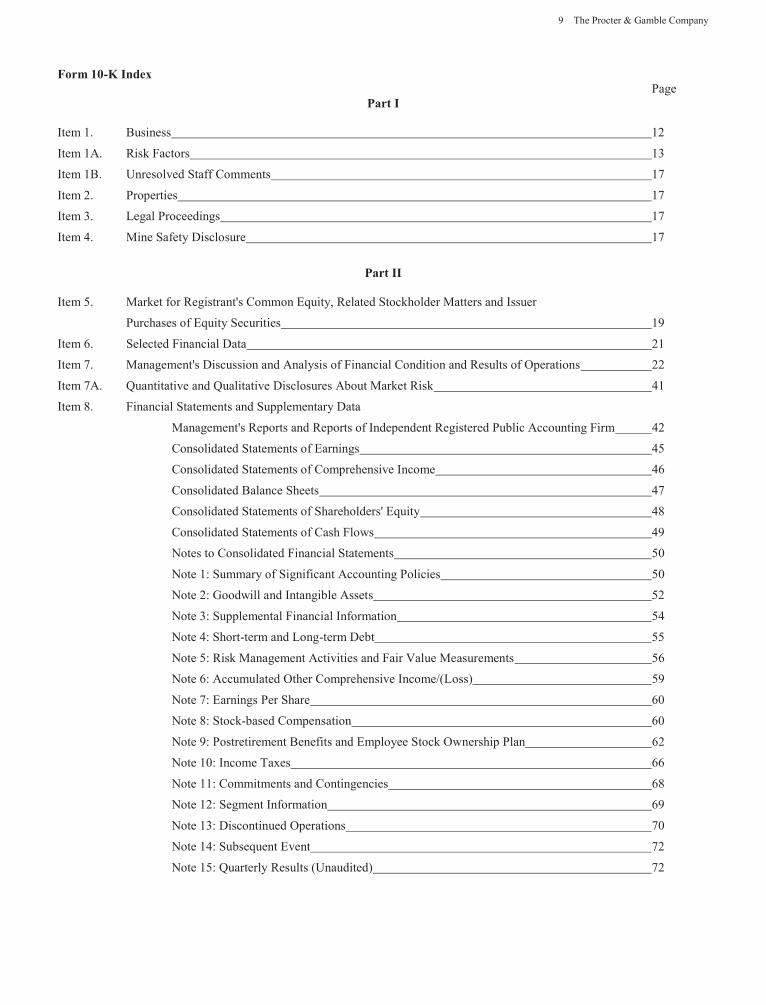
Form 10-K IndexPage
Part I
Item 1. Business 12
Item 1A. Risk Factors 13
Item 1B. Unresolved Staff Comments 17
Item 2. Properties 17
Item 3. Legal Proceedings 17
Item 4. Mine Safety Disclosure 17
Part II
Item 5. Market for Registrant's Common Equity, Related Stockholder Matters and Issuer
Purchases of Equity Securities 19
Item 6. Selected Financial Data 21
Item 7. Management's Discussion and Analysis of Financial Condition and Results of Operations 22
Item 7A. Quantitative and Qualitative Disclosures About Market Risk 41
Item 8. Financial Statements and Supplementary Data
Management's Reports and Reports of Independent Registered Public Accounting Firm 42
Consolidated Statements of Earnings 45
Consolidated Statements of Comprehensive Income 46
Consolidated Balance Sheets 47
Consolidated Statements of Shareholders' Equity 48
Consolidated Statements of Cash Flows 49
Notes to Consolidated Financial Statements 50
Note 1: Summary of Significant Accounting Policies 50
Note 2: Goodwill and Intangible Assets 52
Note 3: Supplemental Financial Information 54
Note 4: Short-term and Long-term Debt 55
Note 5: Risk Management Activities and Fair Value Measurements 56
Note 6: Accumulated Other Comprehensive Income/(Loss) 59
Note 7: Earnings Per Share 60
Note 8: Stock-based Compensation 60
Note 9: Postretirement Benefits and Employee Stock Ownership Plan 62
Note 10: Income Taxes 66
Note 11: Commitments and Contingencies 68
Note 12: Segment Information 69
Note 13: Discontinued Operations 70
Note 14: Subsequent Event 72
Note 15: Quarterly Results (Unaudited) 72
The Procter & Gamble Company 10
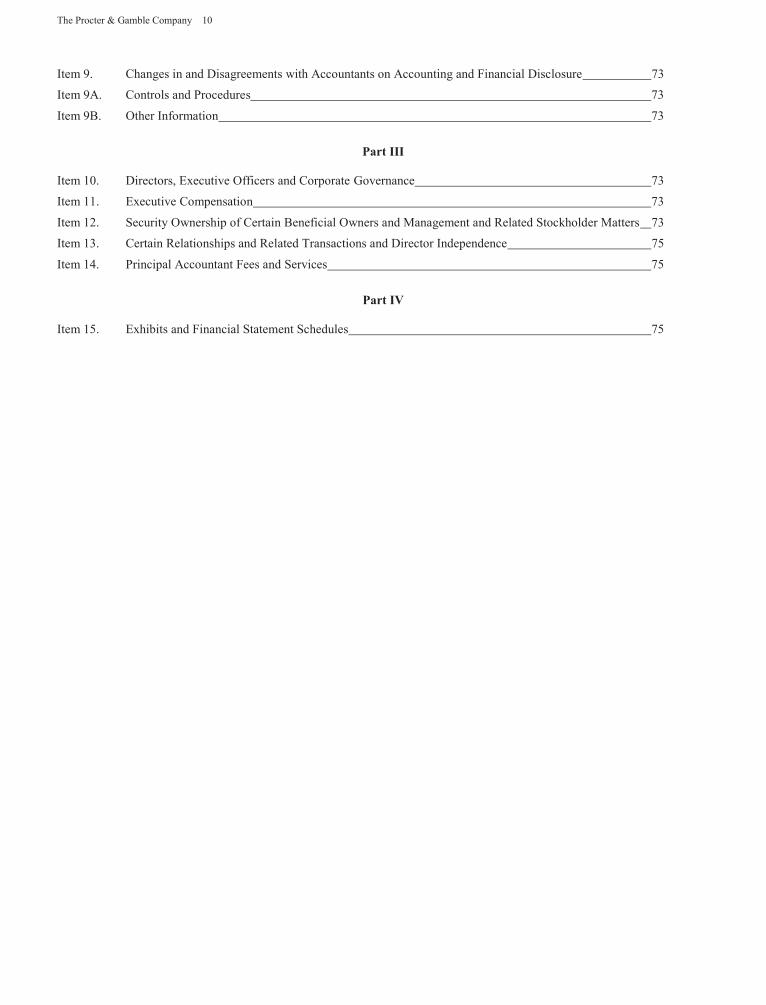
Item 9. Changes in and Disagreements with Accountants on Accounting and Financial Disclosure 73
Item 9A. Controls and Procedures 73
Item 9B. Other Information 73
Part III
Item 10. Directors, Executive Officers and Corporate Governance 73
Item 11. Executive Compensation 73
Item 12. Security Ownership of Certain Beneficial Owners and Management and Related Stockholder Matters 73
Item 13. Certain Relationships and Related Transactions and Director Independence 75
Item 14. Principal Accountant Fees and Services 75
Part I
Item 15. Exhibits and Financial Statement Schedules 75
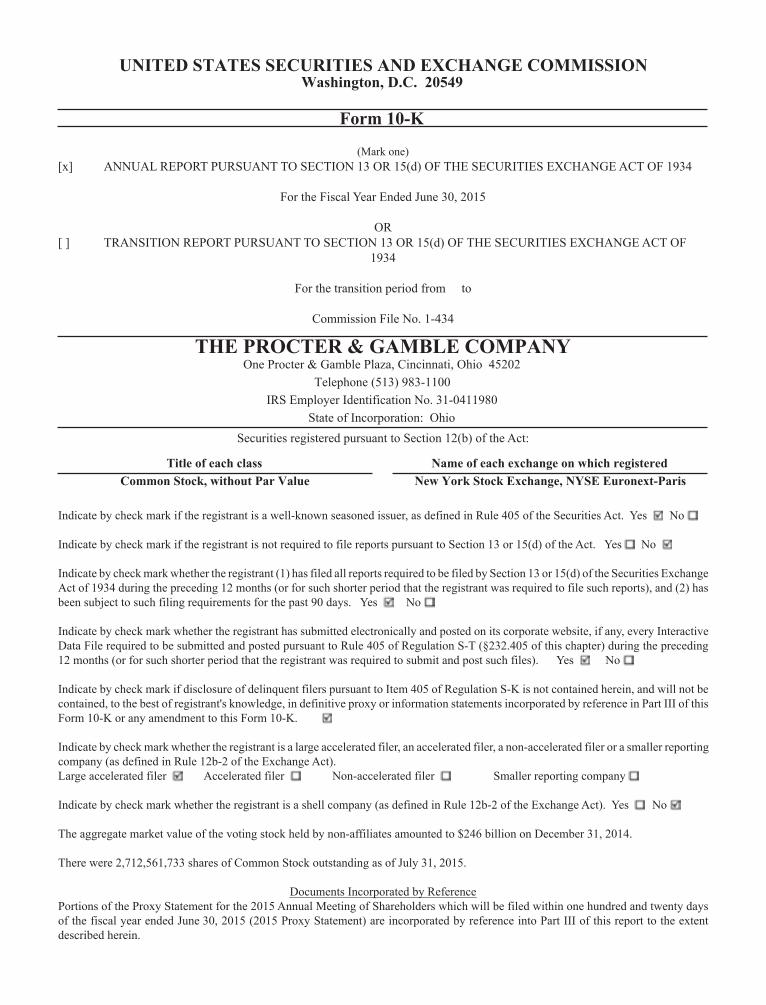
UNITED STATES SECURITIES AND EXCHANGE COMMISSIONWashington, D.C. 20549
Form 10-K
(Mark one)[x] ANNUAL REPORT PURSUANT TO SECTION 13 OR 15(d) OF THE SECURITIES EXCHANGE ACT OF 1934
For the Fiscal Year Ended June 30, 2015
OR[ ] TRANSITION REPORT PURSUANT TO SECTION 13 OR 15(d) OF THE SECURITIES EXCHANGE ACT OF
1934
For the transition period from to
Commission File No. 1-434
THE PROCTER & GAMBLE COMPANYOne Procter & Gamble Plaza, Cincinnati, Ohio 45202
Telephone (513) 983-1100IRS Employer Identification No. 31-0411980
State of Incorporation: OhioSecurities registered pursuant to Section 12(b) of the Act:
Title of each class Name of each exchange on which registeredCommon Stock, without Par Value New York Stock Exchange, NYSE Euronext-Paris
Indicate by check mark if the registrant is a well-known seasoned issuer, as defined in Rule 405 of the Securities Act. Yes No
Indicate by check mark if the registrant is not required to file reports pursuant to Section 13 or 15(d) of the Act. Yes No
Indicate by check mark whether the registrant (1) has filed all reports required to be filed by Section 13 or 15(d) of the Securities ExchangeAct of 1934 during the preceding 12 months (or for such shorter period that the registrant was required to file such reports), and (2) hasbeen subject to such filing requirements for the past 90 days. Yes No
Indicate by check mark whether the registrant has submitted electronically and posted on its corporate website, if any, every InteractiveData File required to be submitted and posted pursuant to Rule 405 of Regulation S-T (§232.405 of this chapter) during the preceding12 months (or for such shorter period that the registrant was required to submit and post such files). Yes No
Indicate by check mark if disclosure of delinquent filers pursuant to Item 405 of Regulation S-K is not contained herein, and will not becontained, to the best of registrant's knowledge, in definitive proxy or information statements incorporated by reference in Part III of thisForm 10-K or any amendment to this Form 10-K.
Indicate by check mark whether the registrant is a large accelerated filer, an accelerated filer, a non-accelerated filer or a smaller reportingcompany (as defined in Rule 12b-2 of the Exchange Act).Large accelerated filer Accelerated filer Non-accelerated filer Smaller reporting company
Indicate by check mark whether the registrant is a shell company (as defined in Rule 12b-2 of the Exchange Act). Yes No
The aggregate market value of the voting stock held by non-affiliates amounted to $246 billion on December 31, 2014.
There were 2,712,561,733 shares of Common Stock outstanding as of July 31, 2015.
Documents Incorporated by ReferencePortions of the Proxy Statement for the 2015 Annual Meeting of Shareholders which will be filed within one hundred and twenty daysof the fiscal year ended June 30, 2015 (2015 Proxy Statement) are incorporated by reference into Part III of this report to the extentdescribed herein.
The Procter & Gamble Company 12
PART I
Item 1. usiness.
Additional information required by this item is incorporatedherein by reference to Management's Discussion and Analysis(MD&A) Note 1 to our Consolidated Financial Statements andNote 12 to our Consolidated Financial Statements. Unless thecontext indicates otherwise, the terms the Company, P&G,we, our or us as used herein refer to The Procter &
Gamble Company (the registrant) and its subsidiaries.
The Procter & Gamble Company is focused on providingbranded consumer packaged goods of superior quality andvalue to improve the lives of the world's consumers. TheCompany was incorporated in Ohio in 1905, having been builtfrom a business founded in 1837 by illiam Procter and JamesGamble. Today, we sell our products in more than 180 countriesand territories.
Throughout this Form 10-K, we incorporate by referenceinformation from other documents filed with the Securities andExchange Commission (SEC).
The Company'sAnnual Report on Form 10-K, quarterly reportson Form 10- and current reports on Form 8-K, andamendments thereto, are filed electronically with the SEC. TheSEC maintains an internet site that contains these reports at:www.sec.gov. You can also access these reports through linksfrom our website at: www.pginvestor.com.
Copies of these reports are also available, without charge, bycontacting Computershare Inc., 250 Royall Street, Canton, MA02021.
Financial Information a out Segments
As of June 30, 2015 the Company has five reportable segmentsunder U.S. GAAP: eauty, Hair and Personal Care GroomingHealth Care Fabric Care and Home Care and aby, Feminineand Family Care. Many of the factors necessary forunderstanding these businesses are similar. Operating marginsof the individual businesses vary due to the nature of materialsand processes used to manufacture the products, the capitalintensity of the businesses and differences in selling, generaland administrative expenses as a percentage of net sales. Netsales growth by business is also expected to vary slightly dueto the underlying growth of the markets and product categoriesin which they operate. hile none of our reportable segmentsare highly seasonal, components within certain reportablesegments, such as Appliances (Grooming) and PrestigeFragrances ( eauty, Hair and Personal Care) are seasonal.
Additional information about our reportable segments can befound in the MD&Aand Note 12 to our Consolidated FinancialStatements.
Narrati e Descri tion of Business
Business Model. Our business model relies on the continuedgrowth and success of existing brands and products, as well asthe creation of new products. The markets and industrysegments in which we offer our products are highly
competitive. Our products are sold in more than 180 countriesand territories around the world primarily through massmerchandisers, grocery stores, membership club stores, drugstores, department stores, salons, e-commerce, high-frequencystores and pharmacies. e utilize our superior marketing andonline presence to win with consumers at the zero moment oftruth - when they are searching for information about a brandor product. e work collaboratively with our customers toimprove the in-store presence of our products and win the firstmoment of truth - when a consumer is shopping in the store.
e must also win the second moment of truth - when aconsumer uses the product, evaluates how well it met his orher expectations and decides whether it was a good value. ebelieve we must continue to provide new, innovative productsand branding to the consumer in order to grow our business.Research and product development activities, designed toenable sustained organic growth, continued to carry a highpriority during the past fiscal year. hile many of the benefitsfrom these efforts will not be realized until future years, webelieve these activities demonstrate our commitment to futuregrowth.
Ke Product Categories. Information on key productcategories can be found in Note 12 to our ConsolidatedFinancial Statements.
Ke Customers. Our customers include mass merchandisers,grocery stores, membership club stores, drug stores,department stores, salons, distributors, e-commerce and high-frequency stores. Sales to al-Mart Stores, Inc. and itsaffiliates represent approximately 14 of our total revenue in2015, 2014 and 2013. No other customer represents more than10 of our net sales. Our top ten customers account forapproximately 33 of our total sales in 2015, 2014 and 2013.The nature of our business results in no material backlog ordersor contracts with the government. e believe our practicesrelated to working capital items for customers and suppliersare consistent with the industry segments in which we compete.
Sources and A aila ilit of Materials. Almost all of the rawand packaging materials used by the Company are purchasedfrom others, some of which are single-source suppliers. eproduce certain raw materials, primarily chemicals, for furtheruse in the manufacturing process. In addition, fuel, natural gasand derivative products are important commodities consumedin our manufacturing process and in the distribution of inputmaterials and finished product to customers. The prices wepay for materials and other commodities are subject tofluctuation. hen prices for these items change, we may ormay not pass the change to our customers. The Companypurchases a substantial variety of other raw and packagingmaterials, none of which is material to our business taken as awhole.
Trademarks and Patents. e own or have licenses underpatents and registered trademarks which are used in connectionwith our activity in all businesses. Some of these patents orlicenses cover significant product formulation and processes
13 The Procter & Gamble Company
used to manufacture our products. The trademarks areimportant to the overall marketing and branding of ourproducts. All major trademarks in each business are registered.In part, our success can be attributed to the existence andcontinued protection of these trademarks, patents and licenses.
Com etiti e Condition. The markets in which our productsare sold are highly competitive. Our products compete againstsimilar products of many large and small companies, includingwell-known global competitors. In many of the markets andindustry segments in which we sell our products we competeagainst other branded products as well as retailers' private-labelbrands. e are well positioned in the industry segments andmarkets in which we operate, often holding a leadership orsignificant market share position. e support our productswith advertising, promotions and other marketing vehicles tobuild awareness and trial of our brands and products inconjunction with an extensive sales force. e believe thiscombination provides the most efficient method of marketingfor these types of products. Product quality, performance, valueand packaging are also important differentiating factors.
Research and De elo ment Ex enditures. Research anddevelopment expenditures enable us to develop technologiesand obtain patents across all categories in order to meet theneeds and improve the lives of our consumers. Total researchand development expenses were $2.0 billion in 2015 and 2014and $1.9 billion in 2013.
Ex enditures forEn ironmental Com liance. Expendituresfor compliance with federal, state and local environmental lawsand regulations are fairly consistent from year to year and arenot material to the Company. No material change is expectedin fiscal year 2016.
Em lo ees. Total number of employees is an estimate of totalCompany employees excluding interns, co-ops and employeesof joint ventures as of the years ended June 30. The numberof employees includes manufacturing and non-manufacturingemployees. A discussion of progress on non-manufacturingenrollment objectives is included in Note 3 to our ConsolidatedFinancial Statements. The number of employees includesemployees of discontinued operations.
Total Num er of Em lo ees
2015 110,0002014 118,0002013 121,0002012 126,0002011 129,0002010 127,000
Financial Information a out Foreign and DomesticO erations. Net sales in the U.S. account for approximately37 of total net sales. No other individual country exceeds10 of total net sales. Operations outside the U.S. are generallycharacterized by the same conditions discussed in thedescription of the business above and may be affected byadditional factors including changing currency values,different rates of inflation, economic growth and political and
economic uncertainties and disruptions. Our sales bygeography for the fiscal years ended June 30 were as follows:
2015 2014 201
North America (1) 40 38 39Europe 2 28 27Asia Pacific 8 9Greater China 8 8IMEA (2) 8 7Latin America 10 10 10
(1) NorthAmerica includes results for the United States, Canada andPuerto Rico only.
(2) IMEA includes India, Middle East and Africa.
Net sales and total assets in the United States andinternationally were as follows (in billions):
Net Sales ears ended une 0 United States International
2015 2 . 4 .02014 $28.3 $52.22013 $28.1 $52.0
Total Assets ears ended une 0
2015 5.0 4.52014 $68.8 $75.52013 $68.3 $71.0
Item 1A. Risk Factors.
e discuss our expectations regarding future performance,events and outcomes, such as our business outlook andobjectives in this Form 10-K, quarterly reports, press releasesand other written and oral communications. All statements,except for historical and present factual information, areforward-looking statements and are based on financial data
and business plans available only as of the time the statementsare made, which may become outdated or incomplete. eassume no obligation to update any forward-looking statementsas a result of new information, future events or other factors.Forward-looking statements are inherently uncertain, andinvestors must recognize that events could significantly differfrom our expectations.
The following discussion of risk factors identifies significantfactors that may adversely affect our business, operations,financial position or future financial performance. Thisinformation should be read in conjunction with the MD&Aandthe Consolidated Financial Statements and related Notesincorporated in this report. The following discussion of risksis not all inclusive, but is designed to highlight what we believeare important factors to consider when evaluating ourexpectations. These and other factors could cause our futureresults to differ from those in the forward-looking statementsand from historical trends.
The Procter & Gamble Company 14
Our usiness is su ect to numerous risks as a result of ourha ing significant o erations and sales in internationalmarkets, including foreign currenc fluctuations, currencexchange or ricing controls and locali ed olatilit .
e are a global company, with operations in approximately 70countries and products sold in more than 180 countries andterritories around the world. e hold assets, incur liabilities,earn revenues and pay expenses in a variety of currencies otherthan the U.S. dollar, and our operations outside the U.S.generate a significant portion of our net revenue. Fluctuationsin exchange rates for foreign currencies, such as the recentvolatility in the Russian ruble, may reduce the U.S. dollar valueof revenues, profits and cash flows we receive from non-U.S.markets, increase our supply costs (as measured in U.S. dollars)in those markets, or otherwise adversely impact our businessresults or financial condition. Moreover, discriminatory orconflicting fiscal policies in different countries could adverselyaffect our results. See also the Results of Operations and CashFlow, Financial Condition and Liquidity sections of the MD&Aand Note 5 to our Consolidated Financial Statements.
e also have sizable businesses and maintain local currencycash balances in a number of foreign countries with exchange,import authorization, pricing or other controls, includingArgentina, China, Egypt, Greece, India, Nigeria, Ukraine and
enezuela. Our results of operations and financial conditioncould be adversely impacted if we are unable to successfullymanage such controls and repatriate earnings from overseas,or if new or increased tariffs, quotas, exchange or price controls,trade barriers or similar restrictions are imposed on ourbusiness outside the U.S., such as the current year impact ofdeconsolidating our enezuelan subsidiaries as discussed inthis Form 10-K.
Additionally, our business, operations or employees may beaffected by political volatility, labor market disruptions or othercrises or vulnerabilities in individual countries or regions,including political instability or upheaval, broad economicinstability or sovereign risk related to a default by ordeterioration in the credit worthiness of local governments,particularly in emerging markets, which could negativelyimpact our financial condition or results of operations.
Uncertain glo al economic conditions, includingdisru tions in credit markets or changes to our creditrating, ma ad ersel im act demand for our roducts,cause our customers and other usiness artners to sufferfinancial hardshi or reduce our access to credit, all ofwhich could ad ersel im act our usiness.
Our business could be negatively impacted by reduced demandfor our products related to one or more significant local,regional or global economic disruptions, such as: a slow-downin the general economy reduced market growth rates tightercredit markets for our suppliers, vendors or customers or theinability to conduct day-to-day transactions through ourfinancial intermediaries to pay funds to or collect funds fromour customers, vendors and suppliers. Additionally, economicconditions may cause our suppliers, distributors, contractorsor other third party partners to suffer financial difficulties that
they cannot overcome, resulting in their inability to provide uswith the materials and services we need, in which case ourbusiness and results of operations could be adversely affected.Customers may also suffer financial hardships due to economicconditions such that their accounts become uncollectible or aresubject to longer collection cycles. If we are unable to generatesufficient income and cash flow, it could affect the Company sability to achieve expected share repurchase and dividendpayments.
Adisruption in the credit markets or a downgrade of our currentcredit rating could increase our future borrowing costs andimpair our ability to access capital and credit markets on termscommercially acceptable to us, which could adversely affectour liquidity and capital resources or significantly increase ourcost of capital.
Disru tion in our glo al su l chain ma negati elim act our usiness results.
Our ability to meet our customers needs and achieve costtargets depends on our ability to maintain key manufacturingand supply arrangements, including execution of ourpreviously-announced supply chain simplifications and certainsole supplier or sole manufacturing plant arrangements. Theloss or disruption of such manufacturing and supplyarrangements, including for issues such as labor disputes, lossor impairment of key manufacturing sites, inability to procuresufficient raw or input materials, natural disasters, acts of waror terrorism or other external factors over which we have nocontrol, could interrupt product supply and, if not effectivelymanaged and remedied, have an adverse impact on ourbusiness, financial condition or results of operations.
Our usinesses face cost fluctuations and ressures thatcould affect our usiness results.
Our costs are subject to fluctuations, particularly due to changesin the prices of commodities and raw materials and the costsof labor, transportation, energy, pension and healthcare.Therefore, our business results are dependent, in part, on ourcontinued ability to manage these fluctuations through pricingactions, cost saving projects and sourcing decisions, whilemaintaining and improving margins and market share. Inaddition, our financial projections include cost savingsdescribed in our announced productivity plan. Failure tomanage these fluctuations and deliver the planned cost savingscould adversely impact our financial results.
Our a ilit to meet our growth targets de ends onsuccessful roduct, marketing and o erations inno ationand successful res onses to com etiti e inno ation.
e are a consumer products company that relies on continuedglobal demand for our brands and products. Achieving ourbusiness results depends, in part, on successfully developing,introducing and marketing new products and on makingsignificant improvements to our equipment and manufacturingprocesses. The success of such innovation depends on ourability to correctly anticipate customer and consumeracceptance and trends, to obtain, maintain and enforcenecessary intellectual property protections and to avoid
15 The Procter & Gamble Company
infringing upon the intellectual property rights of others. emust also be able to successfully respond to technologicaladvances made by, and intellectual property rights granted to,competitors. Failure to do so could compromise ourcompetitive position and adversely impact our results.
The a ilit to achie e our usiness o ecti es is de endenton how well we can com ete with our local and glo alcom etitors in new and existing markets and channels.
The consumer products industry is highly competitive. Acrossall of our categories, we compete against a wide variety ofglobal and local competitors. As a result, we experienceongoing competitive pressures in the environments in whichwe operate, as well as challenges in maintaining profit margins.This includes, among other things, increasing competition frommid- and lower-tier value products, including private-labelproducts, in both developed and developing markets. Toaddress these challenges, we must be able to successfullyrespond to competitive factors, including pricing, promotionalincentives and trade terms. In addition, the emergence of newsales channels and business models may affect customer andconsumer preferences as well as market dynamics. Failure tosuccessfully respond to competitive factors and effectivelycompete in new sales channels could negatively impact ourresults.
A significant change in customer relationshi s or incustomer demand for our roducts could ha e a significantim act on our usiness.
e sell most of our products via retail customers, which includemass merchandisers, grocery stores, membership club stores,drug stores, department stores, salons, distributors, e-commerce and high-frequency stores. Our success isdependent on our ability to successfully manage relationshipswith our retail trade customers, which includes our ability tooffer trade terms that are mutually acceptable and are alignedwith our pricing and profitability targets. Continuedconsolidation among our retail customers could createsignificant cost and margin pressure on our business, and ourbusiness performance could suffer if we cannot reachagreement with a key customer based on our trade terms andprinciples. Our business could also be negatively impacted ifa key customer were to significantly reduce the inventory levelof our products or experience a significant business disruption.
If the re utation of the Com an or one or more of ourrands erodes significantl , it could ha e a material im act
on our financial results.
The Company's reputation, and the reputation of our brands,form the foundation of our relationships with key stakeholdersand other constituencies, including consumers, customers andsuppliers. The quality and safety of our products are criticalto our business. Many of our brands have worldwiderecognition, and our financial success is directly dependent onthe success of our brands. The success of our brands can sufferif our marketing plans or product initiatives do not have thedesired impact on a brand's image or its ability to attractconsumers. Our results could also be negatively impacted ifone of our brands suffers a substantial impediment to its
reputation due to a significant product recall, product-relatedlitigation, allegations of product tampering or the distributionand sale of counterfeit products. Additionally, negative orinaccurate postingsor comments on social media or networkingwebsites about the Company or one of its brands could generateadverse publicity that could damage the reputation of ourbrands or the Company. If we are unable to effectively managereal or perceived issues, including concerns about safety,quality, efficacy or similar matters, sentiments toward theCompany or our products could be negatively impacted andour financial results could suffer. Our Company also devotessignificant time and resources to programs that are consistentwith our corporate values and are designed to protect andpreserve our reputation, such as social responsibility andenvironmental sustainability. If these programs are notexecuted as planned or suffer negative publicity, the Company'sreputation and financial results could be adversely impacted.
We rel on third arties in man as ects of our usiness,which creates additional risk.
Due to the scale and scope of our business, we must rely onrelationships with third parties, including our suppliers,distributors, contractors, joint venture partners or externalbusiness partners, for certain functions. If we are unable toeffectively manage our third party relationships and theagreements under which our third party partners operate, ourfinancial results could suffer. Additionally, while we havepolicies and procedures for managing these relationships, theyinherently involve a lesser degree of control over businessoperations, governance and compliance, thereby potentiallyincreasing our financial, legal, reputational and operationalrisk.
A reach of information securit , including a c ersecuritreach orfailure of one ormore ke information technolog
s stems, networks, hardware, rocesses, associated sites orser ice ro iders could ha e a material ad erse im act onour usiness or re utation.
e rely extensively on information technology (IT) systems,networks and services, including internet sites, data hostingand processing facilities and tools and other hardware, softwareand technical applications and platforms, some of which aremanaged, hosted, provided and or used by third-parties or theirvendors, to assist in conducting our business. The various usesof these IT systems, networks and services include, but are notlimited to:
ordering and managing materials from suppliersconverting materials to finished productsshipping products to customersmarketing and selling products to consumerscollecting, transmitting, transferring and storing customer,consumer, employee, vendor, investor and otherstakeholder information and personal datasummarizing and reporting results of operationshosting, processing and sharing, as appropriate,confidential and proprietary research, business plans andfinancial informationcomplying with regulatory, legal and tax requirements
The Procter & Gamble Company 16
providing data security andhandling other processes necessary to manage ourbusiness.
Numerous and evolving information security threats, includingadvanced persistent cybersecurity threats, pose a risk to thesecurity of our IT systems, networks and services, as well asthe confidentiality, availability and integrity of our data. Ascybersecurity threats rapidly evolve in sophistication andbecome more prevalent across the industry globally, theCompany is continually increasing its sensitivity and attentionto these threats. e continue to assess potential threats andmake investments seeking to address these threats, includingmonitoring of networks and systems and upgrading skills,employee training and security policies for the Company andits third-party providers. However, because the techniquesused in these attacks change frequently and may be difficult todetect for periods of time, we may face difficulties inanticipating and implementing adequate preventativemeasures. Our IT systems have been, and will likely continueto be, subject to computer viruses or other malicious codes,unauthorized access attempts, phishing and other cyber-attacks. To date, we have seen no material impact on ourbusiness or operations from these attacks however, we cannotguarantee that our security efforts will prevent breaches orbreakdowns to our or our third-party providers databases orsystems. If the IT systems, networks or service providers werely upon fail to function properly, or if we or one of our third-party providers suffer a loss, significant unavailability of ordisclosure of our business or stakeholder information, due toany number of causes, ranging from catastrophic events orpower outages to improper data handling or security breaches,and our business continuity plans do not effectively addressthese failures on a timely basis, we may be exposed toreputational, competitive and business harm as well aslitigation and regulatory action. The costs and operationalconsequences of responding to breaches and implementingremediation measures could be significant.
We must successfull manage com liance with legislation,regulation and enforcement, as well as ending legalmatters in the U.S. and a road.
Our business is subject to a wide variety of laws and regulationsacross all of the countries in which we do business, includingthose laws and regulations involving intellectual property,product liability, marketing, antitrust, privacy, environmental,employment, anti-bribery or anti-corruption (such as the U.S.Foreign Corrupt Practices Act) or other matters. Rapidlychanging laws, regulations and related interpretations,including changes in accounting standards, as well as increasedenforcement actions, create challenges for our compliance andethics programs and may alter the environment in which wedo business. If we are unable to continue to meet thesechallenges and comply with all laws, regulations and relatedinterpretations, it could negatively impact our reputation andour business results. Failure to successfully manage regulatoryand legal matters and resolve such matters without significantliability or damage to our reputation may materially adverselyimpact our results of operations and financial position.
Furthermore, if pending legal matters result in fines or costs inexcess of the amounts accrued to date, that may also materiallyimpact our results of operations and financial position.
Changes in a lica le tax regulations could negati elaffect our financial results.
The Company is subject to taxation in the U.S. and numerousforeign jurisdictions. ecause the U.S. maintains a worldwidecorporate tax system, the foreign and U.S. tax systems aresomewhat interdependent. For example, certain income thatis earned and taxed in countries outside the U.S. is not taxedin the U.S., provided those earnings are indefinitely reinvestedoutside the U.S. If those same foreign earnings are insteadrepatriated to the U.S., additional residual U.S. taxation willlikely occur, due to the U.S. s worldwide tax system and higherU.S. corporate tax rate. The U.S. is considering corporate taxreform that may significantly change the corporate tax rate andthe U.S. international tax rules. Additionally, longstandinginternational tax norms that determine each country sjurisdiction to tax cross-border international trade are evolving,such as the ase Erosion and Profit Shifting project ( EPS )currently being undertaken by the G8, G20, and Organizationfor Economic Cooperation and Development ( OECD ). Asthese and other tax laws and related regulations change, ourfinancial results could be materially impacted. Given theunpredictability of these possible changes and their potentialinterdependency, it is very difficult to assess whether theoverall effect of such potential tax changes would becumulatively positive or negative for our earnings and cashflow, but such changes could adversely impact our financialresults.
If we are una le to successfull execute our ortfolioo timi ation strateg , as well as successfull manageongoing ac uisition, oint enture and di estiture acti ities,it could ad ersel im act our usiness.
InAugust 2014, the Company announced a plan to significantlystreamline our product portfolio by divesting, discontinuing orconsolidating about 100 non-strategic brands, resulting in aportfolio of about 65 brands. The Company has announced aseries of transactions that will substantially complete this plan.It will take time to execute this plan, and our ability tosuccessfully do so could impact our results.
In addition, as a company that manages a portfolio of consumerbrands, our ongoing business model includes a certain level ofacquisition, joint venture and divestiture activities. e mustbe able to successfully manage the impacts of these activities,while at the same time delivering against our businessobjectives. Specifically, our financial results could beadversely impacted by the dilutive impacts from the loss ofearnings associated with divested brands. Our financial resultscould also be impacted in the event of acquisitions or jointventure activities if: 1) changes in the cash flows or othermarket-based assumptions cause the value of acquired assetsto fall below book value, or 2) we are not able to deliver theexpected cost and growth synergies associated with suchacquisitions and joint ventures, which could also have animpact on goodwill and intangible assets.
17 The Procter & Gamble Company
Our usiness results de end on our a ilit to successfullmanage ongoing organi ational change.
Our financial targets assume a consistent level of productivityimprovement, including those described in our announcedproductivity plan and our portfolio-optimization strategy. Ifwe are unable to deliver these expected productivityimprovements, while continuing to invest in business growth,our financial results could be adversely impacted. e expectthese types of changes, which will include staffing adjustmentsas well as employee departures, to continue for the foreseeablefuture. Successfully executing these changes, includingeffective management transitions at leadership levels of theCompany and retention of key employees, is critical to ourbusiness success. e are generally a build-from-withincompany and our success is dependent on identifying,developing and retaining key employees to provideuninterrupted leadership and direction for our business. Thisincludes developing and retaining organizational capabilitiesin key growth markets where the depth of skilled or experiencedemployees may be limited and competition for these resourcesis intense. It also includes continued development andexecution of robust leadership succession plans, includingsuccessful execution of our recently announced CEOtransition.
Item 1 . Unresolved Staff Comments.
None.
Item 2. Properties.
In the U.S., we own and operate 29 manufacturing sites locatedin 21 different states or territories. In addition, we own andoperate 100 manufacturing sites in 38 other countries. Manyof the domestic and international sites manufacture productsfor multiple businesses. eauty, Hair and Personal Careproducts are manufactured at 37 of these locations Groomingproducts at 18 Health Care products at 16 Fabric Care andHome Care products at 50 and aby, Feminine and FamilyCare at 43. Management believes that the Company'smanufacturing sites are adequate to support the business andthat the properties and equipment have been well maintained.
Item 3. Legal Proceedings.
On February 10, 2015, the Sacramento County EnvironmentalManagement Department (Sacramento EMD) issued anAdministrative Enforcement Order to The Procter & GambleManufacturing Company, a subsidiary of the Company,alleging violations of California s hazardous wastemanagement regulations at the subsidiary s facility inSacramento, California. On May 26, 2015, the subsidiary andSacramento EMD agreed to a Final Stipulation and Order thatincludes no admission of liability, a release of all claims againstthe subsidiary, a $200,000 fine assessed against the subsidiary,and an agreement by the subsidiary to make certain plantmodifications and have a third party conduct an integrityassessment of certain hazardous waste systems at itsSacramento, California facility.
On August 25, 2014, Procuradur a Federal de Protecci n alAmbiente (PROFEPA) issued a ruling to Procter & Gamble
Manufactura, S. de R.L. de C. . (Planta allejo), a subsidiaryof the Company, citing violations of Mexico s air emissionsregulations at the subsidiary s facility in ona Industrial
allejo, Mexico City, Mexico and requiring the subsidiary toperform certain corrective measures at the facility, most ofwhich have been completed. On June 15, 2015, PROFEPAissued a final ruling to the subsidiary imposing monetarysanctions of $133,000. The proceedings are still pending asPROFEPA reviews compliance with additional terms of thesubsidiary s environmental licenses.
The Company is subject, from time to time, to certain otherlegal proceedings and claims arising out of our business, whichcover a wide range of matters, including antitrust and traderegulation, product liability, advertising, contracts,environmental issues, patent and trademark matters, labor andemployment matters and tax. See Note 11 to our ConsolidatedFinancial Statements for information on certain legalproceedings for which there are contingencies.
This item should be read in conjunction with the Company'sRisk Factors in Part I, Item 1A for additional information.
Item 4. Mine Safety Disclosure.
Not applicable.
The Procter & Gamble Company 18
EXECUTIVE OFFICERS OF THE REGISTRANT
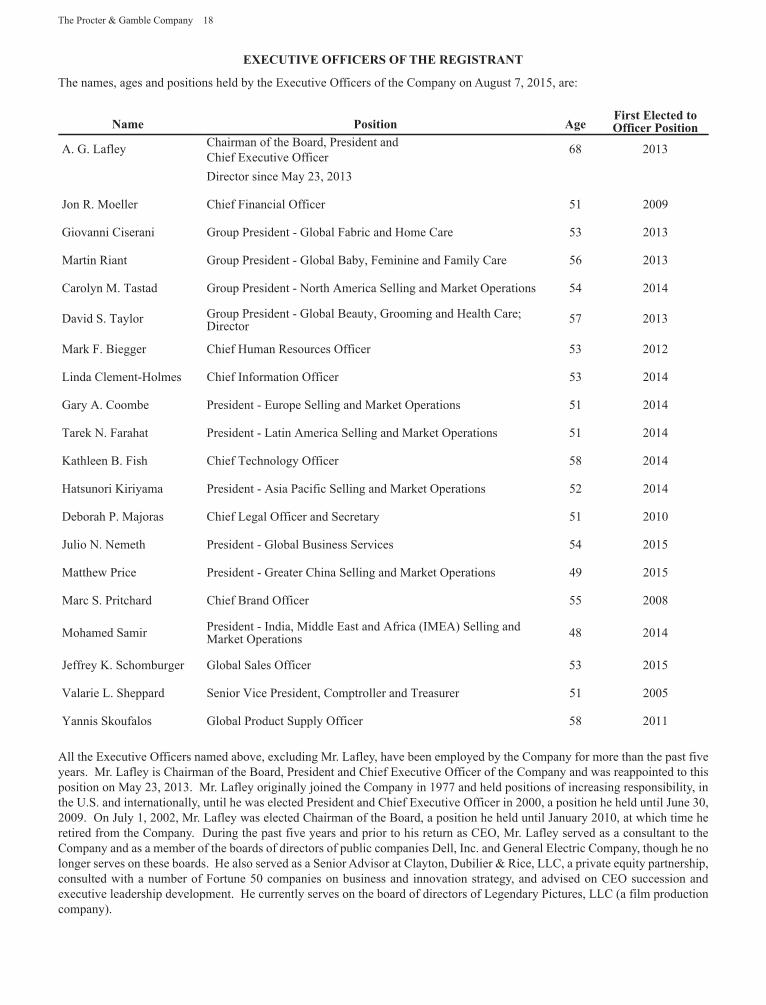
The names, ages and positions held by the Executive Officers of the Company on August 7, 2015, are:
Name Position AgeFirst Elected toOfficer Position
A. G. Lafley Chairman of the oard, President andChief Executive Officer 68 2013
Director since May 23, 2013
Jon R. Moeller Chief Financial Officer 51 2009
Giovanni Ciserani Group President - Global Fabric and Home Care 53 2013
Martin Riant Group President - Global aby, Feminine and Family Care 56 2013
Carolyn M. Tastad Group President - North America Selling and Market Operations 54 2014
David S. Taylor Group President - Global eauty, Grooming and Health CareDirector 57 2013
Mark F. iegger Chief Human Resources Officer 53 2012
Linda Clement-Holmes Chief Information Officer 53 2014
Gary A. Coombe President - Europe Selling and Market Operations 51 2014
Tarek N. Farahat President - Latin America Selling and Market Operations 51 2014
Kathleen . Fish Chief Technology Officer 58 2014
Hatsunori Kiriyama President - Asia Pacific Selling and Market Operations 52 2014
Deborah P. Majoras Chief Legal Officer and Secretary 51 2010
Julio N. Nemeth President - Global usiness Services 54 2015
Matthew Price President - Greater China Selling and Market Operations 49 2015
Marc S. Pritchard Chief rand Officer 55 2008
Mohamed Samir President - India, Middle East and Africa (IMEA) Selling andMarket Operations 48 2014
Jeffrey K. Schomburger Global Sales Officer 53 2015
alarie L. Sheppard Senior ice President, Comptroller and Treasurer 51 2005
Yannis Skoufalos Global Product Supply Officer 58 2011
All the Executive Officers named above, excluding Mr. Lafley, have been employed by the Company for more than the past fiveyears. Mr. Lafley is Chairman of the oard, President and Chief Executive Officer of the Company and was reappointed to thisposition on May 23, 2013. Mr. Lafley originally joined the Company in 1977 and held positions of increasing responsibility, inthe U.S. and internationally, until he was elected President and Chief Executive Officer in 2000, a position he held until June 30,2009. On July 1, 2002, Mr. Lafley was elected Chairman of the oard, a position he held until January 2010, at which time heretired from the Company. During the past five years and prior to his return as CEO, Mr. Lafley served as a consultant to theCompany and as a member of the boards of directors of public companies Dell, Inc. and General Electric Company, though he nolonger serves on these boards. He also served as a Senior Advisor at Clayton, Dubilier & Rice, LLC, a private equity partnership,consulted with a number of Fortune 50 companies on business and innovation strategy, and advised on CEO succession andexecutive leadership development. He currently serves on the board of directors of Legendary Pictures, LLC (a film productioncompany).
19 The Procter & Gamble Company
PART II
Item 5. Market for Registrant's Common Equity, Related Stockholder Matters and Issuer Purchases of Equity Securities.
ISSUER PURCHASES OF E UITY SECURITIES
PeriodTotal Num er of
Shares Purchased 1A erage Price
Paid er Share 2
Total Num er ofShares Purchased as
Part of Pu liclAnnounced Plans or
Programs
A roximate Dollar Value ofShares that Ma Yet Be
Purchased Under Our ShareRe urchase Program
4 1 2015 - 4 30 2015 (3)
5 1 2015 - 5 31 2015 (3)
6 1 2015 - 6 30 2015 4,420,851 $79.17 4,420,851 (3)
Total 4,420,851 $79.17 4,420,851 (3)
(1) The total number of shares purchased for the three months ended June 30, 2015 was 4,420,851. All transactions were made in the openmarket with large financial institutions. This table excludes shares withheld from employees to satisfy minimum tax withholdingrequirements on option exercises and other equity-based transactions. The Company administers cashless exercises through an independentthird party and does not repurchase stock in connection with cashless exercises.
(2) Average price paid per share is calculated on a settlement basis and excludes commission.(3) On April 23, 2015, the Company stated that fiscal year 2015 share repurchases to reduce Company shares outstanding were estimated to
be approximately $5 billion, notwithstanding any purchases under the Company's compensation and benefit plans. The share repurchaseswere authorized pursuant to a resolution issued by the Company's oard of Directors and were financed through a combination of operatingcash flows and issuance of long-term and short-term debt. The total value of the shares purchased under the share repurchase plan was$4.6 billion. The share repurchase plan ended on June 30, 2015.
Additional information required by this item can be found in Part III, Item 12 of this Form 10-K.
SHAREHOLDER RETURN PERFORMANCE GRAPHS
Market and Di idend Information
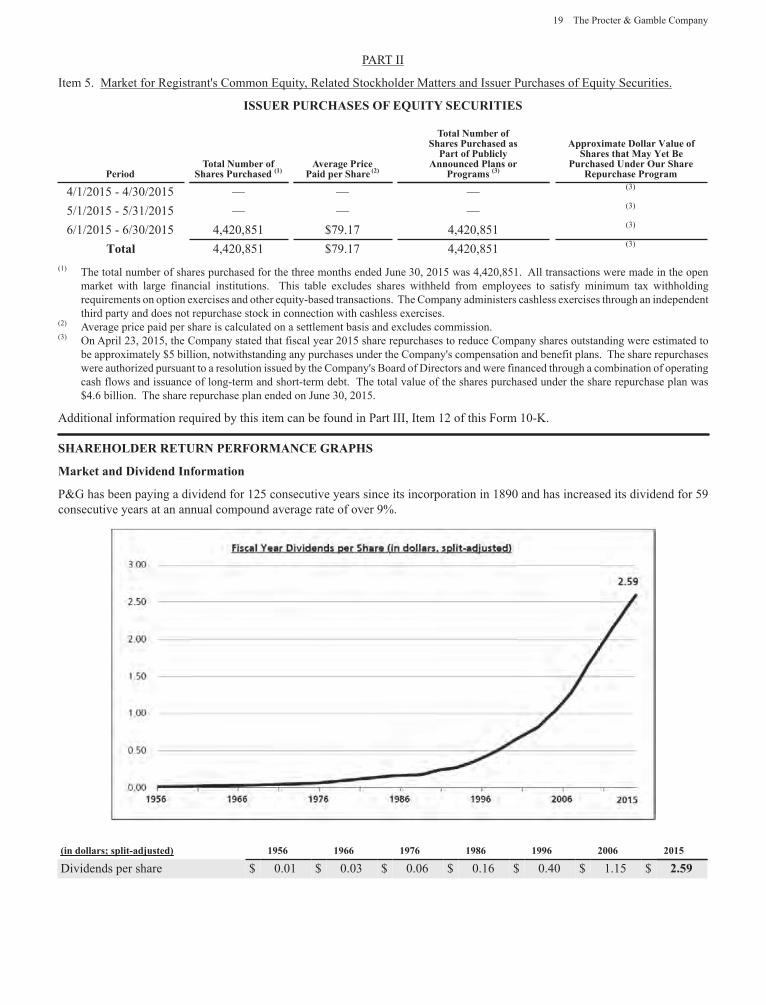
P&G has been paying a dividend for 125 consecutive years since its incorporation in 1890 and has increased its dividend for 59consecutive years at an annual compound average rate of over 9 .
in dollars s lit-ad usted 195 19 19 19 199 200 2015
Dividends per share $ 0.01 $ 0.03 $ 0.06 $ 0.16 $ 0.40 $ 1.15 $ 2.59
The Procter & Gamble Company 20
uarterl Di idends
uarter Ended 2014 - 2015 201 - 2014
September 30 0. 4 $ 0.6015December 31 0. 4 0.6015March 31 0. 4 0.6015June 30 0. 29 0.6436
Common Stock Price Range
uarter Ended 2014 - 2015 201 - 2014High Low High Low
September 30 5.40 .29 $ 82.40 $ 73.61December 31 9 . 9 1.5 85.82 75.20March 31 91. 0. 2 81.70 75.26June 30 4.20 .10 82.98 78.43
P&G trades on the New York Stock Exchange and NYSE Euronext-Paris under the stock symbol PG. There were approximately2.6 million common stock shareowners, including shareowners of record, participants in the P&G Shareholder Investment Program,participants in P&G stock ownership plans and beneficial owners with accounts at banks and brokerage firms, as of June 30, 2015.
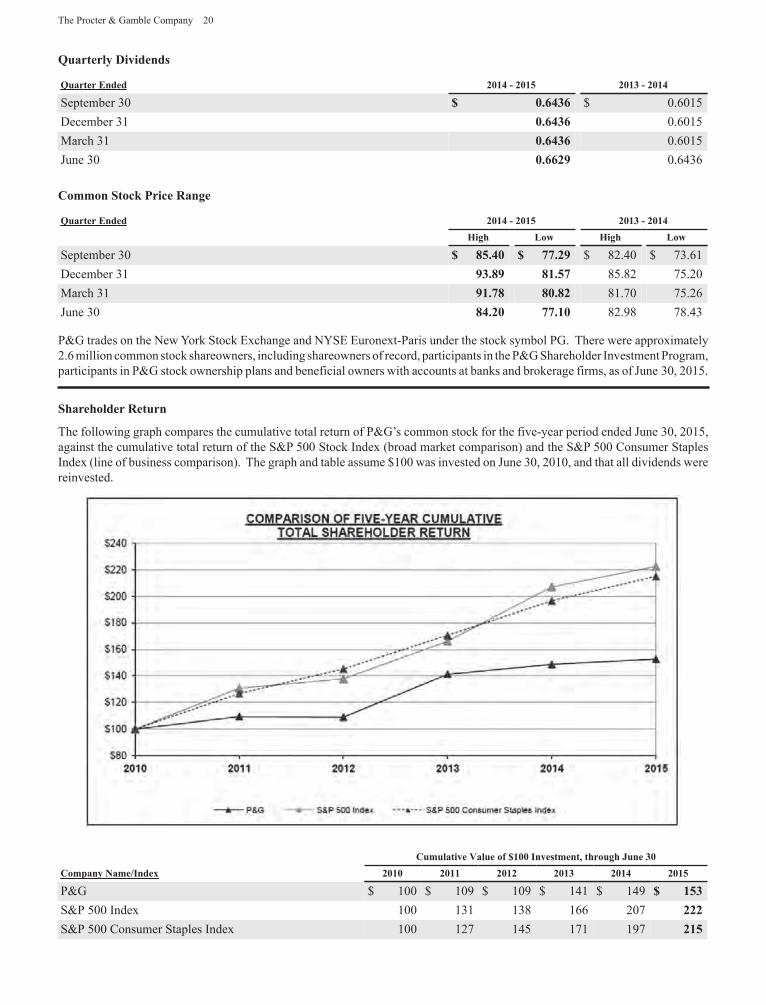
Shareholder Return
The following graph compares the cumulative total return of P&G s common stock for the five-year period ended June 30, 2015,against the cumulative total return of the S&P 500 Stock Index (broad market comparison) and the S&P 500 Consumer StaplesIndex (line of business comparison). The graph and table assume $100 was invested on June 30, 2010, and that all dividends werereinvested.
Cumulati e Value of 100 In estment, through une 0Com an Name Index 2010 2011 2012 201 2014 2015
P&G $ 100 $ 109 $ 109 $ 141 $ 149 15S&P 500 Index 100 131 138 166 207 222S&P 500 Consumer Staples Index 100 127 145 171 197 215
21 The Procter & Gamble Company
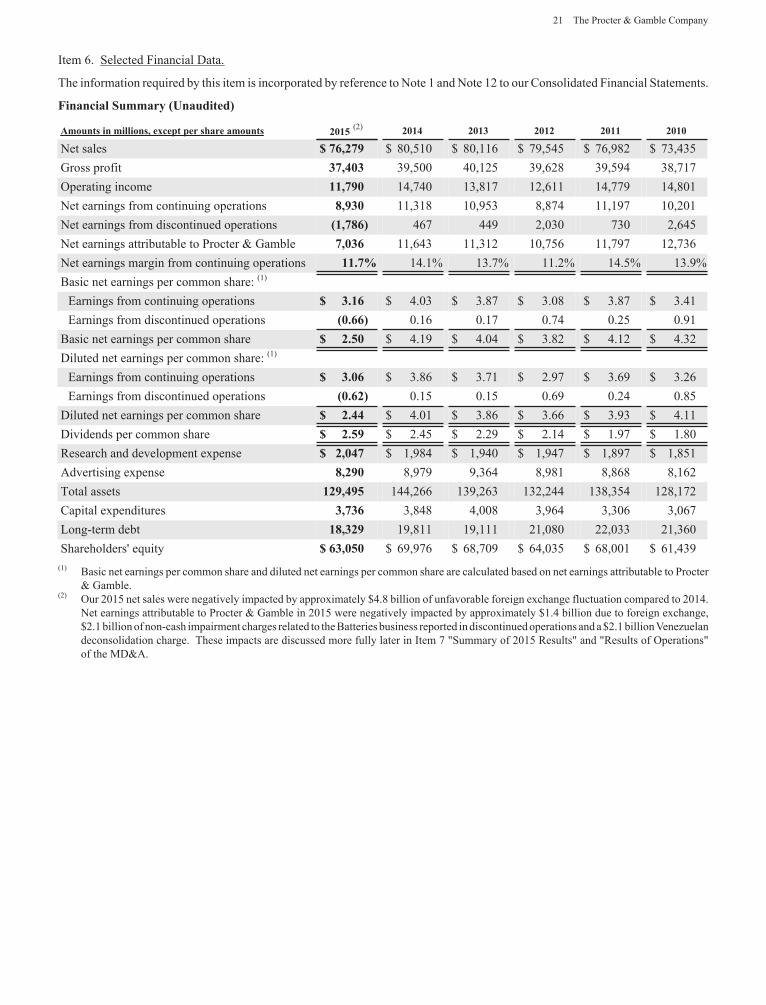
Item 6. Selected Financial Data.
The information required by this item is incorporated by reference to Note 1 and Note 12 to our Consolidated Financial Statements.
Financial Summar Unaudited
Amounts in millions, exce t er share amounts 2015 (2) 2014 201 2012 2011 2010
Net sales ,2 9 $ 80,510 $ 80,116 $ 79,545 $ 76,982 $ 73,435Gross profit ,40 39,500 40,125 39,628 39,594 38,717Operating income 11, 90 14,740 13,817 12,611 14,779 14,801Net earnings from continuing operations ,9 0 11,318 10,953 8,874 11,197 10,201Net earnings from discontinued operations 1, 467 449 2,030 730 2,645Net earnings attributable to Procter & Gamble ,0 11,643 11,312 10,756 11,797 12,736Net earnings margin from continuing operations 11. 14.1 13.7 11.2 14.5 13.9
asic net earnings per common share: (1)
Earnings from continuing operations .1 $ 4.03 $ 3.87 $ 3.08 $ 3.87 $ 3.41Earnings from discontinued operations 0. 0.16 0.17 0.74 0.25 0.91asic net earnings per common share 2.50 $ 4.19 $ 4.04 $ 3.82 $ 4.12 $ 4.32
Diluted net earnings per common share: (1)
Earnings from continuing operations .0 $ 3.86 $ 3.71 $ 2.97 $ 3.69 $ 3.26Earnings from discontinued operations 0. 2 0.15 0.15 0.69 0.24 0.85
Diluted net earnings per common share 2.44 $ 4.01 $ 3.86 $ 3.66 $ 3.93 $ 4.11Dividends per common share 2.59 $ 2.45 $ 2.29 $ 2.14 $ 1.97 $ 1.80Research and development expense 2,04 $ 1,984 $ 1,940 $ 1,947 $ 1,897 $ 1,851Advertising expense ,290 8,979 9,364 8,981 8,868 8,162Total assets 129,495 144,266 139,263 132,244 138,354 128,172Capital expenditures , 3,848 4,008 3,964 3,306 3,067Long-term debt 1 , 29 19,811 19,111 21,080 22,033 21,360Shareholders' equity ,050 $ 69,976 $ 68,709 $ 64,035 $ 68,001 $ 61,439
(1) asic net earnings per common share and diluted net earnings per common share are calculated based on net earnings attributable to Procter& Gamble.
(2) Our 2015 net sales were negatively impacted by approximately $4.8 billion of unfavorable foreign exchange fluctuation compared to 2014.Net earnings attributable to Procter & Gamble in 2015 were negatively impacted by approximately $1.4 billion due to foreign exchange,$2.1 billion of non-cash impairment charges related to the atteries business reported in discontinued operations and a $2.1 billion enezuelandeconsolidation charge. These impacts are discussed more fully later in Item 7 Summary of 2015 Results and Results of Operationsof the MD&A.
The Procter & Gamble Company 22
Item 7. Management's Discussion and Analysis of Financial Condition and Results of Operations.
Management s Discussion and Anal sis
Forward-Looking Statements
Certain statements in this report, other than purely historicalinformation, including estimates, projections, statementsrelating to our business plans, objectives and expectedoperating results and the assumptions upon which thosestatements are based, are forward-looking statements withinthe meaning of the Private Securities Litigation Reform Act of1995, Section 27A of the Securities Act of 1933 andSection 21E of the Securities Exchange Act of 1934. Forward-looking statements may appear throughout this report,including, without limitation, in the following sections:Management's Discussion and Analysis and Risk Factors.
These forward-looking statements generally are identified bythe words believe, project, expect, anticipate,estimate, intend, strategy, future, opportunity,plan, may, should, will, would, will be, will
continue, will likely result and similar expressions.Forward-looking statements are based on current expectationsand assumptions that are subject to risks and uncertaintieswhich may cause actual results to differ materially from thoseexpressed or implied in the forward-looking statements. Adetailed discussion of risks and uncertainties that could causeactual results and events to differ materially from such forward-looking statements is included in the section titled EconomicConditions and Uncertainties and the section titled RiskFactors (Item 1A of this Form 10-K). Forward-lookingstatements are made as of the date of this report, and weundertake no obligation to update or revise publicly anyforward-looking statements, whether because of newinformation, future events or otherwise.
The following Management's Discussion and Analysis(MD&A) is intended to provide the reader with anunderstanding of P&G's financial condition, results ofoperations and cash flows by focusing on changes in certainkey measures from year to year. The MD&A is provided as asupplement to, and should be read in conjunction with, ourConsolidated Financial Statements and accompanying Notes.The MD&A is organized in the following sections:
OverviewSummary of 2015 ResultsEconomic Conditions and UncertaintiesResults of OperationsSegment ResultsCash Flow, Financial Condition and LiquiditySignificant Accounting Policies and EstimatesOther Information
Throughout the MD&A, we refer to measures used bymanagement to evaluate performance, including unit volumegrowth, net sales and net earnings. e also refer to a numberof financial measures that are not defined under accountingprinciples generally accepted in the United States of America(U.S. GAAP), including organic sales growth, core earningsper share (Core EPS), free cash flow, adjusted free cash flow
and adjusted free cash flow productivity. Organic sales growthis net sales growth excluding the impacts of foreign exchange,acquisitions and divestitures. Core EPS is diluted net earningsper share from continuing operations excluding certainspecified charges and gains. Free cash flow is operating cashflow less capital spending. Adjusted free cash flow is free cashflow excluding tax payments for the Pet Care divestiture.Adjusted free cash flow productivity is the ratio of adjustedfree cash flow to net earnings excluding impairment chargeson the atteries business and the enezuelan deconsolidationcharge. e believe these measures provide our investors withadditional information about our underlying results and trends,as well as insight to some of the metrics used to evaluatemanagement. The explanation at the end of the MD&Aprovides more details on the use and derivation of thesemeasures.
Management also uses certain market share and marketconsumption estimates to evaluate performance relative tocompetition despite some limitations on the availability andcomparability of share and consumption information.References to market share and market consumption in theMD&A are based on a combination of vendor-reportedconsumption and market size data, as well as internal estimates.All market share references represent the percentage of salesin dollar terms on a constant currency basis of our products,relative to all product sales in the category and are measuredon an annual basis versus the prior 12-month period.References to competitive activity include promotional andproduct initiatives from our competitors.
OVERVIEW
P&G is a global leader in fast-moving consumer goods,focused on providing branded consumer packaged goods ofsuperior quality and value to our consumers around the world.Our products are sold in more than 180 countries and territoriesprimarily through mass merchandisers, grocery stores,membership club stores, drug stores, department stores, salons,distributors, e-commerce, high-frequency stores andpharmacies. e have on-the-ground operations inapproximately 70 countries.
Our market environment is highly competitive with global,regional and local competitors. In many of the markets andindustry segments in which we sell our products, we competeagainst other branded products as well as retailers' private-labelbrands. Additionally, many of the product segments in whichwe compete are differentiated by price tiers (referred to assuper-premium, premium, mid-tier and value-tier products).
e are well positioned in the industry segments and marketsin which we operate, often holding a leadership or significantmarket share position.
23 The Procter & Gamble Company
ORGANI ATIONAL STRUCTUREOur organizational structure is comprised of Global usiness Units (G Us), Selling and Market Operations (SMOs), Global
usiness Services (G S) and Corporate Functions (CF).
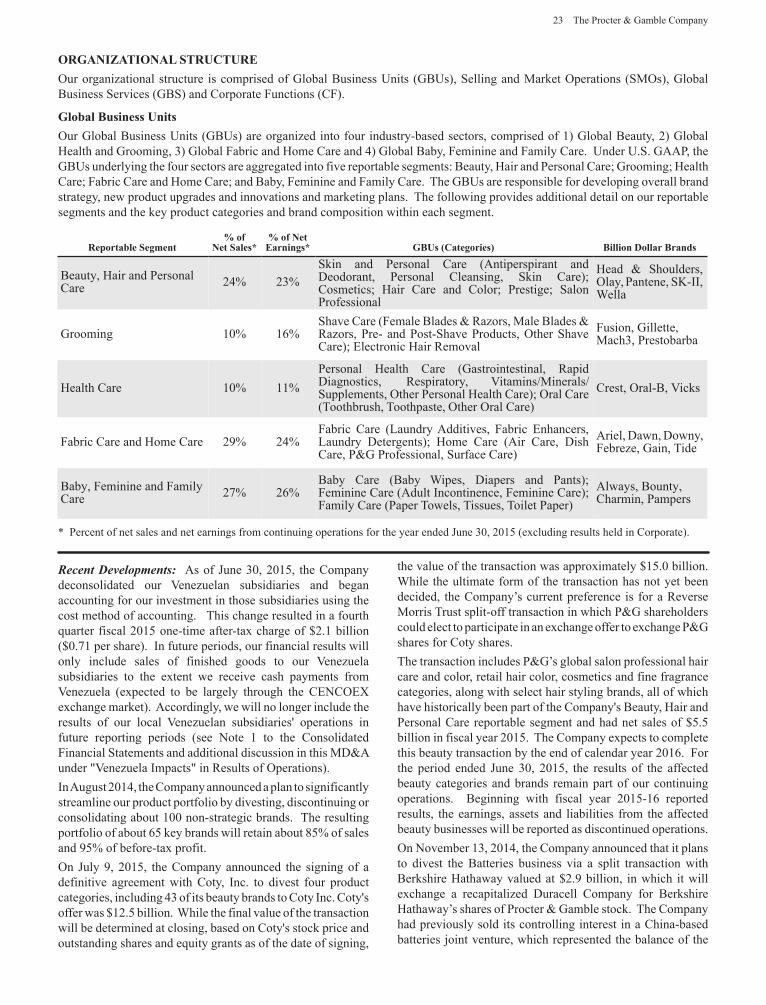
Glo al Business UnitsOur Global usiness Units (G Us) are organized into four industry-based sectors, comprised of 1) Global eauty, 2) GlobalHealth and Grooming, 3) Global Fabric and Home Care and 4) Global aby, Feminine and Family Care. Under U.S. GAAP, theG Us underlying the four sectors are aggregated into five reportable segments: eauty, Hair and Personal Care Grooming HealthCare Fabric Care and Home Care and aby, Feminine and Family Care. The G Us are responsible for developing overall brandstrategy, new product upgrades and innovations and marketing plans. The following provides additional detail on our reportablesegments and the key product categories and brand composition within each segment.
Re orta le Segmentof
Net Sales of Net
Earnings GBUs Categories Billion Dollar Brands
eauty, Hair and PersonalCare 24 23
Skin and Personal Care (Antiperspirant andDeodorant, Personal Cleansing, Skin Care)Cosmetics Hair Care and Color Prestige SalonProfessional
Head & Shoulders,Olay, Pantene, SK-II,
ella
Grooming 10 16Shave Care (Female lades & Razors, Male lades &Razors, Pre- and Post-Shave Products, Other ShaveCare) Electronic Hair Removal
Fusion, Gillette,Mach3, Prestobarba
Health Care 10 11Personal Health Care (Gastrointestinal, RapidDiagnostics, Respiratory, itamins MineralsSupplements, Other Personal Health Care) Oral Care(Toothbrush, Toothpaste, Other Oral Care)
Crest, Oral- , icks
Fabric Care and Home Care 29 24Fabric Care (Laundry Additives, Fabric Enhancers,Laundry Detergents) Home Care (Air Care, DishCare, P&G Professional, Surface Care)
Ariel, Dawn, Downy,Febreze, Gain, Tide
aby, Feminine and FamilyCare 27 26
aby Care ( aby ipes, Diapers and Pants)Feminine Care (Adult Incontinence, Feminine Care)Family Care (Paper Towels, Tissues, Toilet Paper)
Always, ounty,Charmin, Pampers
Percent of net sales and net earnings from continuing operations for the year ended June 30, 2015 (excluding results held in Corporate).
Recent Developments: As of June 30, 2015, the Companydeconsolidated our enezuelan subsidiaries and beganaccounting for our investment in those subsidiaries using thecost method of accounting. This change resulted in a fourthquarter fiscal 2015 one-time after-tax charge of $2.1 billion($0.71 per share). In future periods, our financial results willonly include sales of finished goods to our enezuelasubsidiaries to the extent we receive cash payments from
enezuela (expected to be largely through the CENCOEXexchange market). Accordingly, we will no longer include theresults of our local enezuelan subsidiaries' operations infuture reporting periods (see Note 1 to the ConsolidatedFinancial Statements and additional discussion in this MD&Aunder enezuela Impacts in Results of Operations).InAugust 2014, the Company announced a plan to significantlystreamline our product portfolio by divesting, discontinuing orconsolidating about 100 non-strategic brands. The resultingportfolio of about 65 key brands will retain about 85 of salesand 95 of before-tax profit.On July 9, 2015, the Company announced the signing of adefinitive agreement with Coty, Inc. to divest four productcategories, including 43 of its beauty brands to Coty Inc. Coty'soffer was $12.5 billion. hile the final value of the transactionwill be determined at closing, based on Coty's stock price andoutstanding shares and equity grants as of the date of signing,
the value of the transaction was approximately $15.0 billion.hile the ultimate form of the transaction has not yet been
decided, the Company s current preference is for a ReverseMorris Trust split-off transaction in which P&G shareholderscould elect to participate in an exchange offer to exchange P&Gshares for Coty shares.The transaction includes P&G s global salon professional haircare and color, retail hair color, cosmetics and fine fragrancecategories, along with select hair styling brands, all of whichhave historically been part of the Company's eauty, Hair andPersonal Care reportable segment and had net sales of $5.5billion in fiscal year 2015. The Company expects to completethis beauty transaction by the end of calendar year 2016. Forthe period ended June 30, 2015, the results of the affectedbeauty categories and brands remain part of our continuingoperations. eginning with fiscal year 2015-16 reportedresults, the earnings, assets and liabilities from the affectedbeauty businesses will be reported as discontinued operations.On November 13, 2014, the Company announced that it plansto divest the atteries business via a split transaction with
erkshire Hathaway valued at $2.9 billion, in which it willexchange a recapitalized Duracell Company for erkshireHathaway s shares of Procter & Gamble stock. The Companyhad previously sold its controlling interest in a China-basedbatteries joint venture, which represented the balance of the
The Procter & Gamble Company 24
Company s atteries business, during the quarter endedDecember 31, 2014. The Company expects to complete theDuracell transaction in the beginning of calendar year 2016,pending necessary regulatory approvals. The atteriesbusiness had historically been part of the Company s FabricCare and Home Care reportable segment. The results of the
atteries business are now presented as discontinuedoperations and, as such, are excluded from both continuingoperations and segment results for all periods presented.Additionally, the atteries balance sheet positions as of June30, 2015 are presented as held for sale in the Consolidated
alance Sheets.During fiscal 2015, the Company completed the divestiture ofits Pet Care business. The gain on the transaction was notmaterial. The results of the Pet Care business are now presentedas discontinued operations and, as such, are excluded from bothcontinuing operations and segment results for all periodspresented. Additionally, the Pet Care balance sheet positionsas of June 30, 2014 are presented as held for sale in theConsolidated alance Sheets.
ith these transactions and other recently completed andannounced minor brand divestitures, the Company will havesubstantially completed the strategic portfolio reshapingprogram with 93 out of approximately 100 brands having beensold, discontinued or consolidated.e t n e son l e: e are a global market
leader in the beauty category. Most of the beauty markets inwhich we compete are highly fragmented with a large numberof global and local competitors. e compete in beauty care,hair care and color and prestige. In beauty care, we offer awide variety of products, ranging from deodorants to cosmeticsto skin care, such as our Olay brand, which is the top facialskin care brand in the world with over 8 global market share.In hair care and color, we compete in both the retail and salonprofessional channels. e are the global market leader in theretail hair care and color market with over 20 global marketshare primarily behind our Pantene and Head & Shouldersbrands. In the prestige channel, we compete primarily withour prestige fragrances behind Dolce & Gabbana, Gucci andHugo oss fragrance brands and the SK-II brand.oom n : e are the global market leader in the blades and
razors market. Our global blades and razors market share isover 65 , primarily behind the Gillette franchise includingFusion, Mach3, Prestobarba and enus. Our electronic hairremoval devices, such as electric razors and epilators, are soldunder the raun brand in a number of markets around the worldwhere we compete against both global and regionalcompetitors. e hold over 20 of the male shavers marketand nearly 50 of the female epilators market.e lt e: e compete in oral care and personal health
care. In oral care, there are several global competitors in themarket and we have the number two market share position withapproximately 20 global market share. In personal healthcare, we are a top ten competitor in a large, highly fragmentedindustry behind respiratory treatments ( icks brand) andnonprescription heartburn medications (Prilosec OTC brand).Nearly all of our sales outside the U.S. in personal health care
are generated through the PGT Healthcare partnership withTeva Pharmaceuticals Ltd.
c e n ome e: This segment is comprised ofa variety of fabric care products including laundry detergents,additives and fabric enhancers and home care productsincluding dishwashing liquids and detergents, surface cleanersand air fresheners. In fabric care, we generally have the numberone or number two share position in the markets in which wecompete and are the global market leader with approximately30 global market share, primarily behind our Tide, Ariel andDowny brands. Our global home care market share isapproximately 20 across the categories in which we compete.
em n ne n m l e: In baby care, we competemainly in diapers, pants and baby wipes with over 30 globalmarket share. e are the number one or number two baby carecompetitor in most of the key markets in which we compete,primarily behind Pampers, the Company's largest brand, withannual net sales of approximately $10 billion. e are the globalmarket leader in the feminine care category with approximately30 global market share, primarily behind Always. e haverecently entered the adult incontinence category in certainmarkets, achieving nearly a 10 market share in those marketswhere we have entered. Our family care business ispredominantly a North American business comprised largelyof the ounty paper towel and Charmin toilet paper brands.U.S. market shares are nearly 45 for ounty and over 25for Charmin.Selling and Market O erationsOur SMOs are responsible for developing and executing go-to-market plans at the local level. The SMOs include dedicatedretail customer, trade channel and country-specific teams. OurSMOs are organized under six regions comprised of NorthAmerica, Europe, Latin America, Asia Pacific, Greater Chinaand India, Middle East and Africa (IMEA). Throughout theMD&A, we reference business results in developed markets,which are comprised of North America, estern Europe andJapan, and developing markets which are all other markets notincluded in developed.Glo al Business Ser icesG S provides technology, processes and standard data toolsto enable the G Us and the SMOs to better understand thebusiness and better serve consumers and customers. The G Sorganization is responsible for providing world-class solutionsat a low cost and with minimal capital investment.Cor orate FunctionsCF provides Company-level strategy and portfolio analysis,corporate accounting, treasury, tax, external relations,governance, human resources and legal, as well as othercentralized functional support.
STRATEGIC FOCUSe are focused on strategies that we believe are right for the
long-term health of the Company with the objective ofdelivering total shareholder return in the top one-third of ourpeer group.Our value creation progress is measured internally with theoperating total shareholder return (O-TSR) model. Over time,

25 The Procter & Gamble Company
O-TSR performance is highly correlated with market totalshareholder returns. O-TSR is a balanced measure that requiresstrong performance across the three primary drivers of valuecreation: sales growth, profit margin expansion and efficientutilization of assets to generate strong, reliable operating cashflow. e operationalize O-TSR deep within the Company bydefining tight linkages between business activities and the keydrivers of value creation, from strategic choices of globalbusiness units, brands and country teams down to individualemployees daily work plans.The Company has recently undertaken an effort to focus andstrengthen its business portfolio to compete in categories andbrands that are structurally attractive and that play to P&Gstrengths. This will enable us to allocate resources to leadingbrands - marketed in the right set of countries, channels andcustomers - where the size of the prize and probability ofwinning is highest. hen the major portion of this work iscomplete, we expect to compete in four industry-based sectorsmade up of approximately ten product categories and 65leading brands.Innovation has always been - and continues to be - P&G'slifeblood. To consistently win with consumers around theworld across price tiers and preferences and to consistently winversus our best competitors, each P&G product category needsa full portfolio of innovation, including a mix of commercialprograms, product improvements and game-changing
innovations. e are also innovating to improve our category,brand and market business models to better serve consumersand customers.Productivity is a core strength for P&G, which createsflexibility to fund our growth efforts, offset cost challengesand or improve operating margins. e have taken significantsteps to accelerate productivity and savings across all elementsof costs, including cost of goods sold, marketing expense andnon-manufacturing overhead. These efforts are yieldingsignificant benefits to our operating margin.Finally, we are focused on improving execution and operatingdiscipline in everything we do. Operating discipline andexecution have always been - and must continue to be - corecapabilities and competitive advantages for P&G.The Company expects the delivery of the following long-termannual financial targets will result in total shareholder returnsin the top third of the competitive peer group:
Organic sales growth above market growth rates in thecategories and geographies in which we competeCore EPS growth of high single digits andAdjusted free cash flow productivity of 90 or greater.
In periods with significant macroeconomic pressures, we willmaintain a disciplined approach to investing so as not tosacrifice the long-term health of our businesses to meet short-term objectives in any given year.
SUMMARY OF 2015 RESULTS
Amounts in millions, exce t er share amounts 2015Change s.Prior Year 2014
Change s.Prior Year 201
Net sales ,2 9 (5) $ 80,510 $ 80,116Operating income 11, 90 (20) 14,740 7 13,817Net earnings from continuing operations ,9 0 (21) 11,318 3 10,953Net earnings (loss) from discontinued operations 1, (482) 467 4 449Net earnings attributable to Procter & Gamble ,0 (40) 11,643 3 11,312Diluted net earnings per common share 2.44 (39) 4.01 4 3.86Diluted net earnings per share from continuing operations .0 (21) 3.86 4 3.71Core earnings per common share 4.02 (2) 4.09 5 3.89
Net sales decreased 5 to $76.3 billion including anegative 6 impact from foreign exchange.
Organic sales increased 1 .Unit volume decreased 1 . olume grew low singledigits in Fabric Care and Home Care. olumedecreased low single digits in aby, Feminine andFamily Care, Grooming and Health Care, anddeclined mid-single digits in eauty, Hair andPersonal Care.
Net earnings from continuing operations decreased $2.4billion or 21 due to a $2.1 billion after tax charge relatedto the deconsolidation of our enezuelan subsidiaries andthe decline in net sales, partially offset by reduced selling,general and administrative expenses (SG&A). Foreignexchange impacts negatively affected net earnings byapproximately 12 .
Net earnings from discontinued operations decreased $2.3billion due primarily to impairment charges in our
atteries business, which is included in discontinuedoperations due to the pending divestiture.Net earnings attributable to Procter & Gamble were $7.0billion, a decrease of $4.6 billion or 40 versus the prioryear period due primarily to the enezuelandeconsolidation charge and impairment charges in our
atteries business.Diluted net earnings per share decreased 39 to $2.44
Diluted net earnings per share from continuingoperations decreased 21 to $3.06.Core EPS decreased 2 to $4.02.
Cash flow from operating activities was $14.6 billion.Adjusted free cash flow was $11.6 billion.Adjusted free cash flow productivity was 102 .
The Procter & Gamble Company 26
ECONOMIC CONDITIONS AND UNCERTAINTIES
e discuss expectations regarding future performance, eventsand outcomes, such as our business outlook and objectives, inannual and quarterly reports, press releases and other writtenand oral communications. All such statements, except forhistorical and present factual information, are forward-looking statements and are based on financial data and ourbusiness plans available only as of the time the statements aremade, which may become out-of-date or incomplete. eassume no obligation to update any forward-lookingstatements as a result of new information, future events or otherfactors. Forward-looking statements are inherently uncertainand investors must recognize that events could be significantlydifferent from our expectations. For more information on risksthat could impact our results, refer to Item 1A Risk Factors inthis 10-K.
lo l conom c on t ons Current macroeconomicfactors remain dynamic, and any causes of market sizecontraction, such as greater political unrest in the Middle Eastand Eastern Europe, further economic instability in theEuropean Union, political instability in certain LatinAmericanmarkets and economic slowdowns in Japan and China, couldreduce our sales or erode our operating margin, in either casereducing our earnings.
n es n osts Our costs are subject to fluctuations,particularly due to changes in commodity prices and our ownproductivity efforts. e have significant exposures to certaincommodities, in particular certain oil-derived materials likeresins, and volatility in the market price of these commodityinput materials has a direct impact on our costs. If we areunable to manage commodity fluctuations through pricingactions, cost savings projects and sourcing decisions as wellas through consistent productivity improvements, it mayadversely impact our gross margin, operating margin and netearnings. Sales could also be adversely impacted followingpricing actions if there is a negative impact on consumption ofour products. e strive to implement, achieve and sustain costimprovement plans, including outsourcing projects, supplychain optimization and general overhead and workforceoptimization. As discussed later in this MD&A, we initiatedcertain non-manufacturing overhead reduction projects alongwith manufacturing and other supply chain cost improvementsprojects in 2012. If we are not successful in executing thesechanges, there could be a negative impact on our operatingmargin and net earnings.
o e n c n e e have both translation and transactionexposure to the fluctuation of exchange rates. Translationexposures relate to exchange rate impacts of measuring incomestatements of foreign subsidiaries that do not use the U.S. dollaras their functional currency. Transaction exposures relate to1) the impact from input costs that are denominated in acurrency other than the local reporting currency and 2) therevaluation of transaction-related working capital balancesdenominated in currencies other than the functional currency.In 2015 and 2014, the U.S. dollar has strengthened versus anumber of foreign currencies leading to lower sales andearnings from these foreign exchange impacts. Certain
countries experiencing significant exchange rate fluctuations,like Russia, Ukraine, Japan and Switzerland, have had, andcould have, an additional significant impact on our sales, costsand earnings. Increased pricing in response to thesefluctuations in foreign currency exchange rates may offsetportions of the currency impacts, but could also have a negativeimpact on consumption of our products, which would affectour sales.
ove nment ol c es Our net earnings could be affected bychanges in U.S. or foreign government tax policies. Forexample, the U.S. is considering corporate tax reform that maysignificantly impact the corporate tax rate and change the U.S.tax treatment of international earnings. Additionally, weattempt to carefully manage our debt and currency exposurein certain countries with currency exchange, importauthorization and pricing controls, such as Argentina, China,Egypt, Greece, India, Nigeria, Ukraine and enezuela.Changes in government policies in these areas might cause anincrease or decrease in our sales, operating margin and netearnings. During fiscal 2015, the Company deconsolidated its
enezuelan subsidiaries due to evolving conditions that haveresulted in an other-than-temporary lack of exchangeabilitybetween the enezuelan bolivar and U.S. dollar and haverestricted our ability to pay dividends and satisfy certain otherobligations denominated in U.S. dollars.
RESULTS OF OPERATIONS
The key metrics included in our discussion of our consolidatedresults of operations include net sales, gross margin, SG&A,other non-operating items and income taxes. The primaryfactors driving year-over-year changes in net sales includeoverall market growth in the categories in which we compete,product initiatives, the level of initiatives and other activitiesby competitors, geographic expansion and acquisition anddivestiture activity, all of which drive changes in ourunderlying unit volume as well as pricing actions (which canalso indirectly impact volume), changes in product andgeographic mix and foreign currency impacts on sales outsidethe U.S.
Most of our cost of products sold and SG&Aare to some extentvariable in nature. Accordingly, our discussion of theseoperating costs focuses primarily on relative margins ratherthan the absolute year-over-year changes in total costs. Theprimary drivers of changes in gross margin are input costs(energy and other commodities), pricing impacts, geographicmix (for example, gross margins in developed markets aregenerally higher than in developing markets for similarproducts), product mix (for example, the eauty, Hair andPersonal Care segment has higher gross margins than theCompany average), foreign exchange rate fluctuations (insituations where certain input costs may be tied to a differentfunctional currency than the underlying sales), the impacts ofmanufacturing savings projects and to a lesser extent scaleimpacts (for costs that are fixed or less variable in nature). Theprimary drivers of SG&Aare marketing-related costs and non-manufacturing overhead costs. Marketing-related costs areprimarily variable in nature, although we do achieve some levelof scale benefit over time due to overall growth and other
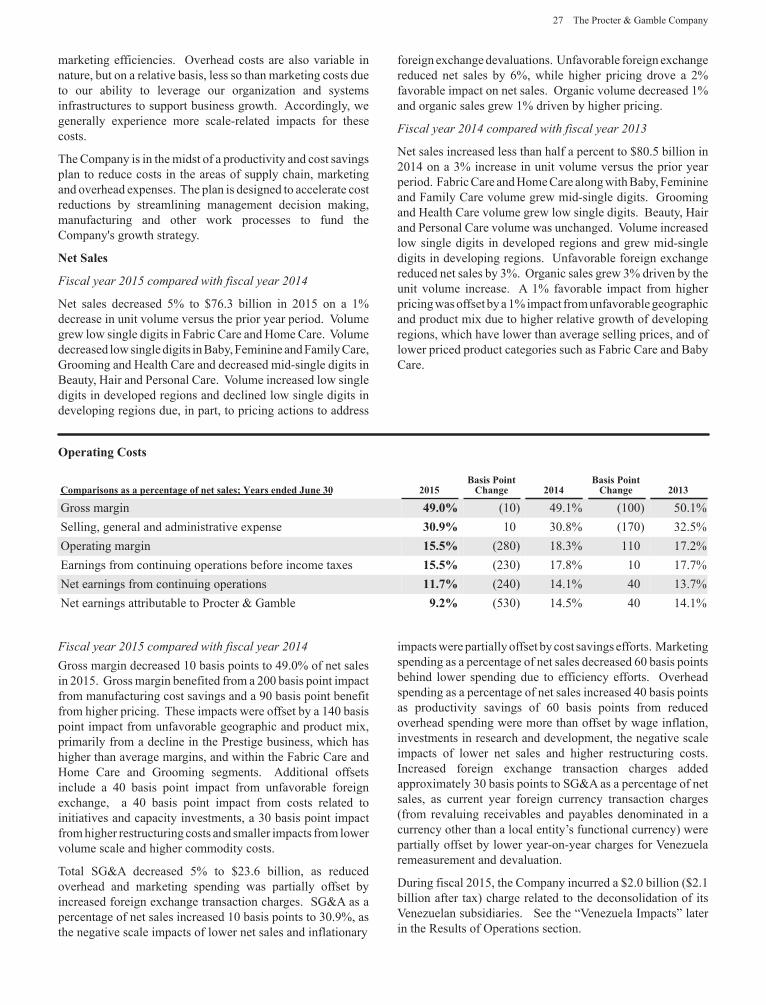
27 The Procter & Gamble Company
marketing efficiencies. Overhead costs are also variable innature, but on a relative basis, less so than marketing costs dueto our ability to leverage our organization and systemsinfrastructures to support business growth. Accordingly, wegenerally experience more scale-related impacts for thesecosts.
The Company is in the midst of a productivity and cost savingsplan to reduce costs in the areas of supply chain, marketingand overhead expenses. The plan is designed to accelerate costreductions by streamlining management decision making,manufacturing and other work processes to fund theCompany's growth strategy.
Net Sales
Fiscal year 2015 compared with fiscal year 2014
Net sales decreased 5 to $76.3 billion in 2015 on a 1decrease in unit volume versus the prior year period. olumegrew low single digits in Fabric Care and Home Care. olumedecreased low single digits in aby, Feminine and Family Care,Grooming and Health Care and decreased mid-single digits in
eauty, Hair and Personal Care. olume increased low singledigits in developed regions and declined low single digits indeveloping regions due, in part, to pricing actions to address
foreign exchange devaluations. Unfavorable foreign exchangereduced net sales by 6 , while higher pricing drove a 2favorable impact on net sales. Organic volume decreased 1and organic sales grew 1 driven by higher pricing.
Fiscal year 2014 compared with fiscal year 2013
Net sales increased less than half a percent to $80.5 billion in2014 on a 3 increase in unit volume versus the prior yearperiod. Fabric Care and Home Care along with aby, Feminineand Family Care volume grew mid-single digits. Groomingand Health Care volume grew low single digits. eauty, Hairand Personal Care volume was unchanged. olume increasedlow single digits in developed regions and grew mid-singledigits in developing regions. Unfavorable foreign exchangereduced net sales by 3 . Organic sales grew 3 driven by theunit volume increase. A 1 favorable impact from higherpricing was offset by a 1 impact from unfavorable geographicand product mix due to higher relative growth of developingregions, which have lower than average selling prices, and oflower priced product categories such as Fabric Care and abyCare.
O erating Costs
Com arisons as a ercentage of net sales Years ended une 0 2015Basis Point
Change 2014Basis Point
Change 201
Gross margin 49.0 (10) 49.1 (100) 50.1Selling, general and administrative expense 0.9 10 30.8 (170) 32.5Operating margin 15.5 (280) 18.3 110 17.2Earnings from continuing operations before income taxes 15.5 (230) 17.8 10 17.7Net earnings from continuing operations 11. (240) 14.1 40 13.7Net earnings attributable to Procter & Gamble 9.2 (530) 14.5 40 14.1
Fiscal year 2015 compared with fiscal year 2014Gross margin decreased 10 basis points to 49.0 of net salesin 2015. Gross margin benefited from a 200 basis point impactfrom manufacturing cost savings and a 90 basis point benefitfrom higher pricing. These impacts were offset by a 140 basispoint impact from unfavorable geographic and product mix,primarily from a decline in the Prestige business, which hashigher than average margins, and within the Fabric Care andHome Care and Grooming segments. Additional offsetsinclude a 40 basis point impact from unfavorable foreignexchange, a 40 basis point impact from costs related toinitiatives and capacity investments, a 30 basis point impactfrom higher restructuring costs and smaller impacts from lowervolume scale and higher commodity costs.
Total SG&A decreased 5 to $23.6 billion, as reducedoverhead and marketing spending was partially offset byincreased foreign exchange transaction charges. SG&A as apercentage of net sales increased 10 basis points to 30.9 , asthe negative scale impacts of lower net sales and inflationary
impacts were partially offset by cost savings efforts. Marketingspending as a percentage of net sales decreased 60 basis pointsbehind lower spending due to efficiency efforts. Overheadspending as a percentage of net sales increased 40 basis pointsas productivity savings of 60 basis points from reducedoverhead spending were more than offset by wage inflation,investments in research and development, the negative scaleimpacts of lower net sales and higher restructuring costs.Increased foreign exchange transaction charges addedapproximately 30 basis points to SG&A as a percentage of netsales, as current year foreign currency transaction charges(from revaluing receivables and payables denominated in acurrency other than a local entity s functional currency) werepartially offset by lower year-on-year charges for enezuelaremeasurement and devaluation.
During fiscal 2015, the Company incurred a $2.0 billion ($2.1billion after tax) charge related to the deconsolidation of its
enezuelan subsidiaries. See the enezuela Impacts laterin the Results of Operations section.
The Procter & Gamble Company 28
Fiscal year 2014 compared with fiscal year 2013Gross margin contracted 100 basis points to 49.1 of net salesin 2014. The decrease in gross margin was primarily drivenby a 150 basis point impact from unfavorable geographic andproduct mix, a 50 basis point impact from higher commoditycosts and a 90 basis point impact from unfavorable foreignexchange, partially offset by manufacturing cost savings of 190basis points and a 40 basis point benefit from higher pricing.The unfavorable geographic and product mix was caused bydisproportionate growth in developing regions and the FabricCare and Home Care and aby, Feminine and Family Caresegments, which have lower gross margins than the Companyaverage.
Total SG&A decreased 5 to $24.8 billion in 2014 due to areduction in marketing spending, overhead expense,impairment charges and restructuring costs. SG&A as apercentage of net sales decreased 170 basis points to 30.8 .Lower restructuring spending drove 30 basis points of thedecline. Marketing spending as a percentage of net salesdecreased 80 basis points primarily due to lower spendingbehind a focus on more efficient marketing support and scalebenefits from increased net sales. Overhead spendingdecreased 50 basis points from productivity savings.Impairment charges were 40 basis points in 2013, but werezero in 2014. Charges for the 2014 foreign currency policychanges in enezuela were comparable to the 2013 enezueladevaluation impact.
During fiscal 2013, we incurred impairment charges of $308million ($290 million after tax) related to the carrying valueof goodwill in our Appliances business and the related rauntrade name intangible asset.
Non-O erating ItemsFiscal year 2015 compared with fiscal year 2014Interest expense was $626 million in 2015, a decrease of $84million versus the prior year due to lower average debt balancesand a decrease in weighted average interest rates. Interestincome was $151 million in 2015, an increase of $50 millionversus the prior year due to an increase in cash, cash equivalentsand investment securities. Other non-operating income, net,primarily includes divestiture gains and investment income.Other non-operating income increased $325 million to $531million, primarily due to minor brand divestiture gains. In2015, we had approximately $400 million in minor branddivestiture gains, including est, Camay, Fekkai and ash &Go hair care brands, Rochas and Laura iagotti fine fragrancebrands and aposteam. The prior year acquisition anddivestiture activities included approximately $150 million indivestiture gains, primarily related to the sale of our bleachbusinesses in Europe, IMEA and Latin America, our Pert haircare business in Latin America and MD IP.
Fiscal year 2014 compared with fiscal year 2013Interest expense increased 6 in 2014 to $710 million,primarily due to an increase in average debt outstanding.Interest income was $101 million in 2014, an increase of $13million versus the prior year due to an increase in cash, cashequivalents and investment securities. Other non-operating
income, net, primarily includes divestiture gains andinvestment income. Other non-operating income decreased$735 million to $206 million, primarily due to acquisition anddivestiture impacts. In 2014, we had approximately $150million in divestiture gains, primarily related to the sale of ourbleach businesses in Europe, IMEA and Latin America, ourPert hair care business in LatinAmerica and MD IP. The 2013acquisition and divestiture activities included a $631 millionholding gain resulting from P&G's purchase of the balance ofits aby Care and Feminine Care joint venture in Iberia andan approximate $250 million gain from the divestiture of ourItaly bleach business.
Income TaxesFiscal year 2015 compared with fiscal year 2014The effective tax rate on continuing operations increased 350basis points to 24.6 in 2015 mainly due to the non-deductibility of the $2.0 billion enezuelan deconsolidationcharge. The rate increase caused by lower current yearfavorable discrete adjustments related to uncertain income taxpositions (the net benefit was 80 basis points in the current yearversus 160 basis points in the prior year) was largely offset bya decrease related to favorable geographic earnings mix.
Fiscal year 2014 compared with fiscal year 2013The effective tax rate on continuing operations decreased 170basis points to 21.1 in 2014. The primary driver of this ratedecline was approximately 320 basis points from the favorablegeographic mix of earnings and approximately 60 basis pointsdue to the non-deductibility of the 2013 impairment chargesrelated to our Appliances business. These impacts werepartially offset by a 50 basis point increase due to the enezuelacurrency policy changes and devaluation discussed below(which decreased the prior year rate 20 basis points andincreased the current year rate by 30 basis points), a 110 basispoint increase due to the tax impacts of acquisition anddivestiture activities (the gains from the purchase of the balanceof the aby Care and Feminine Care joint venture in Iberia andthe sale of our Italy bleach business in 2013) and a 30 basispoint increase due to the net impact of favorable discreteadjustments related to uncertain income tax positions. The netbenefit 2014 was $228 million, or 160 basis points, versus 190basis points of net benefit in 2013.
Net EarningsFiscal year 2015 compared with fiscal year 2014Net earnings from continuing operations decreased $2.4 billionor 21 to $8.9 billion due to the $2.1 billion after tax chargerelated to the deconsolidation of enezuelan subsidiaries andthe decline in net sales, partially offset by reduced selling,general and administrative costs (SG&A). Foreign exchangeimpacts negatively affected net earnings by approximately$1.4 billion in 2015 due to the weakening of certain keycurrencies against the U.S. dollar, primarily in Russia, Ukraine,
enezuela and Argentina, partially offset by lower after-taxcharges related to balance sheet remeasurement charges in
enezuela.
29 The Procter & Gamble Company
Net earnings from discontinued operations decreased $2.3billion in 2015 due primarily to $2.1 billion of after taximpairment charges in our atteries business (see Note 2 tothe Consolidated Financial Statements) and the absence offiscal 2015 earnings from our divested Pet Care business. Netearnings attributable to Procter & Gamble decreased $4.6billion, or 40 to $7.0 billion.
Diluted net earnings per share from continuing operationsdecreased $0.80, or 21 , to $3.06 due to the decrease in netearnings. e had a diluted net loss per share from discontinuedoperations of $0.62 due primarily to the impairment chargeson the atteries business. This was a reduction of $0.78 pershare versus the prior year. Diluted net earnings per sharedecreased $1.57, or 39 , to $2.44.
Core EPS decreased 2 to $4.02. Core EPS represents dilutednet earnings per share from continuing operations excludingcharges for enezuelan deconsolidation, balance sheetremeasurement charges from foreign exchange policy changesand devaluation in enezuela (see below), charges for certainEuropean legal matters and incremental restructuring relatedto our productivity and cost savings plan. The decline wasdriven by reduced net sales, partially offset by minor branddivestiture gains.
Fiscal year 2014 compared with fiscal year 2013Net earnings from continuing operations increased $365million or 3 to $11.3 billion in 2014 due to the increase insales and a 40-basis point expansion in net earnings margin.The increase in net earnings margin was primarily driven bythe decrease in SG&Aas a percentage of net sales and the lowertax rate, partially offset by the gross margin contraction andthe acquisition and divestiture-driven net reduction in othernon-operating income, net.
Net earnings from discontinued operations increased $18million in 2014 due to stronger results in our atteries businessoffsetting the ongoing impacts of prior year product recalls inPet Care. Net earnings attributable to Procter & Gambleincreased $331 million, or 3 to $11.6 billion.
Diluted net earnings per share from continuing operationsincreased 4 to $3.86 primarily due to the increase in netearnings. Diluted net earnings per share from discontinuedoperations was $0.15 due to the earnings of the atteries andPet Care businesses. Diluted net earnings per share increased4 to $4.01.
Core EPS increased 5 to $4.09 primarily due to increased netsales, a 40 basis point net earnings margin expansion and thereduction in shares outstanding. Core EPS represents dilutednet earnings per share from continuing operations excludingcharges from foreign exchange policy changes and thedevaluation of the foreign exchange rates in enezuela (seebelow), the 2013 holding gain on the purchase of the balanceof our Iberian joint venture, the 2013 impairment of goodwilland indefinite-lived intangible assets and charges in both yearsfor European legal matters and incremental restructuringrelated to our productivity and cost savings plan.
Vene uela Im actsEffective June 30, 2015, the Company deconsolidated its local
enezuelan operations from our Consolidated FinancialStatements. P&G has operated in enezuela for over 65 yearsand remains committed to serving enezuelan consumers withour leading brands and products to grow our business. eexpect our operations in enezuela will continue for theforeseeable future. e continue to work proactively with the
enezuelan official agencies to ensure we fully understand andremain compliant as the policies within which our enezuelansubsidiaries operate evolve. e do not expect this change inaccounting to directly affect the local operations of our
enezuelan subsidiaries.There are a number of currency and other operating controlsand restrictions in enezuela, which have evolved over timeand may continue to evolve in the future. These evolvingconditions have resulted in an other-than-temporary lack ofexchangeability between the enezuelan bolivar and U.S.dollar and have restricted our enezuelan operations abilityto pay dividends and satisfy certain other obligationsdenominated in U.S. dollars. For accounting purposes, this hasresulted in a lack of control over our enezuelan subsidiaries.Therefore, in accordance with the applicable accountingstandards for consolidation, effective June 30, 2015, wedeconsolidated our enezuelan subsidiaries and beganaccounting for our investment in those subsidiaries using thecost method of accounting. This change resulted in a fourthquarter fiscal 2015 one-time before-tax charge of $2.0 billion($2.1 billion after tax, or $0.71 per share). In future periods,our financial results will only include sales of finished goodsto our enezuelan subsidiaries to the extent we receivepayments from enezuela (expected to be largely through theCENCOEX exchange market). Accordingly, we will no longerinclude the results of our enezuelan subsidiaries operationsin future reporting periods (see Note 1 to the ConsolidatedFinancial Statements). Our operations in enezuela accountedfor less than 2 of consolidated net sales and earnings fromcontinuing operations (before the deconsolidation charge)during fiscal 2015.
enezuela is a highly inflationary economy under U.S. GAAP.As a result, prior to deconsolidation, the U.S. dollar had beenthe functional currency for our subsidiaries in enezuela. Anumber of changes have been initiated in the enezuelanexchange rate system, including changes that resulted indevaluations to their currency. Prior to deconsolidation,currency remeasurement adjustments for non-dollardenominated monetary assets and liabilities held by our
enezuelan subsidiaries, along with any other transactionalforeign exchange gains and losses, have been reflected inearnings, and totaled $104 million, $275 million and $236million on an after-tax basis in 2015, 2014 and 2013,respectively.
There are currently three official exchange rate mechanismsin enezuela. The CENCOEX (National Center for ExternalCommerce) exchange rate is 6.3 enezuelan bolivares fuerte( EF) per dollar and can be used for the importation of certainqualifying products and materials. SICAD (Complementary
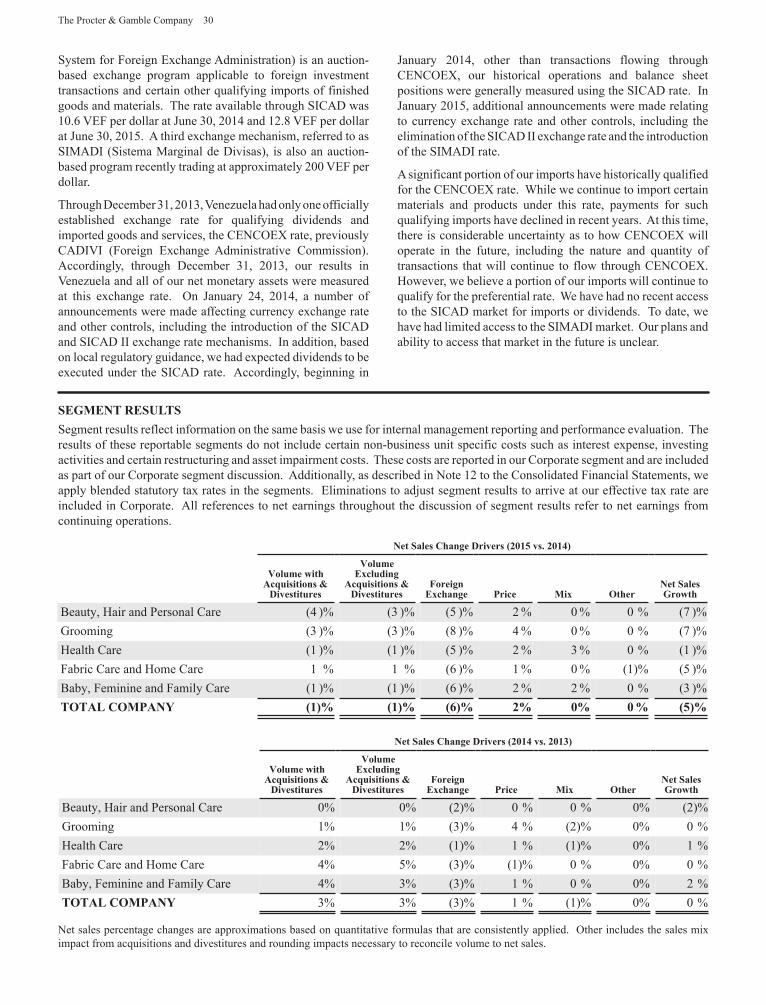
The Procter & Gamble Company 30
System for Foreign Exchange Administration) is an auction-based exchange program applicable to foreign investmenttransactions and certain other qualifying imports of finishedgoods and materials. The rate available through SICAD was10.6 EF per dollar at June 30, 2014 and 12.8 EF per dollarat June 30, 2015. A third exchange mechanism, referred to asSIMADI (Sistema Marginal de Divisas), is also an auction-based program recently trading at approximately 200 EF perdollar.
Through December 31, 2013, enezuela had only one officiallyestablished exchange rate for qualifying dividends andimported goods and services, the CENCOEX rate, previouslyCADI I (Foreign Exchange Administrative Commission).Accordingly, through December 31, 2013, our results in
enezuela and all of our net monetary assets were measuredat this exchange rate. On January 24, 2014, a number ofannouncements were made affecting currency exchange rateand other controls, including the introduction of the SICADand SICAD II exchange rate mechanisms. In addition, basedon local regulatory guidance, we had expected dividends to beexecuted under the SICAD rate. Accordingly, beginning in
January 2014, other than transactions flowing throughCENCOEX, our historical operations and balance sheetpositions were generally measured using the SICAD rate. InJanuary 2015, additional announcements were made relatingto currency exchange rate and other controls, including theelimination of the SICAD II exchange rate and the introductionof the SIMADI rate.
A significant portion of our imports have historically qualifiedfor the CENCOEX rate. hile we continue to import certainmaterials and products under this rate, payments for suchqualifying imports have declined in recent years. At this time,there is considerable uncertainty as to how CENCOEX willoperate in the future, including the nature and quantity oftransactions that will continue to flow through CENCOEX.However, we believe a portion of our imports will continue toqualify for the preferential rate. e have had no recent accessto the SICAD market for imports or dividends. To date, wehave had limited access to the SIMADI market. Our plans andability to access that market in the future is unclear.
SEGMENT RESULTSSegment results reflect information on the same basis we use for internal management reporting and performance evaluation. Theresults of these reportable segments do not include certain non-business unit specific costs such as interest expense, investingactivities and certain restructuring and asset impairment costs. These costs are reported in our Corporate segment and are includedas part of our Corporate segment discussion. Additionally, as described in Note 12 to the Consolidated Financial Statements, weapply blended statutory tax rates in the segments. Eliminations to adjust segment results to arrive at our effective tax rate areincluded in Corporate. All references to net earnings throughout the discussion of segment results refer to net earnings fromcontinuing operations.
Net Sales Change Dri ers 2015 s. 2014
Volume withAc uisitions &
Di estitures
VolumeExcluding
Ac uisitions &Di estitures
ForeignExchange Price Mix Other
Net SalesGrowth
eauty, Hair and Personal Care (4 ) (3 ) (5 ) 2 0 0 (7 )Grooming (3 ) (3 ) (8 ) 4 0 0 (7 )Health Care (1 ) (1 ) (5 ) 2 3 0 (1 )Fabric Care and Home Care 1 1 (6 ) 1 0 (1) (5 )
aby, Feminine and Family Care (1 ) (1 ) (6 ) 2 2 0 (3 )TOTAL COMPANY 1 1 2 0 0 5
Net Sales Change Dri ers 2014 s. 201
Volume withAc uisitions &
Di estitures
VolumeExcluding
Ac uisitions &Di estitures
ForeignExchange Price Mix Other
Net SalesGrowth
eauty, Hair and Personal Care 0 0 (2) 0 0 0 (2)Grooming 1 1 (3) 4 (2) 0 0Health Care 2 2 (1) 1 (1) 0 1Fabric Care and Home Care 4 5 (3) (1) 0 0 0
aby, Feminine and Family Care 4 3 (3) 1 0 0 2TOTAL COMPANY 3 3 (3) 1 (1) 0 0
Net sales percentage changes are approximations based on quantitative formulas that are consistently applied. Other includes the sales miximpact from acquisitions and divestitures and rounding impacts necessary to reconcile volume to net sales.
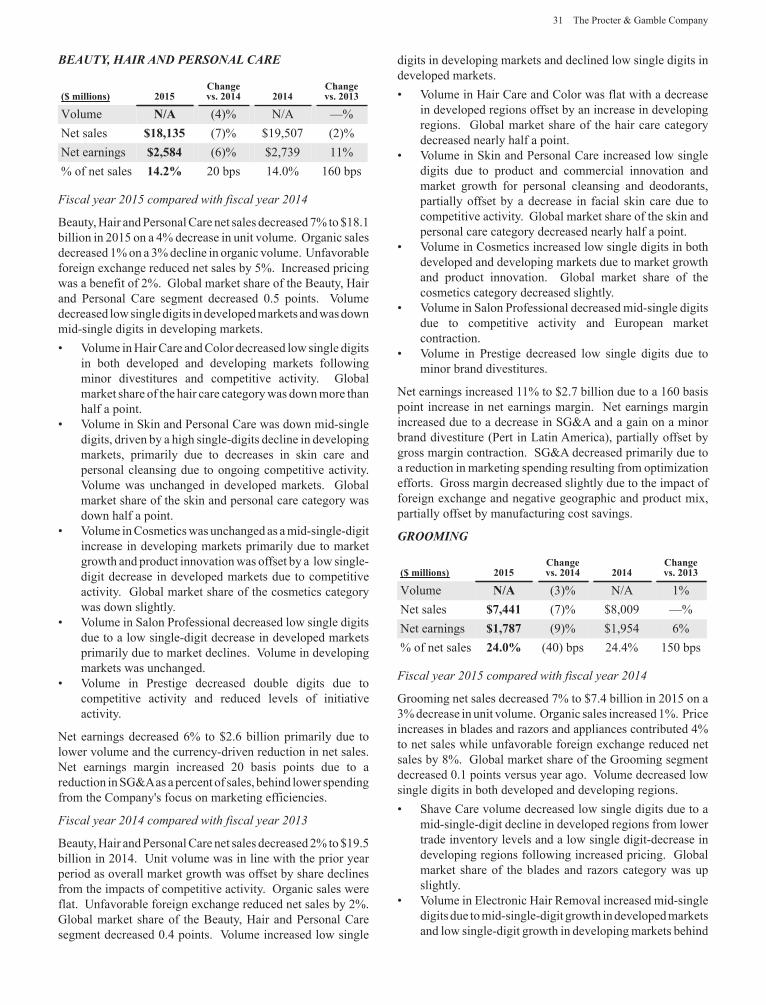
31 The Procter & Gamble Company
R D R R
millions 2015Changes. 2014 2014
Changes. 201
olume N A (4) N ANet sales 1 ,1 5 (7) $19,507 (2)Net earnings 2,5 4 (6) $2,739 11
of net sales 14.2 20 bps 14.0 160 bps
Fiscal year 2015 compared with fiscal year 2014
eauty, Hair and Personal Care net sales decreased 7 to $18.1billion in 2015 on a 4 decrease in unit volume. Organic salesdecreased 1 on a 3 decline in organic volume. Unfavorableforeign exchange reduced net sales by 5 . Increased pricingwas a benefit of 2 . Global market share of the eauty, Hairand Personal Care segment decreased 0.5 points. olumedecreased low single digits in developed markets and was downmid-single digits in developing markets.
olume in Hair Care and Color decreased low single digitsin both developed and developing markets followingminor divestitures and competitive activity. Globalmarket share of the hair care category was down more thanhalf a point.
olume in Skin and Personal Care was down mid-singledigits, driven by a high single-digits decline in developingmarkets, primarily due to decreases in skin care andpersonal cleansing due to ongoing competitive activity.
olume was unchanged in developed markets. Globalmarket share of the skin and personal care category wasdown half a point.
olume in Cosmetics was unchanged as a mid-single-digitincrease in developing markets primarily due to marketgrowth and product innovation was offset by a low single-digit decrease in developed markets due to competitiveactivity. Global market share of the cosmetics categorywas down slightly.
olume in Salon Professional decreased low single digitsdue to a low single-digit decrease in developed marketsprimarily due to market declines. olume in developingmarkets was unchanged.
olume in Prestige decreased double digits due tocompetitive activity and reduced levels of initiativeactivity.
Net earnings decreased 6 to $2.6 billion primarily due tolower volume and the currency-driven reduction in net sales.Net earnings margin increased 20 basis points due to areduction in SG&Aas a percent of sales, behind lower spendingfrom the Company's focus on marketing efficiencies.
Fiscal year 2014 compared with fiscal year 2013
eauty, Hair and Personal Care net sales decreased 2 to $19.5billion in 2014. Unit volume was in line with the prior yearperiod as overall market growth was offset by share declinesfrom the impacts of competitive activity. Organic sales wereflat. Unfavorable foreign exchange reduced net sales by 2 .Global market share of the eauty, Hair and Personal Caresegment decreased 0.4 points. olume increased low single
digits in developing markets and declined low single digits indeveloped markets.
olume in Hair Care and Color was flat with a decreasein developed regions offset by an increase in developingregions. Global market share of the hair care categorydecreased nearly half a point.
olume in Skin and Personal Care increased low singledigits due to product and commercial innovation andmarket growth for personal cleansing and deodorants,partially offset by a decrease in facial skin care due tocompetitive activity. Global market share of the skin andpersonal care category decreased nearly half a point.
olume in Cosmetics increased low single digits in bothdeveloped and developing markets due to market growthand product innovation. Global market share of thecosmetics category decreased slightly.
olume in Salon Professional decreased mid-single digitsdue to competitive activity and European marketcontraction.
olume in Prestige decreased low single digits due tominor brand divestitures.
Net earnings increased 11 to $2.7 billion due to a 160 basispoint increase in net earnings margin. Net earnings marginincreased due to a decrease in SG&A and a gain on a minorbrand divestiture (Pert in Latin America), partially offset bygross margin contraction. SG&A decreased primarily due toa reduction in marketing spending resulting from optimizationefforts. Gross margin decreased slightly due to the impact offoreign exchange and negative geographic and product mix,partially offset by manufacturing cost savings.
R
millions 2015Changes. 2014 2014
Changes. 201
olume N A (3) N A 1Net sales ,441 (7) $8,009Net earnings 1, (9) $1,954 6
of net sales 24.0 (40) bps 24.4 150 bps
Fiscal year 2015 compared with fiscal year 2014
Grooming net sales decreased 7 to $7.4 billion in 2015 on a3 decrease in unit volume. Organic sales increased 1 . Priceincreases in blades and razors and appliances contributed 4to net sales while unfavorable foreign exchange reduced netsales by 8 . Global market share of the Grooming segmentdecreased 0.1 points versus year ago. olume decreased lowsingle digits in both developed and developing regions.
Shave Care volume decreased low single digits due to amid-single-digit decline in developed regions from lowertrade inventory levels and a low single digit-decrease indeveloping regions following increased pricing. Globalmarket share of the blades and razors category was upslightly.
olume in Electronic Hair Removal increased mid-singledigits due to mid-single-digit growth in developed marketsand low single-digit growth in developing markets behind
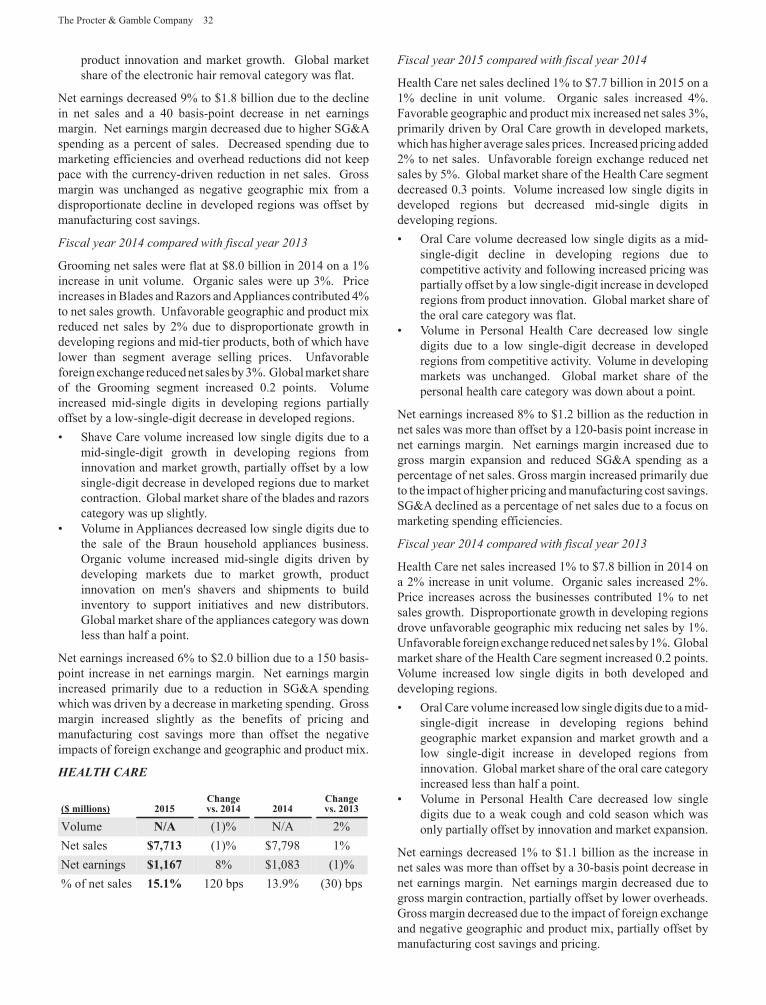
The Procter & Gamble Company 32
product innovation and market growth. Global marketshare of the electronic hair removal category was flat.
Net earnings decreased 9 to $1.8 billion due to the declinein net sales and a 40 basis-point decrease in net earningsmargin. Net earnings margin decreased due to higher SG&Aspending as a percent of sales. Decreased spending due tomarketing efficiencies and overhead reductions did not keeppace with the currency-driven reduction in net sales. Grossmargin was unchanged as negative geographic mix from adisproportionate decline in developed regions was offset bymanufacturing cost savings.
Fiscal year 2014 compared with fiscal year 2013
Grooming net sales were flat at $8.0 billion in 2014 on a 1increase in unit volume. Organic sales were up 3 . Priceincreases in lades and Razors and Appliances contributed 4to net sales growth. Unfavorable geographic and product mixreduced net sales by 2 due to disproportionate growth indeveloping regions and mid-tier products, both of which havelower than segment average selling prices. Unfavorableforeign exchange reduced net sales by 3 . Global market shareof the Grooming segment increased 0.2 points. olumeincreased mid-single digits in developing regions partiallyoffset by a low-single-digit decrease in developed regions.
Shave Care volume increased low single digits due to amid-single-digit growth in developing regions frominnovation and market growth, partially offset by a lowsingle-digit decrease in developed regions due to marketcontraction. Global market share of the blades and razorscategory was up slightly.
olume in Appliances decreased low single digits due tothe sale of the raun household appliances business.Organic volume increased mid-single digits driven bydeveloping markets due to market growth, productinnovation on men's shavers and shipments to buildinventory to support initiatives and new distributors.Global market share of the appliances category was downless than half a point.
Net earnings increased 6 to $2.0 billion due to a 150 basis-point increase in net earnings margin. Net earnings marginincreased primarily due to a reduction in SG&A spendingwhich was driven by a decrease in marketing spending. Grossmargin increased slightly as the benefits of pricing andmanufacturing cost savings more than offset the negativeimpacts of foreign exchange and geographic and product mix.
R
millions 2015Changes. 2014 2014
Changes. 201
olume N A (1) N A 2Net sales , 1 (1) $7,798 1Net earnings 1,1 8 $1,083 (1)
of net sales 15.1 120 bps 13.9 (30) bps
Fiscal year 2015 compared with fiscal year 2014
Health Care net sales declined 1 to $7.7 billion in 2015 on a1 decline in unit volume. Organic sales increased 4 .Favorable geographic and product mix increased net sales 3 ,primarily driven by Oral Care growth in developed markets,which has higher average sales prices. Increased pricing added2 to net sales. Unfavorable foreign exchange reduced netsales by 5 . Global market share of the Health Care segmentdecreased 0.3 points. olume increased low single digits indeveloped regions but decreased mid-single digits indeveloping regions.
Oral Care volume decreased low single digits as a mid-single-digit decline in developing regions due tocompetitive activity and following increased pricing waspartially offset by a low single-digit increase in developedregions from product innovation. Global market share ofthe oral care category was flat.
olume in Personal Health Care decreased low singledigits due to a low single-digit decrease in developedregions from competitive activity. olume in developingmarkets was unchanged. Global market share of thepersonal health care category was down about a point.
Net earnings increased 8 to $1.2 billion as the reduction innet sales was more than offset by a 120-basis point increase innet earnings margin. Net earnings margin increased due togross margin expansion and reduced SG&A spending as apercentage of net sales. Gross margin increased primarily dueto the impact of higher pricing and manufacturing cost savings.SG&A declined as a percentage of net sales due to a focus onmarketing spending efficiencies.
Fiscal year 2014 compared with fiscal year 2013
Health Care net sales increased 1 to $7.8 billion in 2014 ona 2 increase in unit volume. Organic sales increased 2 .Price increases across the businesses contributed 1 to netsales growth. Disproportionate growth in developing regionsdrove unfavorable geographic mix reducing net sales by 1 .Unfavorable foreign exchange reduced net sales by 1 . Globalmarket share of the Health Care segment increased 0.2 points.
olume increased low single digits in both developed anddeveloping regions.
Oral Care volume increased low single digits due to a mid-single-digit increase in developing regions behindgeographic market expansion and market growth and alow single-digit increase in developed regions frominnovation. Global market share of the oral care categoryincreased less than half a point.
olume in Personal Health Care decreased low singledigits due to a weak cough and cold season which wasonly partially offset by innovation and market expansion.
Net earnings decreased 1 to $1.1 billion as the increase innet sales was more than offset by a 30-basis point decrease innet earnings margin. Net earnings margin decreased due togross margin contraction, partially offset by lower overheads.Gross margin decreased due to the impact of foreign exchangeand negative geographic and product mix, partially offset bymanufacturing cost savings and pricing.
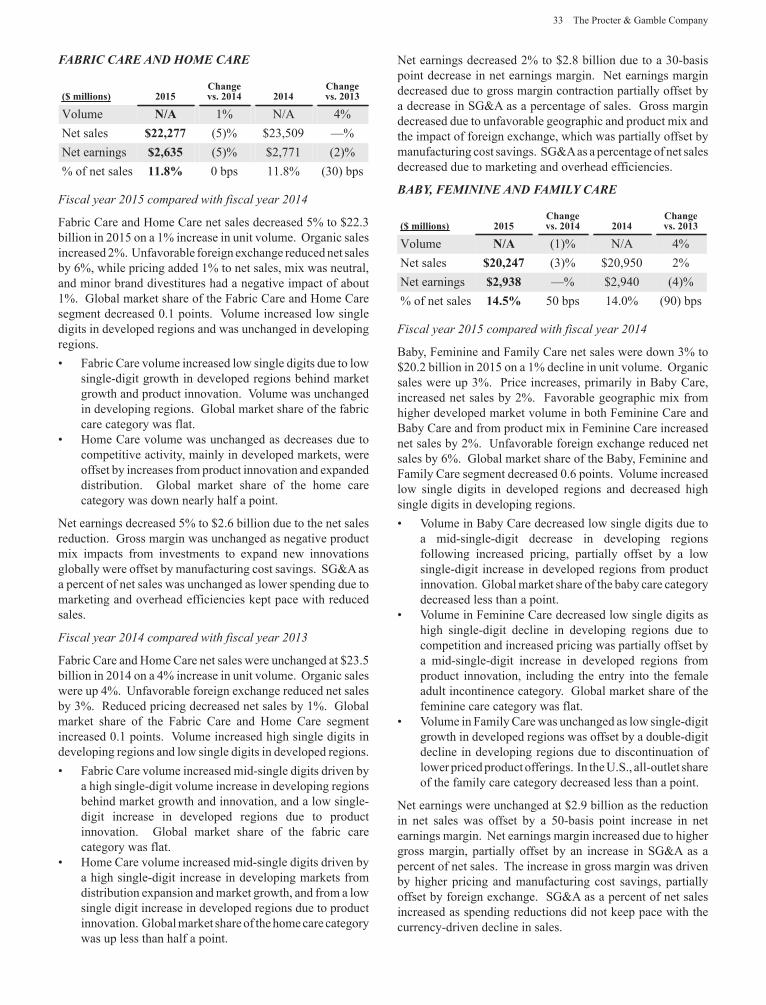
33 The Procter & Gamble Company
R R D R
millions 2015Changes. 2014 2014
Changes. 201
olume N A 1 N A 4Net sales 22,2 (5) $23,509Net earnings 2, 5 (5) $2,771 (2)
of net sales 11. 0 bps 11.8 (30) bps
Fiscal year 2015 compared with fiscal year 2014
Fabric Care and Home Care net sales decreased 5 to $22.3billion in 2015 on a 1 increase in unit volume. Organic salesincreased 2 . Unfavorable foreign exchange reduced net salesby 6 , while pricing added 1 to net sales, mix was neutral,and minor brand divestitures had a negative impact of about1 . Global market share of the Fabric Care and Home Caresegment decreased 0.1 points. olume increased low singledigits in developed regions and was unchanged in developingregions.
Fabric Care volume increased low single digits due to lowsingle-digit growth in developed regions behind marketgrowth and product innovation. olume was unchangedin developing regions. Global market share of the fabriccare category was flat.Home Care volume was unchanged as decreases due tocompetitive activity, mainly in developed markets, wereoffset by increases from product innovation and expandeddistribution. Global market share of the home carecategory was down nearly half a point.
Net earnings decreased 5 to $2.6 billion due to the net salesreduction. Gross margin was unchanged as negative productmix impacts from investments to expand new innovationsglobally were offset by manufacturing cost savings. SG&A asa percent of net sales was unchanged as lower spending due tomarketing and overhead efficiencies kept pace with reducedsales.
Fiscal year 2014 compared with fiscal year 2013
Fabric Care and Home Care net sales were unchanged at $23.5billion in 2014 on a 4 increase in unit volume. Organic saleswere up 4 . Unfavorable foreign exchange reduced net salesby 3 . Reduced pricing decreased net sales by 1 . Globalmarket share of the Fabric Care and Home Care segmentincreased 0.1 points. olume increased high single digits indeveloping regions and low single digits in developed regions.
Fabric Care volume increased mid-single digits driven bya high single-digit volume increase in developing regionsbehind market growth and innovation, and a low single-digit increase in developed regions due to productinnovation. Global market share of the fabric carecategory was flat.Home Care volume increased mid-single digits driven bya high single-digit increase in developing markets fromdistribution expansion and market growth, and from a lowsingle digit increase in developed regions due to productinnovation. Global market share of the home care categorywas up less than half a point.
Net earnings decreased 2 to $2.8 billion due to a 30-basispoint decrease in net earnings margin. Net earnings margindecreased due to gross margin contraction partially offset bya decrease in SG&A as a percentage of sales. Gross margindecreased due to unfavorable geographic and product mix andthe impact of foreign exchange, which was partially offset bymanufacturing cost savings. SG&Aas a percentage of net salesdecreased due to marketing and overhead efficiencies.
D R
millions 2015Changes. 2014 2014
Changes. 201
olume N A (1) N A 4Net sales 20,24 (3) $20,950 2Net earnings 2,9 $2,940 (4)
of net sales 14.5 50 bps 14.0 (90) bps
Fiscal year 2015 compared with fiscal year 2014
aby, Feminine and Family Care net sales were down 3 to$20.2 billion in 2015 on a 1 decline in unit volume. Organicsales were up 3 . Price increases, primarily in aby Care,increased net sales by 2 . Favorable geographic mix fromhigher developed market volume in both Feminine Care and
aby Care and from product mix in Feminine Care increasednet sales by 2 . Unfavorable foreign exchange reduced netsales by 6 . Global market share of the aby, Feminine andFamily Care segment decreased 0.6 points. olume increasedlow single digits in developed regions and decreased highsingle digits in developing regions.
olume in aby Care decreased low single digits due toa mid-single-digit decrease in developing regionsfollowing increased pricing, partially offset by a lowsingle-digit increase in developed regions from productinnovation. Global market share of the baby care categorydecreased less than a point.
olume in Feminine Care decreased low single digits ashigh single-digit decline in developing regions due tocompetition and increased pricing was partially offset bya mid-single-digit increase in developed regions fromproduct innovation, including the entry into the femaleadult incontinence category. Global market share of thefeminine care category was flat.
olume in Family Care was unchanged as low single-digitgrowth in developed regions was offset by a double-digitdecline in developing regions due to discontinuation oflower priced product offerings. In the U.S., all-outlet shareof the family care category decreased less than a point.
Net earnings were unchanged at $2.9 billion as the reductionin net sales was offset by a 50-basis point increase in netearnings margin. Net earnings margin increased due to highergross margin, partially offset by an increase in SG&A as apercent of net sales. The increase in gross margin was drivenby higher pricing and manufacturing cost savings, partiallyoffset by foreign exchange. SG&A as a percent of net salesincreased as spending reductions did not keep pace with thecurrency-driven decline in sales.
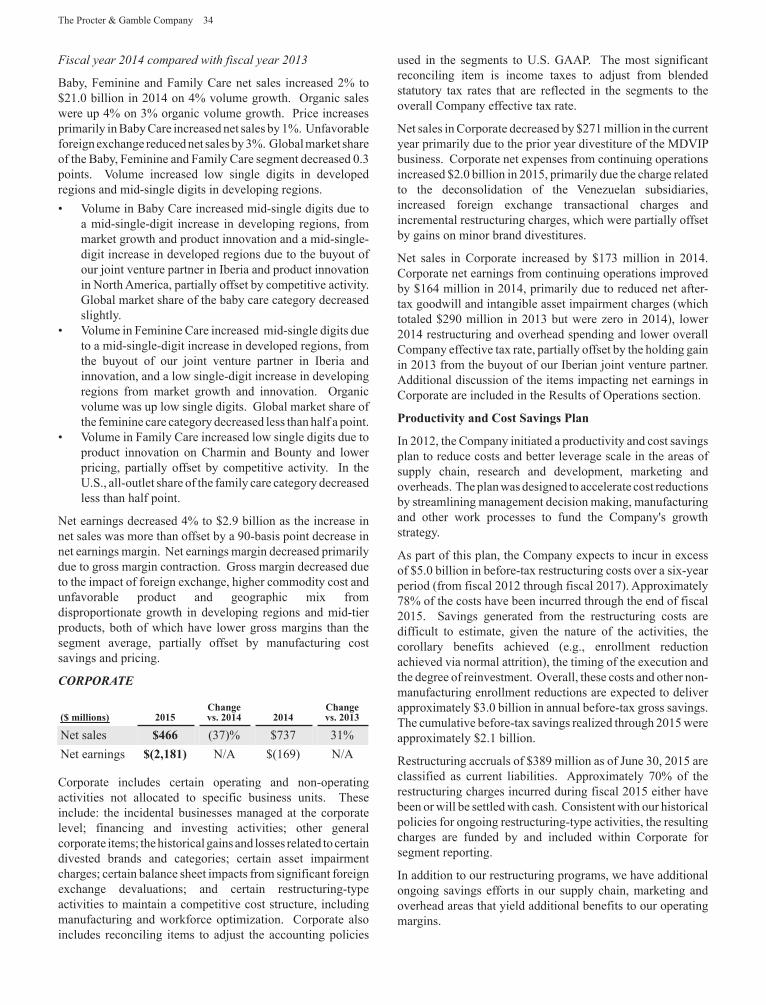
The Procter & Gamble Company 34
Fiscal year 2014 compared with fiscal year 2013
aby, Feminine and Family Care net sales increased 2 to$21.0 billion in 2014 on 4 volume growth. Organic saleswere up 4 on 3 organic volume growth. Price increasesprimarily in aby Care increased net sales by 1 . Unfavorableforeign exchange reduced net sales by 3 . Global market shareof the aby, Feminine and Family Care segment decreased 0.3points. olume increased low single digits in developedregions and mid-single digits in developing regions.
olume in aby Care increased mid-single digits due toa mid-single-digit increase in developing regions, frommarket growth and product innovation and a mid-single-digit increase in developed regions due to the buyout ofour joint venture partner in Iberia and product innovationin North America, partially offset by competitive activity.Global market share of the baby care category decreasedslightly.
olume in Feminine Care increased mid-single digits dueto a mid-single-digit increase in developed regions, fromthe buyout of our joint venture partner in Iberia andinnovation, and a low single-digit increase in developingregions from market growth and innovation. Organicvolume was up low single digits. Global market share ofthe feminine care category decreased less than half a point.
olume in Family Care increased low single digits due toproduct innovation on Charmin and ounty and lowerpricing, partially offset by competitive activity. In theU.S., all-outlet share of the family care category decreasedless than half point.
Net earnings decreased 4 to $2.9 billion as the increase innet sales was more than offset by a 90-basis point decrease innet earnings margin. Net earnings margin decreased primarilydue to gross margin contraction. Gross margin decreased dueto the impact of foreign exchange, higher commodity cost andunfavorable product and geographic mix fromdisproportionate growth in developing regions and mid-tierproducts, both of which have lower gross margins than thesegment average, partially offset by manufacturing costsavings and pricing.
R R
millions 2015Changes. 2014 2014
Changes. 201
Net sales 4 (37) $737 31Net earnings 2,1 1 N A $(169) N A
Corporate includes certain operating and non-operatingactivities not allocated to specific business units. Theseinclude: the incidental businesses managed at the corporatelevel financing and investing activities other generalcorporate items the historical gains and losses related to certaindivested brands and categories certain asset impairmentcharges certain balance sheet impacts from significant foreignexchange devaluations and certain restructuring-typeactivities to maintain a competitive cost structure, includingmanufacturing and workforce optimization. Corporate alsoincludes reconciling items to adjust the accounting policies
used in the segments to U.S. GAAP. The most significantreconciling item is income taxes to adjust from blendedstatutory tax rates that are reflected in the segments to theoverall Company effective tax rate.
Net sales in Corporate decreased by $271 million in the currentyear primarily due to the prior year divestiture of the MD IPbusiness. Corporate net expenses from continuing operationsincreased $2.0 billion in 2015, primarily due the charge relatedto the deconsolidation of the enezuelan subsidiaries,increased foreign exchange transactional charges andincremental restructuring charges, which were partially offsetby gains on minor brand divestitures.
Net sales in Corporate increased by $173 million in 2014.Corporate net earnings from continuing operations improvedby $164 million in 2014, primarily due to reduced net after-tax goodwill and intangible asset impairment charges (whichtotaled $290 million in 2013 but were zero in 2014), lower2014 restructuring and overhead spending and lower overallCompany effective tax rate, partially offset by the holding gainin 2013 from the buyout of our Iberian joint venture partner.Additional discussion of the items impacting net earnings inCorporate are included in the Results of Operations section.
Producti it and Cost Sa ings Plan
In 2012, the Company initiated a productivity and cost savingsplan to reduce costs and better leverage scale in the areas ofsupply chain, research and development, marketing andoverheads. The plan was designed to accelerate cost reductionsby streamlining management decision making, manufacturingand other work processes to fund the Company's growthstrategy.
As part of this plan, the Company expects to incur in excessof $5.0 billion in before-tax restructuring costs over a six-yearperiod (from fiscal 2012 through fiscal 2017). Approximately78 of the costs have been incurred through the end of fiscal2015. Savings generated from the restructuring costs aredifficult to estimate, given the nature of the activities, thecorollary benefits achieved (e.g., enrollment reductionachieved via normal attrition), the timing of the execution andthe degree of reinvestment. Overall, these costs and other non-manufacturing enrollment reductions are expected to deliverapproximately $3.0 billion in annual before-tax gross savings.The cumulative before-tax savings realized through 2015 wereapproximately $2.1 billion.
Restructuring accruals of $389 million as of June 30, 2015 areclassified as current liabilities. Approximately 70 of therestructuring charges incurred during fiscal 2015 either havebeen or will be settled with cash. Consistent with our historicalpolicies for ongoing restructuring-type activities, the resultingcharges are funded by and included within Corporate forsegment reporting.
In addition to our restructuring programs, we have additionalongoing savings efforts in our supply chain, marketing andoverhead areas that yield additional benefits to our operatingmargins.
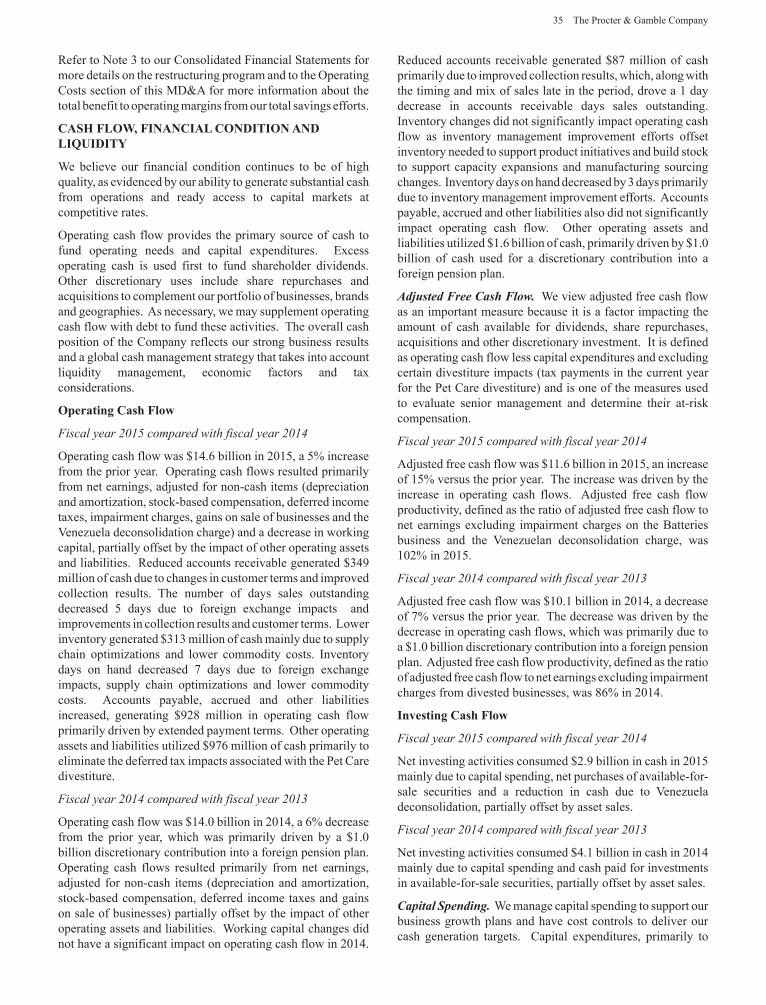
35 The Procter & Gamble Company
Refer to Note 3 to our Consolidated Financial Statements formore details on the restructuring program and to the OperatingCosts section of this MD&A for more information about thetotal benefit to operating margins from our total savings efforts.
CASH FLOW, FINANCIAL CONDITION ANDLI UIDITY
e believe our financial condition continues to be of highquality, as evidenced by our ability to generate substantial cashfrom operations and ready access to capital markets atcompetitive rates.
Operating cash flow provides the primary source of cash tofund operating needs and capital expenditures. Excessoperating cash is used first to fund shareholder dividends.Other discretionary uses include share repurchases andacquisitions to complement our portfolio of businesses, brandsand geographies. As necessary, we may supplement operatingcash flow with debt to fund these activities. The overall cashposition of the Company reflects our strong business resultsand a global cash management strategy that takes into accountliquidity management, economic factors and taxconsiderations.
O erating Cash Flow
Fiscal year 2015 compared with fiscal year 2014
Operating cash flow was $14.6 billion in 2015, a 5 increasefrom the prior year. Operating cash flows resulted primarilyfrom net earnings, adjusted for non-cash items (depreciationand amortization, stock-based compensation, deferred incometaxes, impairment charges, gains on sale of businesses and the
enezuela deconsolidation charge) and a decrease in workingcapital, partially offset by the impact of other operating assetsand liabilities. Reduced accounts receivable generated $349million of cash due to changes in customer terms and improvedcollection results. The number of days sales outstandingdecreased 5 days due to foreign exchange impacts andimprovements in collection results and customer terms. Lowerinventory generated $313 million of cash mainly due to supplychain optimizations and lower commodity costs. Inventorydays on hand decreased 7 days due to foreign exchangeimpacts, supply chain optimizations and lower commoditycosts. Accounts payable, accrued and other liabilitiesincreased, generating $928 million in operating cash flowprimarily driven by extended payment terms. Other operatingassets and liabilities utilized $976 million of cash primarily toeliminate the deferred tax impacts associated with the Pet Caredivestiture.
Fiscal year 2014 compared with fiscal year 2013
Operating cash flow was $14.0 billion in 2014, a 6 decreasefrom the prior year, which was primarily driven by a $1.0billion discretionary contribution into a foreign pension plan.Operating cash flows resulted primarily from net earnings,adjusted for non-cash items (depreciation and amortization,stock-based compensation, deferred income taxes and gainson sale of businesses) partially offset by the impact of otheroperating assets and liabilities. orking capital changes didnot have a significant impact on operating cash flow in 2014.
Reduced accounts receivable generated $87 million of cashprimarily due to improved collection results, which, along withthe timing and mix of sales late in the period, drove a 1 daydecrease in accounts receivable days sales outstanding.Inventory changes did not significantly impact operating cashflow as inventory management improvement efforts offsetinventory needed to support product initiatives and build stockto support capacity expansions and manufacturing sourcingchanges. Inventory days on hand decreased by 3 days primarilydue to inventory management improvement efforts. Accountspayable, accrued and other liabilities also did not significantlyimpact operating cash flow. Other operating assets andliabilities utilized $1.6 billion of cash, primarily driven by $1.0billion of cash used for a discretionary contribution into aforeign pension plan.
ste ee s lo e view adjusted free cash flowas an important measure because it is a factor impacting theamount of cash available for dividends, share repurchases,acquisitions and other discretionary investment. It is definedas operating cash flow less capital expenditures and excludingcertain divestiture impacts (tax payments in the current yearfor the Pet Care divestiture) and is one of the measures usedto evaluate senior management and determine their at-riskcompensation.
Fiscal year 2015 compared with fiscal year 2014
Adjusted free cash flow was $11.6 billion in 2015, an increaseof 15 versus the prior year. The increase was driven by theincrease in operating cash flows. Adjusted free cash flowproductivity, defined as the ratio of adjusted free cash flow tonet earnings excluding impairment charges on the atteriesbusiness and the enezuelan deconsolidation charge, was102 in 2015.
Fiscal year 2014 compared with fiscal year 2013
Adjusted free cash flow was $10.1 billion in 2014, a decreaseof 7 versus the prior year. The decrease was driven by thedecrease in operating cash flows, which was primarily due toa $1.0 billion discretionary contribution into a foreign pensionplan. Adjusted free cash flow productivity, defined as the ratioof adjusted free cash flow to net earnings excluding impairmentcharges from divested businesses, was 86 in 2014.
In esting Cash Flow
Fiscal year 2015 compared with fiscal year 2014
Net investing activities consumed $2.9 billion in cash in 2015mainly due to capital spending, net purchases of available-for-sale securities and a reduction in cash due to enezueladeconsolidation, partially offset by asset sales.
Fiscal year 2014 compared with fiscal year 2013
Net investing activities consumed $4.1 billion in cash in 2014mainly due to capital spending and cash paid for investmentsin available-for-sale securities, partially offset by asset sales.
p t l pen n e manage capital spending to support ourbusiness growth plans and have cost controls to deliver ourcash generation targets. Capital expenditures, primarily to
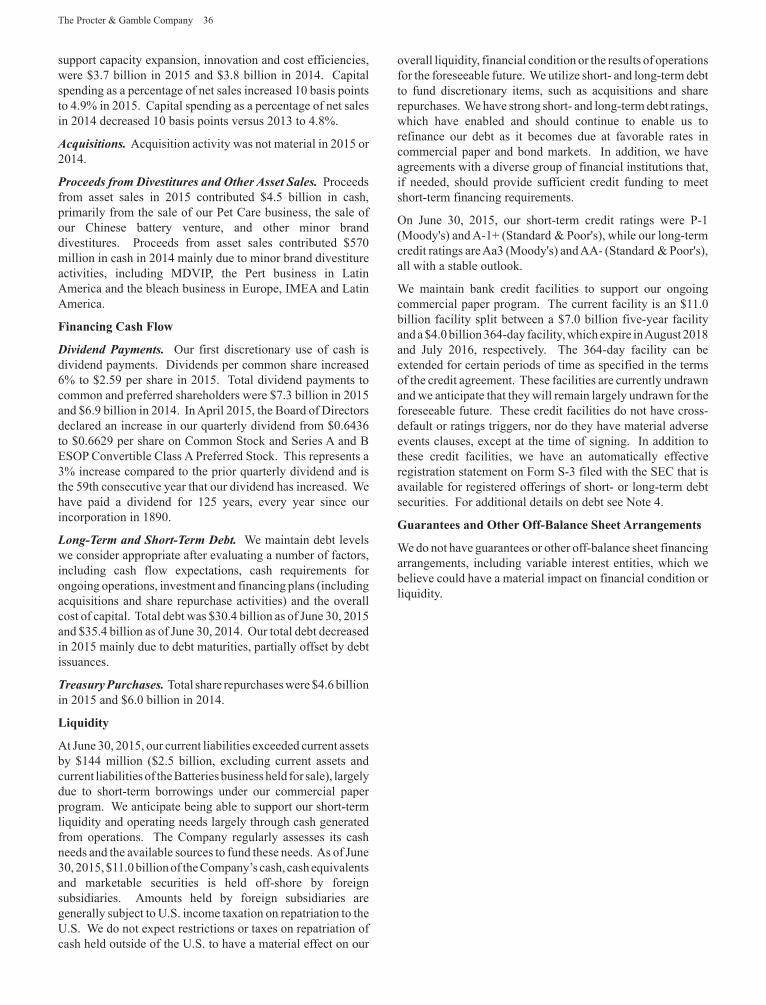
The Procter & Gamble Company 36
support capacity expansion, innovation and cost efficiencies,were $3.7 billion in 2015 and $3.8 billion in 2014. Capitalspending as a percentage of net sales increased 10 basis pointsto 4.9 in 2015. Capital spending as a percentage of net salesin 2014 decreased 10 basis points versus 2013 to 4.8 .
c s t ons Acquisition activity was not material in 2015 or2014.
ocee s om D vest t es n t e sset les Proceedsfrom asset sales in 2015 contributed $4.5 billion in cash,primarily from the sale of our Pet Care business, the sale ofour Chinese battery venture, and other minor branddivestitures. Proceeds from asset sales contributed $570million in cash in 2014 mainly due to minor brand divestitureactivities, including MD IP, the Pert business in LatinAmerica and the bleach business in Europe, IMEA and LatinAmerica.
Financing Cash Flow
D v en ments Our first discretionary use of cash isdividend payments. Dividends per common share increased6 to $2.59 per share in 2015. Total dividend payments tocommon and preferred shareholders were $7.3 billion in 2015and $6.9 billion in 2014. In April 2015, the oard of Directorsdeclared an increase in our quarterly dividend from $0.6436to $0.6629 per share on Common Stock and Series A andESOP Convertible Class A Preferred Stock. This represents a3 increase compared to the prior quarterly dividend and isthe 59th consecutive year that our dividend has increased. ehave paid a dividend for 125 years, every year since ourincorporation in 1890.
on e m n o t e m De t e maintain debt levelswe consider appropriate after evaluating a number of factors,including cash flow expectations, cash requirements forongoing operations, investment and financing plans (includingacquisitions and share repurchase activities) and the overallcost of capital. Total debt was $30.4 billion as of June 30, 2015and $35.4 billion as of June 30, 2014. Our total debt decreasedin 2015 mainly due to debt maturities, partially offset by debtissuances.
e s c ses Total share repurchases were $4.6 billionin 2015 and $6.0 billion in 2014.
Li uidit
At June 30, 2015, our current liabilities exceeded current assetsby $144 million ($2.5 billion, excluding current assets andcurrent liabilities of the atteries business held for sale), largelydue to short-term borrowings under our commercial paperprogram. e anticipate being able to support our short-termliquidity and operating needs largely through cash generatedfrom operations. The Company regularly assesses its cashneeds and the available sources to fund these needs. As of June30, 2015, $11.0 billion of the Company s cash, cash equivalentsand marketable securities is held off-shore by foreignsubsidiaries. Amounts held by foreign subsidiaries aregenerally subject to U.S. income taxation on repatriation to theU.S. e do not expect restrictions or taxes on repatriation ofcash held outside of the U.S. to have a material effect on our
overall liquidity, financial condition or the results of operationsfor the foreseeable future. e utilize short- and long-term debtto fund discretionary items, such as acquisitions and sharerepurchases. e have strong short- and long-term debt ratings,which have enabled and should continue to enable us torefinance our debt as it becomes due at favorable rates incommercial paper and bond markets. In addition, we haveagreements with a diverse group of financial institutions that,if needed, should provide sufficient credit funding to meetshort-term financing requirements.
On June 30, 2015, our short-term credit ratings were P-1(Moody's) and A-1 (Standard & Poor's), while our long-termcredit ratings are Aa3 (Moody's) and AA- (Standard & Poor's),all with a stable outlook.
e maintain bank credit facilities to support our ongoingcommercial paper program. The current facility is an $11.0billion facility split between a $7.0 billion five-year facilityand a $4.0 billion 364-day facility, which expire inAugust 2018and July 2016, respectively. The 364-day facility can beextended for certain periods of time as specified in the termsof the credit agreement. These facilities are currently undrawnand we anticipate that they will remain largely undrawn for theforeseeable future. These credit facilities do not have cross-default or ratings triggers, nor do they have material adverseevents clauses, except at the time of signing. In addition tothese credit facilities, we have an automatically effectiveregistration statement on Form S-3 filed with the SEC that isavailable for registered offerings of short- or long-term debtsecurities. For additional details on debt see Note 4.
Guarantees and Other Off-Balance Sheet Arrangements
e do not have guarantees or other off-balance sheet financingarrangements, including variable interest entities, which webelieve could have a material impact on financial condition orliquidity.
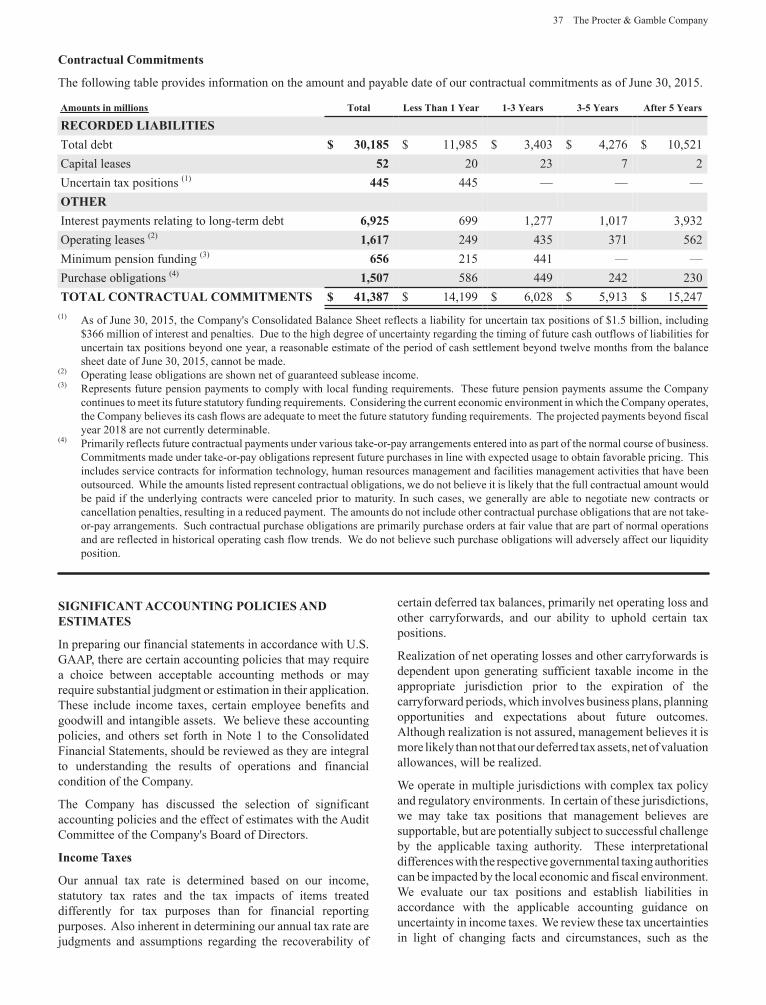
37 The Procter & Gamble Company
Contractual Commitments
The following table provides information on the amount and payable date of our contractual commitments as of June 30, 2015.
Amounts in millions Total Less Than 1 Year 1- Years -5 Years After 5 Years
RECORDED LIABILITIESTotal debt 0,1 5 $ 11,985 $ 3,403 $ 4,276 $ 10,521Capital leases 52 20 23 7 2Uncertain tax positions (1) 445 445OTHERInterest payments relating to long-term debt ,925 699 1,277 1,017 3,932Operating leases (2) 1, 1 249 435 371 562Minimum pension funding (3) 5 215 441Purchase obligations (4) 1,50 586 449 242 230TOTAL CONTRACTUAL COMMITMENTS 41, $ 14,199 $ 6,028 $ 5,913 $ 15,247
(1) As of June 30, 2015, the Company's Consolidated alance Sheet reflects a liability for uncertain tax positions of $1.5 billion, including$366 million of interest and penalties. Due to the high degree of uncertainty regarding the timing of future cash outflows of liabilities foruncertain tax positions beyond one year, a reasonable estimate of the period of cash settlement beyond twelve months from the balancesheet date of June 30, 2015, cannot be made.
(2) Operating lease obligations are shown net of guaranteed sublease income.(3) Represents future pension payments to comply with local funding requirements. These future pension payments assume the Company
continues to meet its future statutory funding requirements. Considering the current economic environment in which the Company operates,the Company believes its cash flows are adequate to meet the future statutory funding requirements. The projected payments beyond fiscalyear 2018 are not currently determinable.
(4) Primarily reflects future contractual payments under various take-or-pay arrangements entered into as part of the normal course of business.Commitments made under take-or-pay obligations represent future purchases in line with expected usage to obtain favorable pricing. Thisincludes service contracts for information technology, human resources management and facilities management activities that have beenoutsourced. hile the amounts listed represent contractual obligations, we do not believe it is likely that the full contractual amount wouldbe paid if the underlying contracts were canceled prior to maturity. In such cases, we generally are able to negotiate new contracts orcancellation penalties, resulting in a reduced payment. The amounts do not include other contractual purchase obligations that are not take-or-pay arrangements. Such contractual purchase obligations are primarily purchase orders at fair value that are part of normal operationsand are reflected in historical operating cash flow trends. e do not believe such purchase obligations will adversely affect our liquidityposition.
SIGNIFICANT ACCOUNTING POLICIES ANDESTIMATES
In preparing our financial statements in accordance with U.S.GAAP, there are certain accounting policies that may requirea choice between acceptable accounting methods or mayrequire substantial judgment or estimation in their application.These include income taxes, certain employee benefits andgoodwill and intangible assets. e believe these accountingpolicies, and others set forth in Note 1 to the ConsolidatedFinancial Statements, should be reviewed as they are integralto understanding the results of operations and financialcondition of the Company.
The Company has discussed the selection of significantaccounting policies and the effect of estimates with the AuditCommittee of the Company's oard of Directors.
Income Taxes
Our annual tax rate is determined based on our income,statutory tax rates and the tax impacts of items treateddifferently for tax purposes than for financial reportingpurposes. Also inherent in determining our annual tax rate arejudgments and assumptions regarding the recoverability of
certain deferred tax balances, primarily net operating loss andother carryforwards, and our ability to uphold certain taxpositions.
Realization of net operating losses and other carryforwards isdependent upon generating sufficient taxable income in theappropriate jurisdiction prior to the expiration of thecarryforward periods, which involves business plans, planningopportunities and expectations about future outcomes.Although realization is not assured, management believes it ismore likely than not that our deferred tax assets, net of valuationallowances, will be realized.
e operate in multiple jurisdictions with complex tax policyand regulatory environments. In certain of these jurisdictions,we may take tax positions that management believes aresupportable, but are potentially subject to successful challengeby the applicable taxing authority. These interpretationaldifferences with the respective governmental taxing authoritiescan be impacted by the local economic and fiscal environment.
e evaluate our tax positions and establish liabilities inaccordance with the applicable accounting guidance onuncertainty in income taxes. e review these tax uncertaintiesin light of changing facts and circumstances, such as the

The Procter & Gamble Company 38
progress of tax audits, and adjust them accordingly. e havea number of audits in process in various jurisdictions. Althoughthe resolution of these tax positions is uncertain, based oncurrently available information, we believe that the ultimateoutcomes will not have a material adverse effect on ourfinancial position, results of operations or cash flows.
ecause there are a number of estimates and assumptionsinherent in calculating the various components of our taxprovision, certain changes or future events such as changes intax legislation, geographic mix of earnings, completion of taxaudits or earnings repatriation plans could have an impact onthose estimates and our effective tax rate. For additional detailson the Company's income taxes, see Note 10 to theConsolidated Financial Statements.
Em lo ee Benefits
e sponsor various post-employment benefits throughout theworld. These include pension plans, both defined contributionplans and defined benefit plans, and other post-employmentbenefit (OPE ) plans, consisting primarily of health care andlife insurance for retirees. For accounting purposes, the definedbenefit pension and OPE plans require assumptions toestimate the projected and accumulated benefit obligations,including the following variables: discount rate expectedsalary increases certain employee-related factors, such asturnover, retirement age and mortality expected return onassets and health care cost trend rates. These and otherassumptions affect the annual expense and obligationsrecognized for the underlying plans. Our assumptions reflectour historical experiences and management's best judgmentregarding future expectations. As permitted by U.S. GAAP,the net amount by which actual results differ from ourassumptions is deferred. If this net deferred amount exceeds10 of the greater of plan assets or liabilities, a portion of thedeferred amount is included in expense for the following year.The cost or benefit of plan changes, such as increasing ordecreasing benefits for prior employee service (prior servicecost), is deferred and included in expense on a straight-linebasis over the average remaining service period of theemployees expected to receive benefits.
The expected return on plan assets assumption impacts ourdefined benefit expense, since many of our defined benefitpension plans and our primary OPE plan are partially funded.The process for setting the expected rates of return is describedin Note 9 to the Consolidated Financial Statements. For 2015,the average return on assets assumptions for pension plan assetsand OPE assets was 7.2 and 8.3 , respectively. A changein the rate of return of 100 basis points for both pension andOPE assets would impact annual after-tax benefit expense byapproximately $101 million.
Since pension and OPE liabilities are measured on adiscounted basis, the discount rate impacts our plan obligationsand expenses. Discount rates used for our U.S. defined benefitpension and OPE plans are based on a yield curve constructedfrom a portfolio of high quality bonds for which the timing andamount of cash outflows approximate the estimated payoutsof the plan. For our international plans, the discount rates are
set by benchmarking against investment grade corporate bondsrated AA or better. The average discount rate on the definedbenefit pension plans and OPE plans of 3.1 and 4.5 ,respectively, represents a weighted average of local rates incountries where such plans exist. A 100-basis point change inthe pension discount rate would impact annual after-tax definedbenefit pension expense by approximately $195 million. Achange in the OPE discount rate of 100 basis points wouldimpact annual after-tax OPE expense by approximately $60million. For additional details on our defined benefit pensionand OPE plans, see Note 9 to the Consolidated FinancialStatements.
Goodwill and Intangi le Assets
Significant judgment is required to estimate the fair value ofintangible assets and in assigning their respective useful lives.Accordingly, we typically obtain the assistance of third-partyvaluation specialists for significant tangible and intangibleassets. The fair value estimates are based on availablehistorical information and on future expectations andassumptions deemed reasonable by management, but areinherently uncertain.
e typically use an income method to estimate the fair valueof intangible assets, which is based on forecasts of the expectedfuture cash flows attributable to the respective assets.Significant estimates and assumptions inherent in thevaluations reflect a consideration of other marketplaceparticipants, and include the amount and timing of future cashflows (including expected growth rates and profitability), theunderlying product or technology life cycles, economicbarriers to entry, a brand's relative market position and thediscount rate applied to the cash flows. Unanticipated marketor macroeconomic events and circumstances may occur, whichcould affect the accuracy or validity of the estimates andassumptions.
Determining the useful life of an intangible asset also requiresjudgment. Certain brand intangible assets are expected to haveindefinite lives based on their history and our plans to continueto support and build the acquired brands. Other acquiredintangible assets (e.g., certain trademarks or brands, customerrelationships, patents and technologies) are expected to havedeterminable useful lives. Our assessment as to brands thathave an indefinite life and those that have a determinable lifeis based on a number of factors including competitiveenvironment, market share, brand history, underlying productlife cycles, operating plans and the macroeconomicenvironment of the countries in which the brands are sold. Ourestimates of the useful lives of determinable-lived intangibleassets are primarily based on these same factors. All of ouracquired technology and customer-related intangible assets areexpected to have determinable useful lives.
The costs of determinable-lived intangible assets are amortizedto expense over their estimated lives. The value of indefinite-lived intangible assets and residual goodwill is not amortized,but is tested at least annually for impairment. Our impairmenttesting for goodwill is performed separately from ourimpairment testing of indefinite-lived intangible assets. e
39 The Procter & Gamble Company
test goodwill for impairment by reviewing the book valuecompared to the fair value at the reporting unit level. e testindividual indefinite-lived intangible assets by comparing thebook values of each asset to the estimated fair value. edetermine the fair value of our reporting units and indefinite-lived intangible assets based on the income approach. Underthe income approach, we calculate the fair value of ourreporting units and indefinite-lived intangible assets based onthe present value of estimated future cash flows. Considerablemanagement judgment is necessary to evaluate the impact ofoperating and macroeconomic changes and to estimate futurecash flows to measure fair value. Assumptions used in ourimpairment evaluations, such as forecasted growth rates andcost of capital, are consistent with internal projections andoperating plans. e believe such assumptions and estimatesare also comparable to those that would be used by othermarketplace participants.
ith the exception of our Appliances and atteries businesses,all of our reporting units have fair values that significantlyexceed recorded values. However, future changes in thejudgments, assumptions and estimates that are used in ourimpairment testing for goodwill and indefinite-lived intangibleassets, including discount and tax rates or future cash flowprojections, could result in significantly different estimates ofthe fair values. In addition, any potential change in the strategicplans for these businesses due to the refocusing of our businessportfolio could impact these judgments, assumptions andestimates, in turn, impacting our fair value. A significantreduction in the estimated fair values could result inimpairment charges that could materially affect the financialstatements in any given year. The recorded value of goodwilland intangible assets from recently impaired businesses andrecently acquired businesses are derived from more recentbusiness operating plans and macroeconomic environmentalconditions and therefore are more susceptible to an adversechange that could require an impairment charge.
Prior to 2013, our Appliances reporting unit incurred animpairment charge to reduce the goodwill carrying amount toits estimated fair value. During 2013, the estimated fair valueof our Appliances reporting unit declined further, below thecarrying amount resulting from the prior impairment.Therefore, we recorded an additional non-cash before andafter-tax impairment charge of $259 million in fiscal 2013.Additionally, our 2013 impairment testing for Appliancesindicated a decline in the fair value of our raun trade nameintangible asset below its carrying value. This resulted in anon-cash, before-tax impairment charge of $49 million ($31million after-tax) to reduce the carrying amount of this assetto its estimated fair value. The impairment of the Appliancesbusiness in fiscal 2013 was due to the devaluation of currencyin Japan, a key country that generates a significant portion ofthe earnings of the Appliances business, relative to thecurrencies in which the underlying net assets are recorded.
As of June 30, 2015, the Appliances business has remaininggoodwill of $299 million and remaining intangible assets of$706 million. As a result of the impairments, the estimatedfair value of our Appliances business slightly exceeds its
respective carrying value. Our 2015 valuation of theAppliances business has it returning to sales and earningsgrowth rates consistent with our long-term business plans.However, the currency in Japan has continued to devaluerelative to the currencies in which the related assets arerecorded, reducing the fair value cushion in the Appliancesbusiness to approximately 5 .
During 2015, we determined that the estimated fair value ofour atteries reporting unit was less than its carrying amount,resulting in a series of impairment charges. The underlyingfair value assessment was initially triggered by an agreementin September 2014 to sell the China-based battery joint ventureand a related decision to pursue options to exit the remainderof the atteries business. The results of our annual goodwillimpairment testing during fiscal 2014 had indicated a declinein the fair value of the atteries reporting unit due to lowerlong-term market growth assumptions in certain keygeographies. At that time, the estimated fair value of the
atteries business continued to exceed its underlying carryingvalue, but the fair value cushion had been reduced to about 5 .The agreement to sell the China-based battery joint venturewas at a transaction value that was below the earnings multipleimplied from the prior valuation of our atteries business,which effectively eliminated our fair value cushion. As a result,the remaining business unit cash flows no longer supported theremaining carrying amount of the atteries business. Duelargely to these factors, we recorded an initial non-cash, beforeand after-tax impairment charge of $863 million to reduce thecarrying amount of goodwill for the atteries business unit toits estimated fair value. These same factors resulted in a declinein the fair value of our Duracell trade name intangible assetbelow its carrying value. This resulted in a non-cash, before-tax impairment charge of $110 million ($69 million after tax)to reduce the carrying amount of this asset to its estimated fairvalue.
In November 2014, the Company reached an agreement todivest the remaining atteries business via a split transactionin which the Company will exchange a recapitalized DuracellCompany for erkshire Hathaway's ( H) shares of P&G stock(see Note 13). ased on the terms of the agreement and thevalue of H's shares of P&G stock at the agreement date, andchanges thereto through June 30, 2015, the Company recordedadditional non-cash, before and after-tax impairment chargestotaling $1.2 billion. All of the fiscal 2015 impairment chargesin the atteries business are included as part of discontinuedoperations.
The business unit valuations used to test goodwill andintangible assets for impairment are dependent on a number ofsignificant estimates and assumptions, includingmacroeconomic conditions, overall category growth rates,competitive activities, cost containment and margin expansionand Company business plans. e believe these estimates andassumptions are reasonable. Changes to or a failure to achievethese business plans or a further deterioration of themacroeconomic conditions could result in a valuation thatwould trigger an additional impairment of the goodwill andintangible assets of these businesses. In addition, we also
The Procter & Gamble Company 40
considered the structure and value of the divestiture agreementwith H in the impairment testing for atteries. If the valueof H s shares of the Company declines further before thetransaction closing dates, we may need to record additionalnon-cash impairment charges as part of discontinuedoperations in the future.
See Note 2 to our Consolidated Financial Statements foradditional discussion on goodwill and intangible assetimpairment testing results.
New Accounting Pronouncements
Refer to Note 1 to the Consolidated Financial Statements forrecently adopted accounting pronouncements and recentlyissued accounting pronouncements not yet adopted as ofJune 30, 2015.
OTHER INFORMATION
Hedging and Deri ati e Financial Instruments
As a multinational company with diverse product offerings,we are exposed to market risks, such as changes in interestrates, currency exchange rates and commodity prices. eevaluate exposures on a centralized basis to take advantage ofnatural exposure correlation and netting. Except withinfinancing operations, we leverage the Company's diversifiedportfolio of exposures as a natural hedge and prioritizeoperational hedging activities over financial marketinstruments. To the extent we choose to further managevolatility associated with the net exposures, we enter intovarious financial transactions which we account for using theapplicable accounting guidance for derivative instruments andhedging activities. These financial transactions are governedby our policies covering acceptable counterparty exposure,instrument types and other hedging practices. Note 5 to theConsolidated Financial Statements includes a detaileddiscussion of our accounting policies for derivativeinstruments.
Derivative positions are monitored using techniques includingmarket valuation, sensitivity analysis and value-at-riskmodeling. The tests for interest rate, currency rate andcommodity derivative positions discussed below are based onthe CorporateManager value-at-risk model using a one-yearhorizon and a 95 confidence level. The model incorporatesthe impact of correlation (the degree to which exposures movetogether over time) and diversification (from holding multiplecurrency, commodity and interest rate instruments) andassumes that financial returns are normally distributed.Estimates of volatility and correlations of market factors aredrawn from the RiskMetrics dataset as of June 30, 2015. Incases where data is unavailable in RiskMetrics , a reasonableproxy is included.
Our market risk exposures relative to interest rates, currencyrates and commodity prices, as discussed below, have notchanged materially versus the previous reporting period. Inaddition, we are not aware of any facts or circumstances thatwould significantly impact such exposures in the near term.
nte est R te pos e on n nc l nst ments Interestrate swaps are used to hedge exposures to interest ratemovement on underlying debt obligations. Certain interest rateswaps denominated in foreign currencies are designated tohedge exposures to currency exchange rate movements on ourinvestments in foreign operations. These currency interest rateswaps are designated as hedges of the Company's foreign netinvestments.
ased on our interest rate exposure as of and during the yearended June 30, 2015, including derivative and otherinstruments sensitive to interest rates, we believe a near-termchange in interest rates, at a 95 confidence level based onhistorical interest rate movements, would not materially affectour financial statements.
enc R te pos e on n nc l nst ments ecausewe manufacture and sell products and finance operations in anumber of countries throughout the world, we are exposed tothe impact on revenue and expenses of movements in currencyexchange rates. Corporate policy prescribes the range ofallowable hedging activity. To manage the exchange rate riskassociated with the financing of our operations, we primarilyuse forward contracts with maturities of less than 18 months.In addition, we enter into certain currency swaps withmaturities of up to five years to hedge our exposure to exchangerate movements on intercompany financing transactions.
ased on our currency rate exposure on derivative and otherinstruments as of and during the year ended June 30, 2015, webelieve, at a 95 confidence level based on historical currencyrate movements, the impact of a near-term change in currencyrates would not materially affect our financial statements.
ommo t ce pos e on n nc l nst ments euse raw materials that are subject to price volatility caused byweather, supply conditions, political and economic variablesand other unpredictable factors. e may use futures, optionsand swap contracts to manage the volatility related to the aboveexposures.
As of and during the years ended June 30, 2015 and June 30,2014, we did not have any commodity hedging activity.
Measures Not Defined B U.S. GAAP
Our discussion of financial results includes several non-GAAP financial measures. e believe these measuresprovide our investors with additional information about ourunderlying results and trends, as well as insight to some of themetrics used to evaluate management. hen used in theMD&A, we have provided the comparable U.S. GAAPmeasure in the discussion. These measures include:
n c les o t Organic sales growth is a non-GAAPmeasure of sales growth excluding the impacts of acquisitions,divestitures and foreign exchange from year-over-yearcomparisons. e believe this provides investors with a morecomplete understanding of underlying sales trends byproviding sales growth on a consistent basis. Organic sales isalso one of the measures used to evaluate senior managementand is a factor in determining their at-risk compensation.
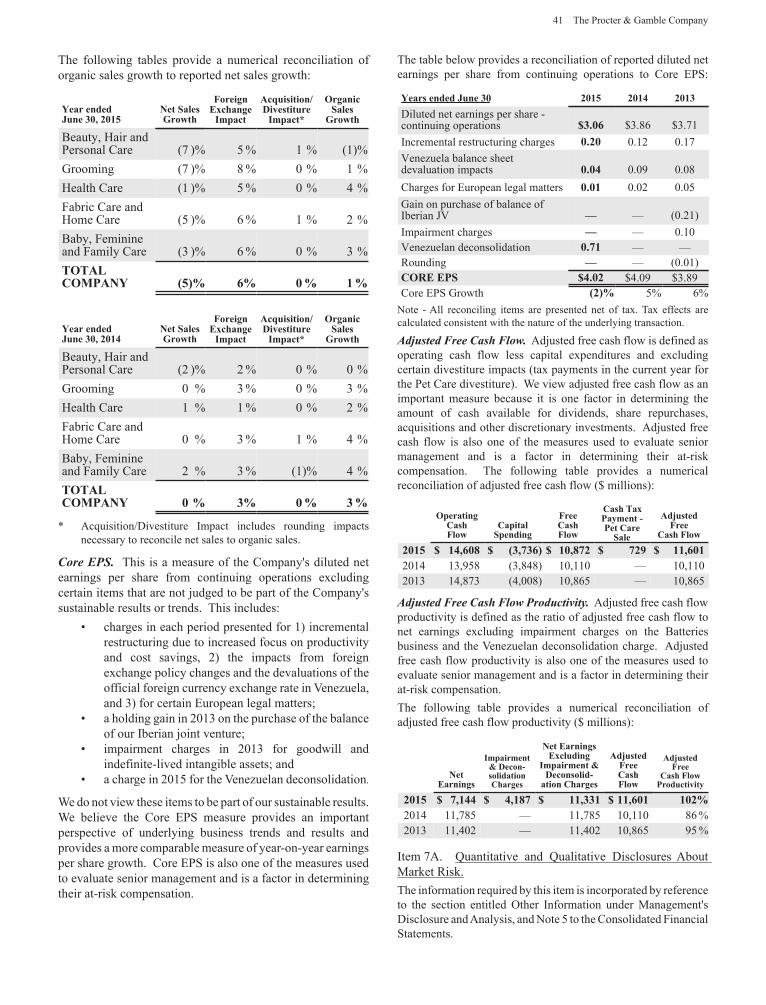
41 The Procter & Gamble Company
The following tables provide a numerical reconciliation oforganic sales growth to reported net sales growth:
Year endedune 0, 2015
Net SalesGrowth
ForeignExchange
Im act
Ac uisitionDi estiture
Im act
OrganicSales
Growth
eauty, Hair andPersonal Care (7 ) 5 1 (1)Grooming (7 ) 8 0 1Health Care (1 ) 5 0 4Fabric Care andHome Care (5 ) 6 1 2
aby, Feminineand Family Care (3 ) 6 0 3TOTALCOMPANY 5 0 1
Year endedune 0, 2014
Net SalesGrowth
ForeignExchange
Im act
Ac uisitionDi estiture
Im act
OrganicSales
Growth
eauty, Hair andPersonal Care (2 ) 2 0 0Grooming 0 3 0 3Health Care 1 1 0 2Fabric Care andHome Care 0 3 1 4
aby, Feminineand Family Care 2 3 (1) 4TOTALCOMPANY 0 0
Acquisition Divestiture Impact includes rounding impactsnecessary to reconcile net sales to organic sales.
o e This is a measure of the Company's diluted netearnings per share from continuing operations excludingcertain items that are not judged to be part of the Company'ssustainable results or trends. This includes:
charges in each period presented for 1) incrementalrestructuring due to increased focus on productivityand cost savings, 2) the impacts from foreignexchange policy changes and the devaluations of theofficial foreign currency exchange rate in enezuela,and 3) for certain European legal mattersa holding gain in 2013 on the purchase of the balanceof our Iberian joint ventureimpairment charges in 2013 for goodwill andindefinite-lived intangible assets anda charge in 2015 for the enezuelan deconsolidation.
e do not view these items to be part of our sustainable results.e believe the Core EPS measure provides an important
perspective of underlying business trends and results andprovides a more comparable measure of year-on-year earningsper share growth. Core EPS is also one of the measures usedto evaluate senior management and is a factor in determiningtheir at-risk compensation.
The table below provides a reconciliation of reported diluted netearnings per share from continuing operations to Core EPS:
Years ended une 0 2015 2014 201Diluted net earnings per share -continuing operations .0 $3.86 $3.71Incremental restructuring charges 0.20 0.12 0.17
enezuela balance sheetdevaluation impacts 0.04 0.09 0.08Charges for European legal matters 0.01 0.02 0.05Gain on purchase of balance ofIberian J (0.21)Impairment charges 0.10
enezuelan deconsolidation 0. 1Rounding (0.01)CORE EPS 4.02 $4.09 $3.89Core EPS Growth 2 5 6
Note - All reconciling items are presented net of tax. Tax effects arecalculated consistent with the nature of the underlying transaction.
ste ee s lo Adjusted free cash flow is defined asoperating cash flow less capital expenditures and excludingcertain divestiture impacts (tax payments in the current year forthe Pet Care divestiture). e view adjusted free cash flow as animportant measure because it is one factor in determining theamount of cash available for dividends, share repurchases,acquisitions and other discretionary investments. Adjusted freecash flow is also one of the measures used to evaluate seniormanagement and is a factor in determining their at-riskcompensation. The following table provides a numericalreconciliation of adjusted free cash flow ($ millions):
O eratingCash Flow
Ca italS ending
FreeCashFlow
Cash TaxPa ment -Pet Care
Sale
Ad ustedFree
Cash Flow
2015 14, 0 , 10, 2 29 11, 012014 13,958 (3,848) 10,110 10,1102013 14,873 (4,008) 10,865 10,865
ste ee s lo o ct v t Adjusted free cash flowproductivity is defined as the ratio of adjusted free cash flow tonet earnings excluding impairment charges on the atteriesbusiness and the enezuelan deconsolidation charge. Adjustedfree cash flow productivity is also one of the measures used toevaluate senior management and is a factor in determining theirat-risk compensation.The following table provides a numerical reconciliation ofadjusted free cash flow productivity ($ millions):
NetEarnings
Im airment& Decon-solidationCharges
Net EarningsExcluding
Im airment &Deconsolid-
ation Charges
Ad ustedFreeCashFlow
Ad ustedFree
Cash FlowProducti it
2015 ,144 4,1 11, 1 11, 01 1022014 11,785 11,785 10,110 862013 11,402 11,402 10,865 95
Item 7A. uantitative and ualitative Disclosures AboutMarket Risk.The information required by this item is incorporated by referenceto the section entitled Other Information under Management'sDisclosure andAnalysis, and Note 5 to the Consolidated FinancialStatements.
The Procter & Gamble Company 42
Item 8. Financial Statements and Supplementary Data.
MANAGEMENT S RESPONSIBILITY FORFINANCIAL REPORTING
At The Procter & Gamble Company, we take great pride in ourlong history of doing what's right. If you analyze what's madeour Company successful over the years, you may focus on ourbrands, our marketing strategies, our organization design andour ability to innovate. ut if you really want to get at whatdrives our Company's success, the place to look is our people.Our people are deeply committed to our Purpose, alues andPrinciples. It is this commitment to doing what's right thatunites us.
This commitment to doing what's right is embodied in ourfinancial reporting. High-quality financial reporting is ourresponsibility, one we execute with integrity, and within boththe letter and spirit of the law.
High-quality financial reporting is characterized by accuracy,objectivity and transparency. Management is responsible formaintaining an effective system of internal controls overfinancial reporting to deliver those characteristics in all materialrespects. The oard of Directors, through itsAudit Committee,provides oversight. e have engaged Deloitte & Touche LLPto audit our Consolidated Financial Statements, on which theyhave issued an unqualified opinion.
Our commitment to providing timely, accurate andunderstandable information to investors encompasses:
omm n c t n e pect t ons to emplo ees. Every employee,from senior management on down, is required to be trained onthe Company's orldwide si ess o d ct a al, whichsets forth the Company's commitment to conduct its businessaffairs with high ethical standards. Every employee is heldpersonally accountable for compliance and is provided severalmeans of reporting any concerns about violations of theorldwide si ess o d ct a al, which is available on
our website at www.pg.com.
nt n n st on nte n l cont ol env onment. Oursystem of internal controls includes written policies andprocedures, segregation of duties and the careful selection anddevelopment of employees. The system is designed to providereasonable assurance that transactions are executed asauthorized and appropriately recorded, that assets aresafeguarded and that accounting records are sufficientlyreliable to permit the preparation of financial statementsconforming in all material respects with accounting principlesgenerally accepted in the United States ofAmerica. e monitorthese internal controls through control self-assessmentsconducted by business unit management. In addition toperforming financial and compliance audits around the world,our Global Internal Audit organization provides training andcontinuously improves internal control processes. Appropriateactions are taken by management to correct any identifiedcontrol deficiencies.
ec t n n nc l ste s p. e maintain specificprograms and activities to ensure that employees understand
their fiduciary responsibilities to shareholders. This ongoingeffort encompasses financial discipline in strategic and dailybusiness decisions and brings particular focus to maintainingaccurate financial reporting and effective controls throughprocess improvement, skill development and oversight.
e t n o o s ove s t o t e s ness. e continuouslyreview business results and strategic choices. Our GlobalLeadership Council is actively involved - from understandingstrategies to reviewing key initiatives, financial performanceand control assessments. The intent is to ensure we remainobjective, identify potential issues, continuously challengeeach other and ensure recognition and rewards are appropriatelyaligned with results.
n n o D sclos e omm ttee. e maintain disclosurecontrols and procedures designed to ensure that informationrequired to be disclosed is recorded, processed, summarizedand reported timely and accurately. Our Disclosure Committeeis a group of senior-level executives responsible for evaluatingdisclosure implications of significant business activities andevents. The Committee reports its findings to the CEO andCFO, providing an effective process to evaluate our externaldisclosure obligations.
t on n e ect ve co po te ove n nce om o oo D ecto s. e have an active, capable and diligent oardthat meets the required standards for independence, and wewelcome the oard's oversight. Our Audit Committeecomprises independent directors with significant financialknowledge and experience. e review significant accountingpolicies, financial reporting and internal control matters withthem and encourage their independent discussions withexternal auditors. Our corporate governance guidelines, as wellas the charter of the Audit Committee and certain othercommittees of our oard, are available on our website atwww.pg.com.
P&G has a strong history of doing what's right. Our employeesembrace our Purpose, alues and Principles. e takeresponsibility for the quality and accuracy of our financialreporting. e present this information proudly, with theexpectation that those who use it will understand our Company,recognize our commitment to performance with integrity andshare our confidence in P&G's future.
s afley
A. G. Lafley
Chairman of the oard, President and Chief ExecutiveOfficer
s o oeller
Jon R. Moeller
Chief Financial Officer
43 The Procter & Gamble Company
MANAGEMENT S REPORT ON INTERNALCONTROL OVER FINANCIAL REPORTING
Management is responsible for establishing and maintainingadequate internal control over financial reporting of TheProcter & Gamble Company (as defined in Rule 13a-15(f)under the Securities Exchange Act of 1934, as amended). Ourinternal control over financial reporting is designed to providereasonable assurance regarding the reliability of financialreporting and the preparation of financial statements forexternal purposes in accordance with generally acceptedaccounting principles in the United States of America.
Strong internal controls is an objective that is reinforcedthrough our orldwide si ess o d ct a al, which setsforth our commitment to conduct business with integrity, andwithin both the letter and the spirit of the law. The Company'sinternal control over financial reporting includes a Control Self-Assessment Program that is conducted annually for criticalfinancial reporting areas of the Company and is audited by theinternal audit function. Management takes the appropriateaction to correct any identified control deficiencies. ecauseof its inherent limitations, any system of internal control overfinancial reporting, no matter how well designed, may notprevent or detect misstatements due to the possibility that acontrol can be circumvented or overridden or thatmisstatements due to error or fraud may occur that are notdetected. Also, because of changes in conditions, internalcontrol effectiveness may vary over time.
Management assessed the effectiveness of the Company'sinternal control over financial reporting as of June 30, 2015,using criteria established in ter al o trol te ratedFramewor 2013 issued by the Committee of SponsoringOrganizations of the Treadway Commission (COSO) andconcluded that the Company maintained effective internalcontrol over financial reporting as of June 30, 2015, based onthese criteria.
Deloitte & Touche LLP, an independent registered publicaccounting firm, has audited the effectiveness of the Company'sinternal control over financial reporting as of June 30, 2015, asstated in their report which is included herein.
s afley
A. G. Lafley
Chairman of the oard, President and Chief ExecutiveOfficer
s o oeller
Jon R. Moeller
Chief Financial Officer
August 7, 2015
REPORT OF INDEPENDENT REGISTERED PUBLICACCOUNTING FIRM
To the oard of Directors and Stockholders ofThe Procter & Gamble Company
e have audited the accompanying Consolidated alanceSheets of The Procter & Gamble Company and subsidiaries(the Company ) as of June 30, 2015 and 2014, and the relatedConsolidated Statements of Earnings, Comprehensive Income,Shareholders' Equity, and Cash Flows for each of the three yearsin the period ended June 30, 2015. These financial statementsare the responsibility of the Company's management. Ourresponsibility is to express an opinion on these financialstatements based on our audits.
e conducted our audits in accordance with the standards ofthe Public Company Accounting Oversight oard (UnitedStates). Those standards require that we plan and perform theaudit to obtain reasonable assurance about whether the financialstatements are free of material misstatement. An audit includesexamining, on a test basis, evidence supporting the amountsand disclosures in the financial statements. An audit alsoincludes assessing the accounting principles used andsignificant estimates made by management, as well asevaluating the overall financial statement presentation. ebelieve that our audits provide a reasonable basis for ouropinion.
In our opinion, such Consolidated Financial Statements presentfairly, in all material respects, the financial position of TheProcter & Gamble Company and subsidiaries at June 30, 2015and 2014, and the results of their operations and their cash flowsfor each of the three years in the period ended June 30, 2015,in conformity with accounting principles generally accepted inthe United States of America.
e have also audited, in accordance with the standards of thePublic Company Accounting Oversight oard (United States),the Company's internal control over financial reporting as ofJune 30, 2015, based on the criteria established in ter alo trol te rated Framewor 2013 issued by the
Committee of Sponsoring Organizations of the TreadwayCommission and our report dated August 7, 2015 expressed anunqualified opinion on the Company's internal control overfinancial reporting.
s eloitte o che
Cincinnati, Ohio
August 7, 2015
The Procter & Gamble Company 44
REPORT OF INDEPENDENT REGISTERED PUBLICACCOUNTING FIRM
To the oard of Directors and Stockholders of
The Procter & Gamble Company
e have audited the internal control over financial reporting ofThe Procter & Gamble Company and subsidiaries (theCompany ) as of June 30, 2015, based on criteria established
in ter al o trol te rated Framewor 2013 issued bythe Committee of Sponsoring Organizations of the TreadwayCommission. The Company's management is responsible formaintaining effective internal control over financial reportingand for its assessment of the effectiveness of internal controlover financial reporting, included in the accompanyingManagement's Report on Internal Control over FinancialReporting. Our responsibility is to express an opinion on theCompany's internal control over financial reporting based onour audit.
e conducted our audit in accordance with the standards of thePublic Company Accounting Oversight oard (United States).Those standards require that we plan and perform the audit toobtain reasonable assurance about whether effective internalcontrol over financial reporting was maintained in all materialrespects. Our audit included obtaining an understanding ofinternal control over financial reporting, assessing the risk thata material weakness exists, testing and evaluating the designand operating effectiveness of internal control based on theassessed risk, and performing such other procedures as weconsidered necessary in the circumstances. e believe that ouraudit provides a reasonable basis for our opinion.
A company's internal control over financial reporting is aprocess designed by, or under the supervision of, the company'sprincipal executive and principal financial officers, or personsperforming similar functions, and effected by the company'sboard of directors, management, and other personnel to providereasonable assurance regarding the reliability of financialreporting and the preparation of financial statements forexternal purposes in accordance with generally acceptedaccounting principles. A company's internal control overfinancial reporting includes those policies and procedures that(1) pertain to the maintenance of records that, in reasonabledetail, accurately and fairly reflect the transactions anddispositions of the assets of the company (2) providereasonable assurance that transactions are recorded asnecessary to permit preparation of financial statements inaccordance with generally accepted accounting principles, andthat receipts and expenditures of the company are being madeonly in accordance with authorizations of management anddirectors of the company and (3) provide reasonable assuranceregarding prevention or timely detection of unauthorizedacquisition, use, or disposition of the company's assets thatcould have a material effect on the financial statements.
ecause of the inherent limitations of internal control overfinancial reporting, including the possibility of collusion orimproper management override of controls, materialmisstatements due to error or fraud may not be prevented ordetected on a timely basis. Also, projections of any evaluation
of the effectiveness of the internal control over financialreporting to future periods are subject to the risk that the controlsmay become inadequate because of changes in conditions, orthat the degree of compliance with the policies or proceduresmay deteriorate.
In our opinion, the Company maintained, in all materialrespects, effective internal control over financial reporting asof June 30, 2015, based on the criteria established in ter alo trol te rated Framewor 2013 issued by the
Committee of Sponsoring Organizations of the TreadwayCommission.
e have also audited, in accordance with the standards of thePublic Company Accounting Oversight oard (United States),the Consolidated Financial Statements of the Company as ofand for the year ended June 30, 2015 and our report datedAugust 7, 2015 expressed an unqualified opinion on thosefinancial statements.
s eloitte o che
Cincinnati, Ohio
August 7, 2015
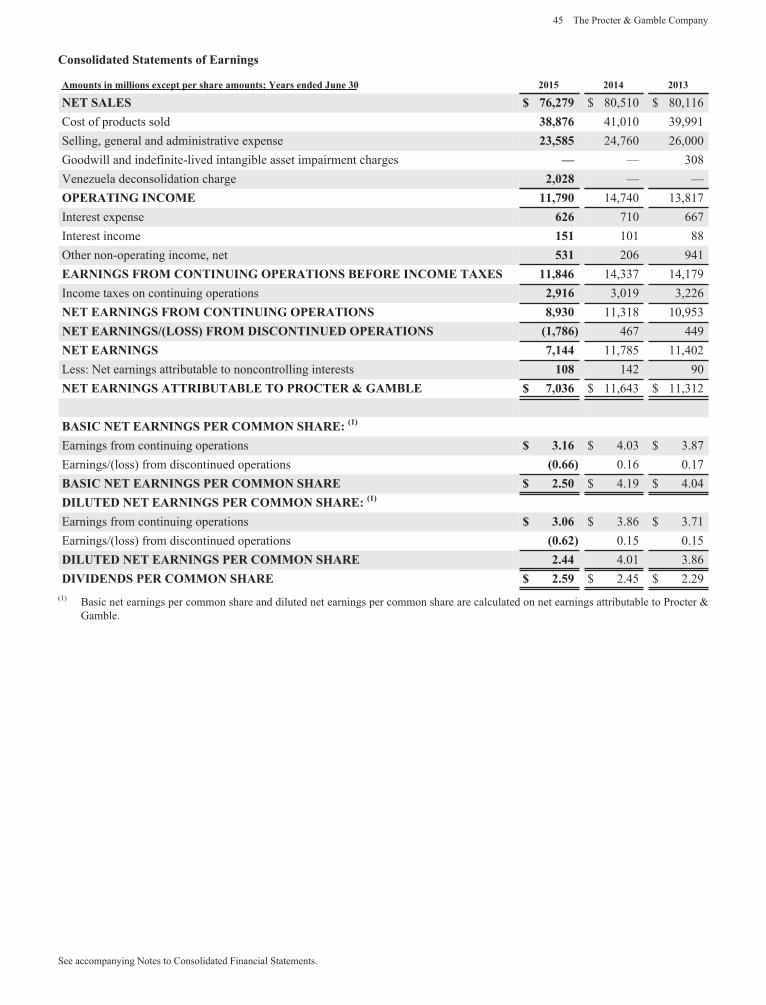
45 The Procter & Gamble Company
See accompanying Notes to Consolidated Financial Statements.
Consolidated Statements of Earnings
Amounts in millions exce t er share amounts Years ended une 0 2015 2014 201
NET SALES ,2 9 $ 80,510 $ 80,116Cost of products sold , 41,010 39,991Selling, general and administrative expense 2 ,5 5 24,760 26,000Goodwill and indefinite-lived intangible asset impairment charges 308
enezuela deconsolidation charge 2,02OPERATING INCOME 11, 90 14,740 13,817Interest expense 2 710 667Interest income 151 101 88Other non-operating income, net 5 1 206 941EARNINGS FROM CONTINUING OPERATIONS BEFORE INCOME TAXES 11, 4 14,337 14,179Income taxes on continuing operations 2,91 3,019 3,226NET EARNINGS FROM CONTINUING OPERATIONS ,9 0 11,318 10,953NET EARNINGS LOSS FROM DISCONTINUED OPERATIONS 1, 467 449NET EARNINGS ,144 11,785 11,402Less: Net earnings attributable to noncontrolling interests 10 142 90NET EARNINGS ATTRIBUTABLE TO PROCTER & GAMBLE ,0 $ 11,643 $ 11,312
BASIC NET EARNINGS PER COMMON SHARE 1
Earnings from continuing operations .1 $ 4.03 $ 3.87Earnings (loss) from discontinued operations 0. 0.16 0.17BASIC NET EARNINGS PER COMMON SHARE 2.50 $ 4.19 $ 4.04DILUTED NET EARNINGS PER COMMON SHARE 1
Earnings from continuing operations .0 $ 3.86 $ 3.71Earnings (loss) from discontinued operations 0. 2 0.15 0.15DILUTED NET EARNINGS PER COMMON SHARE 2.44 4.01 3.86DIVIDENDS PER COMMON SHARE 2.59 $ 2.45 $ 2.29
(1) asic net earnings per common share and diluted net earnings per common share are calculated on net earnings attributable to Procter &Gamble.

The Procter & Gamble Company 46
See accompanying Notes to Consolidated Financial Statements.
Consolidated Statements of Com rehensi e Income
Amounts in millions Years ended une 0 2015 2014 201
NET EARNINGS ,144 $ 11,785 $ 11,402OTHER COMPREHENSIVE INCOME LOSS , NET OF TAX
Financial statement translation ,220 1,044 710Unrealized gains (losses) on hedges (net of $739, $(209) and $92 tax, respectively) 1,2 4 (347) 144Unrealized gains (losses) on investment securities (net of $0, $(4) and $(5) tax,respectively) 24 9 (24)Unrealized gains (losses) on defined benefit retirement plans (net of $328, $(356)and $637 tax, respectively) 44 (869) 1,004
TOTAL OTHER COMPREHENSIVE INCOME LOSS , NET OF TAX 5,11 (163) 1,834TOTAL COMPREHENSIVE INCOME 2,02 11,622 13,236Less: Total comprehensive income attributable to noncontrolling interests 10 150 94TOTAL COMPREHENSIVE INCOME ATTRIBUTABLE TOPROCTER & GAMBLE 1,91 $ 11,472 $ 13,142

47 The Procter & Gamble Company
See accompanying Notes to Consolidated Financial Statements.
Consolidated Balance Sheets
Amounts in millions Years ended une 0 2015 2014
AssetsCURRENT ASSETSCash and cash equivalents , 45 $ 8,558Available-for-sale investment securities 4, 2,128Accounts receivable 4, 1 6,386INVENTORIES
Materials and supplies 1, 92 1,742ork in process 550 684
Finished goods ,512 4,333Total inventories 5,454 6,759Deferred income taxes 1, 5 1,092Prepaid expenses and other current assets 2, 5 3,845Assets held for sale ,510 2,849TOTAL CURRENT ASSETS 29, 4 31,617PROPERTY, PLANT AND E UIPMENT, NET 20,2 22,304GOODWILL 4 , 1 53,704TRADEMARKS AND OTHER INTANGIBLE ASSETS, NET 2 , 29 30,843OTHER NONCURRENT ASSETS 5,4 5,798TOTAL ASSETS 129,495 $ 144,266
Lia ilities and Shareholders E uitCURRENT LIABILITIESAccounts payable ,25 $ 8,461Accrued and other liabilities , 25 8,999Liabilities held for sale 1,1 660Debt due within one year 12,021 15,606TOTAL CURRENT LIABILITIES 29, 90 33,726LONG-TERM DEBT 1 , 29 19,811DEFERRED INCOME TAXES 9,5 1 10,218OTHER NONCURRENT LIABILITIES , 95 10,535TOTAL LIABILITIES ,445 74,290SHAREHOLDERS E UITYConvertible Class A preferred stock, stated value $1 per share (600 shares authorized) 1,0 1,111Non- oting Class preferred stock, stated value $1 per share (200 shares authorized)Common stock, stated value $1 per share (10,000 shares authorized shares issued:2015 - 4,009.2, 2014 - 4,009.2) 4,009 4,009Additional paid-in capital , 52 63,911Reserve for ESOP debt retirement 1, 20 (1,340)Accumulated other comprehensive income (loss) 12, 0 (7,662)Treasury stock, at cost (shares held: 2015 - 1,294.7, 2014 - 1,298.4) ,22 (75,805)Retained earnings 4, 0 84,990Noncontrolling interest 1 762TOTAL SHAREHOLDERS E UITY ,050 69,976TOTAL LIABILITIES AND SHAREHOLDERS E UITY 129,495 $ 144,266
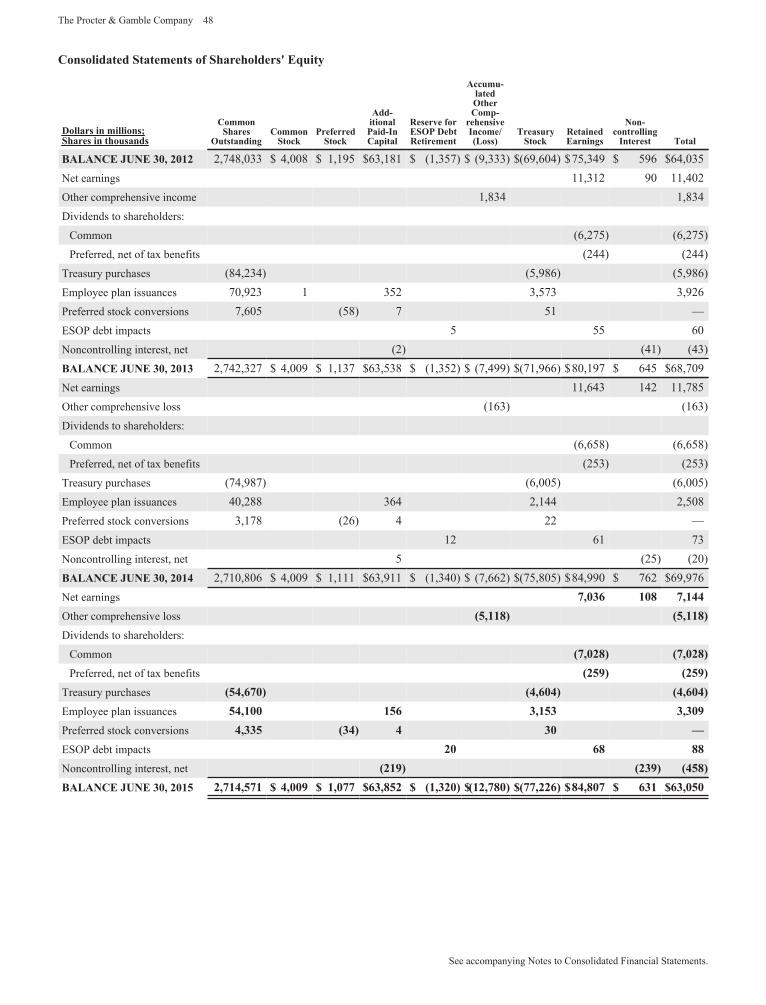
The Procter & Gamble Company 48
See accompanying Notes to Consolidated Financial Statements.
Consolidated Statements of Shareholders E uit
Dollars in millionsShares in thousands
CommonShares
OutstandingCommon
StockPreferred
Stock
Add-itionalPaid-InCa ital
Reser e forESOP De tRetirement
Accumu-latedOtherCom -
rehensi eIncome
LossTreasur
StockRetainedEarnings
Non-controlling
Interest Total
BALANCE UNE 0, 2012 2,748,033 $ 4,008 $ 1,195 $63,181 $ (1,357) $ (9,333) $(69,604) $75,349 $ 596 $64,035Net earnings 11,312 90 11,402Other comprehensive income 1,834 1,834Dividends to shareholders:
Common (6,275) (6,275)Preferred, net of tax benefits (244) (244)
Treasury purchases (84,234) (5,986) (5,986)Employee plan issuances 70,923 1 352 3,573 3,926Preferred stock conversions 7,605 (58) 7 51ESOP debt impacts 5 55 60Noncontrolling interest, net (2) (41) (43)BALANCE UNE 0, 201 2,742,327 $ 4,009 $ 1,137 $63,538 $ (1,352) $ (7,499) $(71,966) $80,197 $ 645 $68,709Net earnings 11,643 142 11,785Other comprehensive loss (163) (163)Dividends to shareholders:
Common (6,658) (6,658)Preferred, net of tax benefits (253) (253)
Treasury purchases (74,987) (6,005) (6,005)Employee plan issuances 40,288 364 2,144 2,508Preferred stock conversions 3,178 (26) 4 22ESOP debt impacts 12 61 73Noncontrolling interest, net 5 (25) (20)BALANCE UNE 0, 2014 2,710,806 $ 4,009 $ 1,111 $63,911 $ (1,340) $ (7,662) $(75,805) $84,990 $ 762 $69,976Net earnings ,0 10 ,144Other comprehensive loss 5,11 5,11Dividends to shareholders:
Common ,02 ,02Preferred, net of tax benefits 259 259
Treasury purchases 54, 0 4, 04 4, 04Employee plan issuances 54,100 15 ,15 , 09Preferred stock conversions 4, 5 4 4 0ESOP debt impacts 20Noncontrolling interest, net 219 2 9 45BALANCE UNE 0, 2015 2, 14,5 1 4,009 1,0 , 52 1, 20 12, 0 ,22 4, 0 1 ,050
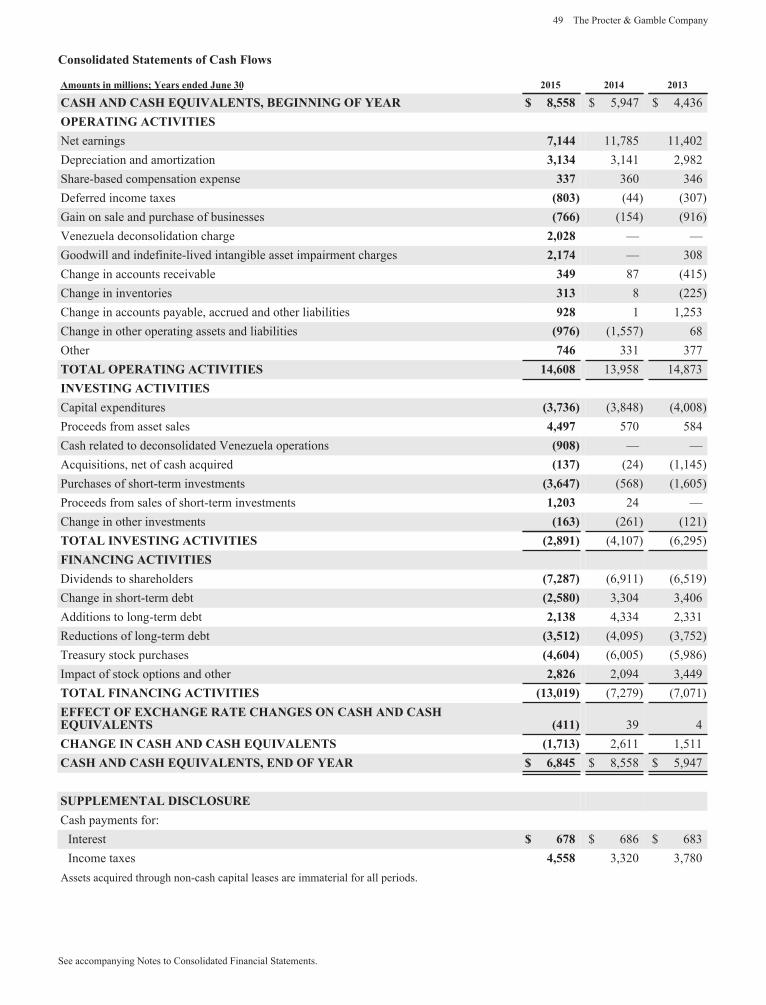
49 The Procter & Gamble Company
See accompanying Notes to Consolidated Financial Statements.
Consolidated Statements of Cash Flows
Amounts in millions Years ended une 0 2015 2014 201
CASH AND CASH E UIVALENTS, BEGINNING OF YEAR ,55 $ 5,947 $ 4,436OPERATING ACTIVITIESNet earnings ,144 11,785 11,402Depreciation and amortization ,1 4 3,141 2,982Share-based compensation expense 360 346Deferred income taxes 0 (44) (307)Gain on sale and purchase of businesses (154) (916)
enezuela deconsolidation charge 2,02Goodwill and indefinite-lived intangible asset impairment charges 2,1 4 308Change in accounts receivable 49 87 (415)Change in inventories 1 8 (225)Change in accounts payable, accrued and other liabilities 92 1 1,253Change in other operating assets and liabilities 9 (1,557) 68Other 4 331 377TOTAL OPERATING ACTIVITIES 14, 0 13,958 14,873INVESTING ACTIVITIESCapital expenditures , (3,848) (4,008)Proceeds from asset sales 4,49 570 584Cash related to deconsolidated enezuela operations 90Acquisitions, net of cash acquired 1 (24) (1,145)Purchases of short-term investments , 4 (568) (1,605)Proceeds from sales of short-term investments 1,20 24Change in other investments 1 (261) (121)TOTAL INVESTING ACTIVITIES 2, 91 (4,107) (6,295)FINANCING ACTIVITIESDividends to shareholders ,2 (6,911) (6,519)Change in short-term debt 2,5 0 3,304 3,406Additions to long-term debt 2,1 4,334 2,331Reductions of long-term debt ,512 (4,095) (3,752)Treasury stock purchases 4, 04 (6,005) (5,986)Impact of stock options and other 2, 2 2,094 3,449TOTAL FINANCING ACTIVITIES 1 ,019 (7,279) (7,071)EFFECT OF EXCHANGE RATE CHANGES ON CASH AND CASHE UIVALENTS 411 39 4CHANGE IN CASH AND CASH E UIVALENTS 1, 1 2,611 1,511CASH AND CASH E UIVALENTS, END OF YEAR , 45 $ 8,558 $ 5,947
SUPPLEMENTAL DISCLOSURECash payments for:
Interest $ 686 $ 683Income taxes 4,55 3,320 3,780
Assets acquired through non-cash capital leases are immaterial for all periods.
The Procter & Gamble Company 50
Amounts in millions of dollars except per share amounts or as otherwise specified.
Notes to Consolidated Financial Statements
SUMMARY OF SIGNIFICANT ACCOUNTINGPOLICIES
Nature of O erationsThe Procter & Gamble Company's (the Company, Procter& Gamble, we or us ) business is focused on providingbranded consumer packaged goods of superior quality andvalue. Our products are sold in more than 180 countries andterritories primarily through retail operations including massmerchandisers, grocery stores, membership club stores, drugstores, department stores, salons, e-commerce, high-frequencystores and pharmacies. e have on-the-ground operations inapproximately 70 countries.
Basis of PresentationThe Consolidated Financial Statements include the Companyand its controlled subsidiaries. Intercompany transactions areeliminated. Prior year amounts have been reclassified toconform with current year presentation for amounts related todiscontinued operations (see Note 13) and segment reporting(see Note 12).Prior to June 30, 2015, we included the results of our
enezuelan operations in our Consolidated FinancialStatements using the consolidation method of accounting. TheCompany s enezuelan earnings and cash flows are reflectedin the historical Consolidated Financial Statements using acombination of the official exchange rates, with imports ofcertain essential finished goods reflected at the CENCOEXrate of 6.30 bolivars per U.S. dollar and the remaining business,primarily related to our on-the-ground manufacturing andother business activities, reflected at the SICAD rate, whichgenerally operated in a range of approximately 12 to 13 bolivarsper U.S. dollar. Evolving conditions in enezuela, includingcurrency exchange regulations, other operating controls andrestrictions, reduced access to dollars through official currencyexchange markets and local market dynamics, have resulted inan other-than-temporary lack of exchangeability between the
enezuelan bolivar and U.S. dollar, and have restricted ourenezuelan operations ability to pay dividends and satisfy
certain other obligations denominated in U.S. dollars.hile we continue to have access to dollars through the
CENCOEX market for certain finished goods and rawmaterials imports, the currency and other controls in enezuelahave significantly limited our ability to realize the benefitsfrom earnings of the Company s on-the-ground enezuelanoperations and to access the resulting liquidity provided bythose operations. e expect that this condition will continuefor the foreseeable future. For accounting purposes, this lackof exchangeability and evolving conditions has resulted in alack of control over our enezuelan subsidiaries. Therefore,in accordance with the applicable accounting standards forconsolidation, we deconsolidated our enezuelan subsidiariesand began accounting for our investment in those subsidiariesusing the cost method of accounting.
This change, which we made effective June 30, 2015, resultedin a fourth quarter fiscal 2015 one-time after-tax charge of $2.1billion. This charge included the write-off of our investmentin our enezuelan subsidiaries, foreign currency translationlosses of $255 previously recorded in accumulated othercomprehensive income and the write-off of certainintercompany receivables due from enezuela subsidiaries,which was triggered by the decision to deconsolidate thosesubsidiaries. Our enezuelan operations cash balance of $908at June 30, 2015 (previously measured using a combination ofCENCOEX and SICAD exchange rates), is no longer reportedin Cash and cash equivalents.In future periods, our financial results will only include salesof finished goods to our enezuelan subsidiaries to the extentwe receive cash payments from those subsidiaries (expectedto be largely through the CENCOEX exchange market).Accordingly, we will not include the results of our on-the-ground enezuelan subsidiaries. Any dividends from our
enezuelan subsidiaries will be recorded as operating incomeupon receipt of the cash.
Use of EstimatesPreparation of financial statements in conformity withaccounting principles generally accepted in the United Statesof America (U.S. GAAP) requires management to makeestimates and assumptions that affect the amounts reported inthe Consolidated Financial Statements and accompanyingdisclosures. These estimates are based on management's bestknowledge of current events and actions the Company mayundertake in the future. Estimates are used in accounting for,among other items, consumer and trade promotion accruals,restructuring reserves, pensions, post-employment benefits,stock options, valuation of acquired intangible assets, usefullives for depreciation and amortization of long-lived assets,future cash flows associated with impairment testing forgoodwill, indefinite-lived intangible assets and other long-lived assets, deferred tax assets, uncertain income tax positionsand contingencies. Actual results may ultimately differ fromestimates, although management does not generally believesuch differences would materially affect the financialstatements in any individual year. However, in regard toongoing impairment testing of goodwill and indefinite-livedintangible assets, significant deterioration in future cash flowprojections or other assumptions used in estimating fair valuesversus those anticipated at the time of the initial valuations,could result in impairment charges that materially affect thefinancial statements in a given year.
Re enue RecognitionSales are recognized when revenue is realized or realizable andhas been earned. Revenue transactions represent sales ofinventory. The revenue recorded is presented net of sales andother taxes we collect on behalf of governmental authorities.The revenue includes shipping and handling costs, whichgenerally are included in the list price to the customer. Ourpolicy is to recognize revenue when title to the product,ownership and risk of loss transfer to the customer, which canbe on the date of shipment or the date of receipt by the customer.
51 The Procter & Gamble Company
Amounts in millions of dollars except per share amounts or as otherwise specified.
A provision for payment discounts and product returnallowances is recorded as a reduction of sales in the same periodthe revenue is recognized.Trade promotions, consisting primarily of customer pricingallowances, merchandising funds and consumer coupons, areoffered through various programs to customers and consumers.Sales are recorded net of trade promotion spending, which isrecognized as incurred, generally at the time of the sale. Mostof these arrangements have terms of approximately one year.Accruals for expected payouts under these programs areincluded as accrued marketing and promotion in the Accruedand other liabilities line item in the Consolidated alanceSheets.
Cost of Products SoldCost of products sold is primarily comprised of direct materialsand supplies consumed in the manufacture of product, as wellas manufacturing labor, depreciation expense and directoverhead expense necessary to acquire and convert thepurchased materials and supplies into finished product. Costof products sold also includes the cost to distribute products tocustomers, inbound freight costs, internal transfer costs,warehousing costs and other shipping and handling activity.
Selling, General and Administrati e Ex enseSelling, general and administrative expense (SG&A) isprimarily comprised of marketing expenses, selling expenses,research and development costs, administrative and otherindirect overhead costs, depreciation and amortization expenseon non-manufacturing assets and other miscellaneousoperating items. Research and development costs are chargedto expense as incurred and were $2.0 billion in 2015 and 2014and $1.9 billion in 2013. Advertising costs, charged to expenseas incurred, include worldwide television, print, radio, internetand in-store advertising expenses and were $8.3 billion in 2015,$9.0 billion in 2014 and $9.4 billion in 2013. Non-advertisingrelated components of the Company's total marketing spendinginclude costs associated with consumer promotions, productsampling and sales aids, which are included in SG&A, as wellas coupons and customer trade funds, which are recorded asreductions to net sales.
Other Non-O erating Income, NetOther non-operating income, net, primarily includes netacquisition and divestiture gains and investment income.
Currenc TranslationFinancial statements of operating subsidiaries outside the U.S.generally are measured using the local currency as thefunctional currency. Adjustments to translate those statementsinto U.S. dollars are recorded in Other comprehensive income(OCI). For subsidiaries operating in highly inflationaryeconomies, the U.S. dollar is the functional currency. Re-measurement adjustments for financial statements in highlyinflationary economies and other transactional exchange gainsand losses are reflected in earnings.
Cash Flow PresentationThe Consolidated Statements of Cash Flows are prepared usingthe indirect method, which reconciles net earnings to cash flow
from operating activities. Cash flows from foreign currencytransactions and operations are translated at an averageexchange rate for the period. Cash flows from hedgingactivities are included in the same category as the items beinghedged. Cash flows from derivative instruments designatedas net investment hedges are classified as financing activities.Realized gains and losses from non-qualifying derivativeinstruments used to hedge currency exposures resulting fromintercompany financing transactions are also classified asfinancing activities. Cash flows from other derivativeinstruments used to manage interest, commodity or othercurrency exposures are classified as operating activities. Cashpayments related to income taxes are classified as operatingactivities. Cash flows from the Company's discontinuedoperations are included in the Consolidated Statements of CashFlows.
In estmentsInvestment securities consist of readily marketable debt andequity securities. Unrealized gains or losses from investmentsclassified as trading, if any, are charged to earnings. Unrealizedgains or losses on securities classified as available-for-sale aregenerally recorded in OCI. If an available-for-sale security isother than temporarily impaired, the loss is charged to eitherearnings or OCI depending on our intent and ability to retainthe security until we recover the full cost basis and the extentof the loss attributable to the creditworthiness of the issuer.Investment securities are included as Available-for-saleinvestment securities and Other noncurrent assets in theConsolidated alance Sheets.Investments in certain companies over which we exertsignificant influence, but do not control the financial andoperating decisions, are accounted for as equity methodinvestments. Other investments that are not controlled, andover which we do not have the ability to exercise significantinfluence, are accounted for under the cost method. oth equityand cost method investments are included as Other noncurrentassets in the Consolidated alance Sheets.
In entor ValuationInventories are valued at the lower of cost or market value.Product-related inventories are primarily maintained on thefirst-in, first-out method. Minor amounts of productinventories, including certain cosmetics and commodities, aremaintained on the last-in, first-out method. The cost of sparepart inventories is maintained using the average-cost method.
Pro ert , Plant and E ui mentProperty, plant and equipment is recorded at cost reduced byaccumulated depreciation. Depreciation expense is recognizedover the assets' estimated useful lives using the straight-linemethod. Machinery and equipment includes office furnitureand fixtures (15-year life), computer equipment and capitalizedsoftware (3- to 5-year lives) and manufacturing equipment (3-to 20-year lives). uildings are depreciated over an estimateduseful life of 40 years. Estimated useful lives are periodicallyreviewed and, when appropriate, changes are madeprospectively. hen certain events or changes in operatingconditions occur, asset lives may be adjusted and an

The Procter & Gamble Company 52
Amounts in millions of dollars except per share amounts or as otherwise specified.
impairment assessment may be performed on therecoverability of the carrying amounts.
Goodwill and Other Intangi le AssetsGoodwill and indefinite-lived intangible assets are notamortized, but are evaluated for impairment annually or moreoften if indicators of a potential impairment are present. Ourannual impairment testing of goodwill is performed separatelyfrom our impairment testing of indefinite-lived intangibleassets.
e have acquired brands that have been determined to haveindefinite lives. e evaluate a number of factors to determinewhether an indefinite life is appropriate, including thecompetitive environment, market share, brand history, productlife cycles, operating plans and the macroeconomicenvironment of the countries in which the brands are sold.
hen certain events or changes in operating conditions occur,an impairment assessment is performed and indefinite-livedassets may be adjusted to a determinable life.The cost of intangible assets with determinable useful lives isamortized to reflect the pattern of economic benefitsconsumed, either on a straight-line or accelerated basis overthe estimated periods benefited. Patents, technology and otherintangible assets with contractual terms are generallyamortized over their respective legal or contractual lives.Customer relationships, brands and other non-contractualintangible assets with determinable lives are amortized overperiods generally ranging from 5 to 30 years. hen certainevents or changes in operating conditions occur, an impairment
assessment is performed and remaining lives of intangibleassets with determinable lives may be adjusted.For additional details on goodwill and intangible assets seeNote 2.
Fair Values of Financial InstrumentsCertain financial instruments are required to be recorded at fairvalue. Changes in assumptions or estimation methods couldaffect the fair value estimates however, we do not believe anysuch changes would have a material impact on our financialcondition, results of operations or cash flows. Other financialinstruments, including cash equivalents, certain investmentsand short-term debt, are recorded at cost, which approximatesfair value. The fair values of long-term debt and financialinstruments are disclosed in Note 5.
New Accounting Pronouncements and PoliciesIn May 2014, the FAS issued ASU 2014-09, Revenue fromContracts with Customers (Topic 606). This guidanceoutlines a single, comprehensive model for accounting forrevenue from contracts with customers. e will adopt thestandard no later than July 1, 2018. hile we are currentlyassessing the impact of the new standard, we do not expect thisnew guidance to have a material impact on our ConsolidatedFinancial Statements.No other new accounting pronouncement issued or effectiveduring the fiscal year had or is expected to have a materialimpact on the Consolidated Financial Statements.
GOODWILL AND INTANGIBLE ASSETS
The change in the net carrying amount of goodwill by reportable segment was as follows:
Beaut ,Hair andPersonal
Care GroomingHealthCare
Fa ricCare and
HomeCare
Ba ,Feminine
and FamilCare Cor orate
TotalCom an
GOODWILL at UNE 0, 201 - Gross $ 17,094 $ 21,775 $ 6,185 $ 1,973 $ 4,828 $ 4,922 $ 56,777Accumulated impairment losses at June 30, 2013 (431) (1,158) (1,589)
GOODWILL at UNE 0, 201 - Net 16,663 20,617 6,185 1,973 4,828 4,922 55,188Acquisitions and divestitures (3) (2,445) (2,448)Goodwill impairment chargesTranslation and other 377 322 95 11 82 77 964
GOODWILL at UNE 0, 2014 - Gross 17,471 22,097 6,280 1,981 4,910 2,554 55,293Accumulated impairment losses at June 30, 2014 (431) (1,158) (1,589)
GOODWILL at UNE 0, 2014 - Net 17,040 20,939 6,280 1,981 4,910 2,554 53,704Acquisitions and divestitures 1 449 594Goodwill impairment charges 2,0 4 2,0 4Translation and other 1,50 1, 20 9 104 1 41 , 0
GOODWILL at UNE 0, 2015 - Gross 15, 29 20, 5, 1, 4 4,549 2,0 4 50,9 9Accumulated impairment losses at June 30, 2015 4 1 1,15 2,0 4 , 5
GOODWILL at UNE 0, 2015 - Net 15, 9 19, 19 5, 1, 4 4,549 4 , 1
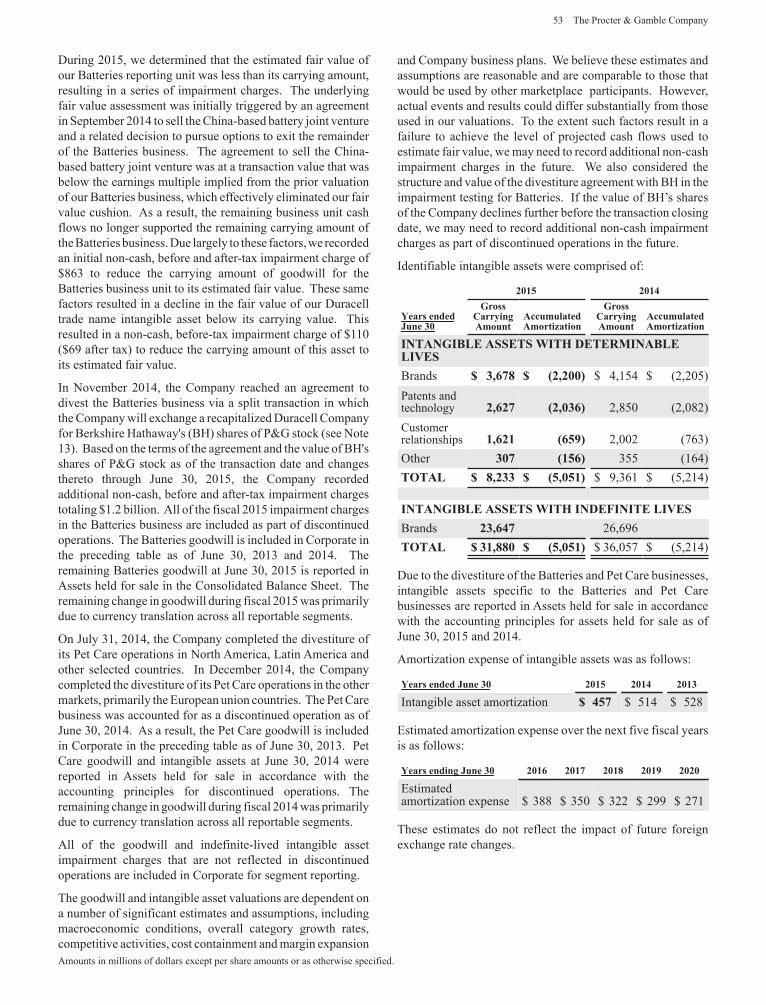
53 The Procter & Gamble Company
Amounts in millions of dollars except per share amounts or as otherwise specified.
During 2015, we determined that the estimated fair value ofour atteries reporting unit was less than its carrying amount,resulting in a series of impairment charges. The underlyingfair value assessment was initially triggered by an agreementin September 2014 to sell the China-based battery joint ventureand a related decision to pursue options to exit the remainderof the atteries business. The agreement to sell the China-based battery joint venture was at a transaction value that wasbelow the earnings multiple implied from the prior valuationof our atteries business, which effectively eliminated our fairvalue cushion. As a result, the remaining business unit cashflows no longer supported the remaining carrying amount ofthe atteries business. Due largely to these factors, we recordedan initial non-cash, before and after-tax impairment charge of$863 to reduce the carrying amount of goodwill for the
atteries business unit to its estimated fair value. These samefactors resulted in a decline in the fair value of our Duracelltrade name intangible asset below its carrying value. Thisresulted in a non-cash, before-tax impairment charge of $110($69 after tax) to reduce the carrying amount of this asset toits estimated fair value.
In November 2014, the Company reached an agreement todivest the atteries business via a split transaction in whichthe Company will exchange a recapitalized Duracell Companyfor erkshire Hathaway's ( H) shares of P&G stock (see Note13). ased on the terms of the agreement and the value of H'sshares of P&G stock as of the transaction date and changesthereto through June 30, 2015, the Company recordedadditional non-cash, before and after-tax impairment chargestotaling $1.2 billion. All of the fiscal 2015 impairment chargesin the atteries business are included as part of discontinuedoperations. The atteries goodwill is included in Corporate inthe preceding table as of June 30, 2013 and 2014. Theremaining atteries goodwill at June 30, 2015 is reported inAssets held for sale in the Consolidated alance Sheet. Theremaining change in goodwill during fiscal 2015 was primarilydue to currency translation across all reportable segments.
On July 31, 2014, the Company completed the divestiture ofits Pet Care operations in North America, Latin America andother selected countries. In December 2014, the Companycompleted the divestiture of its Pet Care operations in the othermarkets, primarily the European union countries. The Pet Carebusiness was accounted for as a discontinued operation as ofJune 30, 2014. As a result, the Pet Care goodwill is includedin Corporate in the preceding table as of June 30, 2013. PetCare goodwill and intangible assets at June 30, 2014 werereported in Assets held for sale in accordance with theaccounting principles for discontinued operations. Theremaining change in goodwill during fiscal 2014 was primarilydue to currency translation across all reportable segments.
All of the goodwill and indefinite-lived intangible assetimpairment charges that are not reflected in discontinuedoperations are included in Corporate for segment reporting.
The goodwill and intangible asset valuations are dependent ona number of significant estimates and assumptions, includingmacroeconomic conditions, overall category growth rates,competitive activities, cost containment and margin expansion
and Company business plans. e believe these estimates andassumptions are reasonable and are comparable to those thatwould be used by other marketplace participants. However,actual events and results could differ substantially from thoseused in our valuations. To the extent such factors result in afailure to achieve the level of projected cash flows used toestimate fair value, we may need to record additional non-cashimpairment charges in the future. e also considered thestructure and value of the divestiture agreement with H in theimpairment testing for atteries. If the value of H s sharesof the Company declines further before the transaction closingdate, we may need to record additional non-cash impairmentcharges as part of discontinued operations in the future.
Identifiable intangible assets were comprised of:
2015 2014
Years endedune 0
GrossCarr ingAmount
AccumulatedAmorti ation
GrossCarr ingAmount
AccumulatedAmorti ation
INTANGIBLE ASSETS WITH DETERMINABLELIVES
rands , 2,200 $ 4,154 $ (2,205)Patents andtechnology 2, 2 2,0 2,850 (2,082)Customerrelationships 1, 21 59 2,002 (763)Other 0 15 355 (164)TOTAL ,2 5,051 $ 9,361 $ (5,214)
INTANGIBLE ASSETS WITH INDEFINITE LIVESrands 2 , 4 26,696
TOTAL 1, 0 5,051 $ 36,057 $ (5,214)
Due to the divestiture of the atteries and Pet Care businesses,intangible assets specific to the atteries and Pet Carebusinesses are reported in Assets held for sale in accordancewith the accounting principles for assets held for sale as ofJune 30, 2015 and 2014.
Amortization expense of intangible assets was as follows:
Years ended une 0 2015 2014 201
Intangible asset amortization 45 $ 514 $ 528
Estimated amortization expense over the next five fiscal yearsis as follows:
Years ending une 0 201 201 201 2019 2020
Estimatedamortization expense $ 388 $ 350 $ 322 $ 299 $ 271
These estimates do not reflect the impact of future foreignexchange rate changes.
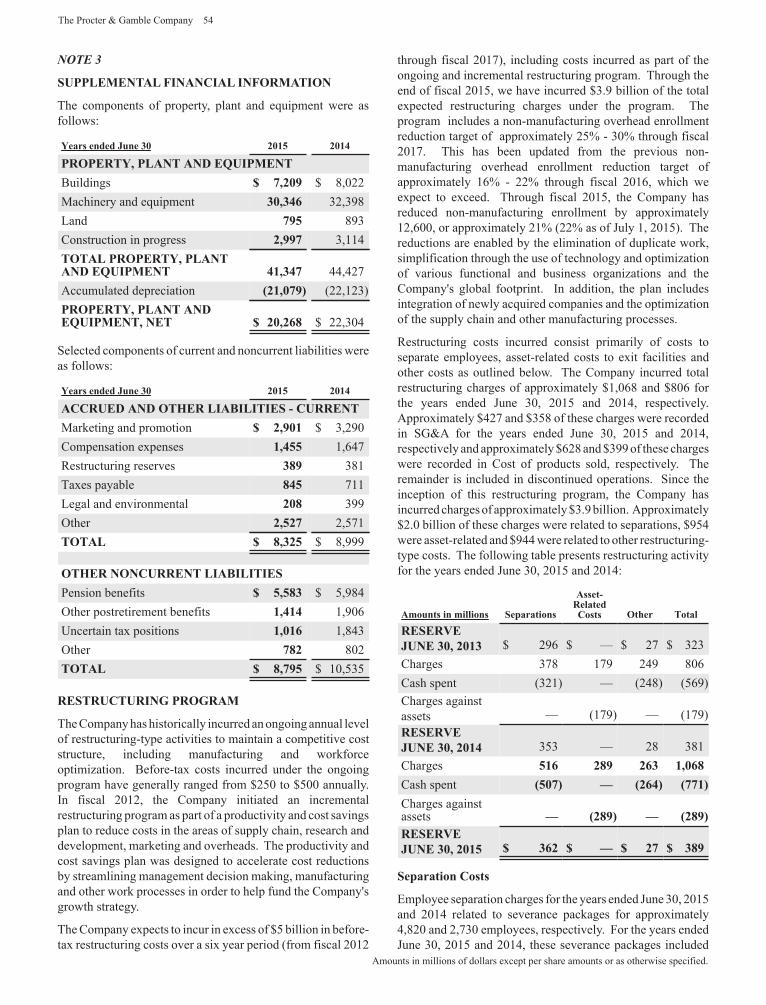
The Procter & Gamble Company 54
Amounts in millions of dollars except per share amounts or as otherwise specified.
SUPPLEMENTAL FINANCIAL INFORMATION
The components of property, plant and equipment were asfollows:
Years ended une 0 2015 2014
PROPERTY, PLANT AND E UIPMENTuildings ,209 $ 8,022
Machinery and equipment 0, 4 32,398Land 95 893Construction in progress 2,99 3,114TOTAL PROPERTY, PLANTAND E UIPMENT 41, 4 44,427Accumulated depreciation 21,0 9 (22,123)PROPERTY, PLANT ANDE UIPMENT, NET 20,2 $ 22,304
Selected components of current and noncurrent liabilities wereas follows:
Years ended une 0 2015 2014
ACCRUED AND OTHER LIABILITIES - CURRENTMarketing and promotion 2,901 $ 3,290Compensation expenses 1,455 1,647Restructuring reserves 9 381Taxes payable 45 711Legal and environmental 20 399Other 2,52 2,571TOTAL , 25 $ 8,999
OTHER NONCURRENT LIABILITIESPension benefits 5,5 $ 5,984Other postretirement benefits 1,414 1,906Uncertain tax positions 1,01 1,843Other 2 802TOTAL , 95 $ 10,535
RESTRUCTURING PROGRAM
The Company has historically incurred an ongoing annual levelof restructuring-type activities to maintain a competitive coststructure, including manufacturing and workforceoptimization. efore-tax costs incurred under the ongoingprogram have generally ranged from $250 to $500 annually.In fiscal 2012, the Company initiated an incrementalrestructuring program as part of a productivity and cost savingsplan to reduce costs in the areas of supply chain, research anddevelopment, marketing and overheads. The productivity andcost savings plan was designed to accelerate cost reductionsby streamlining management decision making, manufacturingand other work processes in order to help fund the Company'sgrowth strategy.
The Company expects to incur in excess of $5 billion in before-tax restructuring costs over a six year period (from fiscal 2012
through fiscal 2017), including costs incurred as part of theongoing and incremental restructuring program. Through theend of fiscal 2015, we have incurred $3.9 billion of the totalexpected restructuring charges under the program. Theprogram includes a non-manufacturing overhead enrollmentreduction target of approximately 25 - 30 through fiscal2017. This has been updated from the previous non-manufacturing overhead enrollment reduction target ofapproximately 16 - 22 through fiscal 2016, which weexpect to exceed. Through fiscal 2015, the Company hasreduced non-manufacturing enrollment by approximately12,600, or approximately 21 (22 as of July 1, 2015). Thereductions are enabled by the elimination of duplicate work,simplification through the use of technology and optimizationof various functional and business organizations and theCompany's global footprint. In addition, the plan includesintegration of newly acquired companies and the optimizationof the supply chain and other manufacturing processes.
Restructuring costs incurred consist primarily of costs toseparate employees, asset-related costs to exit facilities andother costs as outlined below. The Company incurred totalrestructuring charges of approximately $1,068 and $806 forthe years ended June 30, 2015 and 2014, respectively.Approximately $427 and $358 of these charges were recordedin SG&A for the years ended June 30, 2015 and 2014,respectively and approximately $628 and $399 of these chargeswere recorded in Cost of products sold, respectively. Theremainder is included in discontinued operations. Since theinception of this restructuring program, the Company hasincurred charges of approximately $3.9 billion. Approximately$2.0 billion of these charges were related to separations, $954were asset-related and $944 were related to other restructuring-type costs. The following table presents restructuring activityfor the years ended June 30, 2015 and 2014:
Amounts in millions Se arations
Asset-RelatedCosts Other Total
RESERVEUNE 0, 201 $ 296 $ $ 27 $ 323
Charges 378 179 249 806Cash spent (321) (248) (569)Charges againstassets (179) (179)RESERVEUNE 0, 2014 353 28 381
Charges 51 2 9 2 1,0Cash spent 50 2 4 1Charges againstassets 2 9 2 9RESERVEUNE 0, 2015 2 2 9
Se aration Costs
Employee separation charges for the years ended June 30, 2015and 2014 related to severance packages for approximately4,820 and 2,730 employees, respectively. For the years endedJune 30, 2015 and 2014, these severance packages included
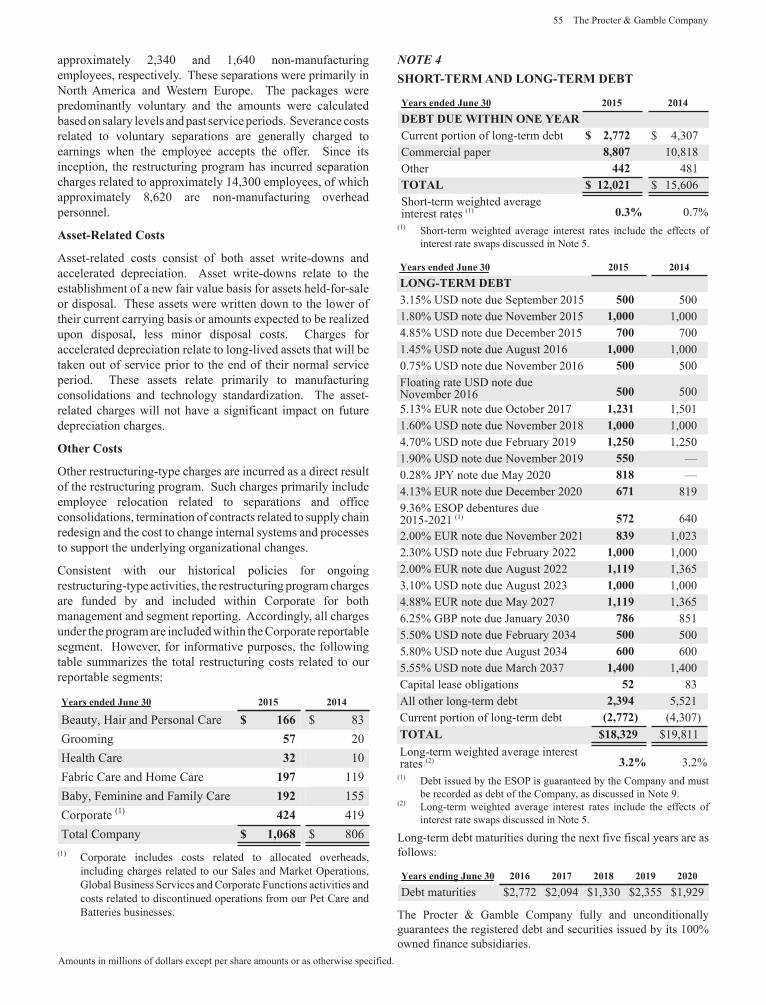
55 The Procter & Gamble Company
Amounts in millions of dollars except per share amounts or as otherwise specified.
approximately 2,340 and 1,640 non-manufacturingemployees, respectively. These separations were primarily inNorth America and estern Europe. The packages werepredominantly voluntary and the amounts were calculatedbased on salary levels and past service periods. Severance costsrelated to voluntary separations are generally charged toearnings when the employee accepts the offer. Since itsinception, the restructuring program has incurred separationcharges related to approximately 14,300 employees, of whichapproximately 8,620 are non-manufacturing overheadpersonnel.
Asset-Related Costs
Asset-related costs consist of both asset write-downs andaccelerated depreciation. Asset write-downs relate to theestablishment of a new fair value basis for assets held-for-saleor disposal. These assets were written down to the lower oftheir current carrying basis or amounts expected to be realizedupon disposal, less minor disposal costs. Charges foraccelerated depreciation relate to long-lived assets that will betaken out of service prior to the end of their normal serviceperiod. These assets relate primarily to manufacturingconsolidations and technology standardization. The asset-related charges will not have a significant impact on futuredepreciation charges.
Other Costs
Other restructuring-type charges are incurred as a direct resultof the restructuring program. Such charges primarily includeemployee relocation related to separations and officeconsolidations, termination of contracts related to supply chainredesign and the cost to change internal systems and processesto support the underlying organizational changes.
Consistent with our historical policies for ongoingrestructuring-type activities, the restructuring program chargesare funded by and included within Corporate for bothmanagement and segment reporting. Accordingly, all chargesunder the program are included within the Corporate reportablesegment. However, for informative purposes, the followingtable summarizes the total restructuring costs related to ourreportable segments:
Years ended une 0 2015 2014
eauty, Hair and Personal Care 1 $ 83Grooming 5 20Health Care 2 10Fabric Care and Home Care 19 119
aby, Feminine and Family Care 192 155Corporate (1) 424 419Total Company 1,0 $ 806
(1) Corporate includes costs related to allocated overheads,including charges related to our Sales and Market Operations,Global usiness Services and Corporate Functions activities andcosts related to discontinued operations from our Pet Care and
atteries businesses.
SHORT-TERM AND LONG-TERM DEBT
Years ended une 0 2015 2014DEBT DUE WITHIN ONE YEARCurrent portion of long-term debt 2, 2 $ 4,307Commercial paper , 0 10,818Other 442 481TOTAL 12,021 $ 15,606Short-term weighted averageinterest rates (1) 0. 0.7
(1) Short-term weighted average interest rates include the effects ofinterest rate swaps discussed in Note 5.
Years ended une 0 2015 2014LONG-TERM DEBT3.15 USD note due September 2015 500 5001.80 USD note due November 2015 1,000 1,0004.85 USD note due December 2015 00 7001.45 USD note due August 2016 1,000 1,0000.75 USD note due November 2016 500 500Floating rate USD note dueNovember 2016 500 5005.13 EUR note due October 2017 1,2 1 1,5011.60 USD note due November 2018 1,000 1,0004.70 USD note due February 2019 1,250 1,2501.90 USD note due November 2019 5500.28 JPY note due May 2020 14.13 EUR note due December 2020 1 8199.36 ESOP debentures due2015-2021 (1) 5 2 6402.00 EUR note due November 2021 9 1,0232.30 USD note due February 2022 1,000 1,0002.00 EUR note due August 2022 1,119 1,3653.10 USD note due August 2023 1,000 1,0004.88 EUR note due May 2027 1,119 1,3656.25 G P note due January 2030 8515.50 USD note due February 2034 500 5005.80 USD note due August 2034 00 6005.55 USD note due March 2037 1,400 1,400Capital lease obligations 52 83All other long-term debt 2, 94 5,521Current portion of long-term debt 2, 2 (4,307)TOTAL 1 , 29 $19,811Long-term weighted average interestrates (2) .2 3.2
(1) Debt issued by the ESOP is guaranteed by the Company and mustbe recorded as debt of the Company, as discussed in Note 9.
(2) Long-term weighted average interest rates include the effects ofinterest rate swaps discussed in Note 5.
Long-term debt maturities during the next five fiscal years are asfollows:
Years ending une 0 201 201 201 2019 2020Debt maturities $2,772 $2,094 $1,330 $2,355 $1,929
The Procter & Gamble Company fully and unconditionallyguarantees the registered debt and securities issued by its 100owned finance subsidiaries.
The Procter & Gamble Company 56
Amounts in millions of dollars except per share amounts or as otherwise specified.
RISK MANAGEMENTACTIVITIESAND FAIR VALUEMEASUREMENTSAs a multinational company with diverse product offerings,we are exposed to market risks, such as changes in interestrates, currency exchange rates and commodity prices. eevaluate exposures on a centralized basis to take advantage ofnatural exposure correlation and netting. To the extent wechoose to manage volatility associated with the net exposures,we enter into various financial transactions that we account forusing the applicable accounting guidance for derivativeinstruments and hedging activities. These financialtransactions are governed by our policies covering acceptablecounterparty exposure, instrument types and other hedgingpractices.At inception, we formally designate and document qualifyinginstruments as hedges of underlying exposures. e formallyassess, at inception and at least quarterly thereafter, whetherthe financial instruments used in hedging transactions areeffective at offsetting changes in either the fair value or cashflows of the related underlying exposures. Fluctuations in thevalue of these instruments generally are offset by changes inthe fair value or cash flows of the underlying exposures beinghedged. This is driven by the high degree of effectivenessbetween the exposure being hedged and the hedginginstrument. The ineffective portion of a change in the fair valueof a qualifying instrument is immediately recognized inearnings. The amount of ineffectiveness recognized wasimmaterial for all years presented.
Credit Risk Managemente have counterparty credit guidelines and normally enter into
transactions with investment grade financial institutions, to theextent commercially viable. Counterparty exposures aremonitored daily and downgrades in counterparty credit ratingsare reviewed on a timely basis. e have not incurred, and donot expect to incur, material credit losses on our riskmanagement or other financial instruments.Substantially all of the Company's financial instruments usedin hedging transactions are governed by industry standardnetting and collateral agreements with counterparties. If theCompany's credit rating were to fall below the levels stipulatedin the agreements, the counterparties could demand eithercollateralization or termination of the arrangements. Theaggregate fair value of the instruments covered by thesecontractual features that are in a net liability position as ofJune 30, 2015, was not material. The Company has not beenrequired to post collateral as a result of these contractualfeatures.Interest Rate Risk ManagementOur policy is to manage interest cost using a mixture of fixed-rate and variable-rate debt. To manage this risk in a cost-efficient manner, we enter into interest rate swaps whereby weagree to exchange with the counterparty, at specified intervals,the difference between fixed and variable interest amountscalculated by reference to a notional amount.
Interest rate swaps that meet specific accounting criteria areaccounted for as fair value or cash flow hedges. For fair valuehedges, the changes in the fair value of both the hedginginstruments and the underlying debt obligations areimmediately recognized in interest expense. For cash flowhedges, the effective portion of the changes in fair value of thehedging instrument is reported in OCI and reclassified intointerest expense over the life of the underlying debt obligation.The ineffective portion for both cash flow and fair valuehedges, which was not material for any year presented, wasimmediately recognized in interest expense.
Foreign Currenc Risk Managemente manufacture and sell our products and finance operations
in a number of countries throughout the world. As a result, weare exposed to movements in foreign currency exchange rates.To manage the exchange rate risk primarily associated with thefinancing of our operations, we have historically used acombination of forward contracts, options and currency swaps.As of June 30, 2015, we had currency swaps with originalmaturities up to five years, which are intended to offset theeffect of exchange rate fluctuations on intercompany loansdenominated in foreign currencies. These swaps are accountedfor as cash flow hedges. The effective portion of the changesin fair value of these instruments is reported in OCI andreclassified into SG&Aand interest expense in the same periodor periods during which the related hedged transactions affectearnings. The ineffective portion, which was not material forany year presented, was immediately recognized in SG&A.The change in fair values of certain non-qualifying instrumentsused to manage foreign exchange exposure of intercompanyfinancing transactions and certain balance sheet items subjectto revaluation are immediately recognized in earnings,substantially offsetting the foreign currency mark-to-marketimpact of the related exposures.
Net In estment Hedginge hedge certain net investment positions in foreign
subsidiaries. To accomplish this, we either borrow directly inforeign currencies and designate all or a portion of the foreigncurrency debt as a hedge of the applicable net investmentposition or we enter into foreign currency swaps that aredesignated as hedges of net investments. Changes in the fairvalue of these instruments are recognized in OCI to offset thechange in the value of the net investment being hedged. Theineffective portion of these hedges, which was not material inany year presented, was immediately recognized in interestexpense.
Commodit Risk ManagementCertain raw materials used in our products or productionprocesses are subject to price volatility caused by weather,supply conditions, political and economic variables and otherunpredictable factors. To manage the volatility related toanticipated purchases of certain of these materials, we havehistorically, on a limited basis, used futures and options withmaturities generally less than one year and swap contracts withmaturities up to five years. As of and during the years ended
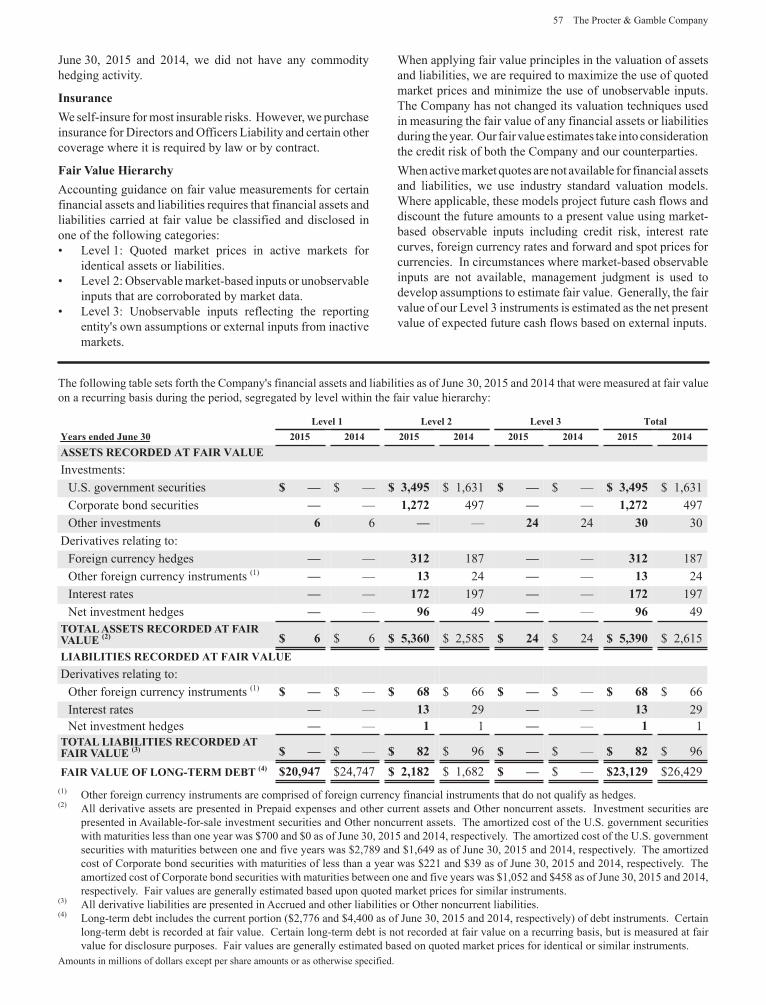
57 The Procter & Gamble Company
Amounts in millions of dollars except per share amounts or as otherwise specified.
June 30, 2015 and 2014, we did not have any commodityhedging activity.
Insurancee self-insure for most insurable risks. However, we purchase
insurance for Directors and Officers Liability and certain othercoverage where it is required by law or by contract.
Fair Value HierarchAccounting guidance on fair value measurements for certainfinancial assets and liabilities requires that financial assets andliabilities carried at fair value be classified and disclosed inone of the following categories:
Level 1: uoted market prices in active markets foridentical assets or liabilities.Level 2: Observable market-based inputs or unobservableinputs that are corroborated by market data.Level 3: Unobservable inputs reflecting the reportingentity's own assumptions or external inputs from inactivemarkets.
hen applying fair value principles in the valuation of assetsand liabilities, we are required to maximize the use of quotedmarket prices and minimize the use of unobservable inputs.The Company has not changed its valuation techniques usedin measuring the fair value of any financial assets or liabilitiesduring the year. Our fair value estimates take into considerationthe credit risk of both the Company and our counterparties.
hen active market quotes are not available for financial assetsand liabilities, we use industry standard valuation models.
here applicable, these models project future cash flows anddiscount the future amounts to a present value using market-based observable inputs including credit risk, interest ratecurves, foreign currency rates and forward and spot prices forcurrencies. In circumstances where market-based observableinputs are not available, management judgment is used todevelop assumptions to estimate fair value. Generally, the fairvalue of our Level 3 instruments is estimated as the net presentvalue of expected future cash flows based on external inputs.
The following table sets forth the Company's financial assets and liabilities as of June 30, 2015 and 2014 that were measured at fair valueon a recurring basis during the period, segregated by level within the fair value hierarchy:
Le el 1 Le el 2 Le el TotalYears ended une 0 2015 2014 2015 2014 2015 2014 2015 2014ASSETS RECORDED AT FAIR VALUEInvestments:
U.S. government securities $ ,495 $ 1,631 $ ,495 $ 1,631Corporate bond securities 1,2 2 497 1,2 2 497Other investments 6 24 24 0 30
Derivatives relating to:Foreign currency hedges 12 187 12 187Other foreign currency instruments (1) 1 24 1 24Interest rates 1 2 197 1 2 197Net investment hedges 9 49 9 49
TOTAL ASSETS RECORDED AT FAIRVALUE 2 $ 6 5, 0 $ 2,585 24 $ 24 5, 90 $ 2,615LIABILITIES RECORDED AT FAIR VALUEDerivatives relating to:
Other foreign currency instruments (1) $ $ 66 $ $ 66Interest rates 1 29 1 29Net investment hedges 1 1 1 1
TOTAL LIABILITIES RECORDED ATFAIR VALUE $ 2 $ 96 $ 2 $ 96FAIR VALUE OF LONG-TERM DEBT 4 20,94 $24,747 2,1 2 $ 1,682 $ 2 ,129 $26,429
(1) Other foreign currency instruments are comprised of foreign currency financial instruments that do not qualify as hedges.(2) All derivative assets are presented in Prepaid expenses and other current assets and Other noncurrent assets. Investment securities are
presented in Available-for-sale investment securities and Other noncurrent assets. The amortized cost of the U.S. government securitieswith maturities less than one year was $700 and $0 as of June 30, 2015 and 2014, respectively. The amortized cost of the U.S. governmentsecurities with maturities between one and five years was $2,789 and $1,649 as of June 30, 2015 and 2014, respectively. The amortizedcost of Corporate bond securities with maturities of less than a year was $221 and $39 as of June 30, 2015 and 2014, respectively. Theamortized cost of Corporate bond securities with maturities between one and five years was $1,052 and $458 as of June 30, 2015 and 2014,respectively. Fair values are generally estimated based upon quoted market prices for similar instruments.
(3) All derivative liabilities are presented in Accrued and other liabilities or Other noncurrent liabilities.(4) Long-term debt includes the current portion ($2,776 and $4,400 as of June 30, 2015 and 2014, respectively) of debt instruments. Certain
long-term debt is recorded at fair value. Certain long-term debt is not recorded at fair value on a recurring basis, but is measured at fairvalue for disclosure purposes. Fair values are generally estimated based on quoted market prices for identical or similar instruments.
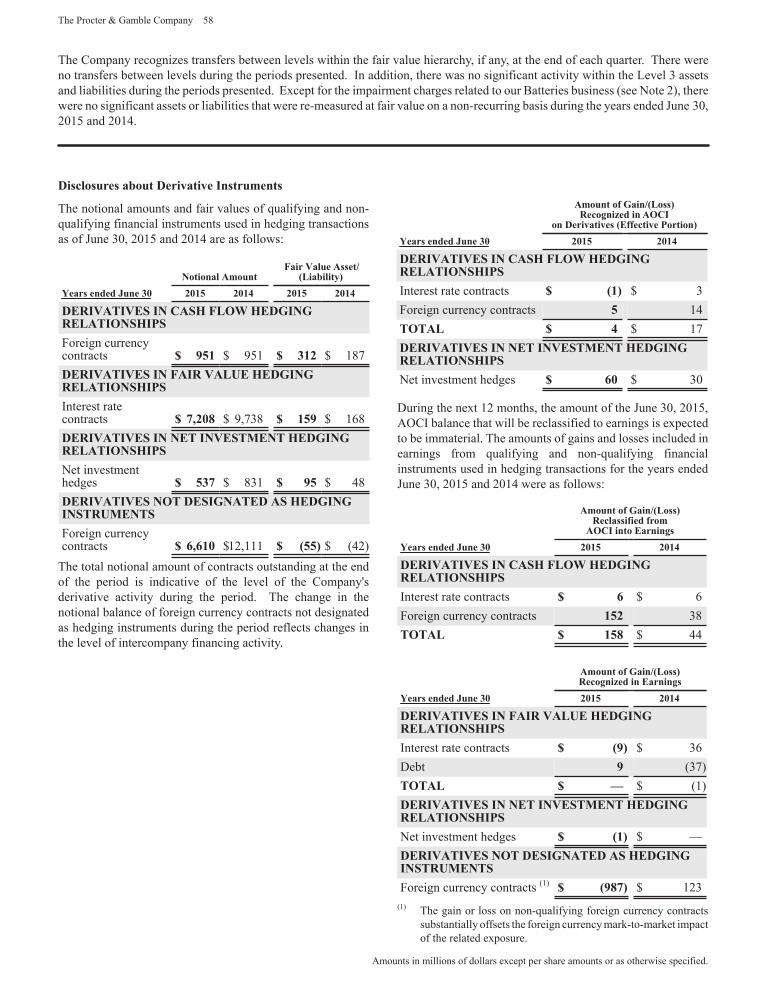
The Procter & Gamble Company 58
Amounts in millions of dollars except per share amounts or as otherwise specified.
The Company recognizes transfers between levels within the fair value hierarchy, if any, at the end of each quarter. There wereno transfers between levels during the periods presented. In addition, there was no significant activity within the Level 3 assetsand liabilities during the periods presented. Except for the impairment charges related to our atteries business (see Note 2), therewere no significant assets or liabilities that were re-measured at fair value on a non-recurring basis during the years ended June 30,2015 and 2014.
Disclosures a out Deri ati e Instruments
The notional amounts and fair values of qualifying and non-qualifying financial instruments used in hedging transactionsas of June 30, 2015 and 2014 are as follows:
Years ended une 0Notional Amount
Fair Value AssetLia ilit
2015 2014 2015 2014
DERIVATIVES IN CASH FLOW HEDGINGRELATIONSHIPSForeign currencycontracts 951 $ 951 12 $ 187DERIVATIVES IN FAIR VALUE HEDGINGRELATIONSHIPSInterest ratecontracts ,20 $ 9,738 159 $ 168DERIVATIVES IN NET INVESTMENT HEDGINGRELATIONSHIPSNet investmenthedges 5 $ 831 95 $ 48DERIVATIVES NOT DESIGNATED AS HEDGINGINSTRUMENTSForeign currencycontracts , 10 $12,111 55 $ (42)
The total notional amount of contracts outstanding at the endof the period is indicative of the level of the Company'sderivative activity during the period. The change in thenotional balance of foreign currency contracts not designatedas hedging instruments during the period reflects changes inthe level of intercompany financing activity.
Amount of Gain LossRecogni ed in AOCI
on Deri ati es Effecti e PortionYears ended une 0 2015 2014
DERIVATIVES IN CASH FLOW HEDGINGRELATIONSHIPSInterest rate contracts 1 $ 3Foreign currency contracts 5 14TOTAL 4 $ 17DERIVATIVES IN NET INVESTMENT HEDGINGRELATIONSHIPSNet investment hedges 0 $ 30
During the next 12 months, the amount of the June 30, 2015,AOCI balance that will be reclassified to earnings is expectedto be immaterial. The amounts of gains and losses included inearnings from qualifying and non-qualifying financialinstruments used in hedging transactions for the years endedJune 30, 2015 and 2014 were as follows:
Amount of Gain LossReclassified from
AOCI into EarningsYears ended une 0 2015 2014
DERIVATIVES IN CASH FLOW HEDGINGRELATIONSHIPSInterest rate contracts $ 6Foreign currency contracts 152 38TOTAL 15 $ 44
Amount of Gain LossRecogni ed in Earnings
Years ended une 0 2015 2014
DERIVATIVES IN FAIR VALUE HEDGINGRELATIONSHIPSInterest rate contracts 9 $ 36Debt 9 (37)TOTAL $ (1)DERIVATIVES IN NET INVESTMENT HEDGINGRELATIONSHIPSNet investment hedges 1 $DERIVATIVES NOT DESIGNATED AS HEDGINGINSTRUMENTSForeign currency contracts (1) 9 $ 123
(1) The gain or loss on non-qualifying foreign currency contractssubstantially offsets the foreign currency mark-to-market impactof the related exposure.
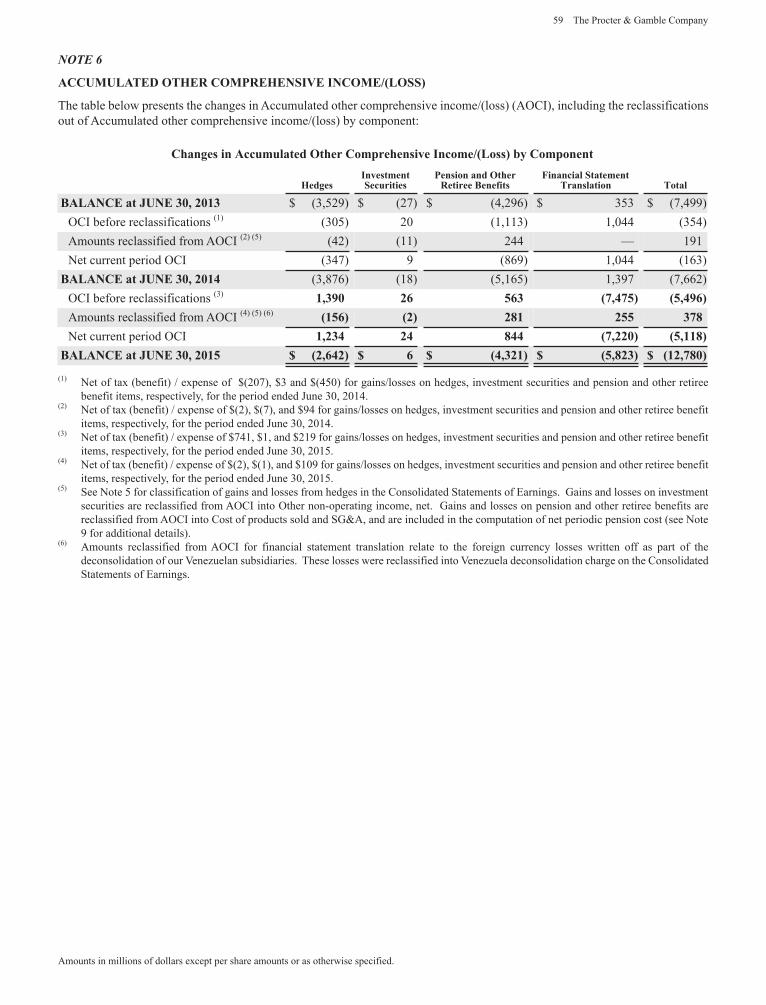
59 The Procter & Gamble Company
Amounts in millions of dollars except per share amounts or as otherwise specified.
ACCUMULATED OTHER COMPREHENSIVE INCOME LOSS
The table below presents the changes in Accumulated other comprehensive income (loss) (AOCI), including the reclassificationsout of Accumulated other comprehensive income (loss) by component:
Changes in Accumulated Other Com rehensi e Income Loss Com onent
HedgesIn estmentSecurities
Pension and OtherRetiree Benefits
Financial StatementTranslation Total
BALANCE at UNE 0, 201 $ (3,529) $ (27) $ (4,296) $ 353 $ (7,499)OCI before reclassifications (1) (305) 20 (1,113) 1,044 (354)Amounts reclassified from AOCI (2) (5) (42) (11) 244 191Net current period OCI (347) 9 (869) 1,044 (163)
BALANCE at UNE 0, 2014 (3,876) (18) (5,165) 1,397 (7,662)OCI before reclassifications (3) 1, 90 2 5 ,4 5 5,49Amounts reclassified from AOCI (4) (5) (6) 15 2 2 1 255Net current period OCI 1,2 4 24 44 ,220 5,11
BALANCE at UNE 0, 2015 2, 42 4, 21 5, 2 12, 0
(1) Net of tax (benefit) expense of $(207), $3 and $(450) for gains losses on hedges, investment securities and pension and other retireebenefit items, respectively, for the period ended June 30, 2014.
(2) Net of tax (benefit) expense of $(2), $(7), and $94 for gains losses on hedges, investment securities and pension and other retiree benefititems, respectively, for the period ended June 30, 2014.
(3) Net of tax (benefit) expense of $741, $1, and $219 for gains losses on hedges, investment securities and pension and other retiree benefititems, respectively, for the period ended June 30, 2015.
(4) Net of tax (benefit) expense of $(2), $(1), and $109 for gains losses on hedges, investment securities and pension and other retiree benefititems, respectively, for the period ended June 30, 2015.
(5) See Note 5 for classification of gains and losses from hedges in the Consolidated Statements of Earnings. Gains and losses on investmentsecurities are reclassified from AOCI into Other non-operating income, net. Gains and losses on pension and other retiree benefits arereclassified from AOCI into Cost of products sold and SG&A, and are included in the computation of net periodic pension cost (see Note9 for additional details).
(6) Amounts reclassified from AOCI for financial statement translation relate to the foreign currency losses written off as part of thedeconsolidation of our enezuelan subsidiaries. These losses were reclassified into enezuela deconsolidation charge on the ConsolidatedStatements of Earnings.
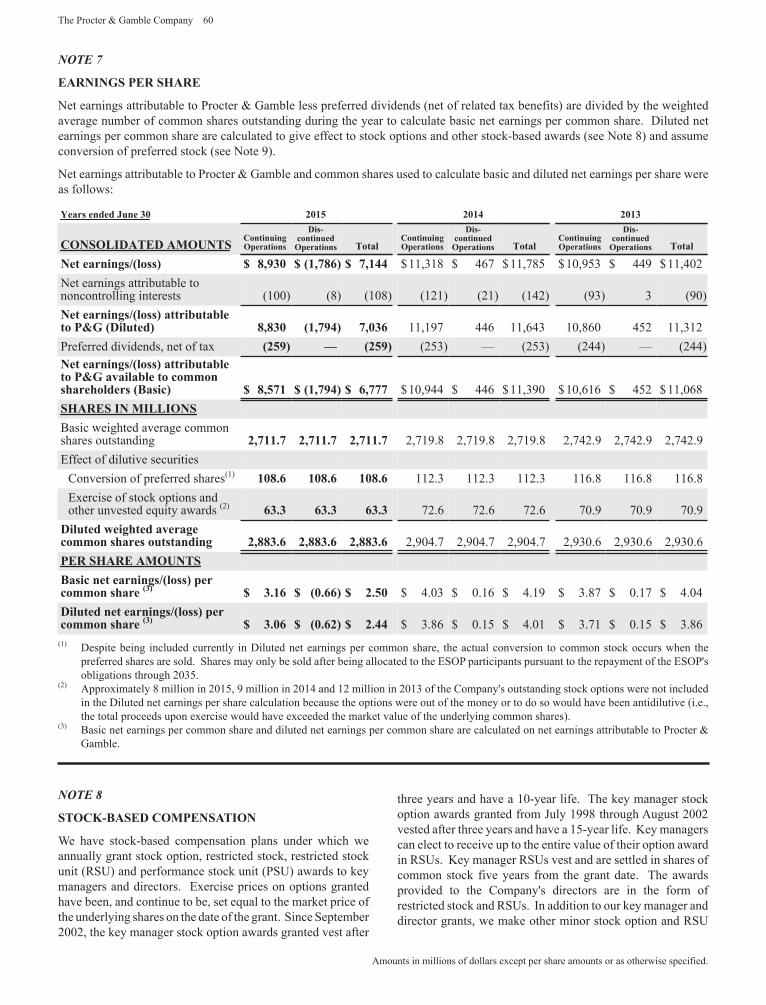
The Procter & Gamble Company 60
Amounts in millions of dollars except per share amounts or as otherwise specified.
EARNINGS PER SHARE
Net earnings attributable to Procter & Gamble less preferred dividends (net of related tax benefits) are divided by the weightedaverage number of common shares outstanding during the year to calculate basic net earnings per common share. Diluted netearnings per common share are calculated to give effect to stock options and other stock-based awards (see Note 8) and assumeconversion of preferred stock (see Note 9).
Net earnings attributable to Procter & Gamble and common shares used to calculate basic and diluted net earnings per share wereas follows:
Years ended une 0 2015 2014 201
CONSOLIDATED AMOUNTS ContinuingO erations
Dis-continued
O erations TotalContinuingO erations
Dis-continued
O erations TotalContinuingO erations
Dis-continued
O erations Total
Net earnings loss ,9 0 1, ,144 $11,318 $ 467 $11,785 $10,953 $ 449 $11,402Net earnings attributable tononcontrolling interests (100) (8) (108) (121) (21) (142) (93) 3 (90)Net earnings loss attri uta leto P&G Diluted , 0 1, 94 ,0 11,197 446 11,643 10,860 452 11,312Preferred dividends, net of tax 259 259 (253) (253) (244) (244)Net earnings loss attri uta leto P&G a aila le to commonshareholders Basic ,5 1 1, 94 , $10,944 $ 446 $11,390 $10,616 $ 452 $11,068SHARES IN MILLIONS
asic weighted average commonshares outstanding 2, 11. 2, 11. 2, 11. 2,719.8 2,719.8 2,719.8 2,742.9 2,742.9 2,742.9Effect of dilutive securities
Conversion of preferred shares(1) 10 . 10 . 10 . 112.3 112.3 112.3 116.8 116.8 116.8Exercise of stock options andother unvested equity awards (2) . . . 72.6 72.6 72.6 70.9 70.9 70.9
Diluted weighted a eragecommon shares outstanding 2, . 2, . 2, . 2,904.7 2,904.7 2,904.7 2,930.6 2,930.6 2,930.6PER SHARE AMOUNTSBasic net earnings loss ercommon share .1 0. 2.50 $ 4.03 $ 0.16 $ 4.19 $ 3.87 $ 0.17 $ 4.04Diluted net earnings loss ercommon share .0 0. 2 2.44 $ 3.86 $ 0.15 $ 4.01 $ 3.71 $ 0.15 $ 3.86
(1) Despite being included currently in Diluted net earnings per common share, the actual conversion to common stock occurs when thepreferred shares are sold. Shares may only be sold after being allocated to the ESOP participants pursuant to the repayment of the ESOP'sobligations through 2035.
(2) Approximately 8 million in 2015, 9 million in 2014 and 12 million in 2013 of the Company's outstanding stock options were not includedin the Diluted net earnings per share calculation because the options were out of the money or to do so would have been antidilutive (i.e.,the total proceeds upon exercise would have exceeded the market value of the underlying common shares).
(3) asic net earnings per common share and diluted net earnings per common share are calculated on net earnings attributable to Procter &Gamble.
STOCK-BASED COMPENSATION
e have stock-based compensation plans under which weannually grant stock option, restricted stock, restricted stockunit (RSU) and performance stock unit (PSU) awards to keymanagers and directors. Exercise prices on options grantedhave been, and continue to be, set equal to the market price ofthe underlying shares on the date of the grant. Since September2002, the key manager stock option awards granted vest after
three years and have a 10-year life. The key manager stockoption awards granted from July 1998 through August 2002vested after three years and have a 15-year life. Key managerscan elect to receive up to the entire value of their option awardin RSUs. Key manager RSUs vest and are settled in shares ofcommon stock five years from the grant date. The awardsprovided to the Company's directors are in the form ofrestricted stock and RSUs. In addition to our key manager anddirector grants, we make other minor stock option and RSU
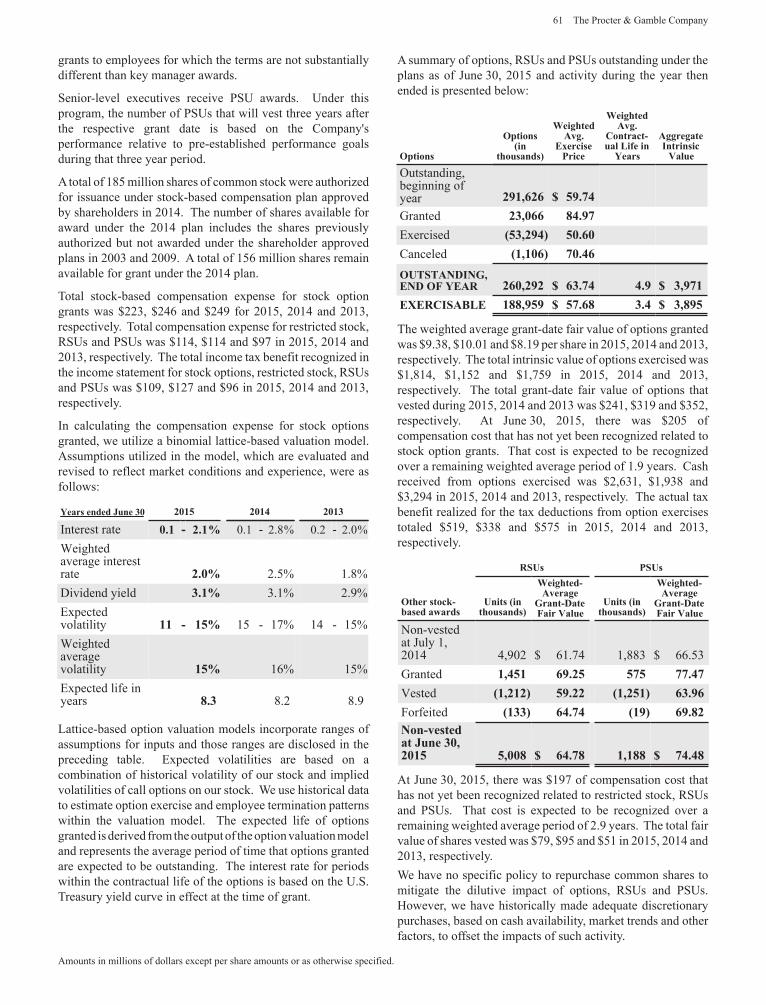
61 The Procter & Gamble Company
Amounts in millions of dollars except per share amounts or as otherwise specified.
grants to employees for which the terms are not substantiallydifferent than key manager awards.
Senior-level executives receive PSU awards. Under thisprogram, the number of PSUs that will vest three years afterthe respective grant date is based on the Company'sperformance relative to pre-established performance goalsduring that three year period.
Atotal of 185 million shares of common stock were authorizedfor issuance under stock-based compensation plan approvedby shareholders in 2014. The number of shares available foraward under the 2014 plan includes the shares previouslyauthorized but not awarded under the shareholder approvedplans in 2003 and 2009. A total of 156 million shares remainavailable for grant under the 2014 plan.
Total stock-based compensation expense for stock optiongrants was $223, $246 and $249 for 2015, 2014 and 2013,respectively. Total compensation expense for restricted stock,RSUs and PSUs was $114, $114 and $97 in 2015, 2014 and2013, respectively. The total income tax benefit recognized inthe income statement for stock options, restricted stock, RSUsand PSUs was $109, $127 and $96 in 2015, 2014 and 2013,respectively.
In calculating the compensation expense for stock optionsgranted, we utilize a binomial lattice-based valuation model.Assumptions utilized in the model, which are evaluated andrevised to reflect market conditions and experience, were asfollows:
Years ended une 0 2015 2014 201
Interest rate 0.1 - 2.1 0.1 - 2.8 0.2 - 2.0eighted
average interestrate 2.0 2.5 1.8Dividend yield .1 3.1 2.9Expectedvolatility 11 - 15 15 - 17 14 - 15
eightedaveragevolatility 15 16 15Expected life inyears . 8.2 8.9
Lattice-based option valuation models incorporate ranges ofassumptions for inputs and those ranges are disclosed in thepreceding table. Expected volatilities are based on acombination of historical volatility of our stock and impliedvolatilities of call options on our stock. e use historical datato estimate option exercise and employee termination patternswithin the valuation model. The expected life of optionsgranted is derived from the output of the option valuation modeland represents the average period of time that options grantedare expected to be outstanding. The interest rate for periodswithin the contractual life of the options is based on the U.S.Treasury yield curve in effect at the time of grant.
A summary of options, RSUs and PSUs outstanding under theplans as of June 30, 2015 and activity during the year thenended is presented below:
O tions
O tionsin
thousands
WeightedA g.
ExercisePrice
WeightedA g.
Contract-ual Life in
Years
AggregateIntrinsic
Value
Outstanding,beginning ofyear 291, 2 59. 4Granted 2 ,0 4.9Exercised 5 ,294 50. 0Canceled 1,10 0.4OUTSTANDING,END OF YEAR 2 0,292 . 4 4.9 ,9 1EXERCISABLE 1 ,959 5 . .4 , 95
The weighted average grant-date fair value of options grantedwas $9.38, $10.01 and $8.19 per share in 2015, 2014 and 2013,respectively. The total intrinsic value of options exercised was$1,814, $1,152 and $1,759 in 2015, 2014 and 2013,respectively. The total grant-date fair value of options thatvested during 2015, 2014 and 2013 was $241, $319 and $352,respectively. At June 30, 2015, there was $205 ofcompensation cost that has not yet been recognized related tostock option grants. That cost is expected to be recognizedover a remaining weighted average period of 1.9 years. Cashreceived from options exercised was $2,631, $1,938 and$3,294 in 2015, 2014 and 2013, respectively. The actual taxbenefit realized for the tax deductions from option exercisestotaled $519, $338 and $575 in 2015, 2014 and 2013,respectively.
RSUs PSUs
Other stock-ased awards
Units inthousands
Weighted-A erage
Grant-DateFair Value
Units inthousands
Weighted-A erage
Grant-DateFair Value
Non-vestedat July 1,2014 4,902 $ 61.74 1,883 $ 66.53Granted 1,451 9.25 5 5 .4
ested 1,212 59.22 1,251 .9Forfeited 1 4. 4 19 9. 2Non- estedat une 0,2015 5,00 4. 1,1 4.4
At June 30, 2015, there was $197 of compensation cost thathas not yet been recognized related to restricted stock, RSUsand PSUs. That cost is expected to be recognized over aremaining weighted average period of 2.9 years. The total fairvalue of shares vested was $79, $95 and $51 in 2015, 2014 and2013, respectively.
e have no specific policy to repurchase common shares tomitigate the dilutive impact of options, RSUs and PSUs.However, we have historically made adequate discretionarypurchases, based on cash availability, market trends and otherfactors, to offset the impacts of such activity.
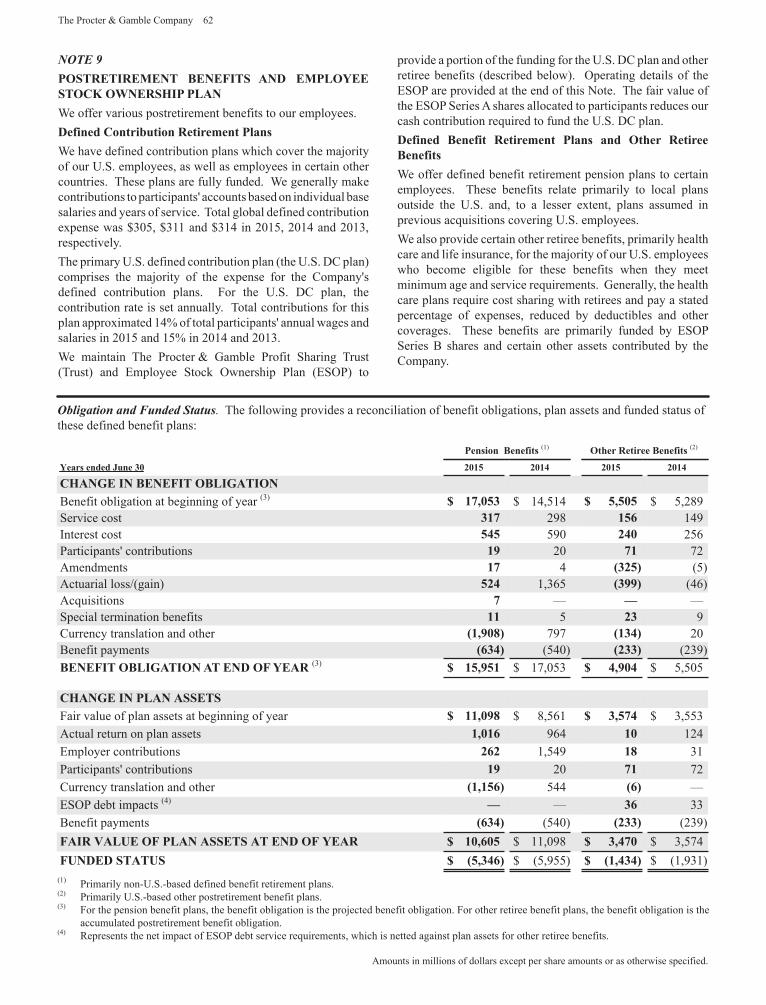
The Procter & Gamble Company 62
Amounts in millions of dollars except per share amounts or as otherwise specified.
POSTRETIREMENT BENEFITS AND EMPLOYEESTOCK OWNERSHIP PLAN
e offer various postretirement benefits to our employees.Defined Contri ution Retirement Plans
e have defined contribution plans which cover the majorityof our U.S. employees, as well as employees in certain othercountries. These plans are fully funded. e generally makecontributions to participants' accounts based on individual basesalaries and years of service. Total global defined contributionexpense was $305, $311 and $314 in 2015, 2014 and 2013,respectively.The primary U.S. defined contribution plan (the U.S. DC plan)comprises the majority of the expense for the Company'sdefined contribution plans. For the U.S. DC plan, thecontribution rate is set annually. Total contributions for thisplan approximated 14 of total participants' annual wages andsalaries in 2015 and 15 in 2014 and 2013.
e maintain The Procter & Gamble Profit Sharing Trust(Trust) and Employee Stock Ownership Plan (ESOP) to
provide a portion of the funding for the U.S. DC plan and otherretiree benefits (described below). Operating details of theESOP are provided at the end of this Note. The fair value ofthe ESOP Series A shares allocated to participants reduces ourcash contribution required to fund the U.S. DC plan.Defined Benefit Retirement Plans and Other RetireeBenefits
e offer defined benefit retirement pension plans to certainemployees. These benefits relate primarily to local plansoutside the U.S. and, to a lesser extent, plans assumed inprevious acquisitions covering U.S. employees.
e also provide certain other retiree benefits, primarily healthcare and life insurance, for the majority of our U.S. employeeswho become eligible for these benefits when they meetminimum age and service requirements. Generally, the healthcare plans require cost sharing with retirees and pay a statedpercentage of expenses, reduced by deductibles and othercoverages. These benefits are primarily funded by ESOPSeries shares and certain other assets contributed by theCompany.
l t on n n e t t s The following provides a reconciliation of benefit obligations, plan assets and funded status ofthese defined benefit plans:
Pension Benefits (1) Other Retiree Benefits (2)
Years ended une 0 2015 2014 2015 2014
CHANGE IN BENEFIT OBLIGATIONenefit obligation at beginning of year (3) 1 ,05 $ 14,514 5,505 $ 5,289
Service cost 1 298 15 149Interest cost 545 590 240 256Participants' contributions 19 20 1 72Amendments 1 4 25 (5)Actuarial loss (gain) 524 1,365 99 (46)AcquisitionsSpecial termination benefits 11 5 2 9Currency translation and other 1,90 797 1 4 20
enefit payments 4 (540) 2 (239)BENEFIT OBLIGATION AT END OF YEAR (3) 15,951 $ 17,053 4,904 $ 5,505
CHANGE IN PLAN ASSETSFair value of plan assets at beginning of year 11,09 $ 8,561 ,5 4 $ 3,553Actual return on plan assets 1,01 964 10 124Employer contributions 2 2 1,549 1 31Participants' contributions 19 20 1 72Currency translation and other 1,15 544ESOP debt impacts (4) 33
enefit payments 4 (540) 2 (239)FAIR VALUE OF PLAN ASSETS AT END OF YEAR 10, 05 $ 11,098 ,4 0 $ 3,574FUNDED STATUS 5, 4 $ (5,955) 1,4 4 $ (1,931)
(1) Primarily non-U.S.-based defined benefit retirement plans.(2) Primarily U.S.-based other postretirement benefit plans.(3) For the pension benefit plans, the benefit obligation is the projected benefit obligation. For other retiree benefit plans, the benefit obligation is the
accumulated postretirement benefit obligation.(4) Represents the net impact of ESOP debt service requirements, which is netted against plan assets for other retiree benefits.
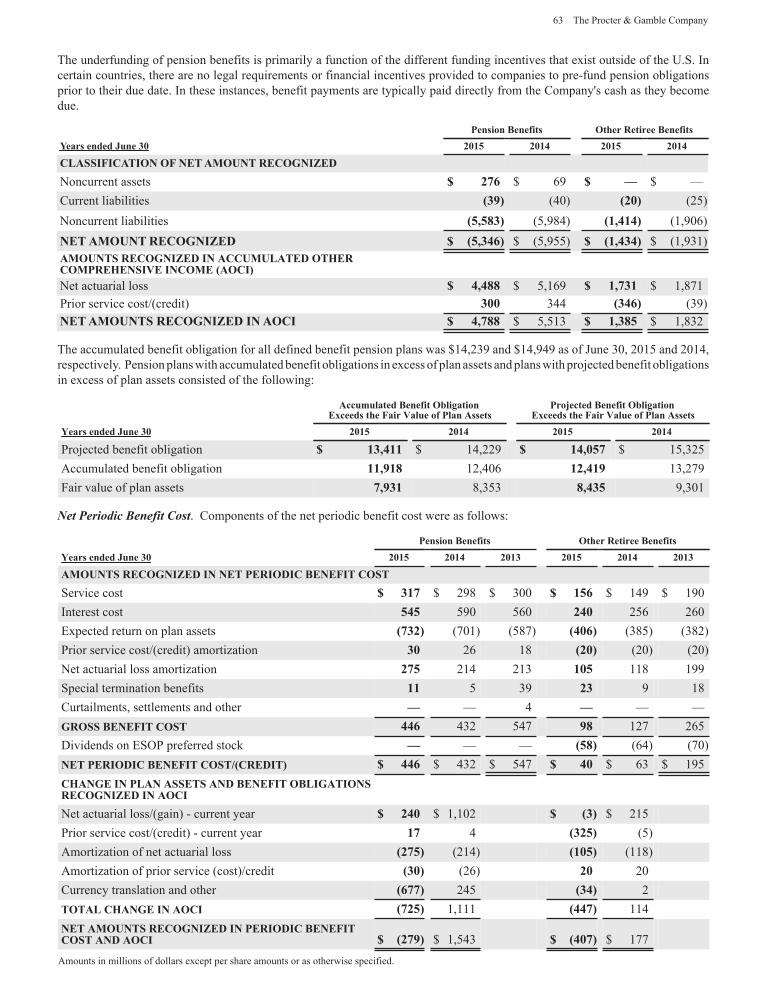
63 The Procter & Gamble Company
Amounts in millions of dollars except per share amounts or as otherwise specified.
The underfunding of pension benefits is primarily a function of the different funding incentives that exist outside of the U.S. Incertain countries, there are no legal requirements or financial incentives provided to companies to pre-fund pension obligationsprior to their due date. In these instances, benefit payments are typically paid directly from the Company's cash as they becomedue.
Pension Benefits Other Retiree BenefitsYears ended une 0 2015 2014 2015 2014
CLASSIFICATION OF NET AMOUNT RECOGNI EDNoncurrent assets 2 $ 69 $Current liabilities 9 (40) 20 (25)Noncurrent liabilities 5,5 (5,984) 1,414 (1,906)NET AMOUNT RECOGNI ED 5, 4 $ (5,955) 1,4 4 $ (1,931)AMOUNTS RECOGNI ED IN ACCUMULATED OTHERCOMPREHENSIVE INCOME AOCINet actuarial loss 4,4 $ 5,169 1, 1 $ 1,871Prior service cost (credit) 00 344 4 (39)NET AMOUNTS RECOGNI ED IN AOCI 4, $ 5,513 1, 5 $ 1,832
The accumulated benefit obligation for all defined benefit pension plans was $14,239 and $14,949 as of June 30, 2015 and 2014,respectively. Pension plans with accumulated benefit obligations in excess of plan assets and plans with projected benefit obligationsin excess of plan assets consisted of the following:
Accumulated Benefit O ligationExceeds the Fair Value of Plan Assets
Pro ected Benefit O ligationExceeds the Fair Value of Plan Assets
Years ended une 0 2015 2014 2015 2014
Projected benefit obligation 1 ,411 $ 14,229 14,05 $ 15,325Accumulated benefit obligation 11,91 12,406 12,419 13,279Fair value of plan assets ,9 1 8,353 ,4 5 9,301
et e o c ene t ost. Components of the net periodic benefit cost were as follows:
Pension Benefits Other Retiree BenefitsYears ended une 0 2015 2014 201 2015 2014 201
AMOUNTS RECOGNI ED IN NET PERIODIC BENEFIT COSTService cost 1 $ 298 $ 300 15 $ 149 $ 190Interest cost 545 590 560 240 256 260Expected return on plan assets 2 (701) (587) 40 (385) (382)Prior service cost (credit) amortization 0 26 18 20 (20) (20)Net actuarial loss amortization 2 5 214 213 105 118 199Special termination benefits 11 5 39 2 9 18Curtailments, settlements and other 4GROSS BENEFIT COST 44 432 547 9 127 265Dividends on ESOP preferred stock 5 (64) (70)NET PERIODIC BENEFIT COST CREDIT 44 $ 432 $ 547 40 $ 63 $ 195CHANGE IN PLAN ASSETS AND BENEFIT OBLIGATIONSRECOGNI ED IN AOCINet actuarial loss (gain) - current year 240 $ 1,102 $ 215Prior service cost (credit) - current year 1 4 25 (5)Amortization of net actuarial loss 2 5 (214) 105 (118)Amortization of prior service (cost) credit 0 (26) 20 20Currency translation and other 245 4 2TOTAL CHANGE IN AOCI 25 1,111 44 114NET AMOUNTS RECOGNI ED IN PERIODIC BENEFITCOST AND AOCI 2 9 $ 1,543 40 $ 177
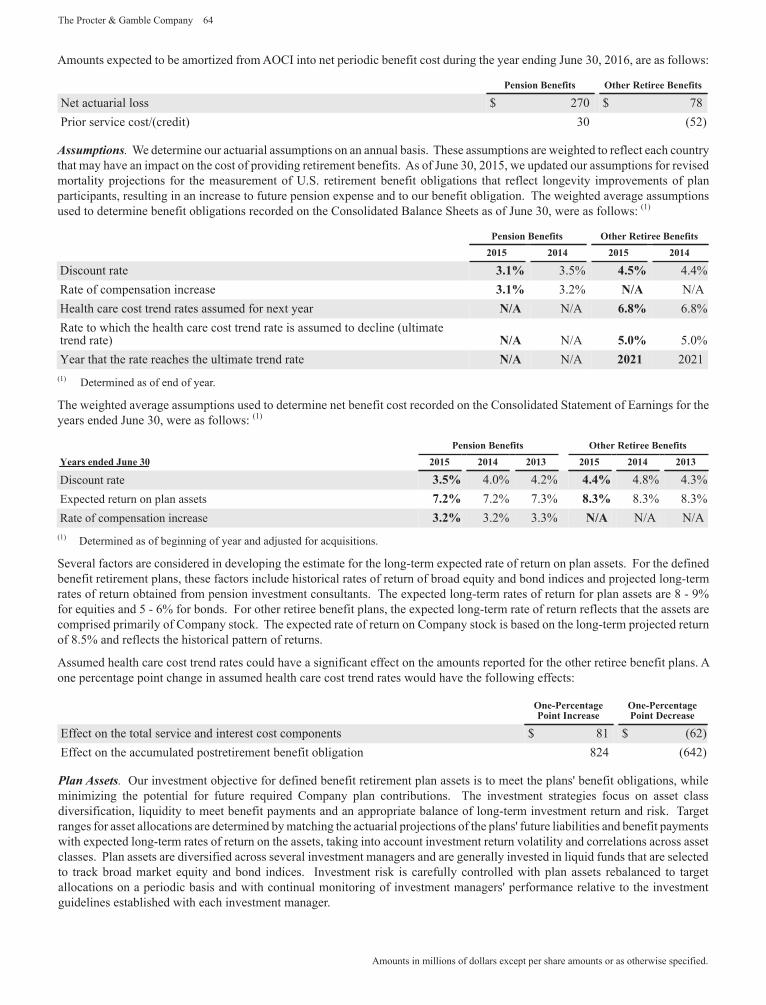
The Procter & Gamble Company 64
Amounts in millions of dollars except per share amounts or as otherwise specified.
Amounts expected to be amortized from AOCI into net periodic benefit cost during the year ending June 30, 2016, are as follows:
Pension Benefits Other Retiree Benefits
Net actuarial loss $ 270 $ 78Prior service cost (credit) 30 (52)
ss mpt ons e determine our actuarial assumptions on an annual basis. These assumptions are weighted to reflect each countrythat may have an impact on the cost of providing retirement benefits. As of June 30, 2015, we updated our assumptions for revisedmortality projections for the measurement of U.S. retirement benefit obligations that reflect longevity improvements of planparticipants, resulting in an increase to future pension expense and to our benefit obligation. The weighted average assumptionsused to determine benefit obligations recorded on the Consolidated alance Sheets as of June 30, were as follows: (1)
Pension Benefits Other Retiree Benefits2015 2014 2015 2014
Discount rate .1 3.5 4.5 4.4Rate of compensation increase .1 3.2 N A N AHealth care cost trend rates assumed for next year N A N A . 6.8Rate to which the health care cost trend rate is assumed to decline (ultimatetrend rate) N A N A 5.0 5.0Year that the rate reaches the ultimate trend rate N A N A 2021 2021
(1) Determined as of end of year.
The weighted average assumptions used to determine net benefit cost recorded on the Consolidated Statement of Earnings for theyears ended June 30, were as follows: (1)
Pension Benefits Other Retiree BenefitsYears ended une 0 2015 2014 201 2015 2014 201
Discount rate .5 4.0 4.2 4.4 4.8 4.3Expected return on plan assets .2 7.2 7.3 . 8.3 8.3Rate of compensation increase .2 3.2 3.3 N A N A N A
(1) Determined as of beginning of year and adjusted for acquisitions.
Several factors are considered in developing the estimate for the long-term expected rate of return on plan assets. For the definedbenefit retirement plans, these factors include historical rates of return of broad equity and bond indices and projected long-termrates of return obtained from pension investment consultants. The expected long-term rates of return for plan assets are 8 - 9for equities and 5 - 6 for bonds. For other retiree benefit plans, the expected long-term rate of return reflects that the assets arecomprised primarily of Company stock. The expected rate of return on Company stock is based on the long-term projected returnof 8.5 and reflects the historical pattern of returns.
Assumed health care cost trend rates could have a significant effect on the amounts reported for the other retiree benefit plans. Aone percentage point change in assumed health care cost trend rates would have the following effects:
One-PercentagePoint Increase
One-PercentagePoint Decrease
Effect on the total service and interest cost components $ 81 $ (62)Effect on the accumulated postretirement benefit obligation 824 (642)
l n ssets Our investment objective for defined benefit retirement plan assets is to meet the plans' benefit obligations, whileminimizing the potential for future required Company plan contributions. The investment strategies focus on asset classdiversification, liquidity to meet benefit payments and an appropriate balance of long-term investment return and risk. Targetranges for asset allocations are determined by matching the actuarial projections of the plans' future liabilities and benefit paymentswith expected long-term rates of return on the assets, taking into account investment return volatility and correlations across assetclasses. Plan assets are diversified across several investment managers and are generally invested in liquid funds that are selectedto track broad market equity and bond indices. Investment risk is carefully controlled with plan assets rebalanced to targetallocations on a periodic basis and with continual monitoring of investment managers' performance relative to the investmentguidelines established with each investment manager.
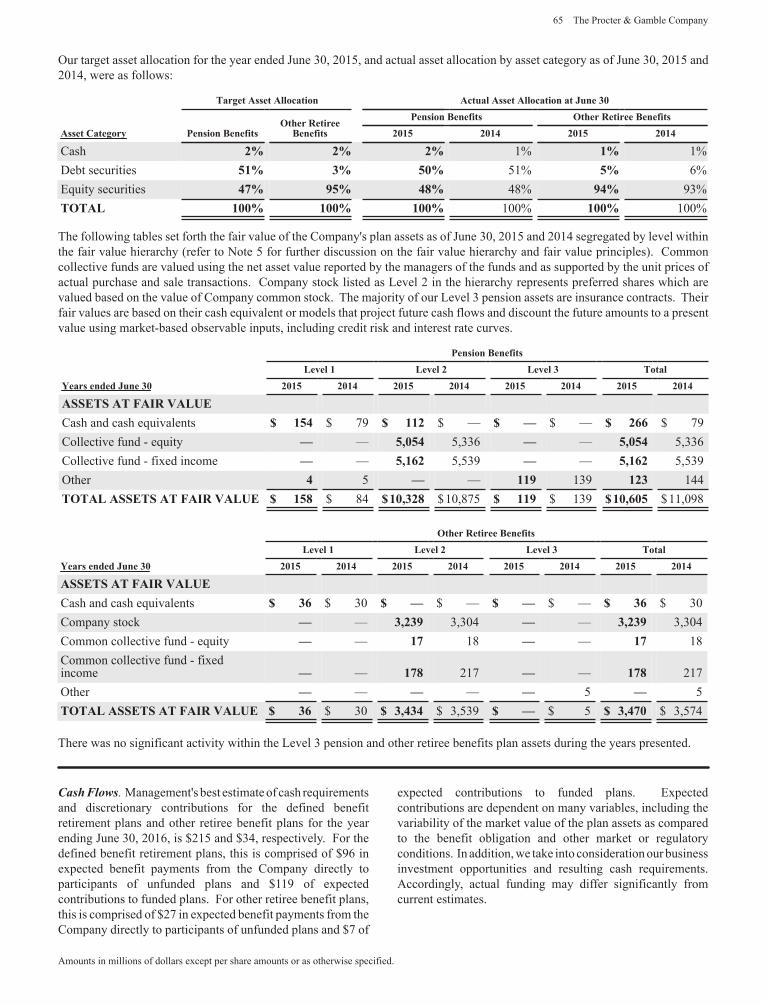
65 The Procter & Gamble Company
Amounts in millions of dollars except per share amounts or as otherwise specified.
Our target asset allocation for the year ended June 30, 2015, and actual asset allocation by asset category as of June 30, 2015 and2014, were as follows:
Target Asset Allocation Actual Asset Allocation at une 0
Pension BenefitsOther Retiree
BenefitsPension Benefits Other Retiree Benefits
Asset Categor 2015 2014 2015 2014
Cash 2 2 2 1 1 1Debt securities 51 50 51 5 6Equity securities 4 95 4 48 94 93TOTAL 100 100 100 100 100 100
The following tables set forth the fair value of the Company's plan assets as of June 30, 2015 and 2014 segregated by level withinthe fair value hierarchy (refer to Note 5 for further discussion on the fair value hierarchy and fair value principles). Commoncollective funds are valued using the net asset value reported by the managers of the funds and as supported by the unit prices ofactual purchase and sale transactions. Company stock listed as Level 2 in the hierarchy represents preferred shares which arevalued based on the value of Company common stock. The majority of our Level 3 pension assets are insurance contracts. Theirfair values are based on their cash equivalent or models that project future cash flows and discount the future amounts to a presentvalue using market-based observable inputs, including credit risk and interest rate curves.
Pension BenefitsLe el 1 Le el 2 Le el Total
Years ended une 0 2015 2014 2015 2014 2015 2014 2015 2014
ASSETS AT FAIR VALUECash and cash equivalents 154 $ 79 112 $ $ 2 $ 79Collective fund - equity 5,054 5,336 5,054 5,336Collective fund - fixed income 5,1 2 5,539 5,1 2 5,539Other 4 5 119 139 12 144TOTAL ASSETS AT FAIR VALUE 15 $ 84 10, 2 $10,875 119 $ 139 10, 05 $11,098
Other Retiree BenefitsLe el 1 Le el 2 Le el Total
Years ended une 0 2015 2014 2015 2014 2015 2014 2015 2014
ASSETS AT FAIR VALUECash and cash equivalents $ 30 $ $ $ 30Company stock ,2 9 3,304 ,2 9 3,304Common collective fund - equity 1 18 1 18Common collective fund - fixedincome 1 217 1 217Other 5 5TOTAL ASSETS AT FAIR VALUE $ 30 ,4 4 $ 3,539 $ 5 ,4 0 $ 3,574
There was no significant activity within the Level 3 pension and other retiree benefits plan assets during the years presented.
s lo s Management's best estimate of cash requirementsand discretionary contributions for the defined benefitretirement plans and other retiree benefit plans for the yearending June 30, 2016, is $215 and $34, respectively. For thedefined benefit retirement plans, this is comprised of $96 inexpected benefit payments from the Company directly toparticipants of unfunded plans and $119 of expectedcontributions to funded plans. For other retiree benefit plans,this is comprised of $27 in expected benefit payments from theCompany directly to participants of unfunded plans and $7 of
expected contributions to funded plans. Expectedcontributions are dependent on many variables, including thevariability of the market value of the plan assets as comparedto the benefit obligation and other market or regulatoryconditions. In addition, we take into consideration our businessinvestment opportunities and resulting cash requirements.Accordingly, actual funding may differ significantly fromcurrent estimates.
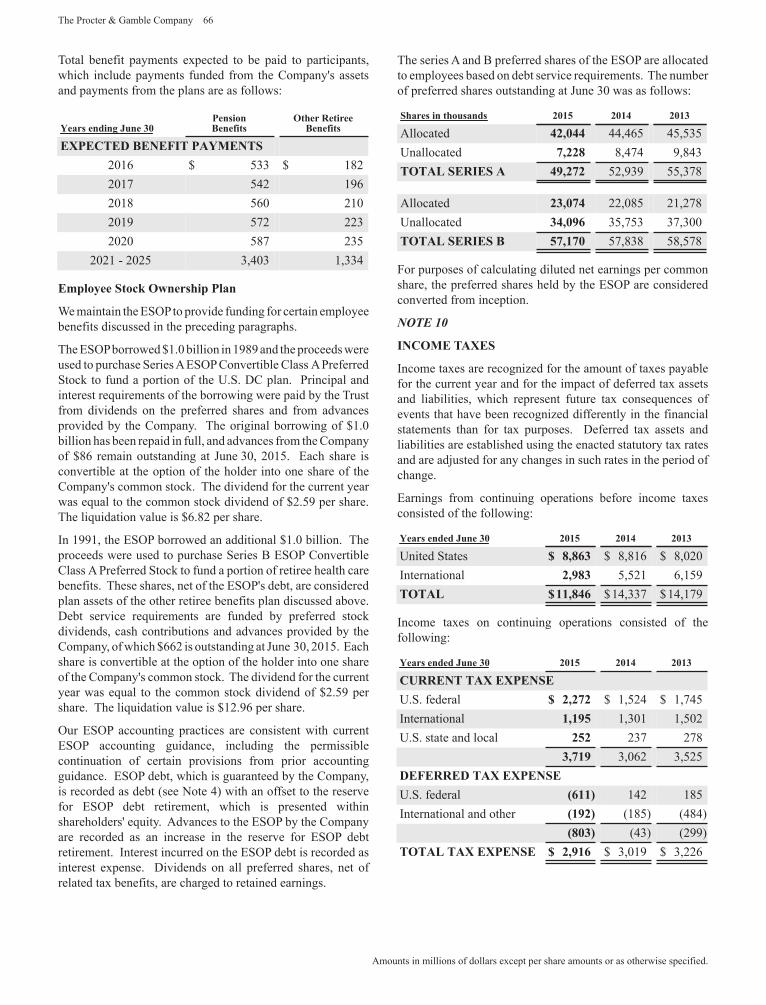
The Procter & Gamble Company 66
Amounts in millions of dollars except per share amounts or as otherwise specified.
Total benefit payments expected to be paid to participants,which include payments funded from the Company's assetsand payments from the plans are as follows:
Years ending une 0PensionBenefits
Other RetireeBenefits
EXPECTED BENEFIT PAYMENTS2016 $ 533 $ 1822017 542 1962018 560 2102019 572 2232020 587 235
2021 - 2025 3,403 1,334
Em lo ee Stock Ownershi Plan
e maintain the ESOPto provide funding for certain employeebenefits discussed in the preceding paragraphs.
The ESOPborrowed $1.0 billion in 1989 and the proceeds wereused to purchase Series AESOP Convertible Class APreferredStock to fund a portion of the U.S. DC plan. Principal andinterest requirements of the borrowing were paid by the Trustfrom dividends on the preferred shares and from advancesprovided by the Company. The original borrowing of $1.0billion has been repaid in full, and advances from the Companyof $86 remain outstanding at June 30, 2015. Each share isconvertible at the option of the holder into one share of theCompany's common stock. The dividend for the current yearwas equal to the common stock dividend of $2.59 per share.The liquidation value is $6.82 per share.
In 1991, the ESOP borrowed an additional $1.0 billion. Theproceeds were used to purchase Series ESOP ConvertibleClass A Preferred Stock to fund a portion of retiree health carebenefits. These shares, net of the ESOP's debt, are consideredplan assets of the other retiree benefits plan discussed above.Debt service requirements are funded by preferred stockdividends, cash contributions and advances provided by theCompany, of which $662 is outstanding at June 30, 2015. Eachshare is convertible at the option of the holder into one shareof the Company's common stock. The dividend for the currentyear was equal to the common stock dividend of $2.59 pershare. The liquidation value is $12.96 per share.
Our ESOP accounting practices are consistent with currentESOP accounting guidance, including the permissiblecontinuation of certain provisions from prior accountingguidance. ESOP debt, which is guaranteed by the Company,is recorded as debt (see Note 4) with an offset to the reservefor ESOP debt retirement, which is presented withinshareholders' equity. Advances to the ESOP by the Companyare recorded as an increase in the reserve for ESOP debtretirement. Interest incurred on the ESOP debt is recorded asinterest expense. Dividends on all preferred shares, net ofrelated tax benefits, are charged to retained earnings.
The series A and preferred shares of the ESOP are allocatedto employees based on debt service requirements. The numberof preferred shares outstanding at June 30 was as follows:
Shares in thousands 2015 2014 201
Allocated 42,044 44,465 45,535Unallocated ,22 8,474 9,843TOTAL SERIES A 49,2 2 52,939 55,378
Allocated 2 ,0 4 22,085 21,278Unallocated 4,09 35,753 37,300TOTAL SERIES B 5 ,1 0 57,838 58,578
For purposes of calculating diluted net earnings per commonshare, the preferred shares held by the ESOP are consideredconverted from inception.
INCOME TAXES
Income taxes are recognized for the amount of taxes payablefor the current year and for the impact of deferred tax assetsand liabilities, which represent future tax consequences ofevents that have been recognized differently in the financialstatements than for tax purposes. Deferred tax assets andliabilities are established using the enacted statutory tax ratesand are adjusted for any changes in such rates in the period ofchange.
Earnings from continuing operations before income taxesconsisted of the following:
Years ended une 0 2015 2014 201
United States , $ 8,816 $ 8,020International 2,9 5,521 6,159TOTAL 11, 4 $14,337 $14,179
Income taxes on continuing operations consisted of thefollowing:
Years ended une 0 2015 2014 201
CURRENT TAX EXPENSEU.S. federal 2,2 2 $ 1,524 $ 1,745International 1,195 1,301 1,502U.S. state and local 252 237 278
, 19 3,062 3,525DEFERRED TAX EXPENSEU.S. federal 11 142 185International and other 192 (185) (484)
0 (43) (299)TOTAL TAX EXPENSE 2,91 $ 3,019 $ 3,226
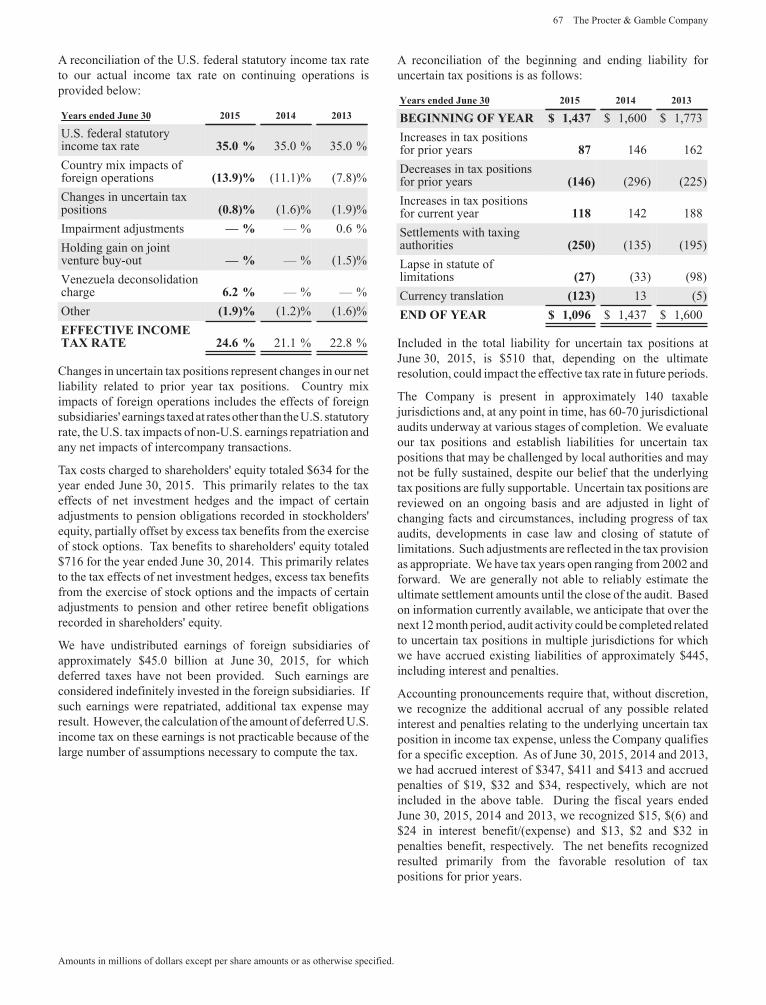
67 The Procter & Gamble Company
Amounts in millions of dollars except per share amounts or as otherwise specified.
A reconciliation of the U.S. federal statutory income tax rateto our actual income tax rate on continuing operations isprovided below:
Years ended une 0 2015 2014 201
U.S. federal statutoryincome tax rate 5.0 35.0 35.0Country mix impacts offoreign operations 1 .9 (11.1) (7.8)Changes in uncertain taxpositions 0. (1.6) (1.9)Impairment adjustments 0.6Holding gain on jointventure buy-out (1.5)
enezuela deconsolidationcharge .2Other 1.9 (1.2) (1.6)EFFECTIVE INCOMETAX RATE 24. 21.1 22.8
Changes in uncertain tax positions represent changes in our netliability related to prior year tax positions. Country miximpacts of foreign operations includes the effects of foreignsubsidiaries' earnings taxed at rates other than the U.S. statutoryrate, the U.S. tax impacts of non-U.S. earnings repatriation andany net impacts of intercompany transactions.
Tax costs charged to shareholders' equity totaled $634 for theyear ended June 30, 2015. This primarily relates to the taxeffects of net investment hedges and the impact of certainadjustments to pension obligations recorded in stockholders'equity, partially offset by excess tax benefits from the exerciseof stock options. Tax benefits to shareholders' equity totaled$716 for the year ended June 30, 2014. This primarily relatesto the tax effects of net investment hedges, excess tax benefitsfrom the exercise of stock options and the impacts of certainadjustments to pension and other retiree benefit obligationsrecorded in shareholders' equity.
e have undistributed earnings of foreign subsidiaries ofapproximately $45.0 billion at June 30, 2015, for whichdeferred taxes have not been provided. Such earnings areconsidered indefinitely invested in the foreign subsidiaries. Ifsuch earnings were repatriated, additional tax expense mayresult. However, the calculation of the amount of deferred U.S.income tax on these earnings is not practicable because of thelarge number of assumptions necessary to compute the tax.
A reconciliation of the beginning and ending liability foruncertain tax positions is as follows:
Years ended une 0 2015 2014 201
BEGINNING OF YEAR 1,4 $ 1,600 $ 1,773Increases in tax positionsfor prior years 146 162Decreases in tax positionsfor prior years 14 (296) (225)Increases in tax positionsfor current year 11 142 188Settlements with taxingauthorities 250 (135) (195)Lapse in statute oflimitations 2 (33) (98)Currency translation 12 13 (5)END OF YEAR 1,09 $ 1,437 $ 1,600
Included in the total liability for uncertain tax positions atJune 30, 2015, is $510 that, depending on the ultimateresolution, could impact the effective tax rate in future periods.
The Company is present in approximately 140 taxablejurisdictions and, at any point in time, has 60-70 jurisdictionalaudits underway at various stages of completion. e evaluateour tax positions and establish liabilities for uncertain taxpositions that may be challenged by local authorities and maynot be fully sustained, despite our belief that the underlyingtax positions are fully supportable. Uncertain tax positions arereviewed on an ongoing basis and are adjusted in light ofchanging facts and circumstances, including progress of taxaudits, developments in case law and closing of statute oflimitations. Such adjustments are reflected in the tax provisionas appropriate. e have tax years open ranging from 2002 andforward. e are generally not able to reliably estimate theultimate settlement amounts until the close of the audit. asedon information currently available, we anticipate that over thenext 12 month period, audit activity could be completed relatedto uncertain tax positions in multiple jurisdictions for whichwe have accrued existing liabilities of approximately $445,including interest and penalties.
Accounting pronouncements require that, without discretion,we recognize the additional accrual of any possible relatedinterest and penalties relating to the underlying uncertain taxposition in income tax expense, unless the Company qualifiesfor a specific exception. As of June 30, 2015, 2014 and 2013,we had accrued interest of $347, $411 and $413 and accruedpenalties of $19, $32 and $34, respectively, which are notincluded in the above table. During the fiscal years endedJune 30, 2015, 2014 and 2013, we recognized $15, $(6) and$24 in interest benefit (expense) and $13, $2 and $32 inpenalties benefit, respectively. The net benefits recognizedresulted primarily from the favorable resolution of taxpositions for prior years.
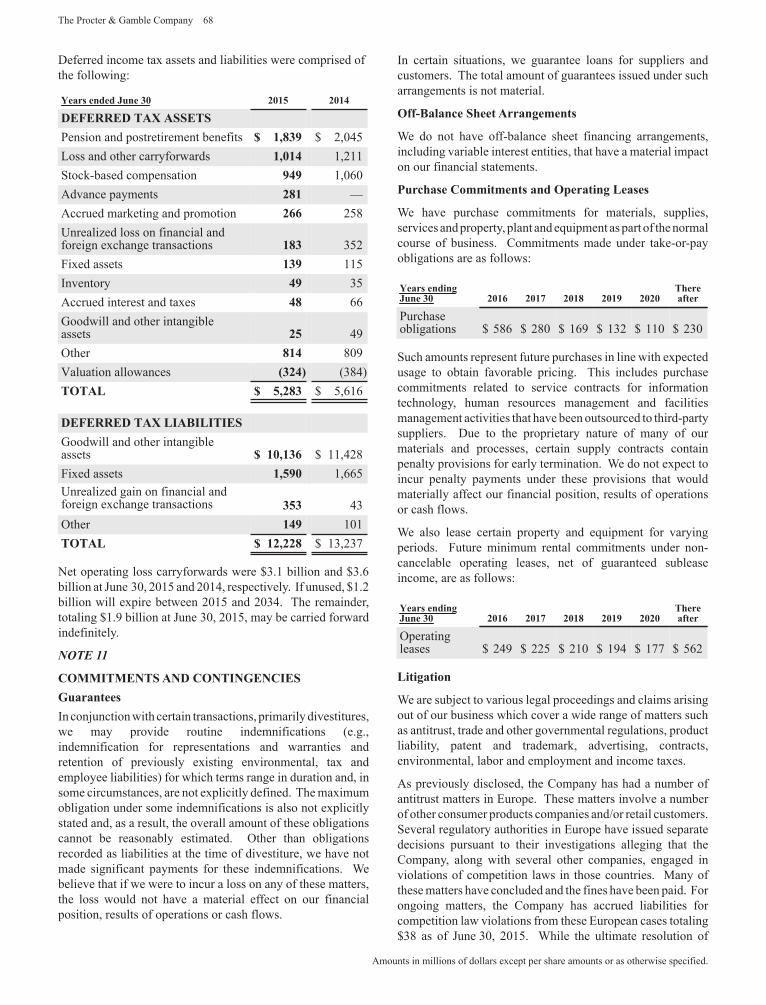
The Procter & Gamble Company 68
Amounts in millions of dollars except per share amounts or as otherwise specified.
Deferred income tax assets and liabilities were comprised ofthe following:
Years ended une 0 2015 2014
DEFERRED TAX ASSETSPension and postretirement benefits 1, 9 $ 2,045Loss and other carryforwards 1,014 1,211Stock-based compensation 949 1,060Advance payments 2 1Accrued marketing and promotion 2 258Unrealized loss on financial andforeign exchange transactions 1 352Fixed assets 1 9 115Inventory 49 35Accrued interest and taxes 4 66Goodwill and other intangibleassets 25 49Other 14 809
aluation allowances 24 (384)TOTAL 5,2 $ 5,616
DEFERRED TAX LIABILITIESGoodwill and other intangibleassets 10,1 $ 11,428Fixed assets 1,590 1,665Unrealized gain on financial andforeign exchange transactions 5 43Other 149 101TOTAL 12,22 $ 13,237
Net operating loss carryforwards were $3.1 billion and $3.6billion at June 30, 2015 and 2014, respectively. If unused, $1.2billion will expire between 2015 and 2034. The remainder,totaling $1.9 billion at June 30, 2015, may be carried forwardindefinitely.
COMMITMENTS AND CONTINGENCIESGuaranteesIn conjunction with certain transactions, primarily divestitures,we may provide routine indemnifications (e.g.,indemnification for representations and warranties andretention of previously existing environmental, tax andemployee liabilities) for which terms range in duration and, insome circumstances, are not explicitly defined. The maximumobligation under some indemnifications is also not explicitlystated and, as a result, the overall amount of these obligationscannot be reasonably estimated. Other than obligationsrecorded as liabilities at the time of divestiture, we have notmade significant payments for these indemnifications. ebelieve that if we were to incur a loss on any of these matters,the loss would not have a material effect on our financialposition, results of operations or cash flows.
In certain situations, we guarantee loans for suppliers andcustomers. The total amount of guarantees issued under sucharrangements is not material.
Off-Balance Sheet Arrangements
e do not have off-balance sheet financing arrangements,including variable interest entities, that have a material impacton our financial statements.
Purchase Commitments and O erating Leases
e have purchase commitments for materials, supplies,services and property, plant and equipment as part of the normalcourse of business. Commitments made under take-or-payobligations are as follows:
Years endingune 0 201 201 201 2019 2020
Thereafter
Purchaseobligations $ 586 $ 280 $ 169 $ 132 $ 110 $ 230
Such amounts represent future purchases in line with expectedusage to obtain favorable pricing. This includes purchasecommitments related to service contracts for informationtechnology, human resources management and facilitiesmanagement activities that have been outsourced to third-partysuppliers. Due to the proprietary nature of many of ourmaterials and processes, certain supply contracts containpenalty provisions for early termination. e do not expect toincur penalty payments under these provisions that wouldmaterially affect our financial position, results of operationsor cash flows.
e also lease certain property and equipment for varyingperiods. Future minimum rental commitments under non-cancelable operating leases, net of guaranteed subleaseincome, are as follows:
Years endingune 0 201 201 201 2019 2020
Thereafter
Operatingleases $ 249 $ 225 $ 210 $ 194 $ 177 $ 562
Litigation
e are subject to various legal proceedings and claims arisingout of our business which cover a wide range of matters suchas antitrust, trade and other governmental regulations, productliability, patent and trademark, advertising, contracts,environmental, labor and employment and income taxes.
As previously disclosed, the Company has had a number ofantitrust matters in Europe. These matters involve a numberof other consumer products companies and or retail customers.Several regulatory authorities in Europe have issued separatedecisions pursuant to their investigations alleging that theCompany, along with several other companies, engaged inviolations of competition laws in those countries. Many ofthese matters have concluded and the fines have been paid. Forongoing matters, the Company has accrued liabilities forcompetition law violations from these European cases totaling$38 as of June 30, 2015. hile the ultimate resolution of
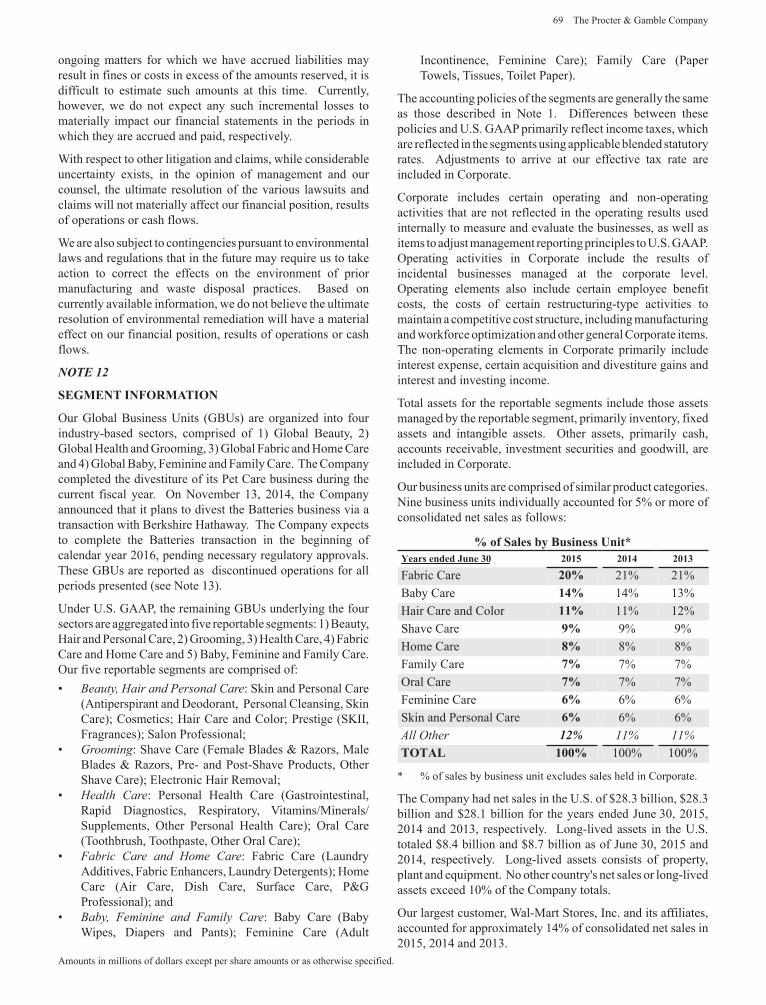
69 The Procter & Gamble Company
Amounts in millions of dollars except per share amounts or as otherwise specified.
ongoing matters for which we have accrued liabilities mayresult in fines or costs in excess of the amounts reserved, it isdifficult to estimate such amounts at this time. Currently,however, we do not expect any such incremental losses tomaterially impact our financial statements in the periods inwhich they are accrued and paid, respectively.
ith respect to other litigation and claims, while considerableuncertainty exists, in the opinion of management and ourcounsel, the ultimate resolution of the various lawsuits andclaims will not materially affect our financial position, resultsof operations or cash flows.
e are also subject to contingencies pursuant to environmentallaws and regulations that in the future may require us to takeaction to correct the effects on the environment of priormanufacturing and waste disposal practices. ased oncurrently available information, we do not believe the ultimateresolution of environmental remediation will have a materialeffect on our financial position, results of operations or cashflows.
SEGMENT INFORMATION
Our Global usiness Units (G Us) are organized into fourindustry-based sectors, comprised of 1) Global eauty, 2)Global Health and Grooming, 3) Global Fabric and Home Careand 4) Global aby, Feminine and Family Care. The Companycompleted the divestiture of its Pet Care business during thecurrent fiscal year. On November 13, 2014, the Companyannounced that it plans to divest the atteries business via atransaction with erkshire Hathaway. The Company expectsto complete the atteries transaction in the beginning ofcalendar year 2016, pending necessary regulatory approvals.These G Us are reported as discontinued operations for allperiods presented (see Note 13).
Under U.S. GAAP, the remaining G Us underlying the foursectors are aggregated into five reportable segments: 1) eauty,Hair and Personal Care, 2) Grooming, 3) Health Care, 4) FabricCare and Home Care and 5) aby, Feminine and Family Care.Our five reportable segments are comprised of:
ea ty air a d erso al are: Skin and Personal Care(Antiperspirant and Deodorant, Personal Cleansing, SkinCare) Cosmetics Hair Care and Color Prestige (SKII,Fragrances) Salon Professionalroomi : Shave Care (Female lades & Razors, Malelades & Razors, Pre- and Post-Shave Products, Other
Shave Care) Electronic Hair Removalealth are: Personal Health Care (Gastrointestinal,
Rapid Diagnostics, Respiratory, itamins MineralsSupplements, Other Personal Health Care) Oral Care(Toothbrush, Toothpaste, Other Oral Care)Fa ric are a d ome are: Fabric Care (LaundryAdditives, Fabric Enhancers, Laundry Detergents) HomeCare (Air Care, Dish Care, Surface Care, P&GProfessional) anda y Femi i e a d Family are: aby Care ( abyipes, Diapers and Pants) Feminine Care (Adult
Incontinence, Feminine Care) Family Care (PaperTowels, Tissues, Toilet Paper).
The accounting policies of the segments are generally the sameas those described in Note 1. Differences between thesepolicies and U.S. GAAP primarily reflect income taxes, whichare reflected in the segments using applicable blended statutoryrates. Adjustments to arrive at our effective tax rate areincluded in Corporate.
Corporate includes certain operating and non-operatingactivities that are not reflected in the operating results usedinternally to measure and evaluate the businesses, as well asitems to adjust management reporting principles to U.S. GAAP.Operating activities in Corporate include the results ofincidental businesses managed at the corporate level.Operating elements also include certain employee benefitcosts, the costs of certain restructuring-type activities tomaintain a competitive cost structure, including manufacturingand workforce optimization and other general Corporate items.The non-operating elements in Corporate primarily includeinterest expense, certain acquisition and divestiture gains andinterest and investing income.
Total assets for the reportable segments include those assetsmanaged by the reportable segment, primarily inventory, fixedassets and intangible assets. Other assets, primarily cash,accounts receivable, investment securities and goodwill, areincluded in Corporate.
Our business units are comprised of similar product categories.Nine business units individually accounted for 5 or more ofconsolidated net sales as follows:
of Sales Business UnitYears ended une 0 2015 2014 201
Fabric Care 20 21 21aby Care 14 14 13
Hair Care and Color 11 11 12Shave Care 9 9 9Home Care 8 8Family Care 7 7Oral Care 7 7Feminine Care 6 6Skin and Personal Care 6 6ll ther 11 11
TOTAL 100 100 100
of sales by business unit excludes sales held in Corporate.
The Company had net sales in the U.S. of $28.3 billion, $28.3billion and $28.1 billion for the years ended June 30, 2015,2014 and 2013, respectively. Long-lived assets in the U.S.totaled $8.4 billion and $8.7 billion as of June 30, 2015 and2014, respectively. Long-lived assets consists of property,plant and equipment. No other country's net sales or long-livedassets exceed 10 of the Company totals.
Our largest customer, al-Mart Stores, Inc. and its affiliates,accounted for approximately 14 of consolidated net sales in2015, 2014 and 2013.
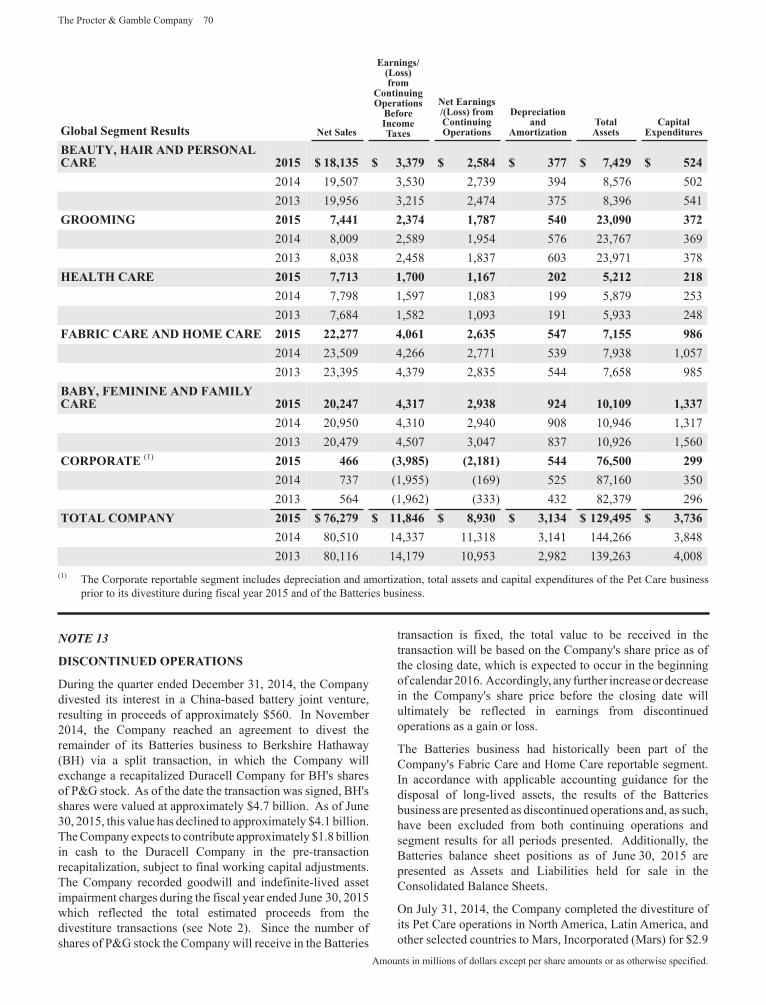
The Procter & Gamble Company 70
Amounts in millions of dollars except per share amounts or as otherwise specified.
Glo al Segment Results Net Sales
EarningsLossfrom
ContinuingO erations
BeforeIncomeTaxes
Net EarningsLoss from
ContinuingO erations
De reciationand
Amorti ationTotalAssets
Ca italEx enditures
BEAUTY, HAIR AND PERSONALCARE 2015 1 ,1 5 , 9 2,5 4 ,429 524
2014 19,507 3,530 2,739 394 8,576 5022013 19,956 3,215 2,474 375 8,396 541
GROOMING 2015 ,441 2, 4 1, 540 2 ,090 22014 8,009 2,589 1,954 576 23,767 3692013 8,038 2,458 1,837 603 23,971 378
HEALTH CARE 2015 , 1 1, 00 1,1 202 5,212 212014 7,798 1,597 1,083 199 5,879 2532013 7,684 1,582 1,093 191 5,933 248
FABRIC CARE AND HOME CARE 2015 22,2 4,0 1 2, 5 54 ,155 92014 23,509 4,266 2,771 539 7,938 1,0572013 23,395 4,379 2,835 544 7,658 985
BABY, FEMININE AND FAMILYCARE 2015 20,24 4, 1 2,9 924 10,109 1,
2014 20,950 4,310 2,940 908 10,946 1,3172013 20,479 4,507 3,047 837 10,926 1,560
CORPORATE (1) 2015 4 ,9 5 2,1 1 544 ,500 2992014 737 (1,955) (169) 525 87,160 3502013 564 (1,962) (333) 432 82,379 296
TOTAL COMPANY 2015 ,2 9 11, 4 ,9 0 ,1 4 129,495 ,2014 80,510 14,337 11,318 3,141 144,266 3,8482013 80,116 14,179 10,953 2,982 139,263 4,008
(1) The Corporate reportable segment includes depreciation and amortization, total assets and capital expenditures of the Pet Care businessprior to its divestiture during fiscal year 2015 and of the atteries business.
DISCONTINUED OPERATIONS
During the quarter ended December 31, 2014, the Companydivested its interest in a China-based battery joint venture,resulting in proceeds of approximately $560. In November2014, the Company reached an agreement to divest theremainder of its atteries business to erkshire Hathaway( H) via a split transaction, in which the Company willexchange a recapitalized Duracell Company for H's sharesof P&G stock. As of the date the transaction was signed, H'sshares were valued at approximately $4.7 billion. As of June30, 2015, this value has declined to approximately $4.1 billion.The Company expects to contribute approximately $1.8 billionin cash to the Duracell Company in the pre-transactionrecapitalization, subject to final working capital adjustments.The Company recorded goodwill and indefinite-lived assetimpairment charges during the fiscal year ended June 30, 2015which reflected the total estimated proceeds from thedivestiture transactions (see Note 2). Since the number ofshares of P&G stock the Company will receive in the atteries
transaction is fixed, the total value to be received in thetransaction will be based on the Company's share price as ofthe closing date, which is expected to occur in the beginningof calendar 2016. Accordingly, any further increase or decreasein the Company's share price before the closing date willultimately be reflected in earnings from discontinuedoperations as a gain or loss.
The atteries business had historically been part of theCompany's Fabric Care and Home Care reportable segment.In accordance with applicable accounting guidance for thedisposal of long-lived assets, the results of the atteriesbusiness are presented as discontinued operations and, as such,have been excluded from both continuing operations andsegment results for all periods presented. Additionally, the
atteries balance sheet positions as of June 30, 2015 arepresented as Assets and Liabilities held for sale in theConsolidated alance Sheets.
On July 31, 2014, the Company completed the divestiture ofits Pet Care operations in North America, Latin America, andother selected countries to Mars, Incorporated (Mars) for $2.9
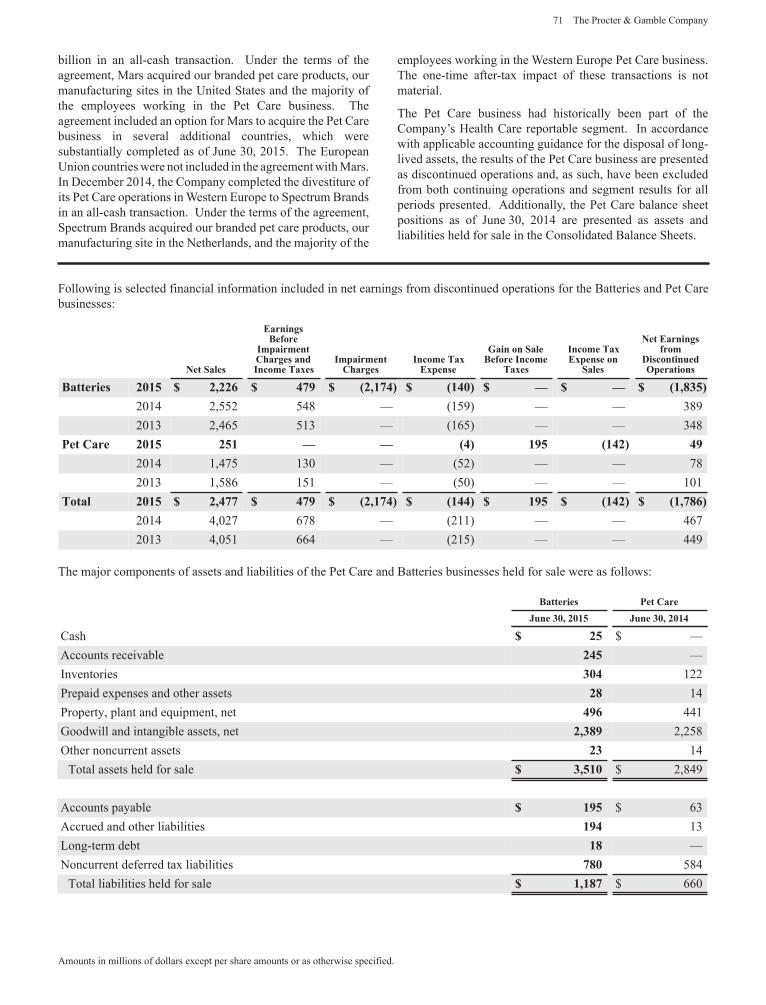
71 The Procter & Gamble Company
Amounts in millions of dollars except per share amounts or as otherwise specified.
billion in an all-cash transaction. Under the terms of theagreement, Mars acquired our branded pet care products, ourmanufacturing sites in the United States and the majority ofthe employees working in the Pet Care business. Theagreement included an option for Mars to acquire the Pet Carebusiness in several additional countries, which weresubstantially completed as of June 30, 2015. The EuropeanUnion countries were not included in the agreement with Mars.In December 2014, the Company completed the divestiture ofits Pet Care operations in estern Europe to Spectrum randsin an all-cash transaction. Under the terms of the agreement,Spectrum rands acquired our branded pet care products, ourmanufacturing site in the Netherlands, and the majority of the
employees working in the estern Europe Pet Care business.The one-time after-tax impact of these transactions is notmaterial.
The Pet Care business had historically been part of theCompany s Health Care reportable segment. In accordancewith applicable accounting guidance for the disposal of long-lived assets, the results of the Pet Care business are presentedas discontinued operations and, as such, have been excludedfrom both continuing operations and segment results for allperiods presented. Additionally, the Pet Care balance sheetpositions as of June 30, 2014 are presented as assets andliabilities held for sale in the Consolidated alance Sheets.
Following is selected financial information included in net earnings from discontinued operations for the atteries and Pet Carebusinesses:
Net Sales
EarningsBefore
Im airmentCharges andIncome Taxes
Im airmentCharges
Income TaxEx ense
Gain on SaleBefore Income
Taxes
Income TaxEx ense on
Sales
Net Earningsfrom
DiscontinuedO erations
Batteries 2015 2,22 4 9 2,1 4 140 1, 52014 2,552 548 (159) 3892013 2,465 513 (165) 348
Pet Care 2015 251 4 195 142 492014 1,475 130 (52) 782013 1,586 151 (50) 101
Total 2015 2,4 4 9 2,1 4 144 195 142 1,2014 4,027 678 (211) 4672013 4,051 664 (215) 449
The major components of assets and liabilities of the Pet Care and atteries businesses held for sale were as follows:
Batteries Pet Careune 0, 2015 une 0, 2014
Cash 25 $Accounts receivable 245Inventories 04 122Prepaid expenses and other assets 2 14Property, plant and equipment, net 49 441Goodwill and intangible assets, net 2, 9 2,258Other noncurrent assets 2 14
Total assets held for sale ,510 $ 2,849
Accounts payable 195 $ 63Accrued and other liabilities 194 13Long-term debt 1Noncurrent deferred tax liabilities 0 584
Total liabilities held for sale 1,1 $ 660
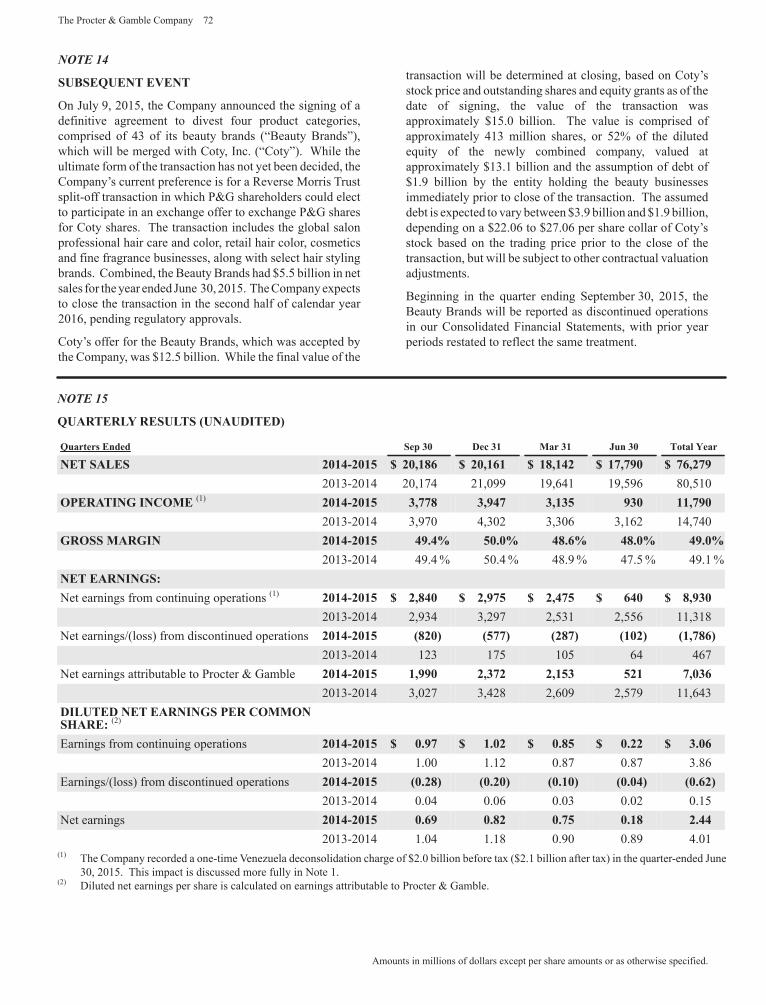
The Procter & Gamble Company 72
Amounts in millions of dollars except per share amounts or as otherwise specified.
SUBSE UENT EVENT
On July 9, 2015, the Company announced the signing of adefinitive agreement to divest four product categories,comprised of 43 of its beauty brands ( eauty rands ),which will be merged with Coty, Inc. ( Coty ). hile theultimate form of the transaction has not yet been decided, theCompany s current preference is for a Reverse Morris Trustsplit-off transaction in which P&G shareholders could electto participate in an exchange offer to exchange P&G sharesfor Coty shares. The transaction includes the global salonprofessional hair care and color, retail hair color, cosmeticsand fine fragrance businesses, along with select hair stylingbrands. Combined, the eauty rands had $5.5 billion in netsales for the year ended June 30, 2015. The Company expectsto close the transaction in the second half of calendar year2016, pending regulatory approvals.
Coty s offer for the eauty rands, which was accepted bythe Company, was $12.5 billion. hile the final value of the
transaction will be determined at closing, based on Coty sstock price and outstanding shares and equity grants as of thedate of signing, the value of the transaction wasapproximately $15.0 billion. The value is comprised ofapproximately 413 million shares, or 52 of the dilutedequity of the newly combined company, valued atapproximately $13.1 billion and the assumption of debt of$1.9 billion by the entity holding the beauty businessesimmediately prior to close of the transaction. The assumeddebt is expected to vary between $3.9 billion and $1.9 billion,depending on a $22.06 to $27.06 per share collar of Coty sstock based on the trading price prior to the close of thetransaction, but will be subject to other contractual valuationadjustments.
eginning in the quarter ending September 30, 2015, theeauty rands will be reported as discontinued operations
in our Consolidated Financial Statements, with prior yearperiods restated to reflect the same treatment.
UARTERLY RESULTS UNAUDITED
uarters Ended Se 0 Dec 1 Mar 1 un 0 Total Year
NET SALES 2014-2015 20,1 20,1 1 1 ,142 1 , 90 ,2 92013-2014 20,174 21,099 19,641 19,596 80,510
OPERATING INCOME (1) 2014-2015 , ,94 ,1 5 9 0 11, 902013-2014 3,970 4,302 3,306 3,162 14,740
GROSS MARGIN 2014-2015 49.4 50.0 4 . 4 .0 49.02013-2014 49.4 50.4 48.9 47.5 49.1
NET EARNINGSNet earnings from continuing operations (1) 2014-2015 2, 40 2,9 5 2,4 5 40 ,9 0
2013-2014 2,934 3,297 2,531 2,556 11,318Net earnings (loss) from discontinued operations 2014-2015 20 5 2 102 1,
2013-2014 123 175 105 64 467Net earnings attributable to Procter & Gamble 2014-2015 1,990 2, 2 2,15 521 ,0
2013-2014 3,027 3,428 2,609 2,579 11,643DILUTED NET EARNINGS PER COMMONSHARE (2)
Earnings from continuing operations 2014-2015 0.9 1.02 0. 5 0.22 .02013-2014 1.00 1.12 0.87 0.87 3.86
Earnings (loss) from discontinued operations 2014-2015 0.2 0.20 0.10 0.04 0. 22013-2014 0.04 0.06 0.03 0.02 0.15
Net earnings 2014-2015 0. 9 0. 2 0. 5 0.1 2.442013-2014 1.04 1.18 0.90 0.89 4.01
(1) The Company recorded a one-time enezuela deconsolidation charge of $2.0 billion before tax ($2.1 billion after tax) in the quarter-ended June30, 2015. This impact is discussed more fully in Note 1.
(2) Diluted net earnings per share is calculated on earnings attributable to Procter & Gamble.
73 The Procter & Gamble Company
Item 9. Changes in and Disagreements with Accountants onAccounting and Financial Disclosure.
Not applicable.
Item 9A. Controls and Procedures.
E aluation of Disclosure Controls and Procedures.
The Company's President and Chief Executive Officer, A. G.Lafley, and the Company's Chief Financial Officer, Jon R.Moeller, performed an evaluation of the Company's disclosurecontrols and procedures (as defined in Rules 13a-15(e) and15d-15(e) of the Securities Exchange Act of 1934 (ExchangeAct)) as of the end of the period covered by this Annual Reporton Form 10-K.
Messrs. Lafley and Moeller have concluded that theCompany's disclosure controls and procedures were effectiveto ensure that information required to be disclosed in reports
we file or submit under the Exchange Act is (1) recorded,processed, summarized and reported within the time periodsspecified in Securities and Exchange Commission rules andforms, and (2) accumulated and communicated to ourmanagement, including Messrs. Lafley and Moeller, to allowtheir timely decisions regarding required disclosure.
Changes in Internal Control o er Financial Re orting.
There were no changes in our internal control over financialreporting that occurred during the Company's fourth fiscalquarter that have materially affected, or are reasonably likelyto materially affect, the Company's internal control overfinancial reporting.
Item 9 . Other Information.
Not applicable.
PART III
Item 10. Directors, Executive Officers and CorporateGovernance.
The oard of Directors has determined that the followingmembers of the Audit Committee are independent and areAudit Committee financial experts as defined by SEC rules:Ms. Patricia A. oertz (Chair) and Mr. Kenneth I. Chenault.
The information required by this item is incorporated byreference to the following sections of the 2015 Proxy Statementfiled pursuant to Regulation 14A: the section entitled Electionof Directors the section entitled Corporate Governance, up tobut not including the subsection entitled oard Engagementand Attendance the subsections of the Corporate Governancesection entitled Code of Ethics and entitled ShareholderRecommendations of oard Nomineesand Committee Processfor Recommending oard Nominees and the section entitledSection 16(a) eneficial Ownership Reporting Compliance.Pursuant to Instruction 3 of Item 401(b) of Regulation S-K,Executive Officers of the Registrant are reported in Part I ofthis report.
Item 11. Executive Compensation.
The information required by this item is incorporated byreference to the following sections of the 2015 Proxy Statement
filed pursuant to Regulation 14A: the subsections of theCorporate Governance section entitled Committees of the
oard and entitled Compensation Committee Interlocks andInsider Participation and the portion beginning with thesection entitled Director Compensation up to but not includingthe section entitled Security Ownership of Management andCertain eneficial Owners.
Item 12. Security Ownership of Certain eneficial Ownersand Management and Related Stockholder Matters.
The following table gives information about the Company'scommon stock that may be issued upon the exercise of options,warrants and rights under all of the Company's equitycompensation plans as of June 30, 2015. The table includesthe following plans: The Procter & Gamble 1992 Stock PlanThe Procter & Gamble 1993 Non-Employee Directors' StockPlan The Procter & Gamble Future Shares Plan TheProcter & Gamble 2001 Stock and Incentive CompensationPlan The Procter & Gamble 2003 Non-Employee Directors'Stock Plan The Gillette Company 2004 Long-Term IncentivePlan The Procter & Gamble 2009 Stock and IncentiveCompensation Plan The Procter & Gamble 2013 Non-Employee Directors' Stock Plan and The Procter & Gamble2014 Stock and Incentive Compensation Plan.
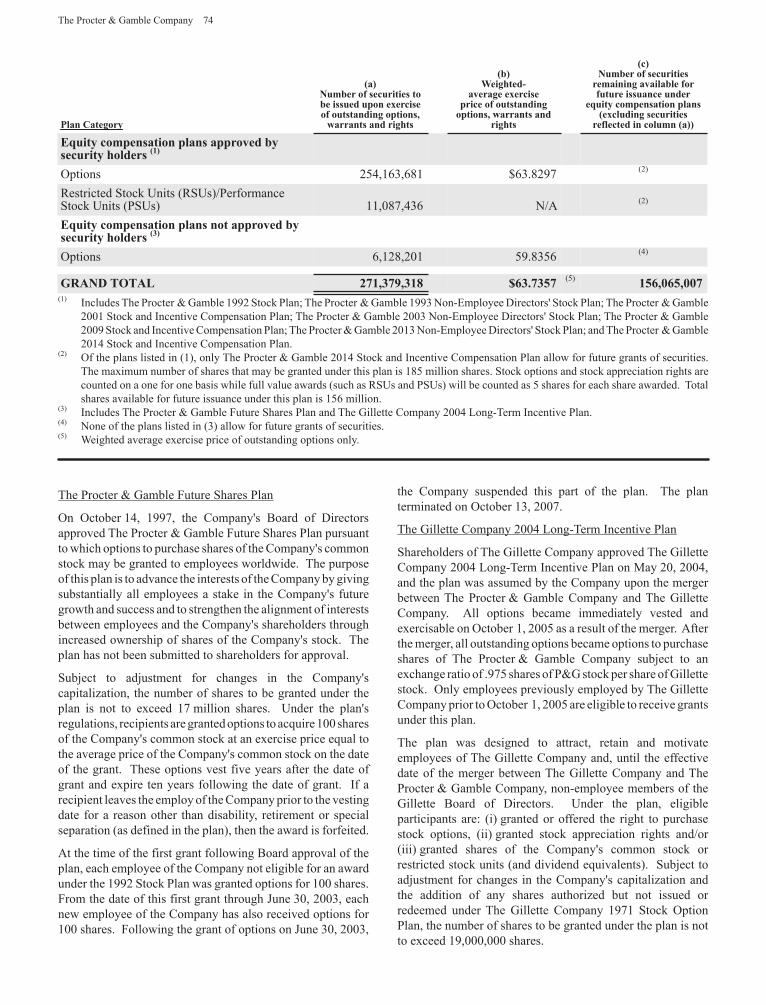
The Procter & Gamble Company 74
Plan Categor
aNum er of securities to
e issued u on exerciseof outstanding o tions,
warrants and rights
Weighted-a erage exercise
rice of outstandingo tions, warrants and
rights
cNum er of securities
remaining a aila le forfuture issuance under
e uit com ensation lansexcluding securities
reflected in column a
E uit com ensation lans a ro edsecurit holders 1
Options 254,163,681 $63.8297 (2)
Restricted Stock Units (RSUs) PerformanceStock Units (PSUs) 11,087,436 N A (2)
E uit com ensation lans not a ro ed securit holdersOptions 6,128,201 59.8356 (4)
GRAND TOTAL 2 1, 9, 1 . 5 (5) 15 ,0 5,00(1) Includes The Procter & Gamble 1992 Stock Plan The Procter & Gamble 1993 Non-Employee Directors' Stock Plan The Procter & Gamble
2001 Stock and Incentive Compensation Plan The Procter & Gamble 2003 Non-Employee Directors' Stock Plan The Procter & Gamble2009 Stock and Incentive Compensation Plan The Procter & Gamble 2013 Non-Employee Directors' Stock Plan and The Procter & Gamble2014 Stock and Incentive Compensation Plan.
(2) Of the plans listed in (1), only The Procter & Gamble 2014 Stock and Incentive Compensation Plan allow for future grants of securities.The maximum number of shares that may be granted under this plan is 185 million shares. Stock options and stock appreciation rights arecounted on a one for one basis while full value awards (such as RSUs and PSUs) will be counted as 5 shares for each share awarded. Totalshares available for future issuance under this plan is 156 million.
(3) Includes The Procter & Gamble Future Shares Plan and The Gillette Company 2004 Long-Term Incentive Plan.(4) None of the plans listed in (3) allow for future grants of securities.(5) eighted average exercise price of outstanding options only.
The Procter & Gamble Future Shares Plan
On October 14, 1997, the Company's oard of Directorsapproved The Procter & Gamble Future Shares Plan pursuantto which options to purchase shares of the Company's commonstock may be granted to employees worldwide. The purposeof this plan is to advance the interests of the Company by givingsubstantially all employees a stake in the Company's futuregrowth and success and to strengthen the alignment of interestsbetween employees and the Company's shareholders throughincreased ownership of shares of the Company's stock. Theplan has not been submitted to shareholders for approval.
Subject to adjustment for changes in the Company'scapitalization, the number of shares to be granted under theplan is not to exceed 17 million shares. Under the plan'sregulations, recipients are granted options to acquire 100 sharesof the Company's common stock at an exercise price equal tothe average price of the Company's common stock on the dateof the grant. These options vest five years after the date ofgrant and expire ten years following the date of grant. If arecipient leaves the employ of the Company prior to the vestingdate for a reason other than disability, retirement or specialseparation (as defined in the plan), then the award is forfeited.
At the time of the first grant following oard approval of theplan, each employee of the Company not eligible for an awardunder the 1992 Stock Plan was granted options for 100 shares.From the date of this first grant through June 30, 2003, eachnew employee of the Company has also received options for100 shares. Following the grant of options on June 30, 2003,
the Company suspended this part of the plan. The planterminated on October 13, 2007.
The Gillette Company 2004 Long-Term Incentive Plan
Shareholders of The Gillette Company approved The GilletteCompany 2004 Long-Term Incentive Plan on May 20, 2004,and the plan was assumed by the Company upon the mergerbetween The Procter & Gamble Company and The GilletteCompany. All options became immediately vested andexercisable on October 1, 2005 as a result of the merger. Afterthe merger, all outstanding options became options to purchaseshares of The Procter & Gamble Company subject to anexchange ratio of .975 shares of P&G stock per share of Gillettestock. Only employees previously employed by The GilletteCompany prior to October 1, 2005 are eligible to receive grantsunder this plan.
The plan was designed to attract, retain and motivateemployees of The Gillette Company and, until the effectivedate of the merger between The Gillette Company and TheProcter & Gamble Company, non-employee members of theGillette oard of Directors. Under the plan, eligibleparticipants are: (i) granted or offered the right to purchasestock options, (ii) granted stock appreciation rights and or(iii) granted shares of the Company's common stock orrestricted stock units (and dividend equivalents). Subject toadjustment for changes in the Company's capitalization andthe addition of any shares authorized but not issued orredeemed under The Gillette Company 1971 Stock OptionPlan, the number of shares to be granted under the plan is notto exceed 19,000,000 shares.
75 The Procter & Gamble Company
Except in the case of death of the recipient, all stock optionsand stock appreciation rights must expire no later than ten yearsfrom the date of grant. The exercise price for all stock optionsgranted under the plan must be equal to or greater than the fairmarket value of the Company's stock on the date of grant. Anycommon stock awarded under the plan may be subject torestrictions on sale or transfer while the recipient is employed,as the committee administering the plan may determine.
If a recipient of a grant leaves the Company while holding anunexercised option or right: (1) any unexercisable portionsimmediately become void, except in the case of death,retirement, special separation (as those terms are defined in theplan) or any grants as to which the Compensation Committeeof the oard of Directors has waived the terminationprovisions and (2) any exercisable portions immediatelybecome void, except in the case of death, retirement, specialseparation, voluntary resignation that is not for Good Reason(as those terms are defined in the plan) or any grants as to whichthe Compensation Committee of the oard of Directors haswaived the termination provisions.
Additional information required by this item is incorporatedby reference to the 2015 Proxy Statement filed pursuant to
Regulation 14A, beginning with the section entitled SecurityOwnership of Management and Certain eneficial Owners andup to but not including the section entitled Section 16(a)
eneficial Ownership Reporting Compliance.
Item 13. Certain Relationships and Related Transactions andDirector Independence.
The information required by this item is incorporated byreference to the following sections of the 2015 Proxy Statementfiled pursuant to Regulation 14A: the sections entitled DirectorIndependence and Review and Approval of Transactions withRelated Persons.
Item 14. Principal Accountant Fees and Services.
The information required by this item is incorporated byreference to the 2015 Proxy Statement filed pursuant toRegulation 14A, beginning with the section entitled Report ofthe Audit Committee and ending with the section entitledServices Provided by Deloitte.
PART I
Item 15. Exhibits and Financial Statement Schedules.
1. Financial Statements:
The following Consolidated Financial Statements of TheProcter & Gamble Company and subsidiaries, management'sreport and the reports of the independent registered publicaccounting firm are incorporated by reference in Part II, Item 8of this Form 10-K.
Management's Report on Internal Control over FinancialReportingReport of Independent Registered PublicAccounting Firmon Internal Control over Financial ReportingReport of Independent Registered PublicAccounting Firmon Consolidated Financial StatementsConsolidated Statements of Earnings - for years endedJune 30, 2015, 2014 and 2013
Consolidated Statements of Other ComprehensiveIncome - for years ended June 30, 2015, 2014 and 2013Consolidated alance Sheets - as of June 30, 2015 and2014Consolidated Statements of Shareholders' Equity - foryears ended June 30, 2015, 2014 and 2013Consolidated Statements of Cash Flows - for years endedJune 30, 2015, 2014 and 2013Notes to Consolidated Financial Statements
2. Financial Statement Schedules:
These schedules are omitted because of the absence of theconditions under which they are required or because theinformation is set forth in the Consolidated FinancialStatements or Notes thereto.
The Procter & Gamble Company 76
EXHI ITS
Exhibit (2-1) - Transaction Agreement dated as of July 8, 2015 among The Procter & Gamble Company, Coty Inc., Galleria Co. andGreen Acquisition Sub Inc.
Exhibit (3-1) - Amended Articles of Incorporation (as amended by shareholders at the annual meeting on October 11, 2011)(Incorporated by reference to Exhibit (3-1) of the Company's Form 10- for the quarter ended September 30, 2011).
(3-2) - Regulations (as approved by the oard of Directors on October 14, 2014, pursuant to authority granted by shareholdersat the annual meeting on October 13, 2009) (Incorporated by reference to Exhibit (3-2) of the Company's Form 10-for the quarter ended September 30, 2014).
Exhibit (4-1) - Indenture, dated as of September 3, 2009, between the Company and Deutsche ank Trust Company Americas, asTrustee.
(4-2) - Indenture, dated as of September 3, 2009, among Procter & Gamble International Funding SCA,the Company and Deutsche ank Trust Company Americas, as Trustee.
Exhibit (10-1) - The Procter & Gamble 2001 Stock and Incentive Compensation Plan (as amended on August 17, 2007), which wasoriginally adopted by shareholders at the annual meeting on October 9, 2001 (Incorporated by reference to Exhibit(10-1) of the Company's Form 10- for the quarter ended March 31, 2013), and related correspondence and terms andconditions (Incorporated by reference to Exhibit (10-1) of the Company's Form 10- for the quarter ended December31, 2013).
(10-2) - The Procter & Gamble 1992 Stock Plan (as amended December 11, 2001), which was originally adopted by theshareholders at the annual meeting on October 12, 1992 (Incorporated by reference to Exhibit (10-2) of the Company'sAnnual Report on Form 10-K for the year ended June 30, 2013).
(10-3) - The Procter & Gamble Executive Group Life Insurance Policy (Incorporated by reference to Exhibit (10-3) of theCompany's Annual Report on Form 10-K for the year ended June 30, 2013).
(10-4) - The Procter & Gamble Deferred Compensation Plan for Directors (as amended December 12, 2006), which wasoriginally adopted by the oard of Directors on September 9, 1980 (Incorporated by reference to Exhibit (10-4) of theCompany's Annual Report on Form 10-K for the year ended June 30, 2012).
(10-5) - The Procter & Gamble 1993 Non-Employee Directors' Stock Plan (as amended September 10, 2002), which wasoriginally adopted by the shareholders at the annual meeting on October 11, 1994 (Incorporated by reference to Exhibit(10-5) of the Company's Annual Report on Form 10-K for the year ended June 30, 2013).
(10-6) - The Procter & Gamble 1992 Stock Plan ( elgian ersion) (as amended December 11, 2001), which was originallyadopted by the oard of Directors on February 14, 1997 (Incorporated by reference to Exhibit (10-6) of the Company'sAnnual Report on Form 10-K for the year ended June 30, 2013).
(10-7) - The Procter & Gamble Future Shares Plan (as adjusted for the stock split effective May 21, 2004), which was originallyadopted by the oard of Directors on October 14, 1997.
(10-8) - The Procter & Gamble 2003 Non-Employee Directors' Stock Plan (as amended in August 2007), which was originallyadopted by the shareholders at the annual meeting on October 14, 2003, and related correspondence and terms andconditions (Incorporated by reference to Exhibit (10-1) of the Company's Form 10- for the quarter ended September30, 2012).
(10-9) - The Procter & Gamble Company Executive Deferred Compensation Plan (Incorporated by reference to Exhibit (10-4)of the Company's Form 10- for the quarter ended December 31, 2013).
(10-10) - Summary of the Company's Short Term Achievement Reward Program (Incorporated by reference to Exhibit (10-3) ofthe Company's Form 10- for the quarter ended September 30, 2014) and related correspondence and terms andconditions (Incorporated by reference to Exhibit (10-4) of the Company's Form 10- for the quarter ended December31, 2012).
(10-11) - Company's Forms of Separation Agreement & Release (Incorporated by reference to Exhibit (10-1) of the Company'sForm 10- for the quarter ended March 31, 2015).
(10-12) - Summary of personal benefits available to certain officers and non-employee directors (Incorporated by reference toExhibit (10-1) of the Company's Form 10- for the quarter ended September 30, 2013).
(10-13) - The Gillette Company 2004 Long-Term Incentive Plan (as amended on August 14, 2007) (Incorporated by referenceto Exhibit (10-4) of the Company's Form 10- for the quarter ended September 30, 2012).
(10-14) - The Gillette Company Executive Life Insurance Program (Incorporated by reference to Exhibit (10-15) of the Company'sAnnual Report on Form 10-K for the year ended June 30, 2012).
(10-15) - The Gillette Company Personal Financial Planning Reimbursement Program (Incorporated by reference to Exhibit(10-16) of the Company's Annual Report on Form 10-K for the year ended June 30, 2012) .
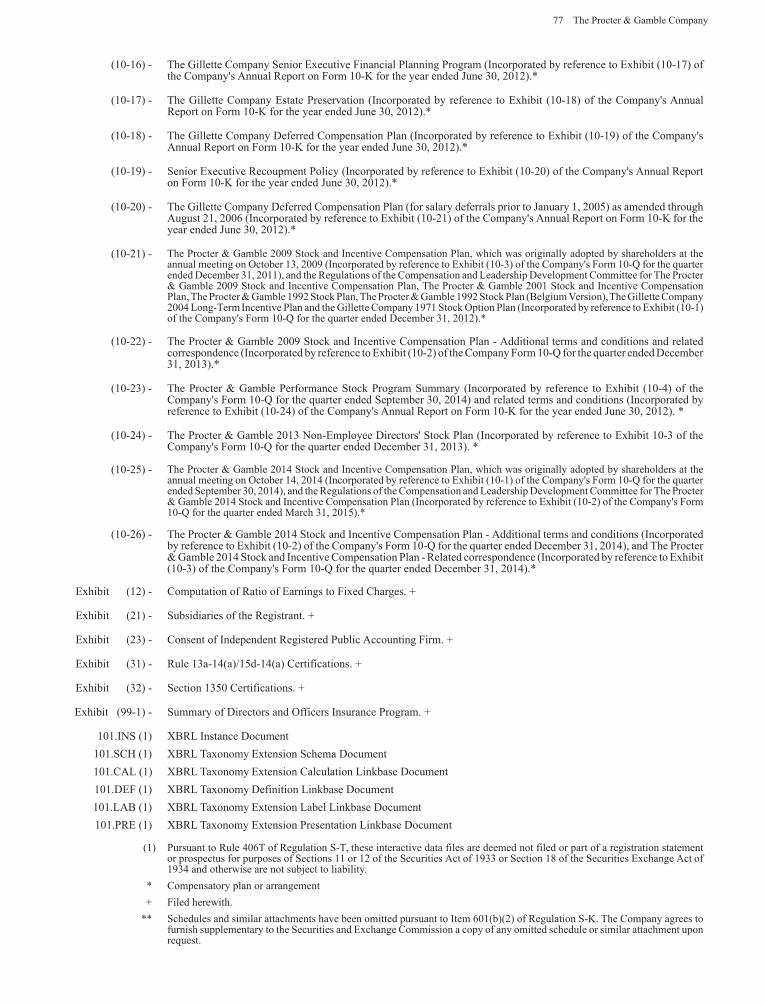
77 The Procter & Gamble Company
(10-16) - The Gillette Company Senior Executive Financial Planning Program (Incorporated by reference to Exhibit (10-17) ofthe Company's Annual Report on Form 10-K for the year ended June 30, 2012).
(10-17) - The Gillette Company Estate Preservation (Incorporated by reference to Exhibit (10-18) of the Company's AnnualReport on Form 10-K for the year ended June 30, 2012).
(10-18) - The Gillette Company Deferred Compensation Plan (Incorporated by reference to Exhibit (10-19) of the Company'sAnnual Report on Form 10-K for the year ended June 30, 2012).
(10-19) - Senior Executive Recoupment Policy (Incorporated by reference to Exhibit (10-20) of the Company's Annual Reporton Form 10-K for the year ended June 30, 2012).
(10-20) - The Gillette Company Deferred Compensation Plan (for salary deferrals prior to January 1, 2005) as amended throughAugust 21, 2006 (Incorporated by reference to Exhibit (10-21) of the Company's Annual Report on Form 10-K for theyear ended June 30, 2012).
(10-21) - The Procter & Gamble 2009 Stock and Incentive Compensation Plan, which was originally adopted by shareholders at theannual meeting on October 13, 2009 (Incorporated by reference to Exhibit (10-3) of the Company's Form 10- for the quarterended December 31, 2011), and the Regulations of the Compensation and Leadership Development Committee for The Procter& Gamble 2009 Stock and Incentive Compensation Plan, The Procter & Gamble 2001 Stock and Incentive CompensationPlan, The Procter & Gamble 1992 Stock Plan, The Procter & Gamble 1992 Stock Plan ( elgium ersion),The Gillette Company2004 Long-Term Incentive Plan and the Gillette Company 1971 Stock Option Plan (Incorporated by reference to Exhibit (10-1)of the Company's Form 10- for the quarter ended December 31, 2012).
(10-22) - The Procter & Gamble 2009 Stock and Incentive Compensation Plan - Additional terms and conditions and relatedcorrespondence (Incorporated by reference to Exhibit (10-2) of the Company Form 10- for the quarter ended December31, 2013).
(10-23) - The Procter & Gamble Performance Stock Program Summary (Incorporated by reference to Exhibit (10-4) of theCompany's Form 10- for the quarter ended September 30, 2014) and related terms and conditions (Incorporated byreference to Exhibit (10-24) of the Company's Annual Report on Form 10-K for the year ended June 30, 2012).
(10-24) - The Procter & Gamble 2013 Non-Employee Directors' Stock Plan (Incorporated by reference to Exhibit 10-3 of theCompany's Form 10- for the quarter ended December 31, 2013).
(10-25) - The Procter & Gamble 2014 Stock and Incentive Compensation Plan, which was originally adopted by shareholders at theannual meeting on October 14, 2014 (Incorporated by reference to Exhibit (10-1) of the Company's Form 10- for the quarterended September 30, 2014), and the Regulations of the Compensation and Leadership Development Committee for The Procter& Gamble 2014 Stock and Incentive Compensation Plan (Incorporated by reference to Exhibit (10-2) of the Company's Form10- for the quarter ended March 31, 2015).
(10-26) - The Procter & Gamble 2014 Stock and Incentive Compensation Plan - Additional terms and conditions (Incorporatedby reference to Exhibit (10-2) of the Company's Form 10- for the quarter ended December 31, 2014), and The Procter& Gamble 2014 Stock and Incentive Compensation Plan - Related correspondence (Incorporated by reference to Exhibit(10-3) of the Company's Form 10- for the quarter ended December 31, 2014).
Exhibit (12) - Computation of Ratio of Earnings to Fixed Charges.
Exhibit (21) - Subsidiaries of the Registrant.
Exhibit (23) - Consent of Independent Registered Public Accounting Firm.
Exhibit (31) - Rule 13a-14(a) 15d-14(a) Certifications.
Exhibit (32) - Section 1350 Certifications.
Exhibit (99-1) - Summary of Directors and Officers Insurance Program.
101.INS (1) X RL Instance Document101.SCH (1) X RL Taxonomy Extension Schema Document101.CAL (1) X RL Taxonomy Extension Calculation Linkbase Document101.DEF (1) X RL Taxonomy Definition Linkbase Document101.LA (1) X RL Taxonomy Extension Label Linkbase Document101.PRE (1) X RL Taxonomy Extension Presentation Linkbase Document
(1) Pursuant to Rule 406T of Regulation S-T, these interactive data files are deemed not filed or part of a registration statementor prospectus for purposes of Sections 11 or 12 of the Securities Act of 1933 or Section 18 of the Securities Exchange Act of1934 and otherwise are not subject to liability.Compensatory plan or arrangementFiled herewith.Schedules and similar attachments have been omitted pursuant to Item 601(b)(2) of Regulation S-K. The Company agrees tofurnish supplementary to the Securities and Exchange Commission a copy of any omitted schedule or similar attachment uponrequest.
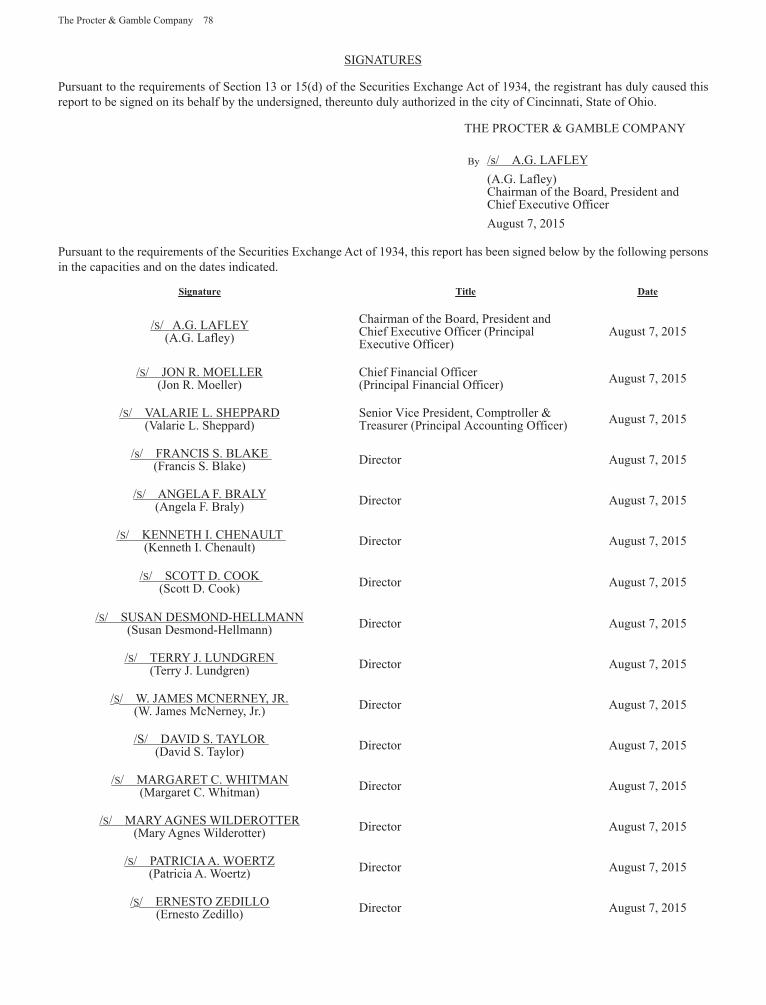
The Procter & Gamble Company 78
SIGNATURES
Pursuant to the requirements of Section 13 or 15(d) of the Securities Exchange Act of 1934, the registrant has duly caused thisreport to be signed on its behalf by the undersigned, thereunto duly authorized in the city of Cincinnati, State of Ohio.
THE PROCTER & GAM LE COMPANY
y s A.G. LAFLEY(A.G. Lafley)Chairman of the oard, President andChief Executive OfficerAugust 7, 2015
Pursuant to the requirements of the Securities Exchange Act of 1934, this report has been signed below by the following personsin the capacities and on the dates indicated.
Signature Title Date
S A.G. LAFLEY(A.G. Lafley)
Chairman of the oard, President andChief Executive Officer (PrincipalExecutive Officer)
August 7, 2015
S JON R. MOELLER(Jon R. Moeller)
Chief Financial Officer(Principal Financial Officer) August 7, 2015
S ALARIE L. SHEPPARD( alarie L. Sheppard)
Senior ice President, Comptroller &Treasurer (Principal Accounting Officer) August 7, 2015
s FRANCIS S. LAKE (Francis S. lake) Director August 7, 2015
S ANGELA F. RALY(Angela F. raly) Director August 7, 2015
S KENNETH I. CHENAULT(Kenneth I. Chenault) Director August 7, 2015
S SCOTT D. COOK(Scott D. Cook) Director August 7, 2015
S SUSAN DESMOND-HELLMANN(Susan Desmond-Hellmann) Director August 7, 2015
S TERRY J. LUNDGREN(Terry J. Lundgren) Director August 7, 2015
S . JAMES MCNERNEY, JR.( . James McNerney, Jr.) Director August 7, 2015
S DA ID S. TAYLOR(David S. Taylor) Director August 7, 2015
S MARGARET C. HITMAN(Margaret C. hitman) Director August 7, 2015
S MARY AGNES ILDEROTTER(Mary Agnes ilderotter) Director August 7, 2015
S PATRICIA A. OERT(Patricia A. oertz) Director August 7, 2015
S ERNESTO EDILLO(Ernesto edillo) Director August 7, 2015

79 The Procter & Gamble Company
EXHI IT INDEX
Exhibit (2-1) - Transaction Agreement dated as of July 8, 2015 among The Procter & Gamble Company, Coty Inc., Galleria Co. andGreen Acquisition Sub Inc.
Exhibit (3-1) - Amended Articles of Incorporation (as amended by shareholders at the annual meeting on October 11, 2011)(Incorporated by reference to Exhibit (3-1) of the Company's Form 10- for the quarter ended September 30, 2011).
(3-2) - Regulations (as approved by the oard of Directors on October 14, 2014, pursuant to authority granted by shareholdersat the annual meeting on October 13, 2009) (Incorporated by reference to Exhibit (3-2) of the Company's Form 10-for the quarter ended September 30, 2014).
Exhibit (4-1) - Indenture, dated as of September 3, 2009, between the Company and Deutsche ank Trust Company Americas, asTrustee.
(4-2) - Indenture, dated as of September 3, 2009, among Procter & Gamble International Funding SCA,the Company and Deutsche ank Trust Company Americas, as Trustee.
Exhibit (10-1) - The Procter & Gamble 2001 Stock and Incentive Compensation Plan (as amended on August 17, 2007), which wasoriginally adopted by shareholders at the annual meeting on October 9, 2001 (Incorporated by reference to Exhibit(10-1) of the Company's Form 10- for the quarter ended March 31, 2013), and related correspondence and terms andconditions (Incorporated by reference to Exhibit (10-1) of the Company's Form 10- for the quarter ended December31, 2013).
(10-2) - The Procter & Gamble 1992 Stock Plan (as amended December 11, 2001), which was originally adopted by theshareholders at the annual meeting on October 12, 1992 (Incorporated by reference to Exhibit (10-2) of the Company sAnnual Report on Form 10-K for the year ended June 30, 2013).
(10-3) - The Procter & Gamble Executive Group Life Insurance Policy (Incorporated by reference to Exhibit (10-3) of theCompany's Annual Report on Form 10-K for the year ended June 30, 2013).
(10-4) - The Procter & Gamble Deferred Compensation Plan for Directors (as amended December 12, 2006), which wasoriginally adopted by the oard of Directors on September 9, 1980 (Incorporated by reference to Exhibit (10-4) of theCompany's Annual Report on Form 10-K for the year ended June 30, 2012).
(10-5) - The Procter & Gamble 1993 Non-Employee Directors' Stock Plan (as amended September 10, 2002), which wasoriginally adopted by the shareholders at the annual meeting on October 11, 1994 (Incorporated by reference to Exhibit(10-5) of the Company's Annual Report on Form 10-K for the year ended June 30, 2013).
(10-6) - The Procter & Gamble 1992 Stock Plan ( elgian ersion) (as amended December 11, 2001), which was originallyadopted by the oard of Directors on February 14, 1997 (Incorporated by reference to Exhibit (10-6) of the Company'sAnnual Report on Form 10-K for the year ended June 30, 2013).
(10-7) - The Procter & Gamble Future Shares Plan (as adjusted for the stock split effective May 21, 2004), which was originallyadopted by the oard of Directors on October 14, 1997.
(10-8) - The Procter & Gamble 2003 Non-Employee Directors' Stock Plan (as amended in August 2007), which was originallyadopted by the shareholders at the annual meeting on October 14, 2003, and related correspondence and terms andconditions (Incorporated by reference to Exhibit (10-1) of the Company's Form 10- for the quarter ended September30, 2012).
(10-9) - The Procter & Gamble Company Executive Deferred Compensation Plan (Incorporated by reference to Exhibit (10-4)of the Company's Form 10- for the quarter ended December 31, 2013).
(10-10) - Summary of the Company's Short Term Achievement Reward Program (Incorporated by reference to Exhibit (10-3) ofthe Company's Form 10- for the quarter ended September 30, 2014) and related correspondence and terms andconditions (Incorporated by reference to Exhibit (10-4) of the Company's Form 10- for the quarter ended December31, 2012).
(10-11) - Company's Forms of Separation Agreement & Release (Incorporated by reference to Exhibit (10-1) of the Company'sForm 10- for the quarter ended March 31, 2015).
(10-12) - Summary of personal benefits available to certain officers and non-employee directors (Incorporated by reference toExhibit (10-1) of the Company's Form 10- for the quarter ended September 30, 2013).
(10-13) - The Gillette Company 2004 Long-Term Incentive Plan (as amended on August 14, 2007) (Incorporated by referenceto Exhibit (10-4) of the Company's Form 10- for the quarter ended September 30, 2012).
(10-14) - The Gillette Company Executive Life Insurance Program (Incorporated by reference to Exhibit (10-15) of the Company'sAnnual Report on Form 10-K for the year ended June 30, 2012).
(10-15) - The Gillette Company Personal Financial Planning Reimbursement Program (Incorporated by reference to Exhibit(10-16) of the Company's Annual Report on Form 10-K for the year ended June 30, 2012) .
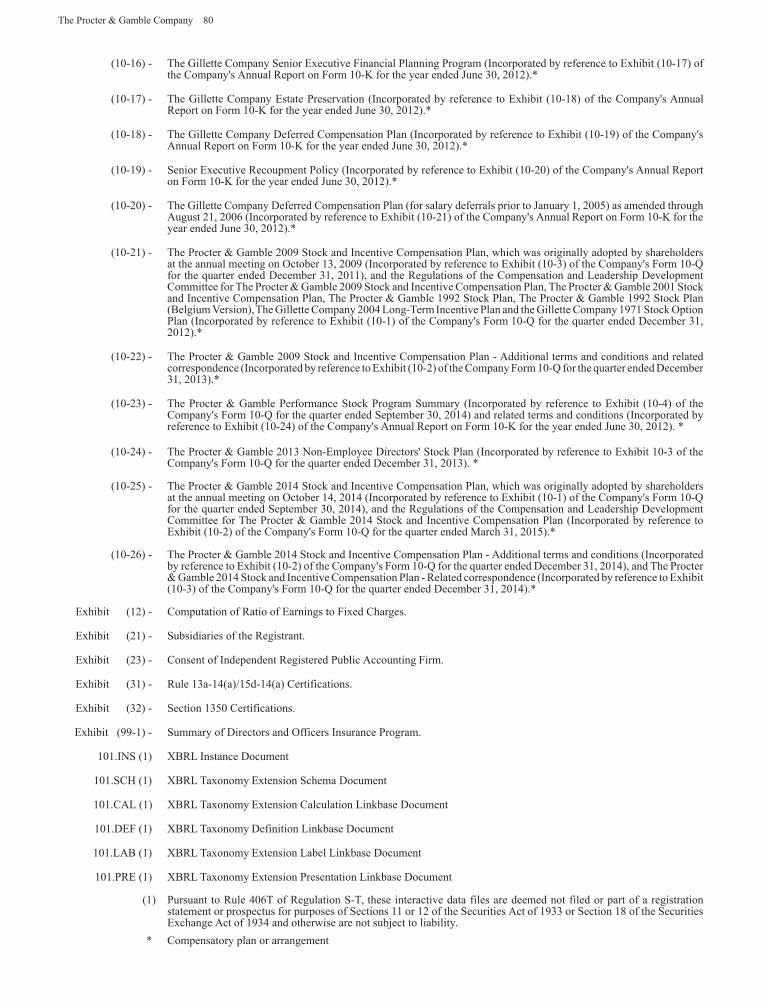
The Procter & Gamble Company 80
(10-16) - The Gillette Company Senior Executive Financial Planning Program (Incorporated by reference to Exhibit (10-17) ofthe Company's Annual Report on Form 10-K for the year ended June 30, 2012).
(10-17) - The Gillette Company Estate Preservation (Incorporated by reference to Exhibit (10-18) of the Company's AnnualReport on Form 10-K for the year ended June 30, 2012).
(10-18) - The Gillette Company Deferred Compensation Plan (Incorporated by reference to Exhibit (10-19) of the Company'sAnnual Report on Form 10-K for the year ended June 30, 2012).
(10-19) - Senior Executive Recoupment Policy (Incorporated by reference to Exhibit (10-20) of the Company's Annual Reporton Form 10-K for the year ended June 30, 2012).
(10-20) - The Gillette Company Deferred Compensation Plan (for salary deferrals prior to January 1, 2005) as amended throughAugust 21, 2006 (Incorporated by reference to Exhibit (10-21) of the Company's Annual Report on Form 10-K for theyear ended June 30, 2012).
(10-21) - The Procter & Gamble 2009 Stock and Incentive Compensation Plan, which was originally adopted by shareholdersat the annual meeting on October 13, 2009 (Incorporated by reference to Exhibit (10-3) of the Company's Form 10-for the quarter ended December 31, 2011), and the Regulations of the Compensation and Leadership DevelopmentCommittee for The Procter & Gamble 2009 Stock and Incentive Compensation Plan, The Procter & Gamble 2001 Stockand Incentive Compensation Plan, The Procter & Gamble 1992 Stock Plan, The Procter & Gamble 1992 Stock Plan( elgium ersion),The Gillette Company 2004 Long-Term Incentive Plan and the Gillette Company 1971 Stock OptionPlan (Incorporated by reference to Exhibit (10-1) of the Company's Form 10- for the quarter ended December 31,2012).
(10-22) - The Procter & Gamble 2009 Stock and Incentive Compensation Plan - Additional terms and conditions and relatedcorrespondence (Incorporated by reference to Exhibit (10-2) of the Company Form 10- for the quarter ended December31, 2013).
(10-23) - The Procter & Gamble Performance Stock Program Summary (Incorporated by reference to Exhibit (10-4) of theCompany's Form 10- for the quarter ended September 30, 2014) and related terms and conditions (Incorporated byreference to Exhibit (10-24) of the Company's Annual Report on Form 10-K for the year ended June 30, 2012).
(10-24) - The Procter & Gamble 2013 Non-Employee Directors' Stock Plan (Incorporated by reference to Exhibit 10-3 of theCompany's Form 10- for the quarter ended December 31, 2013).
(10-25) - The Procter & Gamble 2014 Stock and Incentive Compensation Plan, which was originally adopted by shareholdersat the annual meeting on October 14, 2014 (Incorporated by reference to Exhibit (10-1) of the Company's Form 10-for the quarter ended September 30, 2014), and the Regulations of the Compensation and Leadership DevelopmentCommittee for The Procter & Gamble 2014 Stock and Incentive Compensation Plan (Incorporated by reference toExhibit (10-2) of the Company's Form 10- for the quarter ended March 31, 2015).
(10-26) - The Procter & Gamble 2014 Stock and Incentive Compensation Plan - Additional terms and conditions (Incorporatedby reference to Exhibit (10-2) of the Company's Form 10- for the quarter ended December 31, 2014), and The Procter& Gamble 2014 Stock and Incentive Compensation Plan - Related correspondence (Incorporated by reference to Exhibit(10-3) of the Company's Form 10- for the quarter ended December 31, 2014).
Exhibit (12) - Computation of Ratio of Earnings to Fixed Charges.
Exhibit (21) - Subsidiaries of the Registrant.
Exhibit (23) - Consent of Independent Registered Public Accounting Firm.
Exhibit (31) - Rule 13a-14(a) 15d-14(a) Certifications.
Exhibit (32) - Section 1350 Certifications.
Exhibit (99-1) - Summary of Directors and Officers Insurance Program.
101.INS (1) X RL Instance Document
101.SCH (1) X RL Taxonomy Extension Schema Document
101.CAL (1) X RL Taxonomy Extension Calculation Linkbase Document
101.DEF (1) X RL Taxonomy Definition Linkbase Document
101.LA (1) X RL Taxonomy Extension Label Linkbase Document
101.PRE (1) X RL Taxonomy Extension Presentation Linkbase Document
(1) Pursuant to Rule 406T of Regulation S-T, these interactive data files are deemed not filed or part of a registrationstatement or prospectus for purposes of Sections 11 or 12 of the Securities Act of 1933 or Section 18 of the SecuritiesExchange Act of 1934 and otherwise are not subject to liability.Compensatory plan or arrangement
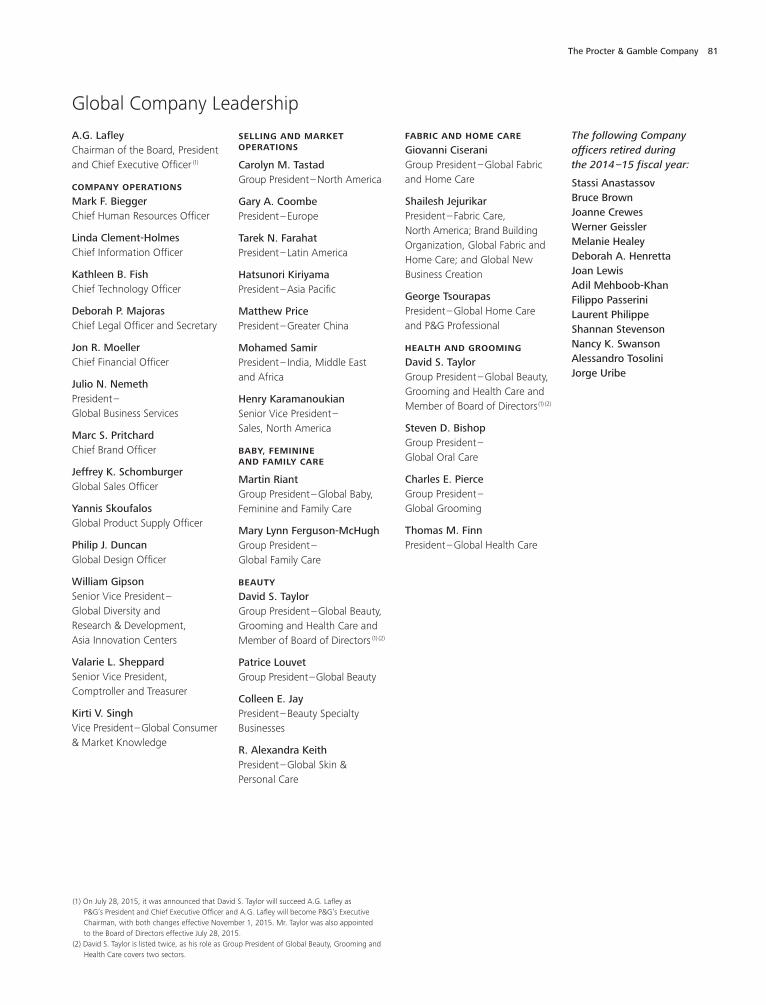
Global Company Leadership
A.G. LafleyChairman of the Board, Presidentand Chief Executive Officer (1)
COMPANY OPERATIONS
Mark F. BieggerChief Human Resources Officer
Linda Clement-HolmesChief Information Officer
Kathleen B. FishChief Technology Officer
Deborah P. MajorasChief Legal Officer and Secretary
Jon R. MoellerChief Financial Officer
Julio N. NemethPresident–Global Business Services
Marc S. PritchardChief Brand Officer
Jeffrey K. SchomburgerGlobal Sales Officer
Yannis SkoufalosGlobal Product Supply Officer
Philip J. DuncanGlobal Design Officer
William GipsonSenior Vice President–Global Diversity andResearch & Development,Asia Innovation Centers
Valarie L. SheppardSenior Vice President,Comptroller and Treasurer
Kirti V. SinghVice President–Global Consumer& Market Knowledge
SELLING AND MARKETOPERATIONS
Carolyn M. TastadGroup President–North America
Gary A. CoombePresident–Europe
Tarek N. FarahatPresident–Latin America
Hatsunori KiriyamaPresident–Asia Pacific
Matthew PricePresident–Greater China
Mohamed SamirPresident– India, Middle Eastand Africa
Henry KaramanoukianSenior Vice President–Sales, North America
BABY, FEMININEAND FAMILY CARE
Martin RiantGroup President–Global Baby,Feminine and Family Care
Mary Lynn Ferguson-McHughGroup President–Global Family Care
BEAUTY
David S. TaylorGroup President–Global Beauty,Grooming and Health Care andMember of Board of Directors (1) (2)
Patrice LouvetGroup President–Global Beauty
Colleen E. JayPresident–Beauty SpecialtyBusinesses
R. Alexandra KeithPresident–Global Skin &Personal Care
FABRIC AND HOME CARE
Giovanni CiseraniGroup President–Global Fabricand Home Care
Shailesh JejurikarPresident–Fabric Care,North America; Brand BuildingOrganization, Global Fabric andHome Care; and Global NewBusiness Creation
George TsourapasPresident–Global Home Careand P&G Professional
HEALTH AND GROOMING
David S. TaylorGroup President–Global Beauty,Grooming and Health Care andMember of Board of Directors(1) (2)
Steven D. BishopGroup President–Global Oral Care
Charles E. PierceGroup President–Global Grooming
Thomas M. FinnPresident–Global Health Care
The following Companyofficers retired duringthe 2014–15 fiscal year:
Stassi AnastassovBruce BrownJoanne CrewesWerner GeisslerMelanie HealeyDeborah A. HenrettaJoan LewisAdil Mehboob-KhanFilippo PasseriniLaurent PhilippeShannan StevensonNancy K. SwansonAlessandro TosoliniJorge Uribe
The Procter & Gamble Company 81
(1) On July 28, 2015, it was announced that David S. Taylor will succeed A.G. Lafley asP&G’s President and Chief Executive Officer and A.G. Lafley will become P&G’s ExecutiveChairman, with both changes effective November 1, 2015. Mr. Taylor was also appointedto the Board of Directors effective July 28, 2015.
(2) David S. Taylor is listed twice, as his role as Group President of Global Beauty, Grooming andHealth Care covers two sectors.
Board of Directors
Francis S. BlakeFormer Chairman of the Board and Chief Executive Officer ofThe Home Depot, Inc. (national retailer). Appointed to the Board onFebruary 10, 2015. Also a Director of Delta Airlines. Age 66.Memberof the Audit and Governance & Public Responsibility Committees.
Angela F. BralyFormer Chair of the Board, President and Chief Executive Officerof WellPoint, Inc. (healthcare insurance), now known as Anthem.Director since 2009. Also a Director of Lowe’s Companies, Inc.and Brookfield Asset Management. Age 54. Member of the Auditand Governance & Public Responsibility Committees.
Kenneth I. ChenaultChairman and Chief Executive Officer of the American ExpressCompany (global services, payments and travel company). Directorsince 2008. Also a Director of International Business MachinesCorporation. Age 64. Member of the Audit and Compensation& Leadership Development Committees.
Scott D. CookChairman of the Executive Committee of the Board of Intuit Inc.(software and web services). Director since 2000. Also a Directorof eBay Inc. Age 63. Chair of the Innovation & TechnologyCommittee and member of the Compensation & LeadershipDevelopment Committee.
Susan Desmond-HellmannChief Executive Officer of the Bill & Melinda Gates Foundation(a private foundation supporting U.S. education, global healthand development, and community giving in the Pacific Northwest).Former Chancellor and Arthur and Toni Rembe Rock DistinguishedProfessor, University of California, San Francisco. Director since 2010.Also a Director of Facebook, Inc. Age 58. Member of the Audit andInnovation & Technology Committees.
A.G. LafleyChairman of the Board, President and Chief Executive Officer ofthe Company. Director since 2013. Also a Director of LegendaryPictures, LLC. Age 68.
Terry J. LundgrenChairman and Chief Executive Officer of Macy’s, Inc. (nationalretailer). Director since 2013. Also a Director of Kraft Foods Group.Age 63. Member of the Governance & Public Responsibility andInnovation & Technology Committees.
W. James McNerney, Jr.Chairman of the Board of The Boeing Company (aerospace,commercial jetliners and military defense systems). President ofThe Boeing Company from 2005 to December 2013 and ChiefExecutive Officer from 2005 to June 2015. Director since 2003.Also a Director of International Business Machines Corporation.Age 66. Lead Director, Chair of the Compensation & LeadershipDevelopment Committee and member of the Governance &Public Responsibility Committee.
David S. TaylorGroup President–Global Beauty, Grooming and Health Care.Appointed to the Board on July 28, 2015. Age 57.
Margaret C. WhitmanChairman, President and Chief Executive Officer of Hewlett Packard(computer software, hardware and IT services company). FormerPresident and Chief Executive Officer of eBay Inc. (ecommerce andpayments) from 1998 to 2008. Director since 2011. Age 59. Memberof the Compensation & Leadership Development and Innovation &Technology Committees.
Mary Agnes WilderotterExecutive Chairman of Frontier Communications Corporation(company specializing in providing communication services topredominantly rural and suburban towns and cities in 28 states).President of Frontier Communications from 2004 to April 2012and Chief Executive Officer from 2004 to April 2015. Director since2009. Also a Director of Xerox Corporation and Juno Therapeutics.Age 60. Member of the Audit, Compensation & LeadershipDevelopment, and Innovation & Technology Committees.
Patricia A. WoertzChairman of the Board of Archer Daniels Midland Company(agricultural processors of oilseeds, corn, wheat and cocoa, etc.).President of Archer Daniels Midland Company from 2006 toFebruary 2014 and Chief Executive Officer from 2006 to January 2015.Director since 2008. Also a director of Royal Dutch Shell plc. Age 62.Chair of the Audit Committee and member of the Governance &Public Responsibility Committee.
Ernesto ZedilloFormer President of Mexico, Director of the Center for the Studyof Globalization and Professor in the field of International Economicsand Politics at Yale University. Director since 2001. Also a Directorof Alcoa Inc., Citigroup, Inc. and Promotora de Informaciones S.A.Age 63. Chair of the Governance & Public Responsibility Committeeand member of the Innovation & Technology Committee.
THE BOARD OF DIRECTORS HAS FOUR COMMITTEES:
Audit, Compensation & Leadership Development, Governance &Public Responsibility, Innovation & Technology
82 The Procter & Gamble Company

Company and Shareowner Information
P&G’S PURPOSE
We will provide branded products and services of superior qualityand value that improve the lives of the world’s consumers, now andfor generations to come. As a result, consumers will reward us withleadership sales, profit and value creation, allowing our people, ourshareowners, and the communities in which we live and work toprosper. To learn more, please visit www.pg.com.
BRANDS
For information on our portfolio of brands and our latest innovations,please visit www.pg.com/brands and www.pginnovation.com.
SUSTAINABILITY
At P&G, we are focusing our efforts where we can make the mostmeaningful difference in both environmental and social sustainability.To learn more, please visit www.pg.com/sustainability.
CORPORATE HEADQUARTERS
The Procter & Gamble CompanyP.O. Box 599Cincinnati, OH 45201-0599
P&G SHAREHOLDER INVESTMENT PROGRAM
The Procter & Gamble Shareholder Investment Program (SIP) isa direct stock purchase and dividend reinvestment plan. The SIPis open to current P&G shareowners as well as new investors andis designed to encourage long-term investment in P&G by providinga convenient and economical way to purchase P&G stock andreinvest dividends. Highlights of the plan include:
• Minimum initial investment— $250
• Nominal administrative fees, including no enrollment fee,and no dividend reinvestment fee
• Optional cash investment— minimum $50
• Administered by The Computershare Trust Company
For complete information on the SIP, please read the ProgramProspectus. The Prospectus and New Account Application Form areavailable at www.pgshareholder.com or by contacting Computershare.
GIVING THE GIFT OF P&G STOCK
Did you know you can give P&G stock to your children, grandchildren,nieces, nephews and friends? Many of our long-time shareownersknow what a great gift P&G stock makes for a special person on aspecial occasion. You can make the gift by transferring shares fromyour account or by purchasing shares for the recipient through theSIP. Please visit www.pgshareholder.com or contact Computersharefor details.
SHAREHOLDER SERVICES
The Computershare Trust Company serves as transfer and dividendpaying agent for P&G Common Stock and Administrator of theProcter & Gamble Shareholder Investment Program. Registeredshareowners and Program participants needing account assistancewith share transfers, plan purchases/sales, lost stock certificates, etc.,should contact Computershare at:
Website: www.pgshareholder.comE-mail: P&[email protected] (M–F, 8am–8pm Eastern): 1-800-742-6253;1-781-575-4399 (outside U.S. and Canada)
TRANSFER AGENT
Computershare250 Royall StreetCanton, MA �����
REGISTRAR
ComputershareP.O. Box 43078Providence, RI 02940
EXCHANGE LISTINGS
New York Stock Exchange, NYSE Euronext-Paris
STOCK SYMBOL
PG
ANNUAL MEETING
The next annual meeting of shareholders will be held on Tuesday,October 13, 2015. A full transcript of the meeting will be availablefrom Susan Felder, Assistant Secretary. Ms. Felder can be reached at1 P&G Plaza, Cincinnati, OH 45202-3315.
FORM 10-K
Shareowners may obtain a copy of P&G’s 2015 report to theSecurities and Exchange Commission on Form ��-K at no chargeby going to www.pginvestor.com or by sending a written requestto Computershare, P.O. Box 43078, Providence, RI 02940.
The most recent certifications by our Chief Executive and ChiefFinancial Officers pursuant to Section 302 of the Sarbanes-OxleyAct of ���� are filed as exhibits to our Form ��-K for the fiscal yearended June ��, ����. We have also filed with the New York StockExchange the most recent Annual CEO certification as requiredby Section ���A.��(a) of the New York Stock Exchange ListedCompany Manual.
The Procter & Gamble Company 83
Recognition
P&G is consistently recognized as a leading global company,earning a variety of awards and recognition in several key areas.
REPUTATION AND LEADERSHIP
Fortune named P&G #1 in our industry and #17 overall on its listof the World’s Most Admired Companies.
Barron’s ranked P&G #31 on its World’s Most RespectedCompanies list.
Chief Executive Magazine named P&G #3 on its list of the40 Best Companies for Leaders.
Hay Group ranked P&G #1 on its list of the Best Companiesfor Leadership.
Universum named P&G to its list of the World’s MostAttractive Employers.
P&G ranked #11 on Glassdoor’s list of the Best Places to Work acrossthe U.S. and the U.K. in its seventh annual Employees’ Choice Awards.
INNOVATION
Innovative new products earned Procter & Gamble five of the top 10spots in the IRI New Product Pacesetters ranking of the mostsuccessful non-food product launches of 2014. P&G innovationsmaking the list were Gain Flings! (#2), DayQuil/NyQuil SEVERE (#5),Old Spice Wild Collection (#7), Duracell Quantum (#8), andCascade Platinum (#9). This achievement underscores P&G’s focuson driving business growth through a strong portfolio of innovativeproducts designed to delight consumers. Since the first IRI NewProduct Pacesetters Report in 1995, P&G has had 161 products makethe top 25 Pacesetters list in non-food categories — more thanour six largest competitors combined.
For the first time, Gartner, a leading research and advisory firm,named P&G a “Supply Chain Master” as part of its 2015 SupplyChain Top 25 list. This distinction recognizes companies that haveconsistently ranked highly on the Top 25 list over the past 10 years.The Gartner Supply Chain Top 25 recognizes sustained leadershipand continued excellence in consumer-driven supply chaintechnologies.
At the 62nd Cannes Lions Festival of Creativity, the premierworldwide event for recognizing the best creative work in theadvertising, media and communications industry, P&G brands andour agencies were awarded 36 Lions across 10 brands, includingAlways/Whisper, Old Spice, Tide, Pampers, Oral-B, and Crest—morethan any other advertiser. Always/Whisper led the way with 21 Lions,a record for P&G brands and the best performance of any brand atthe 2015 Festival. The Always #LikeAGirl campaign won 14 Lions,including a Titanium Lion—the Festival’s highest honor, recognizingbreakthrough ideas that change the world of creativity and informnew ways of thinking. In addition to the recognition at the CannesLions Festival of Creativity, the Always #LikeAGirl campaign and itsagencies have won several awards, including a 2015 Emmy nomination,a Grand CLIO Award and PRWeek’s Global Campaign of the Year.
DIVERSITY
P&G received the 2015 Catalyst Award, recognizing the Companyfor success in creating a workplace where women and men haveequal opportunity to advance and lead. P&G is one of only fourcompanies — and the only company in the CPG industry — to winthis award more than once.
P&G’s commitment to creating a diverse workplace has beenrecognized by DiversityInc, including a #10 ranking on its Top 50Companies for Diversity and a #7 ranking on its Top Ten Companiesfor Global Diversity.
Working Mother named P&G among its 100 Best Companies forworking mothers for the seventh consecutive year. We were alsoranked among Working Mother’s Top 5 Best Companies forMulticultural Women.
The National Association for Female Executives recognized P&Gamong their Top 50 Companies for Executive Women for the 15thyear, ranking P&G in the top 10 for-profit companies for the 5thconsecutive year.
The Human Rights Campaign has recognized P&G among a selectgroup of companies, scoring a perfect 100 on the Human RightsCampaign Foundation’s 2015 Corporate Equality Index.
SUPPLIER DIVERSITY
Supplier diversity is a fundamental business strategy that strengthensour innovation and go-to-market capabilities and touches andimproves the lives of our diverse suppliers, their employees and thecommunities in which they live and work.
For the eighth year in a row, P&G spent more than $2 billion withminority- and women-owned businesses. Since 2005, P&G has beena member of the Billion Dollar Roundtable, a forum of 20 corporationsthat spend more than $1 billion annually with diverse suppliers.
We are expanding the scope of supplier diversity to create evenmore value in our business and communities, launching our GlobalSupplier Diversity Program to develop diverse suppliers outside theU.S., and renewing our commitment to LGBT- and U.S. MilitaryVeteran-Owned suppliers.
SUSTAINABILITY
P&G’s commitment to sustainability is clear, and our focus onsustainability is making P&G stronger, delivering value for consumers,customers and shareowners. P&G’s innovative work in this area hasearned numerous awards across our business, including CorporateResponsibility Magazine’s 100 Best Corporate Citizens, the MSCISustainability Index, and recognition on FTSE4Good—on which P&Ghas been named since the index’s inception.
Des
ign:
VSA
Par
tner
s, In
c.
The paper utilized in the printing of this annual report is certified to the FSC® Standards,which promotes environmentally appropriate, socially beneficial and economically viablemanagement of the world’s forests.
84 The Procter & Gamble Company
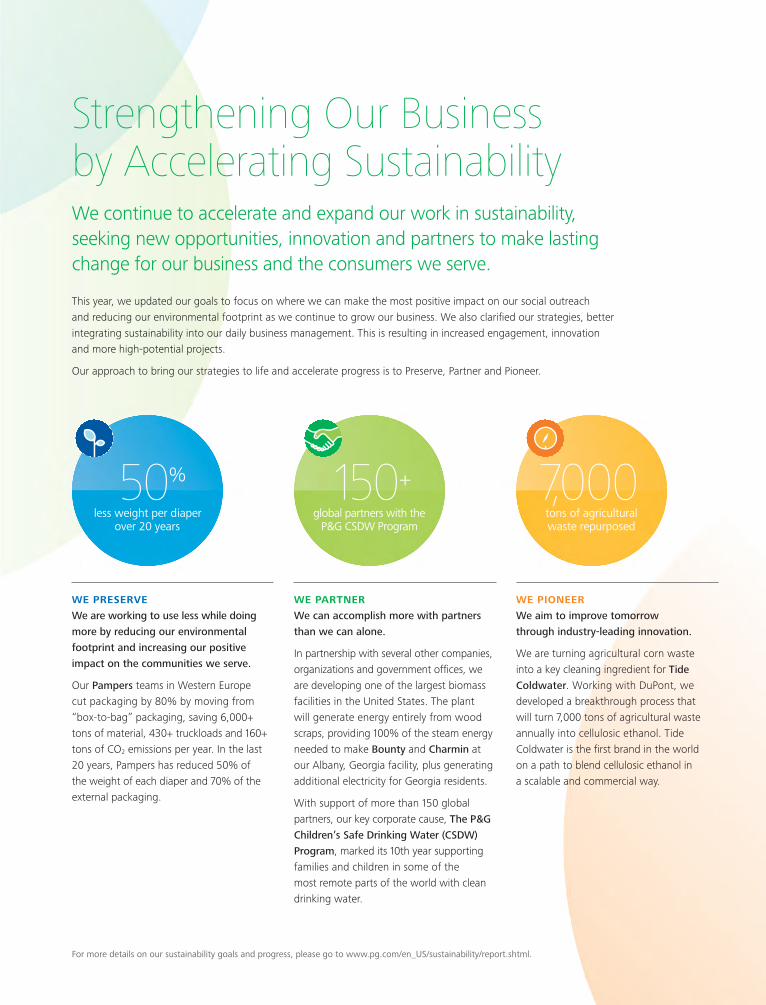
Strengthening Our Business by Accelerating SustainabilityWe continue to accelerate and expand our work in sustainability, seeking new opportunities, innovation and partners to make lasting change for our business and the consumers we serve.
This year, we updated our goals to focus on where we can make the most positive impact on our social outreach and reducing our environmental footprint as we continue to grow our business. We also clarified our strategies, better integrating sustainability into our daily business management. This is resulting in increased engagement, innovation and more high-potential projects.
Our approach to bring our strategies to life and accelerate progress is to Preserve, Partner and Pioneer.
WE PRESERVE
We are working to use less while doing
more by reducing our environmental
footprint and increasing our positive
impact on the communities we serve.
Our Pampers teams in Western Europe cut packaging by 80% by moving from “box-to-bag” packaging, saving 6,000+ tons of material, 430+ truckloads and 160+ tons of CO2 emissions per year. In the last 20 years, Pampers has reduced 50% of the weight of each diaper and 70% of the external packaging.
WE PARTNER
We can accomplish more with partners
than we can alone.
In partnership with several other companies, organizations and government offices, we are developing one of the largest biomass facilities in the United States. The plant will generate energy entirely from wood scraps, providing 100% of the steam energy needed to make Bounty and Charmin at our Albany, Georgia facility, plus generating additional electricity for Georgia residents.
With support of more than 150 global partners, our key corporate cause, The P&G
Children’s Safe Drinking Water (CSDW)
Program, marked its 10th year supporting families and children in some of the most remote parts of the world with clean drinking water.
WE PIONEER
We aim to improve tomorrow
through industry-leading innovation.
We are turning agricultural corn waste into a key cleaning ingredient for Tide
Coldwater. Working with DuPont, we developed a breakthrough process that will turn 7,000 tons of agricultural waste annually into cellulosic ethanol. Tide Coldwater is the first brand in the world on a path to blend cellulosic ethanol in a scalable and commercial way.
For more details on our sustainability goals and progress, please go to www.pg.com/en_US/sustainability/report.shtml.
50%
less weight per diaper over 20 years
7,000tons of agricultural waste repurposed
150+
global partners with the P&G CSDW Program

©2015 Procter & Gamble 00387130