2015 economic outlook: implications of lower oil prices · federal reserve bank of dallas 2015...
TRANSCRIPT

Federal Reserve Bank of Dallas
2015 Economic Outlook:Implications of Lower Oil Prices
Michael PlanteAmerican Gas Association
Finance Committee MeetingMarch 17, 2015
Federal Reserve Bank of Dallas
Disclaimer
Disclaimer 1: The statements in this presentation do not represent the official views of the Federal Reserve Bank of Dallas nor of the Federal Reserve System as a whole.
Disclaimer 2: We are currently in the FOMC blackout period.

Federal Reserve Bank of Dallas
Oil and Gas Prices Plunge
0
20
40
60
80
100
120
140
160
2006 2007 2008 2009 2010 2011 2012 2013 2014 2015
Nominal price, $, weekly
Oil Price
$50.38
$3.04
Natural Gas Price*
*Note: Henry Hub*10Source: Energy Information Administration; Wall Street Journal.
Federal Reserve Bank of Dallas
Outline
• How did we get here?– World oil supply/demand balance
• Impact on U.S. economy• Impact on state economies• Where do we go from here?
Federal Reserve Bank of Dallas
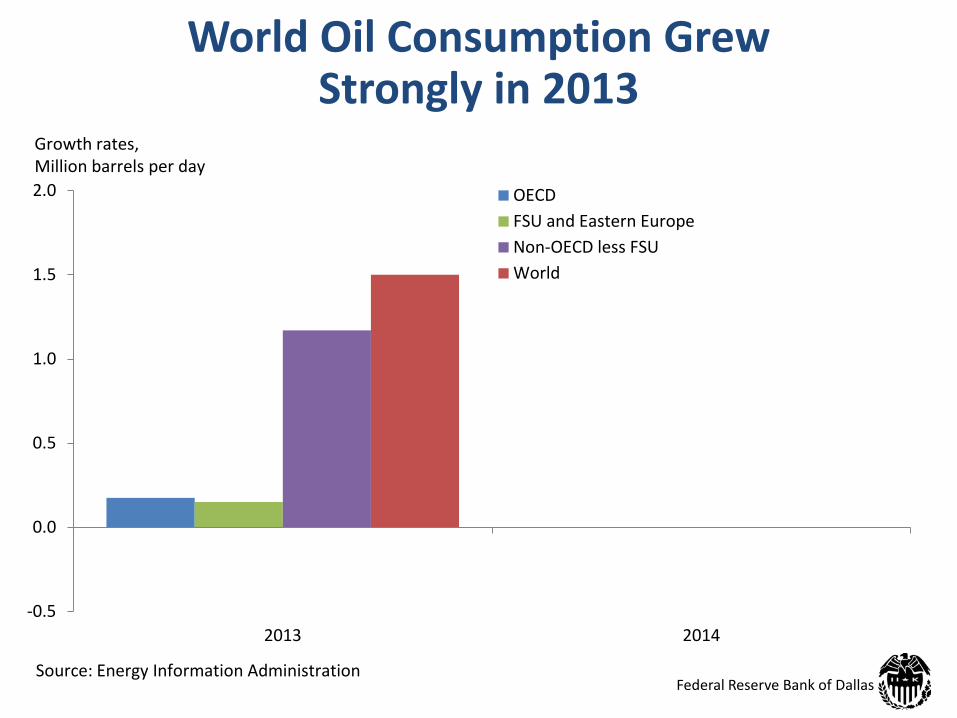
World Oil Consumption Grew Strongly in 2013
-0.5
0.0
0.5
1.0
1.5
2.0
2013 2014
OECDFSU and Eastern EuropeNon-OECD less FSUWorld
Source: Energy Information Administration
Growth rates,Million barrels per day

Federal Reserve Bank of Dallas
World Oil Consumption GrewMuch Slower in 2014
-0.5
0.0
0.5
1.0
1.5
2.0
2013 2014
OECDFSU and Eastern EuropeNon-OECD less FSUWorld
Source: Energy Information Administration
Growth rates,Million barrels per day

Federal Reserve Bank of Dallas
2013 Supply Growth Relatively Weak
-1.5
-1.0
-0.5
0.0
0.5
1.0
1.5
2.0
2.5
2013 2014
Non-OPEC Production OPEC Production World Production World ConsumptionSource: Energy Information Administration.
Growth rates,Million barrels per day

Federal Reserve Bank of Dallas
Supply Growth Exceeded Demand in 2014
-1.5
-1.0
-0.5
0.0
0.5
1.0
1.5
2.0
2.5
2013 2014
Non-OPEC Production OPEC Production World Production World ConsumptionSource: Energy Information Administration.
Growth rates,Million barrels per day

Federal Reserve Bank of Dallas
Unexpected Events in 2014H2
• Iraq and Libyan oil production levels– Unexpected growth Sept. – Dec.
• Outcome of OPEC meeting– Saudi Arabia keeps production at high levels
• Outlook for growth in 2015 downgraded– Particularly for developing countries
Federal Reserve Bank of Dallas
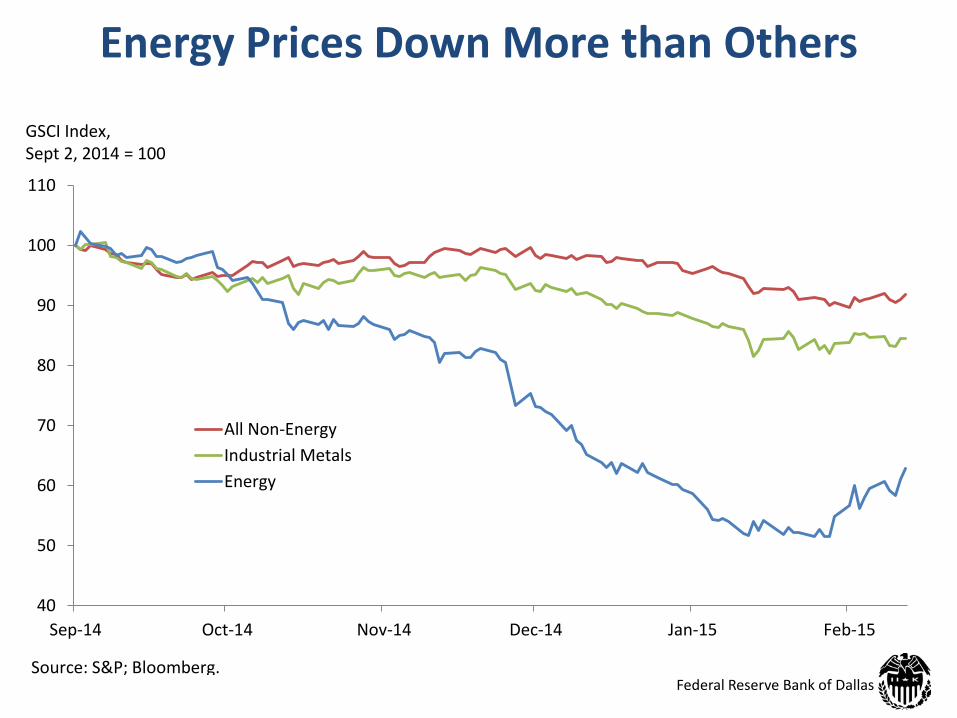
Energy Prices Down More than Others
40
50
60
70
80
90
100
110
Sep-14 Oct-14 Nov-14 Dec-14 Jan-15 Feb-15
All Non-EnergyIndustrial MetalsEnergy
Source: S&P; Bloomberg.
GSCI Index, Sept 2, 2014 = 100
Federal Reserve Bank of Dallas
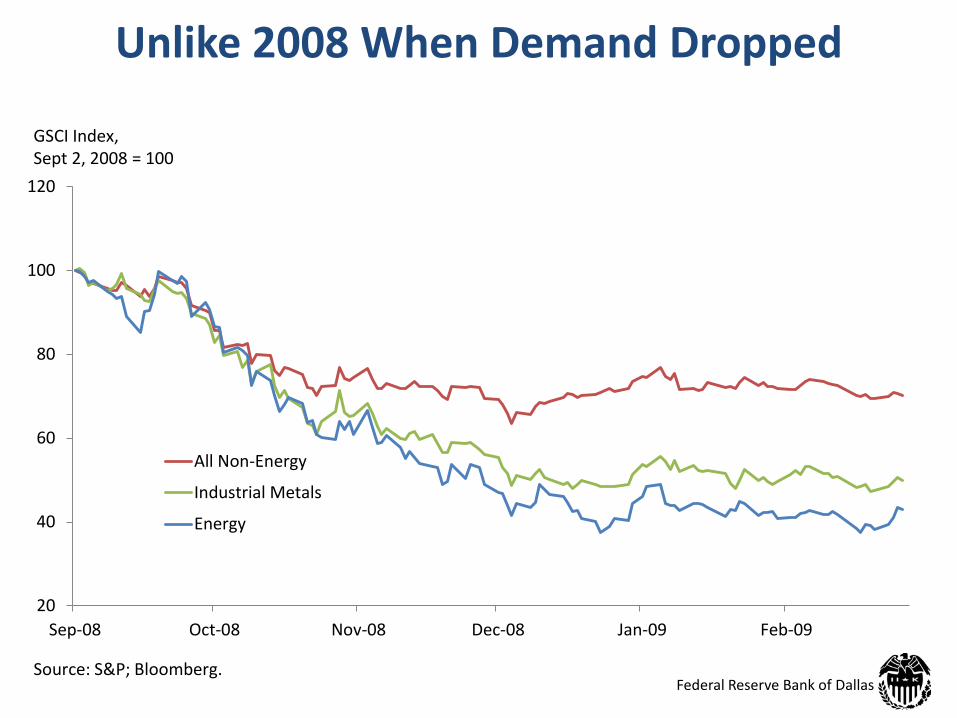
Unlike 2008 When Demand Dropped
20
40
60
80
100
120
Sep-08 Oct-08 Nov-08 Dec-08 Jan-09 Feb-09
All Non-Energy
Industrial Metals
Energy
Source: S&P; Bloomberg.
GSCI Index, Sept 2, 2008 = 100

Federal Reserve Bank of Dallas
IMPACT ON U.S. AND STATES

Federal Reserve Bank of Dallas
Importance of Oil and Gas to U.S. Economy
0
0.1
0.2
0.3
0.4
0.5
0.6
0.7
0.8
0.9
0.0
0.5
1.0
1.5
2.0
2.5
3.0
3.5
4.0
4.5
1972 1977 1982 1987 1992 1997 2002 2007 2012
Source: Bureau of Economic Analysis; Bureau of Labor Statistics.
Percent of GDP
Percent of Employment
US GDPUS Employment

Federal Reserve Bank of Dallas
Shale Boom Means Production Boom
0
10
20
30
40
50
60
70
80
90
0
2
4
6
8
10
12
1920 1930 1940 1950 1960 1970 1980 1990 2000 2010
Million barrels per dayBillion cubic feet per day
Natural Gas
Crude Oil
Source: Energy Information Administration.
Feb 2015Estimates

Federal Reserve Bank of Dallas
Lower Oil Prices: Impacts on U.S. Economy
• The U.S. benefits from lower oil prices• Boosts consumer disposable income
– Lower gas prices add $750 to household budgets in 2015
• Reduces the cost of energy to firms• Reduces profitability of producing oil
– Layoffs and Capex declines in energy firms
• Recent fall in oil prices may lead to a 0.3% to 1.0% increase in GDP (depending on the model)

Federal Reserve Bank of Dallas
Handful of States See Oil Boom
0
500
1000
1500
2000
2500
3000
3500
4000
Jan 2010 Dec 2014 Jan 2010 Dec 2014 Jan 2010 Dec 2014
Source: Energy Information Administration
1,513
Thousand barrels per day
1,227
3,447Texas
North Dakota
UtahColoradoWyomingNew Mexico
Oklahoma
MontanaKansas
786
236
1,098

Federal Reserve Bank of Dallas
Regional Effects of the Boom
• Increased energy activity brings oil and gas extraction and oil-field support jobs
• Local areas: – lease and royalty payments,– infrastructure construction and – increased spending on various services
• Governments: Greater tax revenues
Federal Reserve Bank of Dallas
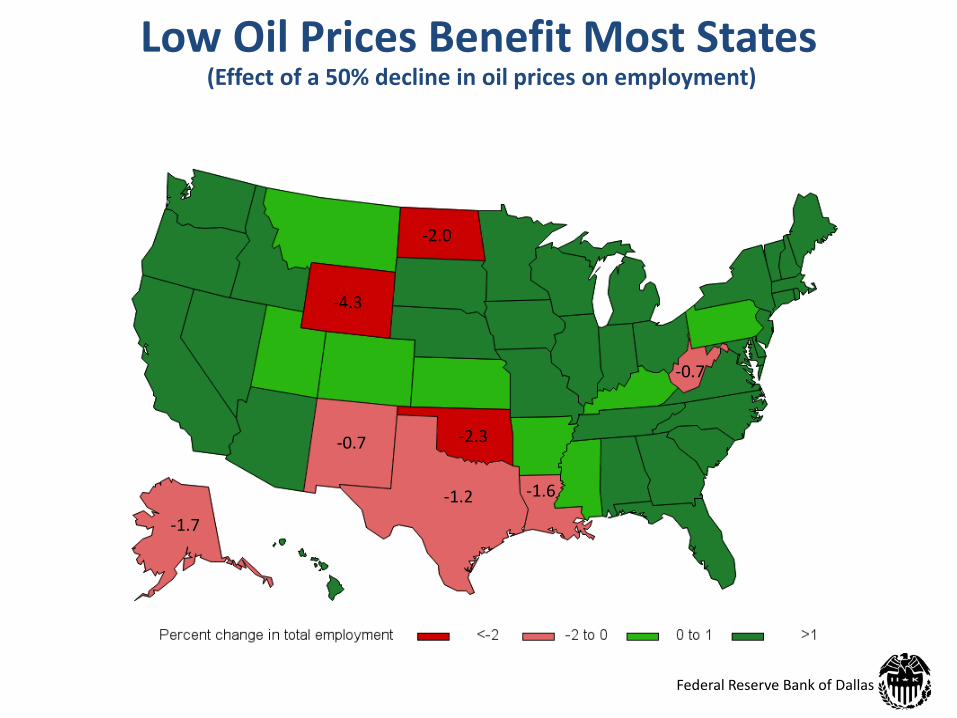
-2.0
-4.3
-2.3-0.7
-1.2 -1.6
-1.7
-0.7
Low Oil Prices Benefit Most States(Effect of a 50% decline in oil prices on employment)

Federal Reserve Bank of Dallas
Energy-related Employment Shares
0
2
4
6
8
10
12
14
2000 2013 2000 2013 2000 2013 2000 2013 2000 2013 2000 2013 2000 2013 2000 2013Oil & gas operations Petrochemicals Oil field equipment Coal mining Refining
Percentage of nonagricultural employment
Alaska Louisiana North Dakota
New Mexico
Oklahoma Texas West Virginia
Wyoming

Federal Reserve Bank of Dallas
WHERE DO WE GO FROM HERE?
Federal Reserve Bank of Dallas
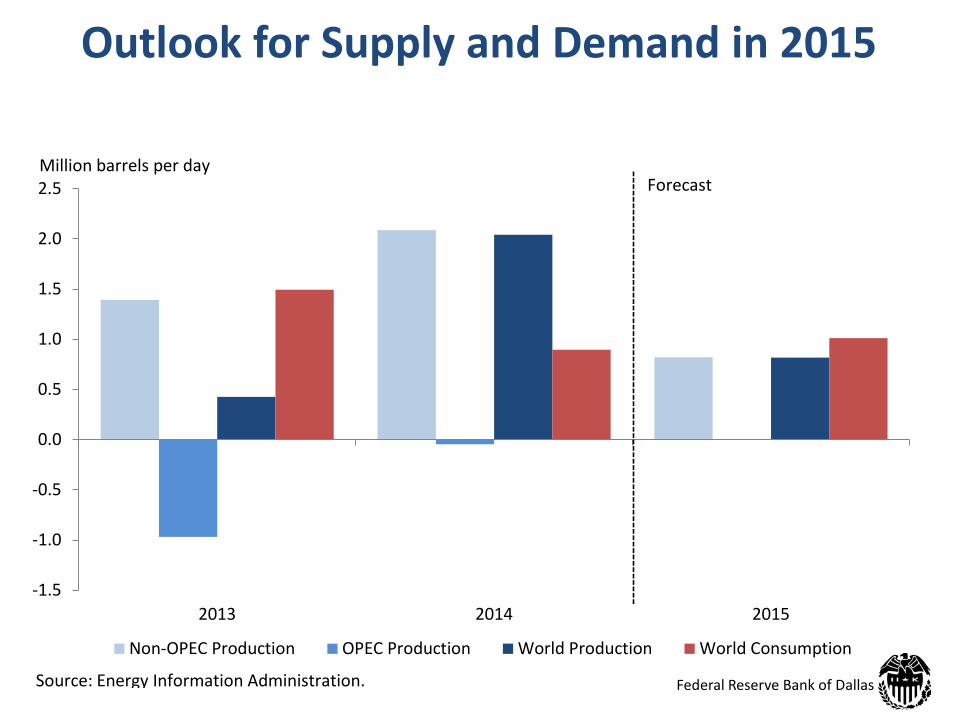
Outlook for Supply and Demand in 2015
-1.5
-1.0
-0.5
0.0
0.5
1.0
1.5
2.0
2.5
2013 2014 2015
Non-OPEC Production OPEC Production World Production World Consumption
Source: Energy Information Administration.
Million barrels per dayForecast

Federal Reserve Bank of Dallas
0
20
40
60
80
100
120
Jan-14 Apr-14 Jul-14 Oct-14 Jan-15 Apr-15 Jul-15 Oct-15 Jan-16 Apr-16 Jul-16 Oct-16
Historical Spot Price
STEO Price Forecast
NYMEX Futures Price
95% NYMEX Futures Confidence Interval
Dollars per barrel
Source: Energy Information Administration.
EIA Expects Spot Prices to Rise

Federal Reserve Bank of Dallas
Outlook for Texas
• Oil and gas: 13 percent of GDP, 2.6 percent of jobs
• Dollar has also appreciated significantly
• Expecting slower job growth in 2015– 2014 growth was 3.4 percent (+389,000 jobs)
• Latest employment data already showing slowdown
Federal Reserve Bank of Dallas
Concluding Remarks
• Oil market will adjust– Lower prices will slow supply growth and spur demand
• Global economy expected to continue growing
• Modest, positive benefits for U.S. economy
• But benefits not evenly distributed across 50 states

Federal Reserve Bank of Dallas
2015 Economic Outlook:Implications of Lower Oil Prices
Michael PlanteAmerican Gas Association
Finance Committee MeetingMarch 17, 2015