©2015 qianqi kay shen all rights reserved
TRANSCRIPT

©2015
Qianqi Kay Shen
ALL RIGHTS RESERVED

NEGOTIATING GOVERNANCE:
CENTRAL-LOCAL GOVERNMENT RELATIONS IN THE ESTABLISHMENT OF
SPECIAL ECONOMIC ZONES IN CHINA
By
QIANQI KAY SHEN
A dissertation submitted to the
Graduate School-New Brunswick
Rutgers, The State University of New Jersey
In partial fulfillment of the requirements
For the degree of
Doctor of Philosophy
Graduate Program in Planning and Public Policy
Written under the direction of
Robert W. Lake
and approved by
_____________________________________
_____________________________________
_____________________________________
_____________________________________
_____________________________________
New Brunswick, New Jersey
OCTOBER 2015

ii
ABSTRACT OF THE DISSERTATION
NEGOTIATING GOVERNANCE:
CENTRAL-LOCAL GOVERNMENT RELATIONS IN THE ESTABLISHMENT OF
SPECIAL ECONOMIC ZONES IN CHINA
by QIANQI KAY SHEN
Dissertation Director:
Robert W. Lake
This dissertation contains information about how decentralization and spatially
delimited zones have been used to govern China’s economic transformation and in what
way these experiences challenge traditional debates on states and decentralization.
For over three decades, decentralization has been the most significant government
restructuring activity worldwide, intended to achieve development and democracy
through dissolving power to local levels. However, previous works on decentralization
and federalism rely on a central assumption: the fixity of a structure with unchanged
boundaries of authority. The chief goal is to create a fixed structure with power and tasks
(i.e., federalism) to achieve societal benefits. Not much attention has been paid to the
bargaining process that keeps the authority boundaries fluid. Agamben (2011) revealed,
in The Kingdom and the Glory, that governance can only exist as the unity of divergence
and convergence of power. Based on this concept of a bipolar governance machine, I

iii
develop a theoretical framework that explains how intergovernmental negotiation
produces different developmental paths at the subnational level.
Through a close and fine-grained case comparison of the planning process of
three development zones in two regions (Binhai New Area in Tianjin, Guangzhou
Development Zone, and Nansha New Area in Guangzhou), I explore two questions: How
does intergovernmental negotiation function as a mechanism of governance? How are
paths of development differentiated by the forms of collaborative relationships? In this
study, I analyze these zones as platforms for intergovernmental contestations, instead of
using the conventional approach of seeing zones as examples of successful policy
implementation.
The theoretical framework that developed from this study can open a new window
to examine multiscalar, multilevel competitive and collaborative intergovernmental
interactions. This paper contributes to converting the “China story” into richer Chinese
stories and also provides examples of instruments and governance structures in Chinese
planning today. It also provides wider theoretical and practical relevance to spatially
delimited economic zones in other countries and contains questions that challenge the
theoretical understanding of the role of planning in international development.

iv
Acknowledgements
The writing of a doctoral thesis is no easy task. During this time, I have received
support and help from many people. A debt of gratitude is owed to my dissertation
committee, including Dr. Robert W. Lake (chair), Dr. Carl Van Horn, Dr. Robert R.
Kaufman, Dr. Hal Salzman, and Dr. Yehua Dennis Wei. I would like to thank all the
committee members for their profound knowledge and understanding of the subject; they
have provided great mentorship, helping me to develop and write my doctoral study.
Their insightful suggestions and comments have contributed to the completion of this
dissertation. In particular, I would like to thank Dr. Robert W. Lake for his patience and
encouragement throughout my doctoral studies and for his suggestions on the key
literature that inspired my theoretical development of this dissertation. I would also like
to thank Dr. Carl Van Horn for his mentorship and help, especially in the early stage of
my work, and for his kindness in offering me the wonderful opportunity to work at the
Heldrich Center for Workforce Development. I thank Dr. Robert R, Kaufman for his
generous guidance in helping me to explore the subject. I thank Dr. Hal Salzman for his
patience and passion in helping me to develop the ideas of my dissertation. I thank Dr.
Yehua Dennis Wei for his insightful comments and suggestions.
I also want to thank Dr. Smita Srinivas, who inspired me in my academic pursuits
when I studied at Columbia University and has continued to be supportive.
I also would like to offer my sincere appreciation for the financial support from
Bloustein School of Planning and Public Policy and from the Heldrich Center for
Workforce Development at Rutgers University.

v
Many thanks also go to those who helped arrange my fieldwork and who were
willing to share their field experience and knowledge.
Last, but far from least, thanks go to my family, especially my mom, Renying
Shen, and my husband, Dr. Wenjie Zeng, who have been my most important and
indispensable sources of spiritual support. Thanks also go to my extended family, who
have all been supportive during my studies.

vi
TABLE OF CONTENTS
Abstract of the Dissertation ............................................................................................................. ii
Acknowledgements ......................................................................................................................... iv
Table of Contents ............................................................................................................................ vi
List of Figures ................................................................................................................................. ix
List of Tables ................................................................................................................................. xii
Chapter 1 Introduction ..................................................................................................................... 1
Chapter 2 China’s Case: Development from Centralization or Decentralization, or Both? ............ 7
2.1 The Myth of Central Control ............................................................................................. 10
2.2 Decentralization and the Development Zone Policy .......................................................... 20
2.3 Summary ............................................................................................................................ 22
Chapter 3 Theoretical Framework: Scale, Bipolar Machine, Glory and Acclamation .................. 25
3.1 State Power and Structure in Development ....................................................................... 25
3.2 The Center-Local Relationship from a Divided View of State Power ............................... 29
3.3 Scaling Processes as Social Processes ............................................................................... 36
3.4 The Last Piece of the Puzzle .............................................................................................. 48
Chapter 4 Design of the Study ....................................................................................................... 65
4.1 The Design of the Original Social Network Analysis ........................................................ 65
4.2 The Design of Comparison Case Studies ........................................................................... 69
Chapter 5 Social Network Analysis of Official Career Data ......................................................... 74
5.1 Local Experience Became More Important with Time ...................................................... 74
5.2 Primary Analysis of Provincial Representation ................................................................. 76
5.3 Considering Experience with the Effect of Time ............................................................... 83
5.4 Forming the Steps of a Political Career ............................................................................. 85
5.5 Correlation between Political Career and GDP ................................................................. 90
vii
5.6 Social Network Analysis on Career Data .......................................................................... 97
5.7 Summary .......................................................................................................................... 108
Chapter 6 Case I: Tianjin—the Coherent Collaborative Platform ............................................... 111
6.1 First Phase: Minimal Central Involvement and Unconditional Local Support ................ 111
6.2 Motorola ........................................................................................................................... 118
6.3 Second Phase: Gaining Financial Independence and the Center–Local Conflicts ........... 123
6.4 Third Phase: Collaborating with the Center ..................................................................... 132
6.5 Fourth Phase: Losing Control and the Development of a “Ghost City” .......................... 139
6.6 Summary .......................................................................................................................... 144
Chapter 7 Case II: Guangzhou—The Locally Contained Conflicting Platform .......................... 148
7.1 First Phase: Heavy Reliance on Local Initiatives ............................................................ 151
7.2 Second Phase: Active Expansion ..................................................................................... 154
7.3 Financial Sustainability and City–District Conflicts ....................................................... 165
7.4 Summary .......................................................................................................................... 172
Chapter 8 Case III: Nansha—The Multiscale Conflicting Platform ............................................ 175
8.1 First Phase: Slow Development and Public–Private Conflicts ........................................ 176
8.2 Administrative Conflicts and Solutions: Merging Panyu with Guangzhou ..................... 178
8.3 The Fight over Nansha Port and the Failure of Heavy Industry Development ................ 180
8.4 New Planning Phase ........................................................................................................ 186
8.5 Summary .......................................................................................................................... 190
Chapter 9 Conclusion: Rethinking Planning and Planners .......................................................... 193
9.1 The Model and the Three Platforms ................................................................................ 194
9.2 Contribution of This Study .............................................................................................. 198
9.3 Power and Acclamation: Why Authoritative Government Needs Planners and Planning
…………………………………………………………………………………………...202
9.4 Ways Forward .................................................................................................................. 206

viii
References .................................................................................................................................... 212

ix
List of Figures
Figure 1. Central and local shares of revenues and expenses, 1980–2011.. .................................. 13
Figure 2. The ratio of land sale fees to local revenues, 2001–2010. .............................................. 15
Figure 3. An illustration of the bipolar governance machine of China’s state............................... 62
Figure 4. A sample profile from China Vitae. ............................................................................... 66
Figure 5. Ranking of provinces/regions by officials with local experience before entering CPC…
....................................................................................................................................................... 77
Figure 6. Ranking of provinces/regions by officials’ local experience after entering CPC ........... 79
Figure 7. China’s GDP and per capita GDP by province.. ............................................................ 83
Figure 8. Local experience (year)*number of officials per province/region before entering CPC.
....................................................................................................................................................... 85
Figure 9. Ranking of provinces/regions by the step they represented in officials' careers before
entering CPC. ................................................................................................................................. 87
Figure 10. Ranking of provinces/regions by the step they formed in officials' entire careers. ...... 88
Figure 11. Political representation of province before officials enter the CPC CC. ...................... 89
Figure 12. Political representation of province based on entire career. ......................................... 89
Figure 13. Officials with local experience before entering CPC, provinces grouped by per capita
GDP. .............................................................................................................................................. 93
Figure 14. Officials’ local experience after entering CPC, provinces grouped by per capita GDP.
....................................................................................................................................................... 93
Figure 15. Local experience (year)*number of officials, provinces grouped by per capita GDP.. 94
Figure 16. Percentage of the posts as the last or only post in an official’s career, provinces
grouped by per capita GDP. ........................................................................................................... 94
Figure 17. Officials with local experience before entering CPC, by economic region. ................. 95
Figure 18. Officials’ local experience after entering CPC, by economic region. .......................... 96

x
Figure 19. Local experience (year)*number of officials, by economic region. ............................. 96
Figure 20. Percentage of the posts as the last or only post in an official’s career, by economic
region. ............................................................................................................................................ 97
Figure 21. Grouping by indegree centrality, before officials entered CPC Central Committee. ... 98
Figure 22. Grouping by indegree centrality, entire career. ............................................................ 98
Figure 23. Reciprocal relationships among provinces, before officials enter CPC CC. .............. 100
Figure 24. Reciprocal relationships among provinces, officials’ entire career. ........................... 101
Figure 25. Ego-centered relationships of Beijing, before officials enter CPC CC. ..................... 102
Figure 26. Ego-centered relationships of Beijing, officials’ entire career. .................................. 102
Figure 27. Province structural equivalence dendrogram, before officials entered CPC CC. ....... 104
Figure 28. Province group reduced graph, before officials enter CPC CC .................................. 104
Figure 29. Province structural equivalence dendrogram, officials’ entire career. ....................... 106
Figure 30. Province group reduced graph, officials’ entire career. .............................................. 108
Figure 31. Map of the location of Tianjin. ................................................................................... 111
Figure 32. Location of Binhai New Area and the original TEDA. .............................................. 113
Figure 33. The changing shape of the “carrying pole with loads on both sides” from 1995 to 2009
..................................................................................................................................................... 114
Figure 34. TEDA Holding’s sectoral structure. ........................................................................... 132
Figure 35. Pictures of the Yu Jia Bao “Ghost City”. ................................................................... 144
Figure 36. Binhai New Area and Tianjin municipal GDP (100 million yuan) 1997–2012 ......... 146
Figure 37. Percentages of secondary, tertiary and financial industry representation in Binhai GDP
..................................................................................................................................................... 147
Figure 38. The location of Guangdong and Guangzhou.. ............................................................ 149
Figure 39. Planning districts of the Guangzhou Development Zone, Luogang (now Huangpu)
District. ........................................................................................................................................ 150
Figure 40. The planning areas of the Luogang District (now Huangpu District).. ...................... 165

xi
Figure 41. Luogang District and Guangzhou GDP, 2006–2012 .................................................. 174
Figure 42. Location of Nansha District. ....................................................................................... 176
Figure 43. Current land use situation in Nansha District ……………………………………….177
Figure 44. Nansha District and Guangzhou GDP 2006–2012 ..................................................... 189
Figure 45. The GDP of the old districts and of Nansha and Luogang combined as a percentage of
Guangzhou’s GDP from 2006–2012. .......................................................................................... 191
Figure 46. The stylized theoretical framework and the three representative cases. ..................... 195

xii
List of Tables
Table 1 Comparison of Two Literatures: Federalism vs. State Rescaling ..................................... 41
Table 2 Composition of 12th–18th Communist Party of China Central Committee ...................... 74
Table 3 Percentage of Officials with Local Experience by the Frequency They are Elected to the
CC .................................................................................................................................................. 76
Table 4 Comparison of the Two Rankings: Before and After Entering CPC CC .......................... 80
Table 5 China’s Provincial GDP and Per Capita GDP in 2012 ..................................................... 82
Table 6 Years of Local Experience before Full Membership in CPC Central Committee ............ 84
Table 7 Correlation Coefficients between GDP and Provincial Representation in CPC CC ........ 91
Table 8 Guangzhou Development Zone Budgeting Breakdown ................................................. 171
Table 9 Nansha’s Annual Land Sale Plan .................................................................................... 190

1
Chapter 1
Introduction
For more than three decades, decentralization has been the most significant
government restructuring activity worldwide; it purports to achieve development and
democracy by dissolving power to local levels. Proponents of decentralization assert that
that intergovernmental competition can enhance economic efficiency (Tiebout, 1956;
Hayek, 1960; Oates, 1993) and that decentralization can improve accountability and
reduce corruption (Ostrom et al., 1993). Neoliberalists have argued that decentralization
can strengthen market mechanisms by reducing the power of a predatory state. Indeed,
even scholars who do not believe in market supremacy often support decentralization as a
good governance practice that can be used to address market failure through creating
better informed local governments (Bardhan, 2002). On the other hand, many scholars
question decentralized governance. Especially in contexts where democracy,
accountability, and professionalism in local government are absent, decentralization is
not a shortcut to governmental capacity. Even worse, decentralization can undermine
allocative efficiency, as it makes redistribution harder and creates regional inequality
(Warner, 2003). Researchers including Tendler (1998), Veron (2006), and Smoke (2003)
have pointed out that central governments have played an equal, if not more important,
role in making decentralization work—a debate that can be traced back to the literature
on federalism, a key intellectual forebear of decentralization (Riker, 1964). At the root of
this debate is the assumption that governance structure is responsible for social outcomes.
However, the antagonism between these two forms of power arrangement,

2
decentralization and centralization, undermines the possibility of realizing the unity of the
opposites: that is, creating a mechanism whose aim is not to determine which government
level has more power to carry out which functions, but rather to achieve desirable social
outcomes by embracing the reality of contested boundaries of authority among different
levels of governments. Locked within the false dichotomy of dualistic thinking, ignoring
the possibility of negotiating the malleable boundary between central and local
government, society is faced with limited options for structuring the actual practice of
governance.
In his recent work “The Kingdom and the Glory,” Agamben demonstrated how
two political paradigms, political theology and economic theology, derived from early
Christian theology (Agamben, 2007; 2011). Agamben argued that from these two
paradigms, the contemporary paradigms of sovereignty and economic governance were
further derived and became the founding paradigms for the modern theory of absolutism
and democracy. By investigating how economy entered into Christian theology as a
byproduct of the doctrine of the Holy Trinity, Agamben actually showed the
inseparability of these seemingly conflicting poles, which rely on and coordinate with
each other in a “bipolar governance machine” (Agamben, 2011). The two powers coexist
and oscillate in one machine, even though sometimes one pole may be dominant.
These principles may also be applied to our present inquiry. Centralization and
decentralization have been discussed as two trends in governmental power structure and
scholars have long been puzzled by the unbreakable yet seemingly contradictory
partnership of the two, as shown by Riker (1964) and Rueschemeyer and Evans (1985).
State action requires decentralization for maximum efficiency, but by giving such

3
autonomy to subunits, a state encounters the problem of coordination. But in Agamben’s
thesis, the divergence and convergence of power create a unity of opposites. From this
perspective, the puzzle is not which pole should dominate, but how coordination becomes
possible and sustainable in the bipolar machine.
To remedy this gap, this study explores the role of intergovernmental bargaining
in governance, using economic development policy in China as an example. By
comparing three cases regarding the planning and implementation of the Chinese national
policy on development zones in two urban regions (i.e., one zone in Tianjin, two in
Guangzhou), this study examines how intergovernmental negotiation—conducted
explicitly through open communication and interactions and implicitly through
noncompliance, rule violation, or other tacit strategies—works as a key mechanism to
engender development strategies that bring about different paths of development. The
research explores two questions: How does intergovernmental negotiation function as a
mechanism of governance? And how are paths of development differentiated by the
forms of collaborative relationships?
Widely considered to be a part of China’s policy of “opening up,” including the
ongoing decentralization process and reforms occurring since the early 1980s, the
development zone program has been deemed the most successful industrial policy
contributing to the country’s rapid urban growth (FIAS, 2008). The main aim of this
policy is to designate “geographically delimited areas” and to provide special monetary,
tax, and other incentives applicable only to the businesses located within such designated
zones. China’s development zone policy has been promoted by the World Bank as an
effective instrument for industrial and economic development in developing countries,
4
and lauded as a symbol of the pursuit of free trade. In this study, however, I analyze
development zones as platforms for intergovernmental contestations rather than merely
praising them as examples of successful industrial policy implementation. Development
zones provide an ideal test bed for the study of how the concepts of decentralization and
centralization interact. Originally established by the central government and located in 14
selected coastal cities in China, these zones were nonetheless planned and implemented
by local governments. As the policy expanded to other locations, the competition
between government levels became fierce: central and local units of government
jockeyed for control of policy implementation to attract businesses and secure other
advantages. The fierce competitions over land and resources have driven local and central
governments into extended rounds of negotiation; development plans for these zones and
the cities in which they are located has often been revised repeatedly. As a result, the
zones have drifted away from fulfilling purely economic functions and have become sites
of political and economic conflict across subnational boundaries. If studied as negotiating
platforms rather than merely outcomes of industrial policy, China’s development zones
can open a new window to examine the multiscalar, multi-level competitive and
collaborative intergovernmental interactions through which governance is enacted in
practice.
In his investigation, Agamben asked a further question: If power is force and
capacity of action, why does power need glory—ceremonies, acclamations, and protocols?
The answer, which is also hidden in the genealogy of the economic governance, is a short
but powerful one: glory needs glorification. Acclamation legitimizes and justifies power.
In modern society, acclamations and doxologies take another form—public opinion.

5
This answer inspired a rethinking on the subject of planning and planners’ roles in
an authoritarian regime, as well as in developing countries where meaningful public
participation in governance is restricted. Public opinion often functions as acclamation in
a democratic society; this same role is performed by planners and other technicians in an
authoritarian regime. The proud efficiency of their planning and effectiveness in
influencing implementation are not the results of profound techniques, but rather the
political power acclaimed in the plans. This realization suggests that planning and
planners’ practices should explore other directions, which I will discuss more in the last
chapter.
The research is structured as follows. Chapter 2 will introduce the context of
China’s economic development and Special Economic Zone policy. It aims to demystify
the various theses on what contributes most to China’s development—centralized
wisdom or innovative decentralized autonomies—by showing that decentralization and
centralization have appeared interchangeably in the reforms. Chapter 3 continues to
explore the theoretical framework. It introduces major debates in development studies
over the past several decades with a focus on the state’s roles and state governance
structure. It compares the state-scale literature with the federalism literature and
concludes that state governance structure is more fluid instead of fixed. This chapter ends
with an introduction to Agamben’s theory on the bipolar machine and compares his ideas
about the relationship between power and acclamation to Habermas’s ideas about
communicative action, along with other scholarly critiques on Habermas’s work. The
discussion leads to the proposal that negotiations among different levels of government
play a key role in making a malleable structure; that concept is the focus of this study.

6
Chapter 4 will cover the methodologies used in this study, including the original design
of Social Network Analysis and comparative case studies. Chapter 5 will report the
results of the Social Network Analysis and discuss its limitations, which led this research
effort to focus more on case studies. Chapters 6 through 8 will discuss the three cases in
detail; each chapter will conclude with a case summary. Chapter 9 comprises a
comparison of the cases and reports the lessons learned from this study, followed by a
discussion session on proposed actions and avenues for future research and application of
the study’s findings.

7
Chapter 2
China’s Case: Development from Centralization or Decentralization, or Both?
There has long been a debate on whether China’s economic growth is the result of
a strong central state or the efforts of active, business-minded local governments.
Scholars who favor the primacy of pro-subnational government argue that China’s
economic development must be understood in the context of decentralization, looking at
its development through the lens of a series of reforms that transformed the economy
from one based on central planning to a market-dominant model. Scholars who follow
this theory study the behavior of the local states and propose theories about the local
governments. For example, Oi (1995) argued for a local state corporatism model in which
the local state—including the local Communist party and the government—behaves as an
economic actor. Local officials directly participate in the management of local firms. The
local state extends through neighborhood, work unit, and village levels and thus relies
heavily on the existing networks of the local bureaucrats. The upper level incentivizes
each lower level, as these sub-units can keep a portion of any revenues generated from
business development in their area. This structure of governance can be seen as a
reflection or model of a multi-level corporation (Oi, 1995).
Meanwhile, scholars who credit China’s growth to the central government usually
base their theories on the developmental state literature. In the developmental state
literature, a strong national government implements effective industrial policy and
planning, which subsequently produces growth. Typical examples include Japan
(Johnson, 1981), South Korea (Amsden, 1992), and Taiwan (Wade, 1990). In this view, a

8
strong central state that exhibits a credible commitment to development will closely plan
and guide sector-oriented industrialization. When examined in the context of this
literature, China owes its economic development mainly to the actions of its central
government, even after the start of reform and decentralization (Bolesta, 2007).
The literature on market-preserving federalism can be seen as a compromise
between the two poles of decentralization and centralization. In this view, the central
state acts as a secondary market regulation enforcer, but subnational governments remain
the primary authority over the local economy. The power to regulate the local market is
reserved for these lower-level governments (Montinola et al., 1995; Parikh & Weingast,
1997; Weingast, 1995).
However, the relationships between the central and the local governments are not
fixed. Scholars who study China have recognized a trend of recentralization in a variety
of policy arenas in the latter part of the reform era. With respect to economic
development policy, China’s central government, though fragmented, “reserved the right
to assume an active role in shaping the developmental trajectory” of a number of
industrial sectors, as shown in Oh (2013)’s study of the automotive sector. In
administrative affairs, Mertha (2005) used the term “soft centralization” to describe a
trend of recentralizing the bureaucracies to the province level in the early 2000s. In this
system of recentralization, the administrative departments of each local government are
directly guided by the department handling the same administrative function in the upper-
level (provincial) government, which makes it more difficult for the municipal and lower-
level governments to manipulate administrative functions. In 1980s, decentralization
reforms shifted the power balance on fiscal matters toward the subnational governments;

9
as a result, the central government lost its control over fiscal redistribution and its ability
to command obedience from municipalities was limited. But after 1994, the central
government regained its fiscal power through tax-sharing reforms (Oi et al., 2012). In the
2000s, the central government implemented further recentralization by eliminating the
agricultural tax and replacing lost tax revenues at the local level through fiscal transfers.
During the same period, central planning introduced binding targets into the 11th Five-
Year Plan, concentrating on the most controversial policy fields, such as environmental
protection and land management, in order to claim the leading role and supreme authority
in these areas (Tian, 2010).
Central planning has not fallen by the wayside as a result of decentralization;
rather, the concept of central planning has gained more currency and is being treated
more seriously than ever in the field of development planning in China (Naughton, 2013).
In the 2000s, China’s central government backed the development ambitions of the
country’s regions and granted discretionary policy-making powers to the subnational
governments through macro-regional programs such as the Western Development Plan
and Northeast Reinvigoration campaign (Heilmann & Melton, 2013). Central planning
extends beyond launching large regional development plans through the country’s central
plans, however, making the central planning process more complicated. Creating the 12th
Five-Year Plan, for example, comprised 11 steps, including: a mid-term evaluation
performed in 2008; early-stage research conducted from 2008 to 2010; a summit on
“Basic Thinking Behind the National Twelfth Five-Year Plan” in 2010; the CCP’s
“Suggestions of the CCP Concerning the Making of the Twelfth Five-Year Plan for the
National Economy and Social Development” in 2010; approval of the “Suggestions” in

10
2010; the drafting of an “Outline of the Twelfth Five-Year Plan for the National
Economy and Social Development of the PRC” in 2010; a feasibility study provided by
the National Plan Expert Commission in 2010; extensive solicitation of internal and
external opinions from 2010 to 2011; the National People’s Congress’s deliberation over
and approval of the “Outline (Draft)” in 2011; the official announcement of the “Outline”
in 2011; and the implementation of the plan from 2011 to the present (Hu, 2013). The
local regions were consulted during the making of central plans on these regions, but
eventually the central government holds the power to direct the local to envision a future
of the area (Heilmann & Melton, 2013). A general account of the center-local
relationship is shown in the following.
2.1 The Myth of Central Control
A myth surrounds China’s central government: that it is the absolute power in the
country, able to retain complete control even after decentralization. This is a fallacy for
two reasons: first, as will be shown, the reform period of the past three decades has not
been a unidirectional process of devolving control. The two periods of fiscal
decentralization constructed different fiscal relationships between the central and the
subnational governments, and the second period actually intensified the control by the
central government. Second, the control and incentive mechanisms put in place through
this process have not given the central government absolute power. The decentralization
process has created competition for power between the subnational governments and the
central government. Circumvention of rules and collusion among different levels of
government have further complicated the issue, as will be discussed in this study.

11
2.1.1 Fiscal reform and administrative decentralization, and the craving for land
Fiscal decentralization in China has taken place in two distinct periods. In the first
period, local governments were given more autonomy by being allowed to keep most of
their revenues. In this period, which began in the early 1980s, the central government
implemented a revenue-sharing system, in which local governments collected taxes at
rates determined by the central government. Then, according to independent contracts
between the central government and the provinces, the provinces would send a
percentage of their tax revenue to the central government in the form of remittances. To
incentivize subnational economic development, the central government allowed the
majority of tax income to be kept at the provincial level, with the exception of a few
provinces and provincial-level cities. Poorer provinces were allowed to retain a higher
percent of tax income and also received revenue transfers from the central government.
Provincial governments were responsible for approving the budgeting plans of the lower-
level governments, including the municipal and county levels (Bahl & Wallich, 1992;
Bahl & Linn, 1992).
The second period of fiscal decentralization began with the fiscal reforms of 1994,
which were triggered by a series of serious fiscal challenges to the central government.
As the first period of decentralization was implemented over a period of 10 years, the
central government gradually sank into a fiscal morass, developing serious budgeting
problems; moreover, it faced a loss of control of those provinces that were withholding
most of the development dividends. In 1992, the total national income was 348 billion
yuan ($58 billion)—only 98 billion of which was remitted to the central government. But
in that same year, the central government had expenditures totaling 117 billion yuan

12
($19.5 billion). With a deficit of 20 billion yuan to cover, the central government’s only
option at the time was to borrow money from the more economically prosperous
provinces. During the annual national fiscal conference, the central government held
negotiations with the provincial governments that were unwilling to lend to the center, as
they expected that the center would never return their money. In 1993, the central
government’s tax income decreased to 96 billion yuan but expenditures increased even
more, to 131 billion yuan1. The larger deficit further threatened the fiscal stability of the
central government and the awareness of a looming fiscal crisis spurred the central
government’s sense of urgency in the matter of implementing a new round of fiscal
reform.
Starting in 1994, China adopted a new fiscal and tax assignment system. Large
tax items, such as income tax, were directly collected by the central government through
that body’s State Administration of Taxation. As a result, local revenues from taxes
decreased dramatically. The reform also weakened local governments’ negotiation
autonomy with businesses, as previously, local governments could lower companies’
taxes at their discretion, using a case-by-case methodology in order to attract investors.
This second period of fiscal reform, although described by some scholars as
implementing a Western-style federal fiscal system (Yang, 2005), was actually a
recentralization process that targeted taxation authority. The reform decreased the
subnational governments’ spending flexibility but strengthened the central government’s
ability to generate revenue and monitor taxation and, thus, reinforced its control over
1 Data were retrieved from the National Bureau of Statistics of China at:
http://data.stats.gov.cn/workspace/index?m=hgnd

13
China’s economy. The central government’s share of budgetary revenue rose from about
20% in 1993 to 55% in 1994, as seen in Figure 1.
Figure 1. Central and local shares of revenues and expenses, 1980–2011. Source: Data from
National Statistics Bureau (11/22/2014).
Parallel to this fiscal reform, the central government shifted more responsibility
for public expenditures to the subnational governments. If the previous revenue-sharing
system can be seen as a carrot, in which the subnational governments were given
incentives to develop their local economies to get a larger share of development
dividends, then fiscal reforms and increased responsibility for public expenditures can be
seen as sticks, antagonistic policies meant to encourage the subnational governments to
compete with each other to sustain the operation of local governments. However, at the
same time, to ease the strained relationships and push forward both administrative and
fiscal reforms, the central government allowed the local governments to keep fees from
0%
10%
20%
30%
40%
50%
60%
70%
80%
90%
100%
0%
10%
20%
30%
40%
50%
60%
70%
80%
90%
100%
19
80
19
81
19
82
19
83
19
84
19
85
19
86
19
87
19
88
19
89
19
90
19
91
19
92
19
93
19
94
19
95
19
96
19
97
19
98
19
99
20
00
20
01
20
02
20
03
20
04
20
05
20
06
20
07
20
08
20
09
20
10
20
11
Central's share of Revenues Local's share of Revenues Local's share of Expenses

14
land sales at the local level, thus compensating them at least somewhat for the increases
in administrative and other expenditures.
Subnational governments with unstable finances began to rely heavily on land
sale fees under this system (Figure 2). Under the current Budget Law, a local government
can only “live within its means”—that is, it can only use as much money as it has readily
available, and must budget based on balancing income and expenses. Local governments
are not allowed to run deficits, nor are they permitted allowed to issue local bonds. Land
sales, then, have become the means for local officials to make ends meet. From 2000 to
2012, urban built area increased by more than 100%, and income from land sales
increased 4500%. Beginning in 2009, revenue from land sales increased dramatically. In
that year, the average rate of increase among the 20 cities with the highest land sales
income was 251%, ranging from 56% to 617% (“2009 National Ranking for Land Sale
Income”, 2010). In 2010, land sale income continued to increase, accounting for 77% of
the local revenue income. In the first three quarters of 2013, the average price of land
sales increased by 70% compared to the same time period in 2012. Moreover, in the first
three quarters of 2013, the total income from land sales in 300 cities was 2.111 trillion
yuan, compared to the previous year’s 1.244 trillion yuan, an increase of 70% (“National
Land Selling Revenues,” 2013). Among the 10 cities with the highest land sales income,
Shenzhen and Guangzhou ranked as the top two, with increases of 475% and 431.2%
respectively (Ibid).

15
Figure 2. The ratio of land sale fees to local revenues, 2001–2010. Source: 2001–2010 China
Land Resource Statistical Yearbook and 2001–2010 China Statistical Yearbook. (Note:
According to standard accounting rules, land sale fees are counted as “income beyond budget”
and are not counted as part of local revenues. Thus, the ratio presented is a comparison of the
quantity of the income under the two items and cannot be interpreted in the form of “A takes x%
of B.”)
2.1.2 Land control
Since implementing the previous round of fiscal reforms, the central government
has tightened its regulatory control over land use, especially in the case of rural land.
Under the current law, the Land Management Act (1998), each level of government is
required to submit a Land Use Master Plan every five to ten years for authorization by the
central government. This plan must be made in accordance with the national Five-Year
Plan. In these plans, the ability to provision land and the ability to grant land use for
construction projects are designated according to the assigned land development quotas
passed down from a superior level of government. Without land quotas, local
governments are not allowed to grant permission for new construction projects. These
land quotas are centrally controlled and assigned at the top level by the central
17%
28%
55% 54%
39% 42%
51%
34%
49%
77%
0%
10%
20%
30%
40%
50%
60%
70%
80%
90%
0
5000
10000
15000
20000
25000
30000
35000
40000
2001 2002 2003 2004 2005 2006 2007 2008 2009 2010
Land selling fees(100 millionRMB)
Local Revenue(100 millionRMB)

16
government’s Ministry of Land and Resources, then assigned to the provincial
government, which then makes assignments to lower-level governments. Land quotas are
highly restricted and it is supposedly difficult for lower-level governments to increase
quotas at will. Moreover, the monitoring system is also strict. The central government
established nine regional bureaus of land supervision, which combine several provinces
and cities to create jurisdictions; the bureaus are directly under the authority of the central
Ministry of Land and Resources. This independent system makes it difficult for any
single subnational government to influence or corrupt the land supervision system
(Interviews, July–September 2013). The system for land development and control is
highly centralized and, theoretically, it should enable the central government to tightly
control land use despite previous decentralization.
In addition to implementing a centralized land control system and strict land
control rules and laws, the central government also controls land development through
temporary restrictions. In 2003, the General Office of the State Council issued the
“Urgent Circular on Suspending the Authorization of All Types of Development Zones”
and the “Notice of Clearance and Rectification of All Types of Development Zones and
Strengthening the Administration of Land Use for Construction Projects” to tighten its
control of development zone land use. As a result, in 2004, a large number of
development zones were closed. Guangdong province closed 397 development zones and
reduced its number of zones to 102 from 499, a reduction of 80%. The amount of land
earmarked for development zones was reduced from 339,907 hectares to 101,708
hectares, a reduction of 70% (Xinhua Net, 2004). In 2005, the State Council sent out a
notice, “Notice of the General Office of the State Council on Forwarding the Opinions on

17
Promoting the Further Development of State-Level Economic and Technological
Development Zones,” which further restricted commercial and retail development within
the development zones and forbade real estate development in the zones. “The Measures
for the Management of Income and Expenditure from the Assignment of the Right to Use
State-Owned Land” were enacted in 2006, and the central government specifically
forbade any practices that sold land at zero or even lower than zero prices.
Although the central government has tightened the restrictions on land use and
has increased its administrative capacity in this area, in reality, local governments still
use a variety of tactics to expand their land quotas and to avoid being punished for land
use violations. For example, one common tactic is to set up more development zones and
apply for a zone level upgrade, moving from a local zone to a provincial or even national
zone. When creating land use plans, development zones usually enjoy the top priority for
construction quota assignments. National level zones have the highest priority and can be
used by the host province and the host municipality as leverage to ask for more land
quotas. Lower-level zones have secondary priority, but still can be used by the lower-
level governments to earn more land quota allotments. As long as the local officials can
prove that the outcome of economic development in their area is good or that the
intention behind the requested quota is “good,” meaning that the officials are not making
the request to further their “private interests,” no official will be caught or punished for
such bending of the rules (Interview, September 2013).

18
2.1.3 The official performance evaluation system
To explain China’s growth, a number of scholars have sought to understand that
growth’s relationship with the design of the official motivation mechanism. They claim
that the officials who were able to promote economic growth were rewarded with
promotions. This system has been credited for its efficacy in creating a development-
oriented environment in which officials compete for top results, thus contributing to
China’s GDP growth. For example, Hongbin Li and Li-An Zhou used a tournament
model to explain how this system works to promote growth (Li & Zhou, 2005). From this
perspective, scholars usually claim that the central government therefore has the power
and resources to influence the local governments (Yang, 2006; Edin, 2003).
However, this claim ignores the fact that promotions and appointments are often
manipulated by subnational officials. The relationship between growth and promotion is
not as linear and direct as this model might indicate; passing a qualifying exam or having
an outstanding history of achieving growth and satisfying other requirements does not
necessarily guarantee promotion, nor does the failure to do these things always equate to
career stagnation. There are numerous tacit rules around promotions, compounded by the
widespread phenomenon of buying and selling government offices at the subnational
level (“Central Office about Ratifying the Buying and Selling Office Phenomenon,”
2010). Due to the complexity of the issue, the central government does not have the
necessary power or resources to closely monitor every level of the government and
influence the appointments of lower-level officials. The Official Performance System
may be one of the factors that contribute to the central government’s power to control and
motivate lower levels to achieve growth, but such power is limited.

19
Even if the performance system does provide some motivation to promote growth
at the local levels, it is difficult to control the quality of the growth spurred by these
incentives. It could be argued that local officials have a high incentive to falsify their
local GDP in order to gain high rewards, political and economically; this turns the
recorded GDP into an illusion of prosperity. For example, in some western provinces, the
index of GDP accounts for about 30% of the total performance evaluation of a local
official. In addition, every 0.1 point increase in GDP earns that local official 1,000 yuan.
These strong incentives create an environment in which the temptation to falsify
performance data is strong. Indeed, over the past 12 years, the sum of the reported
provincial GDPs has exceeded the official national GDP. According to the national
census, the difference between the official national GDP and the sum of provincial GDPs
was as high as 3,000 trillion yuan in 2004, a gap of 19% (China Business, 2013).
There are also other ways to circumvent the performance evaluation. Zhou
Xueguang (2009) documented in detail how local village officials collude to avoid
punishments from the upper government and to meet the target of being an
environmentally friendly village. He also argued that the performance system has
functioned as “goal displacement,” rather than providing motivation for good policy
implementation (2009). The lower the level of a government body, the heavier its
responsibilities for meeting evaluation targets. Local officials usually have to focus on
meeting their targets through any means possible rather than giving much thought to the
consequences of violating rules and ethics. An official I interviewed said that this is like
“thousands of threads upon one single needle.” (Interviewee, August 2012) That

20
metaphorical needle is the lowest government level, which has to do whatever it takes to
meet evaluation targets.
2.2 Decentralization and the Development Zone Policy
The development zone policy opened a door for local governments to appropriate
land on the outskirts of the cities. Local governments experience a great deal of pressure
from the central government to develop their economies: official performance evaluations,
along with the promise of punishments or rewards, affect local efforts, as do demands to
increase local GDP and attract businesses. This motivates the subnational governments to
establish development zones. More importantly, however, development zones make it
easier for the local governments to get authorization from superior governments to
requisition land and to improve their construction land quotas. Because some of this land
can be sold to real estate developers, cities seek to expand their quotas through any means
possible, so as to increase revenues and cover their increasing administrative expenses.
Local officials’ private economic interests also factor into the subnational governments’
eagerness to set up development zones and obtain more land cleared for sale. This focus
on obtaining and developing virgin or “raw” land has a number of consequences. On the
one hand, the local governments develop the raw land and offer it at low prices to
industrial businesses in order to attract industry to their region. On the other hand, local
governments also try to expand their development zones and sell housing and commercial
land around or even within the zones at high prices to compensate for the deficits created
by developing raw industrial land (“Why Is It So Hard To Regulate Development Zones?,”
2003). For example, industrial land in Zhejiang was sold at 86% of its development price,

21
on average, in 2009. This number is even lower in other regions (Huang, 2010). Local
governments are usually willing to lose 100,000 yuan per mu (666.67 square meters) to
draw investment to their region. They compensate for the loss in revenue by selling other
land to real estate developers at inflated prices (Tao and Wang, 2010).
In addition to selling land, the subnational governments have other means of
boosting their revenue and promoting growth and development. Many coordinate with
the banking sector to secure infrastructure investments, promising to pay back these
investment funds with revenue from future land sales. Thus, the subnational governments
become the primary promoters of the capital investment cycle, with land acting as the
main carrier of interest. China’s loose land management policies eventually led to at least
two instances of “zone fevers,” or development zone bubbles—one in the mid-1990s, and
another in the early 2000s—in which large areas were enclosed and earmarked for
development zones, but never actually utilized. Little of the land in these designated
zones has actually been developed, leaving large swaths of land to lie fallow, reserved for
future speculation by local governments and private companies (Cartier, 2001; Yang &
Wang, 2008; Yang, 1997; Yang, 2005). Of the 3,837 development zones in the country,
only 232 (6%) were approved by the State Council; 1,019 (26.6%) were approved by the
provinces. The remaining 2,586 zones (67.4%) were city-, county-, or even village-level
development zone. In 2003, the total area of development zones in the country on record
was 36,000 square kilometers, which exceeded the total city and town construction land
area at that time (Ren, 2003).
The competition for industrial businesses is so fierce that many of these
development zones are simply left idle. In a study conducted by the Ministry of Land and

22
Resources, 43% of designated development zone land was found to be left idle (“Forty-
Three Percent of Development Zone Land Lingering,” 2004). In these cases, the central
government bears most of the costs, and also faces challenges from the discontent of
peasants whose land has been appropriated, as well as challenges imposed by inefficient
use of land resources. In a 2006 study on 87 development zones in six provinces/cities by
the central government’s National Audit Office, it was found that more than 60
development zones violated the central government’s mandate to sell 78,730,000 m2 of
land as industrial development land, costing China 5.6 trillion yuan in land sale income.
Further complicating the situation, some local governments contracted with private
parties to sell acreage at a normal price, then provided rebates or other fiscal
compensation later, an alternative practice sometimes used to sell land at a lower than
authorized price (Li, 2006).
Viewing decentralization as a dynamic process, which involves frequently
changing relationships between the central and subnational governments, can reconcile
the ideological split on the question of who is responsible for a country’s economic
growth and development. Development strategies at both levels change according to the
relationships between parties. Therefore, any analysis of economic development
strategies and their effects must be set against the backdrop of changing
intergovernmental relationships in the course of decentralization.
2.3 Summary
In the general field of China studies, the roles of the state, the central government,
and the local governments have been intensively studied and questioned. Viewing the

23
nation’s political landscape as fragmented and disorganized is misleading; it gives only a
partial view of the political reality, particularly in light of the centralized power of
determination held by the Chinese Communist Party. The interactions between the
nation’s centralized and decentralized powers present different dynamics in different
phases of development, especially in the policy realm, creating a dynamic development
environment. This poses a quandary: The authoritarian regime must maintain its
legitimacy through political and economic means; however, pursuing control in these
areas deepened the regime’s legitimacy crisis by destabilizing its control in other ways.
This study was motivated by these debates and by general confusion about
China’s governance structure and its impact on the country’s development. The changing
policies that have periodically granted and revoked the autonomy of the subnational
governments paint a complicated picture of intergovernmental relationships, refuting the
tendency to portray governance restructuring as a one-time transfer of authority.
China’s development zone policy provides a way to study the ongoing
transformation of these intergovernmental relationships. Originally intended to promote
decentralization, the development zones have faced constant challenges from the
changing policy environment affected by the central government’s dictates, including its
efforts to rearrange fiscal relationships and intensify land resource administration. While
the local governments feel threatened by a loss of autonomy, the central government is
also confronted by the conundrum of losing control over local speculations. An example
of this tension involves the spiraling local debt within China, as local deficits have
skyrocketed in recent years, a problem exacerbated by the restructuring of revenue
allocation, increased economic targets, and devolving administrative costs. A more

24
rigorous theoretical framework is required to develop a meaningful understanding of the
dynamics between the two poles of decentralized and centralized power and to create
action plan for dealing with this dynamic environment, which will be explained in the
next chapter.

25
Chapter 3
Theoretical Framework: Scale, Bipolar Machine, Glory and Acclamation
This chapter explains the development of the theoretical framework of this study.
In the past several decades, the field of development studies has experienced several
major paradigm shifts. This chapter begins with an overview of the transition from
studying development in terms of constructing economic models to considering it as a
subject of political economy. The state’s role in and capacity for promoting development
emerged as an important subfield of study. A major focus is on the structure of the state,
especially the concept of decentralization, which has played an important part in the
global political reform process during the past three decades. Two major disciplines,
political science and geography, each provide different perspectives on decentralization.
Power and interest struggles are the common themes to both of these perspectives. A key
difference, however, is in how these struggles are portrayed: in a fixed structure or a fluid
form. Finally, Agamben’s investigation into theories of kingdom, glory, and governance
inspires a different kind of thinking on intergovernmental interactions and their
relationships with policy implementation, providing a new angle from which to think
about sovereign power and governance, which has largely been ignored in the debates
about decentralization and centralization.
3.1 State Power and Structure in Development
In general, economic models of growth, from neoclassical to endogenous growth,
share one major characteristic: They all assume that the market functions well and that

26
government intervention is unnecessary unless market failure occurs. In this paradigm,
the government’s role is to allocate public goods that are critical to the economy and to
market establishment. The implied development strategy can be summarized in this
function: economic development equals property rights and contract enforcement, plus
trade openness, plus investment and ideas (Hausmann & Rodrik, 2006). That is,
economic development is the result of openness, investment, and innovation coupled with
minimal intervention that focuses on maintaining and enforcing property rights and
contractual obligations. The state’s very limited intervention should be both broad and
sector-neutral. Studies on growth from an economic perspective attempt to identify the
factors contributing to growth and view these matters in isolation. Factors are not treated
as embedded in a broader institutional framework that enables them to function (North,
1990). However, this perspective has notable limits, particularly when examining
burgeoning economies. Often, the assumption of a functioning market is fallacious: such
an ideal market simply does not exist in developing countries. In fact, no truly free and
self-regulating market system exists. Politics and economics are inevitably intertwined.
The state plays a major role in enabling the market society, and also plays an active role
in managing the market via political decisions that cannot be reduced to strict technical
functions as the neoclassical models imply (Polanyi, 1944).
State intervention is crucial in accumulating capital and enhancing productivity
(Evans et al., 1985). Statists may agree with neoclassical economists that factors such as
capital and technological progress are important, but the main divergence between the
two is how to achieve the benevolent conditions necessary for development. Neoclassical
theorists assume a competitive market, and hence demand that the state play only a

27
residual role in the market. However, statists argue for the reverse: The state takes the
leading role in creating growth, whereas the market is just the means (for growth) and
ends (as an institution) created by the state. Therefore, the emphasis of this realm of study
is on the role of the state: i.e., how state policy and intervention can achieve growth.
Early development studies credited the success of most East Asian countries to a
“strong state” that makes a credible commitment to long-run development—incentivizing
state administrators, designing effective industrial policies, and enacting policies to
stabilize the macroeconomic environment (Yusuf, 2001). Due to these practices, East
Asian countries have often been lauded as the embodiments of the concept of the strong
state. For example, in her study on Korea, Amsden (1992) argued that these countries did
not flourish because they caught up with the technological progress made elsewhere in
the world. Rather, what made the latecomers’ massively successful industrialization
possible was an “interventionist state, large diversified business groups, and abundant
supply of competent salaried managers, and an abundant supply of low-cost, well-
educated labor” (Amsden, 1992). This is because countries tend to industrialize through
learning rather than inventing or innovating—continental Europe and the United States
learned from England in the 18th century, just as Germany learned from England, France,
and the Netherlands in the 19th century (Amsden, 1992). Wade (1990) made similar
arguments to Amsden’s after studying Taiwan. The role of Taiwan’s government “has
gone well beyond the practice of Anglo-American economies and the principles of
neoclassical economics, while at the same time resource allocation has occurred primarily
through vigorously functioning markets” (Wade, 1990, p. 4); this was indeed a result of
the government’s credible commitment to development (Wade, 1990). Contrary to what

28
the neoclassical model and endogenous model indicate, scientific advancement generates
a larger gap between strong and weak nations in their relative income levels and
technological capabilities (Amsden, 1992).
The role of the state in promoting industrialization and development can also be
investigated from an industry perspective. Positive state intervention is usually described
as having succeeded in picking winners, and therefore evidence of state intervention is
often sector-oriented (Wade, 2009). For example, Amsden (1990) studied the automobile
manufacturing, ship-building, and steel-making sectors; Evans (1995) studied the
computer industry in Korea, Brazil, and India. Until recently, sector targeting was still
advocated by some scholars. For example, Hausmann and Rodrik (2006) argued that
development involves both expansion and improvement of productive capabilities; this
requires specialized inputs that cannot always be provided by the market. A lack of
planning, along with a lack of specific inputs to economic activity, will constrain the
economy’s structural transformation and development. “It is not that choosing is
desirable. It is regrettably inevitable.” (Hausmann & Rodrik, 2006, p. 25) However, in his
earlier work, even Rodrik himself doubted whether countries are capable of exploiting
new opportunities and upgrading their targeting capabilities due to the increasingly fierce
competition in global market (Rodrik, 2004). In addition, some scholars have argued for
an evolutionary state, one that keeps experimenting and avoids picking any winners. In
this view, the state should focus on building up institutions that allow appropriate shifts
in development trajectories (Klimenko, 2004; Moreau, 2004). Taiwan nurtured just such
an environment; the government did not pick winners, but rather made winning possible

29
by creating a friendly economic environment conducive to the development of new
industries (Wade, 1992).
Most of these arguments regarding state intervention and the “strong state” depict
the state as a unified entity with coherent interests. Inside the appearance of unity,
however, the character of the state as an “instrument of domination” is determined by the
interrelations of various state apparatuses and class factions. The state is an “arena of
social conflict” and a coherent “corporate actor” that tries to act as an integrated entity to
protect the common interests (Rueschemeyer & Evans, 1985, p. 47). This is a difficult
balance to strike: Acting as a “corporate actor” will affect the state’s autonomy, and thus
will reduce its capacity for effective intervention; however, effective state intervention
will exacerbate social conflicts. Maximum efficiency requires decentralization, but the
same process creates the problem of “corporate cohesion and coordination”
(Rueschemeyer & Evans, 1985, p. 56). The construction of a state involves not only the
establishment of a formal organization chart characterized by hierarchical structure and
incentives, but also a long-term building of institutions that reshape the participants’
goals, priorities, and commitments. The latter enterprise has far-reaching consequences,
especially for the state’s capacity of intervention, which must be explained through the
historical character of the bureaucratic apparatus (Rueschemeyer & Evans, 1985, p. 59).
Rueschemeyer and Evans’s (1985) brief discussion on the problematic relationship
between centralization and decentralization serves as a bridge that now leads us to the
other literature that provides a foundation for the theoretical core of this study.
3.2 The Center-Local Relationship from a Divided View of State Power

30
The dilemma of decentralization and centralization was reviewed in an earlier
work by Riker (1964). In this classic work, the origin of federalism was described as a
bargaining process from which a unified desire emerged, motivated by gaining public
goods such as security and a common market, which pushed compromises upon the
various subnational governments. Riker (1964) explained that this process of compromise
happened when the central government lacked either military or ideological capacity.
Assuming that a political center prefers direct control, a strong military and political
center will tend to exhibit a unitary governance structure rather than a federal structure
because it has the capacity to do so; that is, a central government with a strong military
and ideological foundation has no need to compromise with subnational governments, as
it simply exerts its overwhelming authority to make decisions. Therefore, federalism, as a
result of compromise, is only established by a somewhat weak center.
Riker (1964)’s assertion calls attention to two dilemmas that exists in all
federations. The dilemmas, as described by de Figueiredo and Weingast (2005), are that a
federal system needs to prevent subnational units from becoming freeloaders and the
center from becoming a leviathan. Resolving these two dilemmas, which persist
throughout the system’s evolution, is fundamental to the sustainability of a federal system.
Discussions on the two dilemmas have engendered a stream of literature on safeguarding
federalism. This issue is, according to Bednar (2011), fundamentally a question about the
distribution of authority: What are the feasible ways to distribute authority to enable the
accomplishment of societal goals? This question will yield different answers if asked in
different historical and institutional contexts, particularly when one diverges from the
United States and European countries, which are the examples used in the original

31
federalism literature. Although decentralization and federalism are not two overlapping
concepts (see the discussions in Linder (2004) and Blume & Voigt (2008)), the dilemmas
faced by federalism show the complexity of balancing power between the central and
subnational governments.
Developing countries have often taken quite different paths from developed
countries to achieve decentralization. These countries, including China, India, and other
South Asian nations, were decolonized or went through decades of war in the early to
mid-20th century; they were highly centralized before the implementation of
decentralization reforms. Decentralization in these countries was initiated as a matter of
policy reform rather than an endogenous bargaining process. It was urged by free-market
economists and donors through international organizations, and such reforms often
served as veils for promoting a number of other ideologies, including anti-centralized
state, neoliberal, and even anti-market ideologies, in an attempt to bolster self-governing
local communities (Bardhan, 2002). Because the dissolution of central power in these
nations had a different context from the classical view of federalism as an outcome of
endogenous bargaining, these cases mandate a reexamination of the power relationships
inherent in their governance structures. Such a reexamination, using the unique contexts
of these newly decentralized countries, is critical to understanding the challenges they
face moving forward.
When decentralizing what was previously a highly centralized system, the state
has to face a contradiction in its needs: While the central government might recognize the
need of the subnational governments to have autonomy in their affairs, there is also a
need for the central government to have the authority to build institutional infrastructure

32
at the national scale. In these cases, the impetus to have a federal government comes from
the center, but the central authority is responsible for setting up the very decentralization
structure that will dissolve its power. This contradiction provokes this central authority to
attempt to hold on to some vestige of power, often reclaiming its original authority when
necessary after decentralization. To manage the process of decentralization, the central
government must propose how authority will be redistributed—what gets done at what
level of government, and how each level of government gains its power, whether top-
down (e.g., official appointment) or bottom-up (e.g., election). The national framework
also needs to provide incentives for the subnational governments to avoid shirking their
duties to the federal group, freeriding, or remaining intransigent or noncompliant when
cooperation among subnational units is needed. However, the central government,
accustomed to complete domination, will often build escape mechanisms into such
frameworks, seeking an institutional, codified means to keep its power and create a
mechanism to legitimize its possible future intervention in federal matters. Examples of
such mechanisms are evident in a number of cases. Some states reserve the right to make
crucial decisions for the central government, rather than devolving decision making to the
subnational governments, turning them into the branches of the central state (see
discussions on Indonesia by Smoke & Lewis (1996) and Nepal and Senegal by Agrawal
& Ribot (1999)). Other states, acting more delicately, reserve for the center the power to
set the national agenda and periodically reshuffle the relationships between levels of
government to reinforce the center’s powerful image in front of the subnational
governments. The central government can do this by enacting new decrees and reforms,
as has happened in China a number of times during the reform era, which began in the

33
late 1970s. No matter what means are used to preserve the power of the central
government, however, the urge to cling to power and to reclaim it when necessary haunts
the decentralizing nation and is reflected in the conflict-riddled and constantly changing
relationships between central and local governments.
Some scholars argue that to sustain decentralization in a country in which a free
electoral system is absent, the central government needs to provide economic and
political incentives. An example in China that has been widely discussed is the
implementation of a performance evaluation mechanism as an incentive. When economic
targets are met, local officials are rewarded with higher personal bonuses and promotions.
This system can be understood as a revenue-sharing contract (Oi, 1992; Montinola et al.,
1995; Qian & Weingast 1997; Weingast, 1995; McKinnon, 1997) or a tournament
mechanism (Li, H. & Zhou, 2005), in which the central government implements a system
that rewards those officials who increase the GDP of their governed territory and
punishes those who are not able to do so. In this incentive mechanism, the central
government uses fiscal and administrative decentralization to dole out power, but retains
authority over personnel appointment and promotion, enabling the central government to
closely observe and control the behavior of local officials.
The discussion on implementing incentives has its intellectual origin in the
principal–agent literature. Originally treated as a problem of economic organization due
to imperfect information, the principal–agent problem has been focused on “how one
individual, the principal (say, an employer), can design a compensation system (a
contract) which motivates another individual, his agent (say, the employee), to act in the
principal’s interests” (Stiglitz, 1987). However, when applied to public bureaucracy, this

34
framework becomes problematic: The theories do not align with the problem’s
application in political structures. While firms have specific and quantifiable goals for
improving efficiency, goals in the public sector are often more ambiguous and harder to
quantify and evaluate (Moe, 1984; Perry & Rainey, 1988). A simple example is when a
government sets goals involving both increasing GDP and protecting the environment.
Clearly, the public sector faces a more complicated set of options in prioritizing its
sometimes-contradictory goals. Additionally, the public sector has to deal with budget
limits that can restrict material rewards for its employees. Political rewards may not
sufficiently motivate officials when the public sector tends to attract people who care
more about job security than career development; finding the correct balance between
tangible, political, and career rewards can be challenging for a government. When
restricted to its origins in the principal–agent literature, analysis of the central–local
government relationship is reduced to researching incentives and monitoring mechanisms
for dealing with local disobedience, and the relationship between the central and local
governments is only understood in the context of the relationship between a supreme
power and noncompliant elements.
An alternative way to look at the central–local relationship, as proposed in this
study, is through power transfer. Once subnational governments are given a certain level
of autonomy, it is difficult to revoke this power. No matter how minor the
decentralization effort, nor how little power the local government has, subnational
governments tend not to relinquish autonomy once it has been granted. Instead, they
cultivate their leverage and negotiate with the center for more power—or at least to
maintain their current power. Thus, the relationship between the central and subnational

35
governments is perpetuated through a constant negotiation process, motivated by the
desire to gain and maintain control. The negotiation may not be explicit. Implicit
negotiation, exercised through means such as tacit rules and flexible interpretation at will
by either party, becomes a more common tactic in this system. In this form of negotiation,
the central government has the advantage of holding the power to set the nation’s agenda,
but the subnational governments strive to earn more leverage to negotiate rather than
remaining unwaveringly compliant with the rules set by the center. The desire for power,
therefore, will distort the way an incentive scheme usually works. When the incentive
offered is in accordance with the subnational government’s desire to earn more leverage
and power, it will motivate that government to achieve good implementation results.
However, when the rules threaten to decrease the subnational governments’ leverage,
these rules will be poorly enforced and subject to implicit negotiation; no incentive
proffered by the central government can overwhelm the greater unstated incentive of
retaining autonomy. Therefore, a dynamic perspective, rather than static, is preferable
when analyzing the relationship between the central and subnational governments, taking
into account the constantly fluctuating nature of the balance of power between these
bodies.
From a static perspective, decentralization is understood as a policy meant to
achieve a perfect state of balance between the central and local governments.
Decentralization’s primary goal is to maintain the center’s influence at such a level that it
can enforce coordination among subnational governments while simultaneously
minimizing its intervention in local affairs. The local governments are granted enough
power to be accountable and efficient in managing local affairs and taking responsibility

36
for their citizens. The status of the relationship between the center and the local can be
imagined on a two-dimensional coordinate system in which decentralized power (the
level of local autonomy) is positioned on one axis and federal cooperation (how willing
local groups are to cooperate when dealing with national issues) is placed on the other
axis. The best scenario in a decentralized relationship is a system that is high in local
autonomy, but that also displays a strong cooperative spirit that can be coordinated by a
federal/central government.
However, as discussed, in a highly centralized state, decentralization policy is
actually the trigger for a long series of negotiations between the central government and
the subnational governments. Instead of being in a hierarchical relationship, acting as
principal and agent, the center and the subnational governments are in a dynamic
relationship. Metaphorically, they are playing tug of war, pulling on the opposite ends of
an elastic rope. The effort requires not only strength but also sometimes elasticity to
avoid over-stretching that rope, which represents the allocation of power and resources.
The analysis of the relationship should be focused on how each party has acted in
different circumstances to maintain authority or gain more power. A dynamic analysis
will understand decentralization not just as a one-time authority transfer, but as an
ongoing transformation of the state that involves a continual restructuring of the
relationships among different levels of governments. By introducing the concept of scale,
the next section will expand the discussion by acknowledging the fluid attributes of such
a power struggle.
3.3 Scaling Processes as Social Processes

37
In the most general sense, geographical scales—local, regional, national, and
global—are the sizes and levels of a space. Taylor (1981) first discussed a “trilogy of
scales” that includes local, national, and global levels. When viewed as size, scale is the
ratio of measurement that is the most efficient way of defining the boundaries of the
space under study. When viewed as level, scale is the hierarchy of layers that are nested
within each other as a system, much like a Russian doll (Howitt, 1998). Generally, scales
taken as levels imply the hierarchical order of authority, power, and priority.
The dimension of space is neglected by much of the social science inquiry into
state power and construction, including in the federalism literature. Space is considered to
be predefined in Weber’s most famous definition of the modern state, in which territory
is viewed as a “given” container (Weber, 1946; Brenner et al., 2003). Agnew (1994)
declared the implicit geographical assumptions made due to neglecting state territoriality
as an object of intellectual inquiry to be the “territorial trap.” The naturalistic explanation
of the state comprises three assumptions: (a) the global political system is assumed to be
composed of bounded, independent, unitary states; (b) the national scale is assumed to be
the primary scale of modern political life and processes operating at different scales are
presumed to not interact (e.g., globalization and local economic development policies);
and (c) the state is a static container of economic and political processes. However, scalar
organization of state space—global, national, subnational, regional, local—is never fixed.
By breaking out from the restrictive spatial container and adding the more fluid spatial
dimension, the scalist perspective unleashes a new way to think about the intertwining
relationship between fixed structure and changing authority boundaries.

38
By opening up a more general understanding of human geography, scales become
the embodiment and expression of social political struggles. Scales do not exist to
categorize social and regulatory processes; rather, they are formation processes in which
particular scales become constituted and dominant (Swyngedouw, 1997; Brenner, 1998,
2004; Peck, 2002). A dominant scale order, called “scalar fixes” by Brenner (1998), is a
temporary equilibrium of geographical hierarchies. The scalar fixes are maintained by the
hegemonic power so that certain interests are privileged and their opponents are
handicapped (Peck, 2002). But as struggles continue and scales are rearticulated, new
orders will be created and new places, spaces, and horizons of action will be formed and
reordered (Brenner, 2004). Scalar relations are power relations and must be understood in
dynamic terms. The production of scales—how a particular scale becomes dominant and
what social processes have been involved in producing the order—tells a story about
power and power relations (Peck, 2002). Therefore, scalist perspectives strongly
emphasize the kinds of politics that produce a fluid structure. This scale production
process has been called “the politics of scale” (Smith, 1992; Brenner, 2001).
3.3.1 Scalist perspectives vs. federalist perspectives on governance structure
A conventional understanding of the relationship between decentralized
governance structure and economic performance takes the formal, fixed structure as a
starting point and sets clear-cut authority boundaries as the base. In his article
“Federalism as an Ideal Political Order and an Objective for Constitutional Reform,”
Buchanan (1995) said that “the domain of authority for the central government … may be
severely limited, while remaining political authority is residually assigned to the several

39
‘state’ units, each of which is smaller in territory and membership than the economy
[emphasis added].” Weingast (1995) discussed a model of federalism, “market-
preserving federalism,” which is also based on such a fixed-structure perspective. As
defined by Weingast’s interpretation of Riker (1964), a federal system is characterized by:
(a) a hierarchy of government, which means at least “two levels of government rule the
same land and people,” each with “a delineated scope of authority” that emphasizes a
“well-defined sphere of political authority,” and (b) a set of self-enforcing federalist
institutions (Weingast, 1995, p. 4). In addition to these primary characteristics, a market-
preserving federal system gives subnational governments “primary regulatory
responsibility over the economy;” ensures a common market, forbidding lower-level
governments from setting up trade barriers; and imposes budget constraints on lower-
level governments (Weingast, 1995). The political structure of the state overlaps with the
entire economy; both are divided into pieces defined by territory boundaries governed by
subnational governments. Economic performance is based on an effective structure that
provides proper stimulus for growth and distributes authority to the governmental sub-
units and individuals, encouraging them to compete to make the best policies for
development. Fiscal federalism is implemented to motivate the subnational units. In order
to maintain its tax base, a subnational governance unit needs to compete to attract
businesses and maintain its population size, as people can “vote with their feet” and leave
a region if their needs are not being satisfied (Tiebout, 1956; Hayek, 1960).
Administrative federalism shifts the responsibility and authority for administration to the
subnational units, which are presumed to possess better knowledge of and be more
accountable to the local population. The main tasks of decentralization in this federalist

40
view are to transfer authority and responsibility from a centralized power to individual
units and to construct the safeguards necessary to maintain such a system.
Intergovernmental relations, then, are mainly the bilateral relations between the center
(federation) and the subnational (constituent states or entities).
In contrast to the federalist perspective, which assumes a fixed structure, the
scalist perspective assumes a fluid and changing governance structure. In this literature,
decentralization refers to the phenomenon in which national governments devolve public
policy responsibilities to subnational administrative units (Brenner, 2004; Pike &
Tomaney, 2009). The emphasis is on the process of the reassignment of power and
responsibility, but not on choosing the levels of governments to which to assign
responsibilities. Decentralization, in this perspective, is seen as a series of state projects
to “empower more flexible, responsive, and effective economic governance” to “boost
local growth” (Pike & Tomaney, 2009). Contrary to the federalist assumption that
preferable societal outcomes can be achieved by perfecting the fixed structure, the scalist
view is based on the observation that societal change is the result of a fluid, rather than a
fixed, structure. As argued by Brenner (2004), “economic development strategies during
the last two decades have not occurred within a fixed institutional framework, but have
been enabled by, and have in turn accelerated, a fundamental transformation of state
scalar configurations.” Following this understanding, policy is not seen as articles (e.g.,
authority and decision-making responsibility) to be divided or as pieces to be distributed
and to be held within smaller containers (e.g., different levels of government), but rather,
policy is seen as being enacted by all levels of governmental bodies at the scale from
which the hegemonic power benefits the most. Instead of taking up different portions of

41
responsibility in a hierarchical order, these different governmental bodies represent the
nation’s interests in fixing and privileging economic activities at a certain scale that
empowers some while disempowering others (Swyngedouw, 1997). Table 1 compares the
main differences between the two perspectives.
Table 1
Comparison of Two Literatures: Federalism vs. State Rescaling
Federalism Geographical Scale (State
Rescaling)
Assumptions
about governance
structures
Structure—municipal, provincial,
central—is fixed and static;
hierarchical levels are the proxies of
power
Scales—local, regional,
national—are fluid and changing;
scale-making is a process of
power contestation (scale as the
mediation of power) Focus of practice Task-assigning to lower levels of
government Process of power dissolution
Intergovernmental
relationships
Mainly competitive; bilateral central–
local (center/subnational,
federal/constituent states)
relationships
Competitive and cooperative;
multiscalar, multi-level
relationships
3.3.2 State rescaling and its limitations in non-Western contexts
Decentralization is broadly discussed in the state rescaling literature. In this
literature, which is primarily based on the cases of Atlantic Fordism economies
(including the United States, Canada, northwestern Europe, Australia, and New Zealand),
government structure is an object of reconstruction in the state rescaling process and
reflects the distribution of power. In the Keynesian Welfare National States’ (KWNS)
spatial form, the national territorial state assumed the primary responsibility for enforcing
homogenization of regional development, with the aim of creating an equally developed
territory (Jessop, 2002; Brenner, 2004). The main characteristic of intergovernmental
relations was centralization, in which concentrated national power defined

42
intergovernmental relations and set the state’s policy agendas. Such policy agendas, set
by the central power and made possible through the channels of local governments, were
oriented toward evenly distributing resources throughout the nation (Mayer, 1991, p. 107
as cited by Brenner, 2004, p. 152). Policy implementation was understood as a top-down
process. National scale was the scale of policy. Local states’ roles were managerial,
subordinate, and centrally determined, with subnational governments functioning as
branches of the central government. State space was nationalized in the sense that the
central national government regulated urban development and committed to regional
balance and even growth (Goodwin & Painter, 1996, p. 646 as cited by Brenner 2004, p.
152).
In the 1970s and 1980s, the KWNS focus on “big government” proved
problematic. The central governments in KWNS had set their goals as full employment,
stable prices, economic growth, and payment balancing; they failed to achieve these goals
and entered a crisis over state legitimacy and loss of state unity. To tackle this crisis, a
new type of state, called the Schumpeterian Competition State by Jessop (2002), emerged.
The Schumpeterian Competition State is intended “to create, restructure, or reinforce …
the competitive advantages of its territory, population, built environment, social
institutions, and economic agents” (Jessop, 2002, p. 96). The KWNS nations that adopted
this model turned from the pursuit of centralization and uniformity to decentralization,
emphasizing customized spatial projects in which the state “transfers various regulatory
tasks away from the central coordinating tier of state power” and establishes “customized,
area-specific institutional arrangements … in specific places or geographic zones”
(Brenner, 2004, p. 97). The “hollowing out” of the national state in this manner dispersed

43
activities of national interest to different levels of government, built up different
relationships with the private sector, and expanded the promotion of economic
development in subnational spaces, turning the local units into “self-promoting islands of
entrepreneurship” (Amin & Malmberg, 1994, p. 243; Brenner, 2004; Harvey, 1989). In
this way, the state became multiscalar, distributing socioeconomic activities among
multiple scales and abandoning the equalization of public resources by concentrating
those resources in particular locations (Brenner, 2004).
In the course of state rescaling, urban regions become the primary sites of state
restructuring. Decentralization and centralization (as in the British case) are means of
“recalibration of intergovernmental relations” (Brenner, 2004) meant to achieve promote
a policy of urban growth, though decentralization is most often used to achieve this aim.
Beginning in the 1980s, spurred by the “Fordist crisis,” national governments throughout
Western Europe have transferred public policy responsibilities to subnational
governments to reduce welfare burdens. National governments began to shift welfare
demands to urban areas and encouraged subnational governance units to assume
responsibility for economic growth. To complete this downward shift of policy
responsibility, national governments established new subnational institutions and
implemented new regulatory activities. In order to motivate the local governments,
administrative decentralization was usually accompanied by fiscal decentralization.
Fiscal pressures, including budget cuts impacting central to local transfer, left the
subnational governments reliant on locally collected taxes, causing the local states to
adopt investment-attracting policies in an attempt to increase tax revenues. The
tendencies toward decentralization were an institutional mechanism to mobilize urban

44
locational policies, as urban areas were made the primary container of growth policies
created by subnational governments. In this view, decentralization is a transformational
process affecting the national state, rather than an erosion or demise of national power.
Here, the state has transformed from a nationalized hierarchy into a policy-centric
multiscalar structure.
State rescaling, if understood broadly as the process of nationalized state space
transformation, can be witnessed across the world. State rescaling “tendencies” refer to
scalar configurations of the state as the result of power contestations and as responses to
the crises that challenge the state’s regulatory capacity and current spatial selectivity;
these tendencies know no geographic boundaries (Park, 2013; Brenner, 2009). However,
scholars who study policy and planning in non-Western contexts find it difficult to apply
the language to the situations of non-Western and developing nations, as the lexicon was
developed with respect to advanced capitalist countries. Though both contexts focus on
transforming state space from nationalized to denationalized, the origins of the
centralized states of non-Western and developing countries are often quite different from
those of advanced capitalist countries. The post-colonial states centralized in order to
build modern states after achieving independence. Consolidating territorial integrity was
a common theme of nation-building in countries such as Turkey and South Korea in the
1960s and 1970s (Park, 2013; Gimm, 2013; Bayirbag, 2013). When struggling to create
integrated national economies, these countries faced challenges of market building and
regulation. Notably, the period during which capital accumulation became stagnant in the
Atlantic Fordism countries was the same period in which capital was expanding to reach
the rest of the world. Non-Western countries, in a developmental state, focused more on

45
concentration rather than distribution of economic benefits and resources; by
consolidating resources under a strong central government, it was possible to accelerate
national economic growth. The “bread spreading” type of industrial development in the
advanced capitalist countries, in which resources were meant to be allocated equally
across subnational territories, did not happen in these developing nations; rather, the
developing state always strategically selected areas in which to concentrate investment
and infrastructure in order to maximize the efficiency and efficacy of its limited resources
(Park, 2013). Therefore, the argument, applicable under Fordism, that the national state is
the preeminent scale for regulation and that decentralization transforms it to different
scales does not readily transition to observations made in non-Western and developing
countries.
3.3.3 A dialogue between the federalist and scalist perspectives
What has been missing from both the federalist and scalist perspectives is a closer
analysis of the constant power struggles that bring about the evolution of governance
structure. Seeing the distribution of authority as the outcome of power contestation, the
scalist perspective focuses on how that distribution occurs without a defined structure
(such as the federal or the local) and sees the distribution of authority as a constantly
changing nexus. But as some scholars have noticed, agency is not the main level and
object of analysis in the body of scale literature. It is unclear whether the diffusion of
power is a deliberate political project or an unintended consequence of neoliberal policies
(Harmes, 2006). For example, it is not clear in accounts of state rescaling how new
interstate relations are formed and institutionalized. Because the literature paid most of its

46
attention to the form of statehood and its transformation, the actual power transfer
mechanism and process was not studied in depth. Without an understanding of the agents
involved in the process, it is problematic to use this argument to understand social change
(Beauregard, 2006).
Both the state rescaling literature and the federalism literature see decentralization
as a process in which a dominant power is typically dissolved. However, although
decentralization does involve a dissolution of power, it is also a process of generating
new power and new conflicts. Dissolving the center’s power also means establishing new
competitors for authority at the subnational levels. In this process, the national
government faces the conundrum of both its dissolving power and keeping its authority.
As discussed in Riker (1964)’s classic federalism dilemma, a federal state must balance
the urge to prevent freeriding and noncompliance by subnational governments with the
need to prevent the central government from becoming too powerful and destroying the
federation. The very competitiveness that such national states wanted to promote through
distributing power engendered threats to the central authority. Subnational powers
compete not only with each other, but also with the central government. Indeed, the
central government created the incentives encouraging local governments to aggressively
expand beyond the scale of their own territories, making it difficult for the central body to
maintain dominance.
In this sense, it is not necessarily true that local governments are the best stewards
of local interests (a concept which is questionable to begin with). Unless the interests of
the local level align with the interests of the local government, local governments do not
necessarily make better policy for the local level than any other levels of government. In

47
other words, unless the local scale best serves the interests of the local government, the
local government, just like other governmental bodies with fixed boundaries of authority,
will seek out scales at which its interests are better addressed. Local governments may
seek a higher scale and wider terrain to achieve greater power, a phenomenon called
“jumping scale” by Smith (1992). However, local governments may also seek lower
scales or create new scales and new spaces that make it easier to preserve or pursue their
best interests. As Swyngedouw (1997) stated, “scale (at whatever level) is not and can
never be the starting point for sociospatial theory” (p. 141). When constrained by the
concept of fixed authority boundaries and levels, scholars cannot properly understand the
dynamics of power conflicts in governance structuring. The question of how governance
structuring affects policy making and implementation outcomes must be addressed within
the context of fluid-scale levels and boundaries that are constantly being rearticulated and
recreated.
Therefore, a dialogue between these two ways of understanding governance
structure can both raise and answer a set of new questions in economic governance: How
do the scales of formal governance structure align and misalign with the scales of actual
governing power and interests? Through what current mechanisms and at what scales are
different interests in economic governance (or other policy areas) competing and
coordinating? What are these interests? And what new governing mechanism may be
revealed in such cross-scale competition and coordination activities? Particularly in
developing countries where the constitutional structure is weak or even absent in
outlining intergovernmental relationships, the federalists’ hierarchical division of
governmental authority is not the best proxy for the power possessed by different interest

48
groups; the fluctuating realm of power dynamics may be better seen as a set of temporary
scalar fixes. Analysis of intergovernmental relationships should be focused on the
interaction of the governmental bodies at different levels, how these bodies present
themselves as the representatives of different scales that best address their agendas and
interests, and how the scales they choose change given different times and situations.
3.4 The Last Piece of the Puzzle
The last piece of the puzzle brings us back to the center–local division. Even if we
admit that the distribution of power is fluid across different scales, we still cannot ignore
the fact that we tend to see a center that seems more powerful and dominant in national
policy making. How do we rationalize the seemingly different power structures? Exactly
what power does the center hold? What power does the local level hold? How is power
differentiated between the two?
In his recent work “The Kingdom and the Glory,” Agamben (2011) set out to look
for a theological genealogy of economics and government. The goal was to demonstrate
how early Christian theology became the paradigm for current economics and
government (Agamben, 2007; 2011). The investigation sought to shed light on what has
been a long shadow cast by a theoretical question regarding modern social life: why
power in the West has taken the form of an oikonomia, “a government of men.”
Agamben argued that the answer lies with the early Christian theologians who invented
the Trinitarian doctrine and tried to reconcile the Trinity with monotheism. In order to
reconcile the two, the concept of oikonomia was adopted, describing a separate sphere of
God and the way God governs the created world. In theology, the Trinity is placed in the

49
oikonomia, but God remains His oneness in His being, just like the father who manages
the household and will not lose the concentration of his power by delegating his son to
run errands or even to take on part of the management responsibility. In this way, God in
His being is absolutely one, but in His economy, He is three.
Agamben (2007; 2011) stressed that two political paradigms springing from
Christian theology had a decisive influence on Western society. One is political theology,
from which derived the paradigm of sovereignty; the other is economic theology,
including the idea of oikonomia, from which derived the idea of government of men. The
former is also the paradigm of absolutism; the latter, of democratic power. For Agamben,
the origin of modern government and its split from sovereignty lies in economic theology.
Agamben was not the first scholar to investigate the puzzle of sovereignty and
government. Foucault, whose work Agamben sees as parallel to his own writing, gave a
series of lectures on governmentality that also looked into how economy was introduced
into political practice. Investigating a later historical period, Foucault reached a different
conclusion from Agamben on the relationship between sovereignty and government
(Whyte, 2013). Specifically, he pointed out that sovereignty and government are clearly
distinguished from each other. The fundamental element of sovereignty is territory, but
safeguarding territory or property is not the same as governing, in which the target of
control is not territory but men and things. The essence of government is “the art of
exercising power in the form of economy” (Foucault, 2001, p. 208). To govern, in its
economic sense of bringing prosperity to the family, means to see to the welfare of the
population. It is an act of setting up an economy at the state level. In Foucault’s view,

50
economy emerged in the 16th century to signify a form of government; it replaced
sovereignty in the 18th century to be the main purpose of the state.
Agamben did not see his own work as discrediting Foucault’s hypotheses, but
rather held that it confirmed Foucault’s theoretical core regarding the Trinitarian
economy and went on to explore the theological implication of the term oikonomia that
was ignored by Foucault (Agamben, 2011, p. 110). What differentiates Agamben from
Foucault on this point is that, for Foucault, sovereignty and government are two distinct
forms of power, but for Agamben, the two are just poles of the same machine. Agamben
(2011) argued that if we look back to the beginning of Trinitarian doctrine, much earlier
time than Foucault’s focus on the split of sovereignty and government in the 18th century,
then we will be able to see that these two powers, popular sovereignty and economic
government, are indeed two poles and the governmental machine is the oscillation
between the two poles. This point harmonizes well with Karl Polanyi (1944), who argued
that economy is embedded in the political realm. The concept disagrees, however, with
the argument for the predominance of the political, which is popular among political
scientists, as in Evans et al.’s Bringing the State Back In (1985). The state and the
economy, just like sovereignty and oikonomia, are inseparable.
3.4.1 The bipolar governance machine: glory and governance
As a starting point, Agamben (2011) showed how the concept of economy entered
into Christian theology as a by-product of the theory of the Trinity. The reason that the
theologians needed economy was simple, according to Agamben: the Trinitarian doctrine
had to cope with resistance to this doctrine within the church, as some were concerned

51
that the Trinity—which represented a monotheistic God as three related entities—meant a
return to polytheism, which was unacceptable. Thus, economy was introduced as a
concept that people of the day could relate to. It described managing domestic business
within a house, applying metaphorically to the workings of God through oikonomia. That
is, the household of God could delegate matters into the realms of three entities through
oikonomia, just as a father in a house can delegate tasks or responsibilities to his sons.
The theological line was then divided into two discourses: one concerned God’s being,
and the other, God’s action—that is, the management of the world; the latter became the
“hidden ontological paradigm of modern governance” (Murray & Whyte, 2011, p. 85).
But how did theologians give the answer to how God governs the world? This
was explained with the doctrine of providence. Providence itself, in theology, has a
double structure. The general law that God created to govern the world is called the
general providence; the details of how this governance is enacted—the special
providence—are entrusted to the angels. And this, according to Agamben (2011), was the
original separation between order and execution. The machine of the divine government
consists of general law and execution. This bipolar machine cannot be divided, because if
it were divided, the result would be an impotent almighty sovereign who can do nothing
with the execution, coupled with a chaotic mess of particular acts of intervention
unshaped by a coordinated policy of governance. Agamben (2011) argued that a
government is possible only if the two aspects can coordinate and coexist in this bipolar
machine. Government, as defined by Agamben, is “the coordination of these two
elements: general law and execution, general providence and particular providence”
(Agamben, 2007, p. 5). Whereas Foucault held that sovereignty and government are two

52
kinds of power and that government has taken the predominant role in modern society
since the 18th century, Agamben argued that the two powers actually rely upon each
other and coordinate in one machine. The two powers coexist and oscillate in one
machine, even though sometimes one pole may be dominant.
The concept of state seems to be closest to embodying the bipolar machine of
Agamben, though current state theory is ambivalent on the issue of the split of the two
powers. The classic Weberian state, as “a set of organizations invested with the authority
to make binding decisions for people and organizations juridically located in a particular
territory and to implement these decisions using, if necessary, force,” (Evans et al., 1985,
p. 46) combines the sovereign state and the economic government in its implementation.
Even in the classic work on state theory, Bringing the State Back In (Evans et al., 1985),
the concept of the state did not clearly refer to either sovereignty or government.
Sometimes the state appears as a concept in its sovereign form, dominating society or the
market, but sometimes the state is referred to in government terms, as “an arena within
which economic interest groups or normative social movements contended or allied with
one another to shape the making of public policy decisions” (Skocpol, 1985, p. 4). In
another article in the same volume, on the other hand, Rueschemeyer and Evans see the
state only as a bureaucracy (Rueschemeyer & Evans, 1985, p. 47). In Scott’s Seeing as a
State (1998), state-initiated social engineering is formed by four elements:
“administrative ordering of nature and society, high-modernist ideology, an authoritarian
state that is willing and able to use the full weight of its coercive power to bring these
high-modernist designs into being, and a prostrate civil society that lacks the capacity to
resist these plans” (Scott, 1998). For Scott, an authoritarian state guarantees the

53
materialization of a strict ideology. His concept of state comprises both sovereignty and
government.
What does this model mean for an inquiry into governmental structure? As shown
previously, centralization and decentralization have been extensively debated as two
trends in government power structure and scholars have long been puzzled by the
unbreakable yet seemingly contradictory partnership between the two. Similar to Riker’s
(1964) dilemma, Rueschemeyer and Evans (1985) in the section “Centralization and
Decentralization” in their chapter on effective state intervention, pointed out that the state
is a corporate actor and, at the same time, an arena of social conflict. State action requires
decentralization for maximum efficiency, but by giving autonomy to subunits, a state
then encounters the problem of coordination. Decentralization is seen as detrimental to
the ability of the state to act coherently, and centralization as detrimental to effective
execution. In Agamben’s (2011) thesis, the divergence and convergence of power see
their unity of opposites.
Agamben’s inquiry did not stop at establishing the bipolar model of government;
rather, his goal was to look into the connection between oikonomia and glory, a
connection, he argued, that has been neglected by political philosophers and political
scientists. If power is defined as force and capacity of action, why, then, does power need
glory—ceremonies, acclamations, and protocols? The answer to this question is the gem
of his investigation and his chief contribution to an understanding of the divisional layers
of state.
Agamben argued that “glory is the place where theology attempts to think the
difficult conciliation between immanent trinity and economic trinity, theology and

54
oikonomia, being and praxis, God in Himself and God for us” (Agamben, 2011, p. 208).
To understand this statement, we must first turn to Agamben’s idea of inoperativity, or
inactivity, which is a key concept in his philosophy. In searching for mankind’s meaning
of life, Agamben’s answer, derived from Judaism and Christian theology, is that mankind
has no predestined purpose in the world—human life is “completely devoid of work …
and is the Sabbatical animal par excellence” (Agamben, 2011, p. 246). Agamben (2011)
interpreted the Apostle Paul’s Letters and argued that the theme of eternal life is not a
future condition but a special quality of life. This life is meant to anticipate the sabbatism
of the Kingdom in the present. “To live in the Messiah means precisely to revoke and
render inoperative at each instant every aspect of the life that we live, and to make the life
for which we live” (Agamben, 2011, p. 248).
The parallel to the mundane governments of the world in Christian theology is the
divine government with angels as the ministers, who are divided into hierarchies or
ministries, meant to implement the decrees of Providence. In the West, angelology is the
paradigm of bureaucracy, and the ministerial hierarchy is a concept that has been
influenced by this paradigm. The problem, however, is that this divine government is
fundamentally finite. Just as the inoperativity of human life relates to the quality of life,
government in theology is eventually consummated into eternal sabbatism—the angels
will then have nothing to do but sing and praise God. All angelic administration will
cease and transform into an eternal idleness and inactivity, or inoperativity, to use
Agamben’s terminology.
This inoperativity is what state power fears. In his other works, Agamben
addresses this issue, noting, for instance, about Tiananmen Square that “what was most

55
striking about the demonstrations of the Chinese May was the relative absence of
determinate contents in their demands” (Agamben, 1993). The demonstrators at
Tiananmen Square presented themselves as “something that could not and did not want to
be represented, but that presented itself nonetheless as a common life” (Agamben, 1993).
These protestors could have made some particular demands, but this would then allow the
government to defend against and deny their claims. Instead, this group of people
removed themselves from the machinery of the Chinese government. For precisely this
reason, they appeared particularly dangerous to the Chinese government.
An idle god who has given up governing the world is a god that the powerful
cannot accept. What does it mean to govern if the governed party is inoperative? From
the general to secondary cause, from general providence to special providence, from the
Kingdom to the Governance, from the center to the local, there is always a gap that has to
be filled by a third player—“glory”—to hide this inoperativity, the disappearance of all
power, the non-exercised power, so as to maintain the functioning and operation of the
machine. “It allows … us to bridge that fracture between theology and economy that the
doctrine of the trinity has never been able to completely resolve and for which only the
dazzling figure of glory is able to provide a possible conciliation” (Agamben, 2011, p.
230).
To avoid inoperativity or the disappearance of power, theologians maintain that
power will not disappear but rather, it will simply not be exercised; the angels will still
retain their hierarchy, but they will abandon tasks of government and apply themselves
instead to the celebration of God’s glory. “Glory is the form in which power supersedes
itself” (Agamben, 2007, p. 133). To be more precise, it is the doctrine of glory that

56
preserves power. Both in theology and in politics, Agamben (2011) argued, glory takes
place of the emptiness in the center. That is, “Glory, both in theology and in politics, is
precisely what takes the place of that unthinkable emptiness that amounts to the
inoperativity of power. And yet, precisely this unsayable vacuity is what nourishes and
feeds power (or, rather, what the machine of power transforms into nourishment)”
(Agamben, 2011, p. 242).
Glory needs glorification. The meaning of the acclamation may not be clear to
everyone, but its effect and function—to produce glory—are more important than any
meaning. “In the sphere of doxologies and acclamations, the semantic aspect of language
is deactivated and appears for a moment as an empty rotation; and yet, it is precisely this
empty turning that supplies it with its peculiar, almost magical, efficacy: that of
producing glory” (Agamben, 2011, p. 232).
In modern society, acclamations and doxologies take another form—public
opinion. Agamben (2011) quoted Schmitt, who argued that “public opinion is the modern
type of acclamation. It is perhaps a diffuse type, and its problem is resolved neither
sociologically nor in terms of public law. However, its essence and political significance
lie in the fact that it can be understood as an acclamation. There is no democracy and no
state without public opinion, as there is no state without acclamation” (Schmitt, 2008, p.
275; quoted by Agamben, 2011). What seems surprising at first blush but makes perfect
sense in the context of Agamben’s investigation is his claim that acclamations and public
opinion, genuine democratic products, find their roots in the tradition of authoritarianism.
The tradition has simply shifted from applauding the monarch to the media accolades
present in modern democracies: “What was confined to the spheres of liturgy and

57
ceremonials had become concentrated in the media” (Agamben, 2011, p. 256). Agamben
argued that “contemporary democracy is a democracy that is entirely founded upon glory,
that is, on the efficacy of acclamation, multiplied and disseminated by the media beyond
all imagination” (Agamben, 2011, p. 256). Acclamation justifies political power, and
public opinion plays the same affirmative role in modern democracies.
A similar point regarding public opinion was made by Habermas (1989) in his
early work on developing the notion of public sphere. In Habermas’s The Structural
Transformation of the Public Sphere: An Inquiry into a Category of Bourgeois Society
(1989), he reviewed how the bourgeois public sphere eroded through economic and
structural changes dating from the late 18th century. In this telling, the mass media was
manipulated to manufacture consensus, creating a public that did not previously exist.
The rise of new disciplines such as advertising and public relations replaced the old
public sphere.
Habermas’s (1989) criticism of the decline of rational, meaningful argument
concludes with his proposed solution of reviving the kind of rational, critical debate that
characterized the public sphere among property-owning, educated reading individuals, a
point which was elaborated in his later work, The Communicative Action Vol. 1
(Habermas, 1984) and Vol. 2 (Habermas, 1987). Habermas’s theory is built upon a
revision of Parsons’ AGIL model of societal stability—societal stability depends on the
equilibrium of the four functions: Adaptation (A), Goal (G), Influence (I), and Value-
commitments (L). According to Habermas, A and G are systems; A is represented in
contemporary society as the official economy and G as the administrative state. For A
and G, the media of transmission are money and power (votes), which are quantitative

58
and non-communicative. On the other hand, I and L are lifeworld, the media of which is
qualitative and based on rational communication. Prior to the modern era, the legitimacy
of the state system (A and G) was built upon the foundation of a shared understanding in
the lifeworld (I and L). Money and votes were meaningless unless they were legitimized
by the mutual understanding and valuing of these quantitative media by the lifeworld’s
qualitative media. The crisis of contemporary modernity is characterized by the
decoupling of systems media (money and votes) and lifeworld media (influence and
value-commitments), in which communication is replaced by more efficient media—
money and voting—to establish consensus. The lifeworld used to be the source of
legitimacy, but legitimacy is now colonized by the systems.
In late-stage capitalism, the state often begins to involve itself heavily in
economic administration. This ever-increasing involvement poses a quandary: The state
faces the challenge of immediate translation from economic crisis to political crisis,
which creates an increasing legitimacy deficit. In Communicative Action, Habermas
(1984) argued that through communicative action, a reproduction of the lifeworld can
guarantee the coordination of actions. Rational deliberation and debate under specified
ideal conditions could deliver consensus (Habermas, 1984). Communicative action
revolves around an ideal situation that requires transparency, free communication,
neutralization of power differences, and equal opportunities to participate. Habermas
(1984) argued for an undistorted communication experience and saw this as a moral
foundation for politics.
Habermas’s (1984) concept of communicative action has been the foundation for
planning theory related to consensus building. However, this thesis has encountered

59
criticism from a number of scholars. For example, Chantal Mouffe (2000), who based her
agonistic pluralism argument upon the linguistic theories of Lacan and Žižek, argued that
not only is distortion inevitable in communication, but it helps to deliver intelligible
communication and is thus necessary to enable communication (Purcell, 2009). Mouffe
(2000) concluded that rather than eliminate distortion, we need to accept distortion and
power as necessary parts of communication. Another critique of Habermas is from
Flyvbjerg (1998) in his argument about the relationship between rationality and power.
According to Flyvbjerg (1998), “Rationality is context dependent, the context often being
power” (p. 227). If power penetrates rationality, there is no point in discussing rationality
while avoiding power. For Flyvbjerg, the Habermasian ideal of communication is not real
communication. In responding to the advocates for communicative action regarding
creating an ideal speech situation, Flyvbjerg (1998) argued that enough has been said
about “what should be done,” and only by looking into “what is actually done” can we
understand modernity and democracy in practice and bring about change.
Agamben and Flyvbjerg should have no problem agreeing that power defines
rationality. But Agamben asked and answered a question that Flyvbjerg did not: if power
is a determinant, why is rationality needed? Agamben (2011) critiqued communicative
action in the chapter “The Archaeology of Glory.” He specifically pointed out the
essential link between communicative actions and acclamation. “What our investigation
has shown is that the holistic state, founded on the immediate presence of the acclaiming
people, and the neutralized state that resolves itself in the communicative forms without
subject, are opposed only in appearance. They are nothing but two sides of the same
glorious apparatus in its two forms: the immediate and subjective glory of the acclaiming

60
people and the immediate and objective glory of social communication” (Agamben, 2011,
p. 258). For Agamben, the democratic and secular theorists of communicative action are
no different from the conservative thinkers such as Schmitt and Peterson. Communicative
action, to him, is essentially acclamation. Agamben’s (2011) argument is more
provocative in the sense that he actually showed a weakness of power, which has a
positive meaning for action.
3.4.2 Implications of Agamben on this inquiry
There are two major implications from Agamben’s investigation for this study,
relating to the bipolar governmental machine and the concept of glory and glorification.
a. The bipolar governmental machine
Government as a form of power is possible only if its two aspects—general and
particular, Kingdom and Government, sovereign power and executive power—can
coordinate effectively. Neither pole can function independently or exist without the other
pole, whether we are discussing centralization and decentralization or local state and
national state. If this is true, then our focus must be on how the two poles can coordinate
in this double-structure machine.
In Agamben’s earlier work, State of Exception (2005), this double structure
appeared as a more specific form of correlation between auctoritas and potestas. The
state of exception is a zone of indifference between anomie and law: “The state of
exception is neither external nor internal to the juridical order, and the problem of
defining it concerns precisely a threshold, or a zone of indifference, where inside and

61
outside do not exclude each other but rather blur with each other” (Agamben, 2005, p.
23). The state of exception is the double structure that takes the form of Kingdom and
Government—power to reign and power to govern—and ultimately, oikonomia and
glory—power as effective management, and power as regality (Agamben, 2011, p. xii).
The present study argues that the governmental machine in China can also be seen
as a multi-layered bipolar machine. As shown in Figure 3, at each level of the
government, the Communist Party center dominates in decision-making and the general
bureaucratic office (the State Council, the provincial governor, or the mayor) acts as the
execution power. The Party center and the State Council (the highest government level)
form a bipolar central office, which then becomes the sovereign power pole of the
national governmental machine. This pole is then joined by its local counterparts to form
the nationwide government machine. The policies made at the highest level of the
political power—the center that is composed of the Party center and the State Council—
tend to be general and directional, because this central office is equivalent to Agamben’s
(2011) concept of general providence; by its nature, it provides general guidelines. Such
ambiguity leaves ample room for discretion to accommodate local particularities.
Additionally, because the goals of the policies in different fields usually reflect
conflicting departmental interests, these conflicting goals also create a threshold of chaos
that is subject to further discretion in implementation. This gap between the center’s
guidance or rule and the local level’s execution always allows for negotiation and
interpretation. The center–local relationship is not understood as a hierarchical
relationship, then, but as a coordination combination, on which the implementation
outcomes are dependent. The outcome is the result of the coordination mechanism, which

62
includes compromises in interests, negotiations, and conversations. Instead of the
structure itself, it is the coordination mechanism that must be demystified. This study,
then, is focused on the negotiation between the center and the local powers, highlighted
in Figure 3.
Figure 3. An illustration of the bipolar governance machine of China’s state
b. Glory and glorification
Agamben’s (2011) innovative interpretation of modern society’s version of
acclamation sheds light on an overgeneralizing misunderstanding of the difference
between planning practice in developing countries and “the West.” Planning education in
the United States has placed considerable emphasis on public participation, seeing the
public as a key input to create plans that take equality into account. The emphasis on
communicative planning and reaching consensus, however, contributes to the frustration
of numerous planners who work in the field of international development, who are faced
with the conundrum of theorizing their everyday practice, which has little to do with
public participation, community planning, and by and large, democracy. In the
Party
Center
State
Council
Local Party
Center
Local
Government
Departments
Center Bipolar Machine Local Bipolar Machine
National Bipolar Machine
Negotiation relationships Negotiation studied in this research

63
conclusion of an article analyzing Calcutta’s planning, written in 1994, I was surprised to
see what would be an appropriate description of planning in China today, 20 years later:
“The success of the plan was defined simply by official acceptance as a planning
document and money being made available to implement it. The number of projects
implemented from the document’s list becomes a measure of its success; any assessment
of economic development in the context of the city’s communities, its hinterland, and the
nation is forsaken” (Banerjee & Chakravorty, 1994). Faced with the gap between theory
and reality, planners working in China rationalize their experience as if they have a split
personality: on the one hand, they criticize the lack of effective public participation
institutions, as if the lack of democracy is the ultimate answer to all defects in planning;
on the other hand, they happily praise their superiority as technicians for the government
and their ability to deliver plans that are implemented, as if a strong central government is
the answer to successful planning implementation.
Agamben’s (2011) argument is particularly inspired in asserting that the
difference between the two situations is not only whether the democratic process is
present in planning, but what form acclamation takes and who its performers are; while
the democratic process is admittedly an important institutional difference, it gives
planners little guidance on how they may make changes to the system or become more
effective. The role of public opinion, which functions as acclamation in a democratic
society, is performed in the authoritarian regime by planners, among other technicians,
who produce the knowledge to rationalize and legitimize the decisions made by the
bureaucrats. Public opinion is not only produced and mediated by the media, but also by
the scientific institutions that claim to have authoritative knowledge of the natural and

64
social environments. Planners, seeing themselves as service providers for their
governmental clients, are performing acclamation through their planning work, similar to
how the scientists who were hired by gasoline companies in the 1960s provided
necessary acclamation by asserting that the lead in gasoline posed no harm to the
environment. From this perspective, however, planners in a non-democratic regime face a
difficult choice: doing nothing is often better than continuing planning, because the
efficiency and effectiveness of their planning is not due to any profound skill or
technique, but is merely the result of the political power acclaimed in the plans. What can
be done or undone in this situation? This point will be elaborated in the final chapter.

65
Chapter 4
Design of the Study
The first phase in original design methodology of this study was to apply
curriculum vitae data on China’s high officials to conduct a Social Network Analysis,
assuming that intergovernmental relationships are largely reflected in official
appointment data. The result of the first phase of the Social Network Analysis is given in
the next chapter. The second phase of the research, a three-case study, creates a more
comprehensive understanding of the relationships between development and
intergovernmental relationships.
4.1 The Design of the Original Social Network Analysis
4.1.1 Data collection
Social network data for this study was collected through China Vitae
(http://www.chinavitae.com/), an up-to-date online biographical database that records the
career paths of more than 4,000 political, military, economic, business, and academic
leaders in China. Each individual’s biographical record covers their place of origin,
education, work experience, and organizational affiliations, as shown in Figure 4. These
records were used as network data.

66
Figure 4. A sample profile from China Vitae. Source: Retrieved from China Vitae website,
http://www.chinavitae.com/biography/Jiang_Zemin/career; last retrieved on 09/05/2012
As provincial officials are appointed by the central Communist Party, the
appointment of local officials can be seen as a mechanism of control exercised by the
center over the local governments. For each province, I collected information on
relationships extending in two directions, investigating key questions: (a) from local to
center: how many local government officials have become full members of the Central
Committee and how many years did these officials work in the province before they
became full members; and (b) from center to local: how many full members from the
Central Committee were appointed to the provincial government and how many years
have these members stayed in their positions. The general rationale is that the more
members the Central Committee absorbs from or sends to the province, and the more
years these members have worked in the province, the closer the relationship is between
the center and the province.

67
China Vitae provides the full lists of Chinese Communist Party (CCP) Central
Committee membership (including full members and alternate members) from the 14th
(1992–1997) cohort to the 17th (2007–present) cohort—four cohorts in total. Although
the career paths of these members often begin much earlier, I have used 1975 as the cut
point for career data collection—this is the intersection between the Cultural Revolution
and the Great Reform (officially defined as beginning in 1978). Only full members are
counted, as alternate members have very limited power in the Central Committee. I chose
the cut point to reflect the changing development strategy and policy preferences of the
central government since the initial period of the reform. I will analyze all data from the
four cohorts and identify any changes in the power structure across time.
4.1.2 Calculation of equivalence measure
The calculation of an equivalence measure is a necessary step for grouping
observations by position. I conducted formal mathematic calculations (using the software
package UCINET) to measure the distance between the local level and the center—
defined as the number of appointments and the year of the appointments. The selection of
a mathematical measure relates to the definition of “equivalence,” in which the
conditions under which two entities will be considered equivalent to each other so that
they can be grouped into one position must be defined. Here, I used the definition of
structural equivalence. Structural equivalence is the strictest definition of equivalence
because it requires the equivalent entities to have identical ties from and to all other
entities. In the present study, this means that in order for province A and B to be
equivalent, the two provinces must have the same number of officials moving up to or

68
being appointed down from the center and these officials must have worked for the same
number of years in the provinces. However, the structural equivalence is just a
mathematical property; in reality, two entities are seldom perfectly structurally equivalent.
Therefore, using a measure of structural equivalence to group entities, as will be shown in
the next step, is an effort to locate and identify entities that are approximately structurally
equivalent.
There are two measures of structural equivalence: Euclidean distance and
correlation. Both can be calculated using UCINET. For Euclidean distance, the distances
to all other entities will be identical if two entities are perfectly structurally equivalent.
For correlation, the correlation between the rows and columns of the two entities will be
+1 if the two are perfectly structurally equivalent. In order to gain the same conclusion
for both measures, I first standardized the relational data to remove differences in means
and variances among entities.
4.1.3 Representation of equivalence classes
I used Hierarchical Clustering—a data analysis technique—to partition the
entities (the provinces) into different positions. The equivalence measure from the last
step became the input for this step. UCINET provides a function for this technique. The
results of this step formed a dendrogram that shows the hierarchical level of the provinces
based on their political relationship to the CCP Central Committee. To further analyze the
relationships between the different positions/groups of provinces, I produced an “image
matrix”—a simplified matrix that collapses the rows and columns containing equivalent
actors—and a “reduced graph”—a graph that illustrates the ties within and among

69
positions (rather than showing the ties among individual actors as in an original network
graph) (Wasserman & Faust, 1994, p. 362). The combination of the three presentations
creates a picture of the political power structure of provinces in China based on an
analysis of power structures and relationships.
4.2 The Design of Comparison Case Studies
The results of the Social Network Analysis are presented in the next chapter. The
analysis confirms the hypothesis that while local experience is an increasingly important
contributing factor for an official to be promoted to the CCP Central Committee,
provincial representation is unequal. Some provinces consistently have more
representatives in the center. Considering multiple factors including not only the number
of representatives but also the inter-provincial movement of these officials, the reduced
graphs show the relationships among provinces, particularly in terms of their prestige, in
a more structural way. To some extent, the correlation analysis between representation
and GDP confirms a positive relationship between the two.
However, as mentioned before, the official evaluation system and promotion
process is only one motivation mechanism, and studies have shown that manipulation of
this system by lower-level officials is both possible and common. This system can only
provide limited controlling power to the center, and thus does not allow us to develop a
more comprehensive understanding of the interplay between development and
intergovernmental relationships.
In the second phase of the research, I conducted a three-case study. To do this, I
interviewed 43 officials, planners, and researchers who have either been directly involved

70
in the development process, or have conducted extensive research in the area or on
development zone policies. I also relied heavily on secondary data including official
archives, local development memoirs, and books documenting the development of the
zones. During my field study in China, I gradually came to the realization that this
national development zone project cannot be understood at a single scale; rather, the
scales of how a zone is addressed depend on the powers and interests involved. The
multiscalar, multi-level interactions of the governments engaged in implementation are
the focus of comparison between these cases.
I selected three cases of Special Economic Zones: Tianjin Economic
Development Area (currently Binhai New Area), Guangzhou Development Zone
(currently Luogang/Huangpu District), and Guangzhou Nansha Development Zone
(currently Nansha New Area). These three zones are located in two cities, both of which
are important regional economic centers, but which have been studied less in comparison
to Shanghai, Shenzhen, and Beijing. The three zones were all set up under the national
zone policy—the Tianjin and Guangzhou development zones were among the first set of
zones established in the 1980s, and Nansha was created during the second round in the
early 1990s. The three have followed different development paths since their
establishment. Today, Tianjin has become the so-called third pole of China’s economy,
and the Binhai New Area, although currently facing a crisis that threatens to turn it into a
ghost town, has contributed considerably to Tianjin’s development. The Guangzhou
Development Zone has followed a typical path, having progressed from a mediocre
industrial development center to being the frontier of city expansion. The Nansha Zone is
a special case, as there has been no exceptional development in the zone due to its

71
complicated, conflicting relationships with its neighboring cities and regions. Each zone
told a different story, but combined, they reveal a clearer picture of how
intergovernmental relationships affect local development.
Each interview lasted for 60–120 minutes. The interviews usually began with a
short introduction to the project’s goal—to further the understanding of zone
development in China—and the presentation of the Informed Consent Form. The
interview continued with the questions below, which I followed with additional, more
specific questions depending on the interviewees’ answers. The standard interview
questions are as follows:
Questions for local officials:
i. Basic facts about the interviewee: What is your role in zone development?
How long have you been in this position? What is the typical work related to this position?
ii. Basic facts about the zone: When was this zone established? Why was this
zone established?
iii. Support from the central government: Did the zone receive any support
from the central government? Did any particular official or department from the center
express strong preferences on the development of this zone? How would you compare the
support for this zone to other national zones? Do you have any personal experience with
or examples of this kind of support?
iv. Local policies: How engaged is the local government in zone development?
What are the local policies on zone development? Have the local policies and planning
been changed for the zone? If so, how have they been changed? Does the local

72
government have any sector preferences? Which local government departments are
involved? What are their roles?
a) Does the local government communicate with firms directly? How would
you describe the role of official X and department Y in this process? How often does the
local government communicate with firms?
b) Does the local government have any preference for firms that they want to
be in the zone? How would you describe the role of official X and department Y in this
process? If they identify such firms, what would they do to ensure their participation in
the zone?
c) Does the local government innovate in zone development policies? How
would you describe the role of official X and department Y in this process? Describe a
policy that you think is innovative in zone development. What is the outcome of this
policy? Has the central government reacted to this innovation and, if so, how?
v. Performance of the zone: How would you describe the development
performance of the zone? Would you describe the development as linear or do you see
any leaps or falls in development?
vi. How would you compare this zone’s performance with other national
zones?
Questions for professors and experts in zone development include all of the above
questions, plus:
vii. What do you see as the roles of the local government and the central
government in this zone’s development? How would you describe the role of official X
and department Y in this process?

73
During my review of the secondary data, including official archives, local
development memoirs, and books on zone development, I considered it important to
understand the purpose of the bureaucrats’ action. I noticed that the official documents in
China tend to follow a typical structure: (a) the first section is about the achievements
made so far by the project, the difficulties encountered, and how these difficulties were
partially accommodated in this period; (b) next, a section describes the plan for the next
period; (c) the projected difficulties of the next phase are outlined; and, (d) a resolution
proposed to the superior officials. The purpose of bureaucrats’ actions is usually
disclosed in part (c), the description of anticipated difficulties, and part (d), the proposal
for how these difficulties should be addressed. These sections reveal the requests from
the lower offices to their superior government and can be used to discern what the lower
offices really want. For example, as I will show in the case of Tianjin, the real purpose
for requesting that the Tianjin zone be upgraded to a national-level zone was to obtain
land and tax advantages. In some cases, the official writing the document would even
mention how similar cases were solved in the past and ask for similar treatment. For
example, in a document reporting to a superior on the current development in Guangzhou
Development Zone, the reporting official specifically stated that land resources for the
project were still restricted, even though they had been granted an additional quota by the
central government the previous year after a meeting between a local official and the
central official. By reading official documents such as these, it was possible to gain
insight into the true purposes behind administrative actions and requests at the local level.

74
Chapter 5
Social Network Analysis of Official Career Data
5.1 Local Experience Became More Important with Time
I have collected full career records on 848 full members from the seven terms of
Chinese Communist Party (CCP) Central Committee (CC) from the 12th term, elected in
1982, through the 18th term, elected in 2012. Table 2 shows the composition of all the
full members by terms. In total, there are 9,680 career record entries after applying filters
to exclude military and non-critical career records such as student, engineer, and worker.
These career records cover all the full members’ local and ministerial experiences.
Among all full members, 421 full members have at least one record of local experience,
which are the records that are used for the following analysis.
Table 2
Composition of 12th–18th Communist Party of China (CPC) Central Committee (CC)
Terms of CPC Number of
Central
Committee Full
Members
Number of Members
Who Have Local
Experience
% of Members
Who Have Local
Experience
12th CPC (1982–1987) 236 46 19%
13th CPC (1987–1992) 176 76 43%
14th CPC (1992–1997) 192 114 59%
15th CPC (1997–2002) 197 134 68%
16th CPC (2002–2007) 200 144 72%
17th CPC (2007–2012) 204 161 79%
18th CPC (2012–present ) 204 144 71%
Total 848 421 50%
Over the years, the percentage of Central Committee full members with local
experience has increased. In the 12th Central Committee, only 19% of the full members
had local experience records, but from the 16th to the 18th Central Committee, this

75
percentage has increased to more than 70%. There are two potential explanations for this
increase. One possibility is that this increase is due to better data collection—in recent
years, career records are more complete and more local records can be found in the public
record as China’s media landscape becomes more open. A more compelling explanation
is that the central power in China is increasingly recruiting officials with local experience,
including some with substantial experience, into the Central Committee. This explanation
is also supported by similar findings in Qiao’s 2010 dissertation. Qiao (2010) found that
more members of the Politburo, a more powerful organization within the Central
Committee that is typically composed of 25 Central Committee members, now have local
experience. The percentage of Politburo members with local experience has increased
from 36% in the 12th term to 76% in the 17th term (Qiao, 2010, p. 38).
Another way to analyze the relationship between an official’s chance of being
promoted to the Central Committee and the official’s local experience is to examine the
number of times an official was elected to the Central Committee, as shown in Table 3.
The full members who had more local experience before they were first elected to the
Central Committee were elected into the Central Committee more often than those
officials with less local experience. Among the full members who were only elected to
the CC once, 38% had local experience. Higher percentages are found among the
officials who were elected to the CC more than once: Among those who have been
elected to the CC twice, 57% have local experience; among those who have been elected
three times, 74% had local experience before entering the CC. The percentage goes up to
almost 90% for those who have been elected to the CC four times and to 100% for those
who have been elected to the CC five or more times. It seems that local experience makes

76
the officials more successful in their long-term political careers and, perhaps, their local
experience makes them more desirable to the Central Committee.
Table 3
Percentage of Officials with Local Experience by the Frequency They are Elected to the CC
Times the Official is
Elected to CC
All CC Full
Members
CC Full Members with
Local Experience
%
1 477 181 38%
2 237 134 57%
3 91 67 74%
4 33 29 88%
5 7 7 100%
6 3 3 100%
Total 848 421 50%
5.2 Primary Analysis of Provincial Representation
The provinces are ranked in Figure 5 according to the total number of officials
who worked in the provinces (or provincial cities) before they joined the Central
Committee. Provinces can roughly be divided into six tiers: the first tier is the Beijing
Municipality with more than 45 representatives across all the terms under study. In the
second tier are four provinces with 25–30 representatives. In the third tier are five
provinces with 20–25 representatives. In the fourth tier are 10 provinces with 15–20
representatives. In the fifth tier are seven provinces with 10–15 representatives. In the
sixth tier are four provinces with fewer than 10 representatives in the past several terms.

77
Figure 5. Ranking of provinces/regions by officials with local experience before entering CPC.
Several interesting observations can be made from an examination of the numbers
associated with Figure 5: First, it was not until very recently—the 16th CPC—that all
provinces had a representative on the Central Committee. Before the 16th CPC, some
provinces did not have any representative on the Central Committee. For example,
Jiangsu, Zhejiang, and Anhui did not have any representatives until the 13th CPC Central
Committee. Ningxia, Yunnan, Fujian, Qinghai, and Shanxi had no representatives for
more than one term of the CPC Central Committee during the period under study. Second,
except for Beijing Municipality, the number of representatives for each province varied
considerably across years. For example, although Shandong province ranked second in its
total number of representatives on the CPC across all seven terms in the period under
study, it was not well represented during earlier terms such as the 12th and 13th CPC. It
had no representative in the 14th CPC Central Committee. Shanghai Municipality was
better represented in the 14th and the 16th CPC Central Committee periods than in other
terms. Chongqing Municipality had historically low representative numbers except for

78
the 17th CPC, when Bo Xilai was the party secretary, but that number went down
dramatically after Bo’s downfall in 2012.
The reason for the fluctuation of the appointments across CPC terms is unclear,
but one could speculate that the central power strategically uses its power of appointment
during different times and adjusts the provincial political representation according to
national economic and political needs, or simply to maintain the balance of power across
provinces. For example, during the 16th CPC (2002–2007), the central power absorbed a
large number of officials with local experience in Guangdong: Huang Huahua, who had
32 years of local experience in Guangdong and was the secretary of the CPC in
Guangzhou at the time, was brought into the 16th CPC and promoted to be the governor
of Guangdong Province in 2003. Wang Qishan, who had worked in various the central
government departments for years, was sent to Guangdong and Hainan during the late
1990s; upon his return to the central government, he became a full member of the Central
Committee in 2002 and was appointed acting mayor of Beijing Municipality the next
year. Zhang Gaoli, who had 31 years of local experience in Guangdong, was promoted to
be the acting governor and deputy party secretary in Shandong Province, then entered the
Central Committee in 2002.
After being elected to the Central Committee, some officials were sent to
provinces to take high-level positions, usually as governor or secretary of the local party.
For example, Zhang Gaoli, who was an official in Guangdong before entering the 16th
CPC Central Committee, was sent to Shandong to be the governor and to Tianjin to be
the secretary of the CPC during the 16th and the 17th CPC terms. Figure 6 shows the
numbers of officials who took up local positions after they entered the CPC Central

79
Committee. The variations among provinces are smaller in this ranking than the previous
one, but there are still provinces that receive more officials from the central power.
Except for Beijing, which is still on the top of the ranking, among the seven provinces
which have received 15–20 officials from the center over the years, three are from the
second and third tier and four are from the fourth tier as outlined in the last ranking. In
other words, the provinces that receive the most officials from the center are also the
provinces that sent a comparatively higher number of officials to the central power.
Among the lowest seven provinces, which receive the smallest number of officials from
the center, six of them are from the fifth and sixth tier of the last ranking; the exception is
the Inner Mongolia Autonomous Region.
Figure 6. Ranking of provinces/regions by officials’ local experience after entering CPC
Table 4 compared the two rankings—the flow-up ranking (from local to center)
and the flow-down ranking (from center to local). The comparison shows that high flow-
up provinces are more likely to also be high flow-down provinces, and the low flow-up
provinces are also more likely to be low flow-down provinces. Serving in the higher-

80
prestige provinces is usually a necessary step for officials to obtain promotions within the
Communist Party and to finally be elected to the Central Committee and receive other
career incentives. For example, Xi Jinping, who had 17 years of local experience in
Fujian, was brought to Zhejiang Province to be the secretary of the local CPC and entered
the 16th CPC in 2002, then was promoted to be the secretary of Shanghai Municipality
during the 17th CPC.
Table 4
Comparison of the Two Rankings: Before and After Entering CPC CC
Provinces Ranking by Number of
Officials before They
Entered CPC CC
Ranking by Number of
Officials after They
Entered CPC CC
Anhui Province 17 9
Beijing Municipality 1 1
Chongqing Municipality 23 25
Fujian Province 28 15
Gansu Province 6 15
Guangdong Province 10 20
Guangxi Zhuang Autonomous Region 23 30
Guizhou Province 23 15
Hainan Province 28 25
Hebei Province 13 4
Heilongjiang Province 6 15
Henan Province 19 7
Hubei Province 19 12
Hunan Province 13 9
Inner Mongolia Autonomous Region 13 30
Jiangsu Province 5 22
Jiangxi Province 11 20
Jilin Province 3 12
Liaoning Province 4 2
Ningxia Hui Autonomous Region 31 25
Qinghai Province 27 25
Shaanxi Province 23 25
Shandong Province 2 9
Shanghai Municipality 8 7
Shanxi Province 22 15
Sichuan Province 9 5

81
Tianjin Municipality 21 12
Tibet Autonomous Region 17 5
Xinjiang Uygur Autonomous Region 13 3
Yunnan Province 28 22
Zhejiang Province 11 22
Note: Bolded entries are provinces that have large differences between the two rankings
(provinces that have a ranking difference larger than nine are highlighted).
However, there are exceptions to this generalization. Highlighted in Table 4 are
provinces that have large differences between the two rankings (provinces that have a
ranking difference larger than nine are highlighted). There are five low flow-up/high
flow-down (that is, ranking increased) provinces including Fujian, Henan, Tianjin, Tibet,
and Xinjiang, and seven high flow-up/low flow-down (that is, ranking decreased)
provinces including Gansu, Guangdong, Heilongjiang, Inner Mongolia, Jiangsu, Jiangxi,
and Zhejiang. To explain the difference in the two rankings, there are several possibilities.
The first possibility is that the differences are due to security concerns. The most obvious
examples supporting this theory are Xinjiang and Tibet, which are mainly occupied by
ethnic minorities and have extensive borders. These two regions both rank low as origin
points for Central Committee full members but rank high as destinations for full members’
appointments after entering the CPC Central Committee; loyal party members are often
sent to regions of concern to help promulgate central power and interests in those regions.
A second explanation is the political reward hypothesis, which argues that the officials
who have experience in less-developed areas may be appointed to more important or
economically advanced regions to acknowledge and reward their achievements in
administrating so-called backwater regions. Under this hypothesis, we would expect to
see high flow-up/low flow-down patterns for economically underdeveloped provinces.
Gansu and Jiangxi fall in this category. On the other hand, for economically advanced

82
provinces, we will adopt a third hypothesis: The central power uses its appointments to
balance the political power between developed regions and underdeveloped regions. This
hypothesis explains why we see the same result of high flow-up/low flow-down for
economically advanced provinces as for disadvantaged provinces. Guangdong, Jiangsu,
Zhejiang, and Henan are among the top five provinces by GDP (Table 5 and Figure 7).
Inner Mongolia is among the top five provinces in per capita GDP. All of these provinces
are high flow-up/low flow-down regions.
Table 5
China’s Provincial GDP and Per Capita GDP in 2012
Gross Domestic Product
(100 million yuan)
Rank Per Capita GDP
(yuan/person)
Rank
Guangdong 57,068 1 54,095 8
Jiangsu 54,058 2 68,347 4
Shandong 50,013 3 51,768 10
Zhejiang 34,606 4 63,266 6
Henan 29,810 5 31,723 23
Hebei 26,575 6 36,584 15
Liaoning 24,801 7 56,547 7
Sichuan 23,850 8 29,579 24
Hubei 22,250 9 38,572 13
Hunan 22,154 10 33,480 20
Shanghai 20,101 11 85,000 3
Fujian 19,702 12 52,763 9
Beijing 17,801 13 87,091 2
Anhui 17,212 14 28,792 26
Inner
Mongolia
15,988 15 64,319 5
Shaanxi 14,451 16 38,557 14
Heilongjiang 13,692 17 35,711 17
Guangxi 13,031 18 27,943 27
Jiangxi 12,948 19 28,799 25
Tianjin 12,885 20 93,110 1
Shanxi 12,113 21 33,628 19
Jilin 11,938 22 43,412 11
Chongqing 11,459 23 39,083 12
Yunnan 10,310 24 22,195 29

83
Xinjiang 7,530 25 33,909 18
Guizhou 6,802 26 19,566 31
Gansu 5,650 27 21,978 30
Hainan 2,855 28 32,374 22
Ningxia 2,327 29 36,166 16
Qinghai 1,885 30 33,023 21
Tibet 696 31 22,757 28
Source: China Data Online,
http://chinadataonline.org.proxy.libraries.rutgers.edu/member/macroyr/macroyrtshow.asp,
accessed March 30, 2013.
Figure 7. China’s GDP and per capita GDP by province. Source: China Data Online,
http://chinadataonline.org.proxy.libraries.rutgers.edu/member/macroyr/macroyrtshow.asp,
accessed March 30, 2013.
5.3 Considering Experience with the Effect of Time
To further consider the value of local experience to an official’s career in the
central government, the following analysis considered the effect of time. The assumption
0
10,000
20,000
30,000
40,000
50,000
60,000
70,000
80,000
90,000
100,000
0
10,000
20,000
30,000
40,000
50,000
60,000
Tian
jin
Be
ijin
g
Shan
ghai
Jian
gsu
Inn
er M
on
golia
Zhej
ian
g
Liao
nin
g
Gu
angd
on
g
Fujia
n
Shan
do
ng
Jilin
Ch
on
gqin
g
Hu
bei
Shaa
nxi
Heb
ei
Nin
gxia
Hei
lon
gjia
ng
Xin
jian
g
Shan
xi
Hu
nan
Qin
ghai
Hai
nan
Hen
an
Sich
uan
Jian
gxi
An
hu
i
Gu
angx
i
Tib
et
Yun
nan
Gan
su
Gu
izh
ou
Per- Capita GDP(yuan/person)
Gross Domestic Product(100 million yuan)

84
is that the longer an official spent at the local level, the more the official knows about that
place. But in the following table, we see there is not much variation in the years of local
experience before entering the CPC Central Committee across different terms (Table 6).
Overall, the mean of years of local experience is around 13 years. The mean is longer in
the 13th CPC and shorter in the 18th CPC, but the difference is not statistically
significant. The length of local experience before entering the CPC Central Committee
ranges from one year to about 40 years.
Table 6
Years of Local Experience before Full Membership in CPC Central Committee
Terms Frequency Mean of Local
Experience Prior to
Joining CPC CC
Std.
Dev.
Min Max
12th CPC 43 13.49 10.75 1 36
13th CPC 42 15.10 13.61 1 41
14th CPC 53 13.72 11.94 1 48
15th CPC 99 11.29 9.38 1 40
16th CPC 113 12.37 11.40 1 41
17th CPC 115 12.37 10.70 1 38
18th CPC 115 10.58 9.84 1 36
In Figure 8, provinces are reordered by the sum of the years all of the officials
spent at the local level. In comparison to the previous ranking, which was based only on
the number of officials with local experience, not the length of that experience, the
rankings of the provinces of Gansu, Zhejiang, Hebei, and Jiangxi decrease. Officials from
these provinces have less experience at the local level than officials from other provinces
before entering the Central Committee. On the other hand, the rankings of Anhui and
Tianjin increase, showing that the officials from these regions often have a longer period
of local service before entering the CPC Central Committee. Several speculations can be
drawn from this data: on the one hand, one could argue that the central power is seeking
better knowledge about a region when it recruits more officials with longer local

85
experience. But on the other hand, a shorter period of local experience may reflect a
strong desire by the central power to gain control over a region, as it may be able to more
strongly influence these less-experienced officials.
Figure 8. Local experience (year)*number of officials per province/region before entering CPC.
5.4 Forming the Steps of a Political Career
The varied prestige and power levels of the provinces are also reflected in the
formation of the steps of officials’ career paths. Figure 9 illustrates this point by showing
the percentage frequencies of a province being the sole or last post, the second to the last
post, and the third post or more before an official is elected to the CPC Central
Committee. Xinjiang ranks merely 13th
in this assessment, when taken as the origin of
CPC Central Committee officials, but almost 90% of officials promoted from Xinjiang
served there as their sole or last local post before reaching the CPC Central Committee,
indicating that Xinjiang enjoys a very prestigious position in terms of its place in officials’
career paths. Beijing and Tianjin show different levels of importance during different

86
terms when considered as the origins for Central Committee officials, but they are similar
in that about 80% of officials promoted from these regions served there as their sole or
last post prior to joining the Central Committee. Meanwhile, although Jiangsu Province
ranks in the second tier based on the number of officials elected to the Central Committee,
it ranks low in this assessment of direct promotions. The officials who have taken
positions in Jiangsu Province usually need to gain experience from other provinces before
being able to join the CPC Central Committee. For example, Yu Guangzhou had 17 years
of experience in Jiangsu Province, but before entering the 18th CPC Central Committee,
he was first appointed vice-minister in the Ministry of Commerce and then deputy
secretary of the CPC in Fujian Province. Jiang Dingzhi, who had 26 years of experience
in Jinagsu Province, was appointed deputy secretary and later governor of Hainan
Province before entering the 18th CPC Central Committee. In general, rankings change
significantly when we consider the steps the provinces represent in the officials’ career
paths prior to entering the CPC Central Committee: 10 provinces increase their ranking
and nine provinces decrease their ranking.

87
Figure 9. Ranking of provinces/regions by the step they represented in officials' careers before
entering CPC.
To extend this discussion, Figure 10 considers the steps the provinces form in the
course of the officials’ entire careers, including their careers after entering the CPC
Central Committee. In this view, the variance among provinces is even greater. A full 80%
of the posts in Tianjin and Ningxia are the last or the only local post officials have taken
in their entire career. But for Liaoning, Gansu, Jiangsu, and Jilin, less than 40% of the
posts fall into this category. When considering the step a province represents in an
official’s career, Beijing is not as prestigious as might be indicated by examining only the
number of representatives from this region.

88
Figure 10. Ranking of provinces/regions by the step they formed in officials' entire careers.
Figure 11 and 12 synthesize the information discussed above. The value on the X-
axis shows the sum of years all officials served in the provinces; the value on the Y-axis
shows the percentage of these posts as the last or only step in the officials’ career; and
finally, the size of the bubble shows the number of officials that have taken posts in the
province. Figure 11 is based on the data on the officials before entering the CPC Central
Committee, and Figure 12 is based on the data related to their entire career.

89
Figure 11. Political representation of province before officials enter the CPC CC.
Figure 12. Political representation of province based on entire career.
As shown in Figure 11, although some provinces have more officials with a
record of longer service in the provinces, these provinces are also more likely to serve as
stepping stones for officials to reach the CPC Central Committee—for example, the
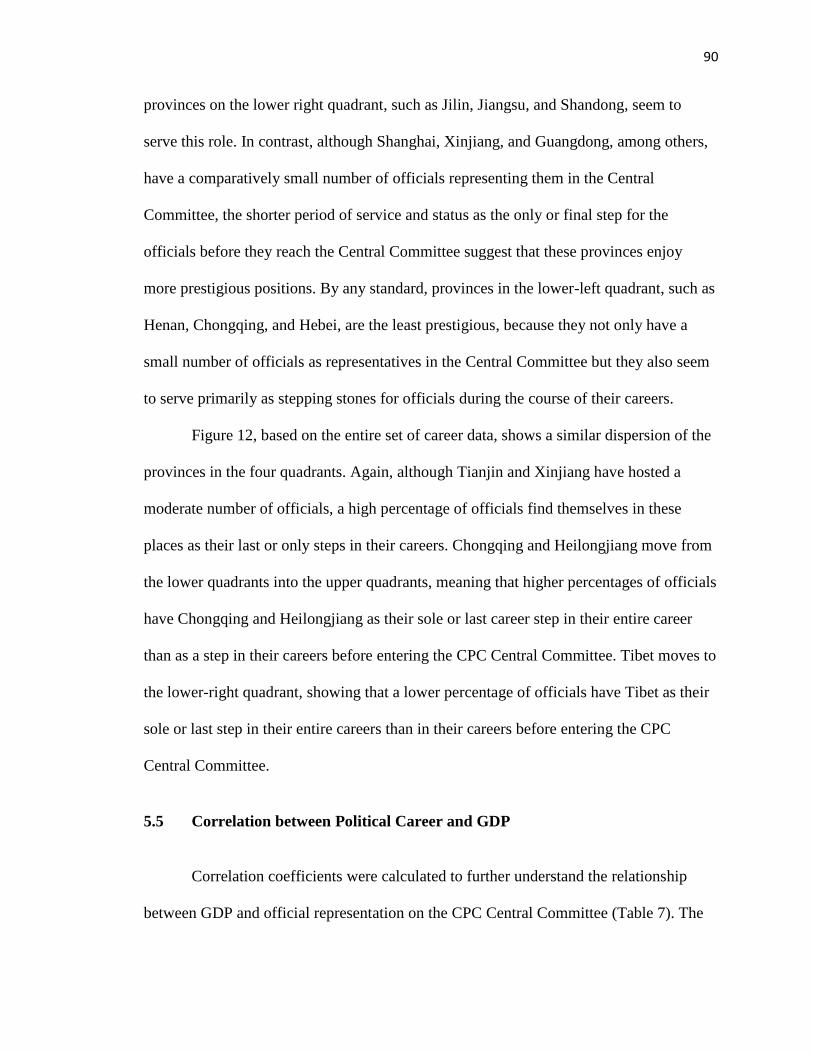
90
provinces on the lower right quadrant, such as Jilin, Jiangsu, and Shandong, seem to
serve this role. In contrast, although Shanghai, Xinjiang, and Guangdong, among others,
have a comparatively small number of officials representing them in the Central
Committee, the shorter period of service and status as the only or final step for the
officials before they reach the Central Committee suggest that these provinces enjoy
more prestigious positions. By any standard, provinces in the lower-left quadrant, such as
Henan, Chongqing, and Hebei, are the least prestigious, because they not only have a
small number of officials as representatives in the Central Committee but they also seem
to serve primarily as stepping stones for officials during the course of their careers.
Figure 12, based on the entire set of career data, shows a similar dispersion of the
provinces in the four quadrants. Again, although Tianjin and Xinjiang have hosted a
moderate number of officials, a high percentage of officials find themselves in these
places as their last or only steps in their careers. Chongqing and Heilongjiang move from
the lower quadrants into the upper quadrants, meaning that higher percentages of officials
have Chongqing and Heilongjiang as their sole or last career step in their entire career
than as a step in their careers before entering the CPC Central Committee. Tibet moves to
the lower-right quadrant, showing that a lower percentage of officials have Tibet as their
sole or last step in their entire careers than in their careers before entering the CPC
Central Committee.
5.5 Correlation between Political Career and GDP
Correlation coefficients were calculated to further understand the relationship
between GDP and official representation on the CPC Central Committee (Table 7). The

91
correlation is medium to strong. The correlation coefficient between the population of the
province and the representation of that province is less than 0.01, showing that the
strength of provincial representation in the central government does not depend on the
population of the province. The coefficient between total GDP of a province and total
officials who held a local position before being elected to the CPC Central Committee is
0.38; the coefficient is higher between per capita GDP and local representation. Both
coefficients are higher if a time effect is included. The correlation coefficient between the
total number of officials who served in the province before joining the CPC Central
Committee with time effect and the per capita GDP is 0.5, showing a strong correlation
between the two.
Table 7
Correlation Coefficients between GDP and Provincial Representation in CPC CC
Population Total GDP
Per Capita GDP
Total Officials Held Positions before Joining CPC CC
Total Officials before Joining CPC CC with Time Effect
Population - 0.50 -0.06 -0.04 0.06
Total GDP 0.50 - 0.40 0.38 0.49
Per Capita GDP -0.06 0.40 - 0.47 0.50
Total Officials Held Positions before Joining CPC CC
-0.04 0.38 0.47 - 0.89
Total Officials before Joining CPC CC with Time Effect
0.06 0.49 0.50 0.89 -
I also group the provinces in two different ways to see if there are relationships
between official appointments and economic development level. Based on per capita
GDP, six groups emerge as follows:
(1) 85,000 yuan/person and above: Shanghai, Beijing, and Tianjin;

92
(2) 50,000 to 84,999 yuan/person: Guangdong, Jiangsu, Shandong, Zhejiang,
Liaoning, Fujian, Inner Mongolia;
(3) 35,000 to 49,999 yuan/person: Hebei, Hubei, Shaanxi, Heilongjiang, Jilin,
Chongqing, Ningxia;
(4) 30,000 to 34,999 yuan/person: Henan, Hunan, Shanxi, Xinjiang, Hainan, Qinghai;
(5) 25,000 to 29,999 yuan/person: Sichuan, Anhui, Guangxi, Jiangxi; and,
(6) Below 25,000 yuan/person: Yunnan, Guizhou, Gansu, Tibet.
Additionally, according to the National Bureau of Statistics of China in 2010,
based on the provinces’ economic status and geographical location, the provinces can
also be divided into four regions:
(1) Eastern China: Fujian, Beijing, Guangdong, Tianjin, Zhejiang, Jiangsu, Hebei,
Hainan, Shandong, Shanghai;
(2) Middle China: Henan, Anhui, Shanxi, Hunan, Jiangxi, Hubei;
(3) West China: Chongqing, Guangxi, Inner Mongolia, Xinjiang, Ningxia, Tibet,
Qinghai, Sichuan, Gansu, Guizhou, Shaanxi, Yunnan; and,
(4) Northeast China: Heilongjiang, Jilin, Liaoning.
As shown in Figures 13–16, in the provinces with a higher per capita GDP, more
officials tend to have longer local experiences before entering the CPC Central
Committee. But such a premium tends to exist only in the top two groups, especially in
Group 1 with Shanghai, Beijing, and Tianjin, and only lasts before the officials enter the
CPC Central Committee. The percentages of the posts as the last or only post before
joining the Central Committee do not differ much across different province groups.

93
Figure 13. Officials with local experience before entering CPC, provinces grouped by per capita
GDP.
Figure 14. Officials’ local experience after entering CPC, provinces grouped by per capita GDP.
28
21
17
14
17 16
0
5
10
15
20
25
30
Per Capita GDP: Yuan/Person
Before 18th CPC
Before 17th CPC
Before 16th CPC
Before 15th CPC
Before 14th CPC
Before 13th CPC
Before 12th CPC
18
12 12
13 12 13
0
2
4
6
8
10
12
14
16
18
20
85,000 and above 50,000-84,999 35,000-49,999 30,000-34,999 25,000-29,999 below 25,000
Capita GDP: Yuan/Person
17th CPC
16th CPC
15th CPC
14th CPC
13th CPC
12th CPC

94
Figure 15. Local experience (year)*number of officials, provinces grouped by per capita GDP.
Figure 16. Percentage of the posts as the last or only post in an official’s career, provinces
grouped by per capita GDP.
Figures 17–20 show the same variables as Figures 13–16 but are grouped by
economic region. Interestingly, more officials have longer local experience in Northeast
China than other regions. Northeast China, comprising Heilongjiang, Liaoning, and Jilin,
362
285
201
170
240
150
411
317
240 214
267
191
0
50
100
150
200
250
300
350
400
450
85,000 andabove
50,000-84,999 35,000-49,999 30,000-34,999 25,000-29,999 below 25,000Capita GDP: Yuan/Person
Years*officials Before CPC
Years*officials Entire Career
76%
66% 62%
72%
63%
76%
68%
48%
59% 60% 57% 56%
0
0.1
0.2
0.3
0.4
0.5
0.6
0.7
0.8
0.9
85,000 and above 50,000-84,999 35,000-49,999 30,000-34,999 25,000-29,999 below 25,000
Capita GDP: Yuan/Person
BEFORE CPC
ENTIRE Career

95
is where heavy industry has traditionally been concentrated. In the past several decades,
the central government has launched a series of campaigns to rejuvenate the northeast
area. The higher number of officials with experience in this area reflects such policy
emphasis. Besides the Northeast area, the Eastern area, which is a wealthier region, also
sends a higher number of officials with longer local experience to the central government
than other regions. Again, the percentages of these posts as the last or only post in an
official’s career do not differ substantially across different economic regions.
Figure 17. Officials with local experience before entering CPC, by economic region.
22
17 15
27
0
5
10
15
20
25
30
Eastern China Middle China Western China Northeast China
Before 18th CPC
Before 17th CPC
Before 16th CPC
Before 15th CPC
Before 14th CPC
Before 13th CPC
Before 12th CPC
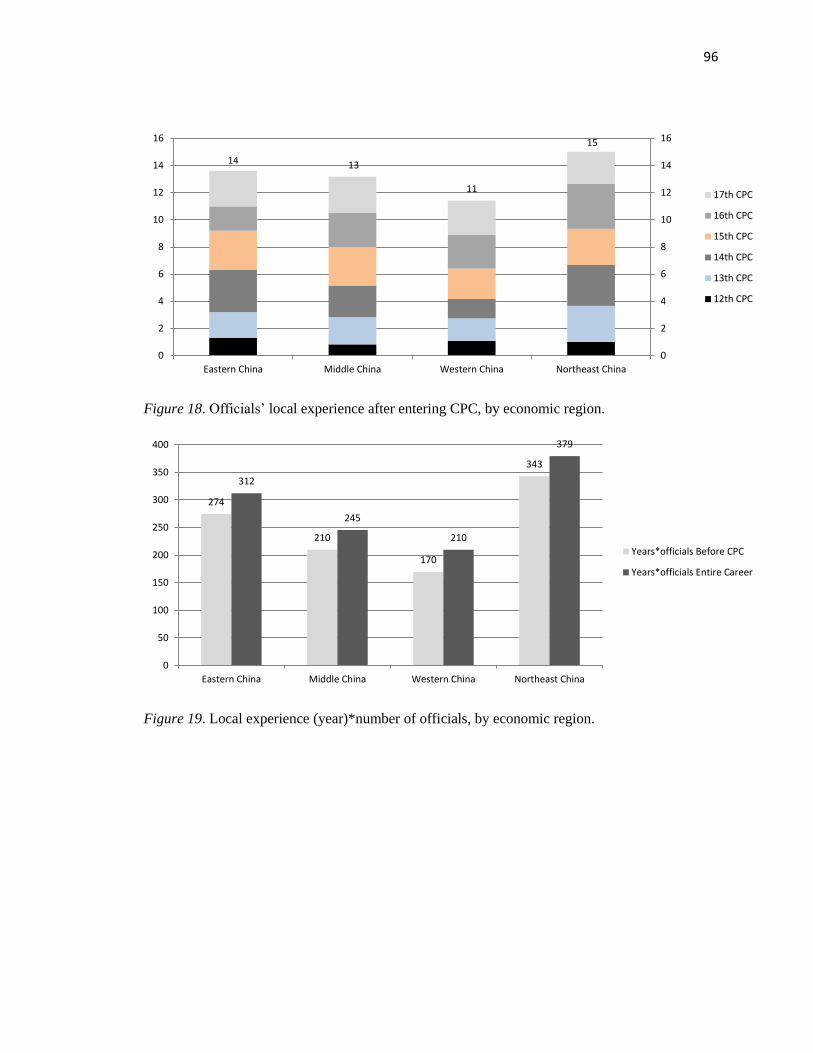
96
Figure 18. Officials’ local experience after entering CPC, by economic region.
Figure 19. Local experience (year)*number of officials, by economic region.
14 13
11
15
0
2
4
6
8
10
12
14
16
0
2
4
6
8
10
12
14
16
Eastern China Middle China Western China Northeast China
17th CPC
16th CPC
15th CPC
14th CPC
13th CPC
12th CPC
274
210
170
343
312
245
210
379
0
50
100
150
200
250
300
350
400
Eastern China Middle China Western China Northeast China
Years*officials Before CPC
Years*officials Entire Career

97
Figure 20. Percentage of the posts as the last or only post in an official’s career, by economic
region.
5.6 Social Network Analysis on Career Data
In Social Network Analysis (SNA), centrality is a way to measure the prestige of
the entities within a network. Indegree centrality, which is one of the centrality measures,
assumes that in a directed network (one in which the ties between entities have directions;
in this case, it means the direction of an official’s career mobility), the more connections
flowing from other entities into the entity under study, the more prestigious the entity is,
and the higher the degree of centrality is present.
Figure 21 and Figure 22 display groupings based on the indegree centrality of the
provinces. The centrality of most of the provinces with a centrality score of 4 or 5 in the
first graph increased to 6 and 7 when officials’ entire careers are considered. This
observation demonstrates that although career mobility across different provinces before
and after an official’s election to the CPC Central Committee is quite common, such
movements take place in a limited group of provinces. Provinces at the lower end of the
67%
60%
74%
65%
57% 53%
63%
43%
0
0.1
0.2
0.3
0.4
0.5
0.6
0.7
0.8
Eastern China Middle China Western China Northeast China
BEFORE CPC
ENTIRE Career

98
indegree scale, such as Shanxi, Hunan, Fujian, Ningxia, and Guangxi, are stable and less
open to having officials flow in.
Figure 21. Grouping by indegree centrality, before officials entered CPC Central Committee.
Figure 22. Grouping by indegree centrality, entire career.

99
In most cases, the movement of the officials goes only in one direction, as shown
in blue. Figure 23 and Figure 24 show only the reciprocal ties, highlighted in red. In both
figures, the provinces form three clusters. The first cluster, formed by one third of the
provinces, contains only senders or receivers of officials. These are the isolated nodes,
including Fujian, Ningxia, Guangxi, and so on. The second cluster contains paired
provinces that have reciprocal relationships, meaning that they send and receive officials
between themselves. These paired provinces tend to be geographically proximate: for
example, Hunan and Guangdong, Gansu and Qinghai, and Hebei and Henan. These
provinces form several dyadic and triadic structures in Figure 23, and then in Figure 24,
they all join together to form a line structure. The third cluster of provinces forms a star
or a tree root structure with Beijing on the top and roots formed by provinces. For
example, Sichuan and Chongqing, which are close to each other, form a reciprocal
relationship; Chongqing and Anhui form the next level of reciprocal relationship, and
Beijing and Anhui are placed on the top of the reciprocal relationship chain. However,
the provinces do not form any clique in the reciprocal relationships—no three provinces
send and receive officials between themselves.

100
Figure 23. Reciprocal relationships among provinces, before officials enter CPC CC.
Anhui
Beijing
ChongqingFujian
Gansu
Guangdong
Guangxi
Guizhou
Hainan
Hebei
Heilongjiang
Henan
Hubei
Hunan
Inner Mongolia
Jiangsu
Jiangxi
Jilin
Liaoning
Ningxia
Qinghai
Shaanxi
Shandong
Shanghai
Shanxi
Sichuan
Tianjin
Tibet
Xinjiang
Yunnan
Zhejiang
101
Figure 24. Reciprocal relationships among provinces, officials’ entire career.
Figure 25 is an ego-centered network analysis that shows all the ties connecting
Beijing and other provinces prior to when officials entered the CPC Central Committee.
This figure reveals more complicated information. Though Beijing does not form
reciprocal relationships with Tibet, Shandong, Jilin, Yunnan, and Guizhou, it connects to
these provinces by receiving officials from them. Beijing also connects with Qinghai,
Sichuan, Zhejiang, Hebei, Hubei, Guangdong, and Ningxia by sending officials to these
provinces. It is unclear why Beijing forms different relationships with different provinces,
although in general, the provinces sending officials to Beijing tend to be less
economically prosperous than those receiving officials from Beijing (with the exceptions
of Shandong, Qinghai, and Ningxia). Beijing may be a promotion destination for those
officials who have done a good job in administrating poor provinces; it is also possible
that Beijing is a necessary career step for officials from poor provinces before they are
seen as qualified to enter the CPC Central Committee. Officials’ career trajectories after
entering the CPC Central Committee does not change the relationships between Beijing
and other provinces, as revealed in Figure 26. The relationships between Beijing and
other provinces remain the same in this analysis, although the relationships among the
various provinces experience minor changes.

102
Figure 25. Ego-centered relationships of Beijing, before officials enter CPC CC.
Figure 26. Ego-centered relationships of Beijing, officials’ entire career.
Anhui
Beijing
Guangdong
Guizhou
Hainan
Hebei
HeilongjiangHubei
Jilin
Ningxia
Qinghai
Shandong
Shanghai
Sichuan
Tibet
Yunnan
Zhejiang
Anhui Province
Beijing Municipality
Guangdong Province
Guizhou Province
Hebei Province
Heilongjiang Province
Hubei Province
Jilin Province
Ningxia Hui Autonomous Region
Qinghai Province
Shandong Province
Shanghai Municipality
Sichuan Province
Tibet Autonomous Region
Yunnan ProvinceZhejiang Province
103
When a structural equivalence model is applied to the data, the provinces are
grouped into sub-groups based on their relationships with each other. Figure 27 presents
the hierarchical clustering results based on the data of the officials’ careers before
entering the CPC Central Committee. The dendrogram displays groups of provinces that
are relatively similar to each other by minimizing the Euclidean Distance (dissimilarity)
among the provinces. Provinces within the same group occupy similar positions in the
network; therefore, within each of the groups, we can choose one province to be the
representative for the group, enabling us to study this group’s relationships with other
provinces occupying different positions (groups). Organized by data of the officials’
careers before entering the CPC Central Committee, the provinces are grouped as follows:
G1: Chongqing, Fujian;
G2: Zhejiang, Guangdong, Xinjiang, Beijing, Tianjin, Jiangsu, Henan;
G3: Hainan, Inner Mongolia, Ningxia;
G4: Shanxi, Anhui, Sichuan, Qinghai, Liaoning, Hebei, Hunan, Guangxi, Jiangxi;
G5: Heilongjiang, Shandong, Shanghai, Hubei, Jilin, Tibet, Gansu, Guizhou, Shaanxi,
Yunnan.

104
Figure 27. Province structural equivalence dendrogram, before officials entered CPC CC.
Figure 28. Province group reduced graph, before officials enter CPC CC
And the relationships among these groups are as shown in the reduced graph in
Figure 28. Interestingly, Group 2 and Group 5 have exactly the same relationships with
G4
G2
G1
G5
G3

105
any other groups in the network. Both groups send officials to Group 1 but do not receive
officials from that group. Both groups form reciprocal relationships with Groups 3 and 4.
From the structural analysis, it is clear that Groups 2, 4, and 5 occupy higher positions
than other groups in the sense that they have the access to the most groups within the
network, although Groups 2 and 5 are better connected (connected with reciprocal
relationships) with Group 3, whereas Group 4 is more closely connected with Group 1.
Group 2 is largely formed by provinces in the Eastern region—five out of the seven
provinces in this group are in the Eastern region. Group 5 is primarily formed by
provinces in the Middle and Western regions.
A similar analysis was conducted based on the officials’ entire career histories.
Figure 29 presents the hierarchical clustering results of this analysis. The grouping is not
very different from the previous one, especially at the lower level of dissimilarity. The
groups are as follows:

106
Figure 29. Province structural equivalence dendrogram, officials’ entire career.
G1: Chongqing, Fujian;
G2: Zhejiang, Guangdong, Xinjiang, Beijing, Tianjin, Tibet, Henan, Jilin, Inner Mongolia,
Ningxia;
G3: Shanxi, Anhui, Sichuan, Qinghai, Jiangsu;
G4: Hebei, Jiangxi, Liaoning, Gansu, Hunan, Guangxi;
G5: Hainan, Heilongjiang, Shandong, Shanghai, Hubei, Guizhou, Shaanxi, Yunnan.

107
Groups 2 and 3 form the same relationships with other groups in the structure, as
do Groups 4 and 5, although Groups 4 and 5 form weaker relationships with Group 1
than with Groups 2 and 3. Figure 30 shows a fragmented power structure in the sense that
all the groups except Group 1 show similar patterns of relationships with all other
positions in the structure. No single dominant power position emerges within the
structure. This observation supports the hypothesis that the central power reshuffles the
local positions of the elite officials who entered Central Committee, controlling the
balance of the power among different regions.

108
Figure 30. Province group reduced graph, officials’ entire career.
5.7 Summary
The analysis of the political career data of the officials who have served in the
Communist Party of China (CPC) Central Committee (CC) has reaffirmed the trend that
the central government has displayed an increasing appreciation of local experience in
recent years. It is notable that not only do the current terms of the CPC CC show a higher
G3G2
G1
G4G5

109
percentage of officials with local experience, but also that the officials who have served
the most terms in the Central Committee have more local experience.
The unequal provincial representation revealed by this analysis has no clear
explanation. This shows the importance of investigating what has contributed to the
different relationships between the center and the provinces. First, the inequality among
provincial representation in the CPC CC is not due to population differences. The
correlation between population and the number of officials who have entered the CPC
CC is close to zero. Second, when we consider unequal provincial representation, we
must take into consideration both where and how long the officials have served at the
local level before and after entering the CPC CC. In some provinces, officials tend to
serve longer at the local level before being elected to the CPC CC. Third, provinces also
hold different places in officials’ careers prior and after joining the CPC CC. Some
provinces tend to yield a higher percentage of officials who serve in the province as the
last step of their career before entering the CPC CC, but some provinces serve a more
transitional role, acting as stepping stones for officials to pursue higher positions. Having
considered all three factors—the numbers of officials who have served in the province,
the duration they have served, and the percentage for whom the province was their last
local step before entering the CPC CC—we can develop a more complete depiction of the
political prestige of a province in terms of the provinces’ roles in central officials’ careers.
Social Network Analysis echoed the main findings above but enabled us to
develop a more structured analysis of the connections among the provinces and between
each province and the center. Some provinces formed closer relationship with each other,
as evidenced by more official exchanges occurring between these provinces. Notably,

110
Beijing has the largest number of connections with other provinces. Using the structural
equivalence model allowed me to group the provinces and show simplified structures of
the grouped provinces with reduced graphs.
However, the reasons for the differences in province prestige were not revealed
by this analysis. As suggested by previous studies, GDP is an important performance
evaluation index that affects the promotion of officials in a given region. This study
shows a similar conclusion based on the correlation coefficients between GDP and the
number of officials from a province that have entered the CPC CC. Economically
advanced provinces tend to have larger numbers of officials in the CPC CC. This is more
obvious when the time effect is considered.
However, GDP alone is too simple an explanation for the movement of officials,
and the transfer of political positions or officials can only reveal a partial understanding
of the relationships between the center and the provinces. The following chapters will
investigate three case studies, allowing us to look deeper into questions regarding the
relationship between the central and local governments and the mechanism of how these
relationships affect development.

111
Chapter 6
Case I: Tianjin—the Coherent Collaborative Platform
Tianjin is a city in Northern China. It is one of the four municipalities in China
that is controlled directly by the central government, along with Beijing, Shanghai, and
Chongqing. It is located along the west coast of the Bohai Gulf, and bordered by Beijing
75 miles to the northwest. It had a population of 7,764,141 in 1982; this number
increased by an average of 12.5% each decade from 1980 to 2000, and increased by 31.4%
in the past decade. By 2010, Tianjin had a population of 12,938,224, and by 2013, had
14,720,000 residents.
Figure 31. Map of the location of Tianjin. Source: Maps were retrieved from Google Maps and
China Explorer on China Data Online on February 10, 2015
6.1 First Phase: Minimal Central Involvement and Unconditional Local Support

112
Tianjin Binhai New Area began with the development of its central area, the
Tianjin Economic Development Area (TEDA). This central area was set up as one of the
first 14 national development zones in China in the early 1980s. However, in the 1980s,
Tianjin was not an area blessed by heavy investment from the central government. On the
contrary, due to the close proximity between Tianjin and Beijing, the center had long
intentionally restricted Tianjin’s development to ensure Beijing’s dominant economic
status in North China. As a result, the municipality’s financial relationship with the
central government is strained. From 1949 to 1988, Tianjin’s total local revenue was 97.7
billion yuan, but 60.1 billion, or 62%, of that was given to the center as remittances.
Meanwhile, the total investment made in Tianjin by the central government was less than
25% of that given to Shanghai and one third of what the center provided to Beijing. The
center invested a large amount of capital in developing Beijing’s industrial projects, such
as Shougang Corporation (National Capital Steel Making), and this preferential treatment
created a strained competitive relationship between Beijing and Tianjin(Wu, 2009).
Tianjin
Beijing
Binhai New Area
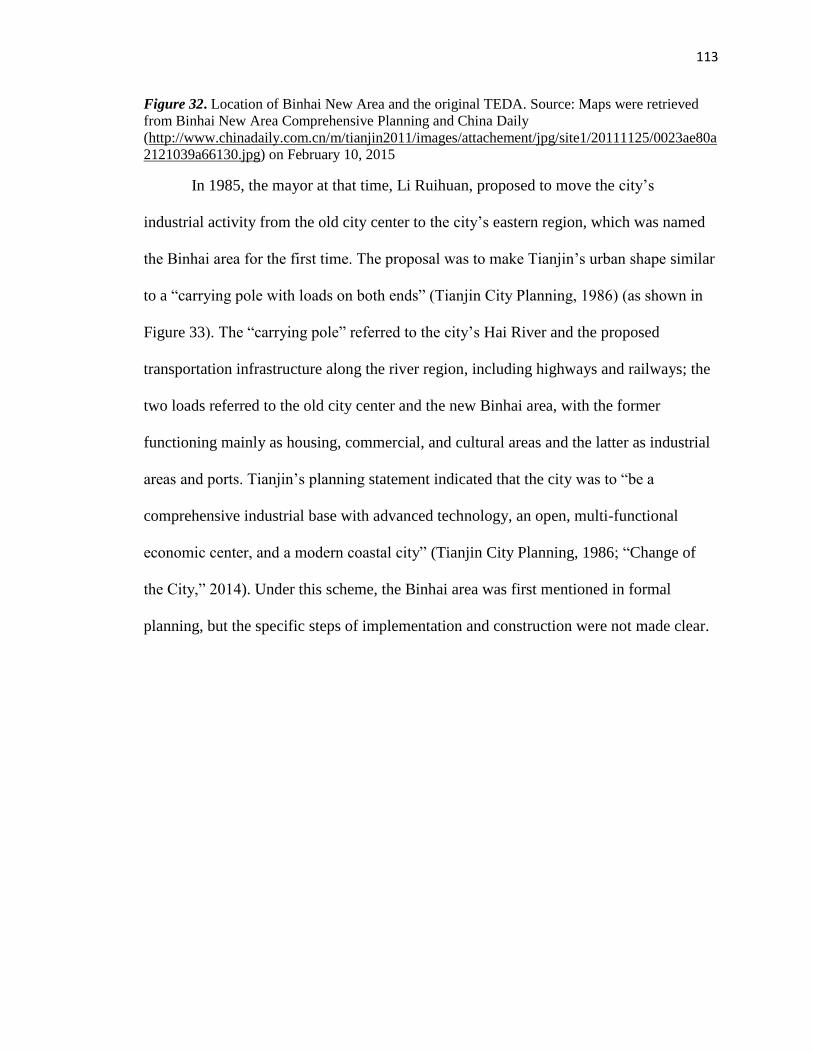
113
Figure 32. Location of Binhai New Area and the original TEDA. Source: Maps were retrieved
from Binhai New Area Comprehensive Planning and China Daily
(http://www.chinadaily.com.cn/m/tianjin2011/images/attachement/jpg/site1/20111125/0023ae80a
2121039a66130.jpg) on February 10, 2015
In 1985, the mayor at that time, Li Ruihuan, proposed to move the city’s
industrial activity from the old city center to the city’s eastern region, which was named
the Binhai area for the first time. The proposal was to make Tianjin’s urban shape similar
to a “carrying pole with loads on both ends” (Tianjin City Planning, 1986) (as shown in
Figure 33). The “carrying pole” referred to the city’s Hai River and the proposed
transportation infrastructure along the river region, including highways and railways; the
two loads referred to the old city center and the new Binhai area, with the former
functioning mainly as housing, commercial, and cultural areas and the latter as industrial
areas and ports. Tianjin’s planning statement indicated that the city was to “be a
comprehensive industrial base with advanced technology, an open, multi-functional
economic center, and a modern coastal city” (Tianjin City Planning, 1986; “Change of
the City,” 2014). Under this scheme, the Binhai area was first mentioned in formal
planning, but the specific steps of implementation and construction were not made clear.

114
Figure 33. The changing shape of the “carrying pole with loads on both sides” from 1995 to 2009
(from left to right: residential densities of 1995, 2005, 2009). Source: Binhai New Area
Comprehensive Planning Revision, 2013.
When the development zone policy was first implemented, local governments
were asked to enhance their infrastructure and to bear the financial and management
responsibility for all construction and other aspects of the project. Beginning in the 1980s,
the central government had implemented a revenue-sharing system in which the taxes
were collected at rates determined by the center, but were gathered by the local
governments and then transferred to the center from the provinces in the form of
remittances, governed by independent contracts between the center and the provinces. To
incentivize subnational economic development, the center allowed the majority of the
income to be kept at the provincial level, with the exception of a few specific provinces
and provincial-level cities. Poorer provinces were allowed to retain a higher percent of
tax income and also received transferred revenue from the central government. The
provincial government was responsible for approving the budgeting plans of the lower-
level governments, including the municipal and county levels. Through this reform,
subnational governments were given greater autonomy in approving project investments
and expenditures (Bahl & Wallich, 1992; Bahl & Linn, 1992). Additionally, as reflected

115
in the policies for the zones, under the new decree, the local levels were permitted to
lower the revenue tax on construction projects that utilized foreign investment. Municipal
governments were also allowed to charge lower land use fees within the center’s
permitted range. At the same time, development zones were required by the central
government to rely on local funding for development. It was specified in the conference
summary establishing these zones that “to open up the coastal cities and make a success
of Special Economic Zones, do not expect the center will provide much money. Again,
the Center would only provide limited financial support, such as long-term low-interest
loans, and exempt the fiscal revenue turnover for five years for authorized Zones” (“The
Summary of the Conference,” 1984). In summary, the development zone policy can be
understood as granting greater economic and administrative autonomy to the subnational
governments, but at the same time, placing a heavier financial burden on them.
The early stages of the development of Tianjin’s Special Zone were
predominantly characterized by explicit bargaining, as summarized by the strategy of
“waiting for, relying on, and requesting” (deng, kao, yao) activity from the center. During
this phase, the municipal government frequently and explicitly asked for special
treatment and negotiated with the center regarding financial support. This was not
unusual: Tacit agreements on “unconditional support” and interpretive flexibility
regarding formal institutions have long given ample room for the local governments to
argue and take actions they deem proper and favorable to maximize their benefit in a
given situation.
“Unconditional support,” a term that was commonly used in newspaper and books
recording the government’s development of the special zones, refers to two kinds of

116
support: (a) support from municipal and provincial governments given to the zone
management committee, usually considered to be a branch of the municipal government
and directed by a person who directly reports to the mayor and (b) support given by the
different government levels to investors.
At the beginning of the establishment of the development zones, money was not
the only bottleneck. It was as hard, if not harder, to obtain authorization on projects of
varied scales from all different levels and departments of governments. Just as in the pre-
reform period, the central government maintained its hold on power by retaining tight
control over authorizations. Management chaos created unimaginable barriers to winning
approvals on any single investment project, and missing an approval from even one
department could create an unending suspension on a project and on zone development,
along with a heavy loss to investors. However, while getting approvals could be
extremely difficult, it also could be made very easy with a few words from the right
officials. If approval was granted by the municipality or the province, or even by certain
individual high-level officials from the center, getting approvals from lower-level
government departments suddenly became simple. Such an agreement of support was
understood among all development zones, but how much support each zone actually
received relied on the results of explicit bargaining between the local officials and the
central government (Interview, July 2013).
With unconditional support from the higher levels of governments, the local zone
officials were given flexibility in interpreting formal rules. As long as a new policy or
practice was not “too over the line”—a rather subjective judgment—the local government
was not required to receive approval from the upper-level government, including the

117
center (Interview, August 2013). For example, in the early stage of zone development,
despite the industrial plan’s vision of attracting high-tech sector investment and
businesses from Europe and the United States, local governments were eager to take any
kind of foreign investments. Most businesses attracted to Tianjin in the early stage,
spanning from 1984 to 1991, were small businesses from Southeast Asian with an
average market cap of about 1 to 2 million yuan, primarily in the low-end manufacturing
sector, including bicycle making, shoe making, and kite making firms (Liu, 2009, p. 46).
This industry trend, attracting smaller and less prestigious manufacturing businesses, did
not change until Motorola’s establishment in Tianjin, the result of a combined effort by
the city and the national government.
The municipal government was also allowed to establish different administrative
and fiscal relationships with development zones. As with other development zones,
Tianjin’s development zone did not receive special funding for construction. However,
unconditional support meant that certain other concessions were made. For instance, the
zone management committee was allowed by the municipality to keep all the revenues
for zone development and was guaranteed that there would be no barriers to obtaining
project approvals. When the Tianjin zone was first established in 1984, Li Ruihuan, the
mayor of Tianjin at the time, told the zone’s chief official that the municipality would not
provide any money for construction; rather, he presented the development of the zone as
a challenge to the abilities of the appointed zone officials. “If the government could give
you a billion yuan to develop, there would be no surprise that you can do it” (Liu, 2009,
pp. 41–42). Despite the lack of financial support, the city granted the zone a “three-no
policy”—no funding, no charging, and no remittances. The zone was also granted a city-

118
level authorization right, which meant that the zone director would not have to report
every construction project in the zone to the city. More importantly, the development
zone was granted a higher support priority than other governmental offices in the city. At
the city cadre conference, Mayor Li Ruihuan stressed that all departments and personnel
should give full support to the development zone and give them “green light only!” (Liu,
2009, p. 42).
6.2 Motorola
The establishment of the first Motorola plant in China was a significant example
of bargaining that involved three main parties: the central government, the local
government of Tianjin, and Motorola. Motorola was able to manipulate the different
business development roles of the central and local governments to maximize its benefits
in China.
Although high-level management within Motorola had shown sporadic interest in
accessing the Chinese market, the company did not engage in significant research or a
serious attempt at entering the market until the 1980s. In the early to mid-1980s, despite
reluctance from senior management, the discussion about accessing China’s market
became more heated as entering the country became easier—for example, people from
Hong Kong, where Motorola already had an Asian presence, were allowed to enter the
People’s Republic of China (PRC) (Avishai, 1996).
Around the same time, China became interested in attracting large-scale foreign
companies like Motorola, as the country was eager to have international partners to help
advance its technology. Communications between the two parties became viable. The

119
Ministry of Machine Building, which oversaw equipment production in China, opened
negotiations with Dan Szymanski, who was the corporate vice president of Motorola at
the time. Like many other developing countries in that period, China had a strict policy
requiring joint ventures to maximize the possibility of technology/knowledge transfer and
other benefits.
But from Motorola’s perspective, a joint venture was too risky, as China did not
meet the company’s technical manufacturing requirements. Motorola sent a
manufacturing expert, Rick Chandler, to China to visit about 30 Chinese facilities in an
effort to research potential partner factories. But Chandler concluded that each of these
Chinese factories lacked the technology, knowledge, and skills to partner with Motorola
in China. For example, Chinese industry had no inventory methodology or planning—at
that time, factories bought a certain number of parts and machines simply because the
government told them to. The workers had no idea how to choose machines, nor did they
know what to do when a machine stopped working. Management skills were mostly
derived from military training, as most factory managers were veterans. Compounding
the issue, the government did not provide any training. Chandler concluded from this trip
that Motorola should not accept any form of joint venture partnership in China; the
company would only participate in the development effort if it could be a wholly owned
subsidiary. Chandler convinced Szymanski, the corporate vice president, of this; in turn,
he reported the findings and his views to Bob Galvin, the chairman of the executive
committee (Avishai, 1996).
Despite this skepticism about China’s manufacturing capabilities, Motorola
actively engaged with a number of high-level Chinese central officials. In the late 1970s,

120
C. Travis Marshall, who then was the head of Motorola’s Office of Government
Relations in Washington and later appointed chairman of the United States delegation to
the International Telecommunications Union Conference by the first Bush administration,
realized the importance of encouraging governments in developing countries to change
their telecommunications rules and open their markets in order to encourage
telecommunications development. In the early 1980s, therefore, Marshall began to
promote the idea of spectrum management to high officials in foreign governments,
including key officials in the Ministry of Posts and Telecommunications in China. In
1984, Carl Lindholm, the executive vice president for International Operations at
Motorola, led the establishment of a China Country Council in Hong Kong. Marshall
introduced a number of officials to the Council, including Li Tieying, who headed the
Ministry of Electronics Industries. After discovering that fewer than 10 companies,
including Coca-Cola, had actually accepted entering China as a joint venture, although all
interested investors were told about the supposed requirement, Motorola reaffirmed its
insistence on a wholly owned subsidiary approach. Marshall and Lindholm reiterated this
position to several high officials in China, including Li Tieying (Avishai, 1996).
As it was too politically fraught for central officials to provide preferential policy
exemptions for a particular company, local officials were sometimes asked to assume the
risk of advocating for foreign firms. However, this arrangement only worked if the local
levels were exempted from any liability. Because China was eager to bring Motorola into
the country, the central leadership privately sought out local authorities willing to take the
risk of hosting a wholly owned subsidiary; this would avoid the kind of confusion and
potential conflicts or disagreements that might occur if the central government itself was

121
seen to be publicly accepting private ownership. After the minister of the Ministry of
Electronics Industries, Li Tieying, came back from a visit to Motorola in the United
States, he called Ye Disheng, who was the director of Tianjin’s development zone and an
expert in semiconductors, and asked him if the Tianjin development zone could host a
wholly owned subsidiary. Ye accepted immediately, unwilling to show hesitation in front
of a central leader, and reported this possible investment to Tianjin’s mayor, Li Ruihuan
(Liu, 2009, p. 49). Subsequently, Ye and Mayor Li became the major lobbyists in the
State Council for a special policy exemption that would allow wholly owned subsidiary
companies to be located in Tianjin. For some time, the Tianjin development zone
“became a crucial advocate for the company inside the national government” (Avishai,
1996, p. 5). In a particularly telling incident, the vice-mayor of Tianjin once said to
Motorola’s Lindhomd: “Look, I want you here, you’re going to be here, I’m going to
make it work for you” (Avishai, 1996, p. 59).
With this implied backing by the central government, the municipality and the
development zone of Tianjin became the main supporters for Motorola’s activities in
China. As documented in Avishai (1996)’s report on Motorola’s history in China, “the
willingness of Chinese officials to overlook (or, at least, broadly interpret) the details of
what has been negotiated … has been a linchpin of the company’s success.” Two
examples can clarify the meaning of this statement. In the 1980s, faced with unstable or
insufficient electricity supplies, it was common for cities to sometimes engage in rolling
blackouts in order to save power. But Ye Disheng, the director of the Tianjin
development zone, made the city’s Electricity Bureau promise not to cut off the
development zone’s electricity. In exchange, Ye promised to give the bureau ownership

122
of all power stations in the development zone. Ye was then able to promise Motorola that
there would never be power outages at the site, which was an extremely powerful
reassurance (“Development Zone’s Explorer: Interview with Ye Disheng,” 2008; “Ye
Disheng: The Witness of the Big Change of Tianjin Binhai New Area,” 2008).
Another example involved the negotiations regarding labor unions. China’s
constitution requires that every enterprise have union representation, but Motorola had a
non-union policy. Eventually, the two parties came to an agreement that allowed a
flexible interpretation of the concept of a union. The union for Motorola China would be
“the organization or individual in the company that ensures that employees are trained to
do their job, get welfare, benefits, housing, etc., and get recreational benefits, and are not
abused or unfairly treated” (Avishai, 1996, p. 51), instead of being an organization that
would negotiate wages and benefits with the company. In light of this definition,
Motorola was able to point to its employee relations department and training department
to convince the Chinese Ministry of Labor that it had indeed established the necessary
union (Avishai, 1996, p. 51).
These two factors—unconditional support, from the central government and
especially from the local government, and flexibility of interpretation—eventually earned
Tianjin the first Motorola factory in China, which was established as a wholly owned
subsidiary in 1990. At that time, with an initial $120 million investment, Motorola
became the largest foreign investor in China since it opened to outsiders. In the 10 years
after its establishment in China, Motorola has become quite important to Tianjin
Economic Development Area (TEDA), both because it provides tax revenue and because
it attracts other business in the value train, encouraging them to establish a presence in

123
TEDA. TEDA also credits its status as a primary area for U.S. investment to this initial
involvement by Motorola. To date, Motorola has invested $3.8 trillion in China,
including $1 trillion for research and development.
A conclusion drawn by Motorola officials reflects the presence of two powers in
China, but more importantly, indicates their relationships with business practices in the
country: “We were facing both a centralization and decentralization of power in China.
We had to learn how to deal with both. The central government may qualify you as a
supplier, but you must fight it out at the local level” (Avishai, 1996, p. 60). In this early
period, the center established incentive structures through a decentralizing fiscal reform
and granted the local governments autonomy over local economic development affairs.
The tax sharing system and expenditure autonomy incentivized the pursuit of active
development policies at the local level. As a result, considerable local development
emerged in this era. However, the center gradually found itself losing control over
macroeconomic issues, leading to the fiscal crisis of the early 1990s, which was followed
by a fiscal reform in 1994 and the implementation of a number of other policies intended
to tighten the center’s control over the subnational governments.
6.3 Second Phase: Gaining Financial Independence and the Center–Local
Conflicts
In the first stage of the creation of the development zone, Tianjin and TEDA
relied on the center to grant special policies supporting the zone. The local government’s
strategies were summarized by the idea of “Waiting, relying, and asking” (deng, kao,
yao). Historically, Tianjin was the site of heavy industry in northern China. The local

124
government did not have much experience with opening up, nor much faith in the
concept. In one of the trips Deng Xiaoping made to TEDA in 1986, a young official
asked him whether the “opening up” policy was going to end. Deng reiterated his
dedication to the idea of opening China and further commented that “opening up is to let
go (of the authority); nothing can be alive if not letting go,” a statement which later
appeared in People’s Daily, the official newspaper of China.
Beginning in the 1990s, the Binhai area began to emerge as an economic center in
northern China. In 1993, the city decided to modify its planning to place emphasis on the
Binhai area. The aim at that time was to make the Binhai area a comprehensive economic
district with focuses on high-end technology, exports, heavy chemicals, and business and
financial development. The city became the main driver of the Binhai area’s development.
At the 12th Tianjin People’s Congress Assembly, the mayor, Zhang Lichang, announced
that Tianjin would finish the construction development of Binhai New Area in 10 years.
Moreover, the goal of the Binhai area was to be the “economic center of Bohai Coastal
Region” (“Binhai New Area”, 2007). In 1994, the city government established a task
force, the Tianjin Binhai New Area Leadership team, and soon established the Tianjin
Binhai New Area Office. Its task was to integrate the different small zones and districts
that made up the large development area, subjecting them to the coordinated leadership
and planning of the New Area Office.
The relationship between the central government and the municipality of Tianjin
became more complicated as the city gained more independence in planning and
implementation; the situation was especially fraught when there were conflicts with
neighboring Beijing’s plans. The central government had a number of concerns regarding

125
Tianjin’s development and its goal of becoming the economic center of the northern
region. When this plan was sent to the central government for authorization, the center
required planners to add the adjective “important” in front of “economic center of
Northern China,” reflecting the center’s reluctance to acknowledge Tianjin as rivaling
Beijing as the economic center of northern area. In the meantime, the center changed the
expression “Binhai New Area” to “Binhai Town Center,” seemingly to avoid having to
acknowledge Binhai’s national status. The city’s planning was modified beginning in
1994, but the plans were not authorized by the State Council until 1999.
Despite these setbacks imposed by the central government, the municipality of
Tianjin strived to maintain financial balance while rapidly developing the city. After
operating under the fiscal contracting system for more than 10 years, the central
government eventually realized the seriousness of the fiscal difficulties facing the
provinces. Starting in 1994, a new fiscal and tax assignment system was adopted. During
this time, zone development became a highly localized economic development strategy.
In Tianjin, the zone suddenly had to not only support itself, but also contribute to
development happening beyond its boundaries. The zone had always been self-financing,
but now it had to generate additional revenue to support development elsewhere in the
municipality—a broader area that covers neighboring districts that were later combined
with the original zone to become the Binhai New Area (Tianjin Municipal Archives,
2008). Local state-owned enterprises were established by the municipality and zone
governments as financing apparatuses. The Tianjin Development Zone provides a critical
example of how zone-established state-owned companies were used as public service

126
providers, infrastructure contractors, and financing channels to promote local
development.
TEDA Holding, the largest zone-level state-owned enterprise in Tianjin, was
established in 2001 as the result of a merger of three state-owned companies in the zone
(Tianjin Municipal Archives, 2008). The first enterprise of the TEDA series, TEDA
Investment Holding Co., Ltd., was originally established in December 1984 as TEDA
General Company. It was formed by the zone committee to develop land and
infrastructure and attract businesses to the area. It also led subsidiary companies that
operated businesses in public services, including heating and electronics; power water,
gas; gardening and landscaping; public transit; sewing; bridge maintenance; and
sanitation. This sort of general-purpose enterprise was common among all development
zones at that time and these enterprises have been an indispensable part of zone
development.
The second large state-owned corporation, TEDA Group, was established in 1994.
Although it was not explicitly stated in public files, evidence has shown that this
company was established to solve debt problems that plagued many of the state-owned
companies in the zone and even the municipality. The TEDA Group did not have a clear
scope of business when it was first established. Its main activities were to consolidate and
regroup a number of businesses. For example, in 1996, when the zone’s state-owned
trading company became insolvent, TEDA Group assumed its 80 million yuan debt and
repaid 60 million yuan to the bank. The bank then provided a 300 million yuan loan to
the company. In this way, the trading company avoided bankruptcy and continued to do
business, the bank avoided bad debt, and the TEDA Group gained capital support

127
(Tianjin Municipal Archives Vol. 3, 2008, p. 45). Thereafter, the TEDA Group gradually
emerged as a major instrument for the zone government to accumulate capital and to
increase its financing ability. It later merged several small state-owned companies and
absorbed them into the group. In 1997, with the support of the Tianjin municipal
government, TEDA Group merged with Tianjin Meilun Holding and launched a
backdoor listing on the Shenzhen Stock Exchange.
The Meilun merger deal became a classic example for backdoor listings of state-
owned companies in China in which the municipal government played a significant role;
thus, it is worth detailing here. Meilun, a textile company that was mainly held by Tianjin
Textile Industry Corporation, formerly known as Tianjin Textile Bureau, had been listed
on the Shenzhen Stock Exchange since 1996. Around 1996, Meilun’s performance was
deteriorating and the company subsequently lost its qualification for obtaining capital
from the market. At the same time, the TEDA Group lacked the necessary money for
expansion. Supported by their connections at the municipal level, the two companies
decided to merge. First, the textile company, Meilun, purchased Binhai Bridge, a turnpike
road connecting the south and the north areas of the zone, for 400 million yuan. The use
fees from the bridge then became the main revenue for Meilun, transforming it from a
textile company into a transportation infrastructure holder. The purchase of the bridge
and the promise of future revenue increased Meilun’s working capital from 300 million
to 700 million yuan . After this purchase, Meilun restructured its capital and its business
scope. At the same time, the municipal government granted the 53,113,284 state-owned
shares of Meilun (39.94% of Meilun’s total shares) to the TEDA Group, which made the
TEDA Group the majority shareholder in Meilun. Eventually, Meilun’s company name

128
was changed and the merged company was listed as TEDA on the stock exchange. Its
business scope also changed from textile manufacturing to hotel, trading, financial, and
real estate concerns. Without undergoing the complicated process of stock market
supervision and authorization, the municipality and the zone governments successfully
put TEDA Group onto the stock market. The capital assets of TEDA Group increased by
11 billion yuan in 12 years, as its stock price increased from 8 yuan in 1997 to 214 yuan
in 2009, making TEDA a significant financial pillar for the municipality and the zone
(Tianjin Municipal Archives Vol. 3, 2008, p. 45; Zhang & Shen, 2011).
The third company that would take part in the merger was Construction Group,
formerly known as Tianjin Binhai Construction Company, established in 1984. Under an
arrangement by the municipal government, it was regrouped with another seven state-
owned companies in the construction and real estate industries and was granted their
shares at no cost in 1995. The Construction Group soon concentrated on real estate
development (Tianjin Municipal Archives, 2008).
These three companies—TEDA Holding, TEDA Group, and the Construction
Group— merged and became TEDA Holding in 2001. The company’s main function was
still to represent the government’s development interests, investing in infrastructure
construction and land development, with a higher ambition of controlling the main fixed
assets in the zone. From 2002–2004, TEDA Holding invested 8 billion yuan in public
services, which was 44% of the total investment in this sector in the past 20 years. Of the
360 million yuan the company invested over the last 14 years, 45% was invested from
2002–2004. By 2004, TEDA Holding’s real estate capital had reached 13 billion yuan
and it controlled more than 100 square kilometers of land in the zone (Tianjin Municipal

129
Archives Vol. 3, 2008, p. 67). With such extensive capital and political resources, TEDA
Holding became a desirable partner for private companies. For example, Wantong Real
Estate, one of the top five real estate companies in China, had to collaborate with TEDA
Holding after Wantong encountered difficulties in obtaining land in 2002, when Tianjin
began to use bidding as the primary means for private party land purchases (Tianjin
Municipal Archives Vol. 3, 2008, p. 52).
TEDA Holding cannot be understood as an independent company without
acknowledging its connection to the government and, in particular, its role as a financial
apparatus for the municipal and zone governments. Its low return on investment (ROI) in
some of its businesses, especially in the public service sector, does not make economic
sense from a purely business standpoint. In fact, by 2010, the company’s total assets had
reached 164.8 trillion yuan, but its return on assets (ROA) was only 3% (Zhang & Shen,
2011, p. 104). Some of its businesses, such as public service and infrastructure
development, are long-term investments that do not yield profits or, in some cases, even
run a deficit for the company. For example, the company held 8 trillion yuan in assets in
the energy supply public service sector in 2009, but it took a net loss of 160 million yuan
that year, and the average net ROA in that sector was only 0.97%. Moreover, TEDA
Holding also suffers from limited financing channels. By 2009, bank loans accounted for
71% of its financing. Other channels include trust financing at 15%, financial leasing at
0.5%, and bond financing at 13.5% (Zhang & Shen, 2011, p. 104). The company has
primarily relied on banks for financing, which not only limited its financing ability but
has also made it heavily reliant on government support. In 2004, the zone government

130
had to give 3 billion yuan capital grant to TEDA Holding to lower the company’s debt
ratio (Zhang & Shen, 2011).
When Tianjin established its first local bank, TEDA Holding again played an
important role, acting as the government’s agent and becoming the shadow holder of
bank assets. As having solid financing channels became increasingly important for the
municipality and the zone’s construction efforts, the Tianjin municipal government began
to propose to the central government that a local bank should be established in Tianjin. In
2002, the central government appointed the former China People’s Bank governor, Dai
Xianglong, to be the mayor of Tianjin; Dai was also a major player in structuring the
Pudong Development Bank in Shanghai in the 1990s. Dai used the network he had
developed within China’s financial industry to accelerate the establishment of a new local
bank in Tianjin. In 2003, the China Banking Regulatory Commission approved the
proposal for the establishment of Bohai Bank (Liu, 2009, p. 105–113).
However, interested parties could not settle on the ownership structure of the bank,
especially regarding the designation of its major shareholder. As a governmental body
cannot be a legal holder of a banking institution, the municipal government wanted
TEDA Holding to be the controlling shareholder; this would allow the Tianjin municipal
government to fulfill its primary goal of using the new bank to finance the development
of the Binhai area. But the central government wanted to use this opportunity to import
risk management expertise and new investment models to China’s banking industry from
a foreign bank. In 2005, the central government signed a contract with the Asia-focused
British bank Standard Chartered. Standard Chartered promised to invest $123 million to
acquire 19.99% of Bohai Bank, which was the maximum legal limit for single foreign

131
investors to invest in a domestic Chinese bank. Nonetheless, the municipal government
still sought a way to involve TEDA Holding. According to Chinese banking law, to hold
shares of a bank, a company’s debt to capital ratio must be lower than 70%, which was a
requirement that TEDA Holding did not meet at the time. To maximize TEDA’s share in
Bohai Bank, the zone government allotted more than 3 trillion yuan debt from TEDA to
other companies. After extensive negotiations, a deal for ownership of Bohai Bank was
eventually struck: Standard Chartered would hold 19.99% of the bank; TEDA Holding
would have 25% of the shares; and China Ocean Shipping Company (COSCO), Bao
Steel, and China Development Bank, among other domestic firms, would hold the
remaining shares (Xinhua Net, August 12, 2005). Without the active support of the local
government, TEDA Holding could not have even become a legal partner in the bank, as it
did not meet the requirements for holding bank shares.
The municipal government’s use of TEDA Holding as an apparatus for
investment and business control is apparent from the case of Bohai Bank. The
government’s influence can also be see in the structure that TEDA Holding has
developed (Figure 34), covering a variety of business sectors that are critical to the local
economy. What this structure actually represents is the municipal and zone governments’
sectoral control over the economy through the vehicle of a government-established, state-
owned enterprise. From 1997 to 2005, the Binhai New Area GDP grew from 38 billion
yuan to 163 billion yuan, an average increase of 18.3% annually. The proportion of the
Binhai New Area’s GDP to the city’s GDP grew from 30% to 42%. Secondary industry
grew from 26 billion yuan to 109 billion yuan, an average growth of 19.6% annually. The
Binhai New Area is playing an increasingly important role in Tianjin’s municipal

132
economy, especially in the area of secondary industry. In addition, the bargaining
between the central and municipal governments became more implicit in this stage as the
municipality began to strategically manipulate its relationship with the center to gain
more local benefits.
Figure 34. TEDA Holding’s sectoral structure. Source: Adapted and translated from Zhang &
Shen (2011), p. 129
6.4 Third Phase: Collaborating with the Center
Although the Binhai New Area has been referred to as a key development area in
Tianjin by the municipal government, the central government has not similarly
acknowledged its great importance to the region. The municipality of Tianjin realized
that if the zone development effort did not scale up to the national level, it would likely
not succeed in gaining the kinds of massive projects and investments it sought. Public
Publicly Traded Companies
Companies
Sectors
TEDA Holding
Finance
Banking, Insurance, Stocking,
Fund, Trust, Guarantee, Pawnbroker
ST Sihuan
Real Estate
TEDA Group, TEDA
Construction, Taifeng,
Xincheng Investment, Binhai Mass
Transit
Jinbin Development
, TEDA, Wantong
Real Estate
Recycling
Recycle Electricity, Water
Recycling, Water
Treatment
Public Services
Water, Electricity,
Heating, Gas,
Infrastructure, Public
Transit, Rail Transit,
Landscape
Binhai Energy, Binhai
Investment, Tianjin
Development
Industrial Investmen
t
Tianjin Pipeline, Coating Material
Regional Development
Sino-Singapore Eco City,
TEDA Ocean City,
Egypt-TEDA
Industrial Park
Hotel
Wanli TEDA, TEDA
Holiday Inn, Central Hotel,
Convention Center, Logistic Group
Binhai Logistics

133
support from the central government is highly desirable, and is often considered
preferable to financial support because such public support has a great branding effect in
attracting big projects (Interview, September 2013).
The Tianjin municipality decided to seek such support from members of the
Chinese People's Political Consultative Conference (CPPCC). This phase of the area’s
development was characterized by a round of explicit bargaining. As an institution, the
CPPCC is not a main power in the center’s decision-making system, but it is a powerful
advisory body that connects to all high officials in the central government and, therefore,
can have a significant influence on the center’s decisions. Tianjin’s roundabout approach
in seeking support from the CPPCC and, through it, the central government, was highly
effective.
In 2003, a key member of the CPPCC, Bai Yuzhang, visited Tianjin. He was
invited to stay for the meeting of the CPPCC’s counterpart institution in the municipality,
which addressed accelerating the development of the Binhai area. Although Bai agreed
that this development plan was important and impressive, the CPPCC’s vice president,
Wang Zhongyu, later refused to report on Tianjin’s development plan to the central
government, because it contradicted the central policy at the time restricting the
development of all forms of development zones in an effort to deal with the national land
abuse issue. However, in a private meeting, Wang told the Tianjin municipal
representatives that they could edit the report to shift its focus from asking for more land
to focusing on national development needs for the Binhai area, such as stressing Tianjin’s
ability to use its saline-alkali land (a type of soil that is difficult to farm) for industrial
development instead of repurposing arable land (Cheng & Zhao, April 1, 2012; Wu, April

134
12, 2004). The representatives from Tianjin applied his advice and invited another key
member from the CPPCC to visit the region. The increasing support from the CPPCC
after several rounds of discussions eventually led to the submission of a jointly authored
report to the Central Secretary and the State Council Secretary in October 2004. This
CPPCC report, titled “Suggestions on Exerting the Effect of Tianjin Binhai New Area in
Invigorating the Regional Economy of Bohai Gulf Area,” suggested that the central
leadership, including the party and the State Council, should support the continuing
development of the Binhai area (Du et al., March 1, 2006). It also suggested that “central
leadership should help coordinate the economic relationship between Tianjin and Beijing
and its surrounding area” (Du et al., March 1, 2006). Premier Wen Jiabao subsequently
commented on the report that “the planning and construction of Tianjin Binhai Area is
not just about the long-term development of Tianjin but also will have an important
impact on invigorating the Bohai gulf area’s economy. This suggestion should be also
sent to the Development and Reform Bureau for research and their creation of the 11th
Five-Year Plan” (Liu, 2008, p. 158). This comment became the prelude to the central
government’s incorporation of the Binhai New Area into the national development
strategy.
Although it was making a concerted effort to scale the Binhai New Area
development up to the national level, the municipality’s main goal, as revealed in city-
level meetings, was to gain more land and financial resources for the city’s development;
the scaling up would simply help to promote its local interests. At the 2004 National
Meeting of Political Consultative Conference, the Tianjin representative advocated in his
annual report for the central government to approve an increased construction land quota

135
for Tianjin and to allow the municipality to keep more revenue locally. In a later report to
the center by the National Political Consultative Conference, other suggestions focused
on rights of authorization, land use, and revenue; the report also requested more
autonomy and special policy exemptions (“A National Political Consultative Conference
Report that Propels Binhai’s Construction,” 2006). When Premier Wen Jiabao visited
Tianjin in 2005, the mayor, Dai Xianglong, gave a report to the premier about the most
important local issues needing support from the central government. The first issue was
to upgrade the Tianjin Binhai New Area to a national-level New Area; the second, to
rearrange land-use planning in Tianjin. The mayor argued that the Binhai area had a great
deal of nonproductive land, but not enough land quotas to use for building and
developing it. The city urged the central government to declare the Binhai New Area an
experimental zone for land management institution reform, which would also
conveniently increase the city’s land quota. Third, the mayor also suggested that the
central government grant a higher revenue reserve for the city—for example, he
suggested that the center use 2004 as a base statistic and allow the city to retain any the
revenue that was lower than 15% of the previous year’s revenue and remit only 50% of
any part exceeding 15% to the central government (Liu, 2008, pp. 175–180). All the
suggestions from the local level were focused on increasing its land quota and revenue
retention; little was said about industrial development.
Beginning in 2005, the central government began to offer clearer support for the
Binhai New Area. In early 2005, the municipality’s consultative conference and its
national counterpart hosted a forum on the Binhai area’s “Development and Opening Up.”
After the forum, People’s Daily, which is considered the central government’s official

136
media outlet, published a four-part report in Situation Compilation (a limited-readership
publication for high officials) on “Research and Discussion on the Planning and
Construction of Tianjin Binhai New Area” (2005) (Cheng & Zhao, 2012). The National
Development and Reform Bureau also formed a task force to visit the Binhai New Area
and planned to include the development of Binhai New Area in the 11th National Five-
Year Plan.
At the end of 2005, the 11th National Five-Year Plan was published and approved;
it officially acknowledged the Tianjin Binhai New Area as a national New Area. Five
special policies were issued by the State Council, including making the Binhai area a
comprehensive reform experiment district, establishing a free-trade port in the area,
embarking on financial reform in the area, increasing the area’s supply of building land,
and lowering the tax rate for high-tech companies to 15% (50% lower than the normal tax
rate). However, of the five special policies, the first three, regarding reforms and free
trade, required additional research and discussions in order to be implemented; the
preferential tax rate policy is applicable to high-tech companies across China. This left
the policy increasing Tianjin’s supply of building land as the single most important
special policy for the Binhai New Area.
While the special policies were useful, the explicit support of the central
government was even more so, as it acted as a symbolic guarantee of investment returns,
helping the Tianjin municipal government to attract businesses to the zone. After the
Tianjin Binhai New Area was acknowledged as a national New Area, it was branded as
“the third pole” of China’s economy, after the Pearl River Delta and Yangtze River Delta.
This acknowledgement was understood as part of the center’s strategy of creating a third

137
concentrated area of economic development that could promote development in the
northern region. When centralized state-owned enterprises were asked to invest in the
Binhai New Area, the decision became one of whether the enterprises would support the
central government’s backing of Tianjin, rather than a mere investment decision
(Interview, September 2013). For domestic investors, investment in a center-designated
area, to some degree, is an implicit acknowledgement of the center’s authority and sign of
compliance with its decisions on development. For foreign investors, the center’s support
is a guarantee of progress and returns on investment, as revealed in the Airbus project and
summarized by one of my interviewees, who was a high official in the Tianjin Binhai
New Area Development and Reform Bureau:
“Support from the center is very important...The Airbus project was a good
example… The center would not directly tell Airbus where they should be located.
Instead, more subtly, the center will tell the company that Tianjin is an important
place that the center is going to focus on its development in the next several years.
Other projects, such as the carrier rocket project and the China-Singapore
Ecological City, experienced similar situations. The proprietors may pick several
places for comparison, but at the end they all chose Tianjin. This is also about
branding. When you go out to attract investment, you can say that this
development strategy is supported by the center and then people will listen to you.”
(Interview, September 2013)
When Tianjin learned that Airbus was planning to invest 7 trillion euro in China
to construct the first assembly line for A320 airplanes outside Europe, it was already late
in the establishment process: Airbus had already visited China and selected Shanghai,
Xi’an, and Zhuhai in Guangdong as potential sites. The mayor of Tianjin, Dai Xianglong,
dedicated himself to winning this project for the Binhai New Area and promised the zone
government that the municipal government would fully support the Binhai area’s
application for the project. Tianjin immediately launched a task force to collect

138
information about the A320 project and wrote reports to the central government to
express the city’s strong interest in being added to the shortlist of potential sites. Three
months later, Tianjin was listed as one of the candidate cities.
Compared to other potential sites, Tianjin did offer many advantages for an
advanced manufacturing industry. Both Guangdong and Shanghai were closer to large
ports. Shanghai Airport had already met the requirements for flight tests, and Shanghai’s
government promised to provide fully return tax payments and issue special land policies.
Guangdong’s Zhuhai City has a deep-water port, which was ideal for an airplane
manufacturing facility, as sea transport is the most economical method of shipping bulky
or heavy items. In addition, Southern China Airline, based in Guangzhou, had promised
to buy the first 150 Chinese-made A320 airplanes from Airbus. At the time, Xi’an was
the major airplane manufacturing base in China. It boasted high-quality human resources
and infrastructure appropriate for manufacturing. Compared to these competitors,
Tianjin’s only arguable advantage was that the city has a second-tier college, the Civil
Aviation University of China, which provides education on relevant subjects.
After a few rounds of debates, the final determination on the location of the new
facility was to be made by the central government, because Airbus was indifferent to the
final choice between Tianjin and Zhuhai, in Guangdong. Lobbying became extremely
important. Tianjin officials submitted a report to the State Council, titled “Regarding
Sincere Request for Selecting Tianjin as the Site for Airbus A320 Assembly Line,” and
visited the State Administration of Science, Technology, and Industry for National
Defense, a department under the leadership of the State Council and the army, to ask for
as much support as possible. At the same time, high officials from Guangdong visited

139
Beijing repeatedly and consulted with the Beijing University of Aeronautics and
Astronautics and the Second China Aviation Industry Corporation. In addition, these
institutions and China Southern Airlines Company signed a collaboration memorandum
and actively lobbied the National Development and Reform Commission for the Airbus
project to be located in Zhuhai, Guangdong.
A subtle change redirected the conversation in 2006. The State Administration of
Science, Technology and Industry for National Defense suggested that the site selection
should be part of a national strategy rather than a decision about local development. This
suggestion signaled the center’s preference in the matter, as the State Council and the
army led the administrative department making the suggestion. As Tianjin was included
in the 11th Five-Year Plan, this national focus then made it proper to recommend Tianjin
as the project site. The National Development and Reform Bureau and the State Council
agreed and endorsed the proposal.
It is debatable what “center-supported” actually means—special policies are no
longer special, and the central government has not been directly involved with planning
and consultation with Tianjin. Any support offered is empty—a declaration of support
with no material backing. But the public, local officials, and investors nevertheless
respond positively to this show of support. Local officials fight to obtain it, and investors
flock to the places given the approval conveyed by the “national area” designation.
Central support may be a myth, but it still works—the public show of support helps zones
to attract businesses and deliver positive investment outcomes, as seen in the cases of
Shanghai, Shenzhen, and now Tianjin Binhai.
6.5 Fourth Phase: Losing Control and the Development of a “Ghost City”
140
In May 2006, in response to Tianjin’s plans for developing the Binhai area, the
State Council issued its “No. 20 document” regarding the promotion of Tianjin Binhai
New Area development. The main purpose of this document was to confirm the Binhai
New Area’s status as the experimental site for a series of financial, land, and
administrative reforms. Financially, the Binhai New Area was instructed to prioritize
reform and experiment with industrial investment funding, venture capital, financial
institutions with different types of ownership structures, foreign currency management
policy, and so on. In terms of land, the document allowed Tianjin to engage in land
reform to increase the government’s capacity to regulate land supply without relying on
increasing its land quota. The central government also promised to grant the Binhai New
Area special aid from the central fiscal budget. Later, Binhai was given 10 trillion yuan in
aid and a 50 trillion yuan ($8.3 trillion) government loan.
However, although the central government emphasized reform in this official
document and made Tianjin Binhai an experimental site for developing such reforms, the
municipality of Tianjin did not interpret the Binhai New Area in a reform context. Rather,
the local government’s focus was on construction, including building and infrastructure,
and attracting investment, both of which contributed to GDP and tax revenue. In 2007,
the top leadership of Tianjin Municipality held a mobilization conference on Binhai New
Area development (E-North, June 14, 2007). The purpose of the conference was to
communicate to lower officials and planning practitioners the key thoughts of the
municipality’s leadership on the direction that the planning work should take. The mayor
stressed that development efforts should be focused on: (a) improving planning and
specific area planning; (b) integrating land resources and providing enough land for the

141
New Area development; (c) making every effort to attract large, beneficial projects; and
(d) accelerating infrastructure construction and environmental beautification. He also
mentioned that the municipality needed to keep winning the state’s support. In the
conference, both the mayor and the director of the local Communist Party emphasized
that the plan should give priority to industrial functional areas in order to attract top
businesses. In particular, improving the transportation infrastructure and environment
would build up a positive “metropolitan image” of Tianjin, helping to attract high-quality
human resources and enterprises. The slogan “Big Project Good Project” appeared in
every top leader’s speech at the conference. “Planning is the productivity,” said the
mayor (First Leadership Small Group Meeting, June 14, 2007). He instructed leaders to
“Grasp the construction of a good project, actively ask for projects, make every effort to
materialize the project; make sure that the constructed projects be used in full capacity,
and make sure that the projects under construction be used as soon as possible. Begin the
construction of the newly contracted projects as soon as possible.”
In the ensuing development process of the Binhai New Area, construction has
remained the primary task. A development report for the municipal government in 2008
noted that there were 360 large projects equating to more than 50 million yuan under
construction (“An Introduction of the Development of Tianjin Binhai New Area”
(internal document), November 2008). The total investment was 700 trillion yuan, mostly
concentrated in high-end office buildings. In the Xiangluo Bay Financial District alone,
where most headquarters for central state-owned enterprises would be located, 32 high-
rise office buildings were under construction in the planned area of 3.2 square kilometers.
Yu Jiao Bao CBD, another area with a high concentration of office buildings, covered a

142
total area of 4.64 square kilometers, with 9.5 million square meters of building area. It
was intended to be the world’s largest financial district, with building heights varying
from 120 to 240 meters. A 15-minute car ride away from both districts, TEDA Holding
planned the “most expensive square mile in Binhai.”2 The TEDA MSD area has 20
skyscrapers with 1.4 million square meters of building footage. The total building area
will be 14.5 million square meters, equal to 15 times of the current supply of office space
in Tianjin. However, this massive construction effort faces a significant problem: demand.
According to a research report by CBRE Group, Inc. (one of the largest commercial real
estate companies in the United States and major players in China), the office space in
Tianjin would reach 5 million square meters in 2014; this is going to take Tianjin 60
years to saturate the market based on the current consumption (“Oversupply of Office in
Tianjin,” 2012). The consumption speed is considerably slower than the construction
speed in the area.
Financial reform has not been a top priority for the municipal government.
However, the bursting of Tianjin’s Central Business District (CBD) bubble may have
changed that. Beginning in 2012, the new cohort of central government officials shifted
the center’s regional development support to other areas. For example, the pilot national
Free Trade Zone was placed in Shanghai instead of Tianjin; this new zone was also
granted permission to experiment with financial reforms. Tianjin’s CBD dream also faces
challenges from Beijing. In 2011, Beijing proclaimed that it intends to become the center
of national financial innovation, engaging in intensive development planning in the
financial industry during the 12th Five-Year Plan period. The financial industry has long
2 Information from TEDA website:
http://www.tedamsd.com/main/Project.aspx?ClassID=e92b2362-2f1c-4488-a77d-a26fbb1b0780,
accessed on 2014, September 20.

143
proliferated in Beijing, and Tianjin faces fierce competition from this close neighbor.
Gradually, the Tianjin municipal government has come to realize that its overambitious
planning and investment in office space construction and CBD has created a huge
consumption problem for the city. Construction projects began to face financing issues,
delaying the completion of many projects. Xiangluo Bay was supposed to be completed
in 2010, but by 2010, only two projects in that area had been completed. The plan’s
timeline was subsequently pushed back by 10 years (Xing, July 4, 2013). By 2013, a full
30% of projects had stalled. To try to counter this stagnation, Tianjin submitted a
proposal on Yu Jia Bao financial industry innovation to the State Council in 2013. It also
applied for a Free Trade Zone policy declaration, which would have made it equal to the
pilot project in Shanghai, so as to push forward financial reform. In 2014, the Tianjin
Communist Party published a document on further reforms, with financial reform and
innovation appearing as a separate chapter. Interestingly, it related these reforms to the
construction of Yu Jia Bao CBD and specifically pointed out that “the zone needs to
accelerate the construction of Yu Jia Bao, to perfect its function as a carrier, to attract
financial institutions from Beijing to set up branches, to support foreign financial
institutions to come into the district, and to accelerate the state’s financial innovation
work.” 3
We have yet to see any significant effects from financial reform in Tianjin,
leaving the only notable results from the area’s development as the CBD “ghost cities”
(abandoned or incomplete building projects) in Binhai (Figure 35).
3 “Chinese Communist Party Binhai Commission Regarding Implementing Further Reform,”
accessed on March 13, 2015 from: http://guba.eastmoney.com/news,600225,98242445.html

144
Figure 35. Pictures of the Yu Jia Bao “ghost city,” including: (i) a weekday morning and
unfinished empty skyscrapers on a weekday morning; (ii) an unfinished project; (iii) another
unfinished project; and (iv) projects which were intended to imitate New York City’s most
famous buildings. Source: CNN, retrieved from
http://www.cnn.com/2015/01/19/world/gallery/china-tianjin-ghost-city/, on February 10, 2015.
6.6 Summary

145
Tianjin Binhai New Area’s development exemplifies the coherent collaborative
platform, characterized by the zone’s highly coherent central–local collaboration and
intracity coherence. Tianjin has a long tradition of seeking collaboration with the central
government. The municipality’s bargaining tends to be explicit, though in the later phases
of the zone’s development, the municipality tended to be more strategic in its bargaining
actions. The center, meanwhile, tacitly supported the Binhai area throughout its
development. Even in Binhai’s earliest phase, at the beginning of the implementation of
the national Economic Zone policy when not much support was given to the development
zones, the central government helped convince Motorola to establish operations in
Tianjin through the use of political connections and influence. In the later phases of
negotiation with Motorola, the central government agreed to compromise on the matters
of unions and joint venture establishment in order to secure the company’s investment.
This kind of influence was later seen again when the central government played a part in
attracting Airbus and other international projects to the Binhai area after it was
designated as a national development zone. In this case, the center’s interest was
congruent with the municipality’s interest: The center’s quest for growth in the northern
area coincided with Tianjin’s planning for Binhai’s development. In the end, the central
government’s concern about Tianjin’s competition against Beijing gave way to its desire
for more growth. Overall, the central government’s support fueled the municipality’s
developmental zeal.
Within the municipality of Tianjin, the governance interests between the city level
and the Binhai New Area level were also highly coherent. Though it has been reported
that the functional districts of New Area competed to attract businesses, the overall

146
environment was characterized by coherent development interests both within the New
Area and between the city and the zone. This high coherence of interests is uncommon,
as will be shown through the following two cases.
However, this highly coherent collaboration exposed the area’s development to
the dangers of over-investment and imprudent decisions. Though the proportion of the
GDP contributed to the municipality by the Binhai New Area has been increasing over
the years (Figure 36), little has changed in the industrial composition of the New Area.
As shown in Figure 37, secondary industry has been the primary contributor to the
economy over the last 15 years, corresponding to 70% of the total GDP; the financial
industry has been stagnant, seeing only limited growth in the past several years, even
though this industry was intended to be the development zone’s primary industry. It is
possible that the offices that were built for high-end tertiary industries may sit empty for
a long time in the near future.
Figure 36. Binhai New Area and Tianjin municipal GDP (100 million yuan) 1997–2012
1,265 1,375 1,501 1,702 1,919 2,151 2,578
3,111 3,906
4,463 5,253
6,719
7,522
9,224
11,307
12,894
382 417 468 572 685 862 1046 1323 1634 1984 2414 3350 3811
5030 6207
7205
30% 30% 31% 34% 36% 40% 41% 43% 42%
44% 46% 50% 51%
55% 55% 56%
0%
10%
20%
30%
40%
50%
60%
70%
80%
90%
100%
0
2000
4000
6000
8000
10000
12000
14000
1997 1998 1999 2000 2001 2002 2003 2004 2005 2006 2007 2008 2009 2010 2011 2012
Total Municipality GDP Binhai New Area GDP Proportion of Binhai GDP

147
Figure 37. Percentages of secondary, tertiary and financial industry representation in Binhai GDP
69% 63% 64% 67% 66% 67% 67% 66% 67% 68% 69% 69% 67% 68% 69% 67%
30% 35% 35% 32% 33% 33% 33% 33% 33% 31% 31% 31% 32% 32% 31% 32%
17% 14% 8% 5% 3% 2% 2% 2% 2% 2% 4% 6% 6% 7% 9% 11%
0%
10%
20%
30%
40%
50%
60%
70%
80%
90%
100%
0%
10%
20%
30%
40%
50%
60%
70%
80%
90%
100%
1997 1998 1999 2000 2001 2002 2003 2004 2005 2006 2007 2008 2009 2010 2011 2012
Percentage of Tertiary Industry Percentage of Secondary Industry Financial Industry

148
Chapter 7
Case II: Guangzhou—The Locally Contained Conflicting Platform
Guangzhou, which is located in Southern China close to Hong Kong, is among
the top five most populated cities in China. Its population grew from 5.6 million to 12.7
million from 1982 to 2011. The Guangzhou Development Zone (later the Luogang
District) was among the first 14 Special Economic Zones established in China. Its area
has grown from the original 9.6 square kilometers to 484 square kilometers, after the
latest district merger involving Huangpu District.
Guangzhou’s relationship with the central government is quite different from that
of Tianjin. Geographically, it is far from Beijing but close to Hong Kong. In the late
1970s, a considerable number of small-and medium-scale labor-intensive manufacturing
activities were transplanted from Hong Kong to the Pearl River District. Guangzhou, as
the capitol of Guangdong, received much of this investment. From the 1980s through the
1990s, Guangzhou relied heavily on capital investment from Hong Kong. The city’s
relationship with Hong Kong, and especially its reliance on Hong Kong investment,
disqualified Guangdong, Guangzhou’s province, from receiving large investments from
the central government. As Lin (1999) suggested, the claim that Guangdong became a
growth pole due to the center’s intensive financial support is misleading. Although
Guangzhou did not suffer from the same sort of intentional restrictions that were placed
on Tianjin’s development, the center at best relaxed the state control and regulations on
Guangzhou, but did not give it an influx of financial support. Evidence from all of my
interviews indicates, with support from documents on the early development of the

149
Special Economic Zone in Guangzhou, that the center specifically did not proved special
support for infrastructure construction and the city develop the raw land on its own,
seeking investments to cover the cost.
Figure 38. The location of Guangdong and Guangzhou. Source: Maps were retrieved from
Google Maps and China Explorer on China Data Online on February 10, 2015.

150
Figure 39. Planning districts of the Guangzhou Development Zone, Luogang (now Huangpu)
District. Source: Left map was retrieved from Google Maps on February 10, 2015; the right map
was adapted from the Luogang District Development Plan (2004–2020).
Guangzhou’s municipal government also has a different relationship with the
central government than does Tianjin’s municipal government. Tianjin has constantly
sought the center’s support and acknowledgement, but Guangzhou intentionally broke
away from any restrictions imposed by the center. Guangzhou’s leadership was explicit
about being flexible in interpreting the rules and laws when such flexibility in
implementation benefits the zone and the city economically. Lei Yu, who was in charge
of the city’s fiscal affairs in the early 1990s, once said that as long as the proposed
Luogang (Now
Huangpu)
District
151
practice was not in direct violation of the upper-level government’s policies and
increased productivity, the development zone was allowed to do anything it wanted (Lei,
2008).
Compared to Tianjin, the minimal involvement by the central government made
Guangzhou a less desirable site for large foreign investors. In order to attract large-scale
businesses, the Guangzhou zone sometimes had to compromise its monetary interests in
addition to implementing flexible policies, particularly in the early stage of zone
development.
7.1 First Phase: Heavy Reliance on Local Initiatives
When the development zone was first established in 1984, three zone-level state-
owned companies were created: Construction Development General Company,
Commercial General Company, and Industrial Development General Company. Initially,
these companies were set up to concentrate on their own targeted businesses. For
example, Construction Company focused on construction projects and infrastructure
development. Soon, however, each of these companies set up its own import-export
subsidiaries, which were allowed to engage in trading and attract businesses for the zone
as a whole.
Circumvention of the central state law was accepted in the name of attracting
business. Although the center hoped the local level would adopt the strategy of “three
mainly and one dedication”—that is, “mainly” focus on industrial development, “mainly”
use foreign investment, “mainly” target exports and create foreign income, and “dedicate”
to developing high-tech industries, in the 1990s, the Guangzhou development zone

152
decided to court the logistic industry, which did not fall into the normal business scope of
a development zone. For example, Meite Containers was jointly owned and managed by
the Guangzhou Bureau of Light Chemicals and a foreign company. Its primary product
was an aluminum beverage can with a pull tab, a product that was invented in the 1960s
and was largely replaced by the stay-tab opening mechanism in the early 1980s. Even
such an outdated project aroused enormous interest from the zone. In order to attract this
project, the Guangzhou zone not only provided land but also agreed to share the resulting
tax revenues with the municipal district where the joint venture company originally
intended to locate (the project was originally located at the former site of the Guangzhou
Badminton Plant in a district outside the zone). This project brought more than $2 million
in foreign income to the zone within the first half-year of its operation and was
considered a successful foreign investment in the early stage of the development zone.
The sectors on which the zone planned to focus were usually either ignored or
broadly interpreted in the process of attracting business. Despite the central government’s
industrial planning to attract more upscale sectors to upgrade China’s industrial structure,
local officials focused instead on the total amount of investment, which happened to be a
main item checked on the official performance evaluation. Local officials would help an
interested business to rebrand their company, making it appear to be in a sector that
satisfied the basic requirements of industrial policy. However, if enough investment
capital was at stake, even such basic requirements could be ignored completely. Such
practices were especially common in the early stages of zone development, and are still
popular among less-advanced development zones.

153
Similar to Tianjin’s case, Guangzhou’s flexibility in interpreting laws and rules
required complicity from the center. This practice of flexible interpretation is even
privately acknowledged by central officials. Although the center has explicitly forbidden
the creation of tax holidays for domestic firms located in the zone, a group of Guangzhou
development zone officials still visited Beijing to ask a State Council official for
permission for “special rights” to “experiment to motivate” the domestic firms (Lei,
2008). Rather than giving Guangzhou permission to do so, the State Council official
merely asked the Guangzhou officials to ask for permission from their city government.
The city government, meanwhile, only needed to draft an explanation of the law to permit
tax holidays for domestic firms in the development zones. This practice was later
accepted by the center publicly and adopted by other local development zones in China.
Furthermore, early in the zone’s development, a central law required that local
governments report every construction project to the center for approval. This, too, was
creatively circumvented. Local officials would bundle a together large number of
adjacent land lots to obtain one license from the center. Then the zone government would
act as a land and license wholesaler, distributing the lots to investors. The deputy mayor
of Guangzhou even established a zone-level commercial bureau to act as an agent to
apply for licenses for bundled land. This practice effectively mitigated the challenges of
the complicated land use application and spared investors a number of bureaucratic
hassles (Lei, 2008). During financial hard times in the early 1990s, the development zone
even allowed companies that had their registration address in the development zone but
operated in other places to enjoy tax breaks and other special policy benefits from the
zone. For example, Bao Steel had its primary base of operations in Tianhe District, but

154
registered in the development zone and paid 4 million yuan tax yearly to the development
zone (Wang, 2009).
In the mid-1980s, the Construction Company learned from the Guangzhou Bureau
of Light Industry that Procter & Gamble (P&G) and Hong Kong Hutchison Whampoa
(an investment company) were collaborating to establish a factory in mainland China.
The Construction Corporation then used its relationship with the Bureau of Light Industry
to earn the opportunity to collaborate with P&G and Hong Kong Hutchison Whampoa on
the project. Due to its belief in the long-term possibilities of this arrangement, the
Construction Corporation refused any immediate consulting and service fee income for
its business attraction services. Eventually, P&G Guangzhou was established, with the
majority of shares held by foreign companies and the Bureau of Light Industry, but
agreed to give a 5% stake to the Construction Company. However, in return, the
Construction Company had to agree that it would not receive dividends during the
venture’s first five years. The venture received other considerations, as well. The
necessary land was sold to P&G at a discounted rate, and the two Guangzhou
corporations agreed to pay all construction fees. This early-stage construction investment
became a huge financing burden for the company and the zone alike. The Construction
Company also agreed to help P&G Guangzhou manage its government relationships
without actually participating in the new company’s management structure. The benefits
of this project were not seen until the mid-1990s, when tax revenue from this joint
venture accounted for a full 50% of the development zone’s income.
7.2 Second Phase: Active Expansion

155
By the early 1990s, all the lots in the original planned area, which totaled 9.6
square kilometers, had been assigned to projects. Expanding the zone area became an
urgent matter. Since the 1990s, the Guangzhou development zone has put considerable
effort into expansion. From 1990 through 2005, the zone experienced seven expansions,
including two major ones. The principle of being flexible is embodied in how the zone’s
planning changed with each expansion. The zone’s own desire to expand paralleled the
city’s desire for more land; eventually, the zone was turned into a significant area of
expansion for the city as a whole. Rather than guiding development, planning has become
a site of political arguments over changes in development strategy and a form of
documentation of this change. The development zone moved from being an industrial
base to being the city’s frontier for urbanization and land development. The expansion
process and planning changes involved are detailed below.
6.2.1 Bonded area
The local Guangzhou government published the “Decision Regarding Guangzhou
Development Zone Further Reform and Opening-Up Extension” in 1991 and the
“Decisions Regarding Further Reform and Expanding Opening-Up” in 1992. Though the
two Decisions covered reforms at different levels, the most important points for the
development zone were the establishment of a Bonded Zone (a specific class of special
economic zone) and more development zones in other forms, intended to act as
extensions of the original zone.
In 1991, when a team of local officials visited the State Council to ask for
authorization for to establish a bonded zone in Guangzhou, they were told that they could

156
file a document to establish a large project and begin preliminary preparations, then start
to implement that plan even before receiving approval by the State Council, which would
take a considerable amount of time. Taking advantage of this short path, an approval for
preparation was granted to the Guangzhou government three days after the team of local
officials visited Beijing. Official approval for the establishment of a bonded zone was
granted to the local government a year later. In 1995, the State Council implied that the
central government might revoke the policy for special zones but retain policies for
bonded areas. The Guangzhou Development Zone committee immediately drafted a
proposal for developing an extended project in the bonded area to keep zone expansion
alive in the region. The State Council approved the extension project.
6.2.2 Yunpu Zone (East District)
In 1990, the Guangzhou government made a proposal to the center for a land
adjustment plan, as about 3 square kilometers of land in the zone was not suitable for
development. In 1991, zone officials raised the issue to Premier Li Peng when he visited
the Guangzhou Development Zone; the premier immediately asked the relevant
department to solve the problem. In 1992, the Yunpu District, which bordered on the
original development zone and Baiyun District, was approved for development. In order
to obtain a larger area for future zone development, the zone committee also included
surrounding land in its definition of the Yunpu District; the total area in the end was 16.7
square kilometers. Later, in the late 1990s, the Guangzhou Export Processing Zone was
established in the Yunpu District (later renamed “East District”) to take advantage of
special policies for Export Processing Zones.

157
6.2.3 Yonghe
In 1993, the zone committee visited several sites and finally selected the Yonghe
District in Zengcheng, a county-level city governed by Guangzhou, as the next site for
expansion. As the director of the Guangzhou Land Bureau was the former secretary of
the Communist Party in Zengcheng, the land acquisition process went smoothly; the
relationships between officials streamlined the process. Once the land was acquired, the
Guangzhou officials formed a team to establish a development company to carry out all
financing and development matters. To make Yonghe easier to access from Guangzhou,
the Guangzhou government spent 100 million yuan to construct a tunnel connecting
Yonghe and Guangzhou. To lower Zengcheng’s opposition to losing land, Guangzhou
also agreed to return 30% of the tax collected in the Yonghe District to Zengcheng.
In 1995, the Guangzhou government decided to merge Yonghe into the original
Guangzhou Development Zone. However, this plan was not initially able to receive
central government approval, which created a major problem for tax supervision, as the
center does not allow special tax rates for unpermitted districts. In order to gain the
center’s approval, the district devoted itself to attracting business from Taiwan. The
development zone committee focused on lobbying different central departments,
attempting to convince them that the Yonghe District was the most suitable target for
Taiwanese investors in Guangzhou. The Guangzhou government even changed Yonghe’s
name to the Guangzhou Taiwan Investor Zone. Although Yonghe was acknowledged as a
provincial-level district in 1996, the center did not grant approval for the development
zone merger until 2003, 10 years after the establishment of this zone.

158
The zone’s plans before 2000 emphasized that the development zone’s main
function was to act as the primary industrial base for Guangzhou. Therefore, early plans
made the original zone, the West District, the administrative center of the entire zone, and
designated the East District—the expansion of the original zone—as the primary site for
large industrial projects. Early plans specifically indicated that the East District would not
develop any commercial centers or service industry. Any tertiary industries in this district
were meant to simply serve the other businesses in the East District. Until 1995, the zone
attempted to develop more commercial activities in Yonghe District, planning it as a local
town center. The zone’s focus then began to expand from purely industrial sectors to
tertiary industries including real estate development, tourism, and commercial activities.
With this new focus, the plan was to make Yonghe a “garden-style modern new town
district” (Guangzhou Economic and Technology Development Zone Chronicle Editor
Committee, 2004).
6.2.4 Science Park
In 1998, the Guangzhou Development Zone and the Guangzhou High-Tech Zone
merged. The High-Tech Zone was originally an industrial development zone in Tianhe
District, approved by the State Council in 1991; although approved by the State Council,
it was under a different central ministerial authority from the development zone. The
development zone was under the leadership of the Ministry of Commerce, whereas the
High-Tech Zark was under the leadership of the Ministry of Technology. By 1996, the
High-Tech Zone had developed five major campuses, covering an area of 43 square
kilometers. While the development zone had been built up, the High-Tech Zone was

159
having trouble attracting businesses. Therefore, the Guangzhou government decided to
merge the two zones and integrate their administrative offices. Moreover, the integrated
development zone government selected Science Park, which had the largest area of the
five High-Tech Zone campuses, covering 22.7 square kilometers, as the site of a key
project to implement independent planning. This project was also listed as one of
Guangzhou’s major infrastructure projects in 1999.
6.2.5 Four-district merger
Later in the zone’s development, the Export Process Zone (established in 2000 in
the East District) and the Bonded Zone were merged into the overall development zone,
making Guangzhou the first four-zone development zone in the country. By 2000, the
expanse of the current development zone was essentially established. From a 9.6 square
kilometer development zone at the beginning, it has expanded to 78.9 square kilometers,
more than eight times its original area.
6.2.6 Establishment of an independent administrative district
In 2002, the Guangzhou government began to explore the option of expanding the
development zone to a larger administrative district as part of the city’s plan to expand to
the east, where the Guangzhou Development Zone lies, making that area a sub-center of
the city. While continuing to focus on the automotive, chemical, and high-tech industries
to promote industrial development, the city also began to construct more residential and
living areas in the development zone area. The government first merged the surrounding
areas with the zone, placing them all under the zone’s leadership. These areas included:

160
Luogang County in Baiyun District; the land held by the Huangpi Farming, Industrial,
and Commercial Company; the land held by the Lingtou Farming, Industrial, and
Commercial Company; Yushu Village in Tianhe District; and Bigang Village in Huangpu
District. Then, in 2005, with approval from the State Council, the Guangzhou
Development Zone and Luogang Administrative District merged and the area of the
planned development region expanded to 393.22 square kilometers with a total
population of 370,000 (Guangzhou Economic and Technology Development Zone
Chronicle Editor Committee, 2004). Authority over the area was granted to the district
government of Luogang District instead of to the Development Zone Committee,
although the core personnel were from the original committee that suggested the merger.
After the merger in 2005, both the district government and the Guangzhou city
government thought it was necessary to make a new master plan for the district in order
to integrate the administrative function into the plan. The new master plan summarized
the main industries on which Luogang District would focus, including modern farming,
auto manufacture, steel manufacture, the IT industry, and others, for 12 industries in total.
The master plan also included the real estate industry and tourism as important sectors.
The purpose of the Guangzhou Development Zone changed from being an economic
development zone to being Guangzhou’s new sub-center town. By 2010, the government
planned to have a built area of 71 square kilometers and a population of 454,000,
compared to 28 square kilometers with 261,000 residents in 2004. By 2020, the city
planned for the built area to be 120 square kilometers with a population of 1 million.
As stated in the municipality’s 2005 master planning, in 2004, Luogang District
had 11.2 square kilometers of developed industrial land, designating 39% of its total land

161
for building (Guangzhou Economic and Technology Development Zone Chronicle Editor
Committee, 2004). Thirty-two percent of the industrial land was located in the original
zone, the West District, which had the highest proportion of industrial land in the zone.
From 1984–2004, the building speed in the district has accelerated notably. Over 15 years,
the West District developed an average of 0.23 square kilometers each year; over 11
years, Yonghe District averaged 0.22 square kilometers of development; over 10 years,
East District averaged 0.21 square kilometers of development; and over 5 years, Science
Park averaged 0.33 square kilometers of development. The evaluation of the land use in
the plan pointed out that if such a rapid pace of land sales and development was sustained
without additional land acquisitions, by 2010, Guangzhou Development Zone would have
no additional land to offer industrial projects. The plan then outlined requirements for
projects to enter the development zone. Science Park, for example, will only accept
projects that have an investment density exceeding $500/m2. Of all the areas within the
Guangzhou Development Zone, Science Park has attracted most the most information
technology (IT) and pharmaceutical industry investment; these account for 46% and 68%
of the projects in the development zone, respectively. Meanwhile, the West District has
concentrated on traditional industries such as food. To ensure appropriate land resource
provisioning for industrial projects, the zone government also adjusted the quotas for
industrial land for all districts in the zone in its 2005 plan.
As opposed to previous plans, which focused on how to expand the zone and gain
more quotas for industrial land, this plan was concerned with addressing the lack of
sufficient residential land in the district. The plan pointed out that the lack of residential
land made it difficult for employees of the local firms to find decent places to live and

162
suggested increasing the amount of residential land in the district substantially. To
achieve this goal, the plan proposed remodeling the village areas, which covered 18.38
square kilometers. According to this plan, the peasants who were the current owners of
the village land could keep 10% of their own land in the form of collective ownership,
which would become their income source after they lost their land to redevelopment. The
peasants were allowed to develop office space or commercial buildings on the land, then
rent them out. The peasants would be relocated into newly built residential buildings.
6.2.7 Sino-Singapore Knowledge City
In 2008, the secretary of the Guangdong Province Communist Party, Wang Yang,
led a team of officials to visit Singapore and invited Singaporean companies to invest in
Guangdong. Subsequently, Singaporean officials visited Guangdong several times and
reached an agreement with the Guangdong provincial government to build a Sino-
Singapore Knowledge City in the northern area of the Guangzhong Development Zone.
The project is located in Jiulong County, which includes 21 villages that concentrated on
farming along with a handful of low-end manufacturing industries. The project plan
involves building a high-quality living area to provide a decent residential and
entrepreneurial environment and to attract high-quality human capital to the area. The
current built area in this district is 4.16 square kilometers. The planning proposal
suggested expanding the built area to 34 square kilometers by 2020, with a target
population of 160,000. The majority of the land area will be residential land and
commercial land, with residential land taking 22.8% of the total built area, commercial
land occupying 23.1%, and industrial land taking only 8.4%, in contrast to the land

163
distribution ratio in the early stages of zone development, when industrial land made up
the highest portion of built area. In this latest sub-area development plan for Sino-
Singapore Knowledge City, the development zone’s role has changed from being a
promoter of industry in Guangzhou to being the frontier of urban expansion for the city.
The development zone has gradually become yet another instrument for the city and zone
governments to transfer land capital from the peasants to the city and to redistribute the
capital gains between the city and the zone. The ideal of industrial development in the
region has changed from knowledge- and technology-based development to the attraction
of human capital.
6.2.8 Summary of the expansion period
The Guangzhou municipal government has led several major expansions of the
development zone from 1990 to 2005 and the expansion efforts have accelerated during
this time. The first period of expansion lasted from 1990 to 2000, when the zone
expanded from its original 9.6 square kilometer area to an area of 78.9 square kilometers,
more than eight times its original area. In this period, the city established new industrial
zones around the original development zone area (Zhu et al., 2006; Guangzhou
Development Zone Chronicle Editor Committee, 2004). In 2002, the Guangzhou
government began to expand the development zone to create a larger administrative
district, making the larger area an independent administrative district and a new sub-
center of the city. While retaining its focus on the automotive, chemical, and high-tech
industries, the city also began to assign more residential and commercial land quotas to
the development zone area. In 2005, with approval from the State Council, the

164
Guangzhou Development Zone and Luogang Administrative District merged, and the
area of the development zone expanded to 393.22 square kilometers with a total
population of 370,000. In the same year, a new master plan for the district was created by
the city and district governments (Luogang District Yearbook, 2007). The new plan kept
industrial development as its focus, but also included the real estate industry and tourism
as new industries of interest. The ultimate goal was to transform the Guangzhou
Development Zone from an economic zone into Guangzhou’s new sub-center town
(Luogang Master Planning 2004–2020, 2004). The zone’s expansion, on the one hand,
meets the area’s needs for obtaining industrial land and attracting businesses and, on the
other hand, meets the city’s needs to expand toward the east.

165
Figure 40. The planning areas of the Luogang District (now Huangpu District). Source:
Adapted from Luogang District Development Plan (2004-2020).
7.3 Financial Sustainability and City–District Conflicts
At the beginning of the zone’s development, nine state-owned companies were
established to represent departmental interests in the zone’s governmental body, the
Development Zone Committee; as a whole, these companies acted as surrogates for the
zone government. By the early 1990s, all the functional departments of the committee
Science Park
Original Area of GZ Zone
East District
Yonghe
Knowledge City
Guangzhou Export Processing Zone
Bonded Zone

166
had their own state owned enterprise (SOE) represented in the zone. The main
departmental officials in the Development Zone Committee were appointed as the chief
managers of these companies. For example, the three largest state-owned companies in
the zone—Construction Company, Commercial Company, and Industrial Company—
represented the interests from the three bureaus of the zone committee—the Bureau of
Construction, Bureau of Commerce, and Bureau of Industry—and the leaders of these
companies were entitled to positions at the same level as a bureau-level official.
Once again, exceptions were the rule of the day in Guangzhou. These companies
were financed by the zone and city governments via guaranteed loans and were entitled to
enjoy lower tax rates or even tax exemptions. However, because the government had
limited capital, the companies did not receive the full amount of the capital they were
supposedly entitled to. At their outset, these three large corporations claimed that they
had registered capital of 5 million yuan, but it took 10 years for them to actually gain this
level of capital assets. This situation would have been judged to be capital fraud under the
law, but nevertheless, this conduct was proclaimed to be reasonable by the government
and the companies as a way to keep income flowing in. That is, as long as the companies
survived with the support of projects assigned by the government, special policies, and
capital resources such as free land, zero-interest loans, and concessions granted by the
government, their fiscal shortfalls and questionable accounting were overlooked. These
companies also obtained loans from banks because they were able to call upon the city
and zone governments as guarantors. But because returns from investment in
infrastructure development are low, all three companies found themselves facing deficits
167
that were unlikely to be paid off, and many of their subsidiary businesses were closed
after special policies expired or after governmental departments merged.
Nevertheless, these actions, which did not seem to make economic or legal sense,
were still supported, at least implicitly, by the local and central governments. In this
scenario, companies are not economic agents, but extended surrogates of the government.
As extended construction and management agencies, these companies were primarily
tasked with providing infrastructure construction services and public services to the zone.
For example, when the zone government needed to carry out the development of a certain
land lot, one of these state-owned companies would be given the money and assigned the
task. In addition, when joint-venture ownership was a requirement for foreign firms to
establish operations in China prior to the early 1990s, these companies also acted as the
Chinese side of the venture to satisfy this requirement.
If there is one rule that is consistent in the development zone, that is the rule of
exception, which dominated again in the reform of the SOEs. Beginning in 1993, the
Development Zone Committee had to initiate state-owned enterprise reform, as the zone
was facing increasing financial burdens from supporting the SOEs. The debate over the
details of the reform lasted four years, until 1997, when the committee finally published
nine decrees and guidelines for reform. The main strategy was “one company, one policy,”
meaning that each company would be treated as an independent case. If the company was
deemed to be inoperable, it would be closed or merged with another company. For
companies that still could generate income, the committee would either appropriate their
assets, change their debt to the committee into investment assets from the committee, or
directly subsidize these companies to lower their loan ratio. The Construction Company,

168
for example, received 200 million yuan through this reform initiative. In 1998, to further
protect these companies, the committee proposed to transfer shares of their joint ventures.
Construction Company sold d 4% of its 5% stake back to P&G Guangzhou and netted
352 million yuan, keeping 1% to prevent P&G Guangzhou from becoming a wholly
owned subsidiary.
The support from the Guangzhou and zone governments was able to enhance the
state-owned companies’ solvency and help them avoid bankruptcy, but it could not
construct a flagship corporation to dominate capital asset management in the
development zone, such as TEDA Holding. In 1998, the development zone founded a
company, GET Holding, to restructure the assets of zone SOEs. To help GET Holding
establish a market base, the zone government created hospital, committee management,
building, and tunnel projects, among others, for the company, for a total of 20 public
projects. It also transferred positively performing assets to GET, but GET has never been
able to reach same size and scope as TEDA—until recently, GET has only had one-fifth
the capital of TEDA. Therefore, unlike TEDA, GET was not able to act as a key capital
operator for the local government. Additionally, beyond GET, there are also other large
corporations in the development zone that prevent any single company from becoming a
monopoly for capital management and reinvestment.
Adopting the TEDA model was risky, especially when an increase in land value
was not guaranteed. When the Bonded Zone in the Guangzhou Development Zone was
established, the district decided to invite foreign companies to invest in the construction
of this new zone, as the local government lacked the money to do so. In reality, the so-
called foreign companies were simply Chinese companies with registered branches in

169
Hong Kong, including Hong Kong Yifa (a Guangzhou Development Zone company’s
Hong Kong branch), Chaoli Investment (Guangdong Development Bank’s Hong Kong
branch), Commercial Bureau’s Hong Kong branch, and Bank of China Group Investment
Limited (Bank of China’s Hong Kong branch). These companies formed a joint company,
CONBO, with Guangzhou Development Zone’s Yifa as the majority shareholder with 40%
of the new company’s shares. The purpose of the joint company was to develop the land
in the new Bonded Zone—an area of 1.4 square kilometers granted by the development
zone government at low price—and to construct offices, factories, and other
infrastructure. The company was formed during a boom time, when land prices were high
and still increasing. At the time, industrial land was priced at $168 per square meter and
commercial land cost $702. CONBO immediately turned the high expectations for land
value increases into operable capital. It was easily able to obtain $180 million in
investments and immediately put the money into land development. In its first few years,
CONBO invested 320 million yuan in land development, 740 million yuan in
infrastructure and public service structure development, and 330 yuan million on a retail
street. However, the Bonded Zone was not able to attract enough business to be
sustainable, and land prices began to drop instead of continuing their climb. In the late
1990s, CONBO became insolvent; it went bankrupt in 2004 when its total debt ratio
reached 220%, with a total debt of 890 million yuan. CONBO was a “failed attempted
innovation in financing,” as described by one official from the development zone
(“CONBO Insolvency,” 2005).
For a long time, the Guangzhou Development Zone had to rely largely on bank
loans for development. However, in 2000, none of the banks in the zone was willing to

170
grant a loan to the zone. Although the zone committee had 1 trillion yuan in disposable
assets, their debt from the SOEs was 5 trillion yuan. To solve this financing problem, the
committee director persuaded the banks with their cash flow model for the development
zone: the committee had to obtain money for development and construction first, before
they could attract businesses and used the tax revenue to pay back the loan. Eventually,
the banks agreed to lend to the zone as long as the committee provided non-industrial or
commercial land (mountain land, committee properties, and roads) as collateral.
Moreover, the money could only be used for land expropriation and infrastructure
development.
Unlike Tianjin, where the city and zone governments have formed stable
partnerships, the Guangzhou city government has acted in a predatory manner toward the
development zone (now district) and gave little financial help to the zone. Having been
unable to develop its own financing infrastructure in the TEDA model, the Guangzhou
Development Zone, as with most other development zones in China, has had to rely
heavily on land sales for revenue to keep up with its rapid pace of construction. After
merging its administrative functions with the surrounding areas to become a district in
2005, the development zone not only has to pay for its own development, but also for the
public affairs of the new villages and residents that did not belong to the zone originally.
As a result, administrative expenses increased rapidly after the district merger. In addition,
the district’s infrastructure investment has increased substantially. The rough budget for
key construction projects was 61.85 trillion yuan for the entire district for a 15-year
period spanning from the early 2000s to the late 2010s. In 2011, the Science Park had to
invest 300 million yuan in construction and demolition and land acquisition. Investment

171
in the Sino-Singapore Knowledge City was planned to total 12 trillion yuan, invested
from 2011–2015. Table 8 shows the decreasing percentage of tax income in total
government revenue and the increasing need for infrastructure investments. Notably,
since 2005, the city also began to take a share of revenue from the district for the city’s
fiscal budget, further complicating the district’s financial issues.
Table 8
Guangzhou Development Zone Budgeting Breakdown
Tax Income
(trillion yuan)
Total
Income
(trillion
yuan)
% of Tax
Income/Total
Income
Infrastructure
Investment
(million yuan)
Industrial
Projects
(trillion
yuan)
1997 2.3 713 2.9
1998 2.68 692 3.68
1999 2.97 460 2.39
2000 3.85 940 1.58
2001 4.7 942 1.54
2002 6.1 6.7 91% 1,830 3.7
2003 7.53 8.6 88% 4,376 3.9
2004 11.2 12.6 89% 4,677 4.8
2005 14.6 15.7 93% 4,230 8.1
2006 - 18.8 - 4, 059 8.4
2007 18.6 22.9 81% 6,136 8.4
2008 23.3 26.4 88% 7,629 9.7
2009 26.8 31.14 86% 10,122 10.5
2010 31.6 38.9 81% 10,741 12.9
2011 37.6 47.2 80% 11,202 14.8
Source: Author’s calculation, data adapted from Yearbook of the Zone (1997-2012)
The fiscal situation forced the district to rely more heavily on land sales to remain
solvent. Tax revenue has been decreasing as a proportion of the total income of the
district, from around 90% in the early 2000s to 80% in the late 2000s (Table 8). Despite
this trend, the city has been taking an increasing percentage of the Luogang District’s tax
revenue. “Every year we have to pay 18–19 billion yuan for social affairs, and invest
almost 8 billion for infrastructure. We have to borrow money as well, using credit

172
guarantees” (Interview, August 2013). In a report by the district government, it stated its
concern about the decrease in land sales in 2012, and urged the municipal government to
accelerate the approval process for land use and sales, especially for residential and
commercial land. In 2012, the land income for the district was 2.3 trillion yuan, 35%
lower than the year before. In 2013, the total disposable income of the district was 19
trillion yuan; of this, land sales income was 7.7 trillion yuan, more than 40% of the
district’s total disposable income (Interview, August 2013). In a meeting of Luogang high
officials in 2012, the party director of the district emphasized that the year’s goal was to
accelerate real estate development, including focusing on some large-scale real estate
projects currently under construction, “in order to increase the GDP and fixed-capital
investment.” The director explicitly stated that the district’s purpose was “to use land as a
mean to contribute for economic development” (“Development Zone Planning Bureau
Updates,” 2012).
7.4 Summary
The development of the Guangzhou Development Zone, later the Luogang
District, exemplifies the model of the locally contained conflict-based platform. Here, the
central government has played a minimal role in the district’s development. Unlike in
Tianjin, where city officials have constantly sought opportunities to involve the central
government in the zone’s affairs, development and planning efforts for the Guangzhou
Development Zone have been kept at the municipal level. There has been minimal
central–local interaction, except when central approvals for district integration and
expansion were necessary. The city made no attempt to upgrade the zone to a national

173
level, as in Tianjin, even though the Guangzhou Development Zone’s economic
performance has been equal with that of Tianjin for some time. Even major foreign
outreach efforts have been more locally driven than in Tianjin. For instance, when the
city pursued a new cooperative project with Singapore, the Sino-Singapore Knowledge
City, the Guangzhou negotiation team was led by Wang Yang, then the secretary of the
Guangdong Province Communist Party. But for a similar project in Tianjin, the
negotiation team was led by Chinese Premier Wen Jiabao (Interview, September 2013).
Indeed, the Guangzhou zone’s development is considered mostly a local affair both by
the city government and the central government.
Much like Tianjin’s TEDA, the Guangzhou Development Zone established
several state-owned enterprises at the onset of zone development to help promote
construction and business attraction activities. But unlike Tianjin, which used TEDA as a
capital operation instrument and supported it with state-owned capital, the Guangzhou
Development Zone used its state-owned enterprises to carry out the zone government’s
strategies for development. There have been some failed attempts at using these
enterprises as capital operation instruments, but by and large, the state-owned enterprises
in the Guangzhou Development Zone have acted more conservatively as governmental
agencies rather than entrepreneurs.
In contrast to the situation in Tianjin, the Guangzhou city government has acted in
a more predatory manner toward the development zone (now district), taking an
increasing share of revenues and lending little financial help to the zone, which left it
heavily reliant on land sales to finance the breakneck pace of construction in the district.
Moreover, when the Guangzhou Development Zone transformed from a special

174
economic district to a normal administrative district of the city, it faced competition on
industrial development and business attraction from other districts in the city. Its
contribution to the city’s GDP has remained relatively low, at 12% of the whole, since it
became a district (as shown in Figure 41).
Figure 41. Luogang District and Guangzhou GDP, 2006–2012 (unit: 100 million yuan)
689 816 1,005 1,162 1,382 1,606 1,684
6,082 7,140
8,287 9,138
10,748
12,423
13,551
11% 11% 12% 13% 13% 13% 12%
0%
5%
10%
15%
20%
25%
30%
35%
40%
45%
50%
-
2,000
4,000
6,000
8,000
10,000
12,000
14,000
16,000
2006 2007 2008 2009 2010 2011 2012
Luogang District Guangzhou GDP Percentage of Luogang GDP of Guangzhou

175
Chapter 8
Case III: Nansha—The Multiscale Conflicting Platform
Nansha is currently a district of Guangzhou. Nansha’s development was initiated
by a highly politically influential businessman from Hong Kong, Dr. Henry Fok (Fok
Ying Tung in Chinese). He was the first Hong Kong citizen to take office in the national
Chinese government and was called “an intimate friend of the Chinese Communist Party”
in official media releases4. In the late 1970s, he became interested in developing Nansha,
and he managed to use his relationships with the central government to push forward the
area’s development. As an indication of his influence, in 1993, the year Nansha
Economic Zone was established, he was also appointed as deputy chairman of China
People’s Political Consultative Congress. Among the arguments raised by Fok in favor of
Nansha’s development was its geographical advantage: Nansha was in the geographic
center of the Pearl River Delta. This is still often cited in official documents today. It was
argued that a 50-kilometer-radius circle centered on Nansha could cover all of the
important cities in the Pearl River Delta, including Hong Kong. Fok’s proposal also
included a plan that would essentially turn Nansha into Hong Kong’s backyard, making it
a place where people from Hong Kong could easily travel and invest in the real estate
market.
4 Refer to newspaper coverage on his pass away, for example:
http://news.takungpao.com/history/jinian/2013-10/1995638.html, retrieved on April 20, 2014.

176
Figure 42. Location of Nansha District. Source: Google Maps, retrieved on February 10, 2015.
8.1 First Phase: Slow Development and Public–Private Conflicts
The Guangzhou municipal government was supportive of the development of
Nansha, though it did not actively participate in the area’s planning and development. In
the 1990s, the Guangzhou Communist Party Committee and the Guangzhou city
government held a public conference in Nansha to announce the district as a key
“opening up” area and important development zone for the city. In the same year, the
mayor, Li Ziliu, hosted a city-wide government meeting; a decision was made to develop
Nansha and the Nansha Economic Zone Management Committee was subsequently
founded. A 22-square-kilometer area was reserved and assigned to Henry Fok to develop.
To secure Fok’s development rights of this land in Nansha, the Fok Ying Tung
Foundation signed two land reservation contracts in 1991 and 1992 and, in 1993, signed a
Nansha

177
contract on Compensated Use of Land in Nansha Economic Development Zone with the
government. At the same time, the local government also reserved 32 square kilometers
of land on the west of Nansha for the city’s own development zone. This area, combining
the 22-square-kilometer area on the east side and the 32-square-kilometer area on the
west, is now called the “little Nansha” development, as opposed to the “big Nansha”
development later proposed and led by the Guangzhou city government.
Figure 43. Current land use situation in Nansha District Source: Adapted from Nansha planning
document (2012).
However, two factors slowed the early development of Nansha. The major
difficulty was an extortion scheme targeting Fok’s investment by the director of the
Nansha Development Zone Committee, Liang Bonan, who was arrested for corruption in
Big Nansha
area
Huangge Auto
Manufacturing
Town
Little
Nansha
area

178
2004. This conflict between the private Fok Ying Tung Foundation and the local
administrative committee slowed down the development process in its early stages.
Additionally, local officials argued that the large amount of land owned by Henry Fok
blocked other investors from entering the development area, which also led to the
stagnation of Nansha’s development.
8.2 Administrative Conflicts and Solutions: Merging Panyu with Guangzhou
At the beginning of its development, the entire area of little Nansha was under the
control of Panyu, a Guangzhou-led county-level city. In 1993, the State Council approved
the establishment of the Nansha Development Zone, an area of 9.9 square kilometers
within the 32-square-kilometer development area on Nansha’s west side, and agreed to
grant the same “opening up” special policies to the Nansha Development Zone as to other
national development zones. In 1995, the mayor of Guangzhou hosted a mayor’s office
meeting and decided to integrate the Nansha Development Zone Communist Party
Committee and Management Committee under the direct leadership and management of
the Panyu government and Panyu Communist Party Committee; at the same time, he
granted Nansha the same construction and land acquisition approval rights as Guangzhou
City. Under this administrative setup, all construction projects in the entire area of
Nansha, spanning 54 square kilometers, had to be approved by the Nansha Development
Zone Management Committee, under the direction of the local Panyu government.
Over the years, the Guangzhou city government’s ambitions for development in
Nansha have grown; this was a primary reason behind the Guangzhou government’s
proposal to merge Panyu into its direct jurisdiction in the late 1990s. The Guangzhou city
179
government was especially interested in developing heavy industries and expanding the
logistics industry in Nansha, because the city lacked resources in these areas and had
been geographically restricted by Guangzhou’s lack of direct access to sea ports. By
merging Panyu into the city, the Guangzhou government could have full control of
Nansha’s development.
A conflict between the Panyu government and the Guangzhou government over
which had jurisdiction over Nansha’s planning was a prelude the merger of Panyu into
Guangzhou. In 1996, Panyu City created a document entitled “Master Planning for
Guangzhou Nansha Economic and Technological Development Zone.” The plan was
discussed and approved by the Guangzhou government at the city government meeting
on January 13, 1997. However, in this meeting, a Panyu city official argued that the
Nansha Development Zone was under Panyu’s jurisdiction, so the master plan did not
require approval by the Guangzhou People’s Congress. However, the Guangzhou
government argued that in the State Council’s official approval, the zone was named the
Guangzhou Nansha Development Zone and the zone had been granted city-level approval
rights for construction projects by Guangzhou itself; therefore, Guangzhou officials
argued that the master plan must obtain approval from the Guangzhou People’s Congress
along with other rights that had been granted to Nansha by Guangzhou. This divergence
of opinion led to the determination of Guangzhou’s high officials to merge Panyu into
Guangzhou’s jurisdiction, making it a district of Guangzhou (Lin, 2013); they saw the
merger as a way to guarantee full control over the Nansha development zone.
The merger proposal encountered strenuous local opposition at all levels, from the
Panyu government to local residents. The Panyu government organized a group of

180
experts to speak publicly about the negative cultural, social, and economic effects that
would occur if Panyu merged into Guangzhou. In an attempt to reassure the locals, the
Guangzhou government promised to build a metro line to Panyu and to grant the Panyu
government a three-year transition period during which it would retain independent
administration rights. The Guangzhou government also promised to prioritize Panyu in
the city’s development planning. The debates went on for several years, ending in 2000.
That year, the State Council approved Guangdong’s proposal for administrative division
adjustment and granted permission for Panyu and another county-level city, Huadu, to
merge and become administrative districts of Guangzhou (Lin, 2013). By merging the
two districts, Guangzhou expanded its area by 2,275 square kilometers, 1.5 times its
original size. The mayor of Guangzhou, Lin Shusen, writing about the merger in his
memoir, stated that the Panyu merger was the toughest city construction task he faced
during his term in Guangzhou (Lin, 2013).
8.3 The Fight over Nansha Port and the Failure of Heavy Industry Development
For a long time, Guangzhou City’s development was restricted by two factors:
first, its geographic constraints on port industry development, and second, its lack of
heavy industry. Development projects to address these issues were often the focus of
local officials. For instance, during his term as Guangzhou’s mayor from 1996 to 2003
and as Guangzhou’s Communist Party chief from 2002 to 2006, Lin Shusen made
particular efforts to expand the port industry and attract heavy industry to the
municipality.

181
Before acquiring Nansha, Guangzhou had only one main port, Huangpu, where
the Guangzhou Development Zone is located. As an inner port, its capacity was restricted
by the depth of the water there, imposing limits on the area’s shipping capabilities. When
the Guangdong provincial government composed a report on “Planning for the Pearl
River Delta Economic Region” in 1994 and predicted a significant increase in cargo
volume for Shenzhen and Zhuhai Ports than Guangzhou Port, the municipality became
concerned. Threatened with a loss of the city’s primary economic status in the region, the
mayor of Guangzhou held a meeting in 1995 to discuss how to accelerate the
development of Guangzhou Port in order to maintain Guangzhou’s status in commercial
trading in Southern China. The city government then decided to commit 100 million yuan
for waterway construction, including expanding and dredging the waterway. However,
although the dredging project improved the port’s turnover capacity, the increase was too
slow to make Guangzhou a local logistics center. The mayor of Guangzhou decided that
only a deep-water port at the Pearl River’s outlet to the sea, Nansha, could change the
city’s fortunes.
The primary difficulty in making Nansha a deep-water port of Guangzhou was
political, rather than a question of engineering or finances. Hong Kong opposed the
Nansha deep-water port project, seeing it as a potential competitor to the Yantian Port in
Shenzhen, which Hong Kong invested in and built. Because the provincial government
wanted to encourage Hong Kong to participate in Pearl River Delta economic
development, it had to suppress the development of Guangzhou Port. Nevertheless,
despite this reluctance by the provincial government, Guangzhou insisted on developing
its own deep-water port. At the end of 2000, the Guangzhou government conducted a

182
feasibility study and estimated the necessary investment in such a port project as 1.4
trillion yuan; the investment return period was estimated as 10 to 11.5 years. The local
government did not wait for the approval from Guangdong or the central government,
instead initiating the first phase of the project at the end of 2001 (Lin, 2013).
In later rounds of negotiation, Guangzhou strategically promoted the development
of the port as a beneficial factor that would aid the development of the Nansha Area, and
suggested that it planned to develop heavy industries in this area. On October 23, 2001,
the mayor of Guangzhou, Lin Shusen, announced the city government’s decision to
develop the Nansha Area in a press conference. The city’s vision was to establish a heavy
industry center in the Pearl River Delta. This plan, “if successful… would provide South
China with the sort of heavy industrial base it has traditionally lacked” (Enright et al.,
2003). In the press conference, officials deliberately stressed that the development of
Nansha and the new port were party of Guangzhou’s strategy to expand south. The
implication was that Nansha would pose no threat to Hong Kong’s investment in other
cities in the region. Specifically, the mayor stressed that Guangzhou Port would serve a
different function from Hong Kong’s regional port and that Nansha Port was only a city-
level development.
The Guangzhou government’s strategy, shifting its focus from port development
to comprehensive heavy industry development, successfully aligned with Guangdong’s
development strategy, gaining it provincial support. In 2002, the Guangzhou government
and the local Communist Party Committee hosted a spot meeting in Nansha, officially
announcing the Nansha Development Area and establishing the Guangzhou Nansha
Development Area Construction Command Office. At the conference, the director of the

183
Communist Party of Guangdong, Li Changchun, made a long speech in which he stressed
Guangzhou’s potential for developing high technology and heavy industries. Nansha had
a number of geographical and political advantages that would enable it to rapidly develop
heavy industry in Guangdong. Moreover, Guangdong also considered Nansha to be a key
area in which Guangdong and Hong Kong could collaborate on economic development.
The Guangdong provincial government announced that it would support Nansha’s
development and allocated 3 trillion yuan (1 trillion per year for three years) for
Guangzhou, earmarked for the development of Nansha Port ,even before receiving
official approval from the central government (Lin, 2013).
Guangzhou and Guangdong’s plan for Nansha’s development gradually gained
support from the center, especially from key officials such as the deputy director of the
State Development and Reform Commission, Zhang Guobao, and the former prime
minister, Zhu Rongji. Both administrative and financial support were soon forthcoming.
In July 2002, the Guangzhou branch of the state’s Central Development Bank promised
to provide a 50 trillion yuan loan credit for Nansha’s development. Later in 2004, the
central government approved the second phase of development for Nansha Port
development and approved the joint investment of Guangzhou, which would hold 30% of
the shares in the port, and Hong Kong—represented by a Chinese-controlled Hong Kong
establishment, Cosco Pacific—which would hold 70% of the shares (Lin, 2013).
The drafting of the Nansha Area Development Plan began in 2001 and was finally
published in 2004. The plan outlined three focal industries: the port industry, high tech
firms, and the equipment industry. This focus was based on the firm belief that the new
development zone would attract large projects in these areas. The planning agency also

184
planned four clusters in Nansha, including an auto-making base, a ship-making base, a
steel manufacturing base, and a petrochemical base. In addition, in 2002, the Guangzhou
government began investing heavily in Nansha’s infrastructure to assure investors that
the municipality was fully behind the area’s development. From 2002 to 2005, the
Guangzhou city government invested 11.7 trillion yuan in infrastructure development in
Nansha, including building 95 roads and bridges, totaling 380 kilometers in length
(Interview, July 2013). To encourage Toyota to establish its factory in the Nansha
Huangge District, the Guangzhou government promised to build a subway line linking
Nansha with the Guangzhou city center.
However, the plan was created without consulting with Nansha’s neighboring
areas; as a result, Nansha’s development plan caused increasing concern in the Pearl
River Delta region, including Hong Kong. Guangzhou’s plan to develop Nansha received
criticism on a number of aspects, including its lack of cost-benefit analysis and a lack of
proper planning for industrial allocation, such as putting deep-water port facilities in a
silting area and placing a high-tech zone directly across from chemical storage facilities.
But the most serious concern from the surrounding areas was the possible duplication of
investments and the possible subsequent threat to their own economic development
(Enright et al., 2003).
These concerns finally led to a major project failure for Nansha, when it was
unable to attract a large petroleum industry investment from Kuwait in 2009. In the early
2000s, the Kuwait Petroleum Corporation had approached Guangdong province to
establish a joint venture with Sino-Pec in the province. The joint venture’s shares would
be divided equally between Kuwait and China and the total investment would exceed $9
185
trillion. Nansha began preparing for the project in 2004 and invested more than one
trillion yuan in land acquisition and demolition to make ready for the joint venture.
During this time, the project also won approval from the central government. However,
beginning in 2008, a number of special interest groups voiced their concerns about the
project’s environmental impact on the surrounding area. But more complicated than these
environmental concerns were the fears of the surrounding cities that Guangzhou would
become the region’s heavy industrial center, resuming its primary status in the Pearl
River Delta region. Hong Kong also opposed the project. Hong Kong’s executive director
reported to the central government about the local environmental concerns and
subsequently forced Guangdong officials to reconsider their positions in backing
Guangzhou for the Kuwait oil project.
To ease the conflicts, the provincial government took steps to reassure the
surrounding cities that they would not suffer in the wake of Nansha’s development and
Guangzhou’s success. In Guangdong’s “Pearl River Delta Region Reform and
Development Planning Guideline,” the provincial government framed the development of
Guangzhou as allowing the city to take a leading role in the region rather than being the
“dragon head” or dominant power, as in previous plans. The guideline document also
required Guangzhou to focus on the high-end service industry instead of concentrating on
heavy industry. In 2009, the Guangdong governor, Wang Yang, decided to take the
Kuwait project away from Guangzhou, moving it to Zhanjiang, another city in
Guangdong.
Guangzhou’s failure to secure the Kuwait project, as well as the later collapse of
the Guangzhou Steel Manufacturing project, forced the city to change its plans for

186
Nansha. In later rounds of planning, Guangzhou no longer aimed to be the heavy
industrial center of the Pearl River Delta, because two of the four industrial bases, as
outlined in the regional development plan in 2004, had failed. Former Guangzhou mayor
Lin Shusen called the failure “the biggest tragedy in Guangzhou’s industrial development
since 1842’s Treaty of Nanking (in which Guangzhou was made one of five ports open to
the Western world and subsequently became much more prosperous than before)” (Lin,
2013). Moreover, he blamed the plan’s failure on regional competition and the jealousy
of the surrounding cities.
8.4 New Planning Phase
After Guangzhou abandoned its plan to become a heavy industrial center, it had to
re-plan the area and consider how to position Nansha. In the 2008 Pearl River Delta
Region Development Planning Guideline, the central government’s Commission of
Reform and Development proposed making Nansha a bridge for collaboration between
Guangdong, Hong Kong, and Macau on developing the high-tech and modern device
industries. Guangdong province also decided to make Nansha a model district for the
Mainland and Hong Kong Closer Economic Partnership Arrangement (CEPA), a series of
treaties between Hong Kong and the mainland signed in 2003. However, enacting the
agreement did not boost the area’s trading activities as much as expected because of the
vast differences, socially and economically, between the two parties to the accord.
In 2011, the national 12th Five-Year Plan positioned Nansha as a “breakthrough
to make a new Guangzhou,” one that would further “strengthen Guangdong, Hong Kong,
and Macao’s cooperation” (National 12th
Five-Year Plan, 2011). Nansha was made one

187
of the three regions, including Hengqin in Zhuhai and Qianhai in Shenzhen (all in
Guangdong), that were expected to rejuvenate the Pearl River Delta. In the planning,
Nansha was instructed to develop a high-quality living circle for Hong Kong and Macau;
its development would be focused on high-end industries and advanced service industries.
Its main functions were to serve the mainland and to connect with Hong Kong and Macau
to create a center of science and technology innovation and develop an education base.
With this new focus on services, knowledge industries, and residential development, the
positioning of Nansha’s development had radically shifted from the heavy industrial
focus of the previous plan.
Although Guangzhou adjusted its master plan for Nansha to address conflicts in
the region and new guidance from the central government, it did not change its ambition
to remain the economic and cultural center of Southern China. In a meeting regarding the
planning efforts hosted by the Guangzhou Planning Bureau and the various planning
companies under contract, the Bureau’s director stressed that Guangzhou needed to retain
its primary status in Southern China and that it required Nansha to achieve this goal. On
an industrial level, Nansha would retain its ship-making and auto-making industries, port-
related industries, and large equipment industry. Again, the port was emphasized and
deemed “the most import strategic infrastructure in the Pearl River Delta cities” (Internal
document, 2012). Unlike the older Guangzhou Development Zone, which focused on
traditional commercial and business activities, the Nansha New Area would be focused
on high-tech companies and exporting services; it would also act as a headquarters for
outsourcing companies, emphasizing intellectual capital and cooperation with overseas

188
firms and working to attract repatriated citizens who might be returning to establish
startups in China.
Although the new master plan maintained Nansha as Guangzhou’s southern
expansion area, it stressed that the expansion needed the cooperation of Hong Kong to
succeed. However, Hong Kong’s goodwill and participation were uncertain, especially
because the Hong Kong public held an antipathy for the mainland. Even after the
publication of the 12th National Five-Year Plan calling for increased cooperation, the
collaboration between Nansha and Hong Kong stayed in the form of a simple
collaboration agreement, signed by Nansha and the Hong Kong Chinese General
Chamber of Commerce, rather than making any concrete strides.
Nansha’s growth is still very slow today. The Nansha District’s GDP growth rate
was ranked eighth in Guangzhou in 2013, even lower than Guangzhou’s average rate,
which put considerable pressure on local officials (Figure 44). In their efforts to turn
around this stagnation, the city and district governments scrambled to attract any
industries that could possibly develop in Nansha. This included encouraging the tourism
industry in Nansha and committing to build three to four 5A-level tourism areas within
five years, along with building a second airport in Nansha.

189
Figure 44. Nansha District and Guangzhou GDP 2006–2012 (unit: 100 million yuan)
Unsurprisingly, to facilitate Nansha’s development, the Guangzhou and Nansha
governments have been relying increasingly on real estate development and land sales.
To allocate more land quota to Nansha, Guangzhou added three counties to the Nansha
area, expanding it from 500 square kilometers to more than 800 square kilometers. From
the fourth quarter of 2012 to the fourth quarter of 2013, the Nansha New Area sold 33
land lots; this made it the district that sold the most land in Guangzhou (“Nansha New
Area Sold 33 Land Lots in Last Year,” 2013). The Nansha government kept pushing
more land to the market (Table 9) to obtain capital to finance Nansha’s infrastructure
development. Though the National Development Bank agreed to provide a 60 trillion
yuan loan to Nansha, the expected investment need was 1,500 billion yuan, a number that
could not be achieved by the local revenue—Nansha’s revenue was only 2 billion yuan in
2012. Given this strong reliance on increasing land prices and significant land sale
revenue, local officials often disobeyed the central government’s orders about stabilizing
land prices and calming the residential market. At one time, the local government
212 311 368 396 488 576 606
6,082
7,140
8,287 9,138
10,748
12,423
13,551
3%
4% 4% 4% 5% 5% 4%
0%
1%
2%
3%
4%
5%
6%
7%
8%
9%
10%
0
2000
4000
6000
8000
10000
12000
14000
16000
2006 2007 2008 2009 2010 2011 2012
Nansha District
Guangzhou GDP
Percentage of Nansha GDP ofGuangzhou

190
officials even met with real estate companies to discuss ways to keep land prices
increasing (Interview, August 2013). In 2009, the average price of housing in Nansha was
4,000 yuan/m2, but it exceeded 10,000 yuan/m
2 at the end of 2011. Increasing land prices
hurt the area’s industrial development, however, creating a vicious cycle for the local
government, which faced even less industrial activity and tax revenue, forcing it to rely
still more on land sales.
Table 9
Nansha’s Annual Land Sale Plan (square meters)
Source: Nansha Government’s Annual Land Sale Plans, retrieved from:
http://nansha.laho.gov.cn/zwxxjb/tdgyjh_2737/ , on April 20, 2014.
8.5 Summary
The development of the two major economic development zones (districts) in
Guangzhou failed to contribute a significant proportion of GDP to the city. Whereas
Tianjin’s development zone has carried as much weight in terms of GDP as the old
districts of the city, combined, the two major economic zones in Guangzhou contributed
less than 20% to the city’s GDP, contrasting with the old districts (including Yuexiu,
Liwan, Haizhu, Tianhe, and Baiyun) that together contributed more than 50% from
2006–2012 (as shown in Figure 45). Comparatively, the Nansha zone performed even
worse than the Guangzhou Development Zone. Conflicts regarding the purpose of the
zone and its effects on the surrounding cities and regional interests led to a lack of clarity
about the zone’s purpose and to many major changes in its aims over the course of its
Residential Commercial Industrial
2009 640,000 470,000 7,050,000
2010 279,264 35,916 4,870,834
2013 2,050,434 2,372,489 3,547,212

191
development. Without an explicit plan, the Nansha area was unable to engage in
significant, coordinated development efforts and suffered as a result.
Figure 45. The GDP of the old districts and of Nansha and Luogang combined as a percentage of
Guangzhou’s GDP from 2006–2012.
Nansha’s lack of effective development was affected by its status as a multiscale
platform of conflict throughout its history. A series of conflicts among multiple parties at
different scales slowed down or even actively hindered the area’s development. In its
initial development stage, conflicts occurred between Fok, the primary private investor,
and the zone committee, led by the corrupt official Liang Bonan, which prevented Fok
from obtaining necessary resources; later, this conflict was replaced by the conflict
between Guangzhou and Panyu over the jurisdiction of Nansha. Although Nansha
eventually became an official district of Guangzhou, Guangzhou’s plan to develop heavy
industries and the port industry in Nansha was stymied; its heavy industry aspirations
were eventually thwarted almost completely by the opposition of neighboring cities.
These conflicts involved parties ranging from local administrations and neighboring cities
56% 56% 55% 55% 54% 54% 55%
15% 16% 17% 17% 17% 18% 17% 0%
10%
20%
30%
40%
50%
60%
70%
80%
90%
100%
2006 2007 2008 2009 2010 2011 2012
Old Districts Nansha and Luogang

192
to more powerful, higher-level units such as Hong Kong (a Special Administrative
Region [SAR]), the Fok Foundation, Guangdong province, and the central government,
which often played the role of mediator among these powerful parties. Nansha’s planning
has always been in a state of flux, focusing on different visions for the area according to
the needs of different interested parties. Such volatile planning made implementation
difficult at best, preventing the area from engaging in coherent, consistent development.

193
Chapter 9
Conclusion: Rethinking Planning and Planners
For a long time, centralization and decentralization have been understood as two
different forms of governance organization, both of which have gained supporters based
on their different theoretical frameworks. Decentralization, in particular, has gained
popularity in the past few decades. In this study, however, I show how the debates about
the split between centralized and decentralized governance practices can be unified. In
Chapter Three, I discussed Agamben’s (2011) investigation into the emergence of the
bipolar governance machine, which consists of a rule-making sovereign power at one
pole and a government focused on the execution of those rules at the other. Either pole,
Agamben suggested, may be predominant in any period of time, but they cannot be
understood as two separate powers. The two forms of power arrangement—sovereignty
and governance—coexist and coordinate in the bipolar governmental machine. If
Agamben’s conclusion about the theological genealogy of Western economic
government is true, we realize that there is much less difference than had previously been
thought between the bipolar governance structures of Western democracies and those of
China. Both societies, whether democratic or authoritarian, face the dilemma that Riker
(1964) illustrated: the struggle between an overly strong federation and a flock of
freeriding constituent states, and the need for two poles to maintain the operation of the
machine in either instance. Inspired by Agamben’s work, I have argued that, in this
bipolar machine, the appropriate focus is on the connecting mechanism of the two poles. I
further argued that negotiation and conversations among governance bodies play key

194
roles in mingling, integrating, and neutralizing the conflicts between (a) the sovereign
power and the government and (b) between the general national policies and their
specific local implementation. If this is true, we must reevaluate the validity of arguments
that support unconditional decentralization, especially those that are in favor of power
sharing and local government’s increasing responsiveness to citizens, particularly in the
case of authoritarian regimes.
9.1 The Model and the Three Platforms
At the beginning of this study, I asked how intergovernmental relationships in
China have influenced the implementation of a national policy at the local level. I used
the Special Economic Zone policy as an example and studied its implementation in three
cases over the past three decades. The cases showed three models of intergovernmental
relationships and their correlation with the paths of development in each area.
Figure 46 summarizes the model demonstrated in this study. In the quadrant
diagram, I show the relationships between the speed of development, the degree of
conflicts or collaboration revealed in the intergovernmental negotiations, and the scales
of the governmental bodies involved. Compared to conflict-dominated relationships,
collaboration brings coherent implementation and thus faster growth to a region. In a
collaboration-predominant environment, the more variety of scales of governmental
bodies involved in the collaboration, meaning that the collaboration is across scales, the
faster the development will be. This is demonstrated in the case of Tianjin Binhai New
Area, a coherent collaborative platform, as shown in the bottom left corner of the figure.
In conflict-dominated relationships, the more governmental bodies of different scales are

195
involved, the slower the development will be. The negotiations take longer and encounter
more difficulties in reaching consensus because of the larger number of participants in
the negotiation and the conflicts among scales, thus “the politics of scale” are more
difficult to reconcile (Brenner, 2001; Smith, 1992). Guangzhou Development Zone
demonstrates a scenario of conflicting platform involving only the zone and the
municipality; Nansha, where multiple governmental bodies with conflicting interests
keep the planning of the area in a state of flux, demonstrates a multiscale conflicting
scenario. The three cases illustrate three types of platforms, each of which exemplifies a
specific combination of the two independent variables—intergovernmental negotiation
and scales—and each of which demonstrates its effects on the dependent variable, the
speed of growth. In the following, I review how the cases illustrate the model.
Figure 46. The stylized theoretical framework and the three representative cases.
The municipality of Tianjin, dedicated to taking advantage of its close
relationship with the central government, aligned its interests with and gained support

196
from the center. In this model of a coherent collaborative platform, the three levels of
government that oversaw the zone—the zone government, municipal government, and
central government—reached a state of highly coherent cooperation. Conflicts of interest
were minor and mainly occurred in the early period of development of the zone.
Although the central government restricted the development of the Binhai area because of
its concerns that this region might rival Beijing as the economic center of northern China,
the concern gave way to the central government’s zeal for constant economic growth in
the 2000s. The central and the municipal governments reached consensus on accelerating
the development of the region with different purposes: the central government wanted
overall growth and a policy experimental field to sustain its image of a reforming party-
regime while the municipality wanted sustainable financial and land resources for the
city’s growth and expansion. But both parties were able to reach consensus on keeping
the zone growing. The central government endorsed the growth of the zone by openly
supporting business attraction, especially investments from large foreign institutions and
national state-owned enterprises, and the municipality actively cooperated. The zone-
level government’s interests were largely congruent with those of the municipal
government. In this development in the late 2000s, this congruence helped to deliver
unstoppable growth and capital concentration to the area. This kind of congruence has the
highest possibility of producing rapid growth, but it is also susceptible to disastrous
development outcomes because no opposition to development exists to challenge
presumptions or force critical thinking about planning, and investors may be blinded by
the perceived government guarantee of profits. The problems caused by the real estate

197
bubble in Tianjin’s Binhai New Area are examples of the risks of this sort of high
coherence.
The Guangzhou Development Zone was not able to establish such congruent
interests between local governments. For historical and geographical reasons, Guangzhou
did not pursue national support for its development efforts. Even the local interests have
been unable to work together coherently and consistently. After the zone became an
administrative district rather than a special economic district, the city became more
predatory in its demands. For the municipality, the Guangzhou Development Zone
primarily served as an expansion area within the city and a means to generate revenue
and attract capital investment. In this model of a locally contained conflicting platform,
the zone does not provide a scale for coordinating conflicts and interests; rather, it
becomes a platform for conflicts between the city and district governments. Another
consequence of the transition from an economic zone to a full administrative district is
that the Luogang District must now also compete with other districts in the city for
resources and businesses. However, these competitions are locally contained and do not
involve regions that are not under the city’s authority. The relationship between the
central government and local government has a minimal effect on this sort of zone, and
the growth rates vary depending on other economic and geographic factors. The district
has maintained a moderate pace of growth.
The case of Nansha illustrates a third model, characterized by competition and
conflicts at multiple scales—a model of a multiscale conflicting platform. The Nansha
zone (later a district) has navigated many different interests and has generated a number
of conflicts with nearby districts, Guangdong province, Hong Kong, and surrounding

198
cities. The major players in the conflicts have included Hong Kong, Guangdong province,
Guangzhou municipality, Nansha district, neighboring cities, and the central government.
Hong Kong wanted to limit the development of Nansha from upscaling to a global scale
and possibly threatening Hong Kong’s status, but it also wanted a certain level of
development of this area to ease Hong Kong’s limited resources for development.
Guangdong province focused on the overall provincial development and needed to ease
the intercity conflicts within the province while concurrently utilizing Nansha’s
geographical advantages for Guangdong’s growth. Guangzhou municipality wanted to
use Nansha to facilitate the city’s development, especially to ease its limitation in heavy
industry development and port industry. Nansha district, which is primarily under the
direction of the Guangzhou municipality, faced pressure from the city for its growth.
Neighboring cities saw Nansha as a primary competitor and threat to their own growth
and tried hard, including collaborating with Hong Kong, to fight against Nansha’s
development plan. The central government wanted peace and collaboration in the area,
especially a controllable, benign relationship between Hong Kong and Guangdong. As a
result of the constant conflict and turmoil, the many parties interested in Nansha’s
development could not reach an agreement on its planning, making the zone an
assemblage of conflicts (Allen & Cochrane, 2007) rather than a site of cooperation,
which has stifled the district’s development. Not surprisingly, zones with this form of
contentious intergovernmental relationship show the lowest rates of growth.
9.2 Contribution of This Study

199
The comparison of the three development zones in China has shown that the
effectiveness of using delimited economic zones for economic development and
industrial development needs more scrutiny. International organizations such as the
World Bank have promoted spatially delimited zones, such as special economic zones
and various types of development zones, as primary industrial development strategies
across the world. In many of the research reports of these organizations, China was used
as the example of how this policy brings growth, employment, and technological
innovation and upgrading by attracting foreign direct investment and state-led
infrastructure investments. However, the different paths and outcomes of development of
the three zones in China raise questions about this approach and the best practices related
to this policy. This study demonstrates the importance of subnational politics in carrying
out national economic development policy.
A second contribution of this study is its reexamination of the dichotomous
theoretical frameworks of decentralization and centralization and proposal of a remedy
that enables merging of power divergence and convergence for better governance.
Decentralization is one of the most important institutional reforms in the last three
decades in numbers of developing and transitioning countries (Bardhan, 2002; Faguet,
2014). Advocates of decentralization believe that it can deliver equity, governance
accountability, democracy, and better public services. However, as noted in a number of
studies, the statistic linkage between decentralization and economic growth so far has
been inconsistent across a geographically diverse body of studies that cover different time
periods (Brehm, 2013; Iimi, 2005; Martinez-Vazquez & McNab, 2003; Zhang & Zou,
1998). In these studies, decentralization has usually been measured in the sense of fiscal

200
decentralization by subnational governments’ shares of expenditures or revenues in the
entire government sector and economic development by per-capita GDP or per-capita
income. Depending on the research design, the authors have sometimes presented
positive relationships between decentralization and economic development proxies as
negative relationships between centralization and relevant variables. Interpretation of the
mixed results is no less controversial. In addition, scholars have accumulated an even
longer list of explanations for the negative relationships between decentralization and
growth (Davoodi & Zou, 1998; Iimi, 2005; Jourmard & Kongsrud, 2003; Martinez-
Vazques & McNab, 2003; Muscatelli & Roy, 2003; Thornton, 2007). This study develops
a theoretical framework with which to reexamine the intergovernmental relationship and
its relation to economic development. Rather than seeing decentralization and
centralization as the only two alternatives of economic management, the framework,
based on Agamben’s (2011) analysis of bipolar governance, is for the two directions of
power structure to coexist, coordinate, and coevolve in a mechanism of
intergovernmental negotiation. Intergovernmental negotiation has been discussed mostly
in regard to international relations, but this study innovatively presents this issue at a
subnational level.
The study also contributes to convert the “China story” into richer Chinese stories.
First appearing in the public media, the phenomena of land finance and ghost towns
(unoccupied high-rise, high-density clusters of buildings in Chinese cities) have attracted
more and more Chinese scholars’ attention (Tan & Zhou, 2015; Zheng et al., 2014). On
December 30, 2013, the National Audit Office published a report on land finance. The
report showed that the local governments had outstripped their revenues and depended
201
heavily on land transaction fees to pay back loans that were used for construction projects.
According to the report, the local government had promised to repay 37% of the loan
money with land transaction fees by 2012. Though the overall levels of debt appear
manageable, some governments, including three provincial governments, 99 cities, 195
county-level administrations, and 3,500 townships, had direct debts exceeding 100% of
their annual economic outputs (National Audit Office, 2013). Land governance systems
are usually studied as a topic in China’s reform and land commodification. The literature
about decentralization has contained little information about China’s land governance
system because it barely falls within the category of administrative decentralization. This
dissertation reveals a story about how land played an important role in incentivizing local
officials in their development strategy making and shows that land governance is
pertinent to both administrative and fiscal decentralization. In fact, decentralization
literature that has presented the restructuring as of only three types (political, fiscal, and
administrative) has significantly limited the explanatory power of that literature to
increase understanding of China’s land administration reform. More systematic study is
needed to focus on what role the reform of land-management institutions has played in
China’s growth in the past three decades.
Lastly, the evidence from the three case studies disproves the universal
applicability of Habermasian communicative action and the consensus-making form of
planning. Smooth and undistorted communication is not simply a potentially impossible
ideal; the truth is that power and special interests are inseparable from communication,
contributing to the outcome of any communicative action. To use Habermas’s
terminology, power and interest are part of the lifeworld. Therefore, the negotiations

202
between interested parties do not necessarily lead to consensus, as seen in the case studies
presented here. In these cases, negotiation leads to consensus only when a clearly defined
power hierarchy coincides with the hierarchy of interests. There must exist either a
superpower that is able and willing to dominate and lead the negotiation toward the
scenario in which the goals of the superpower correlate with the goals of the lesser power
(as in Tianjin), or else a mediocre power may not be constrained by the superpower
(possibly due to its lack of interest) and may therefore dominate and lead the negotiation
(as in the Guangzhou Development Zone). When conflicting powers exist on the same
level it is difficult to reach a consensus, even if a superpower is willing to coordinate the
situation or facilitate negotiations (as in Nansha).
9.3 Power and Acclamation: Why Authoritative Government Needs Planners
and Planning
The forms of intergovernmental relationships and their impact on growth rates
and development outcomes should not be surprising, but it is remarkable how the role of
planning and planners have been minimized in the development of these regions. Plans
are subject to change according to the will of the leading officials at the city level or
higher. Depending on the political and economic needs at the time, officials can launch a
new round of revisions to the original plan or even demand a full re-planning effort.
Professional planners act as facilitators for the completion of these changes and
ultimately serve as agents helping to achieve the political power’s goals. In a
conversation with a planner from a private consulting firm who recently planned one of

203
the development zones, I asked how planners worked on the project and what their most
important planning strategy had been. Her answer was:
“Listen closely to what the officials say, carefully interpret it, and find a clever
way to represent the concerns of the officials in your plan. And currently, the
primary concern has always been land. For example, officials say they will focus
on ‘new development horizon,’ but what does that mean? That means they need
new land and expansion. What do you do? You give him the right reason for
doing so.” (Interview, September 2013)
Such manipulation of plans to suit the goals of local and regional officials is not
unusual. Several planners have confirmed that manipulating the projected population is
one of the key techniques used to ask the central government for increased land quotas.
By projecting that more people will be moving into the area, it stands to reason that more
living area must be added and, therefore, an increased land quota is justified; in fact,
Chinese law requires the addition of living area to address population increases. Planners,
for their part, are responsible for “scientifically making up” answers to questions such as
where these people come from, who they are, and what jobs they will have—all part of
the stories planners in authoritarian regimes must tell through their work.
If officials and the government in an authoritarian regime have so much power,
why would they need planners and planning? The answer, if we go back to Agamben
(2011), is that power needs acclamation as glory needs glorification. Acclamation can
justify the power and fill the empty space between governance and the governed. If the
role of planners and planning is reduced to justifying the existence of power, how can
justice in urban development ever be achieved? In Fainstein and Campbell’s (2012)
introduction to the third edition of Readings in Planning Theory, the authors suggest that
the central question of planning theory is focused on planning’s role in “making a good

204
city and region.” They go on to ask “whether planners should focus on the desired objects
of their efforts or whether they should concern themselves primarily with the process by
which planning decisions are made and assume that a good process will produce a good
outcome” (Fainstein and Campbell, 2012, p. 1). When constrained in the role of offering
acclamation, planners and planning can do neither—they are deprived of both desired
objects and the ability to work on the process. Due to its rational nature, planning
becomes an immensely useful tool for acclamation, wielding the power to convince the
public of the supposedly objective benefits of a plan; it is so useful, in fact, that Chinese
officials have begun taking courses or even pursuing degrees in planning. This begs
another question: Who can decide what a just city is, when even politicians can claim that
they have expertise in urban planning?
Oikonomia disappeared from the theological lexicon during the Middle Ages,
reappearing in the 17th
century in its present form with the more familiar meaning of
economy. However, as argued by Agamben (2011), the modern political economy and
the administrative, apolitical notion of contemporary governance have their roots in and
have been determined by the paradigm of providential oikonomia. The curious doctrine
of the Trinity, the economic relationship between the transcendent God and the immanent
God, between Kingdom and Government, reveals the heart of modern society. For
Agamben (2011), the theological solution provided a model for the solution for
contemporary society. The relationship between the divine plan and the believers, how
the transcendent general providence relates to the specific fate through the economy, how
acclamation and ceremony solved the problem of linking transcendent glory to the
immanent power of the world—all are echoed in contemporary society in the form of

205
economic government and public opinion. The dependence of political power on
acclamation in medieval times is not much different from modern democratic
governments’ reliance on the legitimacy gained from public opinion, which provides the
basis for consensus governing. Ancient glory appears in contemporary society in the form
of public opinion and the media, which penetrate every aspect of modern social life and
make the modern democracy glorious, in the original sense of the term. Thus, “modernity,
removing God from the world, has not only failed to leave theology behind, but in some
ways has done nothing other than to lead the project of the providential oikonomia to
completion” (Agamben, 2011, p. 287). Agamben’s goal is to deactivate the theological–
political machine to make room for inoperativity, which is the center of human life and
the essence of eternal life, and which the machine of economy and glory “ceaselessly
attempts to capture within itself” (Agamben, 20011, p. 251).
Although Agamben (2011) sees this thesis as an account of Western democratic
society, I argued here that his views on the bipolar governance machine and how power
needs acclamation are also applicable to authoritarian regimes. Agamben’s (2011)
research actually creates the possibility of comparing governments of both forms and
offers a nexus of comparison.
In an authoritarian regime like China, the glorification function is carried out not
only by public opinion, which is influenced by the media under the authoritarian power’s
control, but also by the experts who provide consultation services to the government, who
justify and support all the government’s decisions and cannot countermand the decisions
by their powerful client, whether they are not willing to or are unable to given their
working environment. In the “south-eastern settings” (Yiftachel, 2006), where

206
transparency and organization in decision-making and public participation and
deliberation have only a minimal presence, planners have limited options for choosing
their working environment. They can work in government planning departments, in
public planning institutions funded by the government, or at private planning
consultancies, which get their business from the government. In planning, only the
government counts.
9.4 Ways Forward
As discussed by Zhang (2000), a main challenge for Chinese planners is that
“planning as a government function has to follow government leaders, but how to ‘tell
the truth to power’ and rectify consequences of wrong decisions made by the power?”
This is still the biggest challenge facing planners in China today. When planners are
given limited information resources from which to form opinions, as well as limited
outlets to use to publicize their opinions, planning practices are predictable and inevitably
reduced to acclamation. The purpose of planning from the government’s perspective, in a
growth-focused regime, is to provide information and direction in order to attract
business and capital. Planning is subject to change if the desired businesses are not
attracted. The management function of planning is minimized. In such a scenario, the role
of a planner is to create a plan that gives a semi-scientific justification for the
government’s goals and that will attract businesses. People are the factor that merits the
least consideration in this scenario, as it is assumed that the planned population will
simply appear in the area. Under such circumstances, equality, as the core planning
philosophy, has to subsume itself to obedience. Planners are expected to do nothing that

207
would not glorify the power of the authority—and therefore, it is perhaps better to do
nothing than to act merely as a form of acclimation. But other than doing nothing, what
does this study suggest?
First, this study suggests that rapid growth requires neither strong government nor
good planning; however, negotiations, conversations, and conflicts can reduce the chance
of making major mistakes during development. Strong government cannot guarantee the
quality of development. We have seen in this study that the central government did not
have any absolutist techniques to guarantee its control of the local levels. The only
working mechanism is the constant negotiation between the executive branches and the
sovereign power. When little conflict threatens intergovernmental relationships, the risk
of producing unwise plans is high, and the situation is even more dangerous when the
high level coordination between government entities pushes forward smooth execution of
these ill-advised plans.
The special interests and relationships that are reflected in such negotiations lead
to a natural suggestion that implicit and explicit negotiations among governments and
public interest groups should not be kept private, particularly where the public interest is
concerned. The public should be entitled to know what is being debated, what interests
are involved, what alternatives are being proposed, and how the exchanges between
interests might affect them. Planners should have the techniques and skills to report, to
analyze, and to inform the public about these negotiations.
In order to counter the use of planning as acclamation, planning departments and
planners should be given the option to become inoperative. Planning theory has largely
involved theories about action—questions have been asked about when and how to

208
intervene, but this study provides the theoretical ground for not acting at all. When taking
action means acclaiming power with no other results, inactivity is the choice that must be
encouraged and rewarded. This argument is not equal to the market primacy argument,
but it merits consideration as an alternative strategy when planning is used only as a
semi-scientific support for state action and functions merely to glorify authoritarian
power. During my field work, I heard planners complaining that “there is not much
planners can do.” But in these circumstances, “not much” or even “nothing” is precisely
what they should be doing—they should cease providing acclamation for the government
or political power. If disagreeing with the government is not an option, then ceasing to
work for the government is at least a passive solution. On an institutional level, engaging
in less planning or ceasing work entirely should also be rewarded if the project under
consideration would lead to inequality. The institution should guarantee that planners do
not have to rely on the approval of the powerful, both financially and politically.
Moreover, planning should be emancipated from its current role of creating
consensus. Instead, it should embrace the role of organizing and stimulating negotiations
and debates among governmental departments and different levels of government, and
even between the political power and the general public. In the current model, a planning
department is responsible for making plans based on the negotiations and conversations
among different governmental departments. Planners are expected to turn these debates
into a consensus and to create a plan reflecting this consensus. The process of negotiation
is not reflected in the final product; rather, the final product has already been detached
from any debates and negotiations. When the political power or the government is no
longer the best guardian of the public interest—which is difficult to define in the first

209
place—planners should be given the power to organize intergovernmental debates on
development issues, and to document and publicize these debates. In this model, the
planning division is not required to coordinate with other government departments, but
rather it is the coordinator of governance. The product of planning should be
documentation of the process of debate, negotiations, and conversations among interested
parties. The planning division is not responsible for execution, but it should have the
power to monitor and document the execution of a plan. Moreover, the plans should be
freely available to the public. Plans that are proposed by different departments should be
publicized through the planning department, allowing the public to be educated on the
plans and their alternatives. A plan is not the required outcome of planning; rather, plans
and the debates surrounding them are.
Planners should consider the career option of becoming a “weiquan” (rights
protection) planner. Today, many lawyers in China, who used to be civil servants, are
now turning to the private sector. Among them, an emerging group of private lawyers
have become rights-protection lawyers, who look for issues with a profound social
impact or which affect the public interest; they advocate for clients in the face of more
powerful interests (Fu & Cullen, 2008). Weiquan lawyers are a small but influential
group of legal practitioners in China, and the movement they initiated, weiquan (rights
protection) law, has been the boldest initiative in legal practice in China in recent years.
Fu and Cullen (2008) documented how weiquan law is practiced and classified such
lawyers into three groups: moderate weiquan lawyers who work within legal boundaries
and avoid political action altogether, critical weiquan lawyers who criticize the system

210
and may engage in political actions but are cautious not to cross the line, and radical
weiquan lawyers who boldly represent “enemies” of the state.
Weiquan planner, much like weiquan lawyer, is not necessarily a dangerous
profession under the current authoritarian regime in China. First, the government is now
relying more on the rule of law to alleviate its crisis of political legitimacy (Fu & Cullen,
2008). Perhaps more importantly, the political boundaries on what can and cannot be
done are constantly changing and are subject to negotiation and transformation (Stern &
O’Brien, 2011). The state has been sending “mixed signals” and is apparently ambivalent
about “how much is too much” and what actions may be performed before something is
classified as “crossing the line” (Stern & O’Brien, 2011). In such an ambiguous
environment, with government guidelines about permissible political behavior in a
constant state of flux, it is crucial to have individuals, including educated professionals,
who are willing to risk speaking out.
Can planners form a group similar to that of the weiquan lawyers? Davidoff’s
(1965) “Advocacy and Pluralism in Planning” is certainly worth revisiting in this context.
The advocate planner, as proposed by Davidoff (1965), does more than provide
information and envision future options: he or she is also a “proponent of specific
substantive solutions”—alternative plans—and must be responsible to his or client,
especially the underrepresented groups. Weiquan planners are the advocate planners
confronting the authoritarian regimes of China and other developing countries that do not
have open and welcoming environments for public participation. These planners must
learn how to break the current political boundaries and help citizens escape from the
“paradox of weiquan movements,” in which the rights of the powerless weiquan

211
participants are tightly restricted by the terms narrowly defined by the central authority
even as they struggle to exercise those rights (Shih, 2015).
In conclusion, I propose that planners in authoritarian regimes must seek a role
beyond acclamation and the justification of political power, and propose strategies by
which they may do so. To move forward, more research and study about inactivity and
inoperativity is needed—we must develop planning theory that does not see efficiency as
its primary goal, but rather, that envisions alternative planning practices meant to
promote divergence rather than to reach consensus. More needs to be done and undone.

212
References
2009 National Ranking for Land Sale Income. (2010, January 8). Sina Finance. Retrieved
from http://finance.sina.com.cn/g/20100108/14487215343.shtml
Agamben, G. (1993). The coming community. Minneapolis, MN: University of
Minnesota Press.
Agamben, G. (2005). State of exception. Chicago: University of Chicago Press.
Agamben, G. (2007, January 11). 11th B.N. Ganguli memorial lecture: “The Power and
the Glory.” Public Theology.
Agamben, G. (2007). Art, inactivity, politics. In Criticism of Contemporary Issues,
Serralves International Conferences. Porto, Portugal: Serralves Foundation.
Agamben, G. (2011). The kingdom and the glory. Stanford, CA: Stanford University
Press.
Agnew, J. (1994). The territorial trap: The geographical assumptions of international
relations theory. Review of International Political Economy, 1(1), 53–80.
Agrawal, A., & Ribot, J. (1999). Accountability in decentralization: A framework with
South Asian and West African cases. The Journal of Developing Areas, 33, 473–502.
Amin, A., & Malmberg, A. (1994). Competing structural and institutional influences on
the geography of production in Europe. In A. Amin (Ed.), Post-Fordism: A Reader.
Cambridge, UK: Blackwell Publishers Ltd. doi:10.1002/9780470712726
Amsden, A. H. (1992). Asia’s next Giant: South Korea and late industrialization (Vol. 1).
Cambridge, UK: Oxford University Press.
Avishai, B. (1996). Motorola in China, 1986-1996: The Duties of the Global Economy.
Schaumberg, IL: Motorola University Press.
Bahl, R., & Linn, J. (1992). Urban public finance in developing countries. Cambridge,
UK: Oxford University Press.
Bahl, R., & Wallich, C. (1992). Fiscal intergovernmental relations in China. World Bank
Policy Research Working Papers WPS 863.
Banerjee, T., & Chakravorty, S. (1994). Transfer of planning technology and local
political economy. Journal of American Planning Association, 60(1), 37–41.
Bardhan, P. (2002). Decentralization of governance and development. The Journal of
Economic Perspectives, 16(4), 185–205.
Bayirbağ, M. K. (2013). Continuity and change in public policy: Redistribution,
exclusion and state rescaling in Turkey. International Journal of Urban and
Regional Research, 37(4), 1123–1146. doi:10.1111/1468-2427.12000
Beauregard, R. A. (2006). Book review: New state spaces: Urban governance and the
rescaling of statehood. Urban Affairs Review, 41(3), 416–418.
doi:10.1177/1078087405280567
Bednar, J. (2011). The political science of federalism. Annual Review of Law and Social
Science, 7(1), 269–288. doi:10.1146/annurev-lawsocsci-102510-105522
Bednar, J., Eskridge, W., & Ferejohn, J. (2001). A political theory of federalism. In J.
Ferejon, J. N. Rakove, & J. Riley (Eds.) Constitutional Culture and Democratic Rule.
New York: Cambridge University Press.
Binhai New Area. (2007, March 20). The Northern Net. Retrieved from
http://www.www.china-up.com/newsdisplay.php?id=1242431&sib=1

213
Birney, M. (2014). Decentralization and veiled corruption under China’s “rule of
mandates.” World Development, 53, 55–67. doi:10.1016/j.worlddev.2013.01.006
Blanchard, O., & Shleifer, A. (2000). Federalism with and without political centralization:
China versus Russia. NBER Working Paper No. 7616. Retrieved from
http://www.nber.org/papers/w7616
Blume, L., & Voigt, S. (2011). Federalism and decentralization—A critical survey of
frequently used indicators. Constitutional Political Economy.
Bolesta, A. (2007). China as a developmental state. Montenegrin Journal of Economics.
Brehm, S. (2013). Fiscal incentives, public spending, and productivity–county-level
evidence from a Chinese province. World Development, 46, 92–103.
doi:10.1016/j.worlddev.2013.01.029
Brenner, N. (1998). Between fixity and motion: Accumulation, territorial organization,
and the historical geography of spatial scales. Environment and Planning D: Society
and Space, 16(4). 459–481.
Brenner, N. (2001). The limits to scale? Methodological reflections on scalar
structuration. Progress in Human Geography, 25(4), 591–614.
doi:10.1191/030913201682688959
Brenner, N. (2004a). New state spaces: Urban governance and the rescaling of statehood.
New York: Oxford University Press.
Brenner, N. (2004b). Urban governance and the production of new state spaces in
Western Europe, 1960–2000. Review of International Political Economy, 11(3),
447–488. doi:10.1080/0969229042000282864
Brenner, N. (2009). Open questions on state rescaling. Cambridge Journal of Regions,
Economy and Society, 2(1), 123–139. doi:10.1093/cjres/rsp002
Brenner, N., Jessop, B., Jones, M., & MacLeod, G. (2003). Introduction: State space in
question. In N. Brenner, B. Jessop, M. Jones, & G. MacLeod (Eds.), State/Space: A
reader. Hoboken, NJ: Wiley-Blackwell.
Buchanan, J. (1995). Federalism as an ideal political order and an objective for
constitutional reform. Publius: The Journal of Federalism, 25(2), 19–27.
Cartier, C. (2001). “Zone fever,” the arable land debate, and real estate speculation:
China’s evolving land use regime and its geographical contradictions, 10(June 1998),
445–469. doi:10.1080/1067056012006713
Chang, H. (1999). Industrial policy and East Asia: The miracle, the crisis, and the future.
Bank Workshop on “Rethinking the East Asian Miracle” (May), 1–45.
Change of the City. (2014). Retrieved from
http://www.chinacity.org.cn/csfz/csjs/130048.html
Cheng, X., & Zhao, J. (2012, April 1). Tianjin Binhai Xin Qu: Yan Yi “Hua Jian Cheng
Die” De Gu Shi [Tianjin Binhai New Area: A story of its emerging and maturing].
China Economic Times, p. T17. Retrieved from
http://jjsb.cet.com.cn/show_122193.html
China Business. (n.d.). GDP gap between central and local. Retrieved from
http://finance.sina.com.cn/china/hgjj/20130803/000016332423.shtml
CNN. (2015). Inside a Chinese “ghost city.” Retrieved from
http://www.cnn.com/2015/01/19/world/gallery/china-tianjin-ghost-city/
CONBO Insolvency. (2005, May 20). Southern Morning Post. Retrieved from
http://www.southcn.com/news/dishi/guangzhou/jingji/200505200372.htm

214
Cooke, P., & Clifton, N. (2005). Visionary, precautionary and constrained “varieties of
devolution” in the economic governance of the devolved UK territories. Regional
Studies, 39(June), 437–451. doi:10.1080/00343400500128457
Davidoff, P. (1965). Advocacy and pluralism in planning. Journal of the American
Institute of Planners, 31(4). doi:10.1080/01944366508978187
Davoodi, H., & Zou, H. (1998). Fiscal decentralization and economic growth: A cross-
country study. Journal of Urban Economics, 43(2), 244–257.
doi:10.1006/juec.1997.2042
De Figueiredo, R. J. P., & Weingast, B. R. (2005). Self-enforcing federalism. Journal of
Law, Economics, and Organization, 21(1), 103–135. doi:10.1093/jleo/ewi005
Delaney, D., & Leitner, H. (1997). The political construction of scale. Political
Geography, 16(2), 93–97.
Devas, N. (2005). The challenges of decentralization. The Global Forum on Fighting
Corruption, (May), 1–11.
Development Zone’s explorer: Interview with Ye Disheng [Kai Fa Qu Kuo Huang Zhe
Ye Di Sheng ]. (2008). Tianjin People’s Radio. Retrieved from
http://www.radiotj.com/dtzt/system/2010/03/24/000266777.shtml
Development Zone Planning Bureau Updates. (2012). Retrieved from
http://ghj.luogang.gov.cn/htmlauto/ZXXX/gzdt/2012/07/23/1712051750.shtml
Du, Y., Gu, S., & Zhang, J. (2006, March 1). Zheng Xie Diao Yan Bao Gao Zu Tui
Tianjin Binhai Xin Qu Jia Kuai Jian She [The report of CPPCC accelerating Tianjin
Binhai New Area’s development]. Guangming Daily. Retrieved from
http://www.gmw.cn/content/2006-03/01/content_381317.htm
Edin, M. (2003). State capacity and local agent control in China: CCP cadre management
from a township perspective. The China Quarterly, 173, 35–52.
Enright, M., Chang, K., Scott, E., & Zhu, W. (2003). Hong Kong and the Pearl River
Delta: the economic interaction. Retrieved from
http://hub.hku.hk/handle/10722/121264
Evans, P. B. (1995). Embedded autonomy: States and industrial transformation.
Princeton University Press.
Evans, P. B., Rueschemeyer, D., & Skocpol, T. (1985). Bringing the State Back In. New
York: Cambridge University Press.
Faguet, J. P. (2014). Decentralization and governance. World Development, 53, 2–13.
doi:10.1016/j.worlddev.2013.01.002
Fainstein, S. S., & Campbell, S. (2012). Readings in planning theory (3rd
ed.) S. S.
Fainstein & S. Campbell (Eds.). Hoboken, NJ: Wiley-Blackwell.
Fan, C. (2006). China’s eleventh Five-Year Plan (2006–2010): From “getting rich first”
to “common prosperity.” Eurasian Geography and Economics, 47(6), 708–723.
doi:10.2747/1538-7216.47.6.708
FIAS. (2008). Special Economic Zones performance, lessons learned, and implications
for zone development. Washington, DC: The World Bank.
First Leadership small group meeting on accelerating the development of Binhai New
Area [Jia Kuai Binhai Xinqu Kaifa Kaifang Lingdao Xiaozu Zhaokai Di Yi Ci
Huiyi]. (2007, June 14). Retrieved from
http://news.enorth.com.cn/system/2007/07/04/001753039.shtml

215
Flyvbjerg, B. (1998). Rationality and power: Democracy in practice. Chicago: University
of Chicago Press. doi:10.1080/713672902
Forty-three percent of development zone land lingering. (2004). Retrieved from
http://www.mlr.gov.cn/xwdt/jrxw/200406/t20040625_580864.htm
Foucault, M. (2001). Governmentality. In J. Faubion & R. Hurley (Eds.), Power: The
essential works of Foucault, 1954-1984 (pp. 201–222). New York: The New Press.
Fu, H., & Cullen, R. (2007). Weiquan (rights protection) lawyering in an authoritarian
state: Toward critical lawyering. The China Journal, (59).
Further speed up the development of Binhai New Area [Jin Yi Bu Jia Kuai Binhai Xin
Qu Kai Fa Kai Fang Dong Yuan Da Hui Zhao Kai]. (2007, June 14). E-North.
Retrieved from http://news.enorth.com.cn/system/2007/06/14/001717690.shtml
Gimm, D. W. (2013). Fracturing hegemony: Regionalism and state rescaling in South
Korea, 1961-71. International Journal of Urban and Regional Research, 37(4),
1147–1167. doi:10.1111/1468-2427.12002
Goodwin, M., Jones, M., & Jones, R. (2005). Devolution, constitutional change and
economic development: explaining and understanding the new institutional
geographies of the British state. Regional Studies, 39(June), 421–436.
doi:10.1080/00343400500128432
Goodwin, M. & Painter J. (1996). “Local governance, the crises of Fordism and the
changing geographies of regulation.” Transactions of the Institute of British
Geography, 21, 635–48.
Grossman, S., & Hart, O. (1983). An analysis of the principal-agent problem.
Econometrica: Journal of the Econometric Society, 51(1), 7–45
Guangzhou Economic and Technology Development Zone Chronicle Editor Committee.
(2004). Chronicles of Guangzhou Development Zone 1991–2000. Guangzhou:
Guangdong People’s Publisher.
Habermas, J. (1973). Legitimation Crisis. Boston: Beacon Press.
Habermas, J. (1987). The theory of communicative action, Vol. 2: Lifeworld and system:
A critique of functionalist reason. Boston: Beacon Press. doi:10.2307/2072540
Habermas, J. (1984). The theory of communicative action: Reason and the rationalization
of society. Boston: Beacon Press. doi:10.2307/590724
Habermas, J. (1989). The structural transformation of the public sphere: An inquiry into
a category of bourgeois society. Cambridge, MA: The MIT Press.
doi:10.2307/2072652
Harmes, A. (2006). Neoliberalism and multilevel governance. Review of International
Political Economy, 13(5), 725–749. doi:10.1080/09692290600950621
Harvey, D. (1989). The urban experience. Baltimore, MD: Johns Hopkins University
Press.
Hausmann, R., & Rodrik, D. (2006). Doomed to choose: Industrial policy as predicament.
In Blue Sky Seminar, Harvard University.
Hayek, F. (1960). Constitution of liberty. Chicago: University of Chicago Press.
Heilmann, S., & Melton, O. (2013a). The reinvention of development planning in China,
1993-2012. Modern China, 39(6), 580–628. doi:10.1177/0097700413497551
Heilmann, S., & Melton, O. (2013b). The Reinvention of Development Planning in China,
1993–2012. Modern China, 39(6), 580–628. doi:10.1177/0097700413497551

216
Holmstrom, B., & Milgrom, P. (1991). Multitask principal-agent analyses: Incentive
contracts, asset ownership, and job design. Journal of Law, Economics, &
Organization, Vol. 7, 24–52.
Howitt, R. (1998). Scale as relation: Musical metaphors of geographical scale. Area,
30(1), 49–58.
Hu, A. (2013). The distinctive transition of China’s Five-Year Plans. Modern China,
39(6), 629–639. doi:10.1177/0097700413499129
Huang, P. C. C. (2010). The theoretical and practical implications of China’s
development experience: The role of informal economic practices. Modern China,
37(1), 3–43. doi:10.1177/0097700410386434
Hutchcroft, P. (2001). Centralization and decentralization in administration and politics:
assessing territorial dimensions of authority and power. Governance, 14(1), 23–53.
Iimi, A. (2005). Decentralization and economic growth revisited: An empirical note.
Journal of Urban Economics, 57, 449–461. doi:10.1016/j.jue.2004.12.007
Jessop, B. (2002). The future of the capitalist state. Cambridge, UK: Polity Press.
Jin, H., Qian, Y., & Weingast, B. R. (2005). Regional decentralization and fiscal
incentives: Federalism, Chinese style. Journal of Public Economics, 89(9-10),
1719–1742. doi:10.1016/j.jpubeco.2004.11.008
Johnson, C. (1982). MITI and the Japanese miracle: The growth of industrial policy:
1925–1975. Stanford, CA: Stanford University Press.
Joumard, I., & Kongsrud, P. (2003). Fiscal relations across government levels.
Klimenko, M. M. (2004). Industrial targeting, experimentation and long-run
specialization. Journal of Development Economics, 73(1), 75–105.
doi:10.1016/j.jdeveco.2002.09.001
Kneller, R., Bleaney, M. F., & Gemmell, N. (1999). Fiscal policy and growth: Evidence
from OECD countries. Journal of Public Economics, 74(2), 171–190.
doi:10.1016/S0047-2727(99)00022-5
Lei, Y. (2008). Some memories about my work in the Development Zone. In Guangzhou
Luogang Political Consultative Conference (Ed.), The Memories of the Pioneers I.
Guangzhou: Guangzhou Press.
Li, H., & Zhou, L. A. (2005). Political turnover and economic performance: The
incentive role of personnel control in China. Journal of Public Economics, 89(9-10),
1743–1762. doi:10.1016/j.jpubeco.2004.06.009
Li, J. (2006). Regarding National Auditing Report of 2005. Retrieved from
http://www.audit.gov.cn/n1057/n1087/n524092/557651.html
Lin, J., & Liu, Z. (2000). Fiscal decentralization and economic growth in China.
Economic Development and Cultural Change, 49(1).
Lin, S. (2013). Guangzhou Cheng Ji (Memoir of Guangzhou). Guangzhou: Guangdong
People’s Publisher.
Linder, W. (2002). Political challenges of decentralisation. Berne: Institute of Political
Science.
Liu, G. (2009). Di San Ji: Tianjin Binhai Xinqu Fazhan Ji Shi [The Third Pole:
Recording Tianjin Binhai New Area Development]. Tianjin: Tianjin People’s
Publisher.
Lobao, L. (2008). Decentralization and state-rescaling: The policy experiments of local
governments across the U.S. 2001-2008.

217
Luogang District Government. (n.d.). Luogang District Yearbook. Guangzhou. Retrieved
from http://lgdfz.getdd.gov.cn/Sites/Main/HtmlBook.aspx?id=152
Manor, J. (1999). The political economy of democratic decentralization. Washington, DC:
The World Bank.
Martinez-Vazquez, J., & McNab, R. M. (2003). Fiscal decentralization and economic
growth. World Development, 31(9), 1597–1616. doi:10.1016/S0305-
750X(03)00109-8
Mayer. (1991). “Postfordismus” und “lokaler Staat.” In H. Heinelt & H. Wollmann (Eds.),
Brennpunkt Stadt, (pp. 31–51). Basel: Birkhäuser Verlag.
McKinnon, R. I. (1997). Market-preserving fiscal federalism in the American monetary
union. In Macroeconomic Dimensions of Public Finance: Essays in Honour of Vito
Tanzi. New York: Routledge.
Mertha, A. C. (2005). China’s “soft” centralization: Shifting Tiao/Kuai authority relations.
The China Quarterly (Vol. 184), 791-810.
Moe, T. (1984). The new economics of organization. American Journal of Political
Science, 28(4), 739–777.
Montinola, G., Qian, Y., & Weingast, B. R. (1995). Federalism, Chinese style: The
political basis for economic success in China. World Politics, 48(1), 50–81.
Moreau, F. (2004). The role of the state in evolutionary economics. Cambridge Journal
of Economics, 28(6), 847–874. doi:10.1093/cje/beh038
Mouffe, C. (2000). The democratic paradox. Brooklyn, NY: Verso.
Murray, A., & Whyte, J. (2011). The Agamben Dictionary. Edinburgh University Press.
Nansha New Area Sold 33 Land Lots in Last Year. (2013, September 6). Southern
Metropolis Daily. Retrieved from http://gz.house.sina.com.cn/news/2013-09-
06/06483546264.shtml
National Land Selling Revenues for the First Three Quarters Exceeded 2,000 Billion.
(n.d.). Retrieved from http://news.xinhuanet.com/finance/2013-
10/15/c_125539684.htm
National Audit Office. (2013). National governmental loans auditing report no. 32.
Retrieved from
http://www.audit.gov.cn/n1992130/n1992150/n1992500/3432077.html
Naughton, B. (2005). The new common economic program: China’s eleventh Five-Year
Plan and what it means. China Leadership Monitor, (16), 1–10.
Naughton, B. (2013). The return of planning in China: Comment on Heilmann-Melton
and Hu Angang. Modern China, 39(6), 640–652. doi:10.1177/0097700413498847
North, D. C. (1990). Institutions, Institutional Change and Economic Performance.
Cambridge, UK: Cambridge University Press. doi:10.2307/2234910
Oates, W. (1993). Fiscal decentralization and economic development. National Tax
Journal, 46(2).
Oh, S. Y. (2013). Fragmented liberalization in the Chinese automotive industry: The
political logic behind Beijing Hyundai’s success in the Chinese market. The China
Quarterly, 216, 920–945. doi:10.1017/S0305741013001070
Oi, J. (1992). Fiscal reform and the economic foundations of local state corporatism in
China. World Politics, 45(1), 99–126.
Oi, J. (1995). The role of the local state in China’s transitional economy. The China
Quarterly, (144), 1132–1149.

218
Oi, J. C., Babiarz, K. S., Zhang, L., Luo, R., & Rozelle, S. (2012). Shifting fiscal control
to limit cadre power in China’s townships and villages. The China Quarterly, 211,
649–675. doi:10.1017/S0305741012000823
Ostrom, E., Schroeder, L., & Whynne, S. (1993). Institutional incentives and sustainable
development: Infrastructure policies in perspective. Boulder, CO: Westview Press.
Outlook Weekly. (2010). Central Office about ratifying the buying and selling office
phenomenon. Retrieved from http://politics.people.com.cn/GB/1026/13086850.html
Oversupply of Office in Tianjin. (2012). Retrieved from
http://finance.sina.com.cn/roll/20120510/032812032600.shtml
Parikh, S., & Weingast, B. R. (1997). A comparative theory of federalism: India. Virginia
Law Review, 83(7), 1593–1615.
Park, B. G. (2013). State rescaling in non-western contexts. International Journal of
Urban and Regional Research, 37(4), 1115–1122. doi:10.1111/1468-2427.12074
Peck, J. (2002). Political economies of scale: Fast policy, interscalar relations, and
neoliberal workfare. Economic Geography, 78(3), 331. doi:10.2307/4140813
People’s Daily. (2003). Why is it so hard to regulate development zones? People’s Daily.
Retrieved from http://www.china.com.cn/chinese/OP-c/446508.htm
Perry, J. L., & Rainey, H. G. (1988). The public-private distinction in organization theory:
A critique and research strategy. The Academy of Management Review, 13(2), 182.
doi:10.2307/258571
Pike, A., & Tomaney, J. (2009). The state and uneven development: The governance of
economic development in England in the post-devolution UK. Cambridge Journal
of Regions, Economy, and Society, 2(1), 13–34. doi:10.1093/cjres/rsn025
Polanyi, K. (1944). The Great Transformation. F. L. Block (Ed.). Boston: Beacon Press.
doi:10.1521/suli.2010.40.6.574
Purcell, M. (2009). Resisting neoliberalization: Communicative planning or counter-
hegemonic movements? Planning Theory, 8(2), 140–165.
doi:10.1177/1473095209102232
Ren, B. (2003). The mystery of development zone fever. Retrieved from
http://www.china.com.cn/chinese/2003/Aug/393677.htm
Riker, W. H. (1964). Federalism: Origin, operation, significance. New York: Little,
Brown.
Rodriguez-Pose, A., & Sandall, R. (2008). From identity to the economy: Analysing the
evolution of the decentralisation discourse. Environment and Planning C:
Government and Policy, 26, 54–72.
Rodrik, D. (2004). Industrial policy for the twenty-first century. In CEPR Discussion
Paper No. 4767. SSRN. doi:10.2139/ssrn.666808
Sabatier, P. (1986). Top-down and bottom-up approaches to implementation research: a
critical analysis and suggested synthesis. Journal of Public Policy, 6(1), 21–48.
Sappington, D. (1991). Incentives in principal-agent relationships. The Journal of
Economic Perspectives, 5(2), 45–66.
Schragger, R. (2010). Decentralization and development. Virginia Law Review (Vol. 96).
Scott, J. C. (1998). Seeing like a state: How certain schemes to improve the human
condition have failed. New Haven, CT: Yale University Press. Retrieved from
http://books.google.com/books/about/Seeing_Like_a_State.html?id=PqcPCgsr2u0C
&pgis=1

219
Shen, C., Jin, J., & Zou, H. (2012). Fiscal decentralization in China: History, impact,
challenges, and next steps. Annals of Economics and Finance, 51, 1–51.
Shih, M. (2015). The paradox of weiquan movements in urban China: Social inequality
and individual negotiation in land development. In F. Miraftab, K. Salo, & D.
Wilson (Eds.), Cities and Inequalities in a Transnational World. London: Routledge.
Smith, N. (1984). Uneven development. Hoboken, NJ: Wiley-Blackwell.
Smith, N. (1992). Contours of a spatialized politics: Homeless vehicles and the
production of geographical scale. Social Text, 33, 54–81.
Smoke, P. (2003). Decentralisation in Africa: Goals, dimensions, myths, and challenges.
Public Administration and Development, 23(1), 7–16. doi:10.1002/pad.255
Smoke, P., & Lewis, B. D. (1996). Fiscal decentralization in Indonesia: A new approach
to an old idea. World Development, 24(8), 1281–1299. doi:10.1016/0305-
750X(96)00042-3
Stern, R. E. (2014). The political logic of China’s new environmental courts. The China
Journal, (72). 53-74.
Stern, R. E., & O’Brien, K. J. (2011). Politics at the boundary: Mixed signals and the
Chinese state. Modern China. doi:10.1177/0097700411421463
Stiglitz, J. (1987). Principal and agent. In J. Eatwell, M. Milgate, & P. Newman (Eds.),
The New Palgrave. Vol. 3 (pp. 966–72). London: Macmillan Press.
Swyngedouw. (1997). Neither global nor local: “Glocalization” and the politics of scale.
In K. Cox (Ed.), Spaces of globalization: Reasserting the power of the local. New
York: The Guilford Press.
Swyngedouw, E. (2004). Globalisation or “glocalisation”? Networks, territories, and
rescaling. Cambridge Review of International Affairs, 17(1), 25–48.
doi:10.1080/0955757042000203632
Tao, R., & Wang, H. (2010). Zhong Guo Shang Wei Wan Cheng Zhi Zhuan Xing Zhong
De Tu Di Zhi Du Gai Ge [China’s uncompleted, transitioning reform of the land
system: Challenges ahead]. International Economy Reviews, (2), 93–123. Retrieved
from http://www.cqvip.com/QK/90440X/201002/33278258.html
Tan, R., & Zhou, T. (2015). Decentralization in a centralized system: Project-based
governance for land-related public goods provision in China. Land Use Policy, 47,
262–272. doi:10.1016/j.landusepol.2015.04.025
Taylor, P. (1981). Geographical scales within the world-economy approach. Review
(Fernand Braudel Center), 5(1), 3–11. Retrieved from
http://www.jstor.org/stable/40240893
Tendler, J. (1998). Good government in the tropics. Baltimore, MD: Johns Hopkins
University Press.
The Summary of the Conference of Coastal Cities [Yanhai Bu Fen Chengshi Zuo Tan
Hui ]. (1984).
Thießen, U. (2000). Fiscal federalism in Western European and selected other countries:
Centralization or decentralization? What is better for economic growth? Discussion
Papers of DIW Berlin, 224.
Thornton, J. (2007). Fiscal decentralization and economic growth reconsidered. Journal
of Urban Economics, 61(1), 64–70. doi:10.1016/j.jue.2006.06.001

220
Tian, J. (2010). Gui Hua Zhi Biao De She Ji Yu Ce Suan [Designing and Calculating
Planning Targets]. In W. Yang (Ed.), The Theory and Practice of Development
Planning (pp. 145–61). Beijing: Tsinghua University.
Tianjin Municipal Archives. (2008a). Tianjin Binhai Xin Qu Jing Ji Fa Zhan Shi Lu Di Yi
Juan [Tianjin Binhai New Area Economic Development Volume 1]. Tianjin.
Tianjin Municipal Archives. (2008b). Tianjin Binhai Xin Qu Jing Ji Fa Zhan Shi Lu Di
Er Juan [Tianjin Binhai New Area Economic Development Volume 2]. Tianjin.
Tianjin Municipal Archives. (2008c). Tianjin Binhai Xin Qu Jing Ji Fa Zhan Shi Lu Di
San Juan [Tianjin Binhai New Area Economic Development Volume 3]. Tianjin.
Tianjin Shi Shi Zhang: Jin Rong Gai Ge Chuang Xin Yao You Geng Da Zuo Wei [The
mayor of Tianjin on financial reform and innovation]. (2012, September 5).
Financial News. Retrieved from
http://finance.sina.com.cn/money/bank/bank_hydt/20120905/071113048568.shtml
Tiebout, C. M. (1956). A pure theory of local expenditures. Journal of Political Economy,
64(5), 416–424. doi:10.1086/257839
Treisman, D. (2007). The architecture of government: Rethinking political
decentralization. Cambridge, UK: Cambridge University Press.
Véron, R., Williams, G., Corbridge, S., & Srivastava, M. (2006). Decentralized
corruption or corrupt decentralization? Community monitoring of poverty-
alleviation schemes in Eastern India. World Development, 34(11), 1922–1941.
doi:10.1016/j.worlddev.2005.11.024
Wade, R. (1990). Governing the market: Economic theory and the role of government in
East Asian industrialization. Princeton, NJ: Princeton University Press.
Wade, R. (2005). Bringing the state back in: Lessons from East Asia’s development
experience. Internationale Politik Und Gesellschaft, 98–115.
Wade, R. (2009). Rethinking industrial policy for low-income countries. African
Development Review, (2007), 352–367. Retrieved from
http://onlinelibrary.wiley.com/doi/10.1111/j.1467-8268.2009.00213.x/full
Wang, D. (2009). Several things during my time at the development zone. In Guangzhou
Luogang Political Consultative Conference (Ed.), The Memories of the Pioneers II.
Guangzhou: Guangzhou Press.
Warner, M. (2003). Competition, cooperation, and local governance. In D. Brown & L.
Swanson (Eds.), Challenges for Rural America in the Twenty First Century (pp.
252–262). University Park, PA: Penn State University Press.
Wasserman, S., & Faust, K. (1994). Social network analysis: Methods and applications.
New York: Cambridge University Press.
Weber, M. (1946). From Max Weber: Essays in sociology. London: Taylor & Francis.
Weingast, B. R. (1995). The economic role of political institutions: Market-preserving
federalism and economic development. Journal of Law, Economics, and
Organization, 11(1), 1–31.
Weingast, B. R. (2014). Second-generation fiscal federalism: Political aspects of
decentralization and economic development. World Development, 53, 14–25.
doi:10.1016/j.worlddev.2013.01.003
Wong, C., & Bhattasali, D. (2003). China: National development and sub-national
finance. Report No. 22951–CHA. New York: The World Bank.
Wu, J. (2009). The rise of Tianjin (Tianjin Jue Qi). Tianjin: Tianjin People’s Publisher.

221
Wu, Z. (2004, April 12). Quan Guo Zheng Xie Ka Cha Tuan Lai Jin Kao Cha [CPPCC
visited Tianjin]. Tianjin Daily. Tianjin. Retrieved from http://tj.focus.cn/news/1970-
01-01/62268.html
Xie, D., Zou, H., & Davoodi, H. (1999). Fiscal decentralization and economic growth in
the United States. Journal of Urban Economics, 45(2), 228–239.
doi:10.1006/juec.1998.2095
Xing, B. (2013, July 4). Yanjian Di Shang De Man Ha Dun Meng: Tianjin Binhai Xinqu
Ni Jian Zhong Xin Shang Wu Qu [The dream of Manhattan on the saline-alkali soil].
21st Century Economic Report. Retrieved from
http://house.qq.com/a/20130704/003220.htm
Xinhua Net. (n.d.). Development zone rectification. Retrieved from
http://news.xinhuanet.com/fortune/2004-06/27/content_1549453.htm
Xinhua Net. (2005, August 12). TEDA Jiang Chi Gu 50% Yi Shang Bohai Yinhang Yi
Gu Du Da? [Will TEDA Holdings hold more than 50% of Bohai Bank?]. Retrieved
from http://news.xinhuanet.com/newmedia/2005-08/12/content_3344255_2.htm
Xinhua Net. (2006, February 28). A National Political Consultative Conference Report
that Propels Binhai’s Construction. (2006). Retrieved January 4, 2014, from
http://www.gov.cn/jrzg/2006-02/28/content_213701.htm
Yang, D. (2005). Remaking the Chinese leviathan: market transition and the politics of
governance in China. Stanford, CA: Stanford University Press.
Yang, D. L. (1997). Beyond Beijing: Liberalization and the regions in China. London:
Routledge.
Yang, D. Y. R., & Wang, H.-K. (2008). Dilemmas of local governance under the
development zone fever in China: A case study of the Suzhou region. Urban Studies,
45(5-6), 1037–1054. doi:10.1177/0042098008089852
Yang, W. (n.d.). Fa Zhan Gui Hua De Li Lun He Shi Jian [The theory and practice of
development planning]. Beijing: Qinghua daxue chubanshe.
Ye Disheng: the witness of the big change of Tianjin Binhai New Area [Ye Di Sheng:
Tianjin Binhai Xinqu Ju Bian de Jian Zheng Ren ]. (2008, July 9). Tianjin Night
News Paper. Tianjin. Retrieved from
http://news.nankai.edu.cn/nkrw/system/2008/07/09/000017195.shtml
Yiftachel, O. (2006). Essay: Re-engaging planning theory? Towards “south-eastern”
perspectives. Planning Theory, 5, 211–222. doi:10.1177/1473095206068627
Yilmaz, S. (1999). The impact of fiscal decentralization on macroeconomic performance.
Proceedings. Annual Conference on Taxation and Minutes of the Annual Meeting of
the National Tax Association, 92, 251–260.
Yusuf, S. (2001). The East Asian miracle at the millennium. In J. E. Stiglitz & S. Yusuf
(Eds.), Rethinking the East Asian miracle. New York: World Bank and Oxford
University.
Zeng, D. Z. (2010). Building Engines for Growth and Competitiveness in China:
Experience with Special Economic Zones and Industrial Clusters. Regional Studies.
World Bank.
Zhang, B., & Shen, X. (2011). Guo Qi Chang Qing Zhi Lu—Taida Kong Gu Ke Che Xu
Fa ZHan Zhan Lue Yan Jiu [A Study on the sustainable development strategy of
TEDA Holdings]. Beijing: Tsinghua University.

222
Zhang, T. (2002). Challenges facing Chinese planners in rransitional China. Journal of
Planning Education and Research, 22, 64–76. doi:10.1177/0739456X0202200106
Zhang, T., & Zou, H. (1998). Fiscal decentralization, public spending, and economic
growth in China. Journal of Public Economics, 67(2), 221–240. doi:10.1016/S0047-
2727(97)00057-1
Zhang, X. (2006). Fiscal decentralization and political centralization in China:
Implications for growth and inequality. Journal of Comparative Economics, 34(4),
713–726. doi:10.1016/j.jce.2006.08.006
Zheng, H., Wang, X., & Cao, S. (2014). The land finance model jeopardizes China’s
sustainable development. Habitat International, 44, 130–136.
doi:10.1016/j.habitatint.2014.05.008
The Notification of the Coastal Cities’ Conference by CPC and State Council [Zhong
Gong Zhong Yang Guo Wu Yuan Guan Yu Pi Zhuan Yanhai Bu Fen Cheng Shi Zuo
Tan Hui Ji Yao de Tong Zhi ]. (1984).
Zhou, X. (2009). The institutional logic of collusion among local governments in China.
Modern China, 36(1), 47–78. doi:10.1177/0097700409347970
Ziblatt, D. (2004). Rethinking the origins of federalism: Puzzle, theory, and evidence
from nineteenth-century Europe. World Politics, 57(October), 70–98.