2016 global innovation 1000 - strategy& · strategy& | pwc for the 12th year, strategy&...
TRANSCRIPT

Software-as-a-Catalyst
2016 Global Innovation 1000
October 2016

Strategy& | PwC
Introduction
R&D shifts
Innovation 1000 update
1

Strategy& | PwC
For the 12th year, Strategy& studied innovation trends and spending at the world’s 1,000 largest publicly listed corporate R&D spenders
2009:Profits down, spending steady
2005: Money isn't everything
2006: Smart spenders
2007: The customer connection
2008: Beyond borders
2010: How top innovators keep winning
2011:Why culture is key
2012:Making ideas work
2013:Navigating the digital future
2014:Proven paths to innovation success
2015:Innovation’s new world order
2016:Software-as-a-catalyst
2

Strategy& | PwC
The study has become a recognized contributor in better understanding what drives success in R&D and innovation• The Global Innovation 1000 study has
received significant media and academic attention:– Called “the most comprehensive assessment
of the relationship between R&D investment and corporate performance” by the The Economist in 2009
– Given “2006 Special Achievement Award for Advancing Innovation” by Innovate Forum
– Awarded Best of Visions award from PDMA in 2009
– In 2011 and 2014, awarded Silver and Gold, respectively, for original research by the American Society of Business Press Editors (“the Azbee”)
– Cited in more than 180 publications in 27 countries
Global Innovation 1000:Selected press coverage
3

Strategy& | PwC
Introduction
R&D shifts
Innovation 1000 update
4

Strategy& | PwC
Executive Summary
• Companies are shifting their R&D resources away from physical products to software and services and this is paying off financially.– The average allocation of R&D spending for software and services increased from 54% to 59%
between 2010 - 2015 and is expected to grow to 63% by 2020.– The average allocation of R&D spending of product-based offerings fell to 41%(from 46% in 2010),
and is expected to fall to 37% by 2020 (decrease of 19% this decade).
• As R&D shifts to software and services, talent shifts as well. By 2020, the number of companies reporting electrical engineers as their top employed engineering specialty will fall by 35% and the proportion of companies who expect that data engineers will represent their largest group of employed engineers will double from 8% to 16%.
• Regionally, companies in North America are making the strongest shift to software offerings—from 15% of total R&D spending in 2010 to 24% in 2020.
• In 2016 total R&D spending by the Global Innovation 1000 increased 0.04% to $679.8 B, essentially unchanged from the previous year, as a result of fluctuations in foreign currencies.
• R&D intensity spiked to its all-time high of 4.2%, last seen in 2005, as revenue within most industries decreased - especially Chemicals & Energy.
• Apple maintains it’s #1 position over Alphabet (Google) on the 10 Most Innovative Companies list, 3M jumped to #3, and Facebook rejoined the list for the first time since 2013.
5

Strategy& | PwC
In 2010, half of all companies reported allocating 50% or more of their R&D spending to product-based offeringsAllocation of R&D spending to product-based offerings
42%32%
58%68%
50%
50%
20202010 2015
Source: 2016 Global Innovation 1000 studyQ13) Please estimate your company’s allocation of R&D investment across these three offerings. N = 466.
50–100%0–40% of total R&D allocation
6

Strategy& | PwC
However, by 2020, companies will have shifted the majority of their R&D from product offerings to software and services
Total R&D spending by type of offeringUS$ Billions
2010 2015 2020
40%
35%
30%
25%
20%
0%
50%
45%
24%
41%
38%
17%
39%
37%
-19%
43%
37%
46%
21%
Product-based offeringsService offeringsSoftware offerings
Source: 2016 Global Innovation 1000 studyQ13) Please estimate your company’s allocation of R&D investment across these three offerings. N = 466.
$86
$188
$232
$142
$257
$280
+21%
+36%
+65%
Software offeringsService offeringsProduct-based offerings
20152010
Average allocation of R&D spending to types of offerings
7

Strategy& | PwC
The top reason companies are shifting R&D budgets toward software and services is the “need to stay competitive”Top 5 drivers of change in R&D allocation
34%
41%
48%
54%57%
Wish to keep up with customer expectations
Need to stay competitive
Need to increase revenue
generation/growth
Need for higher margins
Desire to access untapped markets
Source: 2016 Global Innovation 1000 studyQ14) What is driving this change in the mix of your company’s R&D investment portfolio? (Please choose up to five reasons).N = 466.
8

Strategy& | PwC
Companies that reported faster revenue growth than their competitors allocated more R&D investment to software Average allocation of R&D spending to software offerings
2010 2015 2020
26%
24%
22%
20%
18%
16%
0%
25%
26%
24%
21%
23%
21%
18%18%
17%
15%
Faster revenue growth relativeto key competitors
Same revenue growthSlower revenue growth
Source: 2016 Global Innovation 1000 studyQ11) How do you believe your company is performing in revenue growth relative to its key competitors?Q13) Please estimate your company’s allocation of R&D investment across these three offerings.N = 466.
9

Strategy& | PwC
To support the shift in R&D spend, companies are significantly altering their engineering talent mixReported change in largest engineer employee group *
20%
15%
10%
29%
8%
15%15%
10%
30%
10%13%12%
9%
31%
16%
Data engineers Systems engineersSoftware engineers
+10%
Mechanical engineers Electrical engineers
+92% -16%
-11%
-35%
2015 20202010: Percentage of companies where X engineers is the largest employee group
Source: 2016 Global Innovation 1000 study*Industrial Engineers/Human Factors and Chemical Engineers/Bioengineers are not shown.Q18) Which innovations below, if any, has your company applied to complement its business model(s)? (Please choose up to two options). Q19) Please choose the top four types of engineers employed by your company during each of the time periods: (Rank from 1 to 4, where 1=largest number of engineers employed).N = 466.
From 2010 to 2020, among companies that employ electrical engineers, the number of companies reporting that electrical engineers are the largest engineering group will fall by 35%.
10
Strategy& | PwC
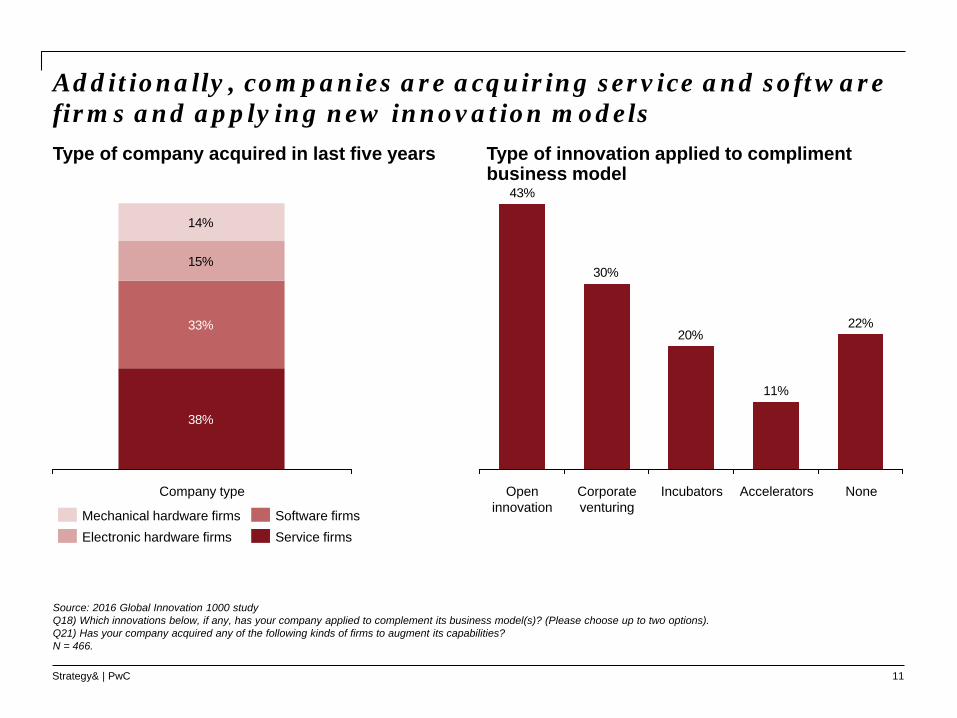
Additionally, companies are acquiring service and software firms and applying new innovation modelsType of company acquired in last five years Type of innovation applied to compliment
business model
Source: 2016 Global Innovation 1000 studyQ18) Which innovations below, if any, has your company applied to complement its business model(s)? (Please choose up to two options). Q21) Has your company acquired any of the following kinds of firms to augment its capabilities? N = 466.
38%
33%
15%
14%
Company type
Mechanical hardware firmsService firmsSoftware firms
Electronic hardware firms
22%
11%
20%
43%
30%
Corporate venturing
Open innovation
NoneIncubators Accelerators
11

Strategy& | PwC
40% of companies cited “customer insight” as the top challenge for developing new services compared to just 28% for software
Top 5 challenges companies experienced pursing service and software offeringsService offerings Software offerings
32%33%
38%39%40%
New capabilities
being required of staff (e.g.,
sales, engineers)
Change in culture from
product-focused to customer
satisfaction-focused
Project management
Cost controlCustomer insight
26%28%
30%30%33%
Project management
New capabilities
being required of staff (e.g.,
sales, engineers)
Cost control Managing the change in
culture from product-
focused to service-
/software-focused
Customer insight
Source: 2016 Global Innovation 1000 studyQ15) What are the biggest challenges your company has experienced while pursuing its service and software offerings? (Please choose up to five reasons for each offering).N = 466.
12

Strategy& | PwC
We’ve identified three distinct innovation strategies that cut across all industries
25%
Need Seeker• Consistently strive to be 1st
movers
• Proactively engage customers to determine needs and shape new innovations
• Identify unarticulated needs
• Determine new innovations market back
Market Reader• Adopt a 2nd mover strategy
• Focus on driving value through incremental change
• Innovations determined market back
• Equally concerned with competitors actions
Technology Driver• Drive innovation via
technological achievement for both incremental and breakthrough efforts
• Least proactive of 3 in directly engaging customers
• Highest Beta strategy
40% 35%
Company Examples• Apple Inc.
Company Examples• Samsung Electronics Co Ltd
Company Examples• Alphabet Inc.
Source: 2016 Global Innovation 1000 study
13

Strategy& | PwC
By 2020, Need Seekers will be allocating nearly a third of their total R&D budget to software offering Average allocation of R&D spending to software offerings
2010 2015 2020
22%
24%
26%
28%
30%
0%14%
16%
18%
20%
25%
21%
23%
29%
21%
18%
20%
19%
14%
50%
Market Readers Tech Drivers Need Seekers
Source: 2016 Global Innovation 1000 studyQ11) How do you believe your company is performing in revenue growth relative to its key competitors?Q13) Please estimate your company’s allocation of R&D investment across these three offerings.N = 466.
14

Strategy& | PwC
Introduction
R&D shifts
Innovation 1000 update
15

Strategy& | PwC
In 2016, R&D spending of the top 1000 companies was flat as a result of currency fluctuations – strong US$Global Innovation 1000 R&D spending2005–2016, US$ Billions
Source: 2016 Global Innovation 1000 study
$680$680$647$638$614
$560$508
$538$501
$447$409$400
2010
10.3%
3.8%
-5.6%9.7%
201420132012
+70%
11-year CAGR = 4.94%
2015 2016
5.1%0.04%
1.4%
2.2% 9.3%
7.3%12.2%
200920082007 20112005 2006
16

Strategy& | PwC
Total revenue for the Innovation 1000 fell by 11.8%
Global Innovation 1000 revenue2005–2016, US$ Trillions
Source: 2016 Global Innovation 1000 study
$16
$18$18$18$18
$16
$13$15
$13$12
$11$9
1.3%
11.7%
12.0%
2008
13.1%
16.7%
20072006 2010
12.3%
2011
+70%
-11.8%
2009
11-year CAGR = 4.93%
-10.4%
20132012 2015 2016
-1.0%
2005
3.7%
2014
11.5%
17

Strategy& | PwC
Primarily due to a 31% decline in revenue in the Chemicals &Energy industryRevenue by industry2005–2016, US$ Trillions
Source: 2016 Global Innovation 1000 study
2005 2006 2007 2008 2009 2010 2011 2012 2013 2014 2015 2016
$5.0
$0.5
$0.0
$3.0
$1.0
$3.5
$2.5
$2.0
$1.5
$4.5
$4.0 3.8
2.9
4.6
-31%
3.1
4.0
4.7
0.5
ConsumerTelecom
Chemicals and Energy
Aerospace and Defense
1.8
0.6
2.6
3.02.8
1.2
2.42.7
4.54.5
Healthcare
0.7
Computing and ElectronicsAuto
1.3
Industrials
OtherSoftware and Internet
3.3
18

Strategy& | PwC
Resulting in a spike in R&D intensity back to its all-time high of 4.2%, last seen in 2005Global Innovation 1000 R&D intensity2005–2016
Source: 2016 Global Innovation 1000 study
4.2%
3.7%3.5%3.6%3.5%3.6%
3.8%3.6%
3.8%3.8%3.9%
4.2%
-4.5%
2007
5.3%
20062005
-5.5%13.4%
2008
-0.8%-2.0%
2010
6.1%
2011
-2.2%
2012
2.5%
2013 2014 2015
-8.5%
11-year CAGR = 0.01%
2016
-2.0%
0%
2009
19

Strategy& | PwC
Only three out of nine industries increased R&D spending
Change in R&D spending by industry2015–2016
Source: 2016 Global Innovation 1000 study
-12.2%-11.5%
-4.0%-3.3%-2.8%-2.0%-1.8%
0.7%
3.6%
15.4%
-15%
-10%
-5%
0%
5%
10%
15%
20%
Software and Internet
Healthcare Consumer Computing and
Electronics
Other Industrials Aerospace and Defense
Auto Chemicals and
Energy
Telecom
20

Strategy& | PwC
By 2018, Software & Internet and Healthcare will be the first and third largest industries by R&D spendR&D spending by Top 5 industries2005–2018, US$ Billions
Source: 2016 Global Innovation 1000 study
$140
$120
$20
$180
$0
$40
$60
$80
$160
$100
41
22
87
116
7075
157
106
105
161
2016
165
60
129159
88
73
150163
137
105
2015
75
145
76
109
2014
166
69
2017 (est.)
105
78
2018 (est.)
171
66
51
105
2013
33
168
103
51
138
2012
64
43
129
168
99
2011
56
36
124
154
87
2010
87
121
68
43
2005 2006
22
114
137
71
2009
52
32
120
150
89
2008
46
29
110
142
86
2007
44
26
98
127
74
Computing and Electronics IndustrialsSoftware and InternetHealthcareAuto
S&I
Healthcare
21

Strategy& | PwC
Computing & Electronics, Healthcare, and Auto are the three largest industries representing about 62% of total R&D spend
2016 R&D spending by industryTotal = $680 Billion
Source: 2016 Global Innovation 1000 study
Computing and Electronics
24.0%
Healthcare22.1%
Auto
15.4%
Software and Internet12.9%
Industrials10.8%
Chemicals and Energy5.5%
Telecom
1.6%Aerospace and Defense
Consumer1.5%
Other
3.2%3.0%
22

Strategy& | PwC
R&D spending declined in Europe and Japan, but increased in North America and China R&D spending by region2005–2016, US$ Billions
Source: 2016 Global Innovation 1000 study
2005 2006 2007 2008 2009 2010 2011 2012 2013 2014 2015 2016
$300
$0
$250
$50
$200
$150
$100
-3%
+19%
-8%
-9%
+8%
Rest of World
North America
Japan
Europe
China
53
297
101
182
47
54
275
109
201
39
23

Strategy& | PwC
For the first time in the study’s history, N. America increased the number of companies in the top 1,000 – Up 9.5% y-o-yNumber of companies in the top 1,000 by region2005–2016
Source: 2016 Global Innovation 1000 study
130123
223244
165181
381
348
101104
0
50
100
150
200
250
300
350
400
450
500
2005 2006 2007 2008 2009 2010 2011 2012 2013 2014 2015 2016
+6%
-9%
-9%
9.5%
Rest of World
North America
Japan
Europe
China-3%
372 of the 381 companies in North America are based in the U.S.
24

Strategy& | PwC
US growth is driven by its large presence in high-growth R&D industries of Software & Internet and Healthcare
Source: 2016 Global Innovation 1000 study
Number of companies in top 5 industries by region 2016
26%
19%22%
20%
43%
13%
56%
24%
62%
12%
18%
10%
26%
29%
19%
19%
1756%
IndustrialsAuto
93
22%
20%
30%
North America
Europe
Japan
China
Rest of World
Computing and Electronics
228
43%
13%
15%
11%
18%
Healthcare
164
56%
24%
10%
2%7%
Software and Internet
103
62%
12%
2%
18%
6%
25

Strategy& | PwC
Bristol-Myers Squibb and Oracle joined the top 20 largest R&D spenders and Apple moved up to 11th
Source: 2016 Global Innovation 1000 study
Top 20 R&D SpendersRank 2016
Rank 2015
Change Company Geography Industry R&D spending (US$ Billions)
Revenue (US$ Billions)
R&D intensity
1 1 NA Volkswagen AG Europe Auto 13.2 236.9 5.6%2 2 NA Samsung Electronics Co Ltd South Korea Computing and Electronics 12.7 177.5 7.2%3 7 +4 Amazon.com Inc North America Software and Internet 12.5 107.0 11.7%4 6 +2 Alphabet Inc North America Software and Internet 12.3 75.0 16.4%5 3 -2 Intel Corp North America Computing and Electronics 12.1 55.4 21.9%6 4 -2 Microsoft Corp North America Software and Internet 12.0 93.6 12.9%7 5 -2 Roche Holding AG Europe Healthcare 10.0 50.1 19.9%8 9 +1 Novartis AG Europe Healthcare 9.5 49.4 19.2%9 10 +1 Johnson & Johnson North America Healthcare 9.0 70.1 12.9%10 8 -2 Toyota Motor Corp Japan Auto 8.8 236.8 3.7%11 18 +7 Apple Inc North America Computing and Electronics 8.1 233.7 3.5%12 11 -1 Pfizer Inc North America Healthcare 7.7 48.9 15.7%13 13 NA General Motors Co North America Auto 7.5 152.4 4.9%14 14 NA Merck & Co Inc North America Healthcare 6.7 39.5 17.0%15 15 NA Ford Motor Co North America Auto 6.7 149.6 4.5%16 12 -4 Daimler AG Europe Auto 6.6 166.0 4.0%17 17 NA Cisco Systems Inc North America Computing and Electronics 6.2 49.2 12.6%18 20 2 AstraZeneca PLC Europe Healthcare 6.0 24.7 24.3%19 32 +13 Bristol-Myers Squibb Co North America Healthcare 5.9 16.6 35.7%20 22 +2 Oracle Corp North America Software and Internet 5.8 37.0 15.6%Total 179.4 2069.0 8.7%
NEW
NEW
26

Strategy& | PwC
However, higher R&D spend doesn’t ensure performance
Source: Strategy& Global Innovation 1000 study
The performance disconnectExample analysis showing relation between R&D & financial performance
y = 0,032x + 1,2914R² = 0,0114
-5
0
5
0 1 2 3 4 5 6 7
Inde
xed
sale
s gr
owth
Indexed R&D-to-sales ratio
~10,000 analyses found NOstatistical relationship
between R&D spend and• Sales growth• Gross profit growth• Operating profit growth• Operating Margin• Net profit growth• Net Margin• Market cap growth• Total shareholder return
27

Strategy& | PwC
Apple and Alphabet (Google) continue to lead the most innovative list, while Facebook rejoined and 3M returned to third
Source: 2016 Global Innovation 1000 study. The 10 Most Innovative Companies are named by respondents to the 2016 survey of global innovation experts.*In 2015, Google announced a corporate restructuring forming an umbrella company called Alphabet.
10 Most Innovative Companies
Rank 2010 2011 2012 2013 2014 2015 2016
1 Apple Apple Apple Apple Apple Apple Apple
2 Google Google Google Google Google Google Alphabet*
3 3M 3M 3M Samsung Amazon Tesla 3M
4 General Electric
General Electric Samsung Amazon Samsung Samsung Tesla
5 Toyota Microsoft General Electric 3M Tesla Amazon Amazon
6 Microsoft IBM Microsoft General Electric 3M 3M Samsung
7 Procter & Gamble Samsung Toyota Microsoft General
ElectricGeneral Electric Facebook
8 IBM Procter & Gamble
Procter & Gamble IBM Microsoft Microsoft Microsoft
9 Samsung Toyota IBM Tesla IBM IBM General Electric
10 Intel Facebook Amazon Facebook Procter & Gamble Toyota IBM
28

Strategy& | PwC
For seven straight years, the 10 Most Innovative Companies have outperformed the Top 10 R&D Spenders
Source: 2016 Global Innovation 1000 study. The 10 Most Innovative Companies are named by respondents to the 2016 survey of global innovation experts.*Facebook did not have Market Cap data spanning back 5 years.
10 Most Innovative Companies* vs. Top 10 R&D Spenders
65%69%
50% 49%
40%40%
Market cap growth
(5-yr. CAGR)
Revenue growth
(5-yr. CAGR)
100%
EBITDA as a % of revenue (5-yr. Avg.)
0%
50%
10 Most Innovative CompaniesTop 10 R&D Spenders
Highest possible
score:
Lowest possible
score:
Normalized performance of industry peers:
Rank 10 Most Innovative Companies
2016 R&D spend
(US$ Bn)
R&D intensity
Top 10 R&D Spenders
2016 R&D
spend (US$ Bn)
R&D intensity
1 Apple Inc 8.1 3.5% Volkswagen AG
13.2 5.6%
2 Alphabet Inc 12.3 16.4% Samsung Electronics
Co Ltd
12.7 7.2%
3 3M Co 1.8 5.8% Amazon.com Inc
12.5 11.7%
4 Tesla Motors Inc
0.7 17.7% Alphabet Inc 12.3 16.4%
5 Amazon.com Inc
12.5 11.7% Intel Corp 12.1 21.9%
6 Samsung Electronics
Co Ltd
12.7 7.2% Microsoft Corp
12.0 12.9%
7 Facebook Inc 4.8 26.9% Roche Holding AG
10.0 19.9%
8 Microsoft Corp
12.0 12.9% Novartis AG 9.5 19.2%
9 General Electric Co
4.2 3.7% Johnson & Johnson
9.0 12.9%
10 International Business Machines
Corp
5.2 6,4% Toyota Motor Corp
8.8 3.7%
29

Strategy& | PwC
For the complete study and moreinformation on the annual
Strategy& Global Innovation 1000 study
Please visit:http://www.strategyand.pwc.com/innovation1000
For media or other inquiries, please contact: Kiran Chauhan+1 416 890 8695
30

© 2016 PwC. All rights reserved.
PwC refers to the PwC network and/or one or more of its member firms, each of which is a separate legal entity. Please see www.pwc.com/structure for further details.
This content is general information purposes only, and should not be used as a substitute for consultation with professional advisors