2018 · kleine berlin-statistik ˜˚˛˝ introduction the »kleine berlin-statistik 2018« gives an...
TRANSCRIPT
statistics Berlin Brandenburg
kleine berlin-statistik
English edition
Editor: Amt für Statistik Berlin-Brandenburg
2018

Photo
© Pete / Fotolia
Explanation of symbols
– no figures… data will be available later• numerical value unknown or not to be disclosedx cell blocked for logical reasons( ) limited informational value because numerical value is of limited statistical reliability / no data because the numerical value is not sufficiently reliable
Information management
Amt für Statistik Berlin-BrandenburgSteinstraße 104-10614480 PotsdamTelephone: +49 331 8173-1777Telefax: +49 30 9028-4091 E-Mail: [email protected]
www.statistik-berlin-brandenburg.de
Imprint
Published in December 2018 Design and LayoutAmt für Statistik Berlin-BrandenburgPrinted by : Tastomat Druck GmbH
© Amt für Statistik Berlin-BrandenburgPotsdam, 2018Reproduction and distribution, also of parts, are permitted provided that the source is mentioned.
Abbreviation of units
bn billionEUR euroha hectarehrs hourskm kilometrekm² square kilometrel litrem² square metrem³ cubic metreMJ mega joulemm millimetremn milliont ton

kleine berlin-statistik 2018
16 Employment and compensation of employees, Labour Market | 32
17 Industry | 34
18 Construction, Housing | 36
19 Retail Trade, Hotel and Restaurant Industry, Tourism | 37
20 Foreign Trade | 40
21 Consumer Prices | 41
22 Construction Prices | 42
23 Judicature | 43
24 Earnings | 44
25 Public Finances | 46
26 Elections | 48
27 The Boroughs of Berlin 2017 | 56
28 Berlin 1871 to 2017 | 58
29 The Region Berlin/Brandenburg 2017 | 60
1 City Area | 5
2 Population | 6
3 Livelihood | 12
4 Households and Families | 14
5 Education | 16
6 Agriculture | 19
7 Public health system | 20
8 Public social benefits | 22
9 Facilities for child care, youth welfar | 23
10 Care | 25
11 Climate | 26
12 Environment | 27
13 Transport | 28
14 Business notification, Insolvencies | 30
15 National Accounts | 31

02
12
05
03
01 1110
04
06 0809
Potsdam Potsdam-Mittelmark
Teltow-FlämingDahme-Spreewald
Barnim
Oberhavel
Havelland
Märkisch-Oderland
Oder-Spree
07
Boroughs
01 Mitte02 Friedrichshain-Kreuzberg03 Pankow04 Charlottenburg-Wilmersdorf05 Spandau06 Steglitz-Zehlendorf07 Tempelhof-Schöneberg08 Neukölln09 Treptow-Köpenick10 Marzahn-Hellersdorf11 Lichtenberg12 Reinickendorf
4 |
kleine berlin-statistik 2018 Introduction
The »kleine berlin-statistik 2018« gives an initial overview of the data provided by official statistics. A similar brochure is avail-able for the federal state of Brandenburg (»kleine brandenburg-statistik 2018«). Both booklets are also published in Ger-man. Comparative figures for the federal states can be found in the common statistics por-tal of the statistical offices of the Federal Republic of Germany and the federal states www.statistikportal.de.
The »kleine berlin-statistik 2018« (statis-tics for the City of Berlin 2018, key facts and figures) offers information on the de-velopment of the German capital, based on the most important statistical results.
Key figures to demographic, economic, social, cultural and political structures of Berlin are shown in Chapter 1 to 26. The results are compared to previous years. The brochure also contains information on the city’s boroughs (Chapter 27), data on Berlin‘s development since 1871 (Chapter 28) and figures for the region of Berlin-Brandenburg (Chapter 29).

| 5
kleine berlin-statistik 2018 01 City Area
Geographical location Elevations m above sea levelCity centre - Berlin Town Hall - Müggelberge ....................................... 115
52° 31’ 12” north latitude Teufelsberg .......................................... 11513° 24’ 36” east longitude Ahrensfelder Berge .............................. 112
Schäferberg .......................................... 103Kienberg .............................................. 102Havelberg ............................................. 97Stolper Berge ....................................... 97Mülldeponie Wannsee .......................... 92
Bigger lakes hakm Großer Müggelsee ................................ 743.3
Length of border ........................ 234 Tegeler See ........................................... 384.3Langer See ........................................... 290.3
Largest expansion km Großer Wannsee ................................... 276.4east-west ..................................... 45 Seddinsee ............................................ 258.0north-south ................................. 38
Rivers (within Berlin) Length in kmha Spree .................................................... 45.1
City area (ha) .............................. 89,112 Havel .................................................... 27.1Panke ................................................... 17.6
Land use % Dahme ................................................. 16.4Settlement ................................... 55.3 Wuhle .................................................. 15.7Traffic area ................................... 15.2Agricultural .................................. 4.1 Canals (within Berlin)Forest ........................................... 17.7 Teltowkanal ......................................... 29.1Other vegetation .......................... 1.1 Landwehrkanal with Flutgraben .......... 11.8Waters .......................................... 6.6 Berlin-Spandauer Schifffahrtskanal
(Hohenzollernkanal) ............................ 7.9Neuköllner Schifffahrtskanal ................ 4.0
6 |
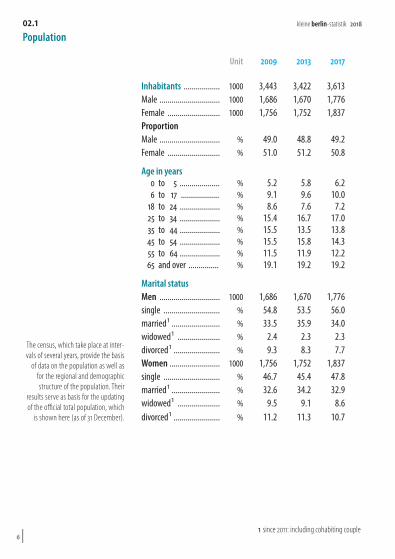
kleine berlin-statistik 201802.1 Population
The census, which take place at inter- vals of several years, provide the basis
of data on the population as well as for the regional and demographic structure of the population. Their
results serve as basis for the updating of the official total population, which
is shown here (as of 31 December).
Unit 2009 2013 2017
Inhabitants .................. 1000 3,443 3,422 3,613Male .............................. 1000 1,686 1,670 1,776Female .......................... 1000 1,756 1,752 1,837ProportionMale .............................. % 49.0 48.8 49.2Female .......................... % 51.0 51.2 50.8
Age in years0 to 5 .................... % 5.2 5.8 6.26 to 17 ................... % 9.1 9.6 10.0
18 to 24 .................... % 8.6 7.6 7.225 to 34 .................... % 15.4 16.7 17.035 to 44 .................... % 15.5 13.5 13.845 to 54 .................... % 15.5 15.8 14.355 to 64 .................... % 11.5 11.9 12.265 and over ............... % 19.1 19.2 19.2
Marital statusMen .............................. 1000 1,686 1,670 1,776single ............................ % 54.8 53.5 56.0married¹ ........................ % 33.5 35.9 34.0widowed¹ ..................... % 2.4 2.3 2.3divorced¹ ....................... % 9.3 8.3 7.7Women ......................... 1000 1,756 1,752 1,837single ............................ % 46.7 45.4 47.8married¹ ........................ % 32.6 34.2 32.9widowed¹ ..................... % 9.5 9.1 8.6divorced¹ ....................... % 11.2 11.3 10.7
1 since 2011: including cohabiting couple

35 30 25 20 15 10 5 0thousand
0
5
10
15
20
25
30
35
40
45
50
55
60
65
70
75
80
85
90
95
100
5 10 15 20 25 30 350thousand
5
10
15
20
25
30
35
40
45
50
55
60
65
70
75
80
85
90
95
100Age in yearsiiiiiii
0
Male Female
widowed1married1single
Surplus of womenSurplus of men
divorced1
Age pyramid on 31 December 2017 by age and marital status
| 7
kleine berlin-statistik 2018 02.2 Population

18 to 24
0 to 17
25 to 64
65 and over
Foreigners
01
0 to 9 %10 to 14 %15 to 19 %20 to 24 %
25 % and over
01 Mitte02 Friedrichshain-Kreuzberg03 Pankow04 Charlottenburg-Wilmersdorf05 Spandau06 Steglitz-Zehlendorf07 Tempelhof-Schöneberg08 Neukölln09 Treptow-Köpenick10 Marzahn-Hellersdorf11 Lichtenberg12 Reinickendorf
02
03
04
05
07
0608
09
10
11
12
Foreigners as of 31 December 2017
by age groups
8 |
kleine berlin-statistik 201802.3 Population
Foreigners are persons with exclusively foreign or unex-
plained nationality as well as stateless persons. The number
of foreigners is part of the official population update.
Unit 2009 2013 2017
Foreigners ............................ 1000 473 459 638Female .................................. % 48.3 49.7 48.2Male ...................................... % 51.7 50.3 51.8
Age in years0 to 17 ................... % 13.5 11.6 13.9
18 to 24 .................... % 10.5 11.0 11.525 to 64 .................... % 68.6 69.3 67.365 and over ............... % 7.3 8.0 7.3
20,00040,00060,00080,000100,000120,000140,000160,000180,000200,000220,000240,000260,000280,000
0
EuropeanUnion
otherEurope America Asia Africa
Australia/Oceania
statelessuncleared,
notspecified
Turky
including:
Poland
Italia
Bulgaria
United States Vietnam
Syria
including:
including:
including:
Romania
France Serbia
RussianFederation
| 9
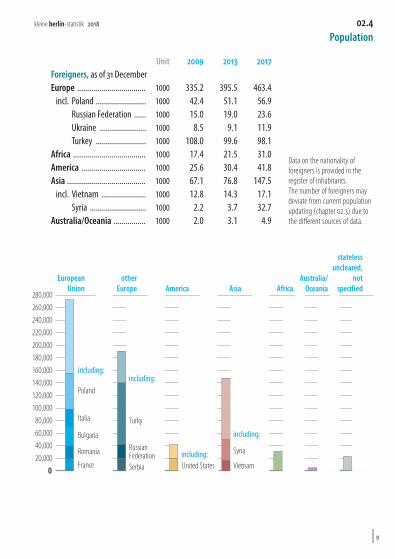
kleine berlin-statistik 2018 02.4 Population
Unit 2009 2013 2017
Data on the nationality of foreigners is provided in the register of inhabitants. The number of foreigners may deviate from current population updating (chapter 02.3) due to the different sources of data.
Foreigners, as of 31 DecemberEurope .................................. 1000 335.2 395.5 463.4
incl. Poland ......................... 1000 42.4 51.1 56.9Russian Federation ...... 1000 15.0 19.0 23.6Ukraine ....................... 1000 8.5 9.1 11.9Turkey ......................... 1000 108.0 99.6 98.1
Africa .................................... 1000 17.4 21.5 31.0America ................................ 1000 25.6 30.4 41.8Asia ....................................... 1000 67.1 76.8 147.5
incl. Vietnam ...................... 1000 12.8 14.3 17.1Syria ............................ 1000 2.2 3.7 32.7
Australia/Oceania ................ 1000 2.0 3.1 4.9
5,00010,00015,000
0
2009 2010 2011 2012 2013 2014 2015 2016 2017
5,00010,00015,00020,00025,00030,00035,00040,00045,000
0
◼ Marriages ◼ Divorces
◼ Live births ◼ Deaths
10 |
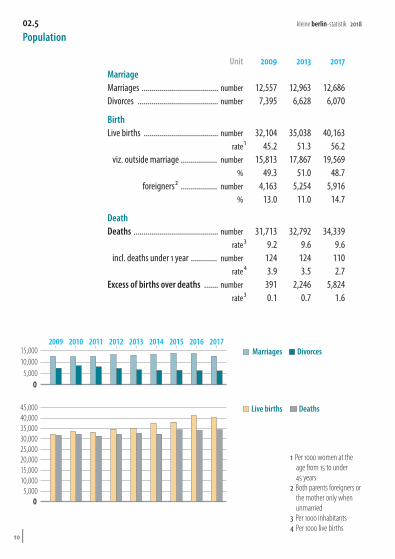
kleine berlin-statistik 201802.5 Population
Unit 2009 2013 2017MarriageMarriages ...................................... number 12,557 12,963 12,686Divorces ........................................ number 7,395 6,628 6,070
BirthLive births ..................................... number 32,104 35,038 40,163
rate¹ 45.2 51.3 56.2viz. outside marriage .................. number 15,813 17,867 19,569
% 49.3 51.0 48.7foreigners² .................. number 4,163 5,254 5,916
% 13.0 11.0 14.7
DeathDeaths .......................................... number 31,713 32,792 34,339
rate³ 9.2 9.6 9.6incl. deaths under 1 year ............. number 124 124 110
rate⁴ 3.9 3.5 2.7Excess of births over deaths ....... number 391 2,246 5,824
rate³ 0.1 0.7 1.6
1 Per 1000 women at the age from 15 to under 45 years
2 Both parents foreigners or the mother only when unmarried
3 Per 1000 inhabitants4 Per 1000 live births
-100,000
-80,000
-60,000
-40,000
-20,000
20,000
40,000
60,000
80,000
100,000
120,000
140,000
0
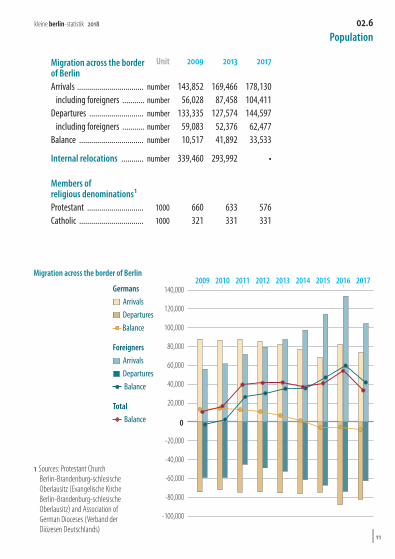
2009 2010 2011 2012 2013 2014 2015 2016 2017Migration across the border of Berlin
Germans◼ Arrivals◼ Departures
• Balance
Foreigners ◼ Arrivals◼ Departures
• Balance
Total
• Balance
| 11
kleine berlin-statistik 2018 02.6 Population
Migration across the border of Berlin
Unit 2009 2013 2017
Arrivals ................................. number 143,852 169,466 178,130including foreigners ........... number 56,028 87,458 104,411
Departures ........................... number 133,335 127,574 144,597including foreigners ........... number 59,083 52,376 62,477
Balance ................................ number 10,517 41,892 33,533
Internal relocations ........... number 339,460 293,992 •
Members of religious denominations ¹Protestant ............................ 1000 660 633 576Catholic ................................ 1000 321 331 331
1 Sources: Protestant Church Berlin-Brandenburg-schlesische Oberlausitz (Evangelische Kirche Berlin-Brandenburg-schlesische Oberlausitz) and Association of German Dioceses (Verband der Diözesen Deutschlands)
500
1,000
1,500
2,000
0
thousand 2009 2010 2011 2012 2013 2014 2015 2016 2017
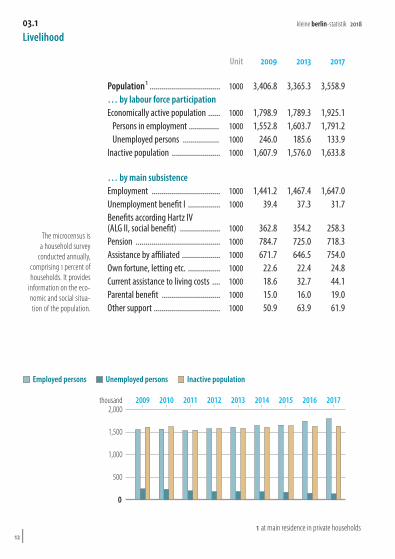
◼ Employed persons ◼ Unemployed persons ◼ Inactive population
12 |
kleine berlin-statistik 201803.1 Livelihood
The microcensus is a household survey
conducted annually, comprising 1 percent of households. It provides
information on the eco- nomic and social situa- tion of the population.
Unit 2009 2013 2017
Population ¹ ................................... 1000 3,406.8 3,365.3 3,558.9… by labour force participationEconomically active population ...... 1000 1,798.9 1,789.3 1,925.1
Persons in employment ............... 1000 1,552.8 1,603.7 1,791.2Unemployed persons .................. 1000 246.0 185.6 133.9
Inactive population ........................ 1000 1,607.9 1,576.0 1,633.8
… by main subsistenceEmployment .................................. 1000 1,441.2 1,467.4 1,647.0Unemployment benefit I ................ 1000 39.4 37.3 31.7Benefits according Hartz IV (ALG II, social benefit) .................... 1000 362.8 354.2 258.3Pension .......................................... 1000 784.7 725.0 718.3Assistance by affiliated ................... 1000 671.7 646.5 754.0Own fortune, letting etc. ................ 1000 22.6 22.4 24.8Current assistance to living costs .... 1000 18.6 32.7 44.1Parental benefit ............................. 1000 15.0 16.0 19.0Other support ................................. 1000 50.9 63.9 61.9
1 at main residence in private households
50 100 150 200 250 300 350 4000 thousand
under 300
300 to 499
500 to 699
700 to 899
900 to 1,099
1,100 to 1,299
1,300 to 1,499
1,500 to 1,999
2,000 to 2,599
2,600 and over
EUR ◼ 2009◼ 2013◼ 2017
| 13
kleine berlin-statistik 2018 03.2 Livelihood
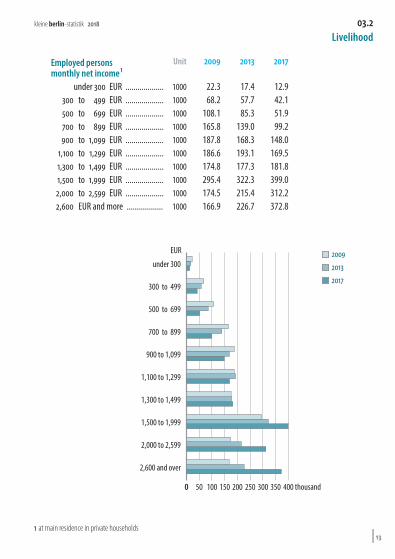
Employed persons monthly net income ¹
Unit 2009 2013 2017
under 300 EUR ................... 1000 22.3 17.4 12.9300 to 499 EUR ................... 1000 68.2 57.7 42.1500 to 699 EUR ................... 1000 108.1 85.3 51.9700 to 899 EUR ................... 1000 165.8 139.0 99.2900 to 1,099 EUR ................... 1000 187.8 168.3 148.0
1,100 to 1,299 EUR ................... 1000 186.6 193.1 169.51,300 to 1,499 EUR ................... 1000 174.8 177.3 181.81,500 to 1,999 EUR ................... 1000 295.4 322.3 399.02,000 to 2,599 EUR ................... 1000 174.5 215.4 312.22,600 EUR and more .................. 1000 166.9 226.7 372.8
1 at main residence in private households

14 |
kleine berlin-statistik 201804.1 Households and Families
Every community of persons living together and forming an economical unit as well as per-
sons who live alone and, never- theless, manage for themselves
are counted as a household (private household). A house-
hold may include relatives and persons who do not
belong to the family as such (e.g. partners in life).
Married couples with children as well as single parents and unmarried couples with their
unmarried children living in the same household are counted
as families.
Unit 2009 2013 2017Households Total ..................................... 1000 1,988.0 1,932.5 2,002.9by size of householdSingle-person households ..... 1000 1,074.3 1,046.2 1,049.1
share ................................... % 54.0 54.1 52.4Multi-person households ...... 1000 913.7 886.3 953.9
share ................................... % 46.0 45.9 47.6with 2 persons ..................... 1000 587.9 544.6 578.7
share ................................ % 29.6 28.2 28.9with 3 persons ..................... 1000 176.6 186.5 193.7
share ................................ % 8.9 9.7 9.7with 4 persons ..................... 1000 109.4 109.9 126.7
share ................................ % 5.5 5.7 6.3with 5 or more persons ........ 1000 39.7 45.2 54.7
share ................................ % 2.0 2.3 2.7
Married couples without children ................................ 1000 363.8 321.5 342.1
Families ................................ 1000 421.5 432.4 461.4Married couples .................. 1000 218.6 218.5 247.0Cohabiting couples .............. 1000 52.1 63.2 69.7Single parents ..................... 1000 150.9 150.7 144.7
incl. families with children less than 18 years of age ........ 1000 308.2 327.4 359.5
Married couples .................. 1000 161.2 165.8 196.3Consensual unions .............. 1000 48.2 57.2 64.3Single parents ..................... 1000 98.8 104.4 98.9
5001,0001,5002,0002,5003,0003,5004,000
0
EUR 2009 2010 2011 2012 2013 2014 2015 2016 2017
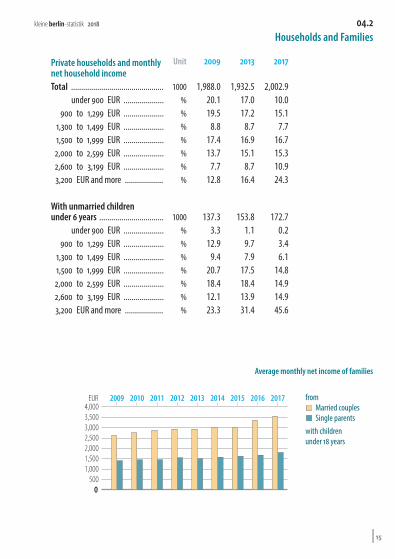
Average monthly net income of families
from ◼ Married couples ◼ Single parentswith children under 18 years
| 15
kleine berlin-statistik 2018 04.2 Households and Families
Private households and monthly net household income
Unit 2009 2013 2017
Total .............................................. 1000 1,988.0 1,932.5 2,002.9under 900 EUR .................... % 20.1 17.0 10.0
900 to 1,299 EUR .................... % 19.5 17.2 15.11,300 to 1,499 EUR .................... % 8.8 8.7 7.71,500 to 1,999 EUR .................... % 17.4 16.9 16.72,000 to 2,599 EUR .................... % 13.7 15.1 15.32,600 to 3,199 EUR .................... % 7.7 8.7 10.93,200 EUR and more ................... % 12.8 16.4 24.3
With unmarried children under 6 years ................................ 1000 137.3 153.8 172.7
under 900 EUR .................... % 3.3 1.1 0.2900 to 1,299 EUR .................... % 12.9 9.7 3.4
1,300 to 1,499 EUR .................... % 9.4 7.9 6.11,500 to 1,999 EUR .................... % 20.7 17.5 14.82,000 to 2,599 EUR .................... % 18.4 18.4 14.92,600 to 3,199 EUR .................... % 12.1 13.9 14.93,200 EUR and more ................... % 23.3 31.4 45.6

10
20
30
40
50
60
70
80
90
100
110
120
130
140
150
160
170
180
0
thousand
Primaryschools
Inte-grated
secondaryschools
Grammarschools
FreieWal-dorf-
schulen
Specialschools
Voca-tional
schools(dual
system)
Full-timevoca-tional
schools
Specia-lised
uppersecon-
daryschools
Two-yearfull-time
voca-tional
schools
Voca-tional
grammarschools
Tradeand
tech-nical
schools
Schoolsfor
nurses,midwives
etc
Pupils 2017
Male Female
16 |
kleine berlin-statistik 201805.1 Education
Unit 2009 2013 2017Pupils inPrimary schools ..................................... number 155,836 152,476 170,369Integrated secondary schools ................ number x 79,406 92,059Secondary general schools .................... number 10,757 29 xIntermediate schools ............................. number 19,777 667 xGrammar schools .................................. number 77,742 75,862 76,138Comprehensive schools¹ ........................ number 44,755 6,150 4,532Special schools ...................................... number 12,003 9,435 8,151Vocational schools (dual system) .......... number 60,195 50,652 51,423Full-time vocational schools .................. number 17,311 17,118 14,866Specialised upper secondary schools ..... number 6,633 4,744 4,452Two-year full-time vocational schools ... number 1,201 1,151 840Vocational grammar schools ................. number 2,410 3,729 5,653Trade and technical schools ................... number 7,202 10,688 11,222Schools of nurses, midwives etc ............ number 5,886 5,724 5,707
Teaching staff²Schools of general education ................ number 25,089 25,880 30,058Vocational schools ................................. number 4,582 4,637 5,250Schools for nurses, midwives etc ........... number 451 482 524
1 Incl. Freie Wal-dorfschule
2 Full- and part-time teaching staff

200 400 600 800 1,000 1,200 1,400 1,600 1,8000
Office managerQualified dental employee
Medical assistantMotor vehicle mechatronics technicianManagementassistant for retail services
Plant mechanic for sanitary, heating and air conditioning systemsManagementassistant for retail services
Electronics technicianInformation technology specialistSpecialist in the hotel business
CookMechatronics fitter
HairdresserSpecialist in the hotel businessClerk in public administration
Office managerJoiner
Sales assistant for retail servicesIndustrial clerk
Tax clerk
Trainees on 31. December 2017 ◼ Male ◼ Female in the ten most frequent training occupations total: 38,432 trainees
| 17
kleine berlin-statistik 2018 05.2 Education
Unit 2009 2013 2017Schools ¹Primary schools ............................. number 440 428 427Integrated secondary schools ........ number x 160 180Secondary general schools ............ number 51 1 xIntermediate schools ..................... number 70 8 xGrammar school ............................ number 110 115 113Comprehensive schools² ............... number 65 16 11Special schools .............................. number 95 82 86Vocational schools (dual system) .. number 55 55 70Full-time vocational schools .......... number 83 99 95Specialised upper secondary schools .......................................... number 50 49 48Two-year full-time vocational schools .......................................... number 25 28 22Vocational grammar schools ......... number 14 19 22Trade and technical schools ........... number 34 56 65Schools of nurses, midwives etc .... number 66 67 70
1 Optionally also educational institutions
2 Incl. Freie Wal-dorfschule

Legal, economic and social sciencesEngineering
Other subjects Humanities
Mathematics, natural sciences
Studentsin winter term 2017/18 by area of study
18 |
kleine berlin-statistik 201805.3 Education
All universities, art schools and colleges
which are recognized under national law
submit their data based on the Higher Education
Statistics Act.
Unit 2009 2013 2017
Students ¹ ............................................ number 140,070 165,923 187,934incl. female ........................................ % 49.3 49.3 49.9
At universities .................................... number 98,544 110,842 123,660incl. female ........................................ % 50.5 49.9 50.3
At colleges of art and music .............. number 4,846 5,173 5,515incl. female ........................................ % 58.4 59.0 58.8
At specialised colleges of higher education (Fachhochschulen) ........... number 36,294 49,453 58,236
incl. female ........................................ % 44.7 46.8 48.1At colleges of public administration number 386 455 523
incl. female ........................................ % 62.4 67.5 67.3
New entrants²viz.in the first semester in higher education ............................ number 26,326 31,877 36,714in the first subject-related semester ... number 39,381 53,196 61,840
Academic and creative arts staff³(without student auxiliary workers) ..... number 22,215 24,477 25,386as primary occupation .......................... number 13,404 15,022 15,749as secondary occupation ...................... number 8,811 9,455 9,637
1 Winter term2 Academic year
(summer term and the following winter term)
3 On 1 December
| 19
kleine berlin-statistik 201805.3 Education
All universities, art schools and colleges
which are recognized under national law
submit their data based on the Higher Education
Statistics Act.
Unit 2009 2013 2017
Students ¹ ............................................ number 140,070 165,923 187,934incl. female ........................................ % 49.3 49.3 49.9
At universities .................................... number 98,544 110,842 123,660incl. female ........................................ % 50.5 49.9 50.3
At colleges of art and music .............. number 4,846 5,173 5,515incl. female ........................................ % 58.4 59.0 58.8
At specialised colleges of higher education (Fachhochschulen) ........... number 36,294 49,453 58,236
incl. female ........................................ % 44.7 46.8 48.1At colleges of public administration number 386 455 523
incl. female ........................................ % 62.4 67.5 67.3
New entrants²viz.in the first semester in higher education ............................ number 26,326 31,877 36,714in the first subject-related semester ... number 39,381 53,196 61,840
Academic and creative arts staff³(without student auxiliary workers) ..... number 22,215 24,477 25,386as primary occupation .......................... number 13,404 15,022 15,749as secondary occupation ...................... number 8,811 9,455 9,637
1 Winter term2 Academic year
(summer term and the following winter term)
3 On 1 December
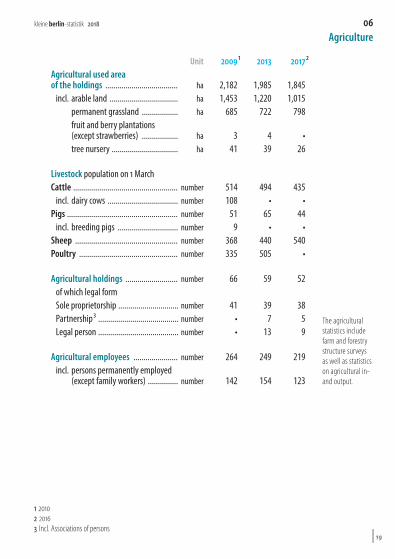
06 Agriculture
Unit 2009 ¹ 2013 2017²
The agricultural statistics include farm and forestry structure surveys as well as statistics on agricultural in- and output.
Agricultural used area of the holdings .................................... ha 2,182 1,985 1,845
incl. arable land .................................. ha 1,453 1,220 1,015permanent grassland .................. ha 685 722 798fruit and berry plantations (except strawberries) .................. ha 3 4 •tree nursery ................................. ha 41 39 26
Livestock population on 1 MarchCattle .................................................... number 514 494 435
incl. dairy cows ................................... number 108 • •Pigs ....................................................... number 51 65 44
incl. breeding pigs .............................. number 9 • •Sheep ................................................... number 368 440 540Poultry ................................................. number 335 505 •
Agricultural holdings .......................... number 66 59 52of which legal formSole proprietorship .............................. number 41 39 38Partnership³ ........................................ number • 7 5Legal person ........................................ number • 13 9
Agricultural employees ...................... number 264 249 219incl. persons permanently employed
(except family workers) ............... number 142 154 123
1 20102 20163 Incl. Associations of persons

5001,0001,5002,0002,5003,0003,500
0
2009 2010 2011 2012 2013 2014 2015Diseases of the respiratory system
20 |
kleine berlin-statistik 201807.1 Public health system
The statistics of the public health system are based on reports by the public
health authorities and the hospitals.
Unit 2009 2013 2015Selected causes of deathDiseases of the circulatory system number 12,265 10,936 10,873Neoplasms .................................... number 8,372 9,010 9,440Injury and poisoning ..................... number 1,079 1,266 1,400AIDS/HIV diseases ......................... number 50 26 30Diseases of the respiratory system number 2,449 2,713 3,169
Died infants ................................. number 124 124 121rate¹ 3.9 3.5 3.2
Physicians .................................... number 18,000 18,923 21,538
Dentists ........................................ number 3,844 3,956 4,140
1 Per 1000 live births
2
4
6
8
10
0
days 2009 2010 2011 2012 2013 2014 2015 2016 2017Average length of stay
| 21
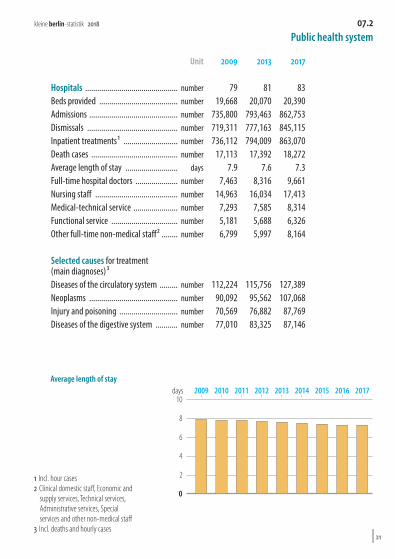
kleine berlin-statistik 2018 07.2 Public health system
Unit 2009 2013 2017
Hospitals .............................................. number 79 81 83Beds provided ....................................... number 19,668 20,070 20,390Admissions ............................................ number 735,800 793,463 862,753Dismissals ............................................. number 719,311 777,163 845,115Inpatient treatments¹ ........................... number 736,112 794,009 863,070Death cases ........................................... number 17,113 17,392 18,272Average length of stay .......................... days 7.9 7.6 7.3Full-time hospital doctors ..................... number 7,463 8,316 9,661Nursing staff ......................................... number 14,963 16,034 17,413Medical-technical service ...................... number 7,293 7,585 8,314Functional service ................................. number 5,181 5,688 6,326Other full-time non-medical staff² ........ number 6,799 5,997 8,164
Selected causes for treatment (main diagnoses)³Diseases of the circulatory system ......... number 112,224 115,756 127,389Neoplasms ............................................ number 90,092 95,562 107,068Injury and poisoning ............................. number 70,569 76,882 87,769Diseases of the digestive system ........... number 77,010 83,325 87,146
1 Incl. hour cases2 Clinical domestic staff, Economic and
supply services, Technical services, Administrative services, Special services and other non-medical staff
3 Incl. deaths and hourly cases

10,00020,00030,00040,00050,00060,00070,00080,00090,000
0
2009 2010 2011 2012 2013 2014 2015 2016 2017
Recipients of
• subsistence payment
• basic security in old age and disability
• benefits under the 5th to 9th Chapter of SGB XII
22 |
kleine berlin-statistik 201808 Public social benefits
Information about social benefits is
taken from diffe- rent official statis-
tics (e.g. social assistance, housing
allowance and severely disabled person statistics).
Public assistance Unit 2009 2013 2017Recipients of subsistence payment ............................ number 17,928 21,063 21,510Recipients of basic security in old age and disability¹ ....................... number 57,502 70,816 80,210Recipients of benefits under the 5th to 9th Chapter of SGB XII ................. number 53,111 59,422 54,418Gross expenditures² .............................. EUR mn 1,403.8 1,663.7 1,347.5
Asylum seekersRecipients, end of year .......................... number 10,528 17,295 25,591Gross expenditures ................................ EUR mn 70.9 128.0 458.9
Housing allowanceRecipients (households) ........................ number 38,129 26,156 24,268
Severely handicapped persons .......... number 342,968 346,826 348,988rate³ 100 101 97
1 from 2015 methodological changes2 from 2017 without gross expendi-
ture on basic security in old-age and disability
3 per 1000 inhabitants

| 23
kleine berlin-statistik 2018 09.1 Facilities for child care
Unit 2009 2013 2017
Child day care centres ................. number 1,859 2,154 2,477Places ............................................ number 131,638 148,220 168,333Cared children ............................... number 117,519 134,776 156,714Staff .............................................. number 20,586 27,626 33,305Public institutions ....................... number 280 277 294Places ............................................ number 36,068 36,213 37,379Cared children ............................... number 31,735 33,141 35,356Staff .............................................. number 4,958 5,696 6,285Independent institutions ........... number 1,579 1,877 2,183Places ............................................ number 95,570 112,007 130,954Cared children ............................... number 85,784 101,635 121,358Staff .............................................. number 15,628 21,930 27,020
Attendance ratesof children under 3 years ............... rate¹ 37.9 39.4 40.8of children 3 to under 6 years ........ rate¹ 92.9 92.8 92.3
Children in day care by child minders .......................... number 4,761 5,913 6,122
incl. under 3 years ...................... number 3,364 4,362 4,214Daily care staff ............................... number 1,408 1,685 1,599
Attendance ratesof children under 3 years ............... rate¹ 3.7 4.3 3.8of children 3 to under 6 years ........ rate¹ 1.3 1.3 1.5
1 Number of children in day care ever 100 of children in the same age group

24 |
kleine berlin-statistik 201809.2 Youth welfare
Closed cases, in the course of the year
Unit 2009 2013 2017
Adoptions .................................... number 114 72 106Take of children in care ................. number 1,326 2,244 2,930Procedure for assessing child welfare ............................... number • 9,959 13,014acute child welfare risk ................ number • 1,984 2,584latent child welfare risk ................ number • 3,254 3,376no child welfare risk, but needs help ............................. number • 2,678 3,567no child welfare risk and no need for assistance ........... number • 2,043 3,487
Cases, as of end of yearAssistance/counselling for young peopleHelp for education ........................ number 945 1,011 912Parenting advice .......................... number 7,280 7,446 7,592Social group work ........................ number 587 527 524Individual assistance .................... number 931 1,148 1,947Day group education .................... number 496 429 578Full-time care ............................... number 1,367 1,387 1,819Care in residential homes; other forms of supported housing number 3,901 3,653 6,194Individual intensive socio-educational assistance ........ number 100 74 187Adaption support for mentally disordered young people .............. number 1,251 2,325 4,319Family-oriented assistance/counsellinghelp for education ........................ number 49 107 1,353Socio-educational family assistance .......................... number 3,074 2,945 4,430

10,00020,00030,00040,00050,00060,00070,00080,000
0
2009 2011 2013 2015 2017
Recipients of care
• cared for exclusively by family members at home
• with inpatient care
• with ambulatory care
• with care level 1 and outpatient care
| 25
kleine berlin-statistik 2018 10 Care
Benefits from nursing care insurances ¹
Unit 2009 2013 2017
This data is provided by the institutions of out-patient and inpatient care facilities and the care funds.
Recipients of care² ..................... number 101,351 112,509 135,680with inpatient care ....................... number 26,013 27,528 29,246with ambulatory care ................... number 26,263 27,769 34,550cared for exclusively by family members at home ........ number 49,075 57,212 71,860with care level 1 and outpatient care ...................... number • • 24
Nursing homes ........................... number 378 378 391private .......................................... number 181 191 191non-profit .................................... number 188 171 183public ........................................... number 9 16 17
Nursing home places ................. number 33,665 33,854 35,103
Ambulatory care services .......... number 505 567 613private .......................................... number 378 442 481non-profit .................................... number 123 121 130public ........................................... number 4 4 2
Staff ............................................. number 39,082 42,040 44,819Nursing homes ........................... number 19,674 20,632 22,511Ambulatory care services .......... number 19,408 21,408 22,308
1 As of 15 December2 without outpatient care

50
100
150
200
0
mm J F M A M J J A S O N D J F M A M J J A S O N D J F M A M J J A S O N D2015 2016 2017Height of precipation
26 |
kleine berlin-statistik 201811 Climate
Climate ¹ (weather station Berlin-Dahlem)
Unit 2009 2013 2017
Temperature (annual average) ............. °C 10 9 10Annual maximum ................................ °C 32 35 32Annual minimum ................................. °C -19 -13 -10Duration of sunshine (annual total) ..... hrs 1,855 1,635 1,706Summer days (at least 25 °C) ................ number 45 42 38Hot days (at least 30 °C) ....................... number 6 9 5Frosty days (minimum below 0 °C) ...... number 86 90 65Ice days ................................................ number 27 25 13
Precipitation (annual total) .................. mm 618 668 854Days with
min 0,1 mm ........................................ number 173 169 193min 1,0 mm ........................................ number 111 111 118min 10,0 mm ...................................... number 15 15 21
1 Source: Meteorological Institute of the Free University Berlin
| 27
kleine berlin-statistik 2018 12 Environment
Unit 2010 2013 2016Public water supplyWithdrawal of water ...................................................... m³ mn 207.1 206.9 221.1Provison of water to final consumers in Berlin ............... m³ mn 193.3 189.1 206.0
incl. households and small businesses ........................ m³ mn 141.7 140.7 152.0Connection rate to public water supply .......................... % 99.8 99.8 99.8Water consumption per inhabitant and day ................... litre 112.9 113.8 117.2
Public sewage disposalIn facilities in Berlin treated sewage, total ..................... m³ mn 82.4 84.6 85.8
viz. waste water ........................................................ m³ mn 71.5 74.1 77.9treated in biological facilities .............................. m³ mn 82.4 84.6 85.8
Connection rate to public sewage treatment facilities .... % 99.6 99.6 99.7
Waste disposal 2009 2013 2016Collection of wastes within public waste disposal¹ ........ 1000 t 1,458.9 1,389.6 1,362.0
incl. municipal and bulky waste ................................. 1000 t 911.4 866.9 885.5In waste disposal facilities processed waste quantities 1000 t 2,688.8 3,053.8 3,204.2
incl. delivered from Berlin .......................................... 1000 t 2,238.3 2,634.3 2,519.3
1 Reporting of the waste balance (Abfallbilanz Berlin)
100200300400500600700800900
1,0001,1001,200
0
thousand 2009 2013 2017
pollutant-reduced with petrol engine3
pollutant-reduced with diesel engine
not reduced pollutant
Passenger cars
28 |
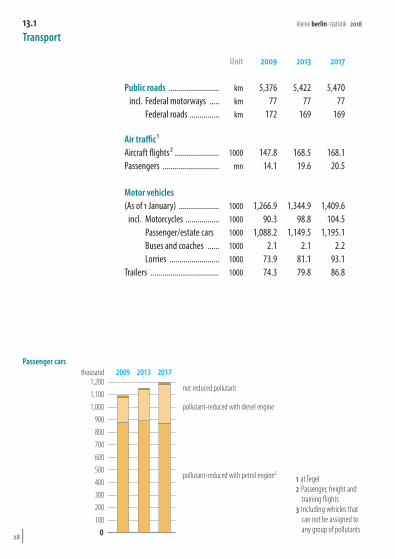
kleine berlin-statistik 201813.1 Transport
Unit 2009 2013 2017
Public roads ......................... km 5,376 5,422 5,470incl. Federal motorways ..... km 77 77 77
Federal roads ............... km 172 169 169
Air traffic ¹Aircraft flights² ...................... 1000 147.8 168.5 168.1Passengers ............................ mn 14.1 19.6 20.5
Motor vehicles(As of 1 January) .................... 1000 1,266.9 1,344.9 1,409.6
incl. Motorcycles ................. 1000 90.3 98.8 104.5Passenger/estate cars 1000 1,088.2 1,149.5 1,195.1Buses and coaches ...... 1000 2.1 2.1 2.2Lorries ......................... 1000 73.9 81.1 93.1
Trailers .................................. 1000 74.3 79.8 86.8
1 at Tegel2 Passenger, freight and
training flights3 Including vehicles that
can not be assigned to any group of pollutants
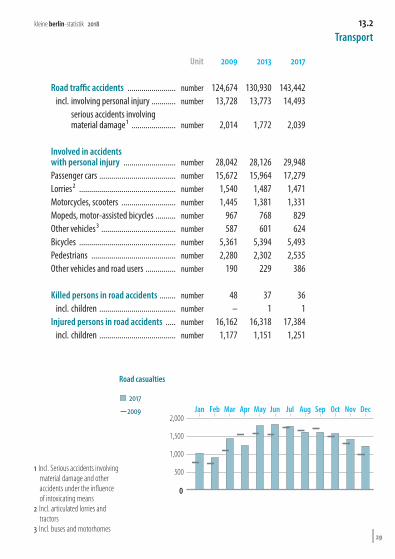
500
1,000
1,500
2,000
0
Jan Feb Mar Apr May Jun Jul Aug Sep Oct Nov Dec
Road casualties
◼ 2017 2009
| 29
kleine berlin-statistik 2018 13.2 Transport
Unit 2009 2013 2017
Road traffic accidents ........................ number 124,674 130,930 143,442incl. involving personal injury ............ number 13,728 13,773 14,493
serious accidents involving material damage¹ ...................... number 2,014 1,772 2,039
Involved in accidents with personal injury .......................... number 28,042 28,126 29,948Passenger cars ...................................... number 15,672 15,964 17,279Lorries² ................................................ number 1,540 1,487 1,471Motorcycles, scooters ........................... number 1,445 1,381 1,331Mopeds, motor-assisted bicycles .......... number 967 768 829Other vehicles³ ..................................... number 587 601 624Bicycles ................................................ number 5,361 5,394 5,493Pedestrians .......................................... number 2,280 2,302 2,535Other vehicles and road users ............... number 190 229 386
Killed persons in road accidents ........ number 48 37 36incl. children ...................................... number – 1 1
Injured persons in road accidents ..... number 16,162 16,318 17,384incl. children ...................................... number 1,177 1,151 1,251
1 Incl. Serious accidents involving material damage and other accidents under the influence of intoxicating means
2 Incl. articulated lorries and tractors
3 Incl. buses and motorhomes

Insolvency proceedings by type of debtor 2009 ◼ 2017
200400600800
1,0001,2001,4001,6001,8002,0002,2002,4002,6002,8003,0003,2003,4003,6003,8004,0004,2004,4004,600
0Enter-prises
Con-sumer
formerself-
employedperson
otherdebtors
30 |
kleine berlin-statistik 201814 Business notifications, Insolvencies
Unit 2009 2013 2017Business notificationsBusiness registrations ... number 44,951 46,212 44,839
includingnew establishments¹ number 40,089 42,585 41,063
Business deregistrations number 33,848 34,776 35,801includingclosing downs² ........... number 29,521 31,243 32,299
Insolvencies ................. number 7,748 6,691 5,734Enterprises .................... number 1,499 1,278 1,349Other debtors ................ number 6,249 5,413 4,385
includingconsumer ................... number 4,471 4,043 3,367
1 Establishment of businesses, other foundations and trans-formations, without arrivals
2 Closing downs of business, other closures and transfor-mations, without departures
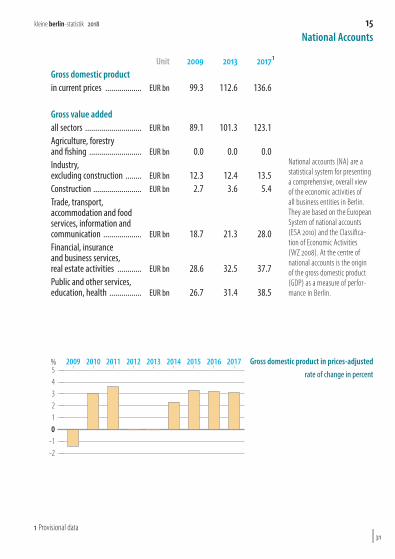
-2-1
12345
0
% 2009 2010 2011 2012 2013 2014 2015 2016 2017 Gross domestic product in prices-adjustedrate of change in percent
| 31
kleine berlin-statistik 2018 15 National Accounts
Unit 2009 2013 2017 ¹
National accounts (NA) are a statistical system for presenting a comprehensive, overall view of the economic activities of all business entities in Berlin. They are based on the European System of national accounts (ESA 2010) and the Classifica- tion of Economic Activities (WZ 2008). At the centre of national accounts is the origin of the gross domestic product (GDP) as a measure of perfor- mance in Berlin.
Gross domestic productin current prices .................. EUR bn 99.3 112.6 136.6
Gross value addedall sectors ............................ EUR bn 89.1 101.3 123.1Agriculture, forestry and fishing .......................... EUR bn 0.0 0.0 0.0Industry, excluding construction ........ EUR bn 12.3 12.4 13.5Construction ........................ EUR bn 2.7 3.6 5.4Trade, transport, accommodation and food services, information and communication ................... EUR bn 18.7 21.3 28.0Financial, insurance and business services, real estate activities ............ EUR bn 28.6 32.5 37.7Public and other services, education, health ................ EUR bn 26.7 31.4 38.5
1 Provisional data
32 |
kleine berlin-statistik 201816.1 Employment and Compensation of Employees
Persons in employment and their wages and salaries are
determined in accordance with system of national accounts. The
number of employed persons corresponds to the workplace concept; that is, all employed
persons that work in Berlin are taken into consideration. In
national accounts the compen- sation of employees reflects all
of the cash and non-cash remu- neration accrued to employees
working in Berlin due to their employment relationships.
Unit 2009 2013 2017 ¹Persons engaged in economic activity ..................... 1000 1,671.5 1,774.2 1,949.5Self-employed and family workers 1000 226.0 227.6 224.2Employees ...................................... 1000 1,445.5 1,546.7 1,725.2
Persons in employment by economic sectorsAgriculture, forestry and fishing ..... 1000 0.6 0.5 0.6Industry (excluding construction) .. 1000 135.7 138.8 138.3Construction ................................... 1000 75.6 81.1 83.6Trade, transport, accommodation and food services, information and communication ....................... 1000 422.6 467.0 523.0Financial, insurance and business services, real estate activities ......... 1000 365.4 385.3 439.2Public and other services, education, health ........................... 1000 671.7 701.5 764.7
Compensation of employees per employee ............................... EUR 34,489 37,399 42,632Agriculture, forestry and fishing ..... EUR 20,426 22,568 24,484Industry (excluding construction) .. EUR 49,881 53,818 57,738Construction ................................... EUR 36,484 36,275 39,723Trade, transport, accommodation and food services, information and communication ....................... EUR 30,566 33,089 39,342Financial, insurance and business services, real estate activities ......... EUR 33,005 35,174 39,061Public and other services, education, health ........................... EUR 34,144 38,043 44,318
1 provisional data

50,000
100,000
150,000
200,000
250,000
0
2009 2010 2011 2012 2013 2014 2015 2016 2017 Unemployed
◼ Male
◼ Female
| 33
kleine berlin-statistik 2018 16.2 Labour Market
Unit 2009 2013 2017
The Federal Employment Agency (Bundesagentur für Arbeit) calculates the labour market data (here annual averages).
Unemployed ....................... number 236,669 210,093 168,991viz.female ................................ number 101,755 92,069 73,665foreign ............................... number 48,143 48,025 51,150
at the age of15 to 19 years ........................ number 4,938 3,878 3,48920 to 24 years ....................... number 20,026 15,232 10,283
Announced positions ......... number 8,372 19,034 24,793Short-time workers ............ number 13,544 3,433 2,256
Unemployment rate ¹ ......... % 14.0 11.7 9.0
1 Unemployed persons as % of all civilian employees (em-ployees subject to social in-surance and employees at a low level, officials and unem-ployed persons additionally self-employed persons and family workers), as of 30 June on previous year

4,000
8,000
12,000
16,000
20,000
24,000
28,000
0
EUR mn 2009 2010 2011 2012 2013 2014 2015 2016 2017
Manufacturing◼ Foreign turnover ◼ Domestic turnover
34 |
kleine berlin-statistik 201817.1 Industry
Industry includes the supply of water and en-
ergy, mining and quarry-ing, and manufacturing
and construction. Unless otherwise indicated, data is based on the data pro-vided by companies with generally 20 or more em-
ployees in accordance with the classification of
Economic branches, valid since 2008 (Klassifikation
der Wirtschaftszweige). Crafts businesses are also
included.
Manufacturing, mining and quarrying
Unit 2009 2013 2017
Establishments¹ ........................... number 737 734 732Employees¹ .................................. number 87,836 92,045 91,215Remuneration .............................. EUR mn 3,772 4,322 4,708Turnover ....................................... EUR mn 22,757 23,240 25,175
incl. with foreign countries ........ EUR mn 10,208 12,359 14,431
Turnover of selected Economic branchesManufacture of food products ...... EUR mn 2,734 2,295 2,265Manufacture of basic pharmaceutical products and pharmaceutical preparations ....... EUR mn 5,514 6,289 7,593Manufacture of basic metals ........ EUR mn 981 1,083 921Manufacture of computer, electronic and optical products .... EUR mn 2,063 2,225 2,555Manufacture of electrical equipment ................................... EUR mn 1,413 1,825 1,938Manufacture of machinery and equipment n.e.c. .......................... EUR mn 1,882 2,275 2,121
1 September

5001,0001,5002,0002,5003,0003,5004,0004,500
0
EUR mn 2008 2009 2010 2011 2012 2013 2014 2015 2016
Construction annual turnover
• Main construction industry
• Building completion work
| 35
kleine berlin-statistik 2018 17.2 Industry
Unit 2009 2013 2017Main construction industry ¹ Establishments ..................................... number 3,019 2,576 2,199Employees ............................................ number 19,312 21,214 23,229Turnover in construction work for previous year .................................. EUR mn 2,222.5 2,766.5 3,376.8
Building completion work ¹ ²Establishments ..................................... number 685 685 845Employees ............................................ number 17,398 19,565 23,981Turnover in construction work for previous year .................................. EUR mn 1,705.7 2,072.9 2,557.5
1 Results of the annual supplementary survey (Site preparation, civil engineering) or annual survey (Building instal-lation) - as of end of June
2 Establishments with generally 10 and more employees
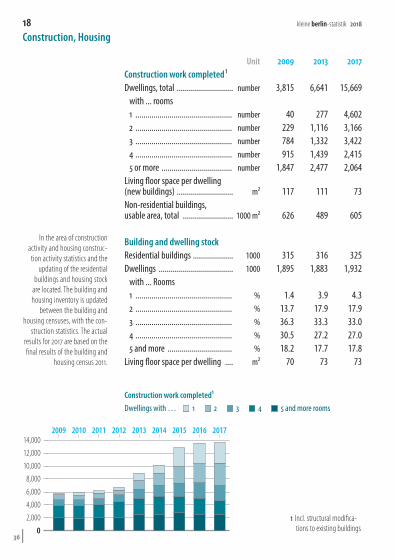
2,000
4,000
6,000
8,000
10,000
12,000
14,000
0
2009 2010 2011 2012 2013 2014 2015 2016 2017
Construction work completed¹ Dwellings with … ◼ 1 ◼ 2 ◼ 3 ◼ 4 ◼ 5 and more rooms
36 |
kleine berlin-statistik 201818 Construction, Housing
In the area of construction activity and housing construc-
tion activity statistics and the updating of the residential
buildings and housing stock are located. The building and housing inventory is updated
between the building and housing censuses, with the con-
struction statistics. The actual results for 2017 are based on the final results of the building and
housing census 2011.
Unit 2009 2013 2017Construction work completed ¹Dwellings, total ............................ number 3,815 6,641 15,669
with ... rooms1 ................................................ number 40 277 4,6022 ................................................ number 229 1,116 3,1663 ................................................ number 784 1,332 3,4224 ................................................ number 915 1,439 2,4155 or more ................................... number 1,847 2,477 2,064
Living floor space per dwelling (new buildings) ............................ m² 117 111 73Non-residential buildings, usable area, total ......................... 1000 m² 626 489 605
Building and dwelling stockResidential buildings .................... 1000 315 316 325Dwellings ..................................... 1000 1,895 1,883 1,932
with ... Rooms1 ................................................ % 1.4 3.9 4.32 ................................................ % 13.7 17.9 17.93 ................................................ % 36.3 33.3 33.04 ................................................ % 30.5 27.2 27.05 and more ................................ % 18.2 17.7 17.8
Living floor space per dwelling .... m² 70 73 73
1 Incl. structural modifica-tions to existing buildings
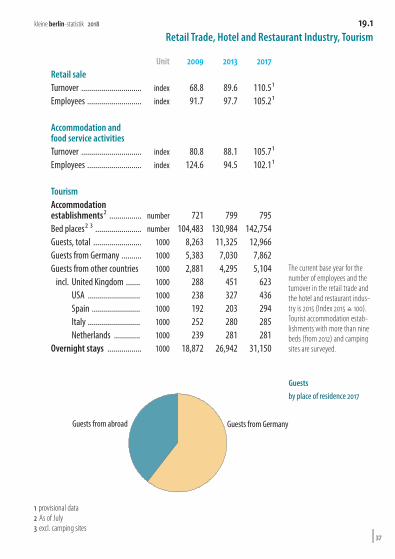
Guests from GermanyGuests from abroad
Guests by place of residence 2017
| 37
kleine berlin-statistik 2018 19.1 Retail Trade, Hotel and Restaurant Industry, Tourism
Unit 2009 2013 2017
The current base year for the number of employees and the turnover in the retail trade and the hotel and restaurant indus- try is 2015 (Index 2015 ≙ 100). Tourist accommodation estab- lishments with more than nine beds (from 2012) and camping sites are surveyed.
Retail saleTurnover .............................. index 68.8 89.6 110.5¹Employees ........................... index 91.7 97.7 105.2¹
Accommodation and food service activitiesTurnover .............................. index 80.8 88.1 105.7¹Employees ........................... index 124.6 94.5 102.1¹
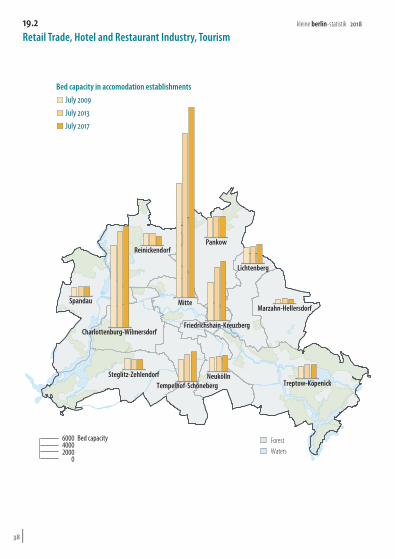
TourismAccommodation establishments² ................ number 721 799 795Bed places² ³ ....................... number 104,483 130,984 142,754Guests, total ........................ 1000 8,263 11,325 12,966Guests from Germany .......... 1000 5,383 7,030 7,862Guests from other countries 1000 2,881 4,295 5,104
incl. United Kingdom ....... 1000 288 451 623USA .......................... 1000 238 327 436Spain ........................ 1000 192 203 294Italy .......................... 1000 252 280 285Netherlands ............. 1000 239 281 281
Overnight stays ................. 1000 18,872 26,942 31,150
1 provisional data2 As of July3 excl. camping sites
Mitte
Friedrichshain-Kreuzberg
Pankow
Spandau
Steglitz-Zehlendorf NeuköllnTreptow-Köpenick
Marzahn-Hellersdorf
Lichtenberg
Reinickendorf
Tempelhof-Schöneberg
40002000
6000
0
Bed capacity ForestWaters
Charlottenburg-Wilmersdorf
Bed capacity in accomodation establishments◼ July 2009◼ July 2013◼ July 2017
38 |
kleine berlin-statistik 201819.2 Retail Trade, Hotel and Restaurant Industry, Tourism

2,000
4,000
6,000
8,000
10,000
12,000
14,000
16,000
18,000
0
thousand 2009 2010 2011 2012 2013 2014 2015 2016 2017
Overnight stays by guests Germany ◼
other countries ◼
| 39
kleine berlin-statistik 2018 19.3 Retail Trade, Hotel and Restaurant Industry, Tourism
Unit 2009 2013 2017
Overnight stays ............................ 1000 18,872 26,942 31,150… by type of establishmentHotels, Inns, Guest-houses .......... 1000 15,559 22,779 26,253Hotel .............................................. 1000 10,012 14,453 16,136Hotels garnis (hotel, breakfast only) 1000 5,210 7,827 9,560Gasthöfe (Inns) .............................. 1000 19 25 39Guest houses .................................. 1000 318 473 518Other accommodation ................. 1000 3,313 4,163 4,897
incl. Campsites ............................ 1000 123 108 117

40 |
kleine berlin-statistik 201820 Foreign Trade
The foreign trade statistics pro-vide information to the move-
ment of goods across the border (exports and imports) between
Berlin and foreign countries. Data is derived from customs
documents of importers and ex-porters with countries outside the EU (extra trade). A second
data source is the statistical reg-istrations of acquisitions and
deliveries within the community according to the Value Added
Tax Act (intra trade).
Unit 2009 2013 2017 ¹
Exports ............................... EUR mn 10,461 12,926 15,339Food industry ...................... EUR mn 1,366 1,791 1,933
incl. food .......................... EUR mn 600 751 948luxury food (Genussmittel) .......... EUR mn 766 1,039 984
Trade and industry .............. EUR mn 8,958 10,945 12,991raw materials ............ EUR mn 30 18 36semi-finished products .................... EUR mn 127 458 339finished products ...... EUR mn 8,801 10,470 12,616
Important exporting countriesUnited States ....................... EUR mn 933 1,356 1,739People’s Republic of China ... EUR mn 516 596 966France ................................. EUR mn 748 780 843
Imports .............................. EUR mn 8,333 9,730 13,681Food industry ...................... EUR mn 1,093 1,296 1,732
incl. food .......................... EUR mn 796 1,039 1,406luxury food (Genussmittel) .......... EUR mn 296 253 324
Trade and industry .............. EUR mn 6,801 7,818 9,901raw materials ............ EUR mn 116 104 196semi-finished products .................... EUR mn 199 326 302finished products ...... EUR mn 6,486 7,388 9,402
Important importing countriesSwitzerland ......................... EUR mn 315 515 1,599Netherlands ........................ EUR mn 623 793 1,377Italy ..................................... EUR mn 558 825 1,341
1 provisional data

-0.5
0.5
1.0
1.5
2.0
2.5
0
% J F M A M J J A S O N D J F M A M J J A S O N D2016 2017
Index of consumer priceschange on same month of previous year
| 41
kleine berlin-statistik 2018 21 Consumer Prices
Consumer price index for Berlin
Unit 2009 2013 2017
The consumer price index, shows the price develop- ment of all goods and services purchased by private households for consumption purposes, relative to a base year (here: 2010). The change in the consumer price index compared to the same month last year is also known as „inflation“.
Total cost of living ........................ index 98.7 106.9 110.0Food and non-alcoholic beverages index 98.4 111.5 115.5Alcoholic beverages and tobacco .... index 98.7 106.9 119.0Clothing and footwear ................... index 97.8 102.2 104.7Housing, water, electricity, gas and other fuels ............................... index 98.5 110.4 112.7Furniture, household equipment and routine maintenance of the house ................................... index 99.8 103.2 106.0Health ............................................ index 99.9 100.6 107.1Transport ........................................ index 97.0 107.8 106.0Communication .............................. index 102.3 93.4 89.7Recreation, entertainment and culture ..................................... index 99.8 103.3 108.8Education ....................................... index 109.2 94.1 83.5Accomodation and restaurant services .................. index 98.8 105.1 115.1Miscellaneous goods and services .. index 98.6 106.4 111.3

1
2
3
4
5
0
% 2009 2010 2011 2012 2013 2014 2015 2016 2017
Price index for the construction of new residential buildingsChange on previous year
42 |
kleine berlin-statistik 201822 Construction Prices
The price indices for new buildings of selected con- struction types, shows the development of prices for construction work Berlin
Contractors achieved inpendent of the location
of services compared to a base year (here: 2010).
This includes building and civil engineering as
well as plant mainte-nance of multi-family
buildings.
Price index for the construction of new …
Unit 2009 2013 2017
Residential buildings ...................... index 98.4 107.9 118.9Office buildings .............................. index 98.3 107.5 119.4Industrial buildings ........................ index 98.5 107.1 118.8
Price index …Road construction .......................... index 100.6 111.7 122.1Bridges in connection with road construction ................... index 98.5 107.1 116.9Local channels ................................ index 99.5 108.8 118.8
Price index for maintenance of …Residential buildings ...................... index 99.2 107.9 121.8Decorative repairs in a dwelling ..... index 99.9 106.3 126.6
| 43
kleine berlin-statistik 2018 23 Judicature
Unit 2009 2013 2017
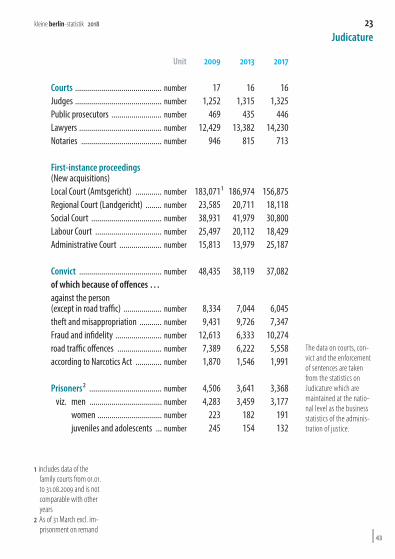
The data on courts, con- vict and the enforcement of sentences are taken from the statistics on Judicature which are maintained at the natio- nal level as the business statistics of the adminis- tration of justice.
Courts ........................................... number 17 16 16Judges ........................................... number 1,252 1,315 1,325Public prosecutors ......................... number 469 435 446Lawyers ......................................... number 12,429 13,382 14,230Notaries ........................................ number 946 815 713
First-instance proceedings (New acquisitions)Local Court (Amtsgericht) ............. number 183,071¹ 186,974 156,875Regional Court (Landgericht) ........ number 23,585 20,711 18,118Social Court ................................... number 38,931 41,979 30,800Labour Court ................................. number 25,497 20,112 18,429Administrative Court ..................... number 15,813 13,979 25,187
Convict ......................................... number 48,435 38,119 37,082of which because of offences …against the person (except in road traffic) ................... number 8,334 7,044 6,045theft and misappropriation ........... number 9,431 9,726 7,347Fraud and infidelity ....................... number 12,613 6,333 10,274road traffic offences ...................... number 7,389 6,222 5,558according to Narcotics Act ............. number 1,870 1,546 1,991
Prisoners² .................................... number 4,506 3,641 3,368viz. men .................................... number 4,283 3,459 3,177
women ................................ number 223 182 191juveniles and adolescents ... number 245 154 132
1 includes data of the family courts from 01.01. to 31.08.2009 and is not comparable with other years
2 As of 31 March excl. im-prisonment on remand

1,000 2,000 3,000 4,000 5,000 6,000 7,0000
Executives
Complex, varied assignments
Difficult professional assignments
Simple, semiskilled assignments
Unskilled, standardised assignments
EUR
Gross monthly earnings ² of full-time employees ¹ in industry and service for 2017
◼ Male
◼ Female
44 |
kleine berlin-statistik 201824.1 Earnings
The described gross annual and gross monthly earnings are
averages from the Quarterly Survey of earnings. The sample
survey contains numbers of full-time, part-time and
marginally employed workers of nearly all industries according
to the WZ 2008.
Full-time employees ¹ in industry and services
Unit 2009 2013 2017
Gross annual earnings² ................ EUR 37,402 39,857 44,525… of male employees ................... EUR 39,876 42,027 46,391… of female employees ................ EUR 33,960 36,972 41,637Gross monthly earnings² ............. EUR 3,117 3,321 3,710… of male employees ................... EUR 3,323 3,502 3,866… of female employees ................ EUR 2,830 3,081 3,470Paid hours of work ....................... hrs 38.8 39.2 39.2
1 Incl. civil servants2 Excluding bonuses;
weighted average of data reported for all four quarters
| 45
kleine berlin-statistik 2018 24.2 Earnings
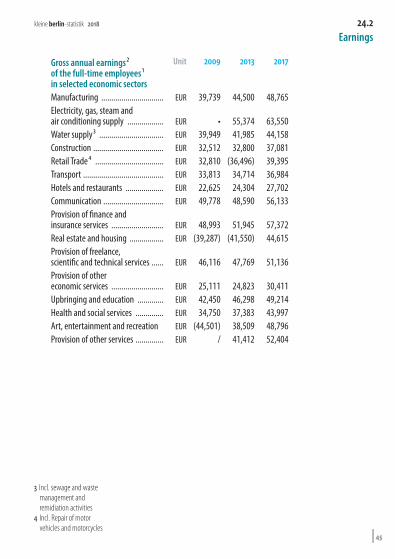
Gross annual earnings² of the full-time employees ¹ in selected economic sectors
Unit 2009 2013 2017
Manufacturing ............................... EUR 39,739 44,500 48,765Electricity, gas, steam and air conditioning supply .................. EUR • 55,374 63,550Water supply³ ................................ EUR 39,949 41,985 44,158Construction ................................... EUR 32,512 32,800 37,081Retail Trade⁴ .................................. EUR 32,810 (36,496) 39,395Transport ........................................ EUR 33,813 34,714 36,984Hotels and restaurants ................... EUR 22,625 24,304 27,702Communication .............................. EUR 49,778 48,590 56,133Provision of finance and insurance services .......................... EUR 48,993 51,945 57,372Real estate and housing ................. EUR (39,287) (41,550) 44,615Provision of freelance, scientific and technical services ...... EUR 46,116 47,769 51,136Provision of other economic services .......................... EUR 25,111 24,823 30,411Upbringing and education ............. EUR 42,450 46,298 49,214Health and social services .............. EUR 34,750 37,383 43,997Art, entertainment and recreation EUR (44,501) 38,509 48,796Provision of other services .............. EUR / 41,412 52,404
3 Incl. sewage and waste management and remidiation activities
4 Incl. Repair of motor vehicles and motorcycles

200
400
600
800
1,000
1,200
0
EUR mn 2013 2015 2017Financial balance Core household land
46 |
kleine berlin-statistik 201825.1 Public Finances
Expenditure and revenue ¹ Unit 2013 2015 2017Core household landAdjusted expenditure ................................. EUR mn 22,269 24,507 26,691
incl. public service personnel ..................... EUR mn 6,938 7,487 8,221operating expenditure ....................... EUR mn 5,611 6,311 7,300Interest .............................................. EUR mn 1,921 1,607 1,306
Adjusted revenue ........................................ EUR mn 22,747 24,713 27,701incl. taxes, tax-related duties ..................... EUR mn 11,946 13,653 15,425
current allocations from the federal government ....................................... EUR mn 4,276 4,421 4,635Fees, other charges ............................ EUR mn 832 971 949
1 including discontinuation period

246810121416
0
EUR bn 2013 2015 2017
Local taxes
Land taxes
Shared taxes
Tax revenues¹ of the Land
| 47
kleine berlin-statistik 2018 25.2 Public Finances
Unit 2013 2015 2017Tax income ¹Land ..................................................... EUR mn 11,921 13,626 15,399
incl. Taxes on income and earnings ... EUR mn 3,809 4,492 5,138Taxes on sales ............................. EUR mn 3,454 3,613 4,282Land taxes .................................. EUR mn 1,028 1,490 1,392Real estate taxes ........................ EUR mn 735 960 1,060
1 after the distribution

1 2 3 4
5 6 7 8
12 03
1110
090807
06
04
05
01
02
5
10
15
20
25
30
35
0
% SPD CDUDIE
LINKE GRÜNE AfD FDPPIRA-TEN Others
Party with the highest share of second vote in the Boroughs
second vote 2016 ◼ 2011 ━
48 |
kleine berlin-statistik 201826.1 Elections
Election to the House of Representatives of Berlin (Abgeordnetenhaus) on 18 September 2016
Constituencies federation (Boroughs)
Turn-out SPD CDU
DIE LINKE GRÜNE AfD FDP
PIRA TEN
- Oth-ers
second vote in percent
01 Mitte ................ 62.6 21.5 13.5 17.6 21.3 9.9 6.6 2.3 7.202 Friedrichshain-
Kreuzberg ......... 68.5 18.2 7.8 23.4 28.4 6.4 3.9 3.1 8.803 Pankow ............ 69.9 20.1 12.6 21.5 17.9 13.8 4.4 2.0 7.704 Charlottenburg-
Wilmersdorf ..... 70.0 22.8 20.3 9.3 18.5 10.3 12.3 1.3 5.105 Spandau ........... 63.5 27.4 24.6 6.6 8.7 16.6 7.6 1.4 7.1
In voting for the House of Repre-
sentatives of Ber-lin (Abgeordneten-haus), the first vote
was cast for direct election of a can-
didate to one of the 78 constituen-
cies and the second vote was to be used to vote for the state
and borough lists of the parties.
06 Steglitz- Zehlendorf ....... 74.5 21.6 25.5 6.9 16.8 11.0 11.8 1.4 4.9
07 Tempelhof- Schöneberg ...... 68.9 24.9 19.9 9.7 18.7 11.4 7.9 1.6 6.0
08 Neukölln .......... 63.2 23.3 17.8 13.6 16.2 13.8 5.7 1.9 7.609 Treptow-
Köpenick .......... 68.1 20.4 12.9 22.6 9.1 20.5 4.1 1.6 8.810 Marzahn-
Hellersdorf ....... 60.9 17.0 17.3 23.5 4.5 23.6 2.8 1.3 10.011 Lichtenberg ...... 62.9 19.7 12.0 26.9 7.7 19.0 2.9 1.8 9.912 Reinickendorf ... 66.8 22.0 28.0 6.1 10.6 16.1 8.8 1.1 7.3
Berlin .............. 66.9 21.6 17.6 15.6 15.2 14.2 6.7 1.7 7.4
5
10
15
20
25
30
35
40
45
00
1990 1995 1999 2001 2006 2011 2016%
◼ SPD◼ CDU◼ DIE LINKE◼ GRÜNE◼ AfD◼ FDP◼ PIRATEN◼ Others
| 49
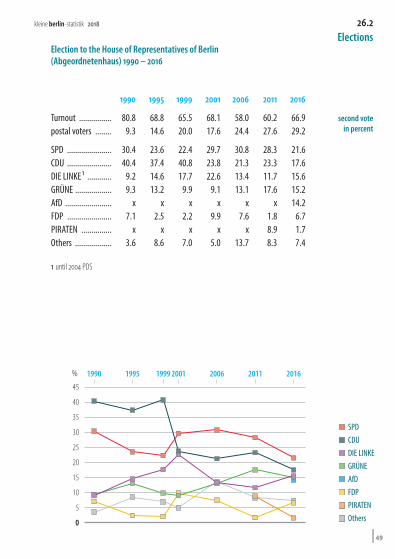
kleine berlin-statistik 2018 26.2 Elections
Election to the House of Representatives of Berlin (Abgeordnetenhaus) 1990 – 2016
1990 1995 1999 2001 2006 2011 2016
Turnout ................ 80.8 68.8 65.5 68.1 58.0 60.2 66.9 second vote in percentpostal voters ........ 9.3 14.6 20.0 17.6 24.4 27.6 29.2
SPD ...................... 30.4 23.6 22.4 29.7 30.8 28.3 21.6CDU ...................... 40.4 37.4 40.8 23.8 21.3 23.3 17.6DIE LINKE¹ ............ 9.2 14.6 17.7 22.6 13.4 11.7 15.6GRÜNE .................. 9.3 13.2 9.9 9.1 13.1 17.6 15.2AfD ....................... x x x x x x 14.2FDP ...................... 7.1 2.5 2.2 9.9 7.6 1.8 6.7PIRATEN ............... x x x x x 8.9 1.7Others .................. 3.6 8.6 7.0 5.0 13.7 8.3 7.4
1 until 2004 PDS
SPDCDUGRÜNEDIE LINKEAfD
SPDCDUGRÜNEDIE LINKEAfD
• ◼ SPD
• ◼ CDU
• ◼ DIE LINKE
• ◼ GRÜNE
• ◼ AfD
• won constituency seat and ◼ party with the highest second vote share in the constituencys 2016
50 |
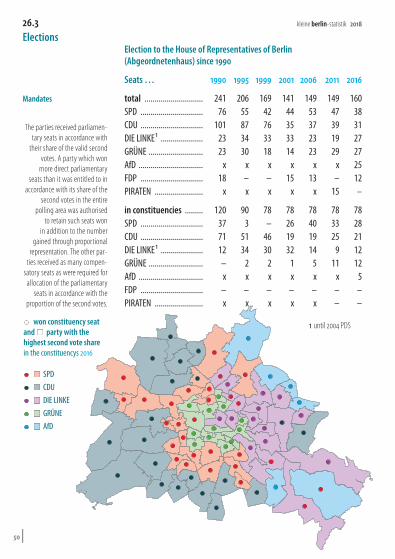
kleine berlin-statistik 201826.3 Elections
Election to the House of Representatives of Berlin (Abgeordnetenhaus) since 1990
Seats … 1990 1995 1999 2001 2006 2011 2016
Mandates total ............................. 241 206 169 141 149 149 160SPD ............................... 76 55 42 44 53 47 38
The parties received parliamen- tary seats in accordance with
their share of the valid second votes. A party which won
more direct parliamentary seats than it was entitled to in
accordance with its share of the second votes in the entire
polling area was authorised to retain such seats won
in addition to the number gained through proportional
representation. The other par- ties received as many compen-
satory seats as were required for allocation of the parliamentary
seats in accordance with the proportion of the second votes.
CDU ............................... 101 87 76 35 37 39 31DIE LINKE¹ ..................... 23 34 33 33 23 19 27GRÜNE ........................... 23 30 18 14 23 29 27AfD ................................ x x x x x x 25FDP ............................... 18 – – 15 13 – 12PIRATEN ........................ x x x x x 15 –
in constituencies ......... 120 90 78 78 78 78 78SPD ............................... 37 3 – 26 40 33 28CDU ............................... 71 51 46 19 19 25 21DIE LINKE¹ ..................... 12 34 30 32 14 9 12GRÜNE ........................... – 2 2 1 5 11 12AfD ................................ x x x x x x 5FDP ............................... – – – – – – –PIRATEN ........................ x x x x x – –
1 until 2004 PDS

0 5 10 15 20 25 30 35 40 45 50 55
MitteFriedrichshain-Kreuzberg
PankowCharlottenburg-Wilmersdorf
SpandauSteglitz-Zehlendorf
Tempelhof-SchönebergNeukölln
Treptow-KöpenickMarzahn-Hellersdorf
LichtenbergReinickendorf
◼ SPD◼ CDU◼ GRÜNE◼ DIE LINKE◼ AfD◼ FDP◼ PIRATEN◼ Die PARTEI
| 51
kleine berlin-statistik 2018 26.4 Elections
Election to the Borough Assemblies (Bezirksverordnetenversammlungen) on 18 September 2016
Boroughs Total SPD CDU GRÜNEDIE
LINKE AfD FDPPIRA TEN
- Die
PAR TEI
-
Mitte ................ 55 14 7 14 10 5 3 2 x Allocation of seatsFriedrichshain-
Kreuzberg ......... 55 10 4 20 12 3 2 2 2Pankow ............ 55 12 8 12 13 8 2 – –Charlottenburg- Wilmersdorf ..... 55 15 13 12 4 5 6 – –Spandau ........... 55 20 16 4 3 9 3 – –Steglitz- Zehlendorf ....... 55 13 17 11 3 6 5 – xTempelhof- Schöneberg ...... 55 15 12 13 5 6 4 – –Neukölln .......... 55 19 10 9 7 8 2 – –Treptow- Köpenick .......... 55 15 7 5 14 12 2 – –Marzahn- Hellersdorf ....... 55 11 11 2 16 15 – – x A total of
55 representatives were selected in the elections for the Borough Assemblies.
Lichtenberg ...... 55 13 7 5 18 12 – – xReinickendorf ... 55 13 21 6 3 8 4 – –
Berlin .............. 660 170 133 113 108 97 33 4 2

SPDCDUG RÜNEDIE LINKESPDCDUG RÜNEDIE LINKE
77 76
8685
848281
79
80
7875
83
5
10
15
20
25
30
35
0
% CDUDIE
LINKE SPD GRÜNE AfD FDP Others
won constituency seats • and party with the highest second vote share
in the constituencys
second vote 2017 ◼ 2013 ━
52 |
kleine berlin-statistik 201826.5 Elections
Election to the German Parliament (Deutscher Bundestag) on 24 September 2017 in Berlin
Constituency Turn-
out CDUDIE
LINKE SPD GRÜNE AfD FDPOth-
ers
second vote in percent
75 Mitte ................................. 73.2 18.6 21.5 17.9 17.2 8.2 8.7 7.876 Pankow ............................. 79.5 19.8 23.5 15.6 14.3 12.5 6.6 7.777 Reinickendorf .................... 75.2 31.0 8.5 20.0 9.1 13.7 11.4 6.278 Spandau –
Charlottenburg Nord ......... 72.0 28.1 9.8 22.7 8.5 14.1 9.9 6.979 Steglitz-Zehlendorf ........... 81.7 29.8 9.1 19.2 14.2 8.8 14.2 4.780 Charlottenburg-
Wilmersdorf ...................... 79.5 25.6 11.7 19.4 15.8 7.9 14.9 4.781 Tempelhof-Schöneberg ..... 77.0 25.0 13.2 20.2 15.6 9.6 10.4 6.1
In Berlin, around
2.5 million eligible citizens
were eligible to vote in 12 constitu-
encys.
82 Neukölln ........................... 70.8 22.3 18.2 19.5 13.0 11.2 7.7 8.083 Friedrichshain-Kreuzberg –
Prenzlauer Berg Ost ........... 77.6 13.9 28.5 15.9 20.4 6.3 5.9 8.984 Treptow-Köpenick ............. 76.6 20.2 25.1 15.5 7.8 16.9 6.5 7.985 Marzahn-Hellersdorf ......... 69.3 20.9 26.1 14.5 4.1 21.6 5.3 7.586 Lichtenberg ....................... 72.6 18.5 29.3 14.9 6.7 16.7 5.3 8.6
Berlin ............................... 75.6 22.7 18.8 17.9 12.6 12.0 8.9 7.1
Seats (28) .......................... x 6 6 5 4 4 3 –Direct seats (12) ................. x 4 4 3 1 – – –List seats (16) .................... x 2 2 2 3 4 3 –

5
10
15
20
25
30
35
40
45
00
1990 1994 1998 2002 2005 2009 2013 2017%
◼ CDU◼ DIE LINKE◼ SPD◼ GRÜNE◼ AfD◼ FDP◼ Others
| 53
kleine berlin-statistik 2018 26.6 Elections
Election to the German Parliament (Deutscher Bundestag) 1990 – 2017 in Berlin
1990 1994 1998 2002 2005 2009 2013 2017
Turnout ......... 80.6 78.6 81.1 77.6 77.4 70.9 72.5 75.6 second vote in percentPostal voters .. 9.3 14.6 19.5 23.6 22.0 26.5 28.0 33.4
CDU ............... 39.4 31.4 23.7 25.9 22.0 22.8 28.5 22.7DIE LINKE¹ ..... 9.7 14.8 13.4 11.4 16.4 20.2 18.5 18.8SPD ............... 30.6 34.0 37.8 36.6 34.3 20.2 24.6 17.9GRÜNE ........... 7.2 10.2 11.3 14.6 13.7 17.4 12.3 12.6AfD ................ x x x x x x 4.9 12.0FDP ............... 9.1 5.2 4.9 6.6 8.2 11.5 3.6 8.9Others ........... 3.9 4.4 8.8 4.9 5.4 7.9 7.7 7.1
1 until 2004 PDS
1 2 3 4
5 6 7 8
12 03
1110
090807
06
04
05
01
02
5
10
15
20
25
30
35
0
% SPD CDU GRÜNEDIE
LINKE AfDPIRA-TEN FDP Others
Party with the highest vote share in the Boroughs
vote 2014 ◼ 2009 ━
54 |
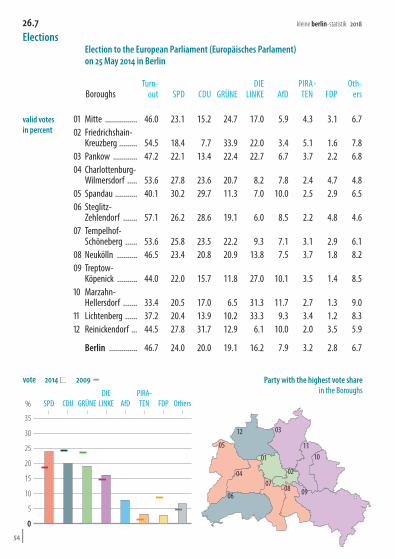
kleine berlin-statistik 201826.7 Elections
Election to the European Parliament (Europäisches Parlament) on 25 May 2014 in Berlin
BoroughsTurn-
out SPD CDU GRÜNEDIE
LINKE AfDPIRA TEN
- FDP
Oth-ers
valid votes in percent
01 Mitte ................ 46.0 23.1 15.2 24.7 17.0 5.9 4.3 3.1 6.702 Friedrichshain-
Kreuzberg ......... 54.5 18.4 7.7 33.9 22.0 3.4 5.1 1.6 7.803 Pankow ............ 47.2 22.1 13.4 22.4 22.7 6.7 3.7 2.2 6.804 Charlottenburg-
Wilmersdorf ..... 53.6 27.8 23.6 20.7 8.2 7.8 2.4 4.7 4.805 Spandau ........... 40.1 30.2 29.7 11.3 7.0 10.0 2.5 2.9 6.506 Steglitz-
Zehlendorf ....... 57.1 26.2 28.6 19.1 6.0 8.5 2.2 4.8 4.607 Tempelhof-
Schöneberg ...... 53.6 25.8 23.5 22.2 9.3 7.1 3.1 2.9 6.108 Neukölln .......... 46.5 23.4 20.8 20.9 13.8 7.5 3.7 1.8 8.209 Treptow-
Köpenick .......... 44.0 22.0 15.7 11.8 27.0 10.1 3.5 1.4 8.510 Marzahn-
Hellersdorf ....... 33.4 20.5 17.0 6.5 31.3 11.7 2.7 1.3 9.011 Lichtenberg ...... 37.2 20.4 13.9 10.2 33.3 9.3 3.4 1.2 8.312 Reinickendorf ... 44.5 27.8 31.7 12.9 6.1 10.0 2.0 3.5 5.9
Berlin .............. 46.7 24.0 20.0 19.1 16.2 7.9 3.2 2.8 6.7
5
10
15
20
25
30
35
40
45
00
1994 1999 2004 2009 2014%
◼ SPD◼ CDU◼ GRÜNE◼ DIE LINKE◼ AfD◼ PIRATEN◼ FDP◼ Others
| 55
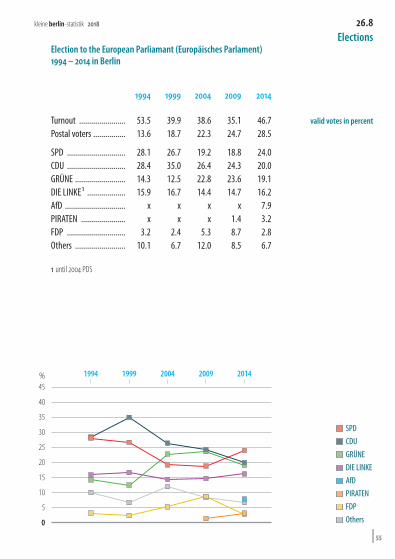
kleine berlin-statistik 2018 26.8 Elections
Election to the European Parliamant (Europäisches Parlament) 1994 – 2014 in Berlin
1994 1999 2004 2009 2014
Turnout ....................... 53.5 39.9 38.6 35.1 46.7 valid votes in percentPostal voters ................ 13.6 18.7 22.3 24.7 28.5
SPD ............................. 28.1 26.7 19.2 18.8 24.0CDU ............................. 28.4 35.0 26.4 24.3 20.0GRÜNE ......................... 14.3 12.5 22.8 23.6 19.1DIE LINKE¹ ................... 15.9 16.7 14.4 14.7 16.2AfD .............................. x x x x 7.9PIRATEN ...................... x x x 1.4 3.2FDP ............................. 3.2 2.4 5.3 8.7 2.8Others ......................... 10.1 6.7 12.0 8.5 6.7
1 until 2004 PDS
26.7 Elections
Election to the European Parliament (Europäisches Parlament) on 25 May 2014 in Berlin
BoroughsTurn-
out SPD CDU GRÜNEDIE
LINKE AfDPIRA TEN
- FDP
Oth-ers
valid votes in percent
01 Mitte ................ 46.0 23.1 15.2 24.7 17.0 5.9 4.3 3.1 6.702 Friedrichshain-
Kreuzberg ......... 54.5 18.4 7.7 33.9 22.0 3.4 5.1 1.6 7.803 Pankow ............ 47.2 22.1 13.4 22.4 22.7 6.7 3.7 2.2 6.804 Charlottenburg-
Wilmersdorf ..... 53.6 27.8 23.6 20.7 8.2 7.8 2.4 4.7 4.805 Spandau ........... 40.1 30.2 29.7 11.3 7.0 10.0 2.5 2.9 6.506 Steglitz-
Zehlendorf ....... 57.1 26.2 28.6 19.1 6.0 8.5 2.2 4.8 4.607 Tempelhof-
Schöneberg ...... 53.6 25.8 23.5 22.2 9.3 7.1 3.1 2.9 6.108 Neukölln .......... 46.5 23.4 20.8 20.9 13.8 7.5 3.7 1.8 8.209 Treptow-
Köpenick .......... 44.0 22.0 15.7 11.8 27.0 10.1 3.5 1.4 8.510 Marzahn-
Hellersdorf ....... 33.4 20.5 17.0 6.5 31.3 11.7 2.7 1.3 9.011 Lichtenberg ...... 37.2 20.4 13.9 10.2 33.3 9.3 3.4 1.2 8.312 Reinickendorf ... 44.5 27.8 31.7 12.9 6.1 10.0 2.0 3.5 5.9
Berlin .............. 46.7 24.0 20.0 19.1 16.2 7.9 3.2 2.8 6.7

56 |
kleine berlin-statistik 201827 The Boroughs of Berlin 2017
Unit Mitte
Friedrichs hain
Kreuz berg
- – -
Pankow
Char lotten
burg Wilmers
dorf
- - – -
Spandau
Steglitz Zehlen
dorf
– -
Tem-pelhof
Schöne berg
– -
NeuköllnTreptow
Köpenick
–
Marzahn Hellers
dorf
– - Lichten
berg
-
Rei nicken
dorf
- -
Berlin
1 For Boroughs results of estimation
2 per 1000 inhabitants, based on the average population; no estimates available for the boroughs
3 Across the respective boundaries
4 At general education schools
5 Dwelling units in resi-dential and non-resi-dential buildings, incl. halls of residence
6 Source: Microcensus7 As well as mining and
quarrying8 Establishments gener-
ally employing 20 or more employees
9 September10 As of 30 June; This data
has been anonymised by 5 rounding.
Area ..................................... km² 39 20 103 65 92 103 53 45 168 62 52 89 891
Population ¹ ......................... 1000 369.1 274.6 395.6 316.7 237.4 292.4 340.6 320.0 261.8 262.7 283.8 258.8 3,613.5Inhabitants/ha ..................... rate 94 135 38 49 26 29 64 71 16 42 54 29 40.6incl. female .......................... % 48 49 51 52 51 53 52 50 51 51 51 51 50.8incl. foreigners ..................... % 32 24 12 20 18 11 18 24 8 9 15 17 17.6Age in years 0 to 5 .......... % 6 7 7 5 6 5 6 6 6 7 7 6 6.2
7 to 14 .......... % 7 7 8 7 9 8 7 8 7 8 7 8 7.716 to 64 .......... % 74 76 70 65 63 60 66 68 64 65 66 62 66.965 and over ..... % 13 10 15 24 22 26 21 18 23 19 20 24 19.2
Live births ............................ rate² • • • • • • • • • • • • 11.2Deaths .................................. rate² • • • • • • • • • • • • 9.6Arrival³ ................................. rate² • • • • • • • • • • • • 49.6Departure³ ........................... rate² • • • • • • • • • • • • 40.2
Pupils⁴ ................................ number 32,193 24,884 38,113 31,370 24,630 35,014 30,455 29,084 23,865 24,756 26,981 29,904 351,249incl. foreigners ..................... % 26.7 13.9 7.5 19.3 18.4 11.4 15.5 20.7 6.8 11.8 16.1 15.9 15.3
Dwelling units⁵ .................. 1000 196.5 152.0 215.7 184.7 119.0 157.5 181.5 163.5 140.8 136.5 153.4 131.1 1,932.3
Day care centres ................. number 298 273 355 243 121 191 242 206 156 108 136 148 2,477Places ................................... number 19,295 15,066 23,086 11,474 9,863 12,256 14,809 13,913 11,838 12,108 14,332 10,293 168,333Cared children ...................... number 17,725 14,061 21,673 10,867 9,233 11,250 13,748 12,378 11,250 11,558 13,343 9,628 156,714Staff ..................................... number 3,811 3,060 4,500 2,473 1,889 2,403 3,019 2,694 2,372 2,241 2,765 2,078 33,305
Monthly median net household income⁶ ..... EUR 1,850 1,900 2,225 2,150 1,900 2,325 2,025 1,775 2,150 1,975 1,925 2,025 2,025
Manufacturing ⁷ ⁸Establishments⁹ ................... number 56 26 45 38 55 43 129 80 79 48 38 95 732Employees⁹ .......................... number 12,697 4,442 3,757 2,694 12,870 4,266 13,051 11,787 7,447 4,842 2,682 10,680 91,215
Public service employees by borough administration ¹⁰ number 2,635 1,940 2,330 1,915 1,640 1,910 1,840 1,865 1,795 1,665 1,895 1,545 22,975

| 57
kleine berlin-statistik 201827 The Boroughs of Berlin 2017
Unit Mitte
Friedrichs hain
Kreuz berg
- – -
Pankow
Char lotten
burg Wilmers
dorf
- - – -
Spandau
Steglitz Zehlen
dorf
– -
Tem-pelhof
Schöne berg
– -
NeuköllnTreptow
Köpenick
–
Marzahn Hellers
dorf
– - Lichten
berg
-
Rei nicken
dorf
- -
Berlin
1 For Boroughs results of estimation
2 per 1000 inhabitants, based on the average population; no estimates available for the boroughs
3 Across the respective boundaries
4 At general education schools
5 Dwelling units in resi-dential and non-resi-dential buildings, incl. halls of residence
6 Source: Microcensus7 As well as mining and
quarrying8 Establishments gener-
ally employing 20 or more employees
9 September10 As of 30 June; This data
has been anonymised by 5 rounding.
Area ..................................... km² 39 20 103 65 92 103 53 45 168 62 52 89 891
Population ¹ ......................... 1000 369.1 274.6 395.6 316.7 237.4 292.4 340.6 320.0 261.8 262.7 283.8 258.8 3,613.5Inhabitants/ha ..................... rate 94 135 38 49 26 29 64 71 16 42 54 29 40.6incl. female .......................... % 48 49 51 52 51 53 52 50 51 51 51 51 50.8incl. foreigners ..................... % 32 24 12 20 18 11 18 24 8 9 15 17 17.6Age in years 0 to 5 .......... % 6 7 7 5 6 5 6 6 6 7 7 6 6.2
7 to 14 .......... % 7 7 8 7 9 8 7 8 7 8 7 8 7.716 to 64 .......... % 74 76 70 65 63 60 66 68 64 65 66 62 66.965 and over ..... % 13 10 15 24 22 26 21 18 23 19 20 24 19.2
Live births ............................ rate² • • • • • • • • • • • • 11.2Deaths .................................. rate² • • • • • • • • • • • • 9.6Arrival³ ................................. rate² • • • • • • • • • • • • 49.6Departure³ ........................... rate² • • • • • • • • • • • • 40.2
Pupils⁴ ................................ number 32,193 24,884 38,113 31,370 24,630 35,014 30,455 29,084 23,865 24,756 26,981 29,904 351,249incl. foreigners ..................... % 26.7 13.9 7.5 19.3 18.4 11.4 15.5 20.7 6.8 11.8 16.1 15.9 15.3
Dwelling units⁵ .................. 1000 196.5 152.0 215.7 184.7 119.0 157.5 181.5 163.5 140.8 136.5 153.4 131.1 1,932.3
Day care centres ................. number 298 273 355 243 121 191 242 206 156 108 136 148 2,477Places ................................... number 19,295 15,066 23,086 11,474 9,863 12,256 14,809 13,913 11,838 12,108 14,332 10,293 168,333Cared children ...................... number 17,725 14,061 21,673 10,867 9,233 11,250 13,748 12,378 11,250 11,558 13,343 9,628 156,714Staff ..................................... number 3,811 3,060 4,500 2,473 1,889 2,403 3,019 2,694 2,372 2,241 2,765 2,078 33,305
Monthly median net household income⁶ ..... EUR 1,850 1,900 2,225 2,150 1,900 2,325 2,025 1,775 2,150 1,975 1,925 2,025 2,025
Manufacturing ⁷ ⁸Establishments⁹ ................... number 56 26 45 38 55 43 129 80 79 48 38 95 732Employees⁹ .......................... number 12,697 4,442 3,757 2,694 12,870 4,266 13,051 11,787 7,447 4,842 2,682 10,680 91,215
Public service employees by borough administration ¹⁰ number 2,635 1,940 2,330 1,915 1,640 1,910 1,840 1,865 1,795 1,665 1,895 1,545 22,975

58 |
kleine berlin-statistik 201828 Berlin 1871 to 2017
Greater-Berlin is a designa- tion for the city community or
unity community Berlin within the borders of the 1920 emerged
city area.
Old Berlin
Old Berlin
Old Berlin
Greater Berlin
Greater Berlin
West Berlin
West Berlin
East Berlin Berlin Berlin Berlin
Unit 1871 1895 1910 1925 1939 1950 1970 1970 1990 2000 2017
Area ................................................. km² 59 63 63 878 884 481 480 403 889 892 891
Population ¹ ..................................... 1000 878.2 1,627.2 2,050.4 4,032.0 4,332.7 2,138.8 2,122.3 1,083.7 3,420.2 3,382.2 3,613.5Live births ........................................ rate² 40.2 30.5 21.5 11.7 15.7 10.1 9.5 13.4 11.0 8.8 11.2Deaths .............................................. rate² 32.7 20.5 14.6 11.3 14.3 12.3 19.1 16.2 12.9 9.8 9.6Balance ............................................ rate² 7.5 10.0 6.9 0.4 1.4 – 2.2 – 9.6 – 2.8 – 1.9 -1.1 1.6Arrival .............................................. rate² 152.1 115.5 127.9 84.3 77.4 49.8 53.4 12.8 41.4 36.3 49.6Departure ......................................... rate² 115.7 113.2 127.8 60.8 73.4 31.9 49.2 5.7 33.8 36.5 40.2Balance ............................................ rate² 36.3 2.3 0.1 23.5 4.0 17.9 4.2 7.1 7.7 -0.3 9.3Population increase or decrease ....... rate² 43.8 12.3 7.0 23.9 5.4 15.7 – 5.4 2.3 5.1 -1.3 10.8
Marriages ........................................ rate² 13.5 10.5 10.6 8.7 14.1 9.1 7.9 8.2 6.4 4.2 3.5
Legal dissolution of marriage ....... rate² 0.5 0.7 1.0 1.9 2.9 4.4 3.0 3.1 2.3 2.8 1.7
Employed persons (workplace) ...... 1000 380.2 589.0 854.4 2,184.0 2,302.6 744.9 944.2 645.5 1,703.2³ 1,615.0 1,949.5⁴Agriculture, forestry and fishing ....... % 0.7 0.6 0.2 0.9 0.8 2.3 0.4 0.9 0.1 0.1 0.0Industry ........................................... % 59.5 58.7 60.8 51.2 48.4 44.4 43.2 36.6 26.6 17.8 11.4Service industries ............................. % 39.8 40.6 39.0 47.9 50.8 53.3 56.4 62.5 73.3 82.1 88.6
Dwellings ........................................ 1000 178.6 408.6 555.4 1,171.5 1,462.9 704.4 1,005.7 463.7 1,712.8 1,862.8 1,932.3rate² 203 251 271 291 338 329 474 428 501 551 541
Pupils⁵ ............................................. 1000 93.2 231.4 253.5 362.6 322.6 293.2 216.9 154.1 360.2 377.4 351.2Students (winter semester) ............. 1000 2.1 8.5 13.5 18.2 18.4 11.3 30.2 22.0 139.2 132.4 187.9
1 Annual averages: The data for population in the column 1871 are averages of the years 1871 to 1875, in the column 1895 average values of the years 1891 to 1895, and for West Berlin 1970 the result of the census.
2 per 1000 inhabitants3 Data for 1990 are from 19914 provisional data5 at schools of general education

| 59
kleine berlin-statistik 201828 Berlin 1871 to 2017
Greater-Berlin is a designa- tion for the city community or
unity community Berlin within the borders of the 1920 emerged
city area.
Old Berlin
Old Berlin
Old Berlin
Greater Berlin
Greater Berlin
West Berlin
West Berlin
East Berlin Berlin Berlin Berlin
Unit 1871 1895 1910 1925 1939 1950 1970 1970 1990 2000 2017
Area ................................................. km² 59 63 63 878 884 481 480 403 889 892 891
Population ¹ ..................................... 1000 878.2 1,627.2 2,050.4 4,032.0 4,332.7 2,138.8 2,122.3 1,083.7 3,420.2 3,382.2 3,613.5Live births ........................................ rate² 40.2 30.5 21.5 11.7 15.7 10.1 9.5 13.4 11.0 8.8 11.2Deaths .............................................. rate² 32.7 20.5 14.6 11.3 14.3 12.3 19.1 16.2 12.9 9.8 9.6Balance ............................................ rate² 7.5 10.0 6.9 0.4 1.4 – 2.2 – 9.6 – 2.8 – 1.9 -1.1 1.6Arrival .............................................. rate² 152.1 115.5 127.9 84.3 77.4 49.8 53.4 12.8 41.4 36.3 49.6Departure ......................................... rate² 115.7 113.2 127.8 60.8 73.4 31.9 49.2 5.7 33.8 36.5 40.2Balance ............................................ rate² 36.3 2.3 0.1 23.5 4.0 17.9 4.2 7.1 7.7 -0.3 9.3Population increase or decrease ....... rate² 43.8 12.3 7.0 23.9 5.4 15.7 – 5.4 2.3 5.1 -1.3 10.8
Marriages ........................................ rate² 13.5 10.5 10.6 8.7 14.1 9.1 7.9 8.2 6.4 4.2 3.5
Legal dissolution of marriage ....... rate² 0.5 0.7 1.0 1.9 2.9 4.4 3.0 3.1 2.3 2.8 1.7
Employed persons (workplace) ...... 1000 380.2 589.0 854.4 2,184.0 2,302.6 744.9 944.2 645.5 1,703.2³ 1,615.0 1,949.5⁴Agriculture, forestry and fishing ....... % 0.7 0.6 0.2 0.9 0.8 2.3 0.4 0.9 0.1 0.1 0.0Industry ........................................... % 59.5 58.7 60.8 51.2 48.4 44.4 43.2 36.6 26.6 17.8 11.4Service industries ............................. % 39.8 40.6 39.0 47.9 50.8 53.3 56.4 62.5 73.3 82.1 88.6
Dwellings ........................................ 1000 178.6 408.6 555.4 1,171.5 1,462.9 704.4 1,005.7 463.7 1,712.8 1,862.8 1,932.3rate² 203 251 271 291 338 329 474 428 501 551 541
Pupils⁵ ............................................. 1000 93.2 231.4 253.5 362.6 322.6 293.2 216.9 154.1 360.2 377.4 351.2Students (winter semester) ............. 1000 2.1 8.5 13.5 18.2 18.4 11.3 30.2 22.0 139.2 132.4 187.9
1 Annual averages: The data for population in the column 1871 are averages of the years 1871 to 1875, in the column 1895 average values of the years 1891 to 1895, and for West Berlin 1970 the result of the census.
2 per 1000 inhabitants3 Data for 1990 are from 19914 provisional data5 at schools of general education

60 |
kleine berlin-statistik 201829 The Region Berlin/Brandenburg 2017
Selected structural data for Berlin and
Brandenburg.
Unit BerlinBranden
burg-
Berlin Branden
burg
/ -
Area ...................................................... km² 891 29,654 30,545
Population ........................................... 1000 3,613.5 2,504.0 6,117.5incl. female ......................................... % 50.8 50.6 50.8
Foreigners ............................................. 1000 637.7 110.4 748.1incl. female ......................................... % 48.2 43.9 47.6
Population density ................................ per km² 4,055.0 84.4 200.3Age in years 0 to 5 ........................... % 6.2 5.2 5.8
6 to 14 .......................... % 7.7 7.8 7.715 to 64 ........................... % 66.9 62.9 65.365 and over ...................... % 19.2 24.1 21.2
Share among 18-year-old in the population .................................. % 16.3 15.5 16.0Share of foreigners in the population .... % 17.6 4.4 12.2
MarriageMarriages .............................................. rate¹ 3.5 5.7 4.4Divorces ................................................ rate¹ 1.7 1.8 1.7
Natural population changesLive Births ............................................. rate¹ 11.2 8.1 9.9Deaths ................................................... rate¹ 9.6 12.7 10.9
Migrations²Arrival ................................................... number 178,130 82,028 210,198Departure .............................................. number 144,597 61,301 155,938Balance ................................................. number 33,533 20,727 54,260
1 per 1000 inhabitants2 Across the boundary of the
region Berlin/Brandenburg, excl. migrations between Berlin and Brandenburg

| 61
kleine berlin-statistik 2018 29 The Region Berlin/Brandenburg 2017
Unit BerlinBranden
burg-
Berlin Branden
burg
/ -
Population³ .................................................. 1000 3,558.9 2,458.2 6,017.1… by labour force participationEconomically active population .................. 1000 1,925.1 1,298.4 3,223.5
Persons in employment ............................... % 93.0 95.5 94.0Unemployed persons .................................. % 7.0 4.5 6.0
Inactive population ...................................... 1000 1,633.8 1,159.8 2,793.6
Households, by size³Households ................................................... 1000 2,002.9 1,249.3 3,252.3Single-person households .............................. 1000 1,049.1 480.4 1,529.5Multi-person households ............................... 1000 953.9 768.9 1,722.8
with 2 persons ............................................. % 60.7 62.3 61.4with 3 persons ............................................. % 20.3 21.0 20.6with 4 persons ............................................. % 13.3 13.1 13.2with 5 and more persons ............................. % 5.7 3.6 4.8
Dwelling units .............................................. rate¹ 541 529 536Living floor space per dwelling ...................... m² 73 85 78
per inhabitant ........................... m² 45 40 42
EducationPupils, 2017/2018 school year⁴ ........................ number 439,705 286,082 725,787Students, winter semester 2017/2018 ............. number 187,934 49,442 237,376
Labour market⁵Unemployment rate⁶ ..................................... % 9.0 7.0 8.2Unemployed .................................................. number 168,991 92,648 261,639
viz. female .................................................. % 43.6 43.9 43.7foreign ......................................... % 30.3 9.1 22.8age from 15 to 24 years ................. % 8.1 6.8 7.7age from 55 to 64 years ................ % 16.1 25.6 19.5
3 Source: microcensus 6 Unemployed persons as % of the dependent labour force in civilian employment (national insurance contributors and marginally employed, civil servants and unemployed) as of 30 June on previous year.
4 At schools of general education and occupational schools (without schools of nurses, midwives etc)
5 Source: The Federal Employment Agency/yearly average
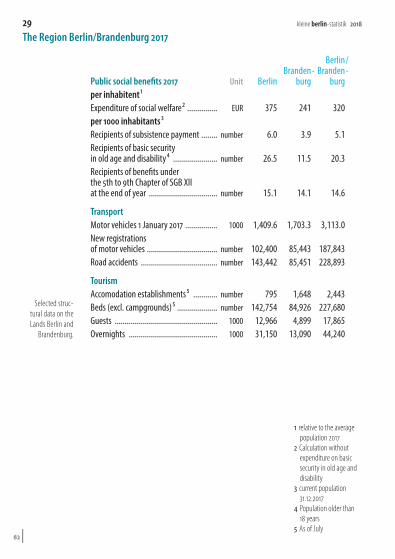
62 |
kleine berlin-statistik 201829 The Region Berlin/Brandenburg 2017
Selected struc-tural data on the Lands Berlin and
Brandenburg.
Public social benefits 2017 Unit BerlinBranden
burg-
Berlin Branden
burg
/ -
per inhabitent ¹Expenditure of social welfare² ............... EUR 375 241 320per 1000 inhabitants³Recipients of subsistence payment ........ number 6.0 3.9 5.1Recipients of basic security in old age and disability⁴ ...................... number 26.5 11.5 20.3Recipients of benefits under the 5th to 9th Chapter of SGB XII at the end of year .................................. number 15.1 14.1 14.6
TransportMotor vehicles 1 January 2017 ................ 1000 1,409.6 1,703.3 3,113.0New registrations of motor vehicles ................................... number 102,400 85,443 187,843Road accidents ...................................... number 143,442 85,451 228,893
TourismAccomodation establishments⁵ ............ number 795 1,648 2,443Beds (excl. campgrounds)⁵ .................... number 142,754 84,926 227,680Guests ................................................... 1000 12,966 4,899 17,865Overnights ............................................ 1000 31,150 13,090 44,240
1 relative to the average population 2017
2 Calculation without expenditure on basic security in old age and disability
3 current population 31.12.2017
4 Population older than 18 years
5 As of July
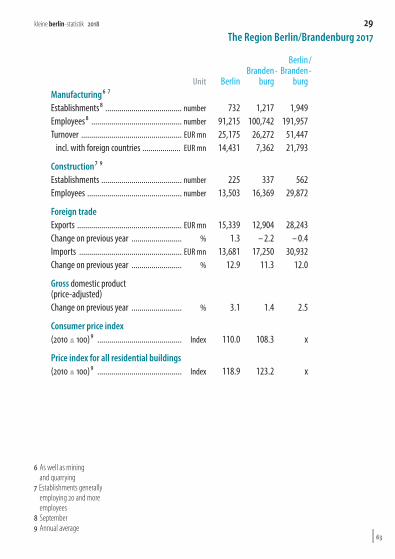
| 63
kleine berlin-statistik 2018 29 The Region Berlin/Brandenburg 2017
Unit BerlinBranden
burg-
Berlin Branden
burg
/ -
Manufacturing⁶ ⁷Establishments⁸ ...................................... number 732 1,217 1,949Employees⁸ ............................................. number 91,215 100,742 191,957Turnover .................................................. EUR mn 25,175 26,272 51,447
incl. with foreign countries ................... EUR mn 14,431 7,362 21,793
Construction ⁷ ⁹Establishments ........................................ number 225 337 562Employees ............................................... number 13,503 16,369 29,872
Foreign tradeExports .................................................... EUR mn 15,339 12,904 28,243Change on previous year ......................... % 1.3 -2.2 -0.4Imports ................................................... EUR mn 13,681 17,250 30,932Change on previous year ......................... % 12.9 11.3 12.0
Gross domestic product (price-adjusted)Change on previous year ......................... % 3.1 1.4 2.5
Consumer price index(2010 ≙ 100)⁹ .......................................... Index 110.0 108.3 x
Price index for all residential buildings(2010 ≙ 100)⁹ .......................................... Index 118.9 123.2 x
6 As well as mining and quarrying
7 Establishments generally employing 20 and more employees
8 September9 Annual average

89,112 ha city area 3.6 million inhabitants
1.9 million economically active population 26 thousand
asylum seekers 92.3 percent of children in age from 3 to under 6 years
in day care centres 2.0 million private households 188 thousand students
81 hospitals 35 thousand places in nursing homes 20.5 million air passengers 325 thousand
residential buildings 75.6 percent turnout in election to the German Parliament on 24.09.2017 110.0 index
of consumer prices based on 2010 15.3 billion EUR
exports 42,632 EUR compensation of employees per employee 25.2 billion EUR turnover in manufactur-
ing 136.6 billion EUR gross domestic prod-uct 45 thousand business registrations
13.0 million guests in Berlin 15.4 billion of tax revenues of the country
7,347 convicts for theft and embezzlement
kleine berlin-statistik