2019 california – baja california border crossing …
TRANSCRIPT
2019 CALIFORNIA – BAJA CALIFORNIA BORDER CROSSING AND
TRADE STATISTICS
May 1, 2020
2
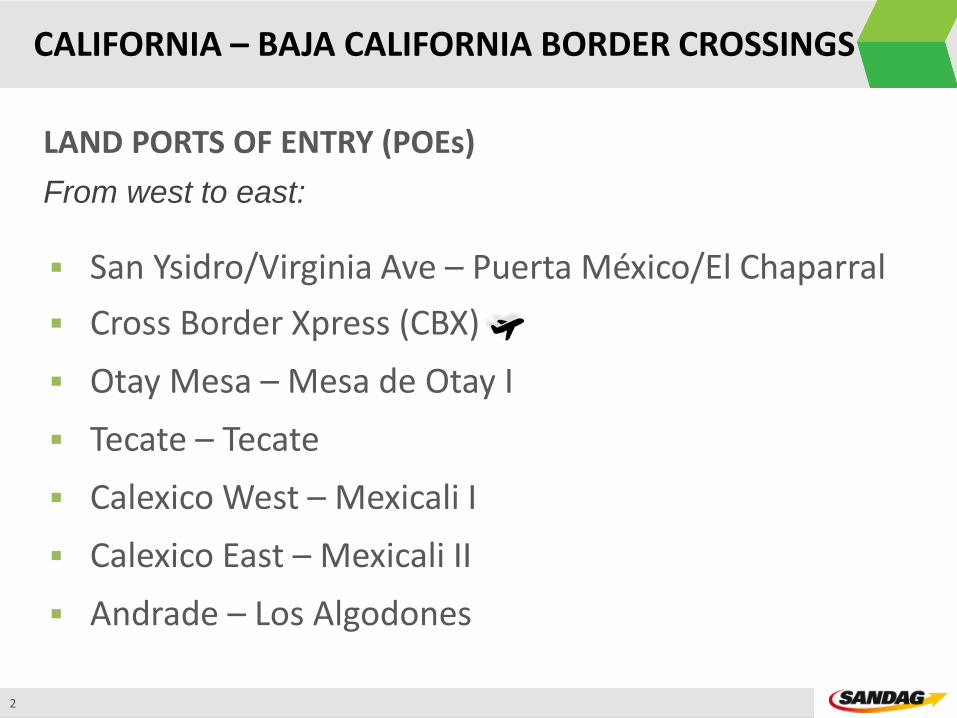
CALIFORNIA – BAJA CALIFORNIA BORDER CROSSINGS
LAND PORTS OF ENTRY (POEs)
▪ San Ysidro/Virginia Ave – Puerta México/El Chaparral
▪ Cross Border Xpress (CBX)
▪ Otay Mesa – Mesa de Otay I
▪ Tecate – Tecate
▪ Calexico West – Mexicali I
▪ Calexico East – Mexicali II
▪ Andrade – Los Algodones
From west to east:
3
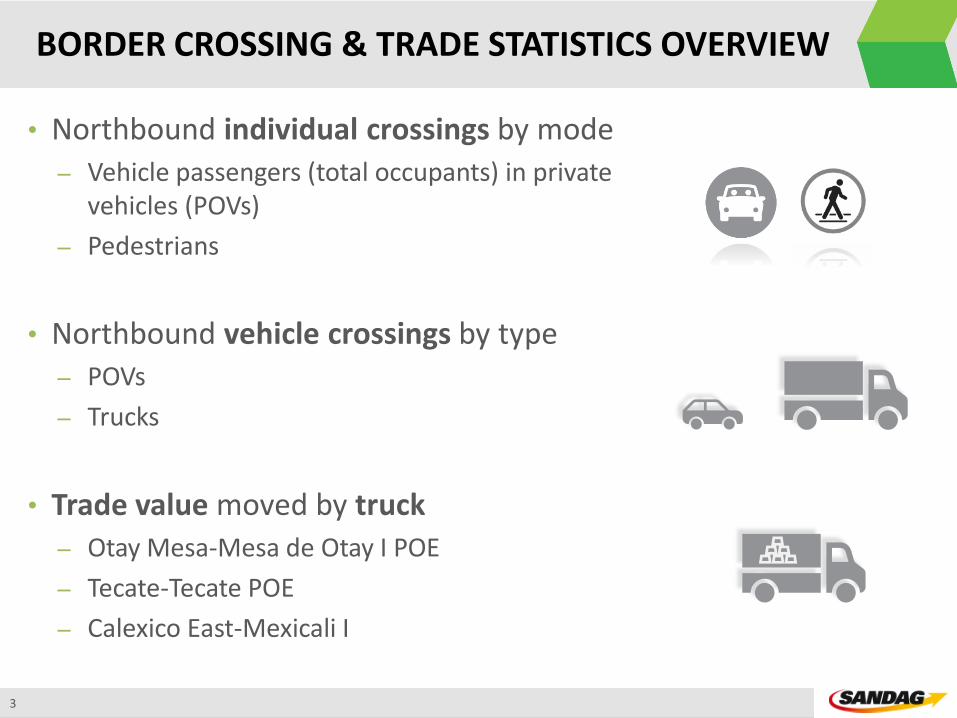
BORDER CROSSING & TRADE STATISTICS OVERVIEW
• Northbound individual crossings by mode
– Vehicle passengers (total occupants) in private vehicles (POVs)
– Pedestrians
• Northbound vehicle crossings by type
– POVs
– Trucks
• Trade value moved by truck
– Otay Mesa-Mesa de Otay I POE
– Tecate-Tecate POE
– Calexico East-Mexicali I
4
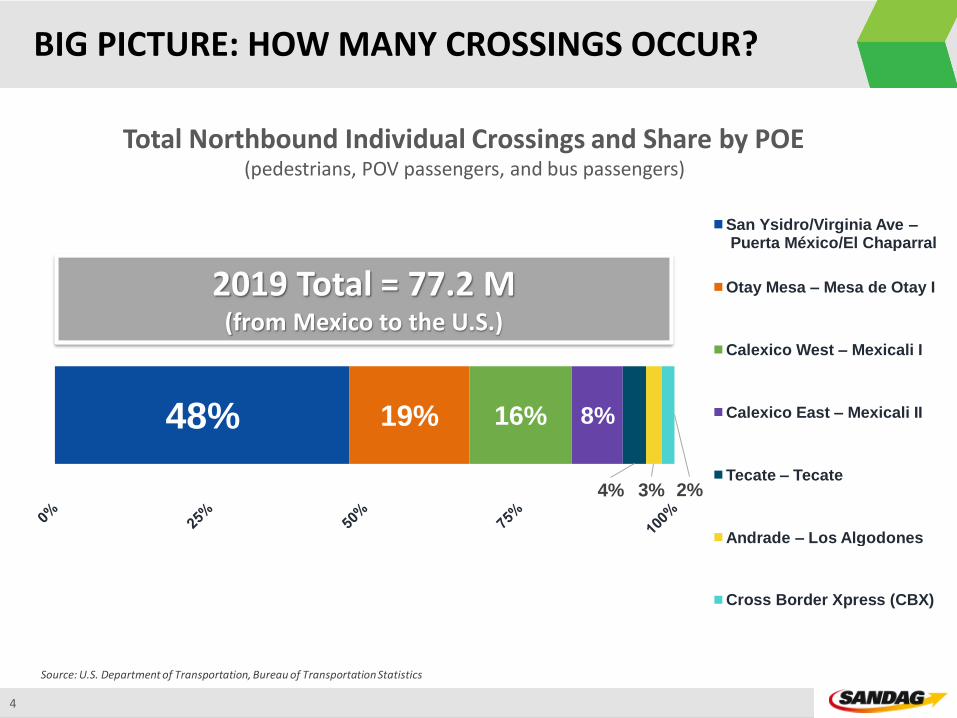
2019 Total = 77.2 M(from Mexico to the U.S.)
Total Northbound Individual Crossings and Share by POE (pedestrians, POV passengers, and bus passengers)
BIG PICTURE: HOW MANY CROSSINGS OCCUR?
Source: U.S. Department of Transportation, Bureau of Transportation Statistics
48% 19% 16% 8%
4% 3% 2%
San Ysidro/Virginia Ave –Puerta México/El Chaparral
Otay Mesa – Mesa de Otay I
Calexico West – Mexicali I
Calexico East – Mexicali II
Tecate – Tecate
Andrade – Los Algodones
Cross Border Xpress (CBX)
5
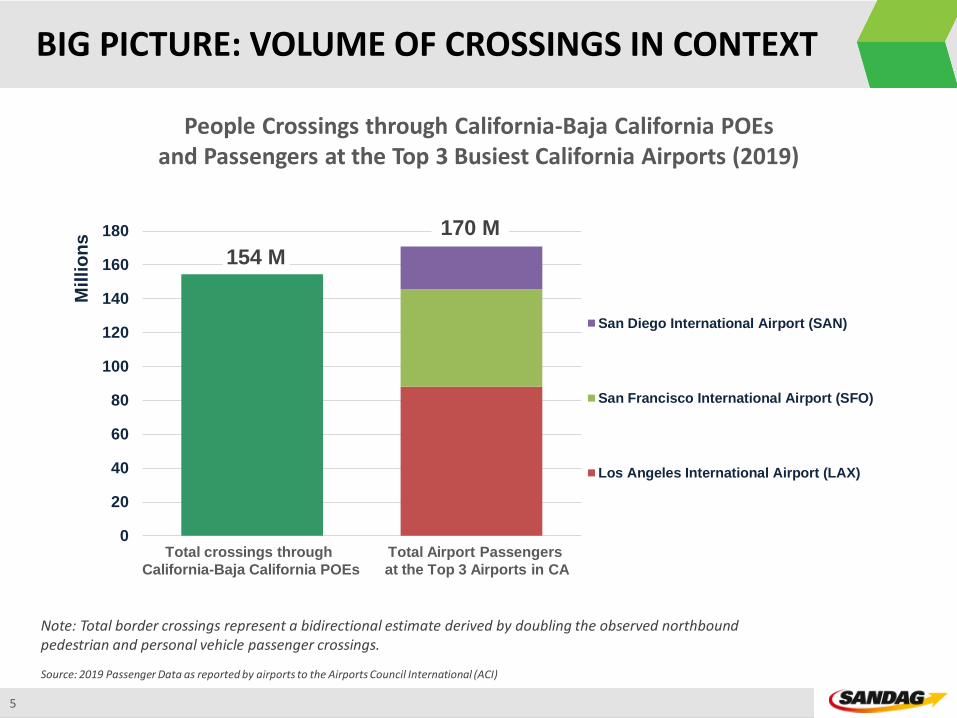
BIG PICTURE: VOLUME OF CROSSINGS IN CONTEXT
Source: 2019 Passenger Data as reported by airports to the Airports Council International (ACI)
154 M
0
20
40
60
80
100
120
140
160
180
Millio
ns
San Diego International Airport (SAN)
San Francisco International Airport (SFO)
Los Angeles International Airport (LAX)
Total crossings through
California-Baja California POEs
Total Airport Passengers
at the Top 3 Airports in CA
170 M
Note: Total border crossings represent a bidirectional estimate derived by doubling the observed northbound pedestrian and personal vehicle passenger crossings.
People Crossings through California-Baja California POEsand Passengers at the Top 3 Busiest California Airports (2019)
6
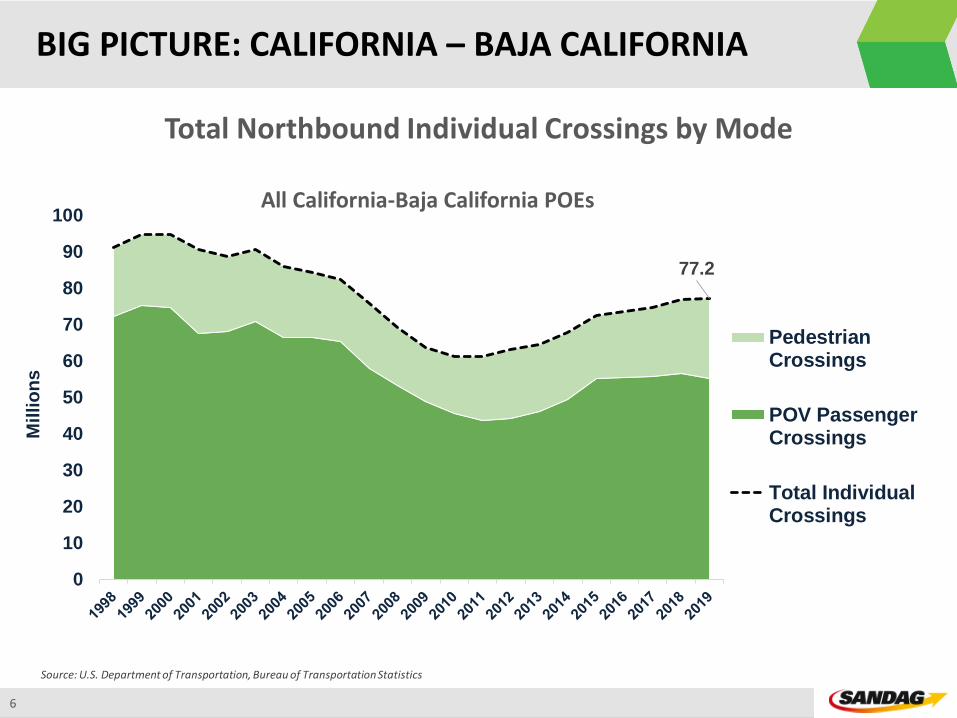
BIG PICTURE: CALIFORNIA – BAJA CALIFORNIA
Total Northbound Individual Crossings by Mode
77.2
0
10
20
30
40
50
60
70
80
90
100
Millio
ns
PedestrianCrossings
POV PassengerCrossings
Total IndividualCrossings
All California-Baja California POEs
Source: U.S. Department of Transportation, Bureau of Transportation Statistics
7
PedestrianCrossings
POV PassengerCrossings
Total IndividualCrossings
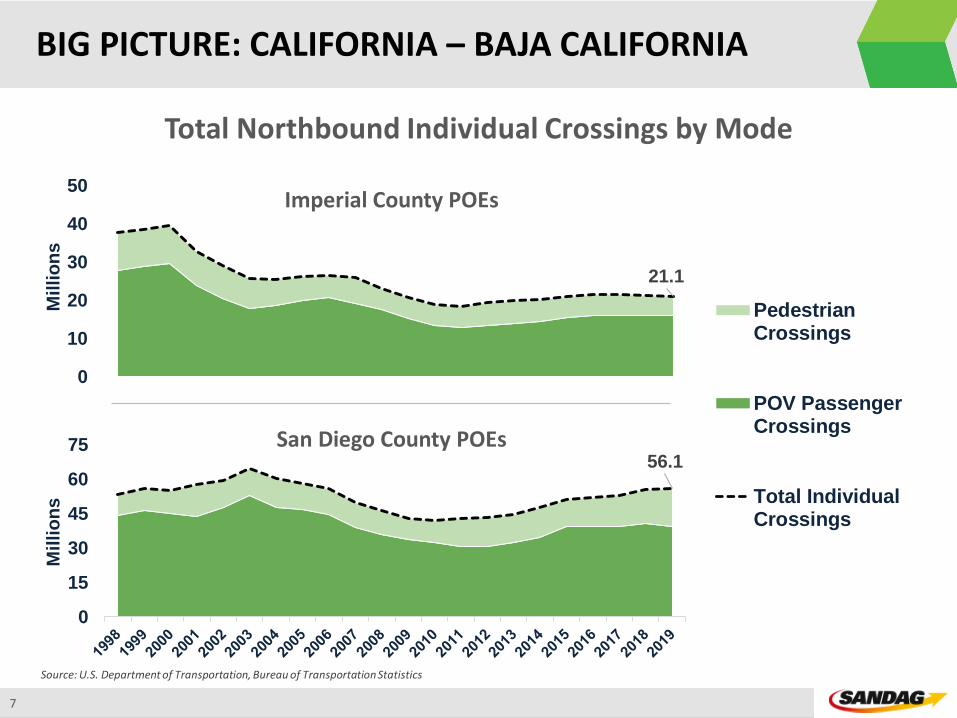
BIG PICTURE: CALIFORNIA – BAJA CALIFORNIA
Total Northbound Individual Crossings by Mode
21.1
0
10
20
30
40
50
Millio
ns
56.1
0
15
30
45
60
75
Millio
ns
Imperial County POEs
San Diego County POEs
Source: U.S. Department of Transportation, Bureau of Transportation Statistics
8
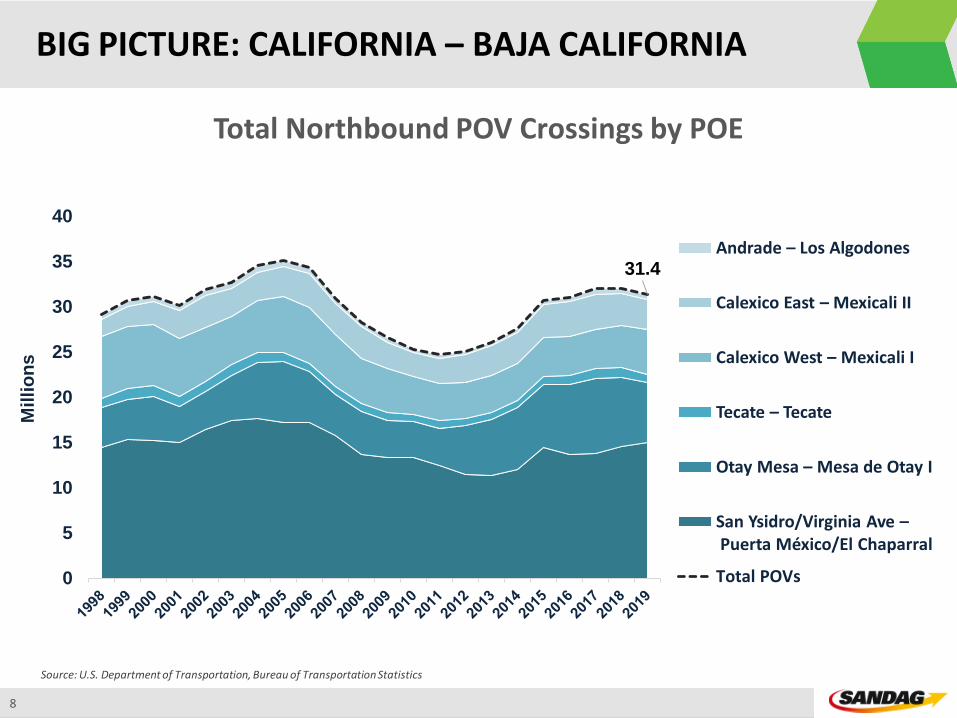
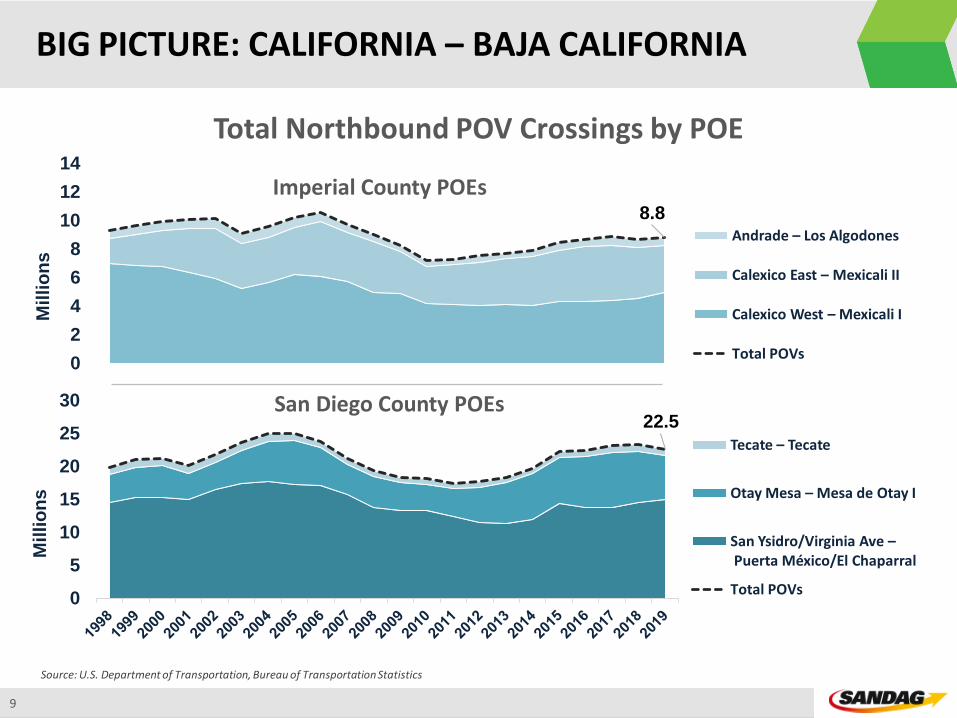
BIG PICTURE: CALIFORNIA – BAJA CALIFORNIA
Total Northbound POV Crossings by POE
Source: U.S. Department of Transportation, Bureau of Transportation Statistics
31.4
0
5
10
15
20
25
30
35
40
Millio
ns
Andrade – Los Algodones
Calexico East – Mexicali II
Calexico West – Mexicali I
Tecate – Tecate
Otay Mesa – Mesa de Otay I
San Ysidro/Virginia Ave –Puerta México/El Chaparral
Total POVs
9
22.5
0
5
10
15
20
25
30
Millio
ns
Tecate – Tecate
Otay Mesa – Mesa de Otay I
San Ysidro/Virginia Ave –Puerta México/El Chaparral
Total POVs
8.8
0
2
4
6
8
10
12
14
Millio
ns
Andrade – Los Algodones
Calexico East – Mexicali II
Calexico West – Mexicali I
Total POVs
BIG PICTURE: CALIFORNIA – BAJA CALIFORNIA
Total Northbound POV Crossings by POE
Source: U.S. Department of Transportation, Bureau of Transportation Statistics
Imperial County POEs
San Diego County POEs
10
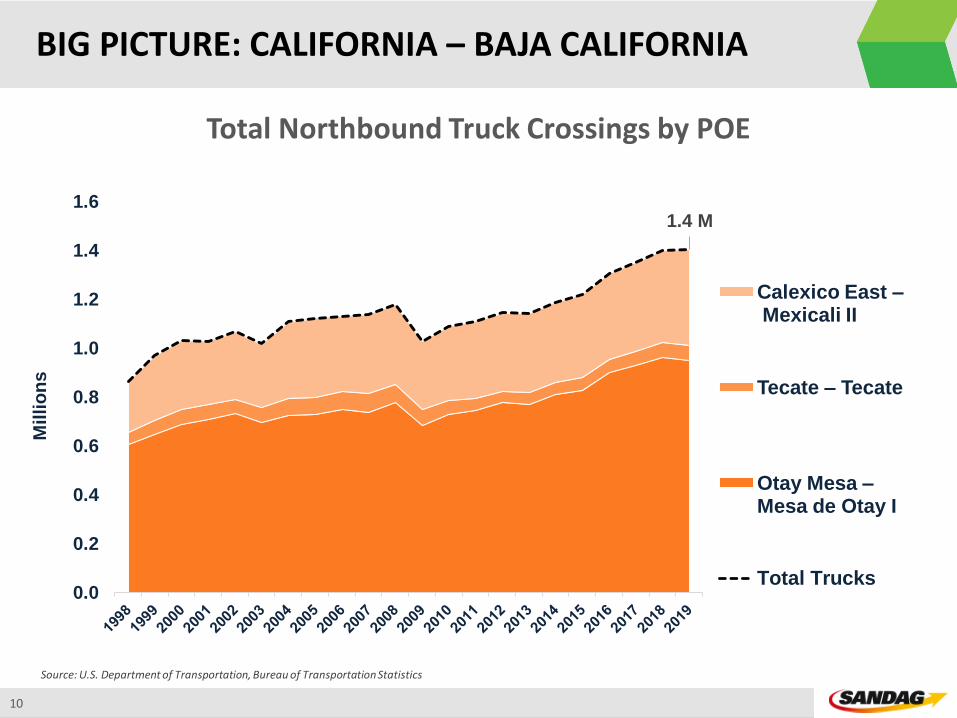
BIG PICTURE: CALIFORNIA – BAJA CALIFORNIA
Total Northbound Truck Crossings by POE
Source: U.S. Department of Transportation, Bureau of Transportation Statistics
1.4 M
0.0
0.2
0.4
0.6
0.8
1.0
1.2
1.4
1.6
Millio
ns
Calexico East –Mexicali II
Tecate – Tecate
Otay Mesa –Mesa de Otay I
Total Trucks
11
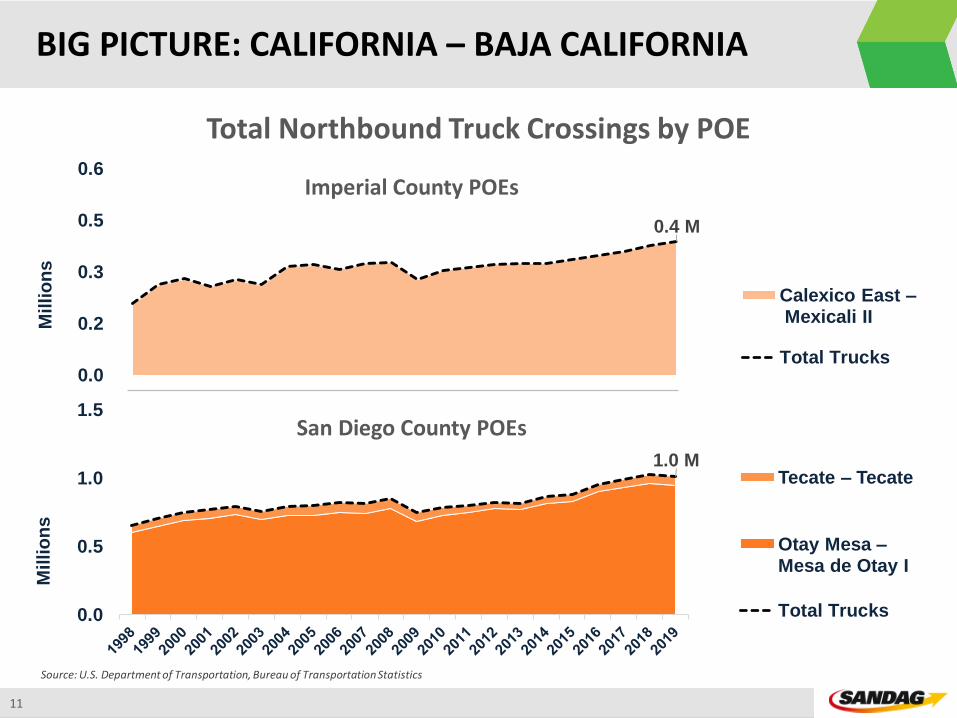
1.0 M
0.0
0.5
1.0
1.5
Millio
ns
Tecate – Tecate
Otay Mesa –Mesa de Otay I
Total Trucks
0.4 M
0.0
0.2
0.3
0.5
0.6
Millio
ns
Calexico East –Mexicali II
Total Trucks
BIG PICTURE: CALIFORNIA – BAJA CALIFORNIA
Total Northbound Truck Crossings by POE
Source: U.S. Department of Transportation, Bureau of Transportation Statistics
Imperial County POEs
San Diego County POEs
12
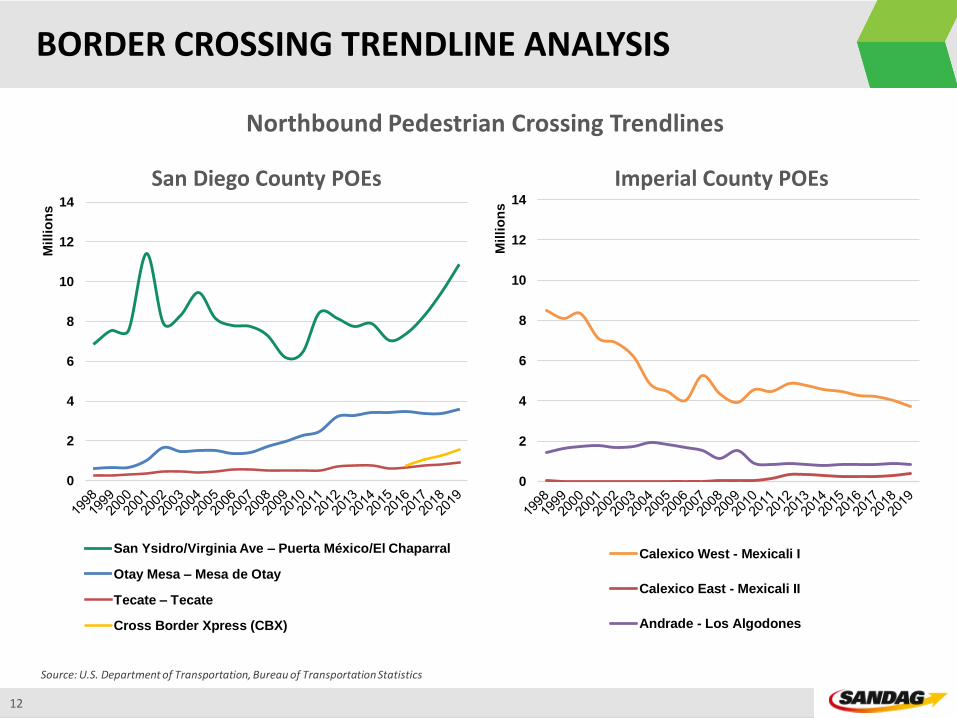
BORDER CROSSING TRENDLINE ANALYSIS
Northbound Pedestrian Crossing Trendlines
Source: U.S. Department of Transportation, Bureau of Transportation Statistics
0
2
4
6
8
10
12
14
Mil
lio
ns
Calexico West - Mexicali I
Calexico East - Mexicali II
Andrade - Los Algodones
Imperial County POEsSan Diego County POEs
0
2
4
6
8
10
12
14
Mil
lio
ns
San Ysidro/Virginia Ave – Puerta México/El Chaparral
Otay Mesa – Mesa de Otay
Tecate – Tecate
Cross Border Xpress (CBX)
13
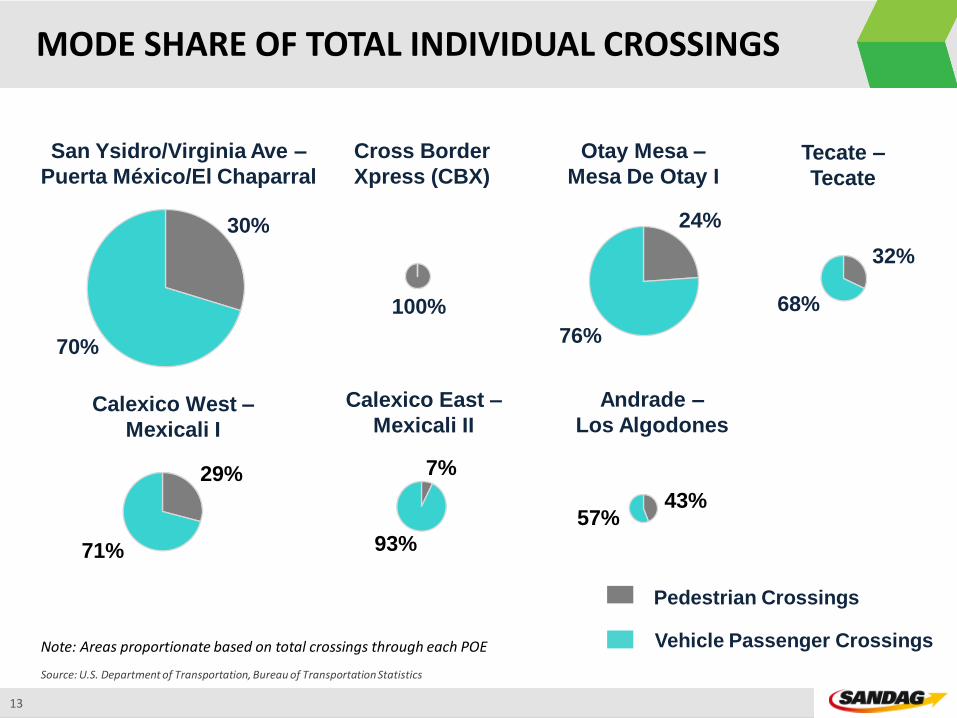
MODE SHARE OF TOTAL INDIVIDUAL CROSSINGS
Note: Areas proportionate based on total crossings through each POE
Source: U.S. Department of Transportation, Bureau of Transportation Statistics
San Ysidro/Virginia Ave –
Puerta México/El Chaparral
Calexico West –
Mexicali I
Cross Border
Xpress (CBX)
Calexico East –
Mexicali II
Otay Mesa –
Mesa De Otay I
Andrade –
Los Algodones
Tecate –
Tecate
Pedestrian Crossings
Vehicle Passenger Crossings
30%
70%
100%
24%
76%
32%
68%
29%
71%
7%
93%
43%57%
14
U.S. - MEXICO TRADE THROUGH THE CALIFORNIA – BAJA CALIFORNIA
BORDER (2019)
15
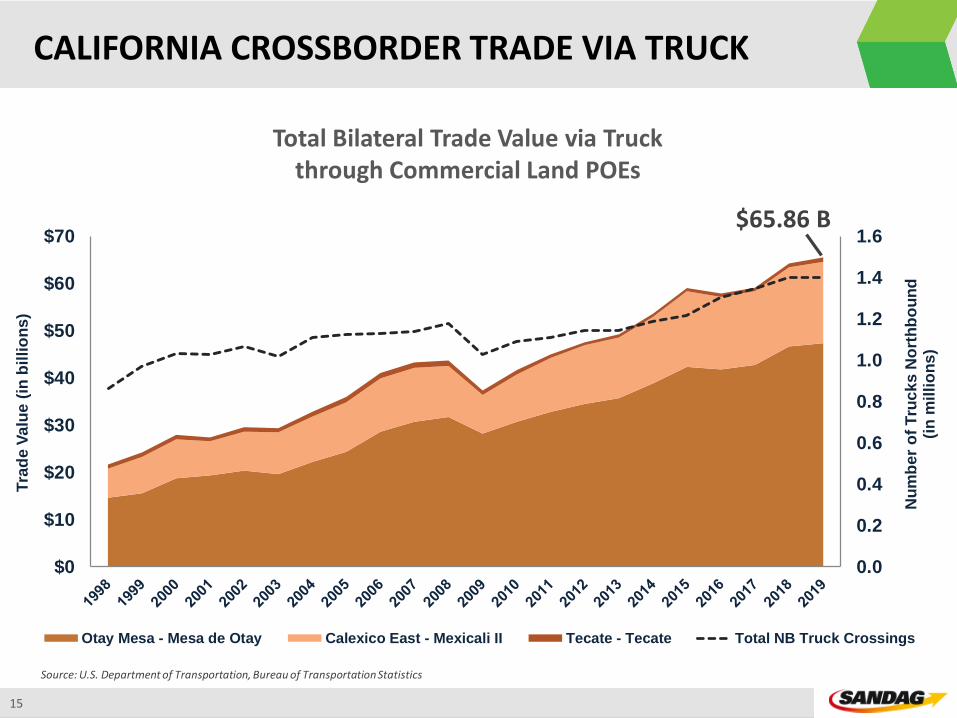
CALIFORNIA CROSSBORDER TRADE VIA TRUCK
Source: U.S. Department of Transportation, Bureau of Transportation Statistics
Total Bilateral Trade Value via Truck through Commercial Land POEs
0.0
0.2
0.4
0.6
0.8
1.0
1.2
1.4
1.6
$0
$10
$20
$30
$40
$50
$60
$70
Nu
mb
er
of
Tru
ck
s N
ort
hb
ou
nd
(in
mil
lio
ns
)
Tra
de
Va
lue
(in
bil
lio
ns
)
Otay Mesa - Mesa de Otay Calexico East - Mexicali II Tecate - Tecate Total NB Truck Crossings
$65.86 B
16
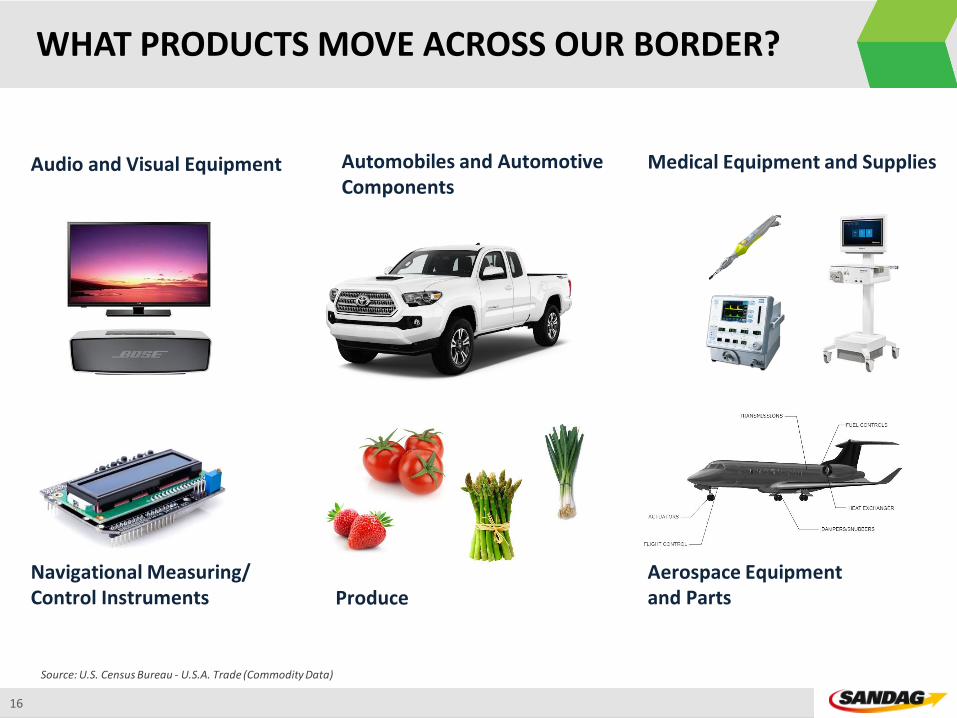
WHAT PRODUCTS MOVE ACROSS OUR BORDER?
Source: U.S. Census Bureau - U.S.A. Trade (Commodity Data)
Audio and Visual Equipment
Navigational Measuring/Control Instruments
Automobiles and Automotive Components
Medical Equipment and Supplies
ProduceAerospace Equipment and Parts
17
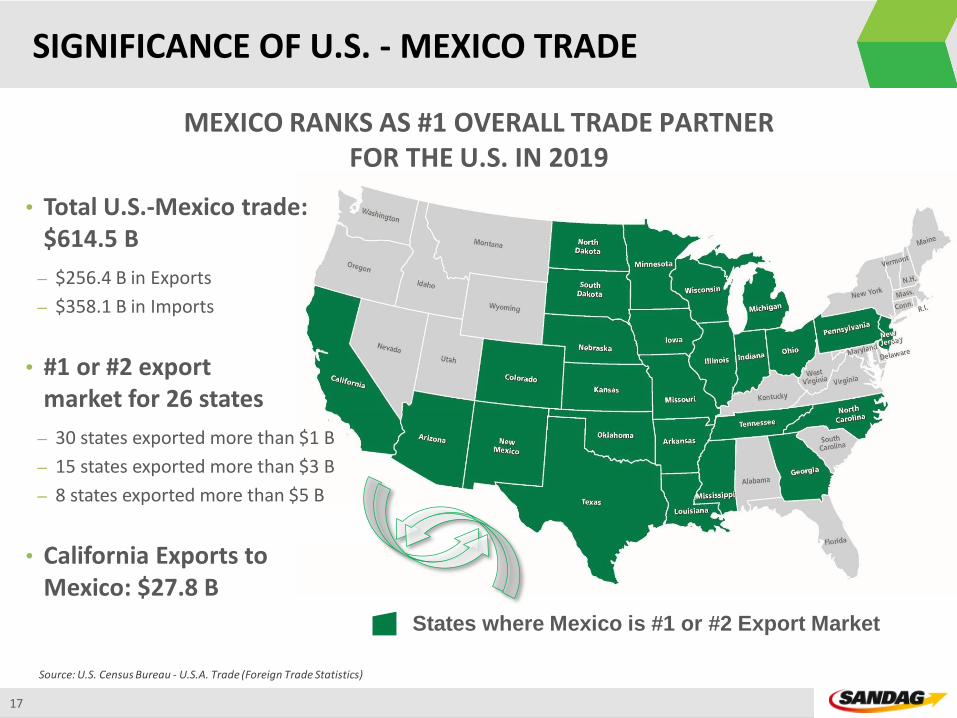
SIGNIFICANCE OF U.S. - MEXICO TRADE
• Total U.S.-Mexico trade: $614.5 B
– $256.4 B in Exports
– $358.1 B in Imports
• #1 or #2 export market for 26 states
– 30 states exported more than $1 B
– 15 states exported more than $3 B
– 8 states exported more than $5 B
• California Exports to Mexico: $27.8 B
MEXICO RANKS AS #1 OVERALL TRADE PARTNER FOR THE U.S. IN 2019
Source: U.S. Census Bureau - U.S.A. Trade (Foreign Trade Statistics)
States where Mexico is #1 or #2 Export Market