2019 non-alcoholic beverage trend analysis...refreshment beverages beverage alcohol traditional...
TRANSCRIPT

May 1, 2019
2019Non-Alcoholic Beverage
Trend Analysis

-2- Copyright © 2019 Beverage Marketing Corp.
Beverage Marketing Capabilities
All data in this presentation is supplied by:
-3- Copyright © 2019 Beverage Marketing Corp.
2019 Non-Alcoholic Beverage Trend Analysis
All data is Beverage Marketing Corporation data
Data compiled from industry surveys
Data measures all channels so provides a total market perspective
Most importantly… BMC data is
Hand-crafted Derived from artisanal numbers Completely organic and gluten-free!

-4- Copyright © 2019 Beverage Marketing Corp.
2019 Non-Alcoholic Beverage Trend Analysis
Market Overview
Category Updates
Projections
Agenda

-5- Copyright © 2019 Beverage Marketing Corp.
Beverage Headlines
State of the Industry – The Good and the Bad
Total U.S. beverage market grew for fifth consecutive year in 2018, and saw slightly accelerated growth over 2017
Carbonated soft drinks (CSDs) experienced improved performance in 2018 but declined slightly for the 14th consecutive year
Bottled water widened its gap over CSDs as the largest beverage category in the U.S., driven primarily by the single-serve PET segment
Niche categories continue to outperform traditional mass-market categories with exception of bottled water
Wine and spirits led alcohol growth in 2018, and beer volume dipped slightly once again
2019 Non-Alcoholic Beverage Trend Analysis

-6- Copyright © 2019 Beverage Marketing Corp.
People On The Move
Quincey becomes Coke CEO
NWNA names Fernando Mercé President and CEO
Indra Nooyi retires; Ramon Laguartanamed PepsiCo CEO
Welch's names Trevor Bynum new CEO
Bobby Chacko becomes Ocean Spray President and CEO
Keurig Dr Pepper named Bob Gamgort CEO
Boston Beer Company Names Dave BurwickPresident and CEO
Bill Newlands named president of Constellation Brands
Lawson Whiting becomes Brown Forman CEO
Maggie Timoneynamed Heineken USA CEO
2019 Non-Alcoholic Beverage Trend Analysis

-7- Copyright © 2019 Beverage Marketing Corp.
Acquisitions on the Rise
Keurig Buys DrPepper Snapple
Coke Buys Costa PepsiCo Buys SodaStream
KDP Buys Core Water
KDP Acquires Big Red
Coke Invests in BODYARMOR
2019 Non-Alcoholic Beverage Trend Analysis

-8- Copyright © 2019 Beverage Marketing Corp.
Source: Beverage Marketing Corporation; Bureau of Economic Analysis, Department of Commerce, Department of Labor
The economy continues to move in a positive direction with improved GDP growth and lower unemployment, a key to successful beverage market performance
Unemployment Rate
2000 – 2018
2017
2.8%
0.8%
3.1%
4.0%
-1.2%
4.0%
5.0%
2.3%2.0%
2.6%
2.0%
0.9%0.8%
1.4%
3.5%
1.9%
1.2%
3.1%3.2%
2.5%
2.2%
4.2%
3.5%
2.6%
Q1 Q2 Q3 Q4 Q1 Q2 Q3 Q4 Q1 Q2 Q3 Q4 Q1 Q2 Q3 Q4 Q1 Q2 Q3 Q4 Q1 Q2 Q3 Q4
2013 2014 2015 2016
4.0%
4.7%
5.8%6.0%
5.5%
5.1%
4.6% 4.6%
5.8%
9.3%
9.6%
9.0%
8.1%
7.4%
6.2%
5.3%
4.9% 4.4%
3.9%
'00 '01 '02 '03 '04 '05 '06 '07 '08 '09 '10 '11 '12 '13 '14 '15 '16 '17 18
Quarterly GDP Change
2013 – 2018
2018
2019 Non-Alcoholic Beverage Trend Analysis
-9- Copyright © 2019 Beverage Marketing Corp.
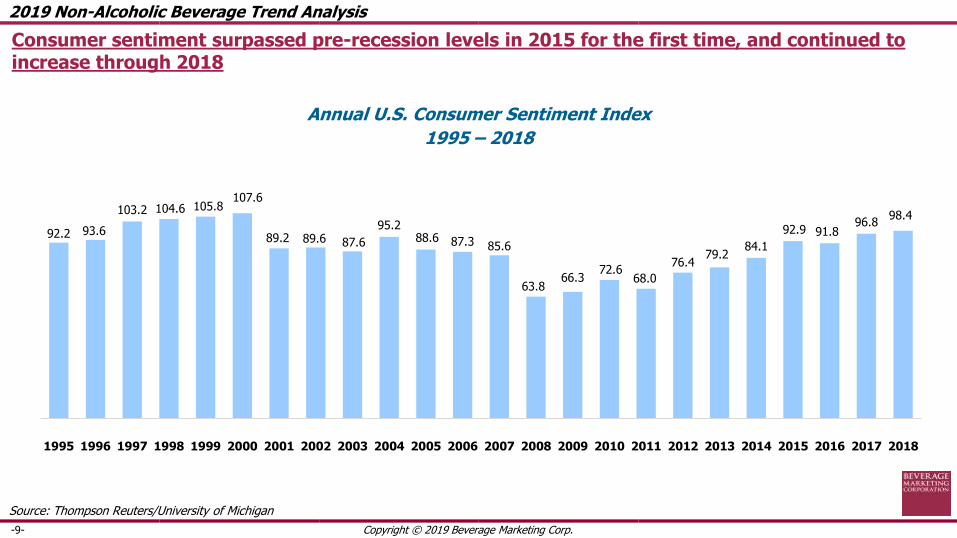
Annual U.S. Consumer Sentiment Index
1995 – 2018
Source: Thompson Reuters/University of Michigan
Consumer sentiment surpassed pre-recession levels in 2015 for the first time, and continued to increase through 2018
92.2 93.6
103.2 104.6 105.8107.6
89.2 89.6 87.6
95.288.6 87.3 85.6
63.866.3
72.668.0
76.479.2
84.1
92.9 91.896.8
98.4
1995 1996 1997 1998 1999 2000 2001 2002 2003 2004 2005 2006 2007 2008 2009 2010 2011 2012 2013 2014 2015 2016 2017 2018
2019 Non-Alcoholic Beverage Trend Analysis

-10- Copyright © 2019 Beverage Marketing Corp.
P: PreliminarySource: Beverage Marketing Corporation
-0.1%
1.1%
1.6%
2.0%
0.7%
1.1%
2013 2014 2015 2016 2017 2018P
U.S. Total Beverage MarketVolume Change2013 – 2018P
The U.S. beverage market grew volume for the fifth consecutive year in 2018, and experienced slightly accelerating growth
2019 Non-Alcoholic Beverage Trend Analysis

-11- Copyright © 2019 Beverage Marketing Corp.
P: PreliminarySource: Beverage Marketing Corporation
U.S. Total Beverage MarketChange in Volume and Wholesale Dollars
2013 – 2018P
Post-recession revenues have consistently outpaced volume growth in recent years, and did so once again in 2018; trends toward premiumization and packaging mix shifts have contributed
-0.1%
1.1%
1.6%
2.0%
0.7%
1.1%1.3%
1.8%
2.8%
2.3% 2.3%
1.4%
2.1% 2.2%
2013 2014 2015 2016 2017 2018P 13/18P CAGR
Volume Change Wholesale Dollar Change
2019 Non-Alcoholic Beverage Trend Analysis

-12- Copyright © 2019 Beverage Marketing Corp.
P: PreliminarySource: Beverage Marketing Corporation
Refreshment beverages have outperformed both traditional beverages and alcohol in recent years
U.S. Beverage MarketVolume Change2017 – 2018P
1.8%
-0.7%
-1.0%
1.7%
2.3%
-0.7% -0.6%
-1.1%
Refreshment Beverages Beverage Alcohol Traditional Beverages Tap Water
2017 2018P
• Bottled Water• CSD• Energy Drinks• Fruit Bevs• RTD Coffee• RTD Tea• Sports Drinks• VA Water
• Beer• Spirits• Wine
• Hot Coffee• Hot Tea• Milk
2019 Non-Alcoholic Beverage Trend Analysis

-13- Copyright © 2019 Beverage Marketing Corp.
U.S. Liquid Refreshment Beverage MarketVolume Change
2018P
Traditional mass market categories have continued to struggle while niche categories have experienced growth
• Bottled water is the primary exception of a mainstream category that has thrived
-0.6%-2.2%
18.3%
7.4% 7.2%
3.7%
-0.1%
5.0%
2.3%
CSDs Fruit Bevs Value AddedWaters
RTD Coffee EnergyDrinks
Sports Bevs RTD Tea BottledWater
TOTAL LRB
P: PreliminarySource: Beverage Marketing Corporation
2019 Non-Alcoholic Beverage Trend Analysis

-14- Copyright © 2019 Beverage Marketing Corp.
Among traditional beverages, only coffee continues to show growth thanks to the success of single-cup brewers, popularity of coffee cafes, and RTD innovations like cold-brew
-2.5%
-2.1%
1.1%
-0.6%
Tea Less RTD Milk Coffee Less RTD TOTAL TRADITIONAL
U.S. Traditional Beverage MarketVolume Change
2018P
P: PreliminarySource: Beverage Marketing Corporation
2019 Non-Alcoholic Beverage Trend Analysis

-15- Copyright © 2019 Beverage Marketing Corp.
P: PreliminarySource: Beverage Marketing Corporation
When tap water consumption declines, consumption of commercial beverages increases
• Tap water consumption declined only modestly in 2018
Estimated Tap WaterVolume Growth2000 – 2018P
-0.5%
-6.4%
-3.8%-5.0%
-9.0%-11.1%
-2.4%
22.6%
19.4%
1.4%
5.2%
-2.5%
6.0%
-0.2%
-4.3%
-9.2%
1.7%
-1.1%
'00/01 '01/02 '02/03 '03/04 '04/05 '05/06 '06/07 '07/08 '08/09 '09/10 '10/11 '11/12 '12/13 '13/14 '14/15 '15/16 '16/17 '17/18(P)
2019 Non-Alcoholic Beverage Trend Analysis
-16- Copyright © 2019 Beverage Marketing Corp.
P: PreliminarySource: Beverage Marketing Corporation
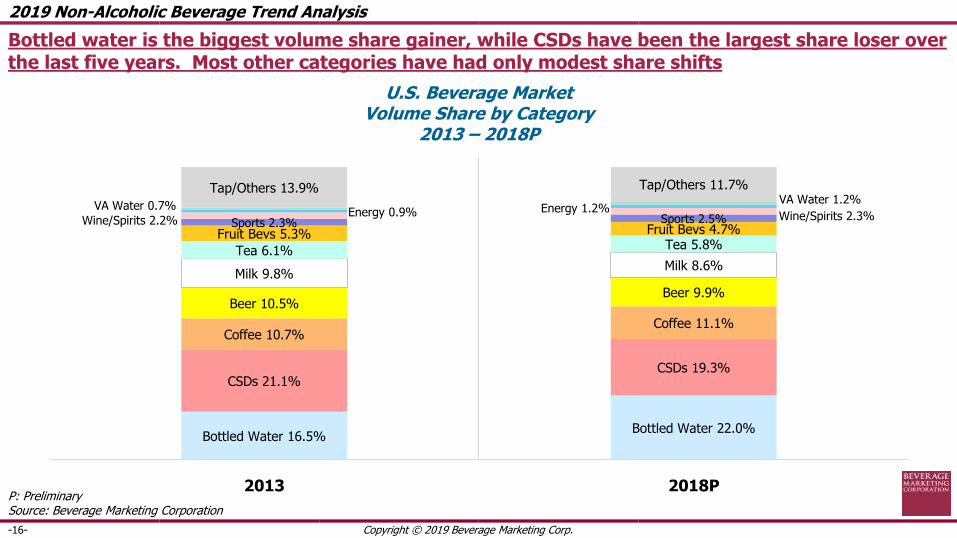
U.S. Beverage MarketVolume Share by Category
2013 – 2018P
Bottled water is the biggest volume share gainer, while CSDs have been the largest share loser over the last five years. Most other categories have had only modest share shifts
Bottled Water 16.5%Bottled Water 22.0%
CSDs 21.1%CSDs 19.3%
Coffee 10.7%Coffee 11.1%
Beer 10.5%Beer 9.9%
Milk 9.8%Milk 8.6%
Tea 6.1% Tea 5.8%Fruit Bevs 5.3% Fruit Bevs 4.7%
Sports 2.3% Sports 2.5%Wine/Spirits 2.2% Wine/Spirits 2.3%Energy 0.9% Energy 1.2%VA Water 0.7%VA Water 1.2%
Tap/Others 13.9% Tap/Others 11.7%
2013 2018P
2019 Non-Alcoholic Beverage Trend Analysis

-17- Copyright © 2019 Beverage Marketing Corp.
Decade Comparison 2008 – 2018P
Which Categories Gained, Which Lost Volume?
5.0%
3.4%
7.6%
2.1%
3.1%
10.9%
-2.3%
-1.5%
1.3%
Category Millions of Gallons 2008/18P CAGR
379
4,031
-2,014
-754
123
192
292
492
5,321
Total LRB
CSD
Fruit Beverages
RTD Coffee
Value-Added Water
Sports Drinks
Energy Drinks
RTD Tea
Bottled Water
Bottled water gained the most volume over the last 10 years while CSDs lost the most
P: PreliminarySource: Beverage Marketing Corporation
2019 Non-Alcoholic Beverage Trend Analysis
-18- Copyright © 2019 Beverage Marketing Corp.
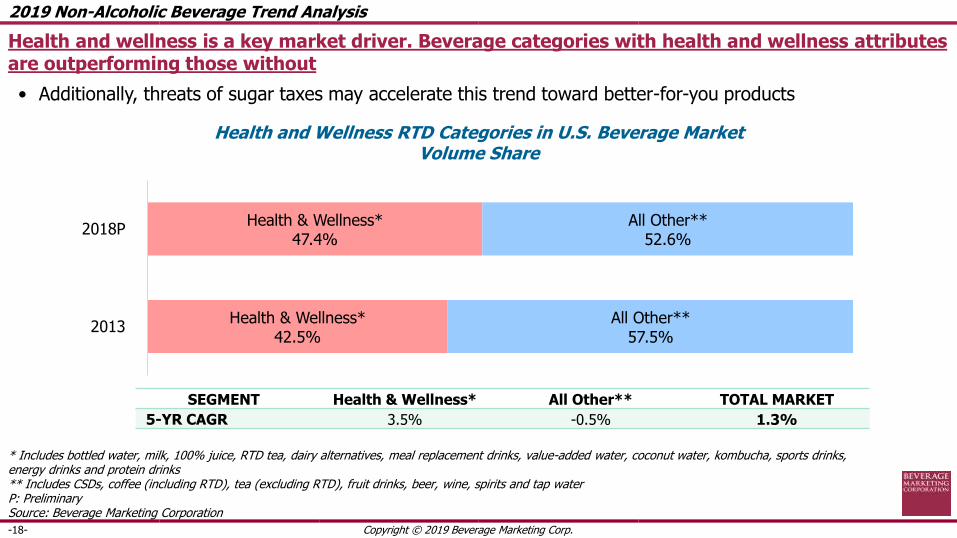
Health and Wellness RTD Categories in U.S. Beverage MarketVolume Share
Health and wellness is a key market driver. Beverage categories with health and wellness attributes are outperforming those without
• Additionally, threats of sugar taxes may accelerate this trend toward better-for-you products
* Includes bottled water, milk, 100% juice, RTD tea, dairy alternatives, meal replacement drinks, value-added water, coconut water, kombucha, sports drinks, energy drinks and protein drinks** Includes CSDs, coffee (including RTD), tea (excluding RTD), fruit drinks, beer, wine, spirits and tap water P: PreliminarySource: Beverage Marketing Corporation
2019 Non-Alcoholic Beverage Trend Analysis
Health & Wellness*42.5%
Health & Wellness*47.4%
All Other**57.5%
All Other**52.6%
2013
2018P
SEGMENT Health & Wellness* All Other** TOTAL MARKET
5-YR CAGR 3.5% -0.5% 1.3%
-19- Copyright © 2019 Beverage Marketing Corp.
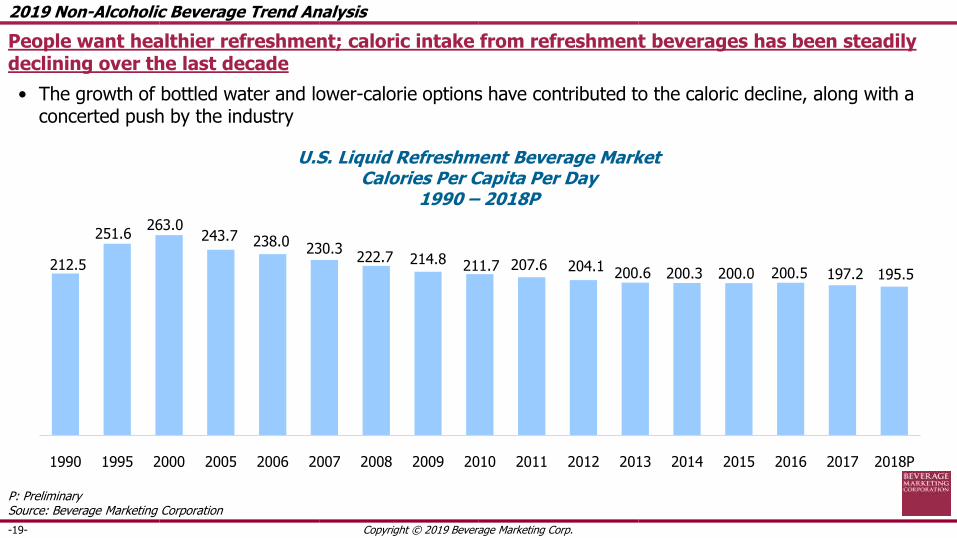
U.S. Liquid Refreshment Beverage MarketCalories Per Capita Per Day
1990 – 2018P
212.5
251.6263.0
243.7 238.0230.3
222.7 214.8 211.7 207.6 204.1 200.6 200.3 200.0 200.5 197.2 195.5
1990 1995 2000 2005 2006 2007 2008 2009 2010 2011 2012 2013 2014 2015 2016 2017 2018P
People want healthier refreshment; caloric intake from refreshment beverages has been steadily declining over the last decade
• The growth of bottled water and lower-calorie options have contributed to the caloric decline, along with a concerted push by the industry
P: PreliminarySource: Beverage Marketing Corporation
2019 Non-Alcoholic Beverage Trend Analysis
-20- Copyright © 2019 Beverage Marketing Corp.
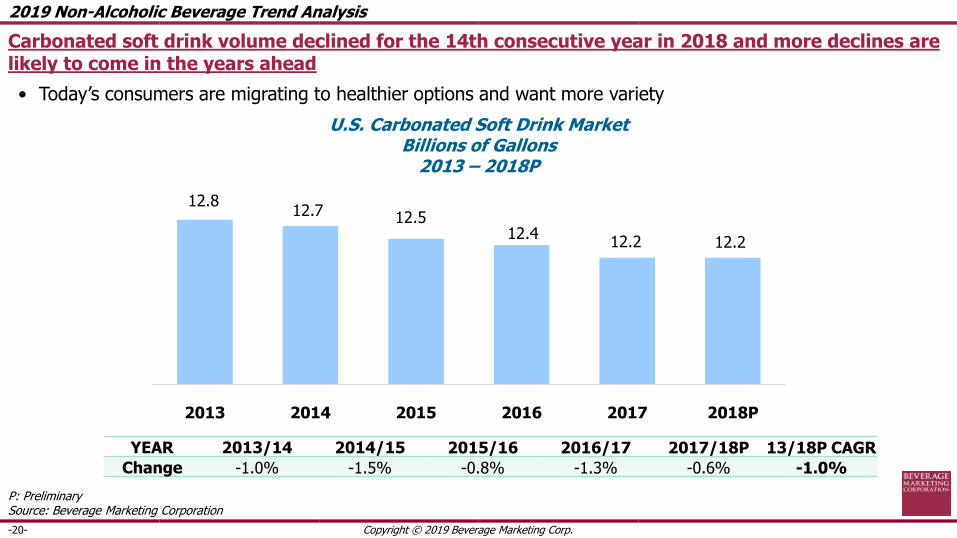
U.S. Carbonated Soft Drink MarketBillions of Gallons
2013 – 2018P
12.812.7 12.5
12.412.2 12.2
2013 2014 2015 2016 2017 2018P
YEAR 2013/14 2014/15 2015/16 2016/17 2017/18P 13/18P CAGR
Change -1.0% -1.5% -0.8% -1.3% -0.6% -1.0%
Carbonated soft drink volume declined for the 14th consecutive year in 2018 and more declines are likely to come in the years ahead
• Today’s consumers are migrating to healthier options and want more variety
P: PreliminarySource: Beverage Marketing Corporation
2019 Non-Alcoholic Beverage Trend Analysis
-21- Copyright © 2019 Beverage Marketing Corp.
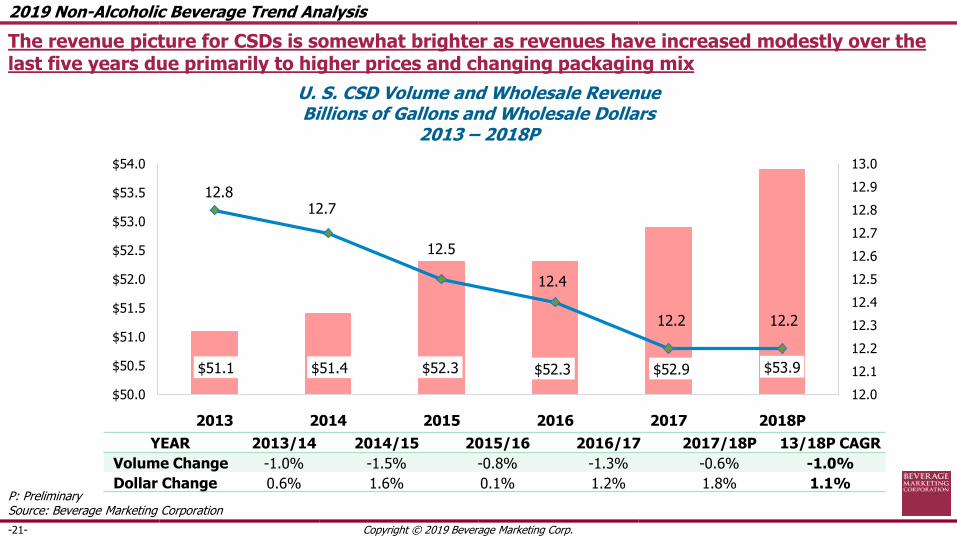
U. S. CSD Volume and Wholesale RevenueBillions of Gallons and Wholesale Dollars
2013 – 2018P
$51.1 $51.4 $52.3 $52.3 $52.9 $53.9
12.812.7
12.5
12.4
12.2 12.2
12.0
12.1
12.2
12.3
12.4
12.5
12.6
12.7
12.8
12.9
13.0
$50.0
$50.5
$51.0
$51.5
$52.0
$52.5
$53.0
$53.5
$54.0
2013 2014 2015 2016 2017 2018P
YEAR 2013/14 2014/15 2015/16 2016/17 2017/18P 13/18P CAGR
Volume Change -1.0% -1.5% -0.8% -1.3% -0.6% -1.0%
Dollar Change 0.6% 1.6% 0.1% 1.2% 1.8% 1.1%
The revenue picture for CSDs is somewhat brighter as revenues have increased modestly over the last five years due primarily to higher prices and changing packaging mix
P: PreliminarySource: Beverage Marketing Corporation
2019 Non-Alcoholic Beverage Trend Analysis

-22- Copyright © 2019 Beverage Marketing Corp.
P: PreliminarySource: Beverage Marketing Corporation
One surprise in 2018 has been the flattening out of diet carbonated soft drink volume, driven by new zero sugar entries
• Improvements in diet sweeteners and product relaunches have helped improve diet performance
U.S. Carbonated Soft Drink MarketShare by Type
Regular70.8%
Regular74.0%
Diet29.2%
Diet26.0%
2013
2018P
YEAR 2013/14 2014/15 2015/16 2016/17 2017/18P 13/18P CAGR
Regular 0.8% -0.1% 0.4% -0.8% -1.0% -0.1%
Diet -5.4% -5.2% -4.1% -2.8% 0.7% -3.4%
2019 Non-Alcoholic Beverage Trend Analysis
-23- Copyright © 2019 Beverage Marketing Corp.
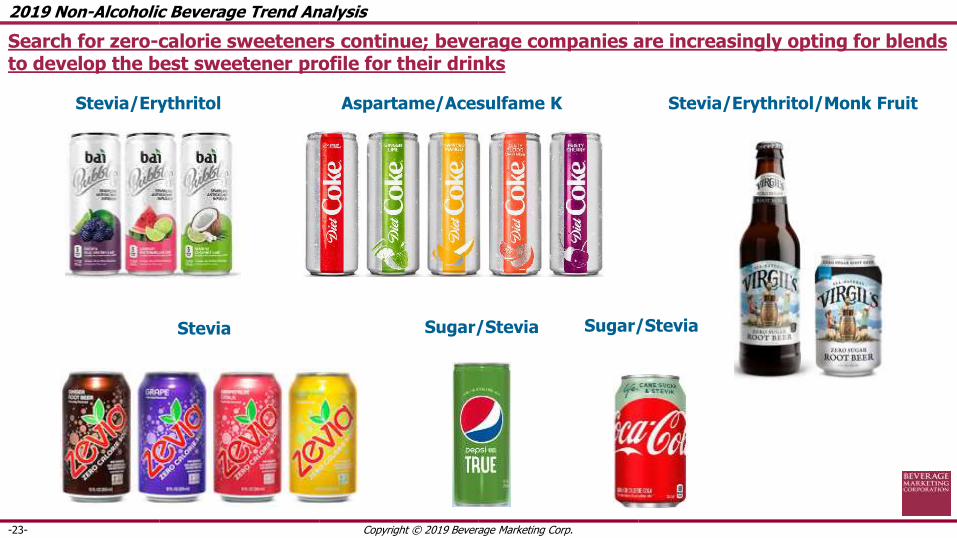
Stevia/Erythritol Aspartame/Acesulfame K
Stevia Sugar/Stevia
Stevia/Erythritol/Monk Fruit
Search for zero-calorie sweeteners continue; beverage companies are increasingly opting for blends to develop the best sweetener profile for their drinks
Sugar/Stevia
2019 Non-Alcoholic Beverage Trend Analysis
-24- Copyright © 2019 Beverage Marketing Corp.
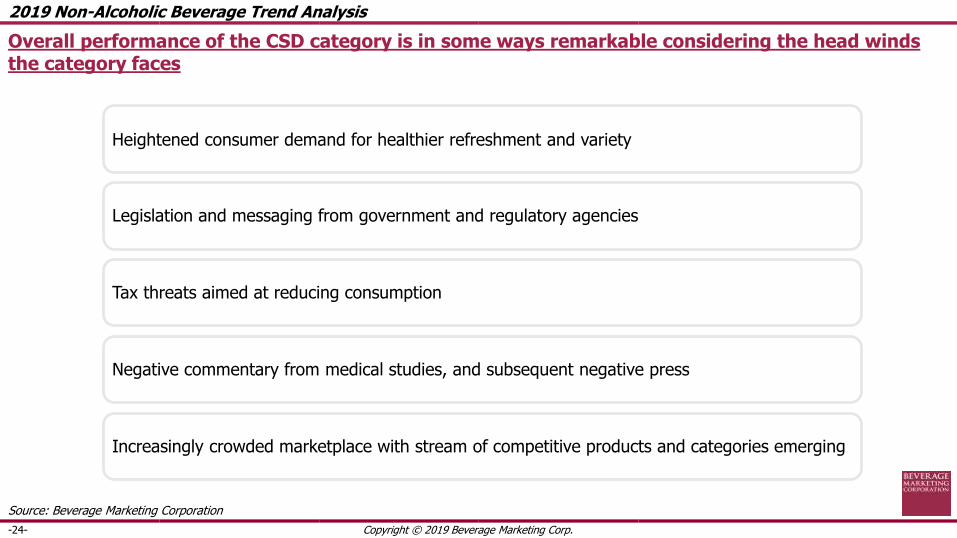
Heightened consumer demand for healthier refreshment and variety
Legislation and messaging from government and regulatory agencies
Tax threats aimed at reducing consumption
Negative commentary from medical studies, and subsequent negative press
Increasingly crowded marketplace with stream of competitive products and categories emerging
Overall performance of the CSD category is in some ways remarkable considering the head winds the category faces
Source: Beverage Marketing Corporation
2019 Non-Alcoholic Beverage Trend Analysis

-25- Copyright © 2019 Beverage Marketing Corp.
Wholesaler Dollars Per Gallon Indexed to 2000
2018 Absolute Price
$4.43
$1.27
100 101 102 103 105 109 111117 122 126 128 131 135 137 139 143 145 148 152
100 98 92 87 83 80 79 76 74 71 70 70 69 67 67 66 66 65
2000 2001 2002 2003 2004 2005 2006 2007 2008 2009 2010 2011 2012 2013 2014 2015 2016 2017 2018P
CSD PET Single Serve Bottled
Modest pricing increases in carbonated soft drinks coupled with significant pricing declines in bottled water have contributed to respective category performances
P: PreliminarySource: Beverage Marketing Corporation
2019 Non-Alcoholic Beverage Trend Analysis

-26- Copyright © 2019 Beverage Marketing Corp.
U.S. Bottled Water MarketBillions of Gallons
2013 – 2018P
10.010.7
11.5
12.413.2
13.9
2013 2014 2015 2016 2017 2018P
YEAR 2013/14 2014/15 2015/16 2016/17 2017/18P 13/18P CAGR
Change 7.2% 7.6% 7.9% 6.1% 5.0% 6.8%
Bottled water has experienced healthy growth each year since the recession
• The category is aided by its positioning as the ultimate health beverage
• The category now is now the largest beverage category in the U.S.
P: PreliminarySource: Beverage Marketing Corporation
2019 Non-Alcoholic Beverage Trend Analysis

-27- Copyright © 2019 Beverage Marketing Corp.
P: PreliminarySource: Beverage Marketing Corporation
PET Single Serve66.9%
PET Single Serve69.7%
1-2.5 Gallon10.1%
1-2.5 Gallon8.4%
HOD12.3%
HOD10.2%
Self-Serve Refill8.2%
Self-Serve Refill7.1%
DomesticSparkling
2.7%
Domestic Sparkling
5.8%
Imports
1.6%
Imports1.9%
2013
2018P
The single-serve water segment continues to drive overall category growth and accounts for two-thirds of total volume
• Domestic sparkling was fastest growing segment in 2018 off a small base
• In the last five years, all category segments experienced increased volume
U.S. Bottled Water Market
2013 – 2018P
Volume, Share and Growth by Segment
SEGMENT PET 1-2.5 GALLON HODSELF-SERVE
REFILLDOMESTIC SPARKLING
IMPORTS TOTAL
5-YR CAGR 7.6% 2.9% 3.0% 3.7% 30.3% 10.9% 6.8%
2019 Non-Alcoholic Beverage Trend Analysis

-28- Copyright © 2019 Beverage Marketing Corp.
U.S. Retail PET Water Market*
Billions of Gallons
2013 – 2018P
6.7
7.2
7.9
8.69.2
9.7
2013 2014 2015 2016 2017 2018P
YEAR 2013/14 2014/15 2015/16 2016/17 2017/18P 13/18P CAGR
Change 8.3% 8.9% 9.2% 6.6% 5.3% 7.6%
Single-serve PET bottled water continues to drive overall category growth
• Aggressive pricing and the success of private label have contributed to the segment’s ascent in recent years
• Segment growth has slowed in each of the last two years but remains healthy
*Includes single-serve sizes of bottled water 1.5 liters and smallerP: PreliminarySource: Beverage Marketing Corporation
2019 Non-Alcoholic Beverage Trend Analysis

-29- Copyright © 2019 Beverage Marketing Corp.
Advances in Supply Chain Costs
Aggressive pricing has helped to boost performance of the single-serve segment but prices increased modestly in 2018 and these increases are likely to hold in 2019
• Every-day pricing has been as low as $2.49-2.99 for 24-packs at retail
2019 Non-Alcoholic Beverage Trend Analysis
Dedicated high-speed filling lines providing for economies of scale savings
After years of low resin prices, prices increased in 2018 but likely more stable in 2019
Bottle light-weighting has aided segment’s aggressive pricing, but has begun to plateau
Freight costs also appear to be stabilizing after an increase in 2018

-30- Copyright © 2019 Beverage Marketing Corp.
U.S. Retail PET Water Market
Branded vs. Private Label
SEGMENT PRIVATE LABEL BRANDED TOTAL
5-YR CAGR 10.6% 5.2% 7.6%
Private label PET water accounts for nearly half of the single-serve market today, and its share is on the rise
P: PreliminarySource: Beverage Marketing Corporation
Branded57.5%
Branded51.3%
Private Label42.5%
Private Label48.7%
2013
2018P
2019 Non-Alcoholic Beverage Trend Analysis
-31- Copyright © 2019 Beverage Marketing Corp.
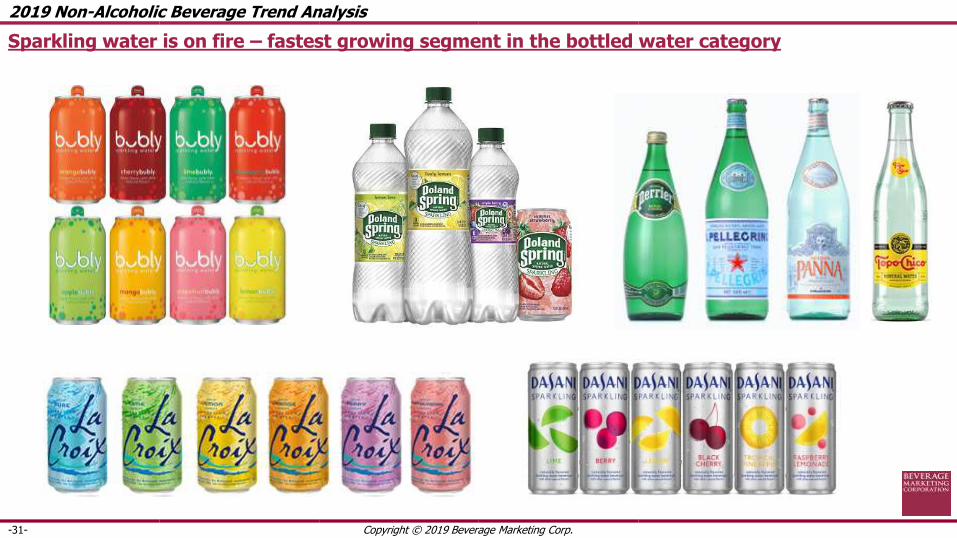
Sparkling water is on fire – fastest growing segment in the bottled water category
2019 Non-Alcoholic Beverage Trend Analysis

-32- Copyright © 2019 Beverage Marketing Corp.
Volume
U.S. Single-Serve Bottled Water Market
Share by Volume and Revenues
2013 – 2018P
SEGMENT REGULAR PET ENHANCED FLAVORED ESSENCE ALKALINE TOTAL
Volume CAGR 7.6% 7.0% 8.6% 32.3% N/A 7.8%
Dollar CAGR 6.6% 8.1% 3.4% 32.8% N/A 7.5%
Value-added waters account for just 6% of single-serve water beverage volume, but hold a larger share of revenues due to higher pricing
P: PreliminarySource: Beverage Marketing Corporation
Regular PET93.9%
Regular PET93.0%
Enhanced
4.9%
Enhanced
4.7%
Flavored1.1%
Flavored1.1%
Essence0.1%
Essence0.3%
Alkaline0.8%
2013
2018P
Regular PET81.3%
Regular PET77.9%
Enhanced15.5%
Enhanced15.9%
Flavored2.9%
Flavored2.4%
Essence0.3%
Essence0.8%
Alkaline0.0%
Alkaline2.9%
2013
2018P
Dollars
2019 Non-Alcoholic Beverage Trend Analysis

-33- Copyright © 2019 Beverage Marketing Corp.
Enhanced Waters
Alkaline Water Plant WaterEssence Water Space Age Water
Similar to other craft refreshment beverages, value-added waters of all types are now proliferating and gaining traction in all parts of the country
• These premium value, craft type waters are adding additional benefits to consumers’ water experience beyond vitamins and minerals
2019 Non-Alcoholic Beverage Trend Analysis

-34- Copyright © 2019 Beverage Marketing Corp.
Projected Water & CSD Growth
Millions of Gallons
2013 – 2023P
CSDs10-Yr CAGR: -0.7%
Enhanced Water
Flavored Water
Bottled water became the leading beverage catetgory in the U.S. on a volume basis in 2016, surpassing CSDs and widened its volume gap subsequently
• As CSDs continue to decline and bottled water continues to grow, the gap between the two categories is only likely to widen even more
• On a dollar basis, CSDs continue to be larger than bottled water, however
p: Preliminary; P: ProjectedSource: Beverage Marketing Corporation
0
2000
4000
6000
8000
10000
12000
14000
16000
18000
20000
2013 2014 2015 2016P 2017 2018p 2019P 2020P 2021P 2022P 2023P
Bulk, HOD, Vended, Sparkling, Imported Waters
Premium Retail PET Waters
2019 Non-Alcoholic Beverage Trend Analysis
-35- Copyright © 2019 Beverage Marketing Corp.
U.S. Fruit Beverage MarketBillions of Gallons
2013 – 2018P
P: PreliminarySource: Beverage Marketing Corporation
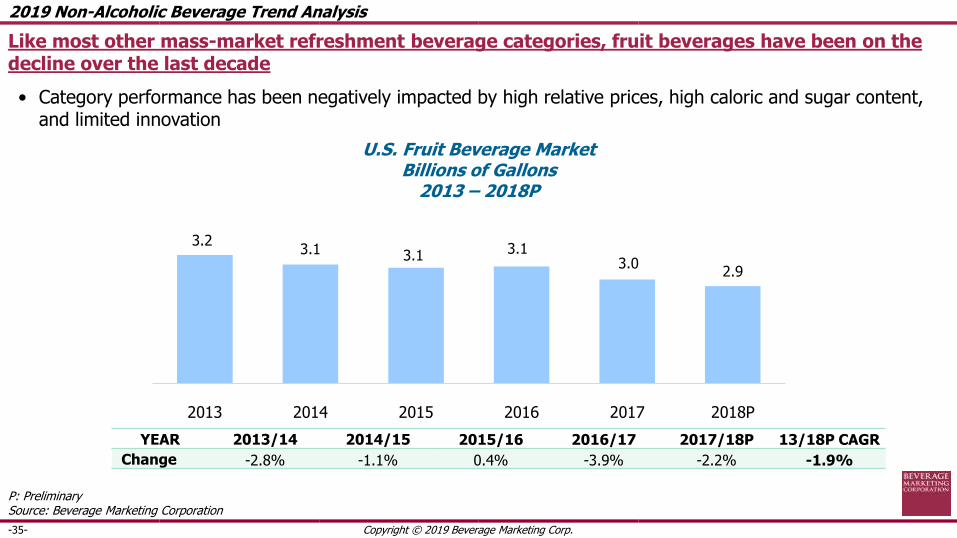
Like most other mass-market refreshment beverage categories, fruit beverages have been on the decline over the last decade
• Category performance has been negatively impacted by high relative prices, high caloric and sugar content, and limited innovation
2019 Non-Alcoholic Beverage Trend Analysis
3.23.1 3.1 3.1
3.02.9
2013 2014 2015 2016 2017 2018P
YEAR 2013/14 2014/15 2015/16 2016/17 2017/18P 13/18P CAGR
Change -2.8% -1.1% 0.4% -3.9% -2.2% -1.9%

-36- Copyright © 2019 Beverage Marketing Corp.
The category is split nearly evenly between 100% juice and juice drinks but both segments of the category have been in decline
• Both segments have declined in the range of 1%-2% annually over the last five years
U.S. Fruit Beverage MarketShare by Type
YEAR 2013/14 2014/15 2015/16 2016/17 2017/18P 13/18P CAGR
100% Juice -2.6% -0.2% 0.9% -3.7% -2.8% -1.7%
Fruit Drinks -3.0% -2.1% -0.2% -4.2% -1.4% -2.2%
P: PreliminarySource: Beverage Marketing Corporation
100% Juice53.4%
100% Juice54.0%
Fruit Drinks46.6%
Fruit Drinks46.0%
2013
2018P
2019 Non-Alcoholic Beverage Trend Analysis

-37- Copyright © 2019 Beverage Marketing Corp.
U.S. Sports Drink MarketBillions of Gallons
2013 – 2018P
P: PreliminarySource: Beverage Marketing Corporation
Sports drinks, which provide hydration, electrolytes and energy, experienced growth in the mid-single digits in recent years, and rebounded in 2018 after a small decline in 2017
• Category volume in 2018 exceeded 1.6 billion gallons
1.4 1.41.5 1.6 1.5
1.6
2013 2014 2015 2016 2017 2018P
YEAR 2013/14 2014/15 2015/16 2016/17 2017/18P 13/18P CAGR
Change 3.0% 5.5% 3.9% -2.1% 3.7% 2.8%
2019 Non-Alcoholic Beverage Trend Analysis
-38- Copyright © 2019 Beverage Marketing Corp.
U.S. Energy Drink MarketMillions of Gallons
2013 – 2018P
P: PreliminarySource: Beverage Marketing Corporation
2019 Non-Alcoholic Beverage Trend Analysis
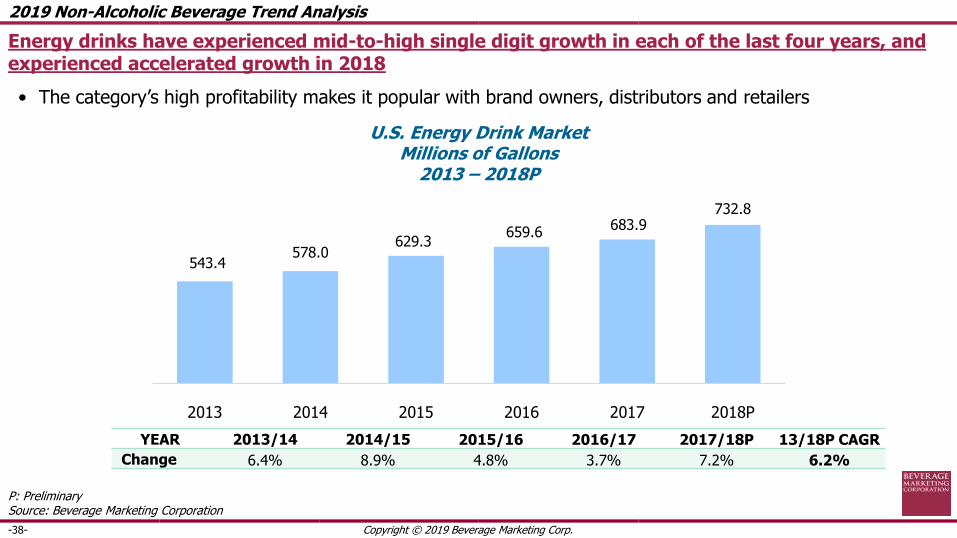
543.4578.0
629.3659.6
683.9732.8
2013 2014 2015 2016 2017 2018P
YEAR 2013/14 2014/15 2015/16 2016/17 2017/18P 13/18P CAGR
Change 6.4% 8.9% 4.8% 3.7% 7.2% 6.2%
Energy drinks have experienced mid-to-high single digit growth in each of the last four years, and experienced accelerated growth in 2018
• The category’s high profitability makes it popular with brand owners, distributors and retailers

-39- Copyright © 2019 Beverage Marketing Corp.
Virtually all of the growth in the U.S. tea market is coming from the ready-to-drink segment
• Convenience is driving the growth of ready-to-drink over other format teas
U.S. Tea MarketShare by Segment
P: PreliminarySource: Beverage Marketing Corporation
2019 Non-Alcoholic Beverage Trend Analysis
YEAR 2013/14 2014/15 2015/16 2016/17 2017/18P 13/18P CAGR
RTD Tea 3.9% 3.9% 3.4% 1.1% -0.1% 2.4%
Loose/Bagged/Mix/Pods -0.5% -3.2% -1.9% -3.3% -2.5% -2.3%
RTD Tea41.6%
RTD Tea47.3%
Loose/Bagged/Mix/Pods58.4%
Loose/Bagged/Mix/Pods52.7%
2013
2018P

-40- Copyright © 2019 Beverage Marketing Corp.
U.S. RTD Tea MarketMillions of Gallons
2013 – 2018P
P: PreliminarySource: Beverage Marketing Corporation
The RTD tea category has experienced modest growth in the last five years, driven in part by the health benefits of the category and convenience of the RTD format
• Category volume exceeded 1.7 billion gallons in 2018 but volume was essentially flat for the year
2019 Non-Alcoholic Beverage Trend Analysis
1,525.11,584.4
1,646.41,702.1 1,720.8 1,718.9
2013 2014 2015 2016 2017 2018P
YEAR 2013/14 2014/15 2015/16 2016/17 2017/18P 13/18P CAGR
Change 3.9% 3.9% 3.4% 1.1% -0.1% 2.4%

-41- Copyright © 2019 Beverage Marketing Corp.
Ready-to-drink coffee is an underdeveloped segment of the coffee category
• Dry format coffee brewed in the home or at coffee cafes has dominated the market
U.S. Coffee MarketShare by Segment
P: PreliminarySource: Beverage Marketing Corporation
RTD Coffee1.6%
RTD Coffee2.7%
Whole Bean/Ground/Pods/Instant/Mix
98.4%
Whole Bean/Ground/Pods/Instant/Mix
97.3%
2013
2018P
YEAR 2013/14 2014/15 2015/16 2016/17 2017/18P 13/18P CAGR
RTD Coffee 17.7% 15.9% 12.7% 12.8% 7.4% 13.2%
Whole Bean/Ground/Pods/Instant/Mix
1.0% 1.9% 1.6% 0.8% 1.1% 1.3%
2019 Non-Alcoholic Beverage Trend Analysis

-42- Copyright © 2019 Beverage Marketing Corp.
U.S. RTD Coffee MarketMillions of Gallons
2013 – 2018P
P: PreliminarySource: Beverage Marketing Corporation
RTD coffee has experienced double-digit volume growth over the last five years
• Developing a ready-to-drink coffee with mass market appeal has been one of the challenges for the segment in addition to the competition from the huge number of coffee cafes in the U.S.
2019 Non-Alcoholic Beverage Trend Analysis
102.2120.3
139.4157.1
177.2190.3
2013 2014 2015 2016 2017 2018P
YEAR 2013/14 2014/15 2015/16 2016/17 2017/18P 13/18P CAGR
Change 17.7% 15.9% 12.7% 12.8% 7.4% 13.2%

-43- Copyright © 2019 Beverage Marketing Corp.
U.S. Milk MarketBillions of Gallons
2013 – 2018P
P: PreliminarySource: Beverage Marketing Corporation
Milk consumption has been on a consistent and steady decline in the U.S.
• Competition from dairy alternatives such as almond, soy and others have impacted sales and compounded the category’s challenges
6.05.8
5.7 5.75.5 5.4
2013 2014 2015 2016 2017 2018P
YEAR 2013/14 2014/15 2015/16 2016/17 2017/18P 13/18P CAGR
Change -3.2% -1.4% -0.7% -2.2% -2.1% -1.9%
2019 Non-Alcoholic Beverage Trend Analysis
-44- Copyright © 2019 Beverage Marketing Corp.
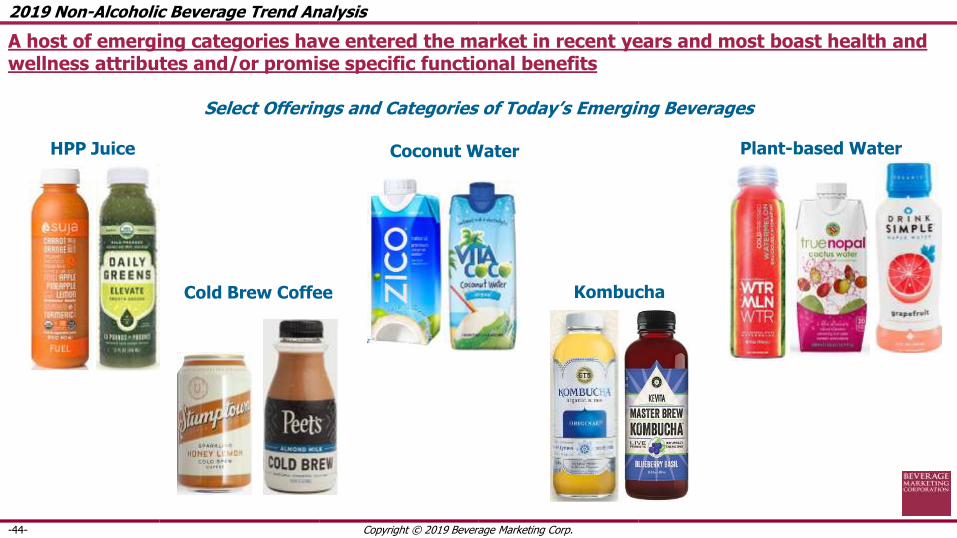
HPP Juice
Cold Brew Coffee
Plant-based Water
Kombucha
Select Offerings and Categories of Today’s Emerging Beverages
Coconut Water
A host of emerging categories have entered the market in recent years and most boast health and wellness attributes and/or promise specific functional benefits
2019 Non-Alcoholic Beverage Trend Analysis

-45- Copyright © 2019 Beverage Marketing Corp.
Dairy Alternatives
Probiotic Matcha
Protein/Sustenance
Premium Mixers
Emerging beverages have provided excitement to the marketplace although not all segments will prove successful in the long run
2019 Non-Alcoholic Beverage Trend Analysis
Select Offerings and Categories of Today’s Emerging Beverages
-46- Copyright © 2019 Beverage Marketing Corp.
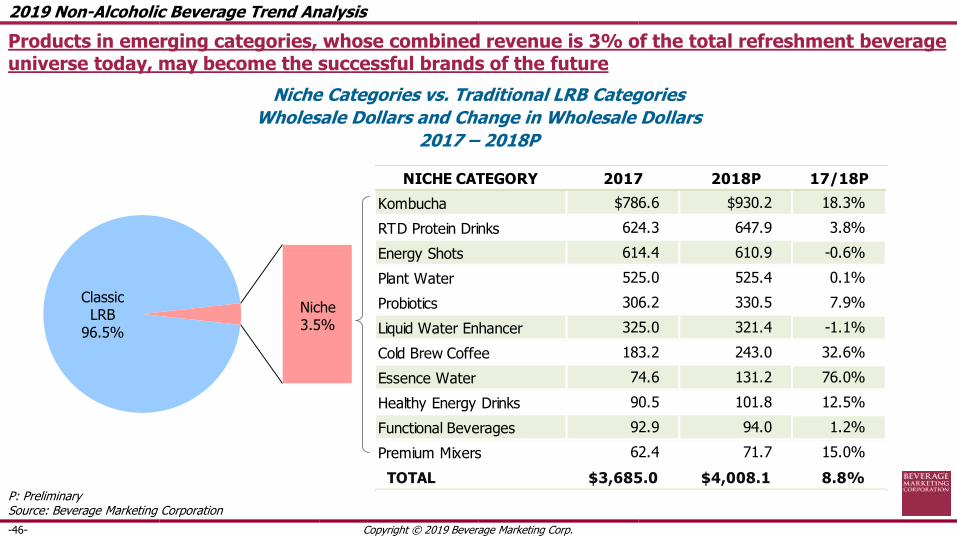
Niche Categories vs. Traditional LRB Categories
Wholesale Dollars and Change in Wholesale Dollars
2017 – 2018P
NICHE CATEGORY 2017 2018P 17/18P
Kombucha $786.6 $930.2 18.3%
RTD Protein Drinks 624.3 647.9 3.8%
Energy Shots 614.4 610.9 -0.6%
Plant Water 525.0 525.4 0.1%
Probiotics 306.2 330.5 7.9%
Liquid Water Enhancer 325.0 321.4 -1.1%
Cold Brew Coffee 183.2 243.0 32.6%
Essence Water 74.6 131.2 76.0%
Healthy Energy Drinks 90.5 101.8 12.5%
Functional Beverages 92.9 94.0 1.2%
Premium Mixers 62.4 71.7 15.0%
TOTAL $3,685.0 $4,008.1 8.8%
Products in emerging categories, whose combined revenue is 3% of the total refreshment beverage universe today, may become the successful brands of the future
P: PreliminarySource: Beverage Marketing Corporation
Classic LRB
96.5%
Niche3.5%
2019 Non-Alcoholic Beverage Trend Analysis

-47- Copyright © 2019 Beverage Marketing Corp.
Bottled Water
Energy Drinks
Kombucha RTD Coffee
Sparkling Water
Value-Added Water
A number of categories are experiencing exceptional growth
Source: Beverage Marketing Corporation
2019 Non-Alcoholic Beverage Trend Analysis
Hot Categories
-48- Copyright © 2019 Beverage Marketing Corp.
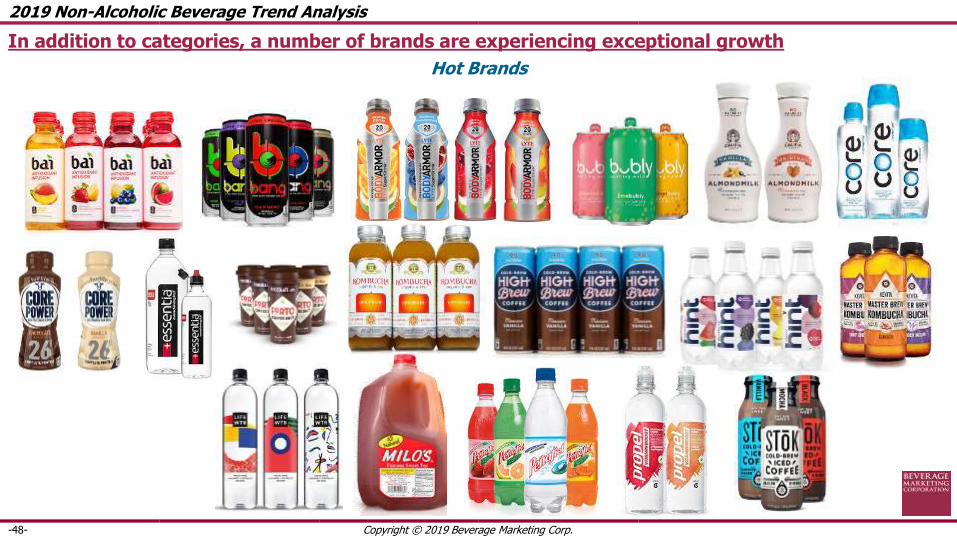
In addition to categories, a number of brands are experiencing exceptional growth
2019 Non-Alcoholic Beverage Trend Analysis
Hot Brands

-49- Copyright © 2019 Beverage Marketing Corp.
2019 Liquid Refreshment Beverage Projections
P: ProjectedSource: Beverage Marketing Corporation
Volume Growth Retail Dollar Growth
LRB CATEGORY 2019P
Value-Added Water 13.0% ~ 14.0%
RTD Coffee 6.2% ~ 7.0%
Bottled Water 4.2% ~ 5.0%
Energy Drinks 5.8% ~ 6.6%
Sports Drinks 3.0% ~ 4.0%
RTD Tea 0.3% ~ 1.0%
Carbonated Soft Drinks -0.7% ~ -0.2%
Fruit Beverages -2.0% ~ -1.0%
TOTAL 1.2% ~ 2.0%
LRB CATEGORY 2019P
Value-Added Water 16.0% ~ 17.0%
RTD Coffee 8.2% ~ 9.0%
Bottled Water 6.8% ~ 7.5%
Energy Drinks 5.4% ~ 6.4%
Sports Drinks 4.0% ~ 5.0%
RTD Tea 2.3% ~ 3.1%
Carbonated Soft Drinks 0.3% ~ 1.0%
Fruit Beverages -1.0% ~ 0.0%
TOTAL 1.8% ~ 2.6%
Among refreshment beverages, the strongest growth is projected for bottled water, value-added water, energy drinks and RTD teas and coffees
• CSDs, milk and fruit beverages will need to innovate and provide healthier options to rekindle growth
2019 Non-Alcoholic Beverage Trend Analysis
Thank You
• Strategic Associates
• Research
• Advisors
Beverage Marketing Corporation