2019 the state of girls in k-12 computer science ... · - uriyah ruiz, girls who code alumni “ at...
TRANSCRIPT

2019 ADVOCACY REPORT
THE STATE OF GIRLS IN K-12 COMPUTER SCIENCE CLASSROOMS: MAKING THE CASE FOR GENDER-SPECIFIC EDUCATION POLICIES
We have to change pol icy to change the face of tech.”
- Reshma Saujani, founder and CEO of Girls Who Code
“

6
7
9
11
13
15
17
19
21
23
26
Executive Summary
The State of Girls’ Participation in Computer Science
Key Findings
The Impact of Policies by State
What is a Gender-Specific Approach?
Our Recommendations
Our Advocacy Work
Women in Tech Lesson Plans
In Conclusion
Research Methodologies
Get in Touch
TABLE OF CONTENTS

6
In recent years, policymakers across the country have been hard at work passing legislation to increase access to computer science (CS) education at the K-12 level. And with good reason.
Computing jobs are among the fastest-growing in the U.S. economy. These jobs pay more than double the average U.S. salary. And in the coming years, they will be key drivers of national economic growth and mobility.
As a result, policies that aim to increase access to CS education have proven popular on both sides of the political aisle, with 33 states passing such legislation in just five short years. 1
At the heart of these policies is the hope that more CS classrooms will translate into more girls in CS and—eventually—an end to the gender gap in tech.
As an organization dedicated to building a more equitable tech industry, we’ve kept a close eye on this wave of legislation. Now, with two years of policy implementation underway and a significant number of states reporting data, we can begin recording and evaluating impact.
This report is the first-ever evaluation of whether policies that increase access to CS at the K-12 level actually change the gender makeup of American classrooms.
According to states’ own data from the last two years, states with policies aimed at increasing the volume of CS classrooms have not seen increased participation by girls. Boys still make up the overwhelming majority of students in CS classrooms.
Data does, however, offer insight into the kind of legislation that could make a tangible impact on the gender gap in tech. Numbers indicate a positive relationship between states with Girls Who Code (GWC) programming and the rate of girls’ participation in CS—making a strong case for gender-specific approaches.
This report is also a testament to the importance of tracking and reporting classroom participation data. Access policies are a relatively new trend, and we believe it’s critical to start capturing data early on to understand whether policies are unintentionally perpetuating or exacerbating the gender gap in tech. To that end, this report will be the first in a series of annual analyses to come.
EXECUTIVE SUMMARY
1 Girls Who Code qualifies policies designed to increase access to computer science as those that fall within at least one of three categories: Computer Science Standards, Funding, or High School Computer Science Offering.

7 8
THE STATE OF GIRLS’ PARTICIPATION IN COMPUTER SCIENCE
2 No data available: Alabama, Alaska, Arizona, Colorado, Delaware, Kentucky, Maine, Maryland, Michigan, Minnesota, Missouri, Montana, New Hampshire, Oklahoma, Rhode Island, South Carolina, South Dakota, Vermont, Virginia, Wyoming
3 States with >40% participation: Connecticut (41.3), Massachusetts (41.4), Hawaii (41.4), Georgia (42.3), Kansas (42.3), Louisiana (45.0), New Jersey (45.2), New York (45.3)
4 States with <40% participation by girls: Wisconsin (30.3), Pennsylvania (30.8), Idaho (30.8), Oregon (31.9), North Carolina (32.1), Nebraska (33.5), Illinois (33.5), Utah (33.7), Indiana (36.1), Florida (36.8), California (38.4), North Dakota (38.4), Mississippi (38.7), West Virginia (39.1), New Mexico (39.7), Nevada (22.9), Tennessee (24.5), Washington (26.3), Texas (27.0), Arkansas (29.0), Iowa (19.02)
2017-2018
40%+ of students in CS are girls
30%+ of students in CS are girls
Non-responsive states, or states with no data
20-29% of students in CS are girls
10-19% of students in CS are girls
GIRLS’ PARTICIPATION RATE IN K-12 CS IN 2017-185
Nationally, participation by girls in computer science courses in grades K-12 averaged 37.5% of all students.
GIRLS IN HISTORICALLY UNDERREPRESENTED GROUPS (HUGS) PARTICIPATION RATE IN K-12 CS IN 2017-186
Nationally, participation by girls from HUGS in computer science courses in grades K-12 averaged 15.5% of all students.
37.5%
15.5%
I ’m one of four g ir ls in a c lass of 22 with a male teacher. Whi le I respect my teacher and def initely respect my peers, I miss the connect ion that I had at GWC, where i t was so easy to ask and improve in place where there wasn’t any pressure to outperform the boys, or just prove my worth.”
- Hannah Schneider, Girls Who Code alumni
“
5 For 31 States with Available Data
6 For 31 States with Available Data, only seven (7) provided gender by race breakdown. Black/Latina student data combined - may be duplicated.
9 10
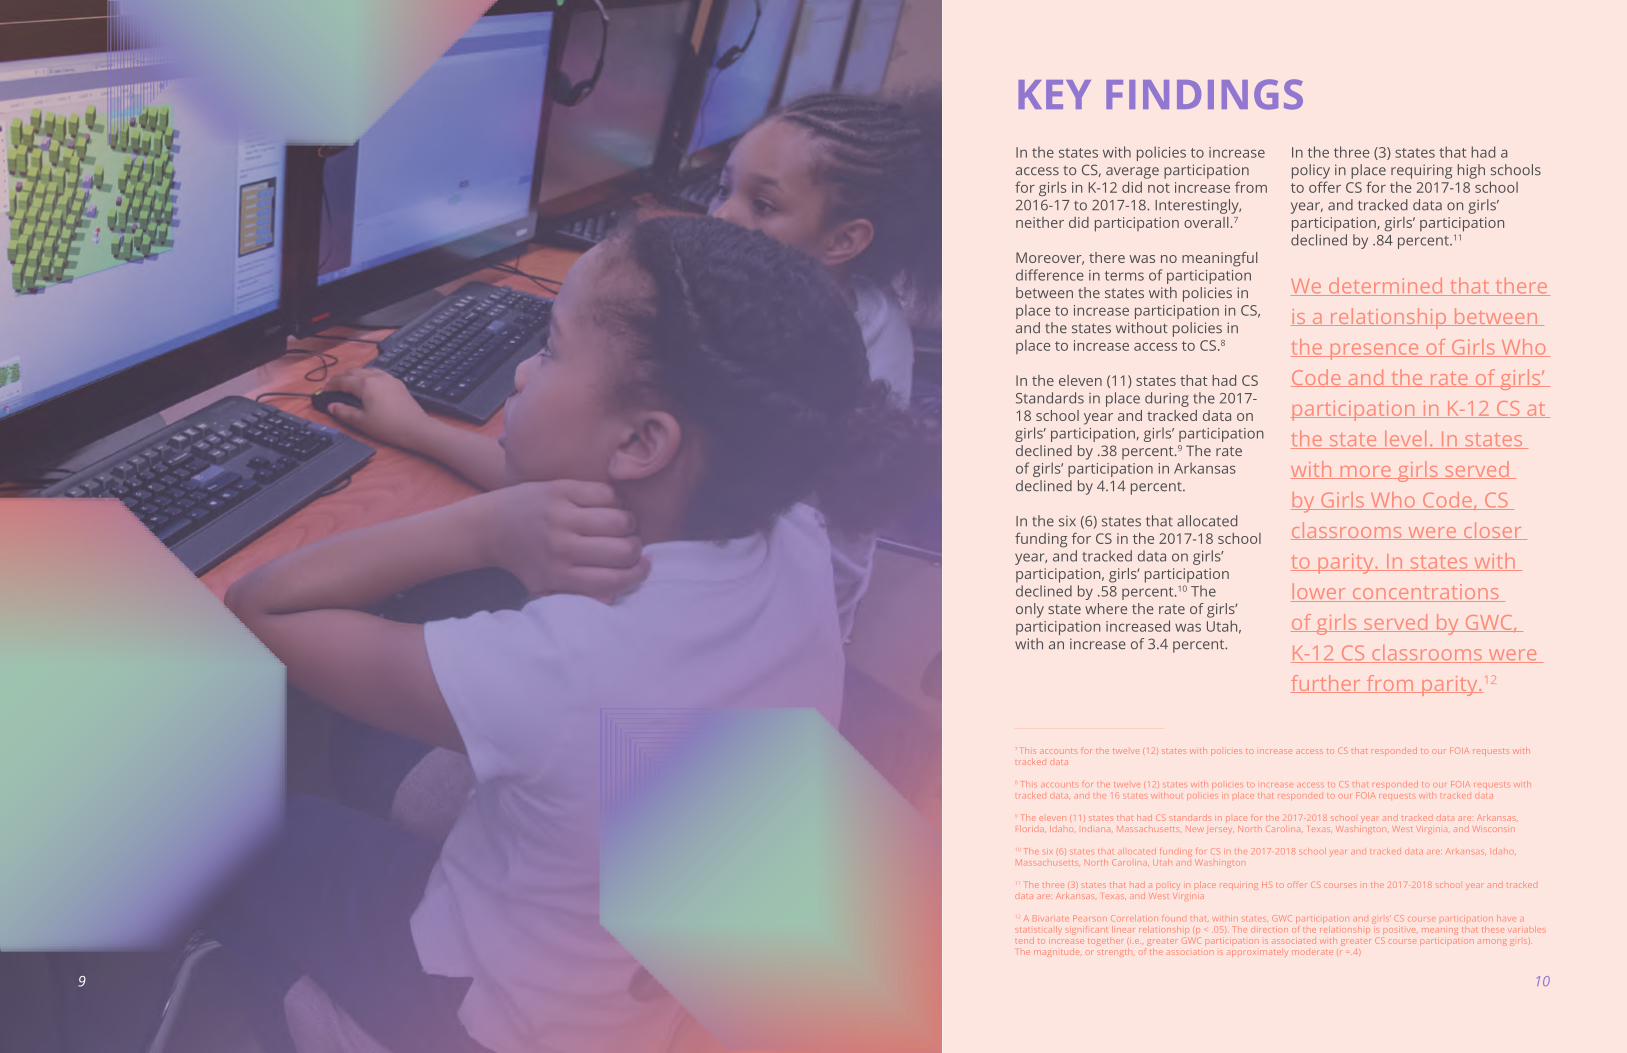
In the states with policies to increase access to CS, average participation for girls in K-12 did not increase from 2016-17 to 2017-18. Interestingly, neither did participation overall.7
Moreover, there was no meaningful difference in terms of participation between the states with policies in place to increase participation in CS, and the states without policies in place to increase access to CS.8
In the eleven (11) states that had CS Standards in place during the 2017-18 school year and tracked data on girls’ participation, girls’ participation declined by .38 percent.9 The rate of girls’ participation in Arkansas declined by 4.14 percent.
In the six (6) states that allocated funding for CS in the 2017-18 school year, and tracked data on girls’ participation, girls’ participation declined by .58 percent.10 The only state where the rate of girls’ participation increased was Utah, with an increase of 3.4 percent.
In the three (3) states that had a policy in place requiring high schools to offer CS for the 2017-18 school year, and tracked data on girls’ participation, girls’ participation declined by .84 percent.11
We determined that there is a relationship between the presence of Girls Who Code and the rate of girls’ participation in K-12 CS at the state level. In states with more girls served by Girls Who Code, CS classrooms were closer to parity. In states with lower concentrations of girls served by GWC, K-12 CS classrooms were further from parity.12
KEY FINDINGS
7 This accounts for the twelve (12) states with policies to increase access to CS that responded to our FOIA requests with tracked data
8 This accounts for the twelve (12) states with policies to increase access to CS that responded to our FOIA requests with tracked data, and the 16 states without policies in place that responded to our FOIA requests with tracked data
9 The eleven (11) states that had CS standards in place for the 2017-2018 school year and tracked data are: Arkansas, Florida, Idaho, Indiana, Massachusetts, New Jersey, North Carolina, Texas, Washington, West Virginia, and Wisconsin
10 The six (6) states that allocated funding for CS in the 2017-2018 school year and tracked data are: Arkansas, Idaho, Massachusetts, North Carolina, Utah and Washington
11 The three (3) states that had a policy in place requiring HS to offer CS courses in the 2017-2018 school year and tracked data are: Arkansas, Texas, and West Virginia
12 A Bivariate Pearson Correlation found that, within states, GWC participation and girls’ CS course participation have a statistically significant linear relationship (p < .05). The direction of the relationship is positive, meaning that these variables tend to increase together (i.e., greater GWC participation is associated with greater CS course participation among girls). The magnitude, or strength, of the association is approximately moderate (r =.4)

1211
“ The data shows that exist ing pol ic ies to bring more gir ls into computer science aren’t just missing the mark, they may actual ly be doing more harm than good.”
- Dr. Tarika Barrett, COO of Girls Who Code
THE IMPACT OFPOLICIES BY STATE
Importantly though, these states are the few that track diversity in K-12 computer science classrooms. As a result, we can measure the impact of access policies and consider how to correct course where necessary. Too many states do not track such data, making it impossible to understand the impact of access policies. Moreover, a vast majority of states do not make this data publicly
available—a standard that makes the process of gathering important data incredibly tedious. From our research with Accenture13, we know that 70 percent of the growth in the computing pipeline could come from changing the path of the youngest girls. It’s critical that we understand whether existing policies work, to correct course and guarantee we reach girls at their critical point in the pipeline.
13 Accenture and Girls Who Code (2016). Cracking the Gender Code
This chart depicts the change in girls’ participation rates (from school years 2016-17 to 2017-18) in states with access policies in place and that tracked data. According to the data, policies have little impact, and in some cases negative impact, on the rate of girls’ participation in K-12 CS.
2016-2017 K-12Girls Participation Rate
2017-2018 K-12Girls Participation Rate
50%
10%
20%
30%
40%
AR FL ID IN MA NJ TX UT WA WV WI
- 4.1%
+ .43%
+ .18%
+ .34%
- .01%
- .18%
+ .22%+ 3.4%
- .47%
+ 1.38%
+ .6%
- 2.51%
NC

13 14
Before being a part of GWC, I honest ly fe l t a lone in the tech community in and out of school . At t imes i t would feel l ike I d idn’t belong in this type of industry because there just wasn’t as many females to make i t feel normal . ”
- Uriyah Ruiz, Girls Who Code alumni
“At Girls Who Code, our gender-specific approaches include providing girls with safe, girls-only spaces, and centering curricula on women in tech so that girls can imagine themselves in computing roles.
For policymakers, a gender-specific approach involves creating policies that are designed specifically to bring girls into CS—by, for example, funding gender inclusion training for teachers.
WHAT IS A GENDER-SPECIFIC APPROACH?
: gender specific approach : // n. a gender specific approach is one that keeps the focus on girls, and considers the biases that might impact their experience.
15 16
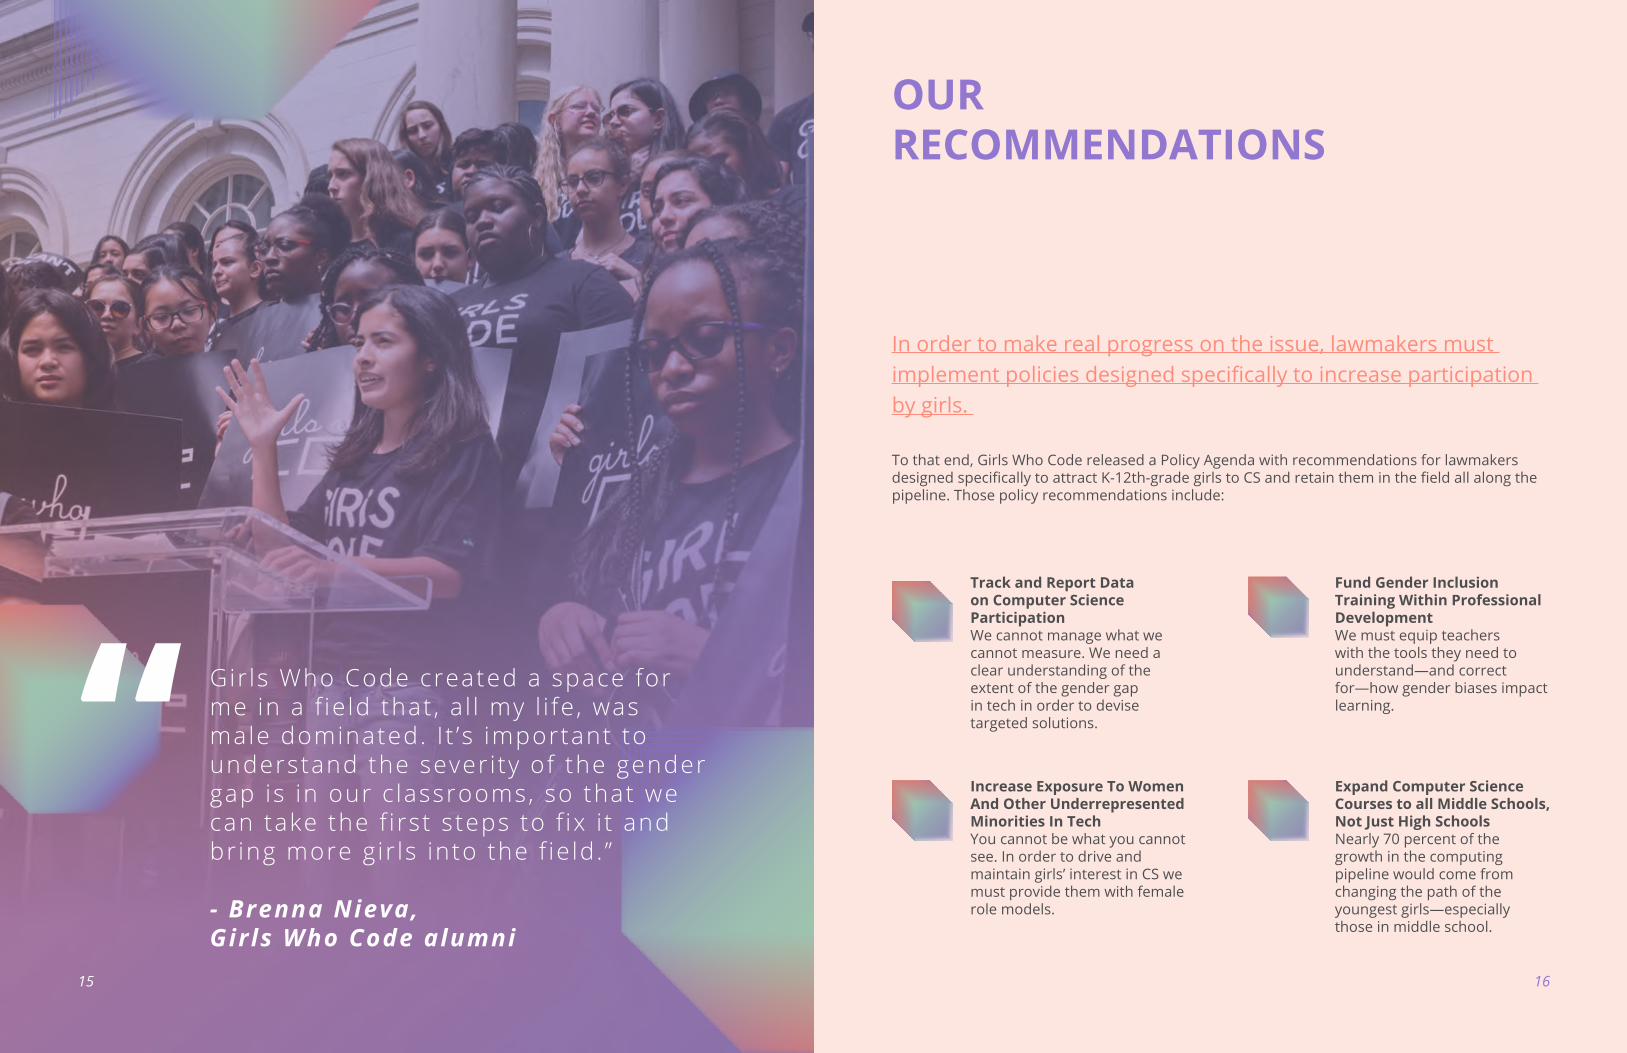
In order to make real progress on the issue, lawmakers must implement policies designed specifically to increase participation by girls.
To that end, Girls Who Code released a Policy Agenda with recommendations for lawmakers designed specifically to attract K-12th-grade girls to CS and retain them in the field all along the pipeline. Those policy recommendations include:
OUR RECOMMENDATIONS
Track and Report Data on Computer Science ParticipationWe cannot manage what we cannot measure. We need a clear understanding of the extent of the gender gap in tech in order to devise targeted solutions.
Increase Exposure To Women And Other Underrepresented Minorities In TechYou cannot be what you cannot see. In order to drive and maintain girls’ interest in CS we must provide them with female role models.
Fund Gender Inclusion Training Within Professional DevelopmentWe must equip teachers with the tools they need to understand—and correct for—how gender biases impact learning.
Expand Computer Science Courses to all Middle Schools, Not Just High Schools Nearly 70 percent of the growth in the computing pipeline would come from changing the path of the youngest girls—especially those in middle school.
Gir ls Who Code created a space for me in a f ie ld that , a l l my l i fe , was male dominated. I t ’s important to understand the severity of the gender gap is in our c lassrooms, so that we can take the f irst steps to f ix i t and bring more gir ls into the f ie ld. ”
- Brenna Nieva, Girls Who Code alumni
“

17 18
GWC releases Policy Agenda with recommendations designed specifically to attract girls to, and retain them in, CS
JUNE 2018
GWC launches Women in Tech Lesson Plans, the organizations first free in-school resource to promote women’s representation in technology
JULY 2018
Pennsylvania becomes the first state to promote GWC Women in Tech Lesson Plans, followed by Vermont, Virginia, and Maryland
SEPTEMBER 2018
Newark, New Jersey introduces GWC Women in Tech Lesson Plans to all middle schools, opens GWC Clubs for more than 3,000 girls
DECEMBER 2018
Colorado passes HB 1277, designed to increase participation for underrepresented groups in STEM
MAY 2019
Washington State passes “Girls Who Code Bill” HB 1577 first-ever law requiring school districts to track and publicly report girls’ participation in CS
APRIL 2019
Girls Who Code is actively working with state governments to pass legislation that aligns with our Policy Agenda.
OUR ADVOCACY WORK
Assuring we’re reaching al l students requires us to have the data on who is engaged with computer science. I t wi l l make a di f ference for young gir ls and students of color. ”
- Washington State Senator Lisa Z. Wellman, Chair, Early Learning & K-12 Education
“

19 20
Before the Gir ls Who Code lesson plans, g ir ls in my c lassroom had few women in tech as a part of their curr iculum to look up to. They real ly ident i fy with these women. I t ’s going to be a game-changer. ”
- Teacher, I l l inois
“
Girls Who Code offers free, downloadable lesson plans featuring historical and contemporary women pioneers in tech — specifically designed to make all students think differently about who can be successful in computing.
WOMEN IN TECH LESSON PLANS
Do the research. Ask questions. Find someone doing what youare interested in! Be curious! -Katherine Johnson
The most dangerousphrase in the language is, "We've always done itthis way." -Grace Hopper

21 22
IN CONCLUSION
At Girls Who Code, we believe that closing the gender gap will take rooting out bias and discrimination still widespread at every stage in the pipeline. It will take building girls’ bravery and resilience, making them feel like they belong, and demonstrating that they can use tech to solve problems they care about.
At the center of this work is the need for thoughtful policies that take gender into account. The support of national, state, and local governments are a crucial part of efforts to making our classrooms more diverse.
To be sure these policies have their intended effect of making our CS classrooms more diverse, it is incumbent upon us to track, report, and evaluate participation data.
The problem of the gender gap in our classrooms—as in our workplaces—is a complicated one. But it is not an impossible problem to solve.
We can bring more girls into tech, and we can do more to support them at all points along the pipeline. Together, we can make sure that our girls have a part to play in defining the future of our economies, our communities, and our lives.

2423
Computer Science:The definition and breadth of what constitutes computer science is contested and evolving. For the purpose of this research, we based our definition of computer science on well-established CSTA standards14, excluding courses that do not require computational thinking skills (such as desktop publishing, communication, and graphic design courses). We define CS as the study of computing concepts including but not limited to programming, robotics, web development, hardware and software, and more.
This report uses 2016-17 school year data as a baseline, and includes 2017-18 data to measure shifts. At this time, it was the earliest available data for the greatest number of states.
Data Request SpecificationsFor each data request, Girls Who Code requested data for CS course enrollment by:
a. Genderb. Race/Ethnicity; including:
American Indian or Alaska Native, Asian, Black or African American, Hispanic or Latino, Native Hawaiian or Other Pacific Islander, White, Multiracial, Other
c. Gender by Race/Ethnicity d. Free and Reduced Lunch Eligibility
Where applicable, Girls Who Code supplied states with the specific course codes based on prior definition.
Each state was asked to include two datasets, as follows:
1. Statewide cumulative number of total unique students enrolled in computer science courses, by gender
2. Individual student enrollment per course by demographic subgroups, with students counting once in each total even if they were taking multiple courses
RESEARCH METHODOLOGIES RESEARCH DESIGNIn August 2018, Girls Who Code contacted every State Department of Education (SDOE) that did not publish CS education data to confirm whether demographic data for K-12 computer science courses was tracked and available. Girls Who Code filed FOIA requests for states that did track demographic data (and where demographic data was not already publicly available) in October 2018. Additional detail on data request specifications available below.
METHOD OF DATA COLLECTIONGirls Who Code obtained completed data reports from SDOE or State Departments of Public Instruction through:
1. Data Requests2. Open Records Requests3. Research Requests4. FOIL Requests 5. Research Proposals6. Informal Channels
The data requested varied based on what was available at each SDOE. When possible, Girls Who Code applied the computer science definition against the master course list or catalog to request the specific courses. If a standard course catalog was not available or made public, the SDOE was sent the Girls Who Code definition and standard of CS. Girls Who Code honored states’ definition of computer science if we were unable to send specific course codes, and trusted each state followed our definition.
Ultimately, states were categorized based on the data, responses, or lack thereof:
• State does not track data• Data is incomplete and only represents
a portion of the state, but is not publicly available
• Data is tracked, only at the high school level, but is not publicly available
• Data is available at district level and by individual courses, but is not publicly available
• Data is tracked and publicly available
Data received from each state varied based on the data available at each department as per tracking requirements and compliance standards. Data should be reviewed on a state by state basis, but limitations persisted around:
• Sample Size: available data varied from only prior-to-secondary or secondary data to all available data.
• Inconsistent Data:◊ Compliance issues around data as
each school or district reports to the state can lead to incomplete or inaccurate data with no checks.
◊ Standard course codes are a work in progress for many states; many states define any course that involves computers as computer science.
14 CSTA Standards. https://www.csteachers.org/page/standards
25 26
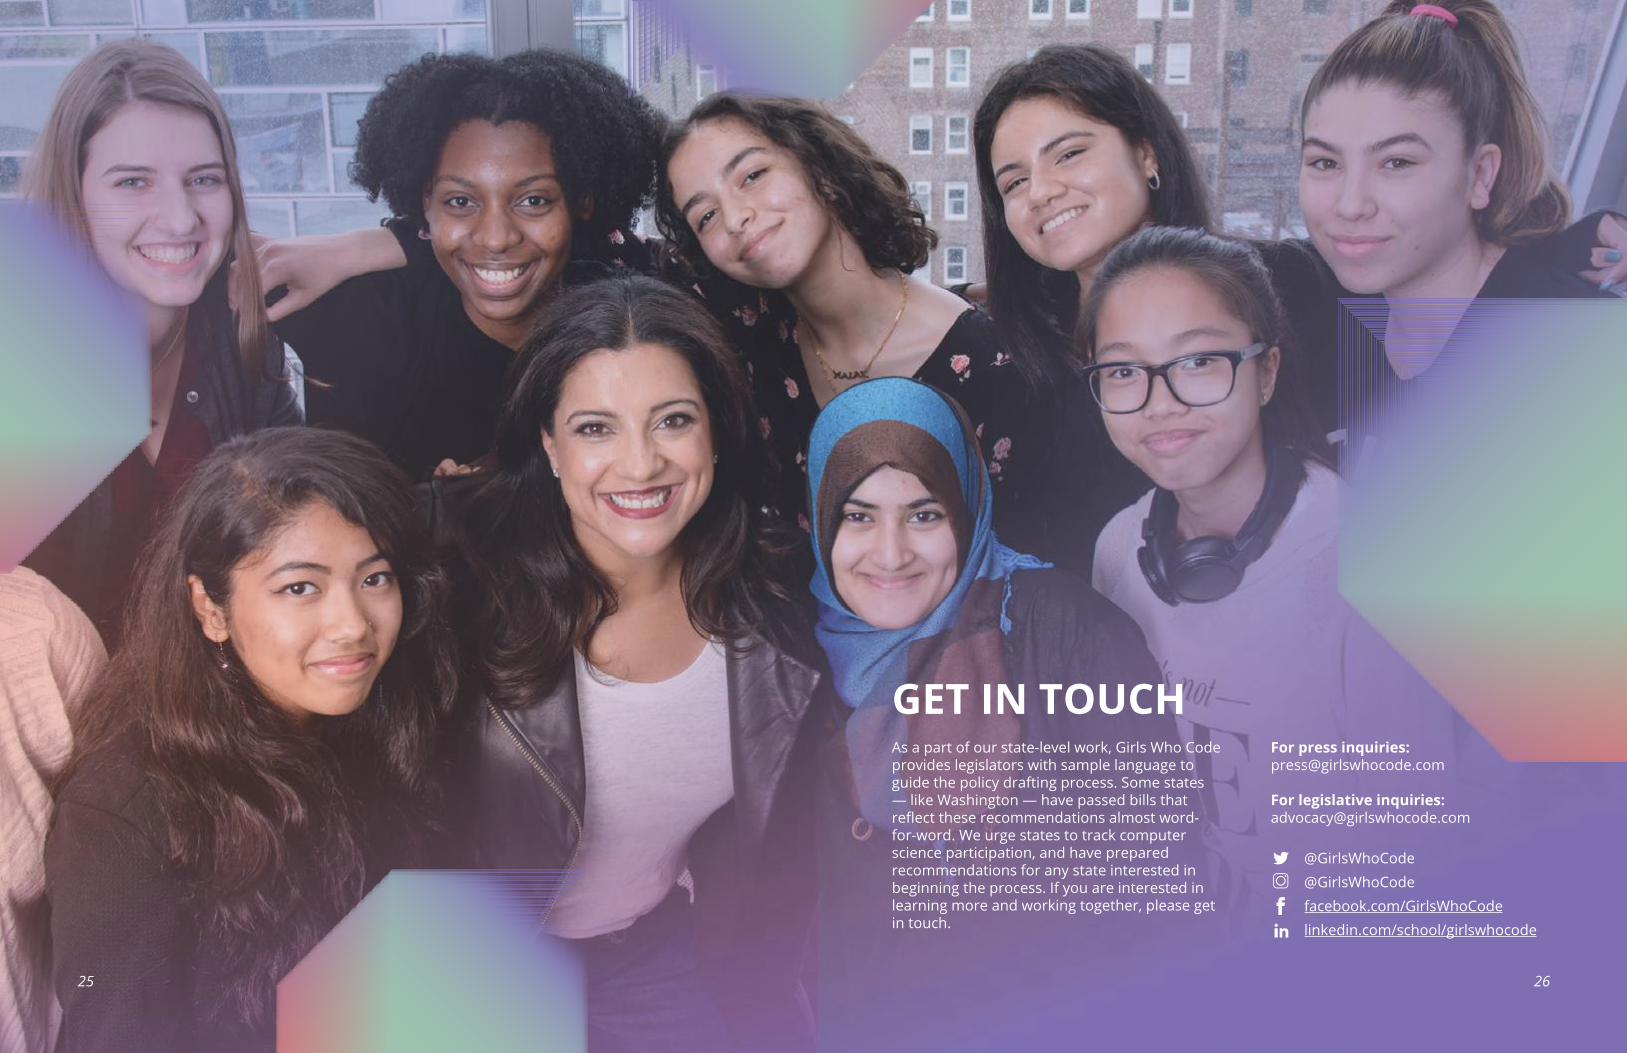
GET IN TOUCHAs a part of our state-level work, Girls Who Code provides legislators with sample language to guide the policy drafting process. Some states — like Washington — have passed bills that reflect these recommendations almost word-for-word. We urge states to track computer science participation, and have prepared recommendations for any state interested in beginning the process. If you are interested in learning more and working together, please get in touch.
For press inquiries: [email protected]
For legislative inquiries: [email protected]
@[email protected]/GirlsWhoCodelinkedin.com/school/girlswhocode

Girls Who Code © 2019 | www.girlswhocode.com
2019 ADVOCACY REPORT
THE STATE OF GIRLS IN K-12 COMPUTER SCIENCE CLASSROOMS: MAKING THE CASE FOR GENDER-SPECIFIC EDUCATION POLICIES