2020 annual report - globenewswire
TRANSCRIPT

A.P. Møller - Mærsk A/S Esplanaden 50, DK-1098 Copenhagen K / Registration no. 22756214
2020Annual
Report
Table of contents
The Annual Report for 2020 of A.P. Møller - Mærsk A/S (here-inafter referred to as A.P. Moller - Maersk as the consolidated group of companies and A.P. Møller - Mærsk A/S as the parent company) has been pre pared in accordance with the International Financial Reporting Standards (IFRS) as adopted by the EU and further requirements in the Danish Financial Statements Act.
Changes in presentation and comparative figuresFrom Q1 2020, as part of the refinement of A.P. Moller - Maersk’s segment structure to align with the internal management structure and demarcation between the reportable segment activities, a number of changes have
been made, see note 23 Significant accounting policies. Com-parison figures have been restated.
Unless otherwise stated, all figures in parenthesis refer to the corre sponding figures for the same period prior year.
Forward-looking statementsThe Annual Report contains forward-looking statements. Such statements are subject to risks and uncertainties as various factors, many of which are beyond A.P. Moller - Maersk’s con-trol, may cause the actual development and results to differ materially from expectations contained in the Annual Report.
3 Directors’ Report4 At a glance
5 Highlights
6 Key activities in 2020
7 Message from the Chairman and the CEO
11 Financial review
13 Full-year guidance for 2021
14 Five-year summary
16 Market update
20 Our business
21 Business model
22 Strategy
26 Customer interview
28 Sustainability
32 Risk management
36 Performance
37 Performance overview
38 Ocean
42 Logistics & Services
44 Terminals & Towage
48 Manufacturing & Others
49 Governance
50 Corporate governance
55 Board of Directors
58 Executive Board
59 Remuneration
60 Shareholder information
63 Financials 64 Consolidated financial statements 2020
112 Parent company financial statements 2020
136 Statement of the Board of Directors and the Executive Board
137 Independent Auditor’s Reports
141 Additional information142 Quarterly summary2
144 Company overview 1
147 Stock exchange announcements
148 Definition of terms
149 External financial reporting for A.P. Moller - Maersk2
1 Part of Financials 2 Part of the Directors’ Report
A.P. Moller - Maersk’s ambition is to have net-zero CO2 emissions from ocean operations by 2050
For more than a century, we have built partnerships with customers, enabling them to prosper by facilitating global trade.
FROM OUR BUSINESS MODEL
Cover photoIn Alaska, sisters Claire and Emma (pictured) launched a clothing brand, Salmon Sisters, based on their upbringing and work as fishermen. Container ship-ping helps bring their catch (and clothing) to customers around the world and sus-tain the unique lifestyle of their remote community.
2 A.P. Moller - Maersk Annual Report 2020 Contents

Directors’ Report
The progress towards becoming the global integrator of container logistics accelerated in 2020
At a glance
Highlights
Key activities in 2020
Message from the Chairman and the CEO
Financial review
Full-year guidance for 2021
Five-year summary
Market update
Our business
Performance
Governance
3 A.P. Moller - Maersk Annual Report 2020

2020 2019 2018 2017 2016
5,712
4,998
3,546
2,579
2020 2019 2018 2017 2016
2020 2019 2018 2017 2016
38,890 39,25731,189 27,646
2020 2019 2018 2017 2016
44.9 42.1 39.6 40.0
2020 2019 2018 2017 2016
11,66214,953 14,971
11,420
At a glanceA.P. Moller - Maersk is an integrated container logistics company, connecting and simplifying trade to help customers grow and succeed. With a dedicated team of over 80,000 employees, operating in 130 countries, we go all the way to enable global trade for a growing world. A.P. Moller - Maersk comprises four business segments with the consolidated key results presented below.
Note: 2018 presented as if IFRS 16 had been implemented in 2018, for comparison purposes. For 2016 and 2017, lease liabilities are not included in net interest-bearing debt. Consequently, comparatives for EBITDA and net Interest-bearing debt for the period 2016-2017 are not comparable with the period 2018-2020.
Revenue increased by USD 850m, despite lower volumes in Ocean and gateway terminals due to the negative impacts from COVID-19.
Net interest-bearing debt decreased by USD 2.4bn, mainly driven by increased free cash flow, partly offset by share buy-back, dividends and acquisitions.
Relative CO2 efficiency improved 2.5% (year-over-year) compared to 2019 driven by both technical and operational improvement initiatives. 1 Percentage improvement in Energy Efficiency Operational Indicator (EEOI)
relative to 2008 baseline. A more exact calculation was implemented in 2020, and comparison figures have been restated.
Free cash flow increased by USD 2.3bn, reflecting a continued capital discipline and higher cash flow from operating activities, lower gross CAPEX and a continued high cash conversion.
EBITDA increased by USD 2.5bn, with improvements across all segments and with Ocean improving the most by USD 2,1bn.
Revenue (USD million)
39,740Net interest-bearing debt (USD million)
9,232
Relative CO2 reduction1 (percentage)
46.3
EBITDA (USD million)
Free cash flow (USD million)
4,648
8,226
2,340
-295 -1,273 -696
4 A.P. Moller - Maersk Annual Report 2020 Directors’ Report At a glance

Highlights Progressing on the strategy
The transformation towards becoming the global integrator of container logistics accelerated in 2020 and all transformation metrics improved further. The metrics relate to growing the A.P. Moller - Maersk logistics business and improve earnings in infrastructure and logistics, while gen-erating free cash flow to ensure a strong balance sheet and to create value for the shareholders of A.P. Moller - Maersk.
A.P. Moller - Maersk significantly improved the free cash flow and generated a cash return on invested capital of 16.6% (10.0%), based on stronger cash flow from operations, lower gross CAPEX and slightly lower invested capital.
Infrastructure and logistics revenue (excl. freight forwarding) increased to USD 9.4bn (USD 9.2bn), mainly due to increased revenue in logistics from warehousing and distribution, due to acquisitions, and supply chain management despite headwinds from gateway terminals, given impacts from COVID-19.
Significant improvement in profitability Revenue increased to USD 39.7bn (USD 38.9bn) and the continued focus on a tight cost con-trol, profitability and stronger rates led to a 44% increase in EBITDA to USD 8.2bn and a margin of 20.7% (14.7%). The strong improve-ment was mainly driven by strong cost savings in Ocean focusing on agile capacity deploy-ment, lower bunker costs and an increase in short-term freight rates. Logistics & Services improved EBITDA 110%, supported by margin optimisation in intermodal and increased prof-itability in warehousing and distribution facil-ities in North America, mainly driven by acqui-sitions. Gateway terminals reported an 8.3% improvement in EBITDA despite of a 3.6% decline in volume, as a result of lower costs.
EBIT improved to USD 4.2bn (USD 1.7bn) reflecting an improvement in the margin to 10.5% (4.4%), while underlying profit was USD 3.0bn (USD 546m).
Guidance for 2021A.P. Moller - Maersk expects earnings before interest, tax, depreciation and amortisa-tion (EBITDA) in the range of USD 8.5-10.5bn, before restructuring and integration costs and free cash flow above USD 3.5bn.
The outlook for 2021 is subject to uncertain-ties related to COVID-19, bunker fuel prices and freight rates given the uncertain macroe-conomic conditions.
Free cash flow improved due to significantly higher earnings and reduced CAPEXFollowing the strong earnings development and a cash conversion ratio of 95% (104%), cash flow from operating activities was USD 7.8bn (USD 5.9bn). CAPEX was USD 1.3bn (USD 2.0m), and free cash flow was USD 4.6bn (USD 2.3bn).
CAPEX discipline remains a key focus area, reflected in the accumulated CAPEX guidance of USD 4.5-5.5bn for 2021-2022.
Digital momentum2020 has been a year that has reinforced the customer interest for A.P. Moller - Maersk’s digital offerings. Maersk Spot continued to gain significant traction during the year and the use of the Maersk App increased by 300%. Twill has increased weekly volumes which was 13 times larger compared to the same period the previous year and new dig-ital solutions such as Maersk Flow, NeoNav and the Transformation Management Sys-tem platform in the logistics business were launched to further enhance customer expe-rience and engagement.
Logistics & Services EBITDA (excl. freight for-warding and restructuring costs) improved to USD 470m (USD 221m) as a result of margin optimisation in intermodal and warehousing and distribution, supported by the acquisition of Performance Team, a US-based warehousing and distribution company, as well as KGH Cus-toms Services, a leading specialist in trade and customs services management in Europe.
Return on invested capital (ROIC), last twelve months, increased significantly to 9.4% (3.1%), as earnings were strong and invested capital decreased slightly. The underlying return on invested capital increased to 9.6% (3.2%).
A.P. Moller - Maersk’s progress towards becoming the global integrator of con-tainer logistics accelerated in 2020
New acquisitions Performance TeamKGH Customs Services
9.4bn Infrastructure and Logistics revenue, USD (excl. freight forwarding)
470m Logistics & Services EBITDA, USD (excl. freight forwarding)
5 A.P. Moller - Maersk Annual Report 2020 Highlights 2020Directors’ Report

Feb Apr Apr May Jun Jul Sep Oct
Key activities in 2020
Maersk FlowA.P. Moller - Maersk launches Maersk Flow, a digital supply chain manage-ment platform to support small and medium-sized businesses.
A simplified Ocean and Logistics organisationThe reorganisation of Ocean and Logistics & Services is com-plete, and the integration of the Safmarine brand, Damco air freight and LCL will improve customer experience and end-to-end service delivery.
300%* increase in usage of the Maersk app*Year-over-year growth
3% of global carbon emissions come from shipping
Digital solutions in demandWith customers working from home, their reliance on e-commerce leads to record-high demand for digital solutions, such as the Maersk app, Maersk Spot, Twill and TradeLens.
The COVID-19 pandemicKeeping our people safe, serving our customers, and helping society become our three top priorities as the pandemic impacts people and supply chains globally.
New terminal went live in Tema, GhanaThe terminal has 16 meters of draught and can handle 23 TEU wide vessels. Once fully ramped up, the terminal will have a throughput capacity of 3.5m TEU.
Performance Team A.P. Moller - Maersk closes the acquisition of the US-based warehousing and distribution company, making it one of North America’s leading providers.
KGH Customs ServicesA.P. Moller - Maersk completes the acquisition of the European customs services specialist to further enhance its logistics and services offering.
Launch of Mærsk Mc-Kinney Møller Center for Zero Carbon Shippingby the A.P. Møller Foundation and a group of leading industry players to develop newnet-zero fuel types and technologies.
6 A.P. Moller - Maersk Annual Report 2020 Key activities in 2020Directors’ Report

Message from the Chairman and the CEO
Real momentum as strategy delivers tangible resultsThe transformation of A.P. Moller - Maersk from a diversified conglomerate to a focused and inte-grated global logistics company is well under way.
A.P. Moller - Maersk today offers a broad and global portfolio of logistics products from ocean and air transport to inland transportation, ware-housing and distribution – including cold stor-age, customs services and lead logistics prod-ucts, such as supply chain management services and e-com fulfilment, as well as container port services and towage.
Our strategy is built on three core elements: Firstly, we offer our customers end-to-end digi-tally enabled transport and logistics services that help them manage their supply chains, sell their products globally, and source from the most com-petitive suppliers worldwide. For us to deliver superior value to our customers, we have built our land-based logistics and service offerings in a way that seamlessly integrates with our strong, leading and sustainable Ocean business. This enables us to leverage the commercial synergies inherent in selling land-based logistics services to our 70,000 customers in our Ocean business.
Jim Hagemann SnabeChairman of A.P. Møller - Mærsk A/S
Søren SkouCEO of A.P. Møller - Mærsk A/S
7 A.P. Moller - Maersk Annual Report 2020 Message from the Chairman and the CEODirectors’ Report

Secondly, we are leveraging the financial and operational synergies between our Ocean busi-ness and our Terminals business for lower cost as well as higher productivity and asset utilisation. Owning and operating container ports enables us to control our global transhipment hubs that are crucial for the reliability and cost effectiveness of our Ocean network.
And thirdly, we are building competitive advantage through technology. We are digitising the interac-tion with our customers while offering unique dig-ital products and leveraging Maersk.com, which is one of the biggest B2B transaction platforms in the world. We are standardising, automating and digitising our core processes as well as our assets, such as ships, containers, warehouses and ports, to manage fuel cost and improve visibility in sup-ply chains, while lowering the overall cost base.
Disciplined execution enables us to perform and transformSince we embarked on our transformation to become the global integrator of container logis-tics, we have executed the strategy consistently and with discipline. Despite a backdrop of weak trade growth, ongoing trade tensions, geopoliti-cal uncertainty and a pandemic in 2020, we have improved our financial performance while we transformed our business.
We achieved good results in a year with extraordi-nary demand fluctuations due to COVID-19, which led from a sharp oversupply of capacity in Q1 to a shortage of vessels and equipment in the second half as demand rebounded, leading to a signifi-cant increase in short-term freight rates. We leave 2020 with a strong balance sheet which enable us to both increase payouts to our shareholders and fund the transformation that will enable the long-term growth of the company.
The work we have done over the past five years to improve the performance of our Ocean business delivered solid results in 2020. Our acquisition of Hamburg Süd in 2017, our focus on cost, and our disciplined approach to CAPEX were all contribut-ing factors to the delivery of excellent results and strong cash flow in 2020. In parallel, we developed new, unique products such as Maersk Spot, which offers loading guarantee, easy online booking and a fixed price for our short-term customers.
Our Logistics & Services business delivered excel-lent margin growth in 2020 and good revenue growth, mainly through acquisitions. We restruc-tured further to reduce cost and develop end-to-end products. We began the implementation of new technology platforms and recruited new leadership and logistics experts globally. Our
Logistics & Services business grew revenue to almost USD 7bn with competitive margins and a sound foundation to accelerate growth in the coming years.
In Terminals, we have executed a turnaround since 2016 and the business has shifted its focus from developing new terminals to becoming a world-class terminal operator. Results and cash genera-tion have steadily improved, also in 2020, despite lower volumes. Due to strong cost performance across all segments, we now have an infrastruc-ture business with resilient returns.
Continuing the transformationAt the Annual General Meeting in 2020, we announced three metrics to track progress on our strategic transformation. During 2020, we progressed well despite challenging market conditions:• Cash return on invested capital (CROIC), last
twelve months, increased to 16.6% (10.0%), due to stronger cash flow from operations, lower gross CAPEX, and lower invested capital.
• Infrastructure and Logistics revenue (excl. freight forwarding) increased to USD 9.4bn (USD 9.2bn), mainly due to the acquisition of Perfor-mance Team, a leading US-based warehousing and distribution company, only partly offset by lower revenue in gateway terminals because of the impacts from COVID-19.
• Logistics & Services EBITDA (excl. freight for-warding) improved to USD 470m (USD 221m) as a result of margin optimisation in intermodal and supported by the acquisition of Perfor-mance Team.
ROIC, which is the overall return ambition of A.P. Moller - Maersk increased to 9.4% compared to 3.1%, driven by significantly improved earnings.
Strategic milestones strengthen integrated offeringIn 2020, we finished the restructuring of our Ocean and Logistics & Services businesses into one, integrated and simplified organisation to enable further improvements in the customer experience and end-to-end service delivery.
“ Since we embarked on our trans-formation to become the global integrator of container logistics, we have executed the strategy consistently and with discipline.“
“ We have improved our financial performance while we transformed our business.“
8 A.P. Moller - Maersk Annual Report 2020 Message from the Chairman and the CEODirectors’ Report

The Safmarine brand and Damco’s Air and LCL (Less than Container Load) offerings were inte-grated into the Maersk brand to enhance cus-tomer access to the global offering, while Damco’s ocean freight forwarding business has closed from 1 January 2021.
In April 2020, we acquired Performance Team, and in September, we closed the deal on KGH Customs Services, a leading specialist in trade and customs services management in Europe. Both companies are logistics experts within their fields, customer feedback is positive, and we have added important capabilities and immensely strengthened our logistics offering and geographical footprint.
On the digital side, we have benefited from our early investments in digitisation and seen a huge uptake on Maersk.com and the Maersk App, as customers have embraced the digital space even more this year on the back of the pandemic.
Our customers also appreciate the predictability, reliability and ease that Maersk Spot offers. The online booking solution has grown exponentially from 20% of short-term volume in the last four weeks of 2019 to 51% in the same period of 2020 under the Maersk brand. Twill, an online service for small and medium-sized businesses, has also experienced immense growth this year. In 2020, more than 2,500 new customers booked on Twill with volumes exceeding 100,000 FFE, represent-ing a 13 fold year-over-year growth. In the terminal space, our Pier 400 terminal in Los Angeles is progressing on a multi-year automation programme and has carried out the first commer-cial, fully automated moves in the third quarter. Digitising our assets enables speed, operational ease, safer operations and lower cost.
Building competitive advantage from technologyTechnology and digitisation of our industry are key to the transformation at A.P. Moller - Maersk. Through technology, we are offering new prod-ucts, connecting and simplifying the customer experience and enabling more efficient operations and utilisation of assets. We want to build sustain-able, competitive advantage through the follow-ing focus areas:
Firstly, we are building new digital platforms, which enable integrated offerings, standardisation and automation. In particular, TradeLens, which is an open and neutral supply chain platform jointly developed with IBM, continues to gain momen-tum as new customers, partners, and suppliers onboard. The tenants of this platform are already benefiting from increased visibility of events in their supply chains and reduced costs from having access to a digital bill of lading.
Secondly, we are strengthening our investment in Internet of Things (IoT) and automation of our terminals to drive better management of our physical assets and efficiencies in our operations. In particular, we are building a roadmap to har-ness near real-time data from devices in our ves-sels, containers and terminals and drive intelli-gent decision making in our operations and for our customers.
Thirdly, we are committed to leveraging data as a discrete and differentiating asset that will offer data products, such as visibility, and democratise access to data to serve our customers better.
Our technology roadmap is enabled through a common and scalable enterprise architecture, a cloud-first strategy, and continued investment
in digital cyber security. This is made possible through focused efforts to insource high-value IT-capabilities to develop one of the leading IT organisations in the industry.
Our response to a global emergencyThe COVID-19 pandemic continues to impact the world. As a global company and industry leader, we have remained focused on protecting our employ-ees, supporting our customers and contributing to the societies we are part of by keeping goods flow-ing throughout the pandemic – ensuring essential food, protective equipment and medical supplies.
Our colleagues at sea, in our ports and at our warehouses have been in the eye of the storm. They have kept the world’s goods moving by showing up to work every day. In particular, our colleagues at sea have contributed by taking longer shifts on board than anyone would have imagined. Our single biggest challenge has been to relieve our seafarers after their tour has ended,
“ Technology and digitisation of our industry are key to the transformation at A.P. Moller - Maersk.”
due to travel restrictions, closed borders and the constant change of local regulations and require-ments. By the end of the year, we had succeeded in relieving due crew members from our vessels and bringing them home to their families and friends.
On shore, we have taken extraordinary measures to protect our workers at ports, warehouses and other frontline locations. Our office-based col-leagues have shown their resilience by adapting to working from home to the extent possible, and we have done our outmost to support this change, mentally and physically.
Amid a pandemic that has large impacts on supply chains, customers need flexible and robust solu-tions. With our integrated approach, we are sup-porting their end-to-end logistics needs, while con-trolling the most central assets and offering alter-native solutions as borders close, air traffic stops and roads are blocked.
9 A.P. Moller - Maersk Annual Report 2020 Message from the Chairman and the CEODirectors’ Report
Unwavering commitment to sustainabilitySustainability continues to be at the top of our agenda, and we are fully committed to our ambi-tion of reducing CO2 emissions as we continue to work towards carbon neutrality in 2050. Our cus-tomers are supporting the ambition and demand-ing responsible transportation of their goods so they can limit their own footprint, and this expec-tation is also reflected among our investors.
In 2020, we updated our sustainability priorities. Our key focus areas reached a level of maturity where they are now fully integrated into our busi-ness practices.
Decarbonising logistics is the one commitment where we can make the greatest contribution to climate action. In June 2020, the A.P. Møller Foun-dation established the Mærsk Mc-Kinney Møller Center for Zero Carbon Shipping to take the next step to develop new fuel types and technologies together with a group of likeminded global indus-try leaders. The centre is a non-profit, independent research centre that will work across the entire shipping sector with industry, academia and authorities to find real-life solutions. We would like to thank the A.P. Møller Foundationfor making this possible thereby demonstrating the essence of our shared values and strong lead-ership in the efforts towards reducing the indus-try’s carbon emissions to zero by 2050.
In addition, we remain committed to our broader sustainability agenda, including our role in multi-plying the benefits of trade, contributing to halving food loss and improving the ship recycling industry.
We are proud of the progress made so far and remain committed to all our stakeholders to be an innovative and responsible global integrator of container logistics.
2021 – continuing to perform while we complete the transformationIn 2021, we will continue to focus on growing our landside logistics, expanding our product portfolio to all relevant markets and increasing cross-selling and upselling to our customers to deliver profita-ble, organic growth. In addition, we expect to con-tinue to acquire capabilities and growth platforms, particularly within warehousing and distribution, air freight as well as customs services to further strengthen our integrated product offerings.
In Ocean, our focus will be on developing our existing products further as well as adding new and unique products to our portfolio. We will remain focused on optimising our network and cost structure to ensure we stabilise earnings and deliver good, sustainable returns in our largest business.
In Terminals, our focus continues to be on improv-ing the operating performance of our portfolio of ports, financially and operationally. We will drive further synergies with our Ocean business, com-plete our automation project in Los Angeles and our construction project for a new terminal in Abidjan, Ivory Coast, and mature plans for future growth in our portfolio, including automation.
Thank you for your continued supportOn May 1, we welcomed our new CFO and member of the Executive Board, Patrick Jany. Patrick brings solid financial experience and a proven record of managing cost discipline and profitable growth through M&As and innovation. We are also happy to welcome Blythe S. J. Masters to the Board of Directors. Blythe has added critical capabilities to the Board with her international outlook and experience within financial services and tech-nology, having extensive knowledge in start-ups, platforms and blockchain.
“ We are fully committed to our ambition of reducing CO2 emissions as we continue to work towards carbon neutrality in 2050.”
We would like to thank our 80,000 colleagues deeply for their truly extraordinary efforts to keep trade moving under such challenging conditions.
In times of increased uncertainty, open supply chains and free global trade is more relevant than ever. We remain optimistic about society’s ability to recover and committed to building on the strong business momentum and foundation that has now been established as we enter another transformative year for A.P. Moller - Maersk.
Jim Hagemann SnabeChairman
Søren SkouCEO
10 A.P. Moller - Maersk Annual Report 2020 Message from the Chairman and the CEODirectors’ Report

Financial reviewA.P. Moller - Maersk reported an EBITDA of USD 8.2bn, and USD 8.3bn excluding restructuring and integration costs, compared to the original guidance of around USD 5.5bn given in February 2020, and in line with the upgraded EBITDA expec-tations announced in November 2020. The increase in EBITDA of USD 2.5bn was mainly driven by improved earnings in Ocean, led by lower cost from agile capac-ity deployment and lower bunker cost, as well as increased freight rates. Logistics & Services more than doubled its EBITDA, while Terminals & Towage proved their resilience by maintaining profitability despite a strong impact from the pandemic. Free cash flow increased significantly supported by strong cash flow from opera-tions and continued capital discipline, and as a result, net interest-bearing debt has been significantly reduced and a second share buy-back launched.
Highlights for the yearUSD million Revenue EBITDA CAPEX 1 1 See definition
on page 148.2020 2019 2020 2019 2020 2019
Ocean 29,175 28,782 6,545 4,436 653 1,172
Logistics & Services 6,963 6,331 454 216 109 126
Terminals & Towage 3,807 3,948 1,205 1,118 457 532
Manufacturing & Others 1,254 1,376 165 136 33 204
Unallocated activities, eliminations, etc. -1,459 -1,547 -143 -194 70 1
A.P. Moller - Maersk consolidated – continuing operations 39,740 38,890 8,226 5,712 1,322 2,035
Return on invested capital (ROIC), last twelve months, increased to 9.4% (3.1%)
Financial and operational performanceA.P. Moller - Maersk reported a revenue of USD 39.7bn (USD 38.9bn) with an increase in Ocean of USD 393m with negative effects from COVID-19 on loaded volumes predominantly in Q2 offset by higher short-term rates and a strong rebound in vol-umes Q4. In Logistics & Services revenue increased by USD 632m, driven by warehousing and distri-bution including Performance Team acquired in April 2020, and air freight forwarding. Terminals & Towage and Manufacturing & Others reported a decrease in revenue of USD 141m and USD 122m, respectively, negatively impacted by COVID-19.
EBITDA increased by 44% to USD 8.2bn (USD 5.7bn) with increases in all segments, primarily in Ocean by USD 2.1bn, driven by higher revenue and a lower cost base mainly due to agile capacity deployment com-bined with a lower bunker price and consumption. This was also supported by the exceptional situation with demand surge leading to bottlenecks in the sup-ply chain and equipment shortage experienced in the second half of 2020. Logistics & Services delivered a strong increase of 110% or USD 238m, driven by acquisitions and profitability increases in intermodal, air freight and warehousing and distribution. The impact from foreign exchange rates was negligible.
EBIT was USD 4.2bn (USD 1.7bn), positively impacted by the improved EBITDA, and the net result from the sale of containers, vessels and facilities, partly offset by impairments du to the market environment in 2020.
Return on invested capital (ROIC), last twelve months, increased to 9.4% (3.1%), as earnings improved sig-nificantly and invested capital was slightly reduced.
Financial expenses, net, amounted to USD 879m (USD 758m), positively impacted by lower gross debt, more than offset by negative foreign
11 A.P. Moller - Maersk Annual Report 2020 Financial review 2020Directors’ Report

exchange rate impacts and costs relating to pre-payment of borrowings.
Tax decreased to USD 407m (USD 458m). The effective tax rate decreased as a larger proportion of profit before tax was earned in the Ocean seg-ment, subject to tonnage taxation.
Net profit was USD 2.9bn (loss of USD 44m) due to significant improvement in operating earnings, while the result for discontinued operations in 2019 negatively impacted the net loss of USD 553m due to a fair value adjustment with Maersk Drilling being demerged on 2 April 2019.
The underlying net profit after financial items and tax was USD 3.0bn (USD 546m), due to the improved operational performance.
Cash flow from operating activities was USD 7.8bn (USD 5.9bn), positively impacted by an increase in EBITDA of USD 2.5bn, a decrease in tax paid of USD 77m, offset by negative change in net working cap-ital of USD 239m (positive USD 476m), leading to a cash conversion of 95% (104%).
Gross capital expenditure (CAPEX) was USD 1.3bn (USD 2.0bn), and lower than guidance of USD 1.5bn due to lower investments in all segments.
Free cash flow was USD 4.6bn (USD 2.3bn), posi-tively impacted by higher cash flow from operat-ing activities and lower gross CAPEX, but partly offset by higher increased lease payments.
Cash flow from borrowings was negative USD 1.9bn (negative USD 1.5bn), due to repayments of USD 3.2bn, partly offset by USD 1.3bn of new funding, which was driven by precautions taken due to COVID-19 in Q2.
Contractual capital commitments totalled USD 1.7bn (USD 1.7bn), of which USD 1.3bn is related to commit-ments towards terminal concession grantors. Strong commitment to capital discipline and free cash flow generation continue to be a key strategic focus.
Capital structure, issue of bonds and credit ratingNet interest-bearing debt decreased to USD 9.2bn (USD 11.7bn), as free cash flow of USD 4.6bn was partly offset by share buy-back of USD 806m, divi-dends of USD 520m including dividend to non-con-trolling interest, acquisitions of USD 425m, and a net increase in lease liabilities of USD 170m. Net interest-bearing debt excluding lease liabilities decreased to USD 485m (USD 3.1bn).
A.P. Moller - Maersk remains investment grade-rated and holds a Baa3 (positive) rating from Moody’s and a BBB (positive) rating from Standard & Poor’s.
Total equity was USD 30.9bn (USD 28.8bn), mainly due to a net profit of USD 2.9bn and addition of non-con-trolling interest of USD 288m partly offset by div-idends of USD 520m and share buy-back of USD 806m, resulting in an equity ratio of 55.0% (52.1%).
The liquidity reserve of USD 11.0bn (USD 10.5bn), composed of liquid funds of USD 4.8bn excluding restricted cash (USD 3.8bn) and undrawn revolving credit facilities of USD 6.2bn (USD 6.6bn).
The ordinary dividend of DKK 150 per A.P. Møller - Mærsk A/S share of nominally DKK 1,000 (in total equal to USD 430m) declared at the Annual General Meeting on 23 March 2020 was paid on 26 March 2020. Of the DKK 150, DKK 75 was related to the underlying profit of the finan-cial year 2019, and DKK 75 was related to gain from the sale of Total S.A. shares.
The Board of Directors proposes an ordinary divi-dend to the shareholders of DKK 330 per share of DKK 1,000 (DKK 150 per share of DKK 1,000) cor-responding to 35% of underlying net result as per the company’s dividend policy of distributing between 30-50% of the underlying net result to shareholders in dividend.
The proposed dividend payment represents an ordinary dividend yield of 2.4% (1.6%), based on the Maersk B share’s closing price of DKK 13,595 as of 30 December 2020. Payment is expected to take place on 26 March 2021.
Share buy-backThe share buy-back programme initiated in Q2 2019 was concluded on 24 July 2020 and A.P. Moller - Maersk has repurchased USD 1.5bn worth of shares.
On 1 June 2020, the cancellation of 156,977 A shares and 627,938 B shares was completed
We have a strong balance sheet andare committed to remaining investmentgrade-rated.
FROM OUR BUSINESS MODEL
corresponding to 3.77% of the total share capital in A.P. Moller - Maersk.
In November 2020, the Board of Directors decided to initiate a new share buy-back programme of DKK 10bn (around USD 1.6bn) and the programme will run from December 2020 over a period of up to 15 months.
This will conclude the distribution associated with the sale of Maersk Oil and any further distribution to shareholders will come from the continuing busi-ness activities.
During Q4, A.P. Moller - Maersk bought back 10,306 A shares and 41,232 B shares worth DKK 673m (around USD 110m).
At 31 December 2020, A.P. Moller - Maersk owns a total of 119,176 A-shares and 505,281 B-shares as treasury shares, corresponding to 3.47% of the share capital.
12 A.P. Moller - Maersk Annual Report 2020 Financial review 2020Directors’ Report

Full-year guidance for 2021Given the current outlook and high degree of uncer-tainty related to the continued impact from COVID-19 on the economic growth and global demand patterns, A.P. Moller - Maersk expects for the full-year 2021:
• Underlying EBITDA in the range of USD 8.5-10.5bn compared to USD 8.3bn in 2020
• Underlying EBIT in the range of USD 4.3-6.3bn compared to USD 4.2bn in 2020
• Free cash flow (FCF) above USD 3.5bn compared to USD 4.6bn in 2020.
As part of the full-year guidance for 2021, A.P. Moller - Maersk expects the current exceptional situation with the demand surge leading to bottle-necks in the supply chain and equipment shortage, which contributed by approximately USD 1.5bn to EBIT in 2020, to continue in Q1 and normalise there-after. Consequently, A.P. Moller - Maersk expects profitability in Q1 2021 to be above Q4 2020.
Ocean is expected to grow in line with the global container demand at an expected 3-5% in 2021, with the highest growth seen in the first half-year.
For the years 2021-2022, the accumulated CAPEX is still expected to be USD 4.5-5.5bn.
Sensitivity guidance
Financial performance for A.P. Moller - Maersk for the full year 2021 depends on several factors and is subject to uncertainties related to COVID-19, bunker fuel prices and freight rates given the uncertain macroeconomic conditions.
All else being equal, the sensitivities for the full year 2021 for four key assumptions are listed in the table below:
Factors Change Effect on EBIT(midpoint of guidance)
(Full year 2021)
Container freight rate +/- 100 USD/FFE +/- USD 1.3bn
Container freight volume +/- 100,000 FFE +/- USD 0.1bn
Bunker price (net of expected BAF coverage) +/- 100 USD/tonne +/- USD 0.4bn
Rate of exchange (net of hedges) +/- 10% change in USD +/- USD 0.2bn
Underlying EBITDA is earnings before interest, taxes, depreciation and amortisation adjusted for restructuring and integration costs.
Underlying EBIT is operating profit before interest and taxes adjusted for restructuring and integration costs, net gains/losses from sale of non-current assets and net impairment losses.
13 A.P. Moller - Maersk Annual Report 2020 Full-year guidance for 2021Directors’ Report

Five-year summary 1/2Income statement 2020 2019 20181 20175 20165 1 Following the classification of Maersk Oil, Maersk
Tankers, Maersk Drilling and Maersk Supply Service as discontinued operations in 2017, the businesses are pre-sented separately on an aggregated level in the income statement, balance sheet and cash flow statements. In accordance with IFRS, the income statement and cash flow statement have both been restated in previous periods, while the balance sheet has not been restated in previous periods. The Maersk Tankers transaction was closed 10 October 2017, the Maersk Oil transaction 8 March 2018 and Maersk Drilling was demerged on 2 April 2019. 2018 is presented as if IFRS 16 had been implemented in 2018.
2 Underlying profit/loss is profit/loss for the period from continuing operations adjusted for net gains/losses from sale of non-current assets, etc. and net impairment losses as well as transaction, restructuring and integration costs related to acquisitions/divestments. The adjust-ments are net of tax and include A.P. Moller - Maersk’s share of mentioned items in associated companies and joint ventures.
3 Compared to prior periods, the definition of net interest- bearing debt has been adjusted to include fair value of the derivatives hedging the underlying debt. The adjust-ment is not reflected in 2016 and 2017.
4 Excluding Hamburg Süd for comparison purposes end of December 2017.
5 2016 and 2017 are presented without impact of IFRS 16.
Revenue 39,740 38,890 39,257 31,189 27,646Profit before depreciation, amortisation and impairment losses, etc. (EBITDA) 8,226 5,712 4,998 3,546 2,579Depreciation, amortisation and impairment losses, net 4,541 4,287 4,756 3,263 3,851Gain on sale of non-current assets, etc., net 202 71 166 153 189Share of profit/loss in joint ventures and associated companies 299 229 1 -30 75Profit/loss before financial items (EBIT) 4,186 1,725 409 406 -1,008Financial items, net -879 -758 -766 -620 -549Profit/loss before tax 3,307 967 -357 -214 -1,557Tax 407 458 398 232 146Profit/loss for the year – continuing operations 2,900 509 -755 -446 -1,703Profit/loss for the year – discontinued operations1 - -553 3,787 -719 -194Profit/loss for the year 2,900 -44 3,032 -1,165 -1,897A.P. Møller - Mærsk A/S’ share 2,850 -84 2,985 -1,205 -1,939
Underlying profit/loss – continuing operations2 2,960 546 -61 286 -547
Balance sheet
Total assets 56,117 55,399 62,690 63,227 61,118Total equity 30,854 28,837 33,205 31,425 32,090Invested capital 40,121 40,555 49,255 46,297 43,491Net interest-bearing debt3 9,232 11,662 14,953 14,971 11,420Investments in non-current assets – continuing operations 4,430 9,809 10,772 9,656 4,710
Cash flow statement
Cash flow from operating activities4 7,828 5,919 4,442 3,115 1,675Gross capital expenditure, excl. acquisitions and divestments (CAPEX) 1,322 2,035 3,219 4,050 2,105Cash flow from financing activities 5,618 4,800 8,080 532 725Free cash flow 4,648 2,340 -295 -1,273 -696Net cash flow from discontinued operations - -372 3,968 1,824 822
14 A.P. Moller - Maersk Annual Report 2020 Five-year summary Amounts in USD million Directors’ Report

Five-year summary 2/2Financial ratios2 2020 2019 2018 1 20175 20165 1 Following the classification of Maersk Oil, Maersk
Tankers, Maersk Drilling and Maersk Supply Service as discontinued operations in 2017, the businesses are pre-sented separately on an aggregated level in the income statement, balance sheet and cash flow statements. In accordance with IFRS, the income statement and cash flow statement have both been restated in previous periods, while the balance sheet has not been restated in previous periods. The Maersk Tankers transaction was closed 10 October 2017, the Maersk Oil transaction 8 March 2018 and Maersk Drilling was demerged on 2 April 2019. 2018 is presented as if IFRS 16 had been implemented in 2018.
2 Underlying profit/loss is profit/loss for the period from continuing operations adjusted for net gains/losses from sale of non-current assets, etc. and net impairment losses as well as transaction, restructuring and integration costs related to acquisitions/divestments. The adjust-ments are net of tax and include A.P. Moller - Maersk’s share of mentioned items in associated companies and joint ventures.
3 Excluding Hamburg Süd for comparison purposes end of December 2017.
4 Relative CO2 reduction is measured using EEOI (Energy Efficiency Operational Indicator) as defined by IMO in MEPC.1/Circ.684 and calculated as g CO2/(tonne x NM). In 2020, improvement of the underlying methodology resulted in a more exact calculation of historical per-formance. Data for previous years are restated to align with the updated methodology.
5 2016 and 2017 are presented without impact of IFRS 16.
Revenue growth 2.2% -0.9% 25.9% 12.8% -10.1%EBITDA margin 20.7% 14.7% 12.7% 11.4% 9.3%Cash conversion 95% 104% 89% 88% 65%Return on invested capital after tax – continuing operations (ROIC) 9.4% 3.1% 0.2% 0.6%3 -3.4%Return on equity after tax 9.7% -0.1% 9.3% -3.6% -5.8%Equity ratio 55.0% 52.1% 53.0% 49.7% 52.5%
Stock market ratios
Earnings per share – continuing operations, USD 145 23 -37 -11 -25Diluted earnings per share – continuing operations, USD 145 23 -37 -11 -25Cash flow from operating activities per share, USD 399 288 214 150 61Ordinary dividend per share, DKK 330 150 150 150 150Ordinary dividend per share, USD 55 22 23 24 21Share price (B share), end of year, DKK 13,595 9,608 8,184 10,840 11,270Share price (B share), end of year, USD 2,246 1,439 1,255 1,746 1,597Total market capitalisation, end of year, USD million 41,957 28,000 25,256 35,419 32,215
Environmental and social data
Relative CO2 reduction (percentage vs 2008 baseline)4 46.3% 44.9% 42.1% 39.6% 40%Fatalities 1 5 7 7 2Lost-time injury frequency (LTIf) 1.27 1.16 1.29 0.89 N/AWomen in leadership (% based on headcount) 28% 27% 25% 23% N/A
15 A.P. Moller - Maersk Annual Report 2020 Five-year summary Amounts in USD million Directors’ Report

Market updateThe global economy sharply deteriorated in the spring and early summer of 2020 as a direct consequence of the COVID-19 led country lockdowns. Since then, a moderate recovery occurred as countries partially reopened and households and businesses were supported by fiscal transfers. However, the pandemic entered a second wave towards the end of 2020, which adds to the downside risk in early 2021. Social dis-tancing and country lockdowns weighed more heavily on consumptions of services than on goods consumption, which supported a faster recovery of container trade compared to the broader economy, and at the end of 2020, global container volumes were higher than at the end of 2019. Dynamics in economic activity, trade and demand patterns will be highly dependent on the further development of the COVID-19 pandemic also in 2021 with the roll-out of a vaccine during the year.
Goods demand recovered quickly during country lockdownsAs a direct consequence of the COVID-19 pan-demic, household salary income declined in 2020. While a substantial part of the income loss was compensated by extensive supporting fiscal pro-grammes and monetary policy in many countries, total consumption demand suffered, some parts of consumption more than others (chart 1). The country lockdowns in H1 and the subsequent social distancing and travel restrictions led to a collapse in services consumption. At the same time, con-sumers spent a larger part of their income on physical goods such as electronics and furniture on the back of the protected disposable income and pent-up demand. This pattern coincided with a surge in e-commerce. Consequently, the fall in goods demand became much less pronounced than in services demand.
This development was most noticeable in the US. Despite the ongoing partial lockdown, US per-sonal disposable income rose by 6.3% in 2020, due to fiscal support through the CARES Act to tackle economic implications of COVID-19. The act included recovery rebates and extra unemploy-ment insurance benefits. However, a good part of the higher incomes was set aside as extra sav-ings, and total US consumption decreased by around 4.6% in 2020. The consumption decline was entirely driven by services down by 7.3%, while goods consumption increased by 3.8%. The increase in US goods consumption drove up con-tainer demand in H2. In fact, North American con-tainer imports were 24% higher at the end of 2020, compared to the end of 2019. A similar division of growth between goods and services consumption
was recorded in Europe, although European COVID-19 restrictions were tougher and the increase in goods demand was more muted.
Going forward, it is highly uncertain if goods consumption will continue to drive up con-tainer demand. The support from higher house-hold income may diminish as unemployment has remained high and consumer confidence is well below pre-COVID-19 levels. Moreover, a continua-tion of the massive fiscal support is uncertain in the near-term, particularly in the US, if political gridlock prolongs decision making. Finally, house-holds’ appetite for services, such as travelling, could initially take up a larger share of the wallet than usual if a vaccine becomes widely available and countries reopen later in 2021.
Q1 Q2 Q3 Q4
-3.6 -11.2
Global container volumes equal December 2019 levels
Country lockdown in China reduces container flows
Strong container demandequipment shortages and supply chain bottlenecks drive up ocean freight rates
Pent-up demandfiscal support and the una-vailability of services lead to strong goods consumption
Country lockdownsin the US and Europe lead to sharp contraction in demand
5.31.6
COVID-19, daily new confirmed cases Global container demand, y/y growth (%)
The COVID-19 pandemic and economic consequences
16 A.P. Moller - Maersk Annual Report 2020 Market updateDirectors’ Report

Ocean market updateGlobal container trade declined in 2020, follow-ing the COVID-19 pandemic. Growth improved to around 5% in Q4 2020, but the sharp contraction in Q2 led to a full-year negative growth of 2%, con-siderably weaker than in 2019. The 2020 slowdown reflected the broad-based crisis across all the main economies, although the H2 2020 recovery was faster than projections made during spring. The second wave of COVID-19 weighs on the early part of 2021, while the roll-out of an effective vac-cine could have a positive impact on H2 2021.
Effective supply growth was contained during the year, as the industry adjusted fleet capacity to the deteriorating demand, and market fundamentals were broadly balanced. However, a significant demand rebound in the US and partially in Europe
together with extensive equipment shortages drove up freight rates in H2, and freight rates increased by 18% compared to 2019.
COVID-19 and container demandContainer trade growth on the East-West trades declined by 2% in 2020 (table 1). European import growth from Asia was heavily impacted by the COVID-19 pandemic in H1 and declined by 13%, first by lockdowns in China and later by lockdowns in Europe. The subsequent recovery in H2 was not strong enough to offset the initial decline. North American container imports from Asia also declined in H1 by 9.5%, but inventory restocking and a sig-nificant spike in US goods consumption fuelled by a housing boom and fiscal stimulus lifted full year import growth to around 4% in 2020. Asian imports from the US and Europe (East-West backhaul) showed a moderate decline during most quarters
Chart 2 Global container demand and nominal supply growthy/y growth, (%) Global container
demand Nominal supply Effective supply
Source: Demand and effective supply is internal Maersk and nominal supply is Alphaliner.
Chart 3Freight ratesIndex 1998 = 100 CCFI 2020
CCFI 2019 CCFI 2018
Source: Thomson/Reuters.Source: CCFI, Shanghai Shipping Exchange. Note: 2020 freight rates were signifi-cantly higher than in 2019.
Chart 1US consumption and North American container imports1,000 FFE Real consumption, Q4 2019 = 100 Imports
Total Goods Services
in 2020, reflecting the decline in global activity. North-South container trade dropped sharply in 2020. Latin American imports decreased by 9%, reflecting strong negative impact from COVID-19 in all major economies in the region. African imports decreased by 5%. Finally, intra- regional trades recorded a milder downturn, as mainly Intra-Asia with around 0% growth in 2020 proved fairly resistant to the global crisis.
As a COVID-19 vaccine becomes widely available during 2021, there is reason to believe that con-tainer demand will grow, possibly by 3-5% in 2021.
SepJanDec DecNovOctSepAugJulJunMayAprMarFebJanDec
20202019 2019 2020
202020192018201720162015201420132012DecNovOctSepAugJulJunMayAprMarFebJan
17 A.P. Moller - Maersk Annual Report 2020 Market updateDirectors’ Report
Particularly Q2 2021 will likely be high compared to Q2 2020 when country lockdowns were at their peak. However, there is substantial uncertainty about the container demand outlook in 2021. The strong goods demand that supported con-tainer volumes in 2020 could partially reverse if spending on services makes up for lost ground in 2021. Moreover, the continuation of adequate fis-cal transfers in 2021 is uncertain. Finally, labour markets remain under pressure, and unemploy-ment rates are still significantly higher than before the pandemic broke out. Upside potential mainly stems from further inventory restocking and a very fast and effective broadly distributed COVID-19 vaccine that stimulates broad-based recovery in labour markets, incomes, and busi-ness investment.
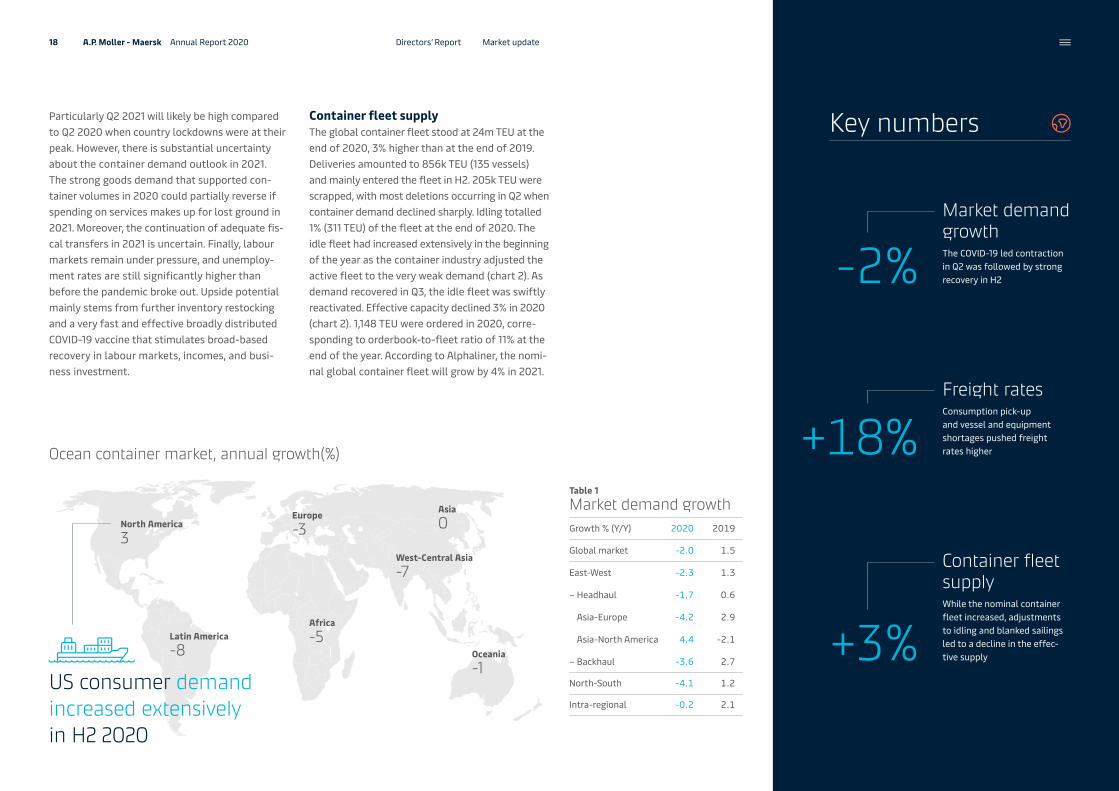
Container fleet supplyThe global container fleet stood at 24m TEU at the end of 2020, 3% higher than at the end of 2019. Deliveries amounted to 856k TEU (135 vessels) and mainly entered the fleet in H2. 205k TEU were scrapped, with most deletions occurring in Q2 when container demand declined sharply. Idling totalled 1% (311 TEU) of the fleet at the end of 2020. The idle fleet had increased extensively in the beginning of the year as the container industry adjusted the active fleet to the very weak demand (chart 2). As demand recovered in Q3, the idle fleet was swiftly reactivated. Effective capacity declined 3% in 2020 (chart 2). 1,148 TEU were ordered in 2020, corre-sponding to orderbook-to-fleet ratio of 11% at the end of the year. According to Alphaliner, the nomi-nal global container fleet will grow by 4% in 2021.
US consumer demand increased extensively in H2 2020
North America 3
Latin America-8
Europe-3
Asia 0
Oceania-1
Africa-5
West-Central Asia-7
Ocean container market, annual growth(%)
Key numbers
Market demand growthThe COVID-19 led contraction in Q2 was followed by strong recovery in H2
Freight ratesConsumption pick-up and vessel and equipment shortages pushed freight rates higher
Container fleet supplyWhile the nominal container fleet increased, adjustments to idling and blanked sailings led to a decline in the effec-tive supply
-2%
+18%
+3%
Table 1 Market demand growthGrowth % (Y/Y) 2020 2019
Global market -2.0 1.5
East-West -2.3 1.3
– Headhaul -1.7 0.6
Asia-Europe -4.2 2.9
Asia-North America 4.4 -2.1
– Backhaul -3.6 2.7
North-South -4.1 1.2
Intra-regional -0.2 2.1
18 A.P. Moller - Maersk Annual Report 2020 Market updateDirectors’ Report

vessel and equipment shortages and bottlenecks across the entire supply chain experienced in the last part of 2020.
Bunker pricesTowards the end of 2019, the industry’s switch to 0.5% sulphur fuel oils amid a tight and nerv-ous market pushed low sulphur fuel oil prices higher. High sulphur fuel oil prices in Singapore and Rotterdam hence declined by 33% and 29% from 2019 to 2020, respectively, as market sup-ply and demand dynamics calmed and the pan-demic spread worldwide, averaging USD 273/tonne and USD 248/tonne in 2020. Similarly, low sulphur fuel oil prices fell by 34% and 37% in Sin-gapore and Rotterdam from 2019 to 2020, aver-aging USD 371/tonne and USD 329/tonne, respec-tively. Lower sulphur 0.1%S marine gasoil prices
followed the downwards trend as it dived 35% to USD 390/tonne in Singapore and 35% to USD 367/tonne in Rotterdam in 2020 over 2019. Fuel oil prices have not fallen as drastically as the rest of the refined oil products in light of the demand destruction from the global pandemic and are supported by the strong and robust container shipping industry.
Singapore strengthened its position as the world’s largest bunker port, with its total bunker sales increasing by an impressive 5% in 2020 amid a global pandemic and economic downturn. Bun-ker prices have experienced an extremely vola-tile period last year at the crux of the COVID-19-in-duced pandemic. The difference between the low sulphur 0.5% fuel oil and high sulphur 3.5% fuel oil spread, also known as the hi5, plunged drasti-cally since the start of the year, but there are signs that the spread may pick up in 2021 with Singa-pore continuing to be the more active pricing cen-tre followed by Rotterdam. A.P. Moller - Maersk expects further volatility in the fuel prices in major trading regions through mid-2021 during this uncertain period.
Terminals and Logistics & Services market updateThe other transport and logistics markets were in broad terms impacted by the dynamics and mar-ket drivers that steered the ocean industry, above all the COVID-19 pandemic. According to Drewry, port throughput volumes decreased by 2.1% in 2020, with ports in most regions recording nega-tive growth rates. In line with projections for ocean trade, global port throughput growth is expected to grow significantly in 2021. The container port industry continues to combat structural
challenges stemming from the cascading of large container vessels, reinforced carrier alliances and capacity increases in many ports.
The large shifts in global trade volumes in 2020 also impacted the broader logistics segment. While the deterioration of trade and country lockdowns in H1 led to a volume decline in most segments, the subsequent recovery, above all in the US, supported volume activity in the freight forwarding market. The air forwarding market additionally gained from increased e-commerce trading during the lockdowns.
North American container imports were 24% higher at the end of 2020, compared to the end of 2019
Chart 4 IdlingIdle TEU as % of cellular fleet Idle TEU
Freight ratesFreight rates, as measured by the China Composite Freight Index (CCFI), were on average 18% higher in 2020 compared to 2019 (chart 3). While global supply and demand was broadly balanced, the unprecedented demand pick-up on key headhaul trades such as Asia-US in H2 2020 together with vessel and equipment shortages and bottlenecks across the entire supply chain supported freight rates. Asia to US West Coast freight rates increased by 28%, and Asia to US East Coast rose by 18%. Freight rates also increased on the Asia to North Europe trades, albeit at a more moderate pace of 13%, but strengthened by 23% from Asia to Med-iterranean Europe. Uncertainties relating to the strength of container demand continue to pose a risk to the developments of freight rates in 2021, including the normalisation of the situation with
20202019201820172016201520142013201220112010
19 A.P. Moller - Maersk Annual Report 2020 Market updateDirectors’ Report

Our business
Business model
Strategy
Customer interview
Sustainability
Risk management
Throughout the year under very difficult circumstances, A.P. Moller - Maersk was never closed for business
20 A.P. Moller - Maersk Annual Report 2020 Directors’ Report

NET ZERO CO2
NET ZERO CO2
MARKET
Import terminal
Warehousing and distribution
Ocean transport
Export terminal
Rail freight
Air freight
Customer's warehouse or shop
Warehousing and distribution
What we do andhow we create value
A.P. Moller - Maersk enables our customers to trade and grow by trans-porting goods anywhere. We work to provide customers with end-to-end products and services, taking the complexity out of global value chains.
Stakeholder relationships and partnerships We rely on constructive relationships with, e.g., customers, suppliers, peers, and authorities to maintain supportive framework conditions.
Technology and IT Technology and IT are key to enhancing our operational performance and solutions for our customers.
Our brand For more than a century, we have built partnerships with customers, enabling them to prosper by facilitating global trade.
Our people and cultureOur talented and diverse group of 80,000 employees live our core values every day as they help customers realise their ambitions.
Natural resources Our business relies on natural resources, in particular steel (the main component of our vessels) and oil for fuel.
For society With global presence and potential for impact, come the responsibility and oppor-tunity to ensure open and inclusive trade.
For our customersWe offer our 70,000 customers to take responsibility of their supply chain logistics.
For our investorsIn our transformation to become the global integrator of container logistics, we continue to innovate and grow shareholder value.
For the environmentOur industry is a significant contributor to global greenhouse gas emissions and through investment and collabora-tion, we will decarbonise our operations.
For our peopleOur people bring key skills and capabilities to our business and in turn we must keep them safe and engaged while offering interesting career paths in enabling global trade.
Financial capital We have a strong balance sheet and are committed to remaining investment grade-rated.
Assets and end-to-end delivery networkOur assets, supplier relationships and exper-tise in end-to-end delivery networks ensure our customers resilient supply chains.
Resources
Value createdBUSINESS MODEL
START DESTINATION
END DESTINATION
21 A.P. Moller - Maersk Annual Report 2020 Our business Business modelDirectors’ Report

Strategy
pillars in the vision of becoming the global integrator of container logistics3
1 Creating a portfolio of end-to-end products/services
An important element of the global integrator strategy is to strengthen the logistics product port-folio, notably on the landside by improving and innovating existing products, as well as acquiring capabilities and product offerings through acquisi-tions. In 2020, A.P. Moller - Maersk strengthened its product offering to customers along the end-to-end value chain.
On 1 April, A.P. Moller - Maersk closed the acqui-sition of Performance Team, a US-based ware-housing and distribution company, which, com-bined with the 2019 acquisition of Vandegrift, a US-based customs services company, has meant a significant strengthening of the land-based logis-tics services to US customers. On 2 September, A.P. Moller - Maersk closed the acquisition of KGH Customs Services, a Sweden-based pan-European customs services provider, hereby enhancing the end-to-end offering to customers with European imports and exports. These acquisitions were part of a general upgrade and improvement of A.P. Moller - Maersk’s Logistics & Services busi-ness, which through the year grew EBITDA to USD 470m or more than twice the size of 2019.
The Ocean product offering was also strength-ened through 2020 as the Maersk Spot product, launched in Q2 2019, was rolled out globally and with its superior offering of transparent price and equipment guarantee, it saw strong uptake with customers. By the end of 2020, the Spot prod-uct made up 51% of the total loaded short-term, volumes under Maersk brand (excl. Sealand and Hamburg Süd), and is well under way to becom-ing A.P. Moller - Maersk’s primary offering in the short-term market.
Despite the subversive effects of COVID-19 on the lives and business of A.P. Moller - Maersk employees and customers alike, the disciplined and consistent strategy execution continued and delivered tangible results through the year. Financial performance improved markedly, and previous year’s efforts to improve customer service in general and digitisation in particu lar paid off. Through outstanding efforts from its front line per sonnel, not least from its seafarers, A.P. Moller - Maersk took pride in being able to sustain its global operation and keep global supply chains moving throughout the pandemic.
1 Creating a portfolio of end-to-end products/services2 Seamless customer engagement3 Superior delivery network end-to-end
2020 marked the fourth year of A.P. Moller - Maersk’s transformation from a conglomerate to the global integrator of container logistics.
22 A.P. Moller - Maersk Annual Report 2020 StrategyOur businessDirectors’ Report

With the launch of Maersk Flow in Q3 of 2020, A.P. Moller - Maersk is now offering a digital supply chain management tool for mid-size customers to improve their supply chain performance through better visibility and control of their shippers, car-riers and shipments. This marked the entry into a customer segment A.P. Moller - Maersk has earlier struggled to serve well and which was extra chal-lenged by the supply chain disruptions caused by the COVID-19 pandemic.
Maersk NeoNav, launched in December 2020, have significantly upgraded A.P. Moller - Maersk’s capabilities in the supply chain planning and orchestration areas. With Maersk NeoNav, A.P. Moller - Maersk is among others able to con-nect customers’ demand data with data on inven-tories and cargo flows and thus optimise these parts of the supply chain in near real time, leading to very significant value realisation. This innovative new product has been well received by customers with large, global supply chains and is currently in the implementation phase with two very large customers.
2 Seamless customer engagement
Adding more products is fundamental towards becoming the global integrator of container logistics, but equally important is the ability to combine these products into tailored customer value propositions, and more effectively serve the cus-tomers’ needs, notably through digital solutions. The COVID-19 situation accelerated A.P. Moller - Maersk’s customers’ need for digital engagement and ser-vices, and A.P. Moller - Maersk benefited from pre-vious investments into its technology stack, includ-ing maersk.com and other online offerings.
Twill, a solution dedicated for small and medium- sized Ocean customers, ended the year with weekly bookings in excess of 6,000 FFE, which was more than 13 times the weekly volumes compared to the same period the previous year. In July, a new digital offering, Maersk Flow, was introduced for small and medium-sized customers and partners to take control of their supply chain from factory to market. In Octo-ber, a new cloud-based supply chain management platform was launched, aimed at larger customers with complex supply chains. The new platform will replace A.P. Moller - Maersk’s existing offering and provide more integrated services and solutions, high levels of automation, self-service opportunity, as well as improved analytical functionalities.
Another important platform and enabler of digitisa-tion is TradeLens, the open and neutral supply chain platform underpinned by blockchain technology, which A.P. Moller - Maersk is developing jointly with IBM. In October, the world’s second and third largest container carriers, MSC and CMA-CGM, announced that they were integrated onto TradeLens. This means that TradeLens now covers more than 50% of the global Ocean market. The other parts of the TradeLens ecosystem also grew in 2020 and now covers more than 120 ports/terminals, 24 customs authorities, and a growing inland presence.
From an organisational perspective, A.P. Moller - Maersk simplified its organisation in Ocean and Logistics further by streamlining the frontline organisation and integrating and clos-ing down the Safmarine and Damco brands. Fur-thermore, A.P. Moller - Maersk initiated a re-or-ganisation of the headquarter technology and commercial functions into a number of plat-forms, each delivering dedicated business and customer outcomes. This reorganisation marked a further integration of digital technology into the A.P. Moller - Maersk organisation and enables faster and more agile development of new prod-ucts and services, as well as a quicker and more effective modernisation of legacy technology.
Customer satisfaction was impacted by the disrup-tive effects of COVID-19, but is now again increas-ing and has remained strong with key customers throughout the year.
Twill
TradeLens
6,000 FFEWeekly bookings for Ocean customers
13xMore weekly volumes than the same period the previous year
120 Ports and terminals
50%Of the global Ocean market is covered by TradeLens
23 A.P. Moller - Maersk Annual Report 2020 StrategyOur businessDirectors’ Report

CASE: PERFORMANCE TEAM
On 1 April 2020, A.P. Moller - Maersk closed the acquisition of Performance Team, which has further strengthened the capabilities of A.P. Moller - Maersk as an integrated container logistics company offering customers end-to-end services.
The integration of Performance Team’s engi-neered solutions and distribution centre capabil-ities to retail, wholesale and direct to consumer services with Maersk Warehousing & Distribu-tion0s regional network in the US and Canada is progressing according to plan. In a time where transparency and resilience in supply chains have been increasingly important for customers, the extended offering of increased flexibility and value adding services have contributed signifi-cantly to the growth of Logistics & Services with
a revenue of USD 398m and an EBITDA of USD 59m. Looking ahead into 2021, our focus will be on driving commercial synergies and cross-selling to Maersk Ocean customers as part of the integrated container logistics strategy.
Transformation metrics To measure the strategic transformation towards becoming the global integrator of container logistics and the ability of A.P. Moller - Maersk to create shareholder value, three metrics are tracked besides the overall ROIC target (see table).
On the back of the improvement in profitability and positive cash flow generation during 2020, positive developments were seen across all transformation metrics.
Cash return on invested capital (CROIC), last twelve months, increased to 16.6% (10.0%), due to stronger cash flow from operations, lower gross CAPEX and slightly lower invested capital.
Infrastructure and Logistics revenue (excl. freight forwarding) increased to USD 9.4bn (USD 9.2bn), mainly due to the increased revenue in logistics from ware-housing and distribution and supply chain management, only partly offset by lower revenue in gateway terminals because of the impacts of COVID-19.
Logistics & Services EBITDA (excl. freight forwarding and restructuring costs) improved to USD 470m (USD 221m) due to margin optimisation in intermodal and warehousing and distribution, supported by the acquisition of Performance Team in April, as well as KGH Customs Services in September.
Transformation metrics2020 2019 1 Last twelve
months2 Excluding freight
forwarding and restructuring costs
A.P. Moller - Maersk cash return on invested capital 1 16.6% 10.0%
Infrastructure and Logistics revenue 2, USDm 9,428 9,201
Logistics & Services EBITDA 2, USDm 470 221
Long-term targets
Return on invested capital 1 9.4% 3.1%
Underlying return on invested capital 1 9.6% 3.2%
3 Superior delivery network end-to-end
The bedrock of the strategy of A.P. Moller - Maersk is a superior delivery network end-to-end, which delivers on fundamental needs for getting goods to the right place, at the right time, at the right price, with minimum environmental impact.
The COVID-19 pandemic stressed the global sup-ply chains to a degree never experienced before. A.P. Moller - Maersk takes pride in being able to continue to serve its customers’ global trans-portation needs and supply chains throughout the year under very difficult circumstances. A.P. Moller - Maersk was never closed for business.
The many challenges caused by the pandemic and the related volatility in supply and demand emphasised the strength of having operational control over the critical parts of the global logis-tics supply chains. A.P. Moller - Maersk was able to leverage its operational control of vessels, ware-houses, and terminals and co-developed new innovative solutions and products with customers in response to the disruptions. The main customer problems typically related to speed and/or flexi-bility of the supply chain, and examples of new solutions were storage in transit, dedicated air charters, and seaborne e-commerce solutions.
“ Having premium assets in warehousing and distribu-tion in 2020 was vital to meet unprecedented cus to mer demand and keep pace with ecommerce growth.” — Craig Kaplan, CEO Performance Team.
24 A.P. Moller - Maersk Annual Report 2020 Our business StrategyDirectors’ Report
2020
2016
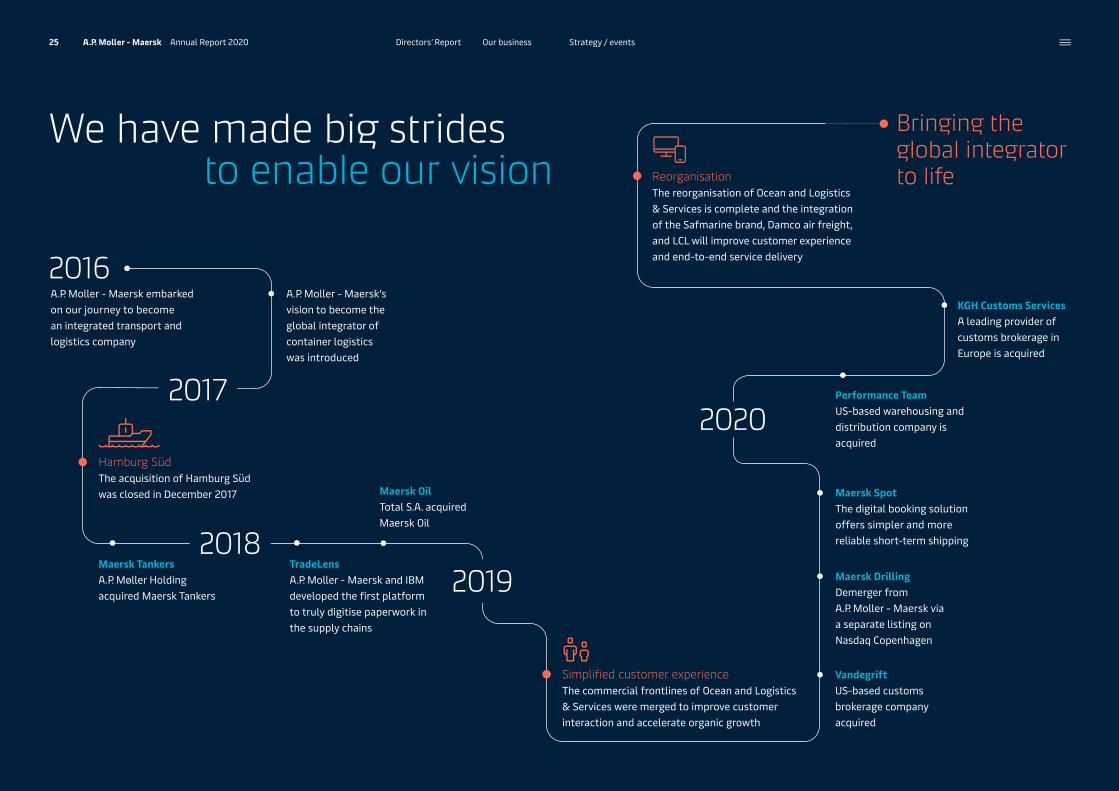
Bringing the global integrator to life
A.P. Moller - Maersk embarked on our journey to become an integrated transport and logistics company
We have made big strides to enable our vision
TradeLensA.P. Moller - Maersk and IBM developed the first platform to truly digitise paperwork in the supply chains
Maersk TankersA.P. Møller Holding acquired Maersk Tankers
Maersk OilTotal S.A. acquired Maersk Oil
Vandegrift US-based customs brokerage company acquired
Maersk Drilling Demerger from A.P. Moller - Maersk via a separate listing on Nasdaq Copenhagen
Maersk Spot The digital booking solution offers simpler and more reliable short-term shipping
KGH Customs ServicesA leading provider of customs brokerage in Europe is acquired
Performance Team US-based warehousing and distribution company is acquired
ReorganisationThe reorganisation of Ocean and Logistics & Services is complete and the integration of the Safmarine brand, Damco air freight, and LCL will improve customer experience and end-to-end service delivery
2018
2017
Hamburg Süd The acquisition of Hamburg Süd was closed in December 2017
2019
Simplified customer experience The commercial frontlines of Ocean and Logistics & Services were merged to improve customer interaction and accelerate organic growth
A.P. Moller - Maersk’s vision to become the global integrator of container logistics was introduced
25 A.P. Moller - Maersk Annual Report 2020 Strategy / eventsOur businessDirectors’ Report
Can you tell me a bit about your business?» Isaac H. Grainger & Son Ltd. is a 150-year-old manufacturing company based outside Birming-ham in the UK. We manufacture metal products for Raised Access Flooring, which is the type of floor you’re standing on in your office so that you can plug your computers into the floor or install air conditioning rather than cables coming down the wall. We manufacture this product in the UK and in India, and it’s used around Europe.
What are your biggest pain points when it comes to transport and logistics?» To manufacture the full flooring system, we need to ship products from the UK to Spain and
from India to the UK and Spain. That’s where seamless, door-to-door shipping becomes very important.
» We’re not a huge customer that ships thousands of containers and has a fixed contract. We order containers as we need them, and the biggest issue for us has been reliability as we operate with a door-to-door policy. This means that if a customer wants a container, we need to tell them the cost of the product, the transportation cost and the arrival date. The biggest problem has been to get a price as this could take as long as two weeks via an agent or freight forwarder. The delivery was also very hard to track and manage when it wasn’t on a vessel. Twill solved these problems.
CUSTOMER INTERVIEW
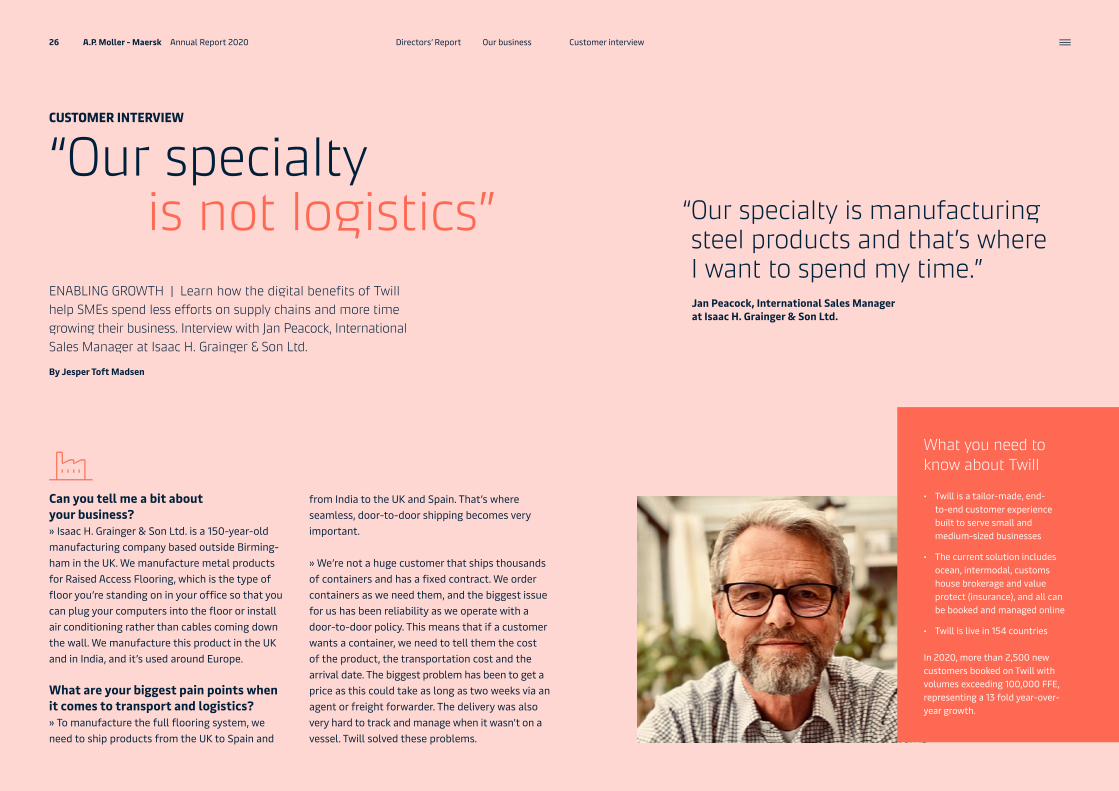
ENABLING GROWTH | Learn how the digital benefits of Twill help SMEs spend less efforts on supply chains and more time growing their business. Interview with Jan Peacock, International Sales Manager at Isaac H. Grainger & Son Ltd.
“Our specialtyis not logistics”
By Jesper Toft Madsen
“ Our specialty is manufacturing steel products and that’s where I want to spend my time.”Jan Peacock, International Sales Manager at Isaac H. Grainger & Son Ltd.
What you need to know about Twill
• Twill is a tailor-made, end-to-end customer experience built to serve small and medium-sized businesses
• The current solution includes ocean, intermodal, customs house brokerage and value protect (insurance), and all can be booked and managed online
• Twill is live in 154 countries
In 2020, more than 2,500 new customers booked on Twill with volumes exceeding 100,000 FFE, representing a 13 fold year-over-year growth.
26 A.P. Moller - Maersk Annual Report 2020 Customer interviewOur businessDirectors’ Report

How critical are these transportation issues in running a smooth operation?» For our import business in the UK, they are abso-lutely critical as we’re known for producing prod-ucts with fairly short notice. The customers don’t care if we manufacture in the UK or in India, they just want their product delivered to the construc-tion site on time.
How far can platforms such as Twill take you in overcoming these challenges?» The platform is very useful. If I log into Twill today, I should be able to, let’s say ship a container in ten days’ time from India to our factory outside Madrid, Spain, by checking the available ships and the price.
» If our factory manager in India says we’re able to ship a bit earlier, I can do this via the platform rather than having to call someone and wait for confirmation. This flexibility is very important to us because we save time and hassle. Shipping should be like Amazon, that’s the standard these days. Twill knows who you are, you make your booking, get confirmation and my guys in India can log in and talk to their Twill contact locally – it’s a smooth system.
» Our specialty is not logistics. In the past, we spent 10-15% of our time chasing logistics. Our specialty is manufacturing steel products and that’s where I want to spend my time. That’s why I’m enthusiastic about Twill as there wasn’t anything like it when it came. It’s like Amazon for shipping.
27 A.P. Moller - Maersk Annual Report 2020 Customer interviewOur businessDirectors’ Report
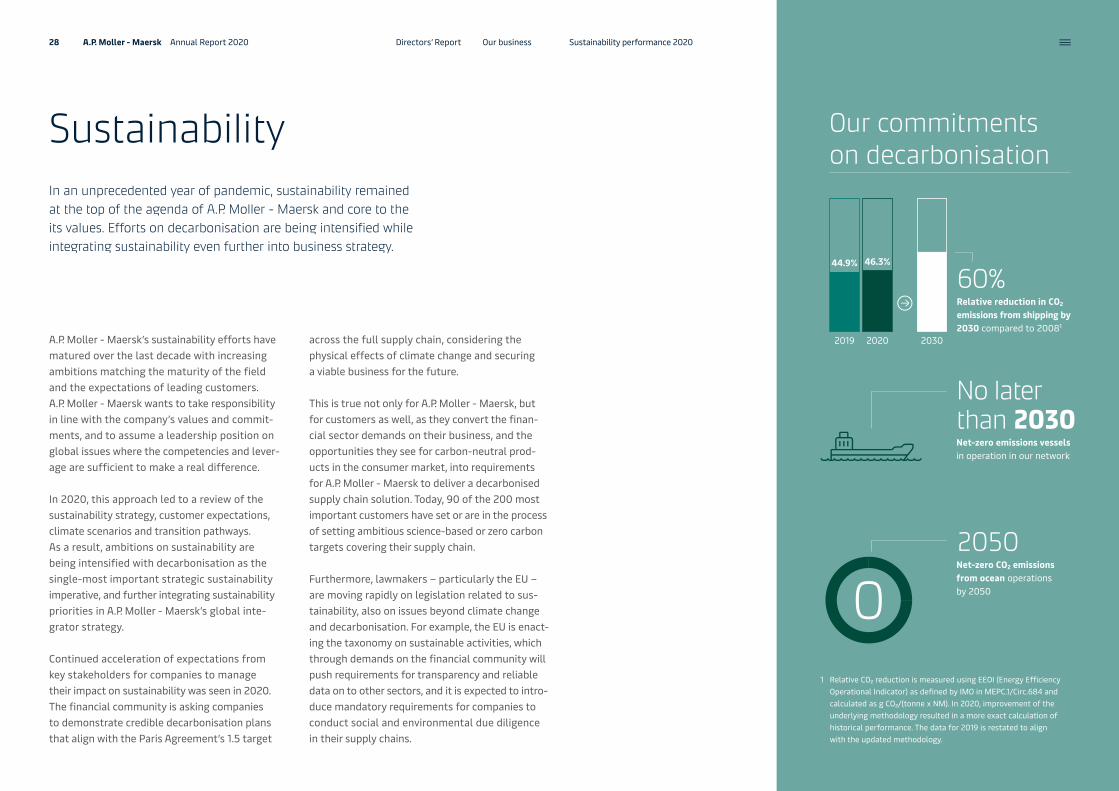
SustainabilityIn an unprecedented year of pandemic, sustainability remained at the top of the agenda of A.P. Moller - Maersk and core to the its values. Efforts on decarbonisation are being intensified while integrating sustainability even further into business strategy.
Our commitments on decarbonisation
A.P. Moller - Maersk’s sustainability efforts have matured over the last decade with increasing ambitions matching the maturity of the field and the expectations of leading customers. A.P. Moller - Maersk wants to take responsibility in line with the company’s values and commit-ments, and to assume a leadership position on global issues where the competencies and lever-age are sufficient to make a real difference.
In 2020, this approach led to a review of the sustainability strategy, customer expectations, climate scenarios and transition pathways. As a result, ambitions on sustainability are being intensified with decarbonisation as the single-most important strategic sustainability imperative, and further integrating sustainability priorities in A.P. Moller - Maersk’s global inte-grator strategy.
Continued acceleration of expectations from key stakeholders for companies to manage their impact on sustainability was seen in 2020. The financial community is asking companies to demonstrate credible decarbonisation plans that align with the Paris Agreement’s 1.5 target
across the full supply chain, considering the physical effects of climate change and securing a viable business for the future.
This is true not only for A.P. Moller - Maersk, but for customers as well, as they convert the finan-cial sector demands on their business, and the opportunities they see for carbon-neutral prod-ucts in the consumer market, into requirements for A.P. Moller - Maersk to deliver a decarbonised supply chain solution. Today, 90 of the 200 most important customers have set or are in the process of setting ambitious science-based or zero carbon targets covering their supply chain.
Furthermore, lawmakers – particularly the EU – are moving rapidly on legislation related to sus-tainability, also on issues beyond climate change and decarbonisation. For example, the EU is enact-ing the taxonomy on sustainable activities, which through demands on the financial community will push requirements for transparency and reliable data on to other sectors, and it is expected to intro-duce mandatory requirements for companies to conduct social and environmental due diligence in their supply chains.
44.9%
2019
46.3%
2020 2030
1 Relative CO2 reduction is measured using EEOI (Energy Efficiency Operational Indicator) as defined by IMO in MEPC.1/Circ.684 and calculated as g CO2/(tonne x NM). In 2020, improvement of the underlying methodology resulted in a more exact calculation of historical performance. The data for 2019 is restated to align with the updated methodology.
2050Net-zero CO2 emissions from ocean operations by 2050
No later than 2030Net-zero emissions vessels in operation in our network
60% Relative reduction in CO2 emissions from shipping by 2030 compared to 20081
0
28 A.P. Moller - Maersk Annual Report 2020 Sustainability performance 2020Our businessDirectors’ Report

A new level of integrationThe approach of A.P. Moller - Maersk and this land-scape of expectations were driving forces behind the decision to fully integrate sustainability into business activities, which was announced at the end of 2019. To fully deliver on sustainability as a strategic imperative, responsibilities must be embedded in the business and owned by business leaders. Governance and organisational struc-tures that correspond with this decision have been established, including a dedicated decarbonisa-tion function.
Decarbonising logisticsAs an industry leader and with the resources avail-able at hand, A.P. Moller - Maersk has an obligation to do what it can to get to a carbon-neutral fleet as fast as possible, and to help customers decar-bonise global supply chains end-to-end.
Vessel decarbonisation is beyond comparison the area with the greatest direct impact. The majority of efforts and investments in the near future will be on decarbonising ocean activities, as this holds the potential for the greatest impact and market leadership that enables setting the direction for an entire industry. However, expanding customer offerings in line with being the global integrator also makes it necessary to identify how the end-to-end supply chain can be decarbonised.
Sustainability priorities for the global integrator strategy were defined in 2020: Enabling sustaina-ble trade by decarbonising logistics, sustainability in our end-to-end offerings and responsible busi-ness practices. Taking leadership on decarbonisa-tion of logistics is the single-most important stra-tegic sustainability priority for A.P. Moller - Maersk, as decarbonisation of the fleet is the area beyond comparison with the greatest potential for impact. Furthermore, A.P. Moller - Maersk aims to increase focus on sustainability in end-to-end offerings in response to the increased responsibility and opportunity to manage supply chain risks for cus-tomers as part of its global integrator business strategy. Commitments on inclusive trade, food loss and ship recycling are now fully owned and driven in the line of business. Responsible business practices continue to form the strong foundation including solid governance structures, accounta-bility and transparency on policies, commitments and performance across sustainability issues.
A.P. Moller - Maersk’s business activities enable open, inclusive and sustainable global trade, and the company continues to actively engage in the global debate through advocacy, projects and partnerships. Even more importantly still more elements are being added to the products and ser-vices offered that can ease the access of SMEs to participate in and benefit from global trade. A.P. Moller - Maersk’s work on helping to halve food loss during transportation is run as an inte-grated part of the Cold Chain Logistics business of A.P. Moller - Maersk, focusing on developing and scaling solutions to connect and integrate cus-tomers’ cold chains. This area now covers several hundred customers across nearly 50 countries. Investments made by the company’s venture arm, Maersk Growth, also contribute to the overall sus-tainable development goal of reducing food loss.
The decarbonisation strategy spans across three complementary pathways:
Building a market for carbon-neutral shippingBuilding on customers’ increasing momentum, integration of a new commercial strategy on sus-tainability began, aiming to respond to and aid customers on their decarbonisation journey.
One key feature in this is the Maersk ECO Delivery product. Launched in 2019, it remains one of only a few options for carbon-neutral shipping on the global market so far. Read more about the product on page 40.
Decarbonising logistics
Responsible business practices
Sustainability in our end-to-end offerings
Enabling sustainable trade Sustainability priorities for the global integrator
2025We aim to connect 50% of global containerised trade to digital solutions that reduce supply chain barriers.
29 A.P. Moller - Maersk Annual Report 2020 Sustainability performance 2020Our businessDirectors’ Report

Importantly, this product demonstrates that the commoditised freight market is open for price differentiation. Driven by the end-consumers’ increased willingness to pay for sustainability, and growing climate urgency, this represents a solid contribution to the development of a business model for decarbonised logistics and transport. A multi-tier value proposition has been developed, as a way to respond to relevant customer needs aligned with their maturity and ambition level for carbon reductions, and building stronger ties and partnerships with the group of customers who also have ambitious decarbonisation strategies.
Technology: The future of fuelsIn the past two years extensive analyses of the available technology and fuel options for net-zero operations have been conducted. Based on this work, four primary pathways are being pur-sued, as seen in the table.
In response to the increased urgency of deliv-ering on decarbonisation, A.P. Moller - Maersk’s position is that the right thing to do is to leap-frog to pure net-zero vessel technology with-out any transitional technologies.
Fuel transformation involves the entire supply chain, and part of the work consists of overcoming barriers to progress, including scaling fuel produc-tion and associated technology, lack of fuel infra-structure and safety related issues, while manag-ing the impact on company profitability.
Policies: The need for broad-based actionThe final piece of the decarbonisation strategy relates to the policy frameworks established to further this process. Policies must not only secure that lowest performers are held accountable, but also that first movers are rewarded for the risks taken on behalf of the whole industry.
With very few exceptions the political and thus leg-islative debate is currently not moving fast enough to fulfil its role. A.P. Moller - Maersk advocate for more ambitious targets in the International Mari-time Organization (IMO) and for lawmakers to build incentive structures that reward first movers and remove a share of the financial risk related to decar-bonisation. There is a risk that regulators are out of sync with the progress and development pushed by industry, which would be to no one’s benefit. At regional level, there is no doubt that shipping will be part of the EU Emissions Trading System within a few years. However, this needs to be done with the objective of actually lowering shipping emissions and with a view to supporting an inter-national greenhouse gas (GHG) reduction agree-ment, while still supporting modal shift of cargo to sea, which will remain the most sustainable way of transporting large quantities of cargo.
Frontline heroes stuck at seaEnabling global trade has been A.P. Moller - Maersk’s finest task for decades. In extraordinary circumstan ces, due to the COVID-19
pandemic, A.P. Moller - Maersk employees across the world have gone to extraordinary lengths during 2020 to keep goods moving freely from the start of the pandemic.
A.P. Moller - Maersk’s executive leadership established that the company’s focus during the COVID-19 crisis would be on three priorities: Pro-tecting our people, supporting our customers, and helping society get through the crisis.
Everyone’s safety was sought to be ensured by enabling employees to work from home wherever possible, providing personal protection equipment, and changing procedures to allow for adequate dis-infection of equipment in for example port termi-nals. The greatest challenge has been for seafarers.
Normally, a crew member stays on a vessel from two to six months. The Maritime Labour Conven-tion states that crews can spend a maximum of 11 months on board. These norms were broken in 2020, as crew changes were made impossible by restric-tions on entry to countries and travel restrictions. At its highest point, more than 2,500 out of 6,000 colleagues could not be relieved of their duties.
The challenge was brought to the highest levels at the UN and IMO as well as to legislators and NGOs, and agreements with governments, airlines, airport operators, hotels and port authorities were estab-lished to enable crews to have essential worker sta-tus and safely travel to and from major port hubs with major international airports, including spe-cial A.P. Moller - Maersk charter flights. Company quarantine safe centres were created in strate-gic locations as well as hubs for local quarantine in high volume areas. These measures helped seafar-ers reach their destination and by the end of the year overdue crew members were relieved.
Four primary fuels for net-zero shippingFuel Key advantages Key limitations/risks
Biodiesel Can be used as drop-in fuel in existing vessels and engines
Limited availability of biomass feedstock a challenge to scalability
Price pressure due to high demand from competing industries
Methanol (bio -methanol and e-methanol)
Already in operation as marine fuel
Engine is available
Liquid at normal conditions, well-known handling
Bio-methanol: Production at scale is challenged by uncertainty over availability of biomass
E-methanol: Availability of biogenic CO2 source at production site, cost and maturity of electrolyser technology
Lignin fuelsA new biofuel based on biomass residue (lignin) and alcohols(methanol or ethanol)
Lignin fuel has the potential of being the most price- competitive carbon-neutral fuel with the lowest price estimates almost on par with fossil fuels
In the development stage, production needs to be scaled up to create a new value chain and infrastructure for supply
Engine requirements would be the same as for methanol, but additional handling of contaminants may be required
Ammonia (green ammonia)
Fully zero emissions fuel
Can be produced at scale from renewable electricity alone
Safety and toxicity challenges
Infrastructure challenges at ports
Future cost depends on cost of renewable electricity and cost/maturity of electro-lyser technology
30 A.P. Moller - Maersk Annual Report 2020 Sustainability performance 2020Our businessDirectors’ Report

To help society in the fight against the pandemic, the capabilities and partnerships of A.P. Moller - Maersk, including the Logistics Emergency Team, were put to use to support communities, countries and regions. The company also endorsed a World Eco-nomic Forum charter in support of safe and sus-tainable distribution of COVID-19 vaccines globally. A.P. Moller - Maersk is heavily involved in develop-ing a global plan for distribution of vaccines, with planning for large-scale distribution beginning in the summer of 2020, including the establishment of a global logistics partnership with COVAXX to distribute up to a billion doses of the COVAXX vac-cine worldwide in 2021.
Safety differentlyIntegrating the updated approach to safety across the company continued with positive examples of progress and true mitigation of risks to human health through new processes of collaboration and deliberation.
In 2020, the safety organisation was reorganised to reinforce that A.P. Moller - Maersk has one and only one safety strategy, which is implemented and enforced equally across the company. The new central Safety and Resilience team creates a strong pool of resources and tools, including
implementation support available at all levels across the company. In this way, the integrated company that A.P. Moller - Maersk is becoming is being matched and mirrored, assuring custom-ers that when they leave their supply chain obli-gations in the hands of A.P. Moller - Maersk, the capacity for safe operations is in place.
Deeply regrettable, one person lost his life while performing tasks under A.P. Moller - Maersk management, when a roofer working for a con-tractor fell as scaffolding collapsed after being hit by a crane that tipped. This tragic event reinforces the company’s commitment to working more with suppliers on safety and sustainability issues.
Commitment to responsible ship recyclingFour years after the first A.P. Moller - Maersk vessel landed in a ship recycling yard in Alang, India, an impact study clearly demonstrated very significant improvements in safety, environ-ment, workers’ conditions and access to health in the wider community. The ambition is to cre-ate responsible ship recycling opportunities that are also commercially viable for the ship owners and changing the ship recycling industry at the same time.
The prospect of broad, sustained change is, how-ever, challenged. No yards from the Alang area – despite collaboration with the EU Commission and investments over the past two years – have yet been included in the EU List of yards outside the OECD that can be legally used for recycling of ships registered in EU countries. In addition, a new legislative barrier has arisen, because legisla-tion has come into force that prohibits exporting of hazardous waste from a list of OECD countries to developing (non-OECD) countries, which some, including the EU Commission, are applying to ves-sels for recycling. This has currently stalled the Alang yard applications and now awaits an inter-nationally negotiated resolution of this regulatory challenge.
This situation is highly detrimental to the deve-lopments in Alang, as well as to ship owners. A.P. Moller - Maersk’s position, based on thorough legislative analysis, is that there are legal options available to the EU, and the company is engaging with a multitude of stakeholders to find both a short and long-term solution to this gridlock.
A further challenge is that within the next few years, even larger vessels than today will be near-ing end of life and ready for recycling, but these vessels will be too large for many of the yards offering financially viable solutions.
Because the work in Alang documents that responsible ship recycling is possible outside yards in OECD countries, A.P. Moller - Maersk’s ambition for the work on ship recycling has changed from radically changing the industry, starting in Alang, to creating opportunities for responsible ship recycling globally.
IMO 2020 conversion successfulFrom January 2020, the IMO’s 0.5% global cap on the content of sulphur in fuels came into effect. The enforcement mechanism for this legislation is a ban on carrying non-compliant fuels on vessels, except for vessels where scrubbers are installed to clean exhaust gasses.
The main concern in the years leading up to the cap taking effect was uneven enforcement. While the level of control is not as stringent as A.P. Moller - Maersk would prefer, there is no indi-cation that compliance is lacking. Oil market shares are a useful proxy for this, and it appears that the low-sulphur fuel uptake is at the expected level.
A.P. Moller - Maersk has installed open-loop scrubbers on a share of the vessels as a risk man-agement measure, as the price gap between heavy fuel oil and low-sulphur fuel was expected to be significant. The use of scrubbers remains a dis-cussion point and no independent, global survey of the effects of scrubbers has yet been produced to support global legislation. Increasingly, legis-lation is being implemented regionally, for exam-ple in the EU and in some US states and Australia, requiring vessels to shut off the scrubber system when entering near-coastal waters and switch to low-sulphur fuel.
The A.P. Moller - Maersk 2020 Sustainability Report provides more information about the work and progress on sustainability priorities. For an overview of Environmental, Social and Governance (ESG) performance data including Sustainability Accounting Standards Board (SASB) and Task force on Climate-Related Financial Disclosures (TCFD) indices, please see the 2020 ESG data overview on A.P. Moller - Maersk’s investor relations website.
A.P. Moller - Maersk worked towards three key priorities during the COVID-19 crisis: Protecting our people, supporting our customers, and helping society to get through the crisis.
31 A.P. Moller - Maersk Annual Report 2020 Sustainability performance 2020Our businessDirectors’ Report
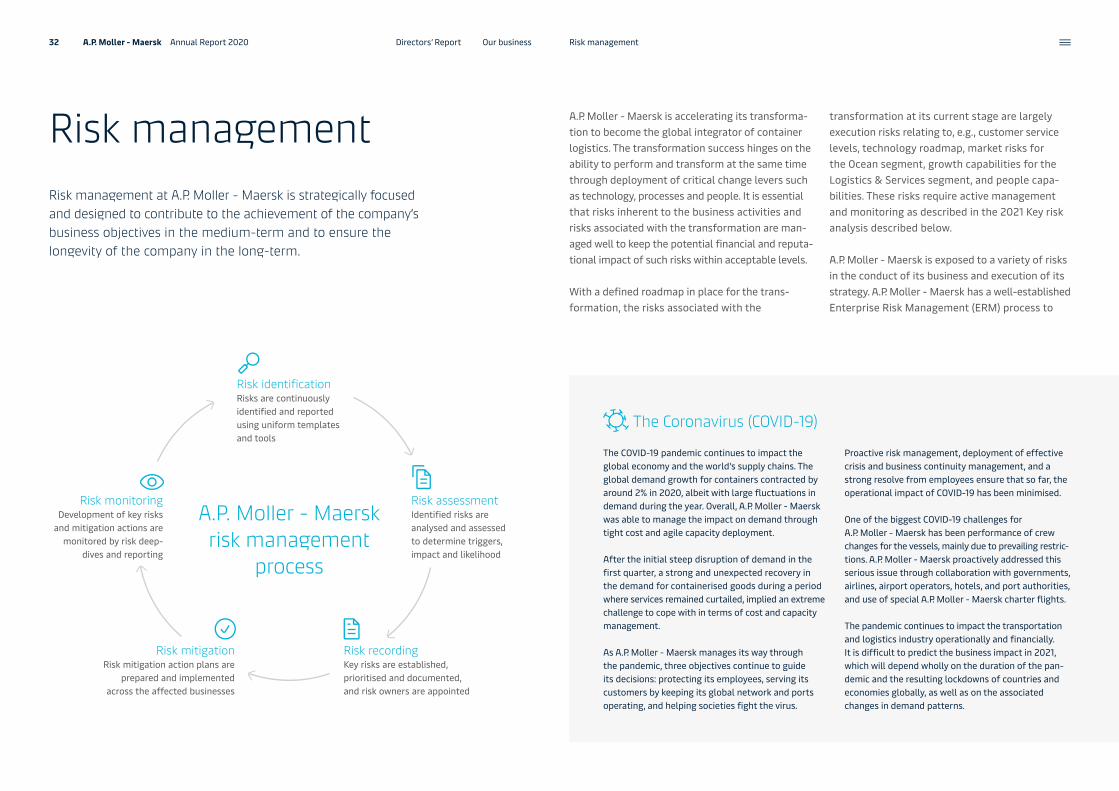
Risk managementRisk management at A.P. Moller - Maersk is strategically focused and designed to contribute to the achievement of the company’s business objectives in the medium-term and to ensure the longevity of the company in the long-term.
A.P. Moller - Maersk is accelerating its transforma-tion to become the global integrator of container logistics. The transformation success hinges on the ability to perform and transform at the same time through deployment of critical change levers such as technology, processes and people. It is essential that risks inherent to the business activities and risks associated with the transformation are man-aged well to keep the potential financial and reputa-tional impact of such risks within acceptable levels.
With a defined roadmap in place for the trans-formation, the risks associated with the
transformation at its current stage are largely execution risks relating to, e.g., customer service levels, technology roadmap, market risks for the Ocean segment, growth capabilities for the Logistics & Services segment, and people capa-bilities. These risks require active management and monitoring as described in the 2021 Key risk analysis described below.
A.P. Moller - Maersk is exposed to a variety of risks in the conduct of its business and execution of its strategy. A.P. Moller - Maersk has a well-established Enterprise Risk Management (ERM) process to
The Coronavirus (COVID-19)
The COVID-19 pandemic continues to impact the global economy and the world’s supply chains. The global demand growth for containers contracted by around 2% in 2020, albeit with large fluctuations in demand during the year. Overall, A.P. Moller - Maersk was able to manage the impact on demand through tight cost and agile capacity deployment.
After the initial steep disruption of demand in the first quarter, a strong and unexpected recovery in the demand for containerised goods during a period where services remained curtailed, implied an extreme challenge to cope with in terms of cost and capacity management.
As A.P. Moller - Maersk manages its way through the pandemic, three objectives continue to guide its decisions: protecting its employees, serving its customers by keeping its global network and ports operating, and helping societies fight the virus.
Proactive risk management, deployment of effective crisis and business continuity management, and a strong resolve from employees ensure that so far, the operational impact of COVID-19 has been minimised.
One of the biggest COVID-19 challenges for A.P. Moller - Maersk has been performance of crew changes for the vessels, mainly due to prevailing restric-tions. A.P. Moller - Maersk proactively addressed this serious issue through collaboration with governments, airlines, airport operators, hotels, and port authorities, and use of special A.P. Moller - Maersk charter flights.
The pandemic continues to impact the transportation and logistics industry operationally and financially. It is difficult to predict the business impact in 2021, which will depend wholly on the duration of the pan-demic and the resulting lockdowns of countries and economies globally, as well as on the associated changes in demand patterns.
A.P. Moller - Maersk risk management
process
Risk identification Risks are continuously identified and reported using uniform templates and tools
Risk assessmentIdentified risks are analysed and assessed to determine triggers, impact and likelihood
Risk monitoringDevelopment of key risks
and mitigation actions are monitored by risk deep-
dives and reporting
Risk recordingKey risks are established, prioritised and documented, and risk owners are appointed
Risk mitigationRisk mitigation action plans are
prepared and implemented across the affected businesses
32 A.P. Moller - Maersk Annual Report 2020 Risk managementOur businessDirectors’ Report

identify, assess and respond to key risks that can threaten A.P. Moller - Maersk’s ability to achieve its business objectives. The process is integrated into strategy review, business planning and per-formance management.
Each year, risks are identified and assessed follow-ing a comprehensive process covering the enter-prise and the individual brands. The enterprise risks identified are validated for relevance and sig-nificance by senior business leaders. Finally, the Executive Leadership Team reviews the risks and decides the key risks to the strategy and the busi-ness plan.
The Executive Leadership Team appoints a risk owner for each key risk to oversee the manage-ment of the risk, including the preparation and execution of mitigation action plans. Once the plans for the management of the risks are final-ised, the progress and effect of such plans are monitored by the Executive Leadership Team and the Audit Committee in designated and regular sessions. Where the progress of mitigating actions is falling behind schedule, or where mitigating actions are not achieving the effect they were designed to have, corrective actions are taken.
The ERM process for 2021 was carried out in the second half of 2020. It identified ten key risks that may have a significant impact on the business plan, including on earnings, financial position and achievement of other strategic objectives.
2021 Key risk analysisThe key risks to achieving the A.P. Moller - Maersk 2021-2025 business plan, the assessment of each risk, and the mitigation strategies deployed are described in the following.
During 2020, A.P. Moller - Maersk has worked sys-tematically on mitigating key risks shown in the Annual Report 2019 to further reduce residual risk levels. Among other things, the risk reduc-tions achieved in 2020 imply that risks relating to IMO 2020 low sulphur fuel, cost excellence in Ocean,
and the APM Terminals transformation are not per-ceived to be among key risks into 2021. Also, the risk relating to standardisation of core processes is now included in the technolo gy roadmap risk. Resid-ual risk levels of continuing risks and new risks by December 2020 are depicted on the heatmap above.
December 2020 position December 2020 – new risk
High
High
Low
All positions are residual risk after current mitigation.
4
10 5
78
9
36
2
1
Risk description12345678910
Customer service levelTechnology roadmapCyber-attackOcean industry collapsePeople safety and security Mergers & AcquisitionsDecarbonisation Organisational capabilities Compliance Company culture and engagement
Financial or reputational impactLi
kelih
ood
25%
33 A.P. Moller - Maersk Annual Report 2020 Risk managementOur businessDirectors’ Report
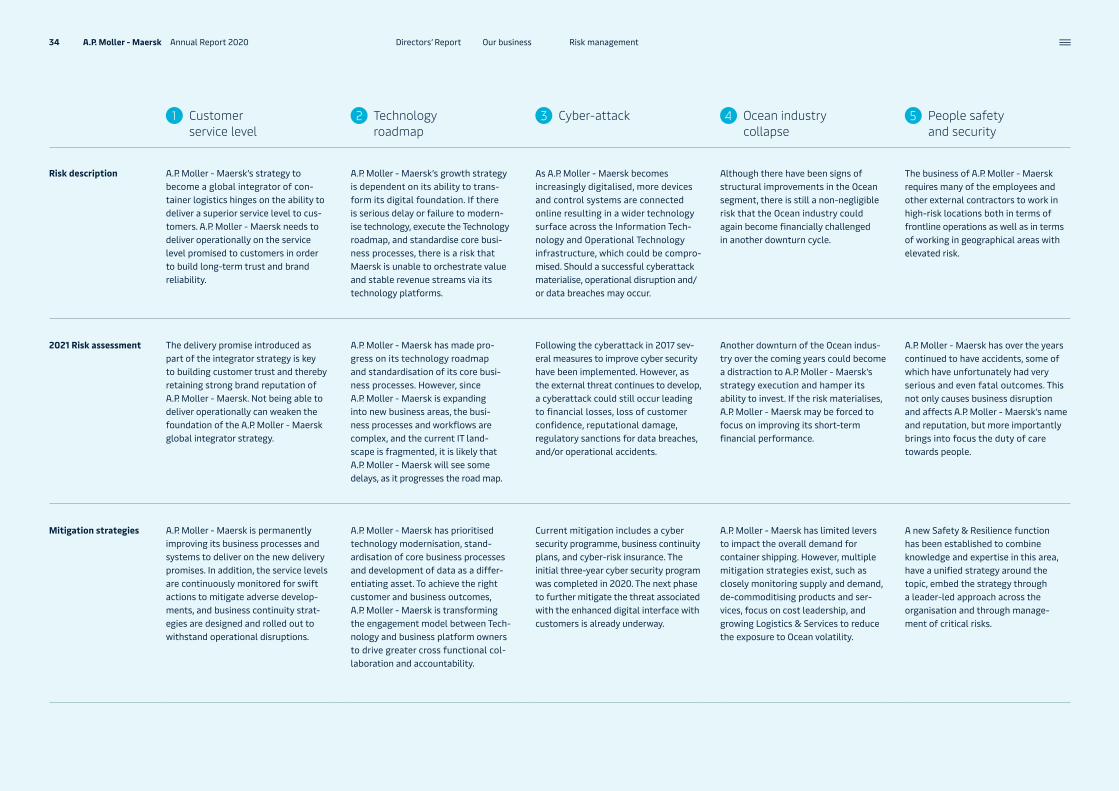
1 Customer service level
2 Technology roadmap
3 Cyber-attack 4 Ocean industry collapse
5 People safety and security
Risk description A.P. Moller - Maersk’s strategy to become a global integrator of con-tainer logistics hinges on the ability to deliver a superior service level to cus-tomers. A.P. Moller - Maersk needs to deliver operationally on the service level promised to customers in order to build long-term trust and brand reliability.
A.P. Moller - Maersk’s growth strategy is dependent on its ability to trans-form its digital foundation. If there is serious delay or failure to modern-ise tech nology, execute the Tech nology roadmap, and standardise core busi-ness processes, there is a risk that Maersk is unable to orchestrate value and stable revenue streams via its technology platforms.
As A.P. Moller - Maersk becomes increasingly digitalised, more devices and control systems are connected online resulting in a wider technology surface across the Information Tech-nology and Operational Technology infrastructure, which could be compro-mised. Should a successful cyber attack materialise, operational disruption and/or data breaches may occur.
Although there have been signs of structural improvements in the Ocean segment, there is still a non-negligible risk that the Ocean industry could again become financially challenged in another downturn cycle.
The business of A.P. Moller - Maersk requires many of the employees and other external contractors to work in high-risk locations both in terms of frontline operations as well as in terms of working in geographical areas with elevated risk.
2021 Risk assessment The delivery promise introduced as part of the integrator strategy is key to building customer trust and thereby retaining strong brand reputation of A.P. Moller - Maersk. Not being able to deliver operationally can weaken the foundation of the A.P. Moller - Maersk global integrator strategy.
A.P. Moller - Maersk has made pro-gress on its technology roadmap and standardisation of its core busi-ness processes. However, since A.P. Moller - Maersk is expanding into new business areas, the busi-ness processes and workflows are complex, and the current IT land-scape is fragmented, it is likely that A.P. Moller - Maersk will see some delays, as it progresses the road map.
Following the cyberattack in 2017 sev-eral measures to improve cyber security have been implemented. However, as the external threat continues to develop, a cyberattack could still occur leading to financial losses, loss of customer confidence, reputational damage, regulatory sanctions for data breaches, and/or operational accidents.
Another downturn of the Ocean indus-try over the coming years could become a distraction to A.P. Moller - Maersk’s strategy execution and hamper its ability to invest. If the risk materialises, A.P. Moller - Maersk may be forced to focus on improving its short-term financial performance.
A.P. Moller - Maersk has over the years continued to have accidents, some of which have unfortunately had very serious and even fatal outcomes. This not only causes business disruption and affects A.P. Moller - Maersk’s name and reputation, but more importantly brings into focus the duty of care towards people.
Mitigation strategies A.P. Moller - Maersk is permanently improving its business processes and systems to deliver on the new delivery promises. In addition, the service levels are continuously monitored for swift actions to mitigate adverse develop-ments, and business continuity strat-egies are designed and rolled out to withstand operational disruptions.
A.P. Moller - Maersk has prioritised technology modernisation, stand-ardisation of core business processes and development of data as a differ-entiating asset. To achieve the right customer and business outcomes, A.P. Moller - Maersk is transforming the engagement model between Tech-nology and business platform owners to drive greater cross functional col-laboration and accountability.
Current mitigation includes a cyber security programme, business continuity plans, and cyber-risk insurance. The initial three-year cyber security program was completed in 2020. The next phase to further mitigate the threat associated with the enhanced digital interface with customers is already underway.
A.P. Moller - Maersk has limited levers to impact the overall demand for container shipping. However, multiple mitigation strategies exist, such as closely monitoring supply and demand, de-commoditising products and ser-vices, focus on cost leadership, and growing Logistics & Services to reduce the exposure to Ocean volatility.
A new Safety & Resilience function has been established to combine knowledge and expertise in this area, have a unified strategy around the topic, embed the strategy through a leader-led approach across the organisation and through manage- ment of critical risks.
34 A.P. Moller - Maersk Annual Report 2020 Risk managementOur businessDirectors’ Report

6 Mergers & Acquisitions
7 Decarbonisation 8 Organisational capabilities
9 Compliance 10 Company culture and engagement
Risk description A key driver to long-term Logistics & Services growth is the expansion of product and people capabilities through successful Mergers & Acquisi-tions (M&A). Acquiring new capabilities is a prerequisite to serve customers end-to-end, and A.P. Moller - Maersk will need to make acquisitions in the com-ing years.
Decarbonisation is becoming a business necessity and a license to operate. It is critical for A.P. Moller - Maersk to decar-bonise the end-to-end supply chain at a speed that meets customers’ and inves-tors’ expectations. Primary focus is the decarbonisation of own emissions.
Delivering a digitally trans-formed business model as part of A.P. Moller - Maersk’s global inte grator strategy requires right balance of capabilities and skills at all levels in the organisation.
It is imperative for A.P. Moller - Maersk to conduct its business in compli-ance with legislation and regulatory standards. The regulatory landscape is becoming increasingly complex, and A.P. Moller - Maersk could be hit by a major compliance case in respect of violations of anti-corruption laws, anti-trust regulations, and/or international sanctions.
The A.P. Moller - Maersk culture is strong with many elements that must be retained. These strong cultural ele-ments were critical in getting through the cyberattack in 2017 and most recently in the COVID-19 pandemic, but there is a need to change and adapt parts of this culture and to further enhance employee engagement to sup-port the transformed business model.
2021 Risk assessment Some of the acquisitions may be sub-stantial, and if A.P. Moller - Maersk fails to integrate one or more of these, it will create a risk to successfully execut-ing the A.P. Moller - Maersk inte grator strategy.
A.P. Moller - Maersk has made a com-mitment of carbon neutrality by 2050. With increasing demand from custom-ers and investors, A.P. Moller - Maersk needs to further innovate sustainable supply chain solutions and accelerate its decarbonisation initiatives.
A.P. Moller - Maersk made good pro-gress in acquiring new and diverse capabilities and skills, especially for Logistics & Services and Technology. Still, the strategy execution could be hampered if the right balance of capabilities and skills are not main-tained at all levels of the organisation.
In respect of corruption, A.P. Moller - Maersk operates in high-risk geographies and high-risk sectors (e.g. the terminals and logistics ser-vices sectors). A.P. Moller - Maersk is the largest container carrier and in an industry with many industry coopera-tion agreements. A.P. Moller - Maersk thereby naturally has the attention of com petition authorities globally.
Most notably, customer centricity is a cultural attribute, which must be honed to a different level than today. Another element that must be further cultivated is the ability to work across functions with shared ownership and accountability for outcomes.
Mitigation strategies A post-merger integration office has been established to develop and man-age integration processes and embed learnings. Integration capabilities have been upskilled through external sourc-ing. Further actions are planned to develop seamless transition between acquisition and integration activities, with clear accountabilities and busi-ness ownership.
In 2020, a strategic review of climate scenarios and transition pathways was conducted with the conclusion that climate action is a strategic imperative for A.P. Moller - Maersk. Consequently, a new Decarbonisation function has been launched in 2021 to further embed and accelerate the decarbon-isation agenda, including coordinat-ing the efforts to reduce the climate impact of operations and developing relevant customer offerings.
A.P. Moller - Maersk Capability Frame-work was established to define key organisational capabilities to support strategic goals. Further actions are in progress to build/buy competencies through functional and leadership pro-grammes and targeted recruitment campaigns.
A.P. Moller - Maersk has a robust com-pliance programme for anti-corruption, competition law and economic sanc-tions, and export controls designed to fulfil the global requirements and many initiatives are in place to improve focus and emphasis on compliance awareness and training.
Actions were launched to assess and address employee engagement levels on a more frequent basis. Further ini-tiatives will be launched to further strengthen the A.P. Moller - Maersk behaviours and elevate the company culture.
35 A.P. Moller - Maersk Annual Report 2020 Risk managementOur businessDirectors’ Report

Performance 2020
Performance overview
Ocean
Logistics & Services
Terminals & Towage
Manufacturing & Others
EBITDA increased by 44% to USD 8.2bn with increases in all segments
36 A.P. Moller - Maersk Annual Report 2020 Directors’ Report

Performance overview
USD 29,175m USD 6,545m
USD 6,963m USD 454m
USD 3,807m USD 1,205m
USD 1,254m USD 165m
Revenue EBITDA
OceanLogistics & Services
Terminals & Towage
Manufacturing & Others
Ocean revenue was USD 29.2bn (USD 28.8bn) with nega-tive effects from COVID-19 on loaded volumes, predomi-nantly in Q2, offset by the effects of higher freight rates. EBITDA increased to USD 6.5bn (USD 4.4bn), yielding an EBITDA margin of 22.4% (15.4%). Profitability improved in 2020 as a result of higher rates, lower costs and timely responses to changing market conditions where agile capacity deployment was executed to meet both mid-year global demand downturn and demand surges towards the end of the year. The average loaded freight rate increased by 7.9% due to short-term rate increases, and total oper-ating costs decreased by 5.8% from improved cost man-agement, higher utilisation and lower bunker cost.
Ocean has actively deployed capacity to accom-modate the significant demand fluctuations by withdrawing in H1 and increasing in H2, which helped mitigate the worsened schedule reliability caused by the global supply chain disruptions to service Ocean customers best possible.
Maersk Spot gained significant momentum in 2020 and, measured on the last four weeks in 2020, accounted for 51% (20%) of total loaded short-term volume under the Maersk brand.
Logistics & Services reported a revenue of USD 7.0bn (USD 6.3bn), driven by increasing revenue in warehousing and distribution including Performance Team, air freight for-warding and supply chain management, offset by decrease in intermodal and sea freight forwarding. Gross profit grew to USD 1.6bn (USD 1.2bn) reflecting a gross profit margin of 23% (20%) with margins improving throughout the year. The improvement was supported by margin optimisation in especially intermodal and warehousing and distribution and effects from the acquisition of Performance Team, partially offset by lower margins in supply chain manage-ment. EBITDA increased to USD 454m (USD 216m).
The combined warehousing and distribution, and customs services presence has increased with the integration of Performance Team in North America and KGH Customs Services in Europe.
Air freight forwarding and less container load (LCL) products was integrated into Maersk logistics and services to complement the end-to-end offering effective as of October. The Damco brand was discontinued.
Terminals & Towage reported an increased EBITDA of USD 1.2bn (USD 1.1bn), despite revenue decreased by 3.6% to USD 3.8bn (USD 3.9bn). In gateway terminals, revenue decreased with lower volumes due to COVID-19. EBITDA increased to USD 989m (USD 913m), mainly driven by con-solidation of Pipavav, India, and cost savings partly off-set by lower volumes. The decrease in volumes of 3.6% was driven by lower volume of 1.2% from the Ocean seg-ment and 4.9% from external customers. Towage reported a revenue of USD 681m (USD 695m), with an EBITDA of USD 216m (USD 205m), mainly due to lower costs, aligned to the strategic growth initiatives launched in 2019.
All terminals remained operational through - out the COVID-19 pandemic. The new terminal in Vado, Italy, began operations in Q1 and the terminal in Tema, Ghana, ramped up during 2020.
Towage signed new contracts and negotiated extensions to existing contracts. Operations were updated with new locations and planned exit of others.
Manufacturing & Others revenue decreased to USD 1.3bn (USD 1.4bn) while EBITDA increased to USD 165m (USD 136m). Maersk Container Industry EBITDA increased to USD 77m (USD 29m), which was the strongest financial year of its core marine reefer business. Maersk Supply Service EBITDA decreased to USD 21m (USD 28m), reflect-ing lower activity offset by cost reductions. For other businesses, revenue was USD 415m (USD 484m), and EBITDA was USD 66m (USD 80m).
Maersk Container Industry saw higher Star Cool Unit sales compensating for lost Star Cool Integrated production in Q1 due to COVID-19 and achieved the highest ever third-party unit bookings total.
Maersk Supply Service was awarded several contracts in the North Sea and Africa for its integrated solution service.
37 A.P. Moller - Maersk Annual Report 2020 Performance 2020 Performance overviewDirectors’ Report

Financial and operational performanceRevenue was USD 29.2bn (USD 28.8bn), with a decrease in volumes to 12,634k FFE (13,296k FFE) as a result of COVID-19, more than offset by improved freight rates, which increased to 2,000 USD/FFE (1,853 USD/FFE).
Despite restructuring cost from strategic changes announced in Q3, EBITDA increased by 48% to USD 6.5bn (USD 4.4bn), driven by higher revenue and a lower cost base mainly due to agile capacity deploy-ment combined with a lower bunker price and con-sumption. As a result of this, the EBITDA margin increased by 7.0 percentage points to 22.4%.
At the heart of the integrator strategy, Ocean enables trade through strategic brands and digital channels providing customers the flex-ibility and stability needed to manage and simplify end-to-end sup-ply chains. Operating the largest container ship fleet in the world, Ocean carries more than 12 million forty-foot-equivalent units per annum, split approximately 45/55 between long-term and short-term contracts calling over 300 ports around the world.
Ocean 2020 2019
Ocean highlightsUSD million 2020 2019
Freight revenue 24,920 24,466Other revenue, including hubs 4,255 4,316Revenue 29,175 28,782
Container handling costs 8,474 8,988Bunker costs 3,835 4,566Network costs, excluding bunker costs 6,625 7,025Selling, General & Administration (SG&A) 2,698 2,786Cost of goods sold and other operational costs 1,252 919Total operating costs 22,884 24,284Other income/costs, net 254 -62Profit/loss before depreciation, amortisation and impairment losses, etc. (EBITDA) 6,545 4,436EBITDA margin 22.4% 15.4%
Gross capital expenditure, excl. acquisitions and divestments (CAPEX) 653 1,172
Operational and financial metricsLoaded volumes (FFE in ’000) 12,634 13,296Loaded freight rate (USD per FFE) 2,000 1,853Unit cost, fixed bunker (USD per FFE incl. VSA income) 1,973 1,954Bunker price, average (USD per tonne) 372 412Bunker consumption (tonne in ’000) 10,322 11,092Average nominal fleet capacity (TEU in ’000) 4,081 4,132Fleet owned (end of year) 301 307Fleet chartered (end of year) 405 401
USD 29,175m USD 28,782m
Revenue
USD 6,545m USD 4,436m
EBITDA
USD 653m USD 1,172m
CAPEX
38 A.P. Moller - Maersk Annual Report 2020 Performance 2020 OceanDirectors’ Report

Volumes were 5.0% lower at 12,634k FFE (13,296k FFE) due to COVID-19, predominantly in Q2, mainly due to decreases in East-West and North-South trades. The decrease in East-West was driven by Europe and Middle East trades, while North America saw higher volumes in H2 2020. The decrease in North-South was driven by the weak demand across Latin America, Africa and Oceania trades. Total headhaul decreased by 4.3%, mainly for Latin America, Europe and Middle East, while total backhaul decreased by 6.3%.
The average loaded freight rate increased by 7.9% to 2,000 USD/FFE (1,853 USD/FFE), driven by an increase of 14.1% on East-West supported by strong demand, vessel and equipment shortages and bottlenecks across the entire supply chain. On North-South the average freight rates increased by 7.8%, driven by headhaul increase in Latin America and Africa combined with higher backhaul rates in Oceania. The rate increases on East-West and North-South trades were partly offset by lower rates on intra- regional trades driven by a 7.0% decrease in intra-Americas rates. The average loaded freight rate was positively impacted by mix effects from relatively higher headhaul volumes especially in North America and neg-atively affected by developments in foreign exchange rate and the bunker price change. The average loaded freight rate at fixed bunker increased by 9.8%.
Freight revenue was USD 24.9bn (USD 24.5bn), while other revenue was flat at USD 4.3bn (USD 4.3bn). Adjusted for the foreign exchange rate effects, the freight revenue increased by 2.4%.
Unit cost at EBIT level (based on a fixed bunker price)
Unit cost fixed at 450 USD/tonne
Unit cost at fixed bunker price was 1.0% above 2019, despite a reduction in total operating costs. Unit cost was driven by lower volumes, offset partially by improved bunker efficiency and for-eign exchange rate effects. Compared to 2019, the unit cost at fixed bunker increased by 1.6% adjusting for the foreign exchange rate effects.
Cost split % EBITDA level
Container handling and equipment cost Network cost excl. bunker Bunker Non-operational cost
37%29%17%17%
2020
37%29%19%15%
2019
Loaded volumes FFE (’000) 2020 2019 Change Change %
East-West 5,948 6,194 -246 -4.0North-South 3,900 4,268 -368 -8.6Intra-regional 2,786 2,834 -48 -1.7Total 12,634 13,296 -662 -5.0
Average freight ratesUSD/FFE 2020 2019 Change Change %
East-West 2,008 1,760 248 14.1North-South 2,529 2,347 182 7.8Intra-regional 1,345 1,366 -21 -1.5Total 2,000 1,853 147 7.9
39 A.P. Moller - Maersk Annual Report 2020 Performance 2020 OceanDirectors’ Report

Total operating costs decreased by 5.8% to USD 22.9bn (USD 24.3bn), impacted by lower volumes, lower fuel costs and agile capacity manage-ment, as well as favourable impact from devel-opment in foreign exchange rates and lower con-tainer-related costs. Network costs excluding bun-ker costs decreased by 5.7%, mainly due to agile
capacity deployment through the COVID-19, lead-ing to a high utilisation, and lower port costs due to reduced calls. Adjusting for the positive impact from the developments in foreign exchange rates, the operating costs decreased by 5.2%. Based on the lower cost base, container handling cost, bun-ker cost and SG&A and other cost decreased their
share of total costs, while network costs, exclud-ing bunker increased slightly.
Total unit cost decreased by 0.7% to 1,909 USD/FFE (1,922 USD/FFE), driven by a decrease in fuel cost caused by a 6.9% lower consumption and a decreased average bunker price of 9.7%, equal
to 40 USD/tonne. The combined effect of lower average prices and lower consumption resulted in a total bunker cost decrease of 16% to USD 3.8bn (USD 4.6bn). Out of the total decrease, USD 0.5bn was due to the lower average bunker price, with the remaining decrease due to lower consump-tion partly, given a 0.8% improvement in bunker
Moving the market with Maersk ECO DeliveryA core element of the strategy to decarbonise shipping is to develop and commercialise prod-ucts that reduce the carbon footprint of cus-tomer supply chains. In 2019, A.P. Moller - Maersk was the first to launch a carbon-neutral solution for ocean transport, Maersk ECO Delivery, based on sustainable biofuel from waste sources such as used cooking oil. It provides direct carbon sav-ings, not carbon offsets, by ensuring that for any Maersk ECO Delivery container transport, enough sustainable biofuel will be purchased and used in the A.P. Moller - Maersk network to neutralise the carbon emissions that would have occurred using standard fuel. These CO2 savings are allocated to the customer and verified by the Roundtable on Sustainable Biomaterials.
In 2020, customer uptake of Maersk ECO Delivery exceeded expectations. So far, around ten major customers have chosen to purchase this car-bon-neutral emissions transport solution, and this number is expected to increase. Conversa-tions with customers on the possibility of con-verting all their shipments to the Maersk ECO delivery product are ongoing. While this is very promising, it represents a small share of the total amount of containers transported by A.P. Moller - Maersk, and we need much more customer demand to scale net-zero emissions offerings and enable a transition to full decar-bonisation.
Customer uptake of Maersk ECO Delivery
exceeded expectations in 2020
Decarbonising ocean shipping
40 A.P. Moller - Maersk Annual Report 2020 Performance 2020 OceanDirectors’ Report

efficiency to 40.9 g/TEU*NM (41.2 g/TEU*NM) compared to 2019.
Unit cost at fixed bunker increased by 1.0% to 1,973 USD/FFE (1,954 USD/FFE), driven by lower volumes, somewhat offset by improved bunker efficiency and development in foreign exchange rates. Adjusting for the positive impact from the developments in foreign exchange rates, the unit cost at fixed bunker increased by 1.6%.
The average nominal capacity of 4,081k TEU decreased by 1.2% due to agile capacity develop-ment executed to meet mid-year global demand downturn, which has since increased with demand surges towards the end of the year. There were no vessels in the newbuilding programme at the end of Q4, and the fleet consisted of 301 owned and 405 chartered vessels, of which 99k TEU or 2.4% of the fleet were idle (12 vessels), mainly due to repairs, scrubbers retrofitting, and capacity adjustments.
Ocean continued to deliver on its strategy with a rigorous focus on servicing customers and limit the negative impact from disruptions to their supply chains during the COVID-19 outbreak. Q2 saw a significant decrease in volumes and major changes to the fleet were applied to adjust capacity to the impact of global lockdown of economies. From Q3, unex-pected pick-up in demand on some routes resulted in strong pricing dynamics, with bottlenecks and space access com-bined with vessel and equipment shortages becoming a chal-lenge for most customers. Additional flexibility was provided, focusing on long-term customers to cater for additional demand, despite the strong short-term freight rate market, while adding extra capacity to accommodate volumes.
In H2, strategic changes were announced in order to further enhance the customer experience and end-to-end service delivery. Safmarine will no longer be marketed as a separate brand, as A.P. Moller - Maersk and Safmarine have converged, both focusing on building a customer-centric culture with digital interactions. While continuing to meet customers as two separate brands with a differentiated service model, the front offices of A.P. Moller - Maersk and Hamburg Süd will come closer together into more customer- centric teams. Maersk Spot, launched in Q2 2019 offering transparent prices and loading guarantee, gained significant momen-tum in 2020, growing its share of loaded short-term vol-umes consistently. On a four-week average basis, Maersk Spot volumes at year-end were 51% of the total loaded short-term volumes under A.P. Moller - Maersk brand (excl. Sealand and Hamburg Süd).
Key initiatives 2020Our industry is a significant contributor to global greenhouse gas emissions, and through investment and collaboration, we will decarbonise our operations.
FROM OUR BUSINESS MODEL
net zero CO2
Fleet overview, year-endTEU Number of vessels
2020 2019 2020 2019
Own container vessels0 – 2,999 TEU 106,222 116,165 53 583,000 – 4,699 TEU 365,351 365,351 90 904,700 – 7,999 TEU 311,230 344,844 50 558,000 – 11,499 TEU 408,774 428,054 50 4811,500 – 14,999 TEU 122,123 69,018 6 615,000 – 17,499 TEU 292,282 292,282 19 19> 17,500 TEU 593,048 593,048 31 31Total 2,199,030 2,208,762 301 307
Chartered container vessels0 – 2,999 TEU 388,524 381,688 188 1793,000 – 4,699 TEU 311,179 286,067 77 714,700 – 7,999 TEU 408,118 410,119 68 698,000 – 11,499 TEU 523,677 544,568 51 5911,500 – 14,999 TEU 214,387 293,656 21 23Total 1,845,885 1,916,098 405 401Total fleet 4,044,915 4,124,860 706 708
Sustained operational resilience
Simplification of the organisation
Maersk Spot, a preferred choice
41 A.P. Moller - Maersk Annual Report 2020 Performance 2020 OceanDirectors’ Report
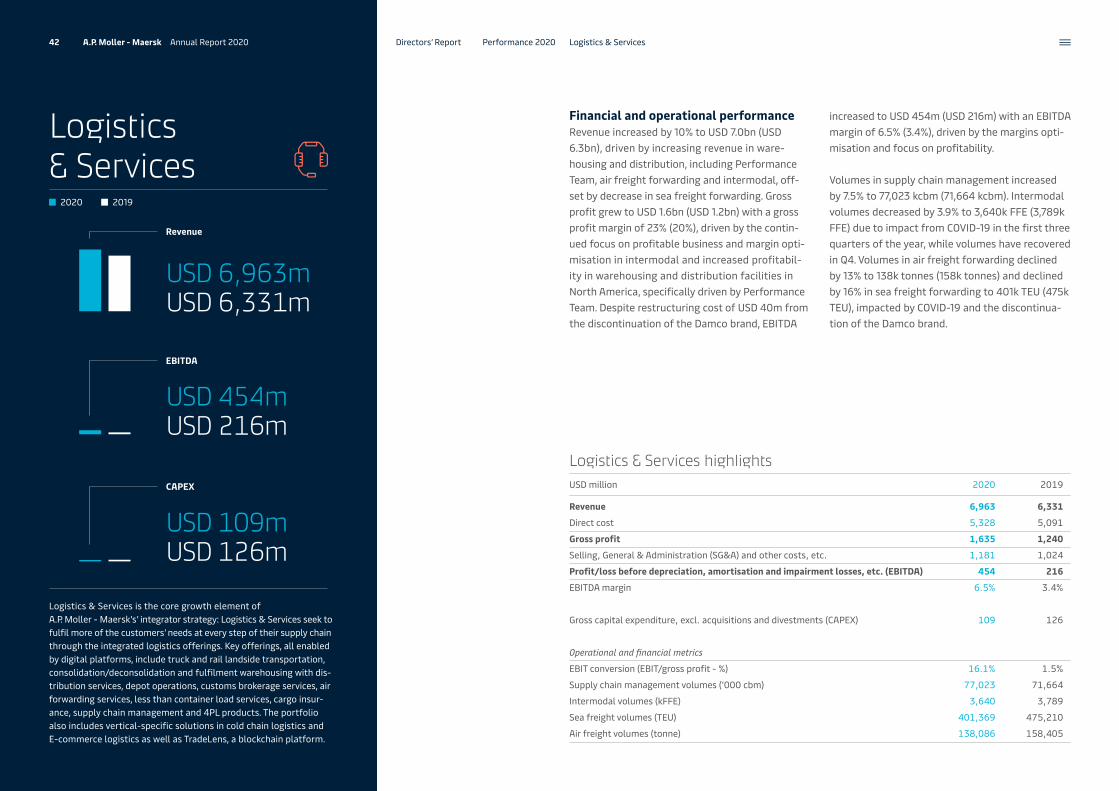
Logistics & Services is the core growth element of A.P. Moller - Maersk’s’ integrator strategy: Logistics & Services seek to fulfil more of the customers’ needs at every step of their supply chain through the integrated logistics offerings. Key offerings, all enabled by digital platforms, include truck and rail landside transportation, consolidation/deconsolidation and fulfilment warehousing with dis-tribution services, depot operations, customs brokerage services, air forwarding services, less than container load services, cargo insur-ance, supply chain management and 4PL products. The portfolio also includes vertical-specific solutions in cold chain logistics and E-commerce logistics as well as TradeLens, a blockchain platform.
Logistics & Services
2020 2019
USD 6,963m USD 6,331m
Revenue
USD 109m USD 126m
CAPEX
USD 454m USD 216m
EBITDA
Financial and operational performanceRevenue increased by 10% to USD 7.0bn (USD 6.3bn), driven by increasing revenue in ware-housing and distribution, including Performance Team, air freight forwarding and intermodal, off-set by decrease in sea freight forwarding. Gross profit grew to USD 1.6bn (USD 1.2bn) with a gross profit margin of 23% (20%), driven by the contin-ued focus on profitable business and margin opti-misation in intermodal and increased profitabil-ity in warehousing and distribution facilities in North America, specifically driven by Performance Team. Despite restructuring cost of USD 40m from the discontinuation of the Damco brand, EBITDA
increased to USD 454m (USD 216m) with an EBITDA margin of 6.5% (3.4%), driven by the margins opti-misation and focus on profitability.
Volumes in supply chain management increased by 7.5% to 77,023 kcbm (71,664 kcbm). Intermodal volumes decreased by 3.9% to 3,640k FFE (3,789k FFE) due to impact from COVID-19 in the first three quarters of the year, while volumes have recovered in Q4. Volumes in air freight forwarding declined by 13% to 138k tonnes (158k tonnes) and declined by 16% in sea freight forwarding to 401k TEU (475k TEU), impacted by COVID-19 and the discontinua-tion of the Damco brand.
Logistics & Services highlightsUSD million 2020 2019
Revenue 6,963 6,331Direct cost 5,328 5,091Gross profit 1,635 1,240Selling, General & Administration (SG&A) and other costs, etc. 1,181 1,024Profit/loss before depreciation, amortisation and impairment losses, etc. (EBITDA) 454 216EBITDA margin 6.5% 3.4%
Gross capital expenditure, excl. acquisitions and divestments (CAPEX) 109 126
Operational and financial metricsEBIT conversion (EBIT/gross profit - %) 16.1% 1.5%Supply chain management volumes (’000 cbm) 77,023 71,664Intermodal volumes (kFFE) 3,640 3,789Sea freight volumes (TEU) 401,369 475,210Air freight volumes (tonne) 138,086 158,405
42 A.P. Moller - Maersk Annual Report 2020 Logistics & ServicesPerformance 2020Directors’ Report

The revenue in supply chain management improved by 12% to USD 961m (USD 861m), while revenue in intermodal decreased by 6.7% to USD 2.7bn (USD 2.9bn), mainly due to lower volumes.
In supply chain management gross profit increased by 2.9% to USD 350m (USD 340m), due to a bounce back in kcbm volumes in H2, while H1 saw a decrease in volumes due to COVID-19. Profitability improved in intermodal, driven by the ongoing margin optimisation and better cor-ridor mix with an increase in gross profit of 75% to USD 296m (USD 169m). The operational effi-ciencies are mainly achieved by focus on higher margin corridors and lower cost from less imbal-ance between import and export in North America, West Central Asia and Europe.
In air freight forwarding, revenue was up 61% to USD 780m (USD 485m) and gross profit was up 66% to USD 88m (USD 53m). Profitability increased despite a volume decrease, driven by the continued high rates in Asia Pacific, where urgent air freight solutions were developed during the COVID-19 pandemic.
Other services revenue and gross profit increased, driven by positive contribution from warehous-ing and distribution including the activity from Performance Team in North America with a rev-enue of USD 398m and an EBITDA of USD 59m. This is a result of a significant turnaround of the US based sites during 2020. While increased han-dling volume was a positive contributing factor, the combined effect of automation investment in sorters and the deployment of operation excel-lence expertise acquired via Per formance Team heavily contributed to strong profitability in the core US facilities, notably Santa Fe, Southgate, and Sumner. The Customs House Broker age activity was
The integration of Damco’s air freight and less container load (LCL) products into the Maersk logistics and services prod-ucts to complement the end-to-end offering was effective as of 1 October. The Damco brand was discontinued.
The agreement to acquire Performance Team, was signed in February with start in April. The acquisition more than doubles the combined warehousing and distribution pres-ence in the North America region, bringing enhanced scale and expertise for the combined customers.
KGH Customs Services was acquired in September. The acquisition increases the combined number of clearances by five times in the Europe region, allowing for a larger foot-print and enhanced ability to service customers end-to-end.
The product offering has expanded by adding Maersk Cargo Insurance to the portfolio, a product that protects customers’ goods against physical loss or damage. Further, in support of the global integrator vision, a new product called Maersk Flow was launched in July. It is a digital solu-tion which provides small and medium sized customers and their partners with everything they need to take con-trol of their supply chain from factory to market.
Work has progressed on the new supply chain management platform and the new Transportation Management System platform for intermodal, to enhance the scope, quality and efficiency of the services offered to customers, thereby con-tributing to an end-to-end integrated offering.
Key initiatives 2020
Revenue and gross profitRevenue Gross profit
2020 2019 2020 2019
Intermodal 2,736 2,932 296 169Supply chain management 961 861 350 340Inland services 527 519 201 210Sea freight forwarding 460 546 62 86Air freight forwarding 780 485 88 53Other services 1,499 988 638 382
expanded with the acquisition of KGH Customs Services in Europe with a revenue of USD 33m and an EBITDA of USD 5m.
The combined acquisitions in 2020 contributed with a revenue of USD 431m and an EBITDA of USD 64m.
EBIT conversion improved to 16.1% (1.5%), with positive impact from SG&A savings and optimised cost base. Further, 2019 was impacted by impair-ment, reducing the EBIT for Logistics & Services in December.
Our assets, supplier relationships and expertise in end-to-end delivery networks ensure our customers resilient supply chains.
FROM OUR BUSINESS MODEL
Freight forwarding integration
Performance Team and KGH Customs Services
End-to-end offerings
43 A.P. Moller - Maersk Annual Report 2020 Performance 2020 Logistics & ServicesDirectors’ Report

Terminals & Towage includes Terminals operating activities in ports fully or partially controlled by the APM Terminals brand, with the main revenue stream being port activities, and Towage operating activities under the Svitzer brand, a provider of offshore towage and salvage services.
Terminals & Towage
2020 2019
TerminalsFinancial and operational performanceRevenue decreased by 3.9% to USD 3.2bn (USD 3.3bn), with lower volumes due to COVID-19. EBITDA increased by 8.3% to USD 989m (USD 913m), reflecting an increase in the EBITDA margin to 31% (28%), driven by higher revenue per move and cost reductions in several terminals. CAPEX was USD 327m (USD 441m). The terminal in Vado, Italy, began operations in Q1, and Pipavav, India, was fully consolidated as of June.USD 3,807m
USD 3,948m
Revenue
USD 457m USD 532m
CAPEX
USD 1,205m USD 1,118m
EBITDA
Significant COVID-19 impact in especially Q2 led to a full year volume decrease of 3.6% (decrease of 6.6% like-for-like, adjusted for new terminal in Vado and Pipavav). The impact varied across regions, and volume volatility was high through-out the year. North America was impacted the most with 8.7% volume reduction, mainly driven by Los Angeles, USA, which handled just 447 moves in the worst week of March as compared to an average of 24k moves per week in Q4.
Terminals & Towage highlightsUSD million 2020 2019
Revenue 3,807 3,948Concession fees 287 249Labour cost (blue collar) 1,236 1,313Other operational cost 520 628Selling, General & Administration (SG&A) and other costs, etc. 559 640Total operating costs 2,602 2,830Profit/loss before depreciation, amortisation and impairment losses, etc. (EBITDA) 1,205 1,118EBITDA margin 31.7 28.3
Gross capital expenditure, excl. acquisitions and divestments (CAPEX) 457 532
Operational and financial metricsTerminal volumes – financially consolidated (moves, m) 11.5 11.9 Ocean segment 4.1 4.1 External customers 7.4 7.8Terminal revenue per move – financially consolidated (USD) 275 272Terminal cost per move – financially consolidated (USD) 232 233Result from joint ventures and associated companies (USD m) 236 206Number of operational tug jobs (harbour towage) (’000) 138 134Annualised EBITDA per tug (terminal towage) (USD in ’000) 956 889
44 A.P. Moller - Maersk Annual Report 2020 Terminals & TowagePerformance 2020Directors’ Report

Europe was impacted by a 3.8% reduction followed by Africa and Middle East with a 2.2% reduction in volume. In Latin America, volume decreased by 2.1%, while volume in Asia increased by 1.1%.
Volume from the Ocean segment decreased by 1.2% (decreased by 5.4% like-for-like), and volume from external customers decreased by 4.9% (decreased by 7.2% like-for-like). Utilisation decreased to 70% (80%), as volume decreased by 3.6%, while capac-ity was higher due to Pipavav consolidation, in Vado driven by the ramp-up, and in Port Elizabeth, USA, due to a modernisation project in Q4 2019. On an equity-weighted basis, volume decreased by 3.2% (decreased by 3.0% like-for-like, adjusted for Vado and the exit from Douala, Cameroon), and uti-lisation was 78% (85%).
Revenue per move increased by 1.3% to USD 275 (USD 272), positively impacted by terminal mix, and supported by higher storage income in Los Angeles, partially offset by negative rate of exchange impact in the African and Latin American regions. Adjusted for foreign exchange rate, volume mix effects, portfolio changes and one-offs, revenue per move increased by 2.5%.
Cost per move decreased by 0.3% to USD 232 (USD 233), positively impacted by rate of exchange in the African and Latin American regions, partially offset by lower utilisation, terminal mix and higher cost in Apapa, Nigeria. Adjusted for foreign exchange rates, volume mix effects and portfolio changes, cost per move increased by 3.9%.
The EBITDA margin in gateway terminals increased by 3.5 percentage points to 31.4% (27.8%), as higher revenue per move and SG&A cost reduc-tions as well as operational cost reductions
Key initiatives 2020
Cost split % Terminals
Labour Service & Administration Other operational cost Concession fee Depreciation
48%10%13%11%18%
2020
50%11%14%
9%16%
2019
Regional volume, Terminals1
Million moves 2020 2019 Growth %
North America 2.8 3.0 -8.7Latin America 2.3 2.4 -2.1Europe, Russia and the Baltics 2.4 2.5 -3.8Asia 2.0 2.0 1.1Africa and Middle East 1.9 2.0 -2.2Total 11.5 11.9 -3.6
1 Financially consolidated.
Terminals signed an agreement with the Yokohama- Kawasaki International Port Corporation (YKIP) in Q2 for two additional modern berths, thereby becoming the only terminal in Japan capable of handling 20,000 TEU vessels. The berths were handed over to APM Terminals in July, and operations on the first berth began in July. The second berth is scheduled in 2021 and by then, the terminal capac-ity will have increased to 2.4m TEU from previously 1.1m TEU annually.
The construction of the second container terminal in Abidjan, Ivory Coast, began following the handover from the Port Authority in March, and the expected go-live is in 2022. Once construction is completed, the new terminal will have an annual throughput capacity of 1.2m TEU and will be capable of handling 14,000 TEU vessels.
APM Terminals Poti, Georgia, and Poti New Terminals Corporation have signed an agreement for the joint develop-ment of the dry and bulk cargo facility on the northern side of Poti Port, where an expansion project is being planned with construction expected to begin in 2021.
APM Terminals launches a new facility in Kalundborg, Denmark in 2021.
A new automated gateinfrastructure was launchedin Port Elizabeth, USA, in Q2
Several cost management programmes carried out by the terminals
New terminal in Vado, Italy, and Tema, Ghana, ramped up during 2020
Revenue and cost per move Financially consolidated, Terminals, USD
Revenue Cost
Note: Revenue per move includes terminal revenue, other income, government grants and excludes IFRIC 12 construction revenue. Cost per move includes cost (EBITDA less revenue less other income), depreciation and excludes internal man-agement fees and IFRIC 12 construction cost.
45 A.P. Moller - Maersk Annual Report 2020 Performance 2020 Terminals & TowageDirectors’ Report

more than compensated for the lower utilisa-tion. In Asia, the EBITDA margin increased by 11 percentage points mainly due to Pipavav con-solidation. In Latin America, the EBITDA margin increased by 8.6 percentage points, due to risks not materialising, and ramp-up in Moin, Costa Rica, followed by North America, where the
EBITDA margin increased by 3.6 percentage points. In Europe, the EBITDA margin increased by 0.6 per-centage points, mainly due to ramp-up of Vado. The EBITDA margin decreased in Africa and Middle East by 12 percentage points partly due to opera-tional challenges in Apapa.
Results from joint ventures and associated companiesThe equity-weighted EBITDA increased to USD 1.4bn (USD 1.3bn), mainly driven by ramp-up of Tema, Ghana, and increased EBITDA from consoli-dated terminals, offset by exit from Douala.
The share of profit in joint ventures and associ-ated companies of USD 216m (USD 185m) was pos-itively impacted by ramp-up of Tema and foreign exchange rate gain. Cash contribution from joint ventures and associated companies through divi-dends was USD 120m (USD 188m).
Regional EBITDA margin, Terminals1
Percentage 2020 2019
North America 24 20Latin America 42 34Europe, Russia and the Baltics 28 28Asia 31 19Africa and Middle East 33 45Total 31 28
1 Financially consolidated.
TerminalsNumber of terminals 2020 2019 One terminal under
implementation in Abidjan, Ivory Coast, opening in 2022.
North America 5 5Latin America 11 11Europe, Russia and the Baltics 18 18Asia 17 17Africa and Middle East 15 16Total 66 67
Port terminals contribute to decarbonisationAPM Terminals consumes 73% of the electricity used by A.P. Moller - Maersk. To sustain leader ship on decarbonisation and to match customer needs and stake-holder demands, A.P. Moller - Maersk is working to identify ways in which emissions across all scopes – directly from operations, emissions related to the purchase of energy, and emissions in the value chain – can be tackled as part of the company’s decarbonisa-tion efforts. Decarbonisation of port terminals will be one of the elements contributing to achieve this goal.
In January 2020, the Green Gate-way Gothenburg was launched as a showcase for decarbonisation of existing terminals. Switching to
renewable electricity to power the cranes and offices, biogas for heating, and using biodiesel made from recy-cled waste vegetable oils in mobile equipment, the Gothenburg terminal reduced its CO2 emissions by 88%.
Ways to eliminate the last 12% of emissions are being pursued with ter-minal customers to provide a fully CO2 neutral container handling service.
Other paths to decarbonisation of the energy supply for ports are being tested as well, with solar projects in Pipavav, India, and Aqaba, Jordan, grid optimisation trial projects in two fur-ther sites, and further switches to renewable electricity in the European and US terminals in 2021.
Decarbonising energy supply
APM Terminals Gothenburg switched to renewable energy in 2020.
46 A.P. Moller - Maersk Annual Report 2020 Performance 2020 Terminals & TowageDirectors’ Report
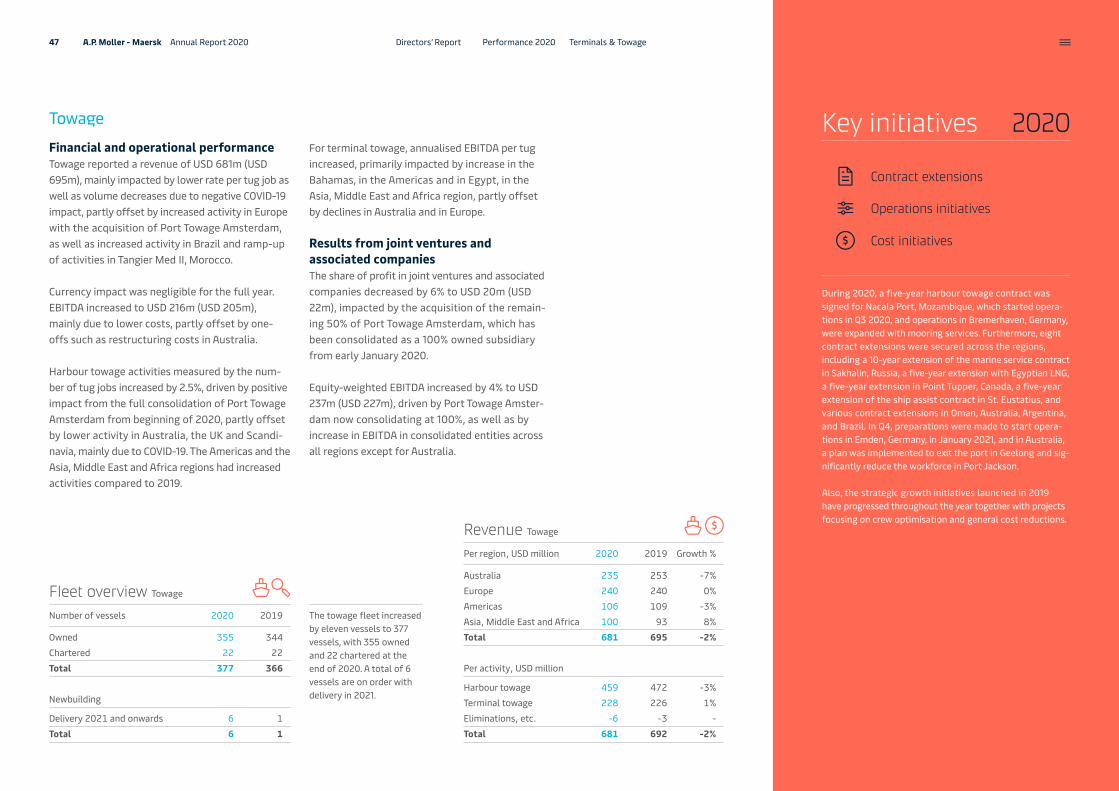
Fleet overview Towage
Number of vessels 2020 2019 The towage fleet increased by eleven vessels to 377 vessels, with 355 owned and 22 chartered at the end of 2020. A total of 6 vessels are on order with delivery in 2021.
Owned 355 344Chartered 22 22Total 377 366
Newbuilding
Delivery 2021 and onwards 6 1Total 6 1
TowageFinancial and operational performanceTowage reported a revenue of USD 681m (USD 695m), mainly impacted by lower rate per tug job as well as volume decreases due to negative COVID-19 impact, partly offset by increased activity in Europe with the acquisition of Port Towage Amsterdam, as well as increased activity in Brazil and ramp-up of activities in Tangier Med II, Morocco.
Currency impact was negligible for the full year. EBITDA increased to USD 216m (USD 205m), mainly due to lower costs, partly offset by one-offs such as restructuring costs in Australia.
Harbour towage activities measured by the num-ber of tug jobs increased by 2.5%, driven by positive impact from the full consolidation of Port Towage Amsterdam from beginning of 2020, partly offset by lower activity in Australia, the UK and Scandi-navia, mainly due to COVID-19. The Americas and the Asia, Middle East and Africa regions had increased activities compared to 2019.
During 2020, a five-year harbour towage contract was signed for Nacala Port, Mozambique, which started opera-tions in Q3 2020, and operations in Bremerhaven, Germany, were expanded with mooring services. Furthermore, eight contract extensions were secured across the regions, including a 10-year extension of the marine service contract in Sakhalin, Russia, a five-year extension with Egyptian LNG, a five-year extension in Point Tupper, Canada, a five-year extension of the ship assist contract in St. Eustatius, and various contract extensions in Oman, Australia, Argentina, and Brazil. In Q4, preparations were made to start opera-tions in Emden, Germany, in January 2021, and in Australia, a plan was implemented to exit the port in Geelong and sig-nificantly reduce the workforce in Port Jackson.
Also, the strategic growth initiatives launched in 2019 have progressed throughout the year together with projects focusing on crew optimisation and general cost reductions.
Key initiatives 2020
Revenue Towage
Per region, USD million 2020 2019 Growth %
Australia 235 253 -7%Europe 240 240 0%Americas 106 109 -3%Asia, Middle East and Africa 100 93 8%Total 681 695 -2%
Per activity, USD million
Harbour towage 459 472 -3%Terminal towage 228 226 1%Eliminations, etc. -6 -3 -Total 681 692 -2%
For terminal towage, annualised EBITDA per tug increased, primarily impacted by increase in the Bahamas, in the Americas and in Egypt, in the Asia, Middle East and Africa region, partly offset by declines in Australia and in Europe.
Results from joint ventures and associated companiesThe share of profit in joint ventures and associated companies decreased by 6% to USD 20m (USD 22m), impacted by the acquisition of the remain-ing 50% of Port Towage Amsterdam, which has been consolidated as a 100% owned subsidiary from early January 2020.
Equity-weighted EBITDA increased by 4% to USD 237m (USD 227m), driven by Port Towage Amster-dam now consolidating at 100%, as well as by increase in EBITDA in consolidated entities across all regions except for Australia.
Contract extensions
Cost initiatives
Operations initiatives
47 A.P. Moller - Maersk Annual Report 2020 Performance 2020 Terminals & TowageDirectors’ Report

Maersk Container Industry is a manufacturer of reefer containers at the factory in China. Maersk Supply Service provides marine services and integrated solutions to the energy sector worldwide with a large fleet of anchor handling tug supply vessels and sub-sea support vessels. Others consists of Maersk Training, a provider of training services to the maritime, oil and gas, offshore wind and crane industries, tanker activity acquired as part of the Hamburg Süd acquisition and other shipping related businesses.
Manufacturing & Others
2020 2019
Financial and operational performanceRevenue was USD 1.3bn (USD 1.4bn) with an EBITDA of USD 165m (USD 136m).
Maersk Container Industry experienced the stron-gest financial year of its core marine reefer busi-ness. Revenue remained stable at USD 587m (USD 586m) with the majority of revenue related to third-party customers. Higher Star Cool Unit (SCU) sales offset lost production of the Star Cool Inte-grated (SCI) product, when the company’s factory in Qingdao, China was forced to close for a portion of Q1 due to COVID-19. Additionally, the company achieved its highest ever third-party unit bookings.
EBITDA increased to USD 77m (USD 29m), due todisciplined cost control and 2019 was negatively impacted by restructuring costs.
Maersk Supply Service reported a 17% decrease in revenue to USD 252m (USD 306m), and an EBITDA of USD 21m (USD 28m), reflecting lower activity offset by cost reductions. Cash flow used for cap-ital expenditure was USD 17m (USD 188m), due to zero (two) payments of new buildings.
Maersk Supply Service was awarded several contracts in the North Sea and Africa for its inte-grated solution service, demonstrating the syner-gies gained from combining the role of the vessel owner with project contractor.
For Others, revenue was USD 415m (USD 484m), and EBITDA was USD 66m (USD 80m).
USD 1,254m USD 1,376m
Revenue
USD 165m USD 136m
EBITDA
USD 33m USD 204m
CAPEX
Manufacturing & Others highlightsUSD million 2020 2019
Revenue 1,254 1,376Profit/loss before depreciation, amortisation and impairment losses, etc. (EBITDA) 165 136EBITDA margin 13.2% 9.9%
Gross capital expenditure, excl. acquisitions and divestments (CAPEX) 33 204
48 A.P. Moller - Maersk Annual Report 2020 Manufacturing & OthersPerformance 2020Directors’ Report

Governance
Corporate governance
Board of Directors
Executive Board
Remuneration
Shareholder information
After an extraordinary year with great volatility, the share price ended 41% higher than last year, implying a total shareholder return of 45% for 2020
49 A.P. Moller - Maersk Annual Report 2020 Directors’ Report
Corporate governanceCorporate governance is an important aspect of A.P. Møller - Mærsk A/S in line with the company values. A.P. Møller - Mærsk A/S is continuously developing its corporate governance in response to the strategic develop-ment, goals, and activities, as well as to the external environment and input from stakeholders.
The five core values ‘Constant Care’, ‘Humble-ness’, ‘Uprightness’, ‘Our Employees’ and ‘Our Name’ remain pillars for the way in which A.P. Møller - Mærsk A/S conducts its business. Engrained in the company for more than a century, these corporate values are continuously being pro-moted throughout the global organisation and serve as guiding principles for employees and leaders.
The governance structure supports close coordi-nation between the Board of Directors (the Board), the Executive Board and leaders throughout the organisation. The structure promotes the objectives of:• Early identification of opportunities,
challenges, and risks• Efficient processes for informed
decision- making• Continuous learning • Proactive planning and agile execution• Sound controls, checks and balances,
and compliance• Clear allocation of authorities and
responsibilities• Safe operations.
The formal basis for the corporate governance of A.P. Møller - Mærsk A/S consists of:• The Articles of Association. Available on
http://investor.maersk.com/corporate-govern-ance
• Rules of procedure applicable to the Board of Directors and the Executive Board as well as pro-cedures specific to each of the Board Commit-tees. The Rules of procedure are available on http://investor.maersk.com/corporate-govern-ance
• Policies and principles on health and safety, legal compliance, working culture, tax and key Environment, Social and Governance (ESG) areas. Read more about our policies on https://www.maersk.com/about
• The internal governance framework (COMMIT) stipulates more detailed policies, rules, instruc-tions, and guidelines applicable to all group entities and employees. Among others, the framework covers enterprise risk management, responsible procurement, anti-corruption, legal compliance, etc., and is continuously updated.
• The Maersk Whistleblower system, established in 2011, enables employees and other stake-holders in 130 countries to report wrongdoings. Further information on whistleblower reports is available in the Sustainability Report and on: https://secure.ethicspoint.eu/domain/media/en/gui/102833/index.html.
To organise and conduct Board of Directors meet-ings in the most relevant and efficient manner, the Board of Directors has established an Annual Wheel in cooperation with the Executive Board. The Annual Wheel outlines the main themes and topics for each ordinary Board of Directors meet-ing and areas on which the Executive Board is expected to report as well as matters for delibera-tion or approval by the Board of Directors
members. The Annual Wheel ensures that all rele-vant topics are covered during the year, e.g. strategy, people and capabilities, transparency and com-pliance and risk.
Board evaluationDuring September 2020, an externally facilitated Board evaluation process was conducted, among others covering the cooperation between the Board of Directors and the Executive Board, the Chair-man’s role, the Board’s and Board committees’ work and an assessment of Board capabilities relative to those best supporting the company’s strategy. All members of the Board of Directors participated in the evaluation and provided input via question-naires, thus forming the basis of a comprehensive evaluation report. The results were discussed in plenary sessions by the Board of Directors, and agreed improvements were implemented.
Main conclusions and outcome of the board evaluationThe Board’s work has undergone a positive de vel-op ment in 2018-2020 by improving dynamics, engagement and the level of challenges and spar-ring offered by and among the Board of Directors and the Executive Board. The Board evaluation con-firmed the alignment on the top strategic issues and continued focus on priorities and transparency.
The results and conclusions from the annual Board evaluation, form the basis for the Nomination Com-mittee’s considerations and continued search for future candidates to the Board of Directors.
Board compositionBased on the strategy to move from a con glom-er ate to a focused transportation and logistics company, the Board initiated a process to define the Board composition of the future. As part of
Core values
Constant CareTake care of today, actively prepare for tomorrow
HumblenessListen, learn, share, give space to others
UprightnessOur word is our bond
Our EmployeesThe right environment for the right people
Our NameSum of how we live the Values and how we are perceived
50 A.P. Moller - Maersk Annual Report 2020 Governance Corporate governanceDirectors’ Report

the Board evaluation 2018, key competencies and areas of experience and expertise required on the Board were identified to be: Shipping, trans-port and logistics, IT/digital/tech and e-commerce, business transformation, innovation and entre-preneurship, asset heavy industries, finance and accounting, risk management, global leadership and board service in stock listed companies.
Consequently, the Nomination Committee initiated a search for Board candidates with relevant addi-tional competencies to complete the Board’s over-all, collective capabilities. At the Annual General Meeting in 2019, Bernard L. Bot and Marc Engel were elected members of the Board of Directors bringing competencies within global transport and logistics. At the Annual General Meeting in 2020, Blythe S. J. Masters was elected, bringing compe-tencies within financial services, technology, start-ups and blockchain.
DiversityWhen assessing the composition of the Board, the Nomination Committee also considers diver-sity and setting of the target for the underrepre-sented gender on the Board of Directors in accor-dance with the Danish Company’s Act § 139c. In 2019, the Board of Directors re-adopted the target for the underrepresented gender on the Board of Directors: Three female Board members elected by the general meeting if the Board consists of less than 12 members and four female Board mem-bers elected by the general meeting if the Board consists of 12 or more members. The target has to be met by end 2023. As the Board consists of ten members of which three are female the target is currently met. The Board will continuously assess whether the target set in 2019 is still ambitious. The company keeps focus on driving diversity both on managerial levels and on the Board.
Further information on diversity can be found in the company’s Sustainability Report.
Disclosure regarding change of controlThe EU Takeover Bids Directive, as partially imple-mented by the Danish Financial Statements Act, requires listed companies to disclose information that may be of interest to the market and poten-tial take-over bidders, in particular in relation to disclosure of change-of-control provisions. A.P. Møller - Mærsk A/S discloses that the group in the ordinary course of business has agreements with business partners which could be terminated in case of a change of control. However, given the ownership structure of A.P. Moller - Maersk, the risk is considered to be very remote.
Recommendations for corporate governanceAs a Danish listed company, A.P. Møller - Mærsk A/S must comply with or explain deviations from the ‘Recommendations for Corporate Governance’ implemented by Nasdaq Copenhagen in the Rules for issuers of shares and Section 107b of the Danish Financial Statements Act.
The Board of Directors has prepared a statement on corporate governance for the financial year 2020. This statement includes a description of the company’s approach to the recommendations in the ‘Recommendations for Corporate Gover-nance’. Reporting on compliance with the Corpo-rate Governance recommendations can be found on http://investor.maersk.com/corporate-gov-ernance
The main elements of the company’s internal control and risk management systems in connection with its financial reportingThe company’s risk management and internal con-trols in connection with its financial reporting are planned to reduce the risk of errors and omissions in the financial reporting.
Control environmentThe Board of Directors, the Audit Committee and the Executive Board regularly assess mate-rial risks and internal controls in connection with the company’s financial reporting process. The Audit Committee has a supervisory responsi bility and reports to the entire Board of Directors. The responsibility for the everyday maintenance of an efficient control environment in connection with the financial reporting rests with the Exec-utive Board. The management of the brands and business units are responsible for ensuring an efficient control environment for the respective brand or business unit.
Based on the applicable rules and regulations, the Board of Directors and the Executive Board pre-pare and approve the general policies, procedures, and controls in significant areas in connection with the company’s financial reporting.
The starting point is a clear organisational struc-ture, clear chains of command, authorisation and certification procedures, and segregation of duties as well as adequate accounting and consolidation systems, including validation controls.
In addition, the company has set up policies, man u-als, and procedures within relevant areas in connec-tion with its financial reporting. The policies, manu-als, and procedures are updated on an ongoing basis.
Risk assessment and managementAt least once a year, as part of the risk assess-ment, the Board of Directors, the Audit Commit-tee and the Executive Board undertake a general identification and assessment of risks in connec-tion with the financial reporting, including the risk of fraud, and consider measures to be imple-mented to reduce or eliminate such risks.
Decisions on measures to reduce or eliminate risks are based on an assessment of materiality and probability of errors and omissions.
Control activitiesSpecific control activities have been defined for each significant brand and business unit.
The performance of such control activities is mon i tored on brand and business unit level as well as on a corporate level. This monitor-ing includes controller reports with follow-up on findings and recommendations as well as an annual statement of rep re sen tation from man-agement of the most significant brands and business units.
Information and communicationThe Board of Directors is overall responsible for the company having information and report-ing systems in place to ensure that its financial reporting is in conformity with rules and regula-tions. For this purpose, the company has set out detailed requirements in policies, manuals, and procedures and a global consolidation system with related reporting instructions has been implemented. Also, risk and control catalogues have been established and collated for all sig-nificant brands and business units as well as for corporate functions.
51 A.P. Moller - Maersk Annual Report 2020 Governance Corporate governanceDirectors’ Report

upwards in the organisation in accordance with relevant policies and instructions. Any weaknesses, omissions, and violations are reported to the Exec-utive Board. The Board of Directors and the Audit Committee receive reports from the Execu tive Board and from Group Internal Audit on the com-pliance with the guidelines, etc., as well as on the weaknesses, omissions, and violations of the poli-cies, procedures, and internal controls found.
The auditors elected by the Annual General Meeting account for any identified significant deficiencies in the internal control systems related to financial reporting in the Auditor’s Long-form Report to the Board of Directors. Identified deficiencies in inter-nal control systems are reported in management letters to the Executive Board.
Governance structureShareholders and the General MeetingsThe General Meeting is the supreme governing body of A.P. Møller - Mærsk A/S. The shareholders exercise their rights at the General Meeting, e.g. in relation to electing the Board of Directors mem-bers and the auditors of the company, approving the annual reports and dividends, deciding on the articles of association and on proposals submit-ted by shareholders or the Board of Directors. The company has two share classes: A shares carrying voting rights and B shares without voting rights. A and B shares carry equal economic rights and are traded publicly at Nasdaq Copenhagen.
Board of DirectorsA.P. Møller - Mærsk A/S has a two-tier manage-ment structure consisting of the Board of Direc-tors and the Executive Board as illustrated. There is no overlap between members of the Board of Directors and members of the Executive Board. By inviting business leaders, functional leaders, and
relevant experts to participate in parts of its meet-ings, the Board of Directors and its committees interact with representatives from various parts of the organisation as well as external specialists.
The Board of Directors lays down the general busi-ness and management principles and ensures the proper organisation and governance of the com-pany. Furthermore, the Board of Directors decides the strategy and the risk policies and supervises the execution of the strategy as well as the performance of the company and its management. The Board of Directors appoints members of the Executive Board.
The Board of Directors shall consist of four to 13 members elected by the General Meeting. The Board members are elected for a two-year term. There are Board members up for election every year to ensure continuity in the work of the Board of Directors. Board members are eligible for re-election.
At the Annual General Meeting on 23 March 2020, Niels B. Christiansen stepped down from the Board of Directors, and the Annual General Meeting elected Blythe S. J. Masters as a new member. The Board of Directors consists of 10 members, all elected by the General Meeting. Six of the members of the Board of Directors, includ-ing the Chairman, are independent. The Chairman of the Board of Directors and the chairmen of the committees, except the Nomination Committee, are independent.
Further information on the members of the Board of Directors, committees as well as the Board members’ participation in Board and committee meetings is available on the company webpage and below.
The Board of Directors plans seven to nine ordi-nary meetings per year.
The Board of Directors has established the following committees:
The ChairmanshipThe Chairmanship consists of the Chairman and the Vice Chairman, who are elected by and among the members of the Board of Directors. The Chairmanship performs certain preparation and planning in relation to Board meetings and is a forum for the Chairman’s and management’s reflections. The Chairmanship meets regularly and as required.
The Audit CommitteeThe Audit Committee consists of three to four Board members appointed by and among the Board members. The Committee reports to the Board of Directors. The tasks of the Audit Com-mittee include the review of accounting, auditing, risk and control matters, which are dealt with at meetings with the external auditors, the CFO, Head of Group Finance and the heads of the account-ing and internal audit functions. Furthermore, the Committee is tasked with reviewing material on related parties’ transactions. All members are independent. The Committee plans six to seven ordinary meetings per year.
The Nomination CommitteeThe Nomination Committee consists of three Board members, one of whom is the Chairman of the Board. The members are elected by and among the Board members, and the Board appoints the chairman of the Committee. The Nomination Com-mittee assists the Board by establishing an over-view of the competencies required and represented on the Board, and reviews the structure, size, com-position, succession planning, and diversity of the Board of Directors. The Committee also reviews the application of the independence criteria, initiates
MonitoringThe monitoring of risk management and control systems in connection with financial reporting takes the form of ongoing assessments and con-trol at different levels within the company.
Any weaknesses, control failures, and violations of the applicable policies, manuals, and procedures or other material deviations are communicated
Framework for corporate governance
Shareholders
Board of Directors
Executive Board
Organisation
Chairmanship
Audit Committee
Nomination Committee
Remuneration Committee
Transformation & Innovation
Committee
Group Internal Audit
52 A.P. Moller - Maersk Annual Report 2020 Governance Corporate governanceDirectors’ Report

recruitment, and evaluates candidates for election to the Board of Directors at the General Meeting. The Committee meets on a regular basis.
The Remuneration CommitteeThe Remuneration Committee consists of three Board members, one of whom is the Chairman of the Board. The Remuneration Committee makes propos-als to the Board of Directors for the remuneration of the Board of Directors and members of the Exec-utive Board. Furthermore, the Committee makes proposals to the Board, e.g. with regard to incen-tive schemes, reporting and disclosure of remunera-tion, and the remuneration policy. The Remuneration Committee ensures that the remuneration policy
Overview of committee members and attendance rate for 2020Board
of DirectorsChairmanship Audit
CommitteeNomination Committee
Remuneration Committee
Transformation & Innovation Committee
1 Considered independent cf. Recommendations for Corporate Governance.
2 Joined the Board or Committee in March 2020
3 Joined the Committee in March 2020
4 Stepped down in March 2020
Jim Hagemann Snabe1 8/8 (Chairman) 7/7 6/6 5/5 4/4
(Chairman) 4/4
Ane Mærsk Mc-Kinney Uggla 8/8 (Vice Chairman) 7/7 5/5
(Chairman)
Dorothee Blessing1 8/8
Bernard L. Bot1 8/82 6/6
Niels Bjørn Christiansen1 1/84 1/44 1/44
Marc Engel1 8/8 4/4
Arne Karlsson1 8/8 6/6 (Chairman) 3/43
Thomas Lindegaard Madsen 8/8
Blythe S. J. Masters1 6/72 3/42
Jacob Andersen Sterling 8/8
Robert Mærsk Uggla 8/8 5/5 4/4 4/4
Overall attendance rate 98.8% 100% 100% 100% 100% 100%
controls, procedures and systems to prevent and detect irregularities. The Head of Group Internal Audit reports to the Chairman of the Board of Directors and to the Audit Committee.
The Executive Board (registered management of the company)The Executive Board is appointed by the Board of Directors to carry out the day-to-day management of the company in accordance with the directions provided by the Board of Directors. The tasks include but are not limited to:• Develop the business and submit strategy pro-
posals to the Board of Directors for decision• Implement the strategy for the company and
execute on investments and divestments• Develop the organisational structure of the
company and allocate resources• Prepare internal and external financial reporting• Monitor and plan capital resources and liquidity• Establish and implement internal policies and
procedures for relevant topics such as account-ing, finance, IT, etc.
• Enterprise Risk Management.
As of 1 January 2020, the Executive Board of A.P. Møller - Mærsk A/S consisted of Søren Skou (CEO), Carolina Dybeck Happe (CFO), Vincent Clerc (CEO of Ocean & Logistics), Morten H. Engelstoft (CEO of APM Terminals) and Henriette Hallberg Thygesen (CEO Fleet & Strategic Brands). After having announced her resignation 25 November 2019, Carolina Dybeck Happe left the company at the end of February 2020. 1 May 2020 Patrick Jany was appointed new CFO and was appointed mem-ber of the Executive Board. Further information about the members of the Executive Board, including photos and occupations can be found on the company webpage.
and practices as well as incentive programmes support the strategy of A.P. Møller - Mærsk A/S and create value for the shareholders. The majority of the members are independent. The Committee plans four meetings per year.
The Transformation & Innovation CommitteeThe Transformation & Innovation Committee con-sists of three to four Board members appointed by and among the Board members. The Commit-tee is established with the purpose of support-ing the transformation of the company as well as the development of the company’s overall strate-gic direction and innovation agenda. The majority
of the members are independent. The Committee plans four meetings per year.
Rules of procedureThe Rules of procedure for the Audit Committee, Nomination Committee, Remuneration Committee and Transformation & Innovation Committee are available on the company webpage.
Group Internal AuditGroup Internal Audit was established in 1998 and provides assurance to the Board of Directors and the Audit Committee and acts independently of the Executive Board. Group Internal Audit’s main focus is to review the effectiveness of internal
53 A.P. Moller - Maersk Annual Report 2020 Governance Corporate governanceDirectors’ Report

Matters handled by the Board of Directors during 2020 (including but not limited to):
• Strategy and business plan review, target setting and budget approval
• Follow-up on M&A activities to ensure growth of Logistics & Services
• Review the implementation of a new safety framework within the organisation
• Monitor the company’s financial policy, credit rating, debt levels and capital structure, including decision on dividend policy and share buy-back programme
• Monitor the implementation of the Tech strategy and cyber security standards
• Monitor the transformation and reorganisation of the company to become the ‘Global integrator of container logistics’
• Conduct Board evaluation• Nominate Blythe S. J. Masters as Board member
for the election to the Board at the Annual General Meeting 2020
• Approval of the Annual Report 2019 and the 2020 Interim Reports as well as review of monthly and quarterly financial reporting and forecasting
• Approval of a Remuneration Policy for the Board of Directors and Executive Board.
Matters handled by the Board Committees in 2020 (including but not limited to):
The Chairmanship• Preparations and planning in relation
to Board meetings• Coordination and sparring with the
Executive Board.
The Audit Committee• Monitor the financial reporting process,
including accounting estimates and judge-ments, accounting policies and reporting process integrity
• Review annual and interim financial reports• Review of the company’s Directors and
Officers Insurance• Monitor the effectiveness of internal control
systems, fraud risks and fraud prevention• Discuss key audit matters, monitor the
services, audit plans, reports, independ-ence of external auditors, and recommend statutory auditor for election
• Monitor the Group Internal Audit function, its independence, scope and performance, resources and reporting, and the resolution of audit findings
• Oversee the company’s Enterprise Risk Management framework and processes as well as review key enterprise risks and related mitigation plans
• Meet with the Head of Group Internal Audit, CFO, Head of Group Finance, Head of External Accounting and Tax, other func-tion al leaders and external auditors.
The Nomination Committee• Review and assess the composition, succes-
sion planning, competencies, and diversity of the Board of Directors as a part of the Board evaluation
• Identify candidates (Blythe S. J. Masters) for membership of the Board of Directors
• Assess independence criteria of the Board members.
The Remuneration Committee• Review and define benchmarks for executive
remuneration• Review, monitor and propose to the Board
the scorecards and remuneration packages of the Executive Board for 2020 and 2021
• Review and propose a new Remuneration Policy
• Prepare the Remuneration Report• Propose fees for the members of the Board
of Directors.
The Transformation & Innovation Committee• Support the development of the trans-
formation and technology agenda by over-seeing progress and prioritisation of pro-jects and processes of strategic importance
• Act as a sparring partner for the Executive Board within innovation, consolidation and growth, including M&A projects
• Assist in setting the standard and ambition level for the IT strategy and cyber security as well as follow-up on progress.
54 A.P. Moller - Maersk Annual Report 2020 Governance Corporate governanceDirectors’ Report

Jim Hagemann Snabe
Bernard L. BotThomas Lindegaard Madsen Jacob Andersen SterlingMarc Engel
Ane Mærsk Mc-Kinney Uggla
Dorothee Blessing Arne Karlsson Blythe S. J. Masters
Robert Mærsk Uggla
Board of DirectorsThe Board of Directors moves onlineLike thousands of colleagues around the world, the Board of Directors adopted new habits and conducted virtual meetings throughout the year.
Captain on the ocean Thomas Lindegaard Madsen
Sweden Arne Karlsson
Denmark Jim Hagemann Snabe Ane Mærsk Mc-Kinney Uggla Robert Mærsk Uggla Jacob Andersen Sterling
England Dorothee Blessing
Bernard L. Bot Marc Engel
Florida, USA Blythe S. J. Masters
55 A.P. Moller - Maersk Annual Report 2020 Board of DirectorsGovernanceDirectors’ Report
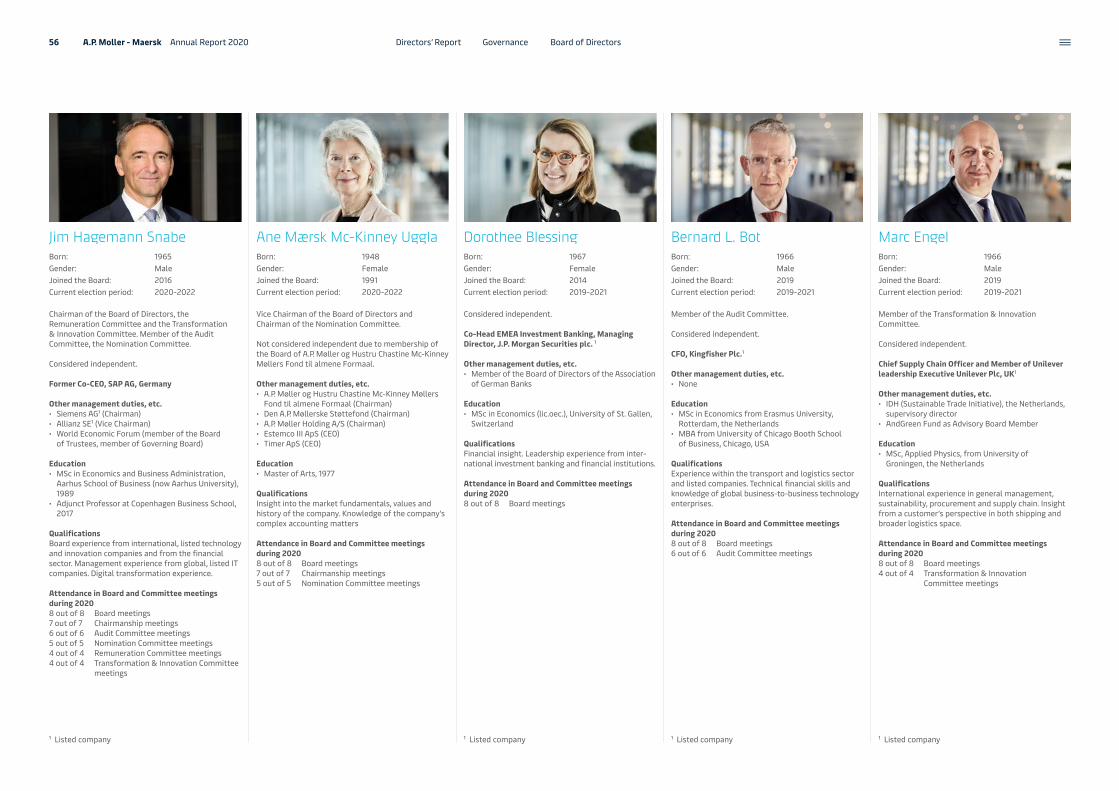
1 Listed company 1 Listed company1 Listed company 1 Listed company
Dorothee BlessingBorn: 1967Gender: FemaleJoined the Board: 2014Current election period: 2019-2021
Considered independent.
Co-Head EMEA Investment Banking, Managing Director, J.P. Morgan Securities plc. 1
Other management duties, etc.• Member of the Board of Directors of the Association
of German Banks
Education• MSc in Economics (lic.oec.), University of St. Gallen,
Switzerland
QualificationsFinancial insight. Leadership experience from inter-national investment banking and financial institutions.
Attendance in Board and Committee meetings during 20208 out of 8 Board meetings
Ane Mærsk Mc-Kinney UgglaBorn: 1948Gender: FemaleJoined the Board: 1991Current election period: 2020-2022
Vice Chairman of the Board of Directors and Chairman of the Nomination Committee.
Not considered independent due to membership of the Board of A.P. Møller og Hustru Chastine Mc-Kinney Møllers Fond til almene Formaal.
Other management duties, etc.• A.P. Møller og Hustru Chastine Mc-Kinney Møllers
Fond til almene Formaal (Chairman)• Den A.P. Møllerske Støttefond (Chairman)• A.P. Møller Holding A/S (Chairman)• Estemco III ApS (CEO)• Timer ApS (CEO)
Education• Master of Arts, 1977
Qualifications Insight into the market fundamentals, values and history of the company. Knowledge of the company’s complex accounting matters
Attendance in Board and Committee meetings during 20208 out of 8 Board meetings7 out of 7 Chairmanship meetings5 out of 5 Nomination Committee meetings
Bernard L. BotBorn: 1966Gender: MaleJoined the Board: 2019Current election period: 2019-2021
Member of the Audit Committee.
Considered independent.
CFO, Kingfisher Plc.1
Other management duties, etc.• None
Education• MSc in Economics from Erasmus University,
Rotterdam, the Netherlands• MBA from University of Chicago Booth School
of Business, Chicago, USA
QualificationsExperience within the transport and logistics sector and listed companies. Technical financial skills and knowledge of global business-to-business tech nology enterprises.
Attendance in Board and Committee meetings during 20208 out of 8 Board meetings6 out of 6 Audit Committee meetings
Marc EngelBorn: 1966Gender: MaleJoined the Board: 2019Current election period: 2019-2021
Member of the Transformation & Innovation Committee.
Considered independent.
Chief Supply Chain Officer and Member of Unilever leadership Executive Unilever Plc, UK1
Other management duties, etc.• IDH (Sustainable Trade Initiative), the Netherlands,
supervisory director• AndGreen Fund as Advisory Board Member
Education• MSc, Applied Physics, from University of
Groningen, the Netherlands
QualificationsInternational experience in general management, sustainability, procurement and supply chain. Insight from a customer’s perspective in both shipping and broader logistics space.
Attendance in Board and Committee meetings during 20208 out of 8 Board meetings4 out of 4 Transformation & Innovation
Committee meetings
Jim Hagemann SnabeBorn: 1965Gender: MaleJoined the Board: 2016Current election period: 2020-2022
Chairman of the Board of Directors, the Remuneration Committee and the Transformation & Innovation Committee. Member of the Audit Committee, the Nomination Committee.
Considered independent.
Former Co-CEO, SAP AG, Germany
Other management duties, etc.• Siemens AG1 (Chairman)• Allianz SE1 (Vice Chairman)• World Economic Forum (member of the Board
of Trustees, member of Governing Board)
Education• MSc in Economics and Business Administration,
Aarhus School of Business (now Aarhus University), 1989
• Adjunct Professor at Copenhagen Business School, 2017
QualificationsBoard experience from international, listed technology and innovation companies and from the financial sector. Management experience from global, listed IT companies. Digital transformation experience.
Attendance in Board and Committee meetings during 20208 out of 8 Board meetings7 out of 7 Chairmanship meetings6 out of 6 Audit Committee meetings5 out of 5 Nomination Committee meetings4 out of 4 Remuneration Committee meetings4 out of 4 Transformation & Innovation Committee
meetings
56 A.P. Moller - Maersk Annual Report 2020 Board of DirectorsGovernanceDirectors’ Report

1 Listed company
Arne KarlssonBorn: 1958Gender: MaleJoined the Board: 2010Current election period: 2019-2021
Chairman of the Audit Committee, member of the Remuneration Committee.
Considered independent.
Former CEO of Ratos AB
Other management duties, etc.• Ecolean (Chairman)• Einar Mattsson (Chairman)• FAPM Fastighets AB (Chairman)• KANA I Ramundberget AB (Chairman)• ROL AB (Chairman)• Rödingbäcken I Ramundberget AB (Chairman)• Swedish Corporate Governance Board (Chairman)• TAK Advisory Ltd (Chairman)• WCPF (World’s Children’s Prize Foundation)
(Chairman)• Swedish Securities Council (Board member)• Girovent Holding AB (Board member)• Advisory Board for The ESS (European Spallation
Source) (member)
Education• Bachelor in Business and Economics, Stockholm
School of Economics, 1982
QualificationsExperience as CEO and board member of private equity and industrial companies and with managing and developing a diverse portfolio of businesses operating in different markets.
Attendance in Board and Committee meetings during 20208 out of 8 Board meetings6 out of 6 Audit Committee meetings3 out of 41 Remuneration Committee meetings
Thomas Lindegaard MadsenBorn: 1972Gender: MaleJoined the Board: 2018Current election period: 2020-2022
Not considered independent due to employment in A.P. Moller - Maersk.
Captain, Maersk Line
Other management duties, etc.• None
Education• Graduated Master, Svendborg Navigations Skole,
1996
QualificationsCaptain in Maersk Line since 2011 and Chief Officer in Maersk Line from 2004-2011. Technical, maritime and operational knowledge relevant to the shipping activities in A.P. Moller - Maersk.
Attendance in Board and Committee meetings during 20208 out of 8 Board meetings
Jacob Andersen SterlingBorn: 1975Gender: MaleJoined the Board: 2018Current election period: 2020-2022
Not considered independent due to employment in A.P. Moller - Maersk.
Head of Technical Innovation, A.P. Møller - Mærsk A/S
Other management duties, etc.• Member of the Board of Directors, NEPCon• Member of the Board of Trustees, Sustainable
Shipping Initiative
Education• MSc in Biology, University of Copenhagen, 2002
QualificationsRelevant knowledge within product management, tech nical innovation and sustainability, through employment in Maersk Line since 2009.
Attendance in Board and Committee meetings during 20208 out of 8 Board meetings
Robert Mærsk UgglaBorn: 1978Gender: MaleJoined the Board: 2014Current election period: 2020-2022
Member of the Nomination Committee, the Remuneration Committee and the Trans formation & Innovation Committee.
Not considered independent due to the position as CEO of A.P. Møller Holding A/S.
CEO, A.P. Møller Holding A/S
Other management duties, etc.• The Drilling Company of 1972, A/S1 (Vice Chairman)• A.P. Møller Capital P/S (Chairman)• Maersk Tankers A/S (Chairman)• Maersk Product Tankers A/S (Chairman)• ZeroNorth A/S (director)• Agata ApS (CEO)• Estemco XII ApS (CEO)• IMD (director of the foundation board)• International Business Leaders’ Advisory Council
(member)• Board positions in a number of controlled
subsidiaries of A.P. Møller Holding A/S
Education• MSc in Business Administration (2003), Stockholm
School of Economics, including studies at Università Commerciale Luigi Bocconi
• Executive education at The Wharton School of the University of Pennsylvania, Stanford Business School and Harvard Business School, and IMD
QualificationsLeadership experience within investments, incubation, transportation & infrastructure activities.
Attendance in Board and Committee meetings during 20208 out of 8 Board meetings5 out of 5 Nomination Committee meetings4 out of 4 Remuneration Committee meetings4 out of 4 Transformation & Innovation
Committee meetings
1 Listed company 2 In 2020 the Board held eight meetings; one before
Blythe S. J. Masters joined.3 One Transformation & Innovation Committee meeting
was held prior to joining.
Blythe S. J. MastersBorn: 1969Gender: FemaleJoined the Board: 2020Current election period: 2020-2022
Member of the Transformation & Innovation Committee
Considered independent
Industry Partner at the private equity firm Motive Partners and CEO of the special purpose acquisition corporation, Motive Capital Corp, sponsored by Motive’s funds
Other management duties, etc.• Member of the International Advisory Board of
Santander Group• Board Member of Santander Open Digital Services• Board Member and Audit Committee Chair of GCM
Grosvenor 1• Board Chair and Audit Committee Chair of Phunware
Inc. 1 (Nasdaq: PHUN)• Advisory Board Member of Figure Technologies, Inc.• Advisory Board Member of Maxex, LLC
Education• Bachelor of Arts: Economics, Trinity College,
Cambridge
QualificationsExperienced financial services and technology executive with extensive knowledge in start-ups and blockchain and extensive corporate governance and advisory experience.
Attendance in Board and Committee meetings during 20206 out of 82 Board meetings3 out of 43 Transformation & Innovation
Committee meetings
1 In 2020, the Remuneration Committee held four meetings; one before Arne Karlsson joined.
57 A.P. Moller - Maersk Annual Report 2020 Board of DirectorsGovernanceDirectors’ Report
Executive Board
Søren SkouChief Executive Officer (CEO) of A.P. Møller - Mærsk A/S Born: 1964Gender: MaleJoined the Executive Board: 2007
Søren Skou has been CEO of A.P. Møller - Mærsk A/S since June 2016.
Søren Skou joined A.P. Moller - Maersk in 1983. Over the next 15 years, he held various positions in A.P. Moller - Maersk with roles in Copenhagen, New York and Beijing. In 1998 he joined Maersk Tankers, where he was CEO from 2001 to 2011.
Other management duties, etc.• Mærsk Mc-Kinney Møller Center for Zero Carbon
Shipping (Chairman)• MITHEL Invest ApS• International Council of Containership Operators
(ICCO)• European Round Table of Industry (member)• Nokia Corporation (Board member)
Education• MBA (honours), IMD, Switzerland• Business Administration, Copenhagen Business
School• Maersk International Shipping Education
Patrick JanyChief Financial Officer (CFO) of A.P. Møller - Mærsk A/SBorn: 1968Gender: MaleJoined the Executive Board: 2020
Patrick Jany has been CFO of A.P. Møller - Mærsk A/S since May 2020.
Before joining A.P. Moller - Maersk, Patrick was CFO and member of the Executive Committee in Clariant AG, Switzerland. Prior to his role as CFO, Patrick Jany held several leadership positions within finance, general manage ment and corporate development in Clariant in Germany, Mexico, Singapore, Indonesia and Spain.
Other management duties, etc.• Comet AG, Switzerland (Board member)
Education• Master in Business Administration, Finance, ESCP
(Ecole Supérieure de Commerce de Paris)
Vincent ClercChief Executive Officer (CEO), Ocean & Logistics Born: 1972Gender: MaleJoined the Executive Board: 2017
Vincent Clerc has been with A.P. Møller - Mærsk A/S since 1997. Vincent Clerc has held various roles in North America and Copenhagen. In December 2015, Vincent Clerc was appointed Chief Commercial Officer in Maersk Line.
Other management duties, etc.• None
Education• Bachelor in Political Science, Lausanne, Switzerland• MBA from Columbia Business School, New York, and
London Business School
Morten H. EngelstoftChief Executive Officer (CEO), APM TerminalsBorn: 1967Gender: MaleJoined the Executive Board: 2017
Morten H. Engelstoft has been with A.P. Møller - Mærsk A/S since 1986. Morten H. Engelstoft has had a long tenure with A.P. Moller - Maersk and other brands, including postings in the the US, Vietnam, Taiwan, Singapore and Italy.
Morten H. Engelstoft has been CEO of APM Terminals since 2016.
Other management duties, etc.• TT Club Mutual Insurance Ltd. (Board member)
Education• Executive MBA, IMD, Lausanne, Switzerland• Maersk International Shipping Education
Henriette Hallberg ThygesenChief Executive Officer (CEO), Fleet & Strategic BrandsBorn: 1971Gender: FemaleJoined the Executive Board: 2020
Henriette Hallberg Thygesen has been with A.P. Møller - Mærsk A/S since 1994.
Henriette Hallberg Thygesen has held various positions in Spain, China, Hong Kong, the USA and Copenhagen for Maersk Tankers, Maersk Oil, Maersk Logistics/Damco and as CEO of Svitzer A/S.
Other management duties, etc.• Cowi Holding A/S (Board member)
Education• Maersk International Shipping Education
(M.I.S.E.)• Master of Science (cand.merc.mat.) from
Copenhagen Business School• PhD in Applied Mathematics from Copenhagen
Business School• Executive MBA (honours) from Columbia University,
New York, and London Business School
58 A.P. Moller - Maersk Annual Report 2020 Executive BoardGovernanceDirectors’ Report

Remuneration
2016–2020 RemunerationRemuneration awarded (USD million) 2020 2019 2018 2017 2016
Board of Directors
Fixed annual fee 3 3 3 3 3
Total 3 3 3 3 3
Executive Board
Fixed base salary 8 10 10 8 13
Short-term cash incentive 6 5 5 2 2
Long-term share-based incentives 2 1 1 1 -2
Remuneration in connection with redundancy, resignations and release from duty to work - 6 4 - 22
Lump sum retirement payment - - - - -1
Total 16 22 20 11 34
2020 has been a strong year for A.P. Moller - Maersk despite the ongoing impacts of the COVID-19 pandemic. The remuneration of the Executive Board members for the financial year 2020 reflects a solid year with strong financial results and a satisfying progress towards the strategic transformation, whilst the remuneration to the members of the Board of Directors remains unchanged from the previous year.
The following sections set out key elements of the Remuneration Policy (‘Policy’), and the total remuneration awarded to the members of Board of Directors and the Executive Board for 2020.
Remuneration policy at a glanceThe Policy supports the business needs by enabling an appropriate total remuneration package that has a clear link to business strategy and aligns with share-holder interests.
The objectives of the Policy are to:• Ensure appropriate total remuneration: The remu-
neration design and decisions are guided by market practice in Europe, reflected in the remuneration components offered and the total remuneration value provided.
• Link to business strategy: The Policy supports the business plan and the need for executive leaders to focus on delivering an on-going progress to achieve the company’s strategic goals, reflected in a combi-nation of short and long-term incentive components.
• Align with shareholder interest: The Policy is designed to support the delivery of strong financial and oper-ational results over time, which ultimately grow shareholder value.
Board of Directors members serving on the Board committees or performing ad hoc work beyond the normal responsibilities receive an additional fee. This does not apply to the Chairman where the fixed annual fee is all inclusive.
Executive Board The remuneration of the Executive Board mem-bers consists of a fixed base salary, which is inclu-sive of company pension contribution and car, short-term incentive as well as the long-term incentive components.
The remuneration structure is intended to drive a ‘reward for performance’ culture by aligning indi-vidual reward to company performance and share-holder value creation. The individual remuneration level is set and reviewed based on peer companies of similar size and complexity to ensure they remain comparable and fit for the business.
Total remuneration 2020The table shows the total remuneration awarded to members of the Board of Directors and the Executive Board in aggregate from 2016 to 2020, as set out in note 2 of the consolidated financial statements.
Further information regarding the share-based payments is detailed in note 11 of the consolidated financial statements as calculated under IFRS2. This is different in both reporting and methodol-ogy in the company’s Remuneration Report 2020 which is available at the company’s website on: https://investor.maersk.com/remuneration.
The current Policy applies to members of the Executive Board and the Board of Directors and was adopted at the company’s Annual General Meeting in 2020.
Board of Directors The members of the Board of Directors receive a fixed annual fee which is differentiated based on the role:• The Chairman receives a fixed amount inclusive of
committee work and all other additional duties• Ordinary Board members receive a fixed amount
and the Vice Chairman receives fixed multiples thereof.
59 A.P. Moller - Maersk Annual Report 2020 RemunerationGovernanceDirectors’ Report

Shareholder information
Share price developmentThe Maersk B share price increased by 41% to DKK 13,595 from its closing price at the end of 2019 of DKK 9,608. By comparison, the benchmark indices MSCI World Transportation and OMXC25 increased by 5% and 34%, respectively. The Maersk B share price reached its highest price of DKK 14,115 on 18 December 2020, and its lowest price of DKK 5,034 on 19 March 2020. The total market value of A.P. Møller - Mærsk A/S was USD 43bn at the end of 2020. The positive development of the share price was driven by a very strong financial perfor-mance in the second half of the year, as demand picked up faster than anticipated after the first lockdown related to the pandemic outbreak in the early days of 2020. The sudden uptick in demand led to a significant increase in freight rates during the third quarter. The continued focus on the cost base and agile capacity deployment, coupled with the higher freight rates lead to improved finan-cial performance and a total of three earnings upgrades after having suspended the guidance in March 2020.
Share capitalA.P. Moller - Maersk shares are listed on Nasdaq Copenhagen and are divided into two classes: A shares with voting rights and B shares without voting rights. Each DKK 1,000 A share entitles the holder to two votes.
The A.P. Møller - Mærsk A/S share capital amounts to nominally DKK 20,031,947,000, divided between 10,599,401 A shares of nominally DKK 1,000 and 9,432,546 B shares of nominally DKK 1,000.
OwnershipThe total number of registered shareholders increased by 3,000 to around 76,000 during 2020. Shareholders with more than 5% of share capital or votes held 53% of the share capital, while the 20 largest institutional shareholders together owned around 16% of the total share capital and 37% adjusted for the free-float. Danish retail investors decreased their ownership slightly from 11% to 10% of the total share capital since the end of 2019.
After an extraordinary year with great volatility in the share price, the share price ended the year 41% higher than last year, implying a total shareholder return of 45% for 2020. The Board of Directors in A.P. Møller - Mærsk A/S proposes an ordinary dividend of DKK 330 per share corresponding to a dividend payout of 35%.
Share price developmentDKK OMXC25
Maersk B MSCI World
Transportation
Source: Bloomberg; data rebased from the Maersk B share price at the end of December 2019.
MSCI
OMX
Maersk B
4,000
6,000
8,000
10,000
16,000
12,000
14,000
Jan Feb Mar Apr May Jun Jul Aug Sep Oct Nov Dec
Own sharesA.P. Moller - Maersk holding of own shares com-prised 3.12% of the share capital at the end of 2020, cf. note 11 in the consolidated financial statements.
Dividend The dividend policy is an annual pay-out ratio of 30-50% of underlying net result, adjusted for gains, impairments and restructurings, to be implemented from the financial year 2020.
In the medium-term and during the strategic phase of transforming the company to become a global integrator of container logistics, the annual pay-out ratio should be expected at the low to midpoint of the range.
Distribution to shareholders will take place through dividends potentially combined with share buy-backs, and the annual pay-out ratio and distribution will be decided from an evaluation
60 A.P. Moller - Maersk Annual Report 2020 Shareholder informationGovernanceDirectors’ Report
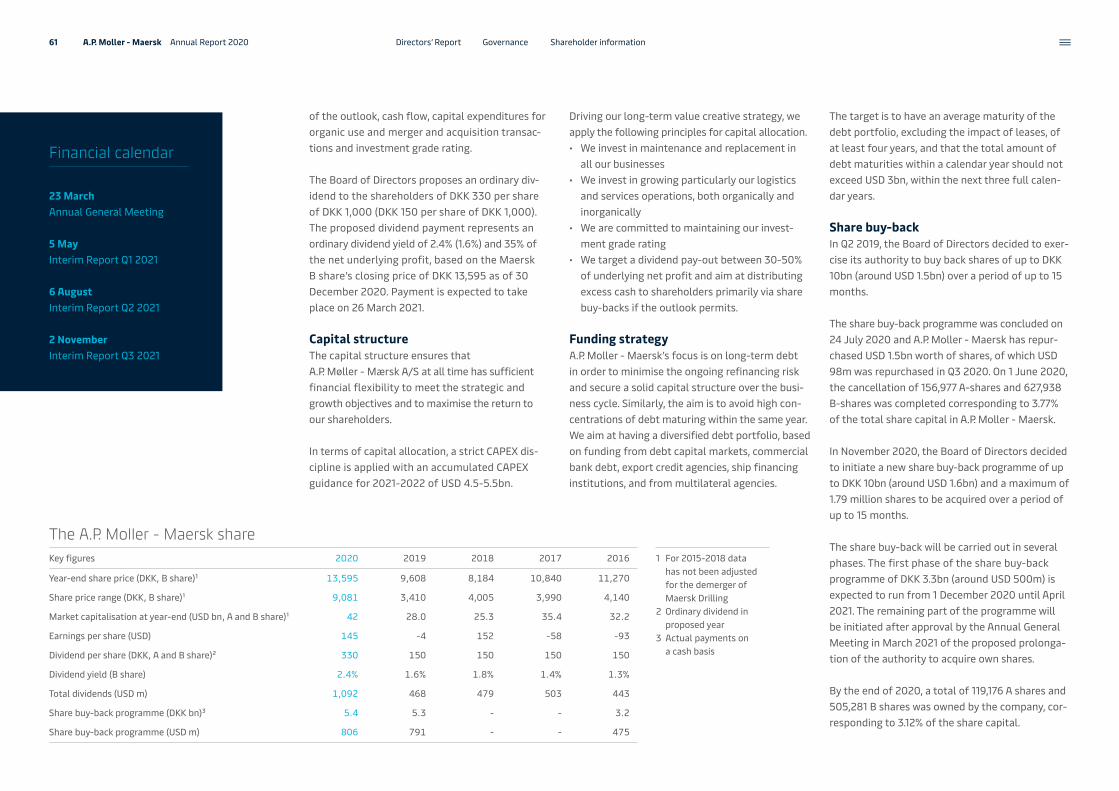
of the outlook, cash flow, capital expenditures for organic use and merger and acquisition transac-tions and investment grade rating.
The Board of Directors proposes an ordinary div-idend to the shareholders of DKK 330 per share of DKK 1,000 (DKK 150 per share of DKK 1,000). The proposed dividend payment represents an ordinary dividend yield of 2.4% (1.6%) and 35% of the net underlying profit, based on the Maersk B share’s closing price of DKK 13,595 as of 30 December 2020. Payment is expected to take place on 26 March 2021.
Capital structureThe capital structure ensures that A.P. Møller - Mærsk A/S at all time has sufficient financial flexibility to meet the strategic and growth objectives and to maximise the return to our shareholders.
In terms of capital allocation, a strict CAPEX dis-cipline is applied with an accumulated CAPEX guidance for 2021-2022 of USD 4.5-5.5bn.
The target is to have an average maturity of the debt portfolio, excluding the impact of leases, of at least four years, and that the total amount of debt maturities within a calendar year should not exceed USD 3bn, within the next three full calen-dar years.
Share buy-backIn Q2 2019, the Board of Directors decided to exer-cise its authority to buy back shares of up to DKK 10bn (around USD 1.5bn) over a period of up to 15 months.
The share buy-back programme was concluded on 24 July 2020 and A.P. Moller - Maersk has repur-chased USD 1.5bn worth of shares, of which USD 98m was repurchased in Q3 2020. On 1 June 2020, the cancellation of 156,977 A-shares and 627,938 B-shares was completed corresponding to 3.77% of the total share capital in A.P. Moller - Maersk.
In November 2020, the Board of Directors decided to initiate a new share buy-back programme of up to DKK 10bn (around USD 1.6bn) and a maximum of 1.79 million shares to be acquired over a period of up to 15 months.
The share buy-back will be carried out in several phases. The first phase of the share buy-back programme of DKK 3.3bn (around USD 500m) is expected to run from 1 December 2020 until April 2021. The remaining part of the programme will be initiated after approval by the Annual General Meeting in March 2021 of the proposed prolonga-tion of the authority to acquire own shares.
By the end of 2020, a total of 119,176 A shares and 505,281 B shares was owned by the company, cor-responding to 3.12% of the share capital.
The A.P. Moller - Maersk shareKey figures 2020 2019 2018 2017 2016 1 For 2015-2018 data
has not been adjusted for the demerger of Maersk Drilling
2 Ordinary dividend in proposed year
3 Actual payments on a cash basis
Year-end share price (DKK, B share) 1 13,595 9,608 8,184 10,840 11,270
Share price range (DKK, B share) 1 9,081 3,410 4,005 3,990 4,140
Market capitalisation at year-end (USD bn, A and B share) 1 42 28.0 25.3 35.4 32.2
Earnings per share (USD) 145 -4 152 -58 -93
Dividend per share (DKK, A and B share) 2 330 150 150 150 150
Dividend yield (B share) 2.4% 1.6% 1.8% 1.4% 1.3%
Total dividends (USD m) 1,092 468 479 503 443
Share buy-back programme (DKK bn) 3 5.4 5.3 - - 3.2
Share buy-back programme (USD m) 806 791 - - 475
Driving our long-term value creative strategy, we apply the following principles for capital allocation. • We invest in maintenance and replacement in
all our businesses• We invest in growing particularly our logistics
and services operations, both organically and inorganically
• We are committed to maintaining our invest-ment grade rating
• We target a dividend pay-out between 30-50% of underlying net profit and aim at distributing excess cash to shareholders primarily via share buy-backs if the outlook permits.
Funding strategyA.P. Moller - Maersk’s focus is on long-term debt in order to minimise the ongoing refinancing risk and secure a solid capital structure over the busi-ness cycle. Similarly, the aim is to avoid high con-centrations of debt maturing within the same year. We aim at having a diversified debt portfolio, based on funding from debt capital markets, commercial bank debt, export credit agencies, ship financing institutions, and from multilateral agencies.
Financial calendar
23 MarchAnnual General Meeting
5 MayInterim Report Q1 2021
6 AugustInterim Report Q2 2021
2 NovemberInterim Report Q3 2021
61 A.P. Moller - Maersk Annual Report 2020 Shareholder informationGovernanceDirectors’ Report

Shareholders with more than 5% of share capital or votesShareholders according to section 55 of the Danish Companies Act are Share capital Votes
A.P. Møller Holding A/S, Copenhagen, Denmark 40.29% 50.88%
A.P. Møller og Hustru Chastine Mc-Kinney Møllers Familiefond, Copenhagen, Denmark 9.18% 13.31%
Den A.P. Møllerske Støttefond, Copenhagen, Denmark 3.23% 6.07%
The decision to initiate a new share buy-back pro-gramme is supported by the strong earnings and free cash flow generation seen in 2020, which has led to further deleveraging of the company and improved credit metrics in line with invest-ment grade rating.
The new programme is in alignment with previously announced intention to distribute a material part of the value of shares received in Total S.A. (value USD 4.5bn) as part of the sale of Maersk Oil, sub-ject to maintaining investment grade rating. With the announced new share buy-back programme the total distribution from the sale of the shares in Total S.A. will be around USD 3.4bn or around 75% of the initial value of the shares received.
The share buy-back is carried out with the purpose to adjust the capital structure of A.P. Moller - Maersk. Shares which are not used for hedging purposes for the long-term incen tive programmes will be proposed cancelled at the Annual General Meetings in 2021 and 2022.
No shares may be bought back at a price exceed-ing the higher of i) share price of latest independ-ent trade, and ii) the highest current independent bid at Nasdaq Copenhagen at the time of trading.
The maximum number of A and B shares that may be purchased on each trading day may not exceed 25% of the average daily trading volume of A and B shares, respectively, on Nasdaq Copenhagen or other regulated markets, on which the purchase is carried out over the last 20 trading days prior to the date of purchase.
A and B shares will be acquired in a 20/80 split reflecting the current trading volumes of the two share classes.
Investor RelationsTo keep investors and analysts updated on the company’s strategic development, market outlook and financial performance, A.P. Moller - Maersk arranges road-shows and participates in investor and industry conferences. Investor Relations, besides meeting domestic investors, also travels extensively to ensure that international investors are kept updated on the latest developments. In the vast majority of 2020, these meetings have been online due to restrictions following the pandemic. In 2020, the Executive Board and the Investor Relations team had more than 500 meetings with the participation of more than 1,200 investors and analysts across Europe, Asia and North America.
A.P. Moller - Maersk is covered by around 30 sell-side analysts, predominantly from international investment banks, who regularly publish research reports and sector reports. A list of the analysts and other relevant information, including finan-cial reports, investor presentations, share and bond information, is available at http://investor.maersk.com.
The company will fulfil its reporting obligations by announcing no later than every 7th trading day the purchases made under the share buy-back programme.
A.P. Møller Holding A/S has committed to partici-pating in the share buy-back programme by selling shares relative to its voting rights and relative to its total ownership in the company. A.P. Møller Holding A/S intends to maintain its ownership of 51.45% of A shares and 41.51% of the total share capital in the company.
The company is entitled to suspend or stop the programme at any time subject to an announce-ment to Nasdaq Copenhagen.
Annual General MeetingThe Annual General Meeting will be held on 23 March 2021 in Copenhagen, Denmark.
In our transformation to become the global integrator of container logistics, we continue to innovate and grow shareholder value.
FROM OUR BUSINESS MODEL
62 A.P. Moller - Maersk Annual Report 2020 Shareholder informationGovernanceDirectors’ Report

Financials
Consolidated financial statements 2020
Parent company financial statements 2020
Statement of the Board of Directors and the Executive Board
Independent Auditor’s Reports
63 A.P. Moller - Maersk Annual Report 2020

Consolidated financial statements 2020
Consolidated income statement
Consolidated statement of comprehensive income
Consolidated balance sheet at 31 December
Consolidated cash flow statement
Consolidated statement of changes in equity
Notes to the consolidated financial statements
A.P. Moller - Maersk(In parenthesis, the corresponding figures for 2019)
64 A.P. Moller - Maersk Annual Report 2020 Financials Consolidated financial statements

Consolidated income statementNote 2020 2019
1 Revenue 39,740 38,8902 Operating costs 31,804 33,13016 Other income 290 12
Other costs - 601 Profit before depreciation, amortisation and impairment losses, etc. (EBITDA) 8,226 5,7126,7,8,10 Depreciation, amortisation and impairment losses, net 4,541 4,2873 Gain on sale of non-current assets, etc., net 202 71
Share of profit/loss in joint ventures 122 93Share of profit/loss in associated companies 177 136Profit/loss before financial items (EBIT) 4,186 1,725
4 Financial income 895 5114 Financial expenses 1,774 1,269
Profit/loss before tax 3,307 9675 Tax 407 458
Profit/loss for the year– continuing operations 2,900 50910 Profit/loss for the year– discontinued operations - -553
Profit/loss for the year 2,900 -44
Of which:Non-controlling interests 50 40A.P. Møller - Mærsk A/S’ share 2,850 -84
11 Earnings per share – continuing operations, USD 145 2311 Diluted earnings per share – continuing operations, USD 145 23
11 Earnings per share, USD 145 -411 Diluted earnings per share, USD 145 -4
Maersk Drilling was classified as discontinued operations in 2019, and the business is presented separately on an aggregated level in the income statement, balance sheet and cash flow statement.
Consolidated statement of comprehensive incomeNote 2020 2019
Profit/loss for the year 2,900 -44
Translation from functional currency to presentation currency: Translation impact arising during the year 195 -81 Reclassified to income statement, gain on sale of non-current assets, etc., net 64 6
16 Cash flow hedges: Value adjustment of hedges for the year 30 -141 Reclassified to income statement – revenue -5 5 – operating costs -16 78 – financial expenses 49 32 – discontinued operations - 1Reclassified to non-current assets -15 2
5 Tax on other comprehensive income 10 16
Share of other comprehensive income of joint ventures and associated companies, net of tax 5 -1Total items that have been or may be reclassified subsequently to the income statement 317 -83
17 Other equity investments (FVOCI), fair value adjustments for the year 2 16514 Actuarial gains/losses on defined benefit plans, etc. -207 915 Tax on other comprehensive income -4 10
Total items that will not be reclassified to the income statement -209 266
Other comprehensive income, net of tax 108 183
Total comprehensive income for the year 3,008 139
Of which:Non-controlling interests 47 29A.P. Møller - Mærsk A/S’ share 2,961 110
65 A.P. Moller - Maersk Annual Report 2020 Consolidated financial statements Notes index Amounts in USD million Financials

Note Equity and liabilities
2020 2019
11 Share capital 3,632 3,774Reserves 26,218 24,324Equity attributable to A.P. Møller - Mærsk A/S 29,850 28,098Non-controlling interests 1,004 739Total equity 30,854 28,837
13 Lease liabilities, non-current 7,356 7,29513 Borrowings, non-current 5,868 7,455
14 Pensions and similar obligations 297 27215 Provisions 556 63616 Derivatives 289 3289 Deferred tax 525 362
Tax payables 237 335Other payables 81 44Other non-current liabilities 1,985 1,977Total non-current liabilities 15,209 16,727
13 Lease liabilities, current 1,391 1,28213 Borrowings, current 758 721
15 Provisions 725 458Trade payables 5,156 5,567Tax payables 305 307
16 Derivatives 228 87Other payables 1,279 1,170Deferred income 121 168Other current liabilities 7,814 7,757
10 Liabilities associated with assets held for sale or distribution 91 75Total current liabilities 10,054 9,835Total liabilities 25,263 26,562Total equity and liabilities 56,117 55,399
Consolidated balance sheet at 31 DecemberNote Assets
2020 2019
6 Intangible assets 5,145 4,2197 Property, plant and equipment 26,481 27,5168 Right-of-use-assets 8,323 8,460
Investments in joint ventures 1,260 1,204Investments in associated companies 951 937
17 Other equity investments 107 7816 Derivatives 269 16114 Pensions, net assets 225 409
Loan receivables 136 160Other receivables 235 318Financial non-current assets, etc. 3,183 3,267
9 Deferred tax 249 237Total non-current assets 43,381 43,699
Inventories 1,049 1,430
16 Trade receivables 3,634 3,531Tax receivables 238 161
16 Derivatives 307 43Loan receivables 91 239Other receivables 869 857Prepayments 464 520Receivables, etc. 5,603 5,351
Equity investments, etc. 1 2Cash and bank balances 5,865 4,768
10 Assets held for sale or distribution 218 149Total current assets 12,736 11,700Total assets 56,117 55,399
66 A.P. Moller - Maersk Annual Report 2020 Consolidated financial statements Notes index Amounts in USD million Financials

Consolidated cash flow statementNote 2020 2019
Profit/loss before financial items 4,186 1,7256,7,8,10 Depreciation, amortisation and impairment losses, net 4,541 4,2873 Gain on sale of non-current assets, etc., net -202 -71
Share of profit/loss in joint ventures -122 -93Share of profit/loss in associated companies -177 -136
20 Change in working capital -239 476Change in provisions and pension obligations, etc. 158 70
20 Other non-cash items 107 162Cash flow from operating activities before tax 8,252 6,420Taxes paid -424 -501Cash flow from operating activities 7,828 5,919
20 Purchase of intangible assets and property, plant and equipment -1,322 -2,035Sale of intangible assets and property, plant and equipment 435 186
21 Acquisition of subsidiaries and activities -425 -4421 Sale of subsidiaries and activities 36 -40
Sale of associated companies -12 46Dividends received 177 297Sale of other equity investments 5 2,617Other financial investments, net 81 -152Purchase/sale of securities, trading portfolio 1 -1Cash flow used for investing activities -1,024 874Repayment of borrowings -3,163 -2,533
13 Repayments of lease liabilities -1,710 -1,291Proceeds from borrowings 1,303 1,077Financial income received 92 91Financial expenses paid -384 -350
4 Financial expenses paid on lease liabilities -468 -477Purchase of own shares -806 -791Sale of own shares 30 - Dividends distributed -430 -469Dividends distributed to non-controlling interests -92 -70Sale of non-controlling interests - - Acquisition of non-controlling interest -14 -1Other equity transactions 24 14Cash flow from financing activities -5,618 -4,800Net cash flow from continuing operations 1,186 1,993
10 Net cash flow from discontinued operations - -372Net cash flow for the period 1,186 1,621Cash and cash equivalents 1 January 4,758 3,149Currency translation effect on cash and cash equivalents -80 -12Cash and cash equivalents 31 December 5,864 4,758Of which classified as assets held for sale -19 - Cash and cash equivalents 31 December 5,845 4,758
Cash and cash equivalentsCash and bank balances 5,865 4,768Overdrafts 20 10Cash and cash equivalents 31 December 5,845 4,758
Cash and bank balances include USD 1.0bn (USD 0.9bn) relating to cash and bank balances in countries with exchange control or other restrictions. These funds are not readily available for general use by the parent com-pany or other subsidiaries.
67 A.P. Moller - Maersk Annual Report 2020 Consolidated financial statements Notes index Amounts in USD million Financials

Consolidated statement of changes in equityA.P. Møller - Mærsk A/S
Note Share capital Translation reserve
Reserve for other equity investments
Reserve for hedges
Retained earnings
Total Non- controlling
interests
Total equity
Equity 1 January 2019 3,774 -616 -202 -103 29,756 32,609 771 33,380
Other comprehensive income, net of tax - -76 180 6 84 194 -11 183Profit/loss for the period - - - - -84 -84 40 -44Total comprehensive income for the period - -76 180 6 - 110 29 139
Dividends to shareholders - - - - -469 -469 -73 -54212 Value of share-based payment - - - - 10 10 - 10
Purchase of own shares - - - - -791 -791 - -79111 Capital increases and decreases - - - - - - 12 1217 Transfer of gain/loss on disposal of equity
investments to retained earnings - - 18 - -18 - - - Distribution of shares in The Drilling Company of 1972 A/S to shareholders in A.P. Møller - Mærsk A/S - - - - -3,371 -3,371 - -3,371Total transactions with shareholders - - 18 - -4,639 -4,621 -61 -4,682
Equity 31 December 2019 3,774 -692 -4 -97 25,117 28,098 739 28,837
2020Other comprehensive income, net of tax - 260 1 55 -205 111 -3 108Profit/loss for the period - - - - 2,850 2,850 50 2,900Total comprehensive income for the period - 260 1 55 2,645 2,961 47 3,008
Dividends to shareholders - - - - -430 -430 -90 -52012 Value of share-based payment - - - - 11 11 - 11
Addition of non-controlling interests - - - - -14 -14 302 288Purchase of own shares - - - - -806 -806 - -806Sale of own shares - - - - 30 30 - 30
11 Capital increases and decreases -142 - - - 142 - 6 617 Transfer of gain/loss on disposal of equity
investments to retained earnings - - -3 - 3 - - - Total transactions with shareholders -142 - -3 - -1,064 -1,209 218 -991
Equity 31 December 2020 3,632 -432 -6 -42 26,698 29,850 1,004 30,854
68 A.P. Moller - Maersk Annual Report 2020 Consolidated financial statements Notes index Amounts in USD million Financials

Notes Note 170 Segment information
Note 273 Operating costs
Note 374 Gain on sale of non-current assets,
etc., net
Note 474 Financial income and expenses
Note 575 Tax
Note 676 Intangible assets
Note 778 Property, plant and equipment
Note 880 Right-of-use assets
Note 981 Deferred tax
Note 1082 Discontinued operations and assets
held for sale or distribution
Note 1184 Share capital and earnings per share
Note 1285 Share-based payment
Note 1387 Borrowings and lease liability
reconciliation
Note 1489 Pensions and similar obligations
Note 1592 Provisions
Note 1693 Financial instruments and risks
Note 1799 Financial instruments by category
Note 18101 Commitments – continuing operations
Note 19102 Contingent liabilities
Note 20103 Cash flow specifications
Note 21103 Acquisition/sale of subsidiaries
and activities
Note 22105 Related parties
Note 23106 Significant accounting policies
Note 24110 Significant accounting estimates
and judgements
69 A.P. Moller - Maersk Annual Report 2020 Consolidated financial statementsFinancials
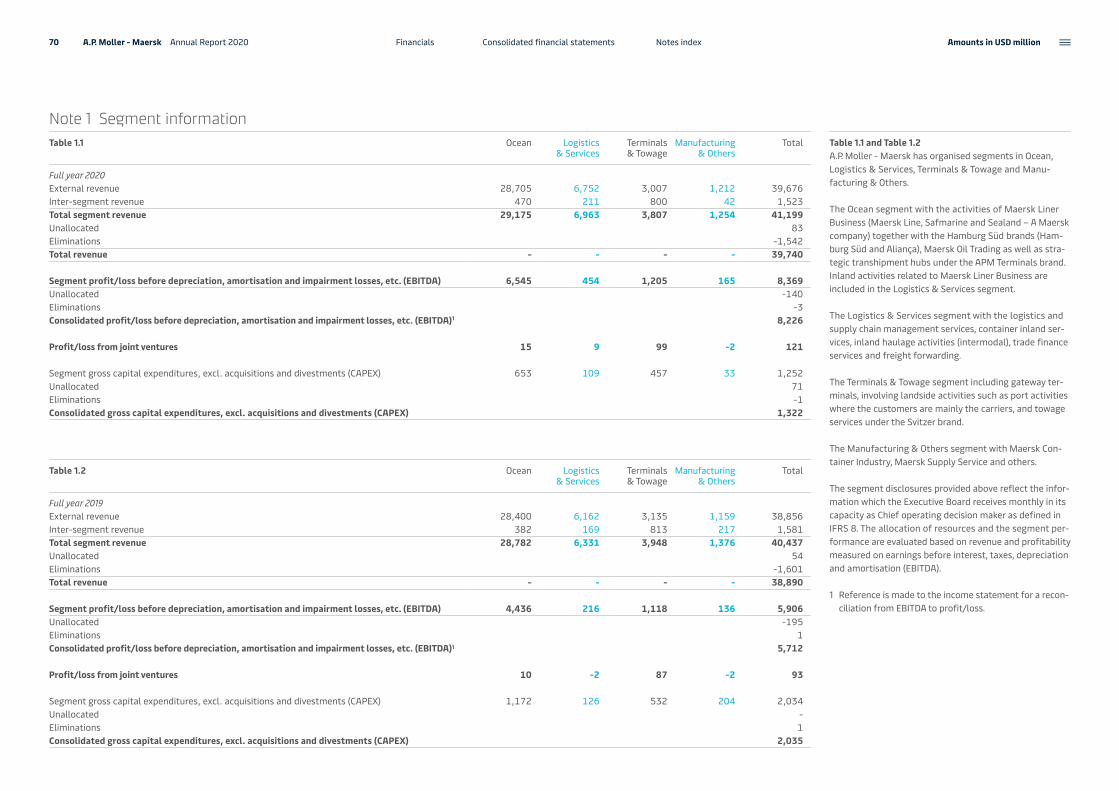
Note 1 Segment informationTable 1.1 Ocean Logistics
& ServicesTerminals & Towage
Manu facturing & Others
Total
Full year 2020External revenue 28,705 6,752 3,007 1,212 39,676Inter-segment revenue 470 211 800 42 1,523Total segment revenue 29,175 6,963 3,807 1,254 41,199Unallocated 83Eliminations -1,542Total revenue - - - - 39,740
Segment profit/loss before depreciation, amortisation and impairment losses, etc. (EBITDA) 6,545 454 1,205 165 8,369Unallocated -140Eliminations -3Consolidated profit/loss before depreciation, amortisation and impairment losses, etc. (EBITDA)¹ 8,226
Profit/loss from joint ventures 15 9 99 -2 121
Segment gross capital expenditures, excl. acquisitions and divestments (CAPEX) 653 109 457 33 1,252Unallocated 71Eliminations -1Consolidated gross capital expenditures, excl. acquisitions and divestments (CAPEX) 1,322
Table 1.2 Ocean Logistics & Services
Terminals & Towage
Manu facturing & Others
Total
Full year 2019External revenue 28,400 6,162 3,135 1,159 38,856Inter-segment revenue 382 169 813 217 1,581Total segment revenue 28,782 6,331 3,948 1,376 40,437Unallocated 54Eliminations -1,601Total revenue - - - - 38,890
Segment profit/loss before depreciation, amortisation and impairment losses, etc. (EBITDA) 4,436 216 1,118 136 5,906Unallocated -195Eliminations 1Consolidated profit/loss before depreciation, amortisation and impairment losses, etc. (EBITDA)1 5,712
Profit/loss from joint ventures 10 -2 87 -2 93
Segment gross capital expenditures, excl. acquisitions and divestments (CAPEX) 1,172 126 532 204 2,034Unallocated -Eliminations 1Consolidated gross capital expenditures, excl. acquisitions and divestments (CAPEX) 2,035
Table 1.1 and Table 1.2A.P. Moller - Maersk has organised segments in Ocean, Logistics & Services, Terminals & Towage and Manu-facturing & Others.
The Ocean segment with the activities of Maersk Liner Business (Maersk Line, Safmarine and Sealand – A Maersk company) together with the Hamburg Süd brands (Ham-burg Süd and Aliança), Maersk Oil Trading as well as stra-tegic transhipment hubs under the APM Terminals brand. Inland activities related to Maersk Liner Business are included in the Logistics & Services segment.
The Logistics & Services segment with the logistics and supply chain management services, container inland ser-vices, inland haulage activities (intermodal), trade finance services and freight forwarding.
The Terminals & Towage segment including gateway ter-minals, involving landside activities such as port activities where the customers are mainly the carriers, and towage services under the Svitzer brand.
The Manufacturing & Others segment with Maersk Con-tainer Industry, Maersk Supply Service and others.
The segment disclosures provided above reflect the infor-mation which the Executive Board receives monthly in its capacity as Chief operating decision maker as defined in IFRS 8. The allocation of resources and the segment per-formance are evaluated based on revenue and profitability measured on earnings before interest, taxes, depreciation and amortisation (EBITDA).
1 Reference is made to the income statement for a recon-ciliation from EBITDA to profit/loss.
70 A.P. Moller - Maersk Annual Report 2020 Consolidated financial statements Notes index Amounts in USD million Financials

Table 1.31 Revenue eliminations between terminal services and
towage services are included under Eliminations.
Table 1.5Accrued income included in trade receivables in the balance sheet constitutes contract assets comprising unbilled amounts to customers representing the Group’s right to consideration for the services transferred to date. Any amount previously recognised as accrued income is reclassified to trade receivables at the time it is invoiced to the customer. Deferred income is recognised in the in-come statement within 12 months.
Under the payment terms generally applicable to the Group’s revenue-generating activities, prepayments are received only to a limited extent. Typically, payment is due upon or after completion of the services.
Part of the deferred income presented in the balance sheet constitutes contract liabilities which represent advance payments and billings in excess of revenue recognised.
There were no significant changes in accrued income and deferred income during the reporting period.
Impairment losses disclosed in note 16 relate to receiva-bles arising from contracts with customers.
Note 1 Segment information – continuedTable 1.3
USD million Types of revenue 2020 2019
Ocean Freight revenue 24,920 24,466Other revenue, including hubs 4,255 4,316
Logistics & Services Intermodal revenue 2,736 2,932Supply chain management revenue 961 861Inland services revenue 527 519Sea freight revenue 460 546Air freight revenue 780 485Other services revenue 1,499 988
Terminals & Towage Terminal services 3,151 3,278Towage services 681 695
Manufacturing & Others Sale of containers and spare parts 587 586Offshore supply services 252 306Other shipping activities 347 404Other services 68 80
Eliminations1 -1,484 -1,572Total revenue 39,740 38,890
Set out below is the reconciliation of the revenue from contracts with customers to the amounts disclosed as total revenue:
Table 1.4 2020 2019
Revenue from contracts with customers 38,727 37,641
Revenue from other sourcesVessel-sharing and slot charter income 929 1,188Lease income 18 21Others 66 40Total revenue 39,740 38,890
Table 1.5
Contract balances 2020 2019
Trade receivables 3,634 3,248Accrued income – contract asset - 48Accrued income – contract liability 149 -Deferred income – contract liability 49 59
71 A.P. Moller - Maersk Annual Report 2020 Consolidated financial statements Notes index Amounts in USD million Financials
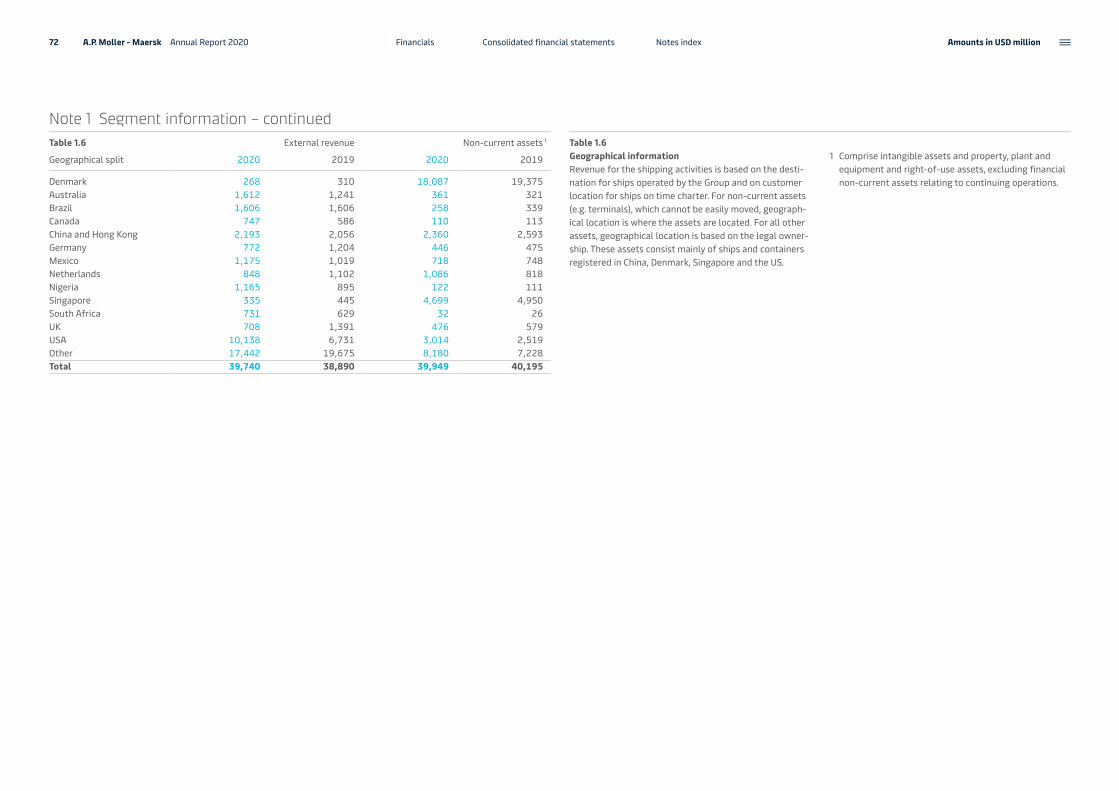
Note 1 Segment information – continuedTable 1.6 External revenue Non-current assets 1
Geographical split 2020 2019 2020 2019
Denmark 268 310 18,087 19,375Australia 1,612 1,241 361 321Brazil 1,606 1,606 258 339Canada 747 586 110 113China and Hong Kong 2,193 2,056 2,360 2,593Germany 772 1,204 446 475Mexico 1,175 1,019 718 748Netherlands 848 1,102 1,086 818Nigeria 1,165 895 122 111Singapore 335 445 4,699 4,950South Africa 731 629 32 26UK 708 1,391 476 579USA 10,138 6,731 3,014 2,519Other 17,442 19,675 8,180 7,228Total 39,740 38,890 39,949 40,195
Table 1.6Geographical informationRevenue for the shipping activities is based on the desti-nation for ships operated by the Group and on customer location for ships on time charter. For non-current assets (e.g. terminals), which cannot be easily moved, geograph-ical location is where the assets are located. For all other assets, geographical location is based on the legal owner-ship. These assets consist mainly of ships and containers registered in China, Denmark, Singapore and the US.
1 Comprise intangible assets and property, plant and equipment and right-of-use assets, excluding financial non-current assets relating to continuing operations.
72 A.P. Moller - Maersk Annual Report 2020 Consolidated financial statements Notes index Amounts in USD million Financials

Table 2.1Customary agreements have been entered into with employees regarding compensation in connection with resignation with consideration for local legislation and collective agreements.
For information about share-based payment, reference is made to note 12.
1 Total number of employees (YTD average) is 83,624 (2019: 86,279) of which 83,624 (2019: 83,512) relate to continuing operations and 0 (2019: 2,767) relate to discontinued operations.
Table 2.2Contract of employment for the Executive Board contains terms customary in Danish listed companies, including termination notice and competition clauses. In connection with a possible takeover offer, neither the Executive Board nor the Board of Directors will receive special remunera-tion. Fees and remuneration do not include pension.
The Board of Directors has received fees of USD 3m (USD 3m).
Table 2.3Fees for other services than statutory audit of the financial statements provided by PricewaterhouseCoopers Stats-autoriseret Revisionspartnerselskab to A.P. Moller - Maersk mainly consist of audit of non- statutory financial state-ments, financial due diligence and transaction advice, accounting advisory services, and other advisory account-ing and tax services.
Note 2 Operating costsTable 2.1 2020 2019
Costs of goods sold 1,471 998Bunker costs 3,820 4,628Terminal costs 6,425 6,775Intermodal costs 3,699 4,151Port costs 2,146 2,265Rent and lease costs 1,295 1,502Staff costs 5,209 4,955Other 7,739 7,856Total operating costs 31,804 33,130
Remuneration of employeesWages and salaries 4,560 4,321Severance payments 148 118Pension costs, defined benefit plans 29 31Pension costs, defined contribution plans 197 170Other social security costs 396 411Total remuneration 5,330 5,051
Of which:Recognised in the cost of assets 1 4Included in restructuring costs 120 92Expensed as staff costs 5,209 4,955
Average number of employees1 83,624 83,512
Table 2.2
Fees and remuneration to the Executive Board 2020 2019
Fixed based salary 8 10Short-term cash incentive 6 5Long-term share-based incentives 2 1Remuneration in connection with redundancy, resignations and release from duty to work - 6Total remuneration to the Executive Board 16 22
Table 2.3
Fees to the statutory auditors 2020 2019
Statutory audit 13 13Other assurance services 1 1 Tax and VAT advisory services 1 1Other services 2 2Total fees 17 17
73 A.P. Moller - Maersk Annual Report 2020 Consolidated financial statements Notes index Amounts in USD million Financials

Note 4 Financial income and expensesTable 4.1 2020 2019
Interest expenses on liabilities1 4 839 971Of which borrowing costs capitalised on assets2 7 23Interest income on loans and receivables 63 91Fair value adjustment transferred from equity hedge reserve (loss) 40 28Net interest expenses 809 885
Exchange rate gains on bank balances, borrowings and working capital 390 299Exchange rate losses on bank balances, borrowings and working capital 629 250Net foreign exchange gains/losses -239 49
Fair value gains from derivatives 331 98Fair value losses from derivatives 137 41Net fair value gains/losses 194 57
Dividends received from securities3 1 13Impairment losses on financial non-current receivables 33 2Reversal of write-downs of loans and other non-current receivables 7 10Financial expenses, net 879 758
Of which:Financial income 895 511Financial expenses 1,774 1,269
Table 4.1For an analysis of gains and losses from derivatives, reference is made to note 16.
1 Of which USD 468m (USD 477m) relates to interest expense on lease liabilities.
2 The capitalisation rate used to determine the amount of borrowing costs eligible for capitalisation is 4.1% (5.2%).
3 Of which USD 1m (USD 1m) pertains to shares held at the end of the year and USD 0m (USD 12m) to shares sold during the year.
4 Of which USD 33m (USD 12m) relates to loss on prepay-ment of issued bonds.
Note 3 Gain on sale of non-current assets, etc., netTable 3.1 2020 2019
Gains 293 128Losses 91 57Gain on sale of non-current assets, etc., net 202 71
Table 3.1Gains in 2020 primarily related to the sale of containers of USD 124m, sale of vessels of USD 44m, and to a lesser extent sale of a facility in China, and gaining control of Port Towage Amsterdam and Pipavav India terminal.
Gains in 2019 were primarily related to the sale of con-tainers of USD 81m and sale and leaseback of S-type vessels and Mitsubishi vessels of USD 12m.
74 A.P. Moller - Maersk Annual Report 2020 Consolidated financial statements Notes index Amounts in USD million Financials
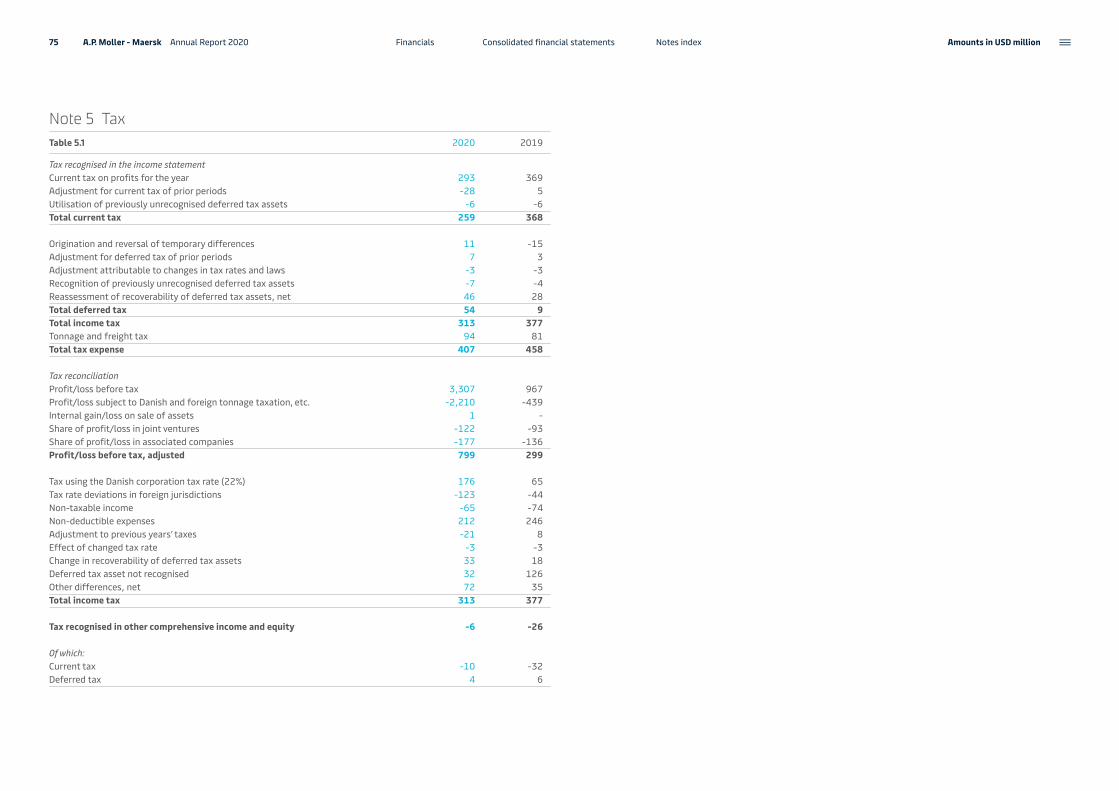
Note 5 TaxTable 5.1 2020 2019
Tax recognised in the income statementCurrent tax on profits for the year 293 369Adjustment for current tax of prior periods -28 5Utilisation of previously unrecognised deferred tax assets -6 -6Total current tax 259 368
Origination and reversal of temporary differences 11 -15Adjustment for deferred tax of prior periods 7 3Adjustment attributable to changes in tax rates and laws -3 -3Recognition of previously unrecognised deferred tax assets -7 -4Reassessment of recoverability of deferred tax assets, net 46 28Total deferred tax 54 9Total income tax 313 377Tonnage and freight tax 94 81Total tax expense 407 458
Tax reconciliationProfit/loss before tax 3,307 967Profit/loss subject to Danish and foreign tonnage taxation, etc. -2,210 -439Internal gain/loss on sale of assets 1 - Share of profit/loss in joint ventures -122 -93Share of profit/loss in associated companies -177 -136Profit/loss before tax, adjusted 799 299
Tax using the Danish corporation tax rate (22%) 176 65Tax rate deviations in foreign jurisdictions -123 -44Non-taxable income -65 -74Non-deductible expenses 212 246Adjustment to previous years’ taxes -21 8Effect of changed tax rate -3 -3Change in recoverability of deferred tax assets 33 18Deferred tax asset not recognised 32 126Other differences, net 72 35Total income tax 313 377
Tax recognised in other comprehensive income and equity -6 -26
Of which:Current tax -10 -32Deferred tax 4 6
75 A.P. Moller - Maersk Annual Report 2020 Consolidated financial statements Notes index Amounts in USD million Financials

Table 6.11 Acquisition of KGH Customs Services, Performance
Team LLC, Port Towage Amsterdam, and Pipavav Terminal cf. note 21.
2 Of which USD 22m (USD 95m) is under development. USD 27m (USD 31m) is related to terminal rights with indefinite useful life in Poti Sea Port Corp, Georgia. The impairment test is based on the estimated fair value ac-cording to business plans. An average discount rate of 11.8% (11.7%) p.a. after tax has been applied in the cal-culations. Furthermore, the developments in volumes and rates are significant parameters. Service concession rights with a carrying amount of USD 86m (USD 74m) have restricted title.
3 Of which USD 202m (USD 73m) is related to ongoing development of software.
Note 6 Intangible assetsTable 6.1 Goodwill Terminal and service
concession rightsCustomer relations
and brand nameOther rights Total
Cost1 January 2019 1,039 2,978 1,136 562 5,715Addition - 43 - 121 164Acquired in business combinations 26 - 25 - 51Disposal - - - 3 3Disposal on sale of businesses - - - - - Transfer, assets held for sale -4 -22 - -8 -34Exchange rate adjustment -1 -24 -1 -3 -2931 December 2019 1,060 2,975 1,160 669 5,864Addition - 23 - 203 226Acquired in business combinations1 309 240 272 86 907Disposal - - - 1 1Transfer - -7 3 -3 -7Transfer, assets held for sale - -57 - -4 -61Exchange rate adjustment 53 41 6 27 12731 December 2020 1,422 3,215 1,441 977 7,055
Amortisation and impairment losses1 January 2019 394 498 75 470 1,437Amortisation - 100 70 30 200Impairment losses 35 6 - 6 47Disposal - - - 3 3Transfer, assets held for sale -4 -17 - -6 -27Exchange rate adjustment -2 -7 - - -931 December 2019 423 580 145 497 1,645Amortisation - 113 82 38 233Impairment losses - 13 - - 13Disposal - - - 1 1Transfer - -4 - - -4Transfer, assets held for sale - -18 - - -18Exchange rate adjustment 31 1 - 10 4231 December 2020 454 685 227 544 1,910
Carrying amount:31 December 2019 637 2,3952 1,015 1723 4,21931 December 2020 968 2,5302 1,214 1 4333 5,145
76 A.P. Moller - Maersk Annual Report 2020 Consolidated financial statements Notes index Amounts in USD million Financials
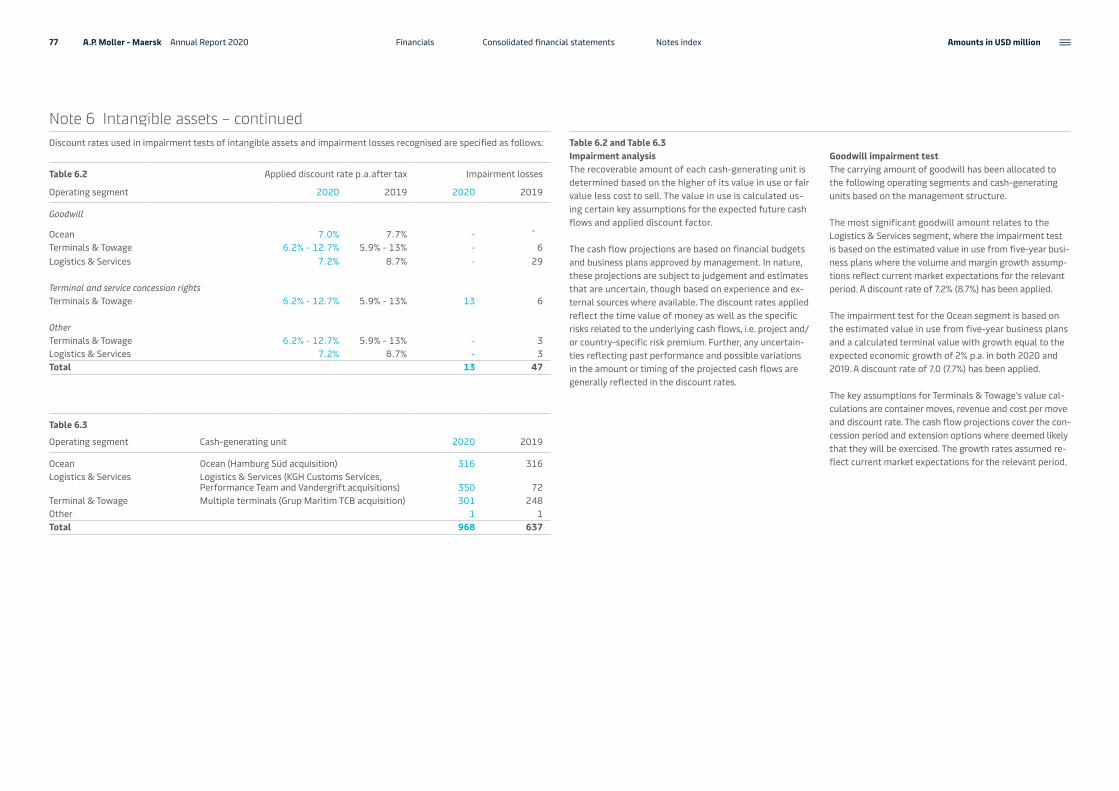
Note 6 Intangible assets – continuedDiscount rates used in impairment tests of intangible assets and impairment losses recognised are specified as follows:
Table 6.2 Applied discount rate p.a.after tax Impairment losses
Operating segment 2020 2019 2020 2019
Goodwill
Ocean 7.0% 7.7% - -
Terminals & Towage 6.2% - 12.7% 5.9% - 13% - 6Logistics & Services 7.2% 8.7% - 29
Terminal and service concession rightsTerminals & Towage 6.2% - 12.7% 5.9% - 13% 13 6
OtherTerminals & Towage 6.2% - 12.7% 5.9% - 13% - 3Logistics & Services 7.2% 8.7% - 3Total 13 47
Table 6.3
Operating segment Cash-generating unit 2020 2019
Ocean Ocean (Hamburg Süd acquisition) 316 316 Logistics & Services Logistics & Services (KGH Customs Services,
Performance Team and Vandergrift acquisitions) 350 72Terminal & Towage Multiple terminals (Grup Marìtim TCB acquisition) 301 248 Other 1 1Total 968 637
Table 6.2 and Table 6.3Impairment analysisThe recoverable amount of each cash-generating unit is determined based on the higher of its value in use or fair value less cost to sell. The value in use is calculated us-ing certain key assumptions for the expected future cash flows and applied discount factor.
The cash flow projections are based on financial budgets and business plans approved by management. In nature, these projections are subject to judgement and estimates that are uncertain, though based on experience and ex-ternal sources where available. The discount rates applied reflect the time value of money as well as the specific risks related to the underlying cash flows, i.e. project and/or country-specific risk premium. Further, any uncertain-ties reflecting past performance and possible variations in the amount or timing of the projected cash flows are generally reflected in the discount rates.
Goodwill impairment testThe carrying amount of goodwill has been allocated to the following operating segments and cash-generating units based on the management structure.
The most significant goodwill amount relates to the Logistics & Services segment, where the impairment test is based on the estimated value in use from five-year busi-ness plans where the volume and margin growth assump-tions reflect current market expectations for the relevant period. A discount rate of 7.2% (8.7%) has been applied.
The impairment test for the Ocean segment is based on the estimated value in use from five-year business plans and a calculated terminal value with growth equal to the expected economic growth of 2% p.a. in both 2020 and 2019. A discount rate of 7.0 (7.7%) has been applied.
The key assumptions for Terminals & Towage’s value cal-culations are container moves, revenue and cost per move and discount rate. The cash flow projections cover the con-cession period and extension options where deemed likely that they will be exercised. The growth rates assumed re-flect current market expectations for the relevant period.
77 A.P. Moller - Maersk Annual Report 2020 Consolidated financial statements Notes index Amounts in USD million Financials

Note 7 Property, plant and equipmentTable 7.1 Ships, con tainers,
etc.Production facilities and equipment, etc.
Construction work in progress and pay-ment on account
Total
Cost1 January 2019 48,122 6,649 1,600 56,371Transfer of IAS 17 finance leases -4,169 -138 - -4,307Addition 432 78 1,315 1,825Disposal 754 127 10 891Transfer 1,153 943 -2,096 - Transfer, assets held for sale -3 -353 1 -355Reclassification from/to right-of-use asset 62 6 - 68Exchange rate adjustment -3 -68 -15 -8631 December 2019 44,840 6,990 795 52,625
Addition 268 163 711 1,142Disposal 1,442 190 25 1,657Additions from acquired companies - 277 3 280Transfer 486 617 -1,103 - Transfer, assets held for sale -67 -57 4 -120Reclassification from/to right-of-use asset, net 793 75 -5 863Exchange rate adjustment 39 156 -3 19231 December 2020 44,917 8,031 377 53,325
Depreciation and impairment losses1 January 2019 21,705 3,354 205 25,264Transfer of IAS 17 finance leases -1,725 -30 - -1,755Depreciation 2,289 380 - 2,669Impairment losses 46 35 - 81Reversal of impairment losses - 53 11 64Disposal 654 120 2 776Transfer 188 - -188 - Transfer, assets held for sale -7 -280 - -287Reclassification from/to right-of-use 3 - - 3Exchange rate adjustment 8 -34 - -2631 December 2019 21,853 3,252 4 25,109
Table 7.1 continues on the next page.
Table 7.1PledgesShips, buildings, etc. with carrying amount of USD 0.8bn (USD 1.9bn) have been pledged as security for loans of USD 0.6bn (USD 1bn).
78 A.P. Moller - Maersk Annual Report 2020 Consolidated financial statements Notes index Amounts in USD million Financials
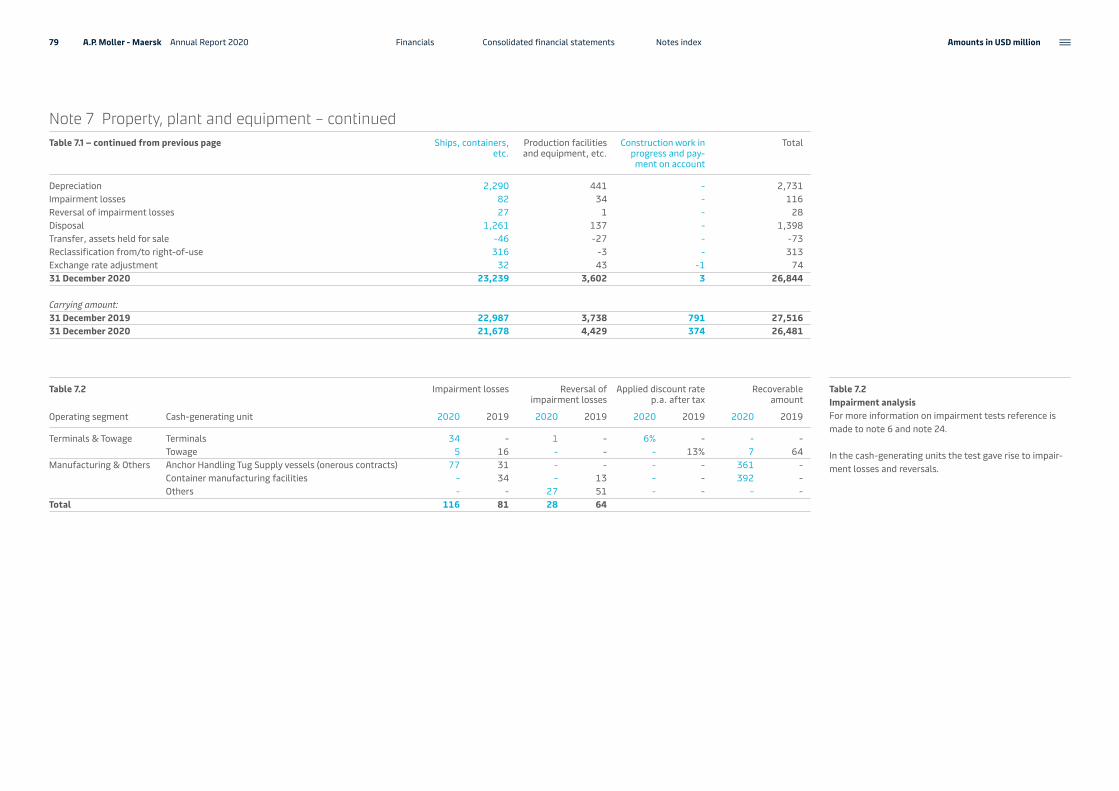
Table 7.2 Impairment losses Reversal of impairment losses
Applied discount rate p.a. after tax
Recoverable amount
Operating segment Cash-generating unit 2020 2019 2020 2019 2020 2019 2020 2019
Terminals & Towage Terminals 34 - 1 - 6% - - -Towage 5 16 - - - 13% 7 64
Manufacturing & Others Anchor Handling Tug Supply vessels (onerous contracts) 77 31 - - - - 361 -Container manufacturing facilities - 34 - 13 - - 392 -Others - - 27 51 - - - -
Total 116 81 28 64
Table 7.2Impairment analysisFor more information on impairment tests reference is made to note 6 and note 24.
In the cash-generating units the test gave rise to impair-ment losses and reversals.
Note 7 Property, plant and equipment – continuedTable 7.1 – continued from previous page Ships, con tainers,
etc.Production facilities and equipment, etc.
Construction work in progress and pay-ment on account
Total
Depreciation 2,290 441 - 2,731Impairment losses 82 34 - 116Reversal of impairment losses 27 1 - 28Disposal 1,261 137 - 1,398Transfer, assets held for sale -46 -27 - -73Reclassification from/to right-of-use 316 -3 - 313Exchange rate adjustment 32 43 -1 7431 December 2020 23,239 3,602 3 26,844
Carrying amount:31 December 2019 22,987 3,738 791 27,51631 December 2020 21,678 4,429 374 26,481
79 A.P. Moller - Maersk Annual Report 2020 Consolidated financial statements Notes index Amounts in USD million Financials

Table 8.1 and Table 8.2As part of the Group’s activities, customary leasing agree-ments are entered, especially regarding the chartering of vessels and leasing of containers and other equip-ment. In some cases, the leasing agreements comprise purchase options exercisable by the Group and options for extending the lease term. The Group also enters into arrangements that provide the right-to-use some existing infrastructure or land as required to carry out the termi-nal business. To optimise lease costs during the contract period, the Group sometimes provides residual value guarantees in relation to equipment leases. At the end of 2020, the expected residual values were reviewed to determine if these reflect the actual residual values achieved on comparable assets and expectations about future prices. At 31 December 2020, USD 354m (USD 489m) is expected to be payable and is included in the measurement of the lease liabilities.
Leases to which A.P. Moller - Maersk is committed but for which lease term has not yet commenced have an undis-counted value of USD 557m (USD 481m). They comprise of approx. 64 contracts commencing in 2021 and 2022. Certain terminal concession agreements contain variable payment terms that are linked to future performance, i.e. number of containers handled, or depend on an index, or a combination hereof. Such payments are recognised in the income statement in the period in which the condition that triggers those payments occurs.
Lease liabilities are disclosed in note 13 and note 16.
Note 8 Right-of-use assetsTable 8.1 Ships,
containers, etc.
Concession agreements
(non-IFRIC 12)
Real estate and other
leases
Total
Right-of-use assets1 January 2019 3,120 2,351 751 6,222Transfer from IAS 17 finance leases 2,444 0 108 2,552Additions 555 780 214 1,549Disposal 321 2 18 341Depreciation cost 1,023 188 185 1,396Transfer, assets held for sale -4 -58 -1 -63Transfer to owned assets, etc. -59 -1 -5 -65Exchange rate adjustment - 2 - 2 31 December 2019 4,712 2,884 864 8,460
Additions 1,040 240 281 1,561Acquired in business combinations 0 0 313 313Disposal 169 2 44 215Depreciation cost 1,007 189 218 1,414Transfer, assets held for sale 0 -5 -2 -7Transfer to owned assets, etc. -476 1 -72 -547Exchange rate adjustment 2 137 33 172 31 December 2020 4,102 3,066 1,155 8,323
Table 8.2 Total
Amounts recognised in profit and loss 2020 2019
Depreciation cost on right-of-use assets 1,414 1,396Interest expenses (included in finance costs) 468 477
Expenses relating to service elements of leases 799 861Expenses relating to short-term leases 296 414Expenses relating to variable lease payments 183 202Expenses relating to leases of low-value assets 22 25Total recognised in operating costs 1,300 1,502
80 A.P. Moller - Maersk Annual Report 2020 Consolidated financial statements Notes index Amounts in USD million Financials
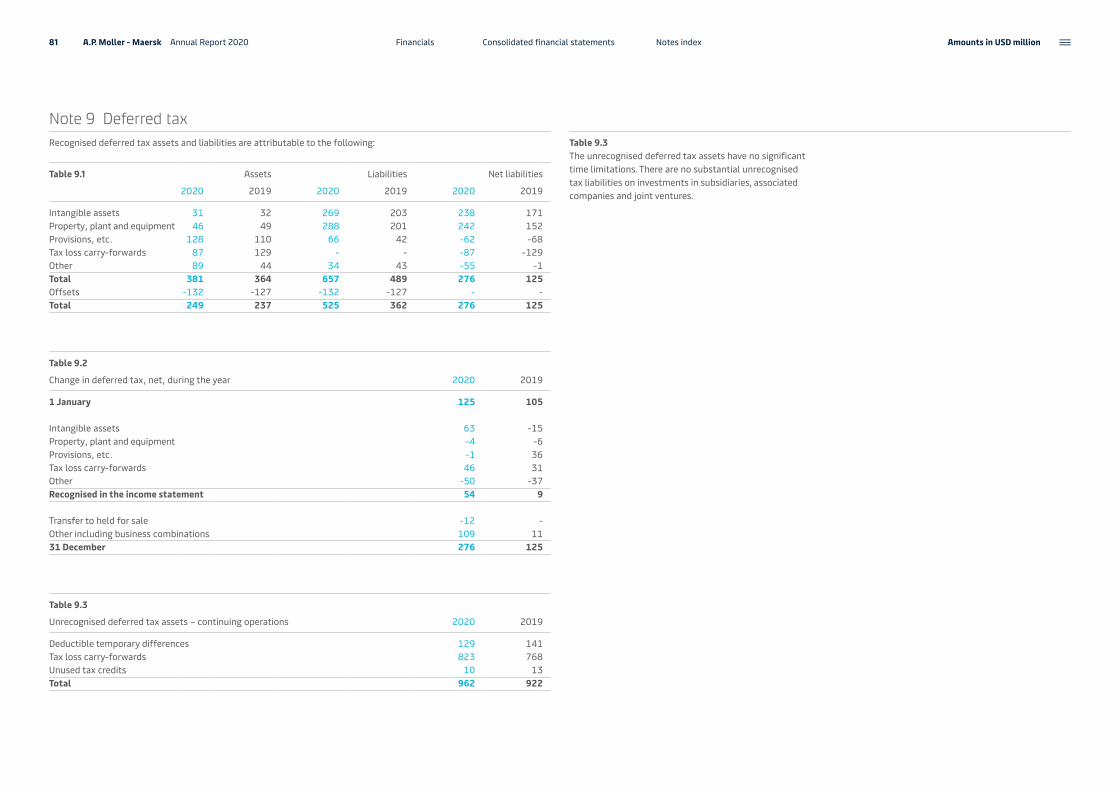
Note 9 Deferred taxRecognised deferred tax assets and liabilities are attributable to the following:
Table 9.1 Assets Liabilities Net liabilities
2020 2019 2020 2019 2020 2019
Intangible assets 31 32 269 203 238 171Property, plant and equipment 46 49 288 201 242 152Provisions, etc. 128 110 66 42 -62 -68Tax loss carry-forwards 87 129 - - -87 -129Other 89 44 34 43 -55 -1Total 381 364 657 489 276 125Offsets -132 -127 -132 -127 - - Total 249 237 525 362 276 125
Table 9.2
Change in deferred tax, net, during the year 2020 2019
1 January 125 105
Intangible assets 63 -15Property, plant and equipment -4 -6Provisions, etc. -1 36Tax loss carry-forwards 46 31Other -50 -37Recognised in the income statement 54 9
Transfer to held for sale -12 - Other including business combinations 109 1131 December 276 125
Table 9.3
Unrecognised deferred tax assets – continuing operations 2020 2019
Deductible temporary differences 129 141Tax loss carry-forwards 823 768Unused tax credits 10 13Total 962 922
Table 9.3The unrecognised deferred tax assets have no significant time limitations. There are no substantial unrecognised tax liabilities on investments in subsidiaries, associated companies and joint ventures.
81 A.P. Moller - Maersk Annual Report 2020 Financials Consolidated financial statements Notes index Amounts in USD million

Note 10 Discontinued operations and assets held for sale or distributionTable 10.1 2020 2019
Profit/loss for the period – discontinued operationsRevenue - 308Expenses - 233Negative fair value adjustment - 628Profit/loss before tax, etc. - -553Profit/loss for the year – discontinued operations - -553
A.P. Møller - Mærsk A/S’ share of profit/loss - -553Earnings per share - -27Diluted earnings per share - -27
Cash flows from discontinued operationsCash flow from operating activities - 137Cash flow used for investing activities - -488Cash flow from financing activities - -21Net cash flow from discontinued operations - -372
Table 10.2 2020 2019
Balance sheet items comprise:Intangible assets 39 7Property, plant and equipment 94 135Other assets 54 - Non-current assets 187 142Current assets 31 7Assets held for sale or distribution 218 149
Provisions - 1Deferred tax liabilities 13 1Other liabilities 78 73Liabilities associated with assets held for sale or distribution 91 75
Table 10.1, table 10.2 and table 10.3There have been no discontinued operations in 2020. Discontinued operations in 2019 included Maersk Drilling up to the demerger in April 2019, which concluded the separation of the energy-related businesses. The results of the discontinued operations are presented in one sepa-rate line in the 2019 income statement, balance sheet and cash flow statement. In the consolidated financial statements in 2019, the results for Maersk Drilling are classified under discontin-ued operations with a net loss of USD 553m in 2019. Total cash flow from the discontinued operations was USD 0m (positive USD 372m).
Assets held for sale in 2020 largely relate to two terminals reported as held for sale within Terminals & Towage and one terminal within Ocean.
The terminal in Ocean was transferred to assets held for sale in 2019, and an impairment of USD 62m has been made against the asset in 2020, being the difference be-tween carrying value and fair value less costs to sell.
Maersk Drilling activityOn 2 April 2019, Maersk Drilling was demerged and listed separately.
Period ended 2 April 2019A.P. Moller - Maersk recognised a loss of USD 553m forthe Maersk Drilling activity, mainly due to a negative fairvalue adjustment of USD 628m. The cash flow from the demerger is summarised in Table 10.3.
The fair value of the new listed company of USD 3.4bn resulted in a negative fair value adjustment of USD 628m being recognised in Q1 2019. Measurement of the fair value of the disposal Group was categorised as level 1 in the fair value hierarchy, as measurement was based on observable market data.
82 A.P. Moller - Maersk Annual Report 2020 Financials Consolidated financial statements Notes index Amounts in USD million

Note 10 Discontinued operations and assets held for sale or distribution – continuedTable 10.3
Cash flow from sale 2020 2019
Carrying amountIntangible assets - 91Property, plant and equipment - 4,426Financial assets, non-current - 4Deferred tax assets - -14Current assets - 792Provisions - -24Liabilities - -1,904Net assets sold - 3,371Non-controlling interests - - A.P. Møller - Mærsk A/S’ share - 3,371Distribution of shares in The Drilling Company of 1972 A/S to shareholders in A.P. Møller - Mærsk A/S - -3,371Total consideration - -Cash and bank balances transferred at closing - -425Cash flow from sale of subsidiaries and activities - -425
The net cash flow effect of USD 372m for the period mainly related to cash and bank balances disposed to Maersk Drilling at demerger. As part of the demerger, A.P. Moller - Maersk was subject to a statutory demerger liability for liabilities existing as of 4 March 2019 assigned to The Drilling Company of 1972 A/S, pursuant to sec-tion 254(2) of the Danish Company Act. The liability is deemed remote.
83 A.P. Moller - Maersk Annual Report 2020 Financials Consolidated financial statements Notes index Amounts in USD million

Note 11 Share capital and earnings per shareDevelopment in the number of shares:
Table 11.1 A shares of B shares of Nominal value
DKK 1,000 DKK 500 DKK 1,000 DKK 500 DKK million USD million
1 January 2019 10,756,262 232 10,060,398 172 20,817 3,774Conversion 3 -6 3 -6 - -31 December 2019 10,756,265 226 10,060,401 166 20,817 3,774
Cancellation 156,977 627,938 785 142Conversion 5 -10 - - - - 31 December 2020 10,599,293 216 9,432,463 166 20,032 3,632
Development in the holding of own shares:
Table 11.2 No. of shares of DKK 1,000 Nominal value DKK million % of share capital
Own shares 2020 2019 2020 2019 2020 2019
A shares1 January 134,279 - 134 - 0.65% 0.00%Addition 141,874 134,279 142 134 0.69% 0.65%Cancellation 156,977 - 157 - 0.75% 0.00%31 December 119,176 134,279 119 134 0.59% 0.65%
B shares1 January 587,949 55,515 588 56 2.82% 0.27%Addition 567,493 537,143 567 537 2.83% 2.57%Cancellation 627,938 628 3.02%Disposal 22,223 4,709 22 5 0.11% 0.02%31 December 505,281 587,949 505 588 2.52% 2.82%
Table 11.1All shares are fully issued and paid up.
One A share of DKK 1,000 holds two votes. B shares have no voting rights.
Adoption of resolutions regarding changes to the com-pany’s Articles of Association or increase or write-down of the share capital requires that at least two-thirds of the A share capital at the General Meeting shall be rep-resented by persons entitled to vote and that at least two-thirds of the votes cast shall be cast in favour of the adoption of the resolution.
Apart from a resolution for the dissolution of the com-pany, other resolutions at the General Meetings are passed by simple majority, as long as legislation does not require particular voting majority. Reference is made to the com-pany’s Articles of Association. In the event of an increase of the company’s share capital, the shareholders in the given share class shall have a pre-emptive right to sub-scribe for a proportionate share of the capital increase.
At the Annual General Meeting of A.P. Møller - Mærsk A/S on 23 March 2020, the shareholders decided on the can-cellation of treasury shares, whereby the share capital was decreased. On June 2, 2020, the company’s share capital was reduced from nominally DKK 20,816,862,000 with nominally DKK 784,915,000 in total, divided into 156,977 A shares and 627,938 B shares of DKK 1,000 to nominally DKK 20,031,947,000 by cancellation of own shares.
The capital decrease took place at a premium at a price of DKK 761.57 and DKK 809.51 for A and B shares, respec-tively, cf. section 188(2) of the Danish Companies Act, cor-responding to the average price at which the shares have been repurchased. The amount from the capital decrease has been paid out to the company as owner of the shares as the amount was transferred from the company’s capi-tal reserves to the free reserves.
Table 11.2The DKK 10bn share buy-back programme announced on 24 May 2019 was thereby concluded on 24 July 2020.
On 18 November 2020, A.P. Møller - Mærsk A/S decided to initiate a share buy-back programme of up to DKK 10bn
(around USD 1.6bn) and a maximum of 1.79 million shares to be acquired over a period of up to 15 months.
The share buy-back programme is initiated pursuant to the authorisation granted to the Board of Directors by the Annual General Meeting in 2019, which entitled the company to acquire treasury shares at a nominal value not exceeding 15% of the share capital at the market price applicable at the time of acquisition with a devia-tion of up to 10%.
The first phase of the programme will run from 1 December 2020 up to 29 April 2021. The shares to be acquired will be limited to a total market value of DKK 3.3bn. A maximum of 158,586 A shares and 620,270 B shares can be acquired in the first phase of the buy-back programme.
The share buy-back is carried out with the purpose to adjust the capital structure of A.P. Moller - Maersk. Shares which are not used for hedging purposes for the long-term incentive programmes will be proposed cancelled at the Annual General Meetings in 2021 and 2022.
A.P. Moller - Maersk has appointed Skandinaviska Enskilda Banken (‘SEB’) as lead manager. SEB will execute the pur-chase of shares on behalf of A.P. Moller - Maersk within the announced limits and will make all share purchase decisions independently and without the involvement of A.P. Moller - Maersk.
No shares may be bought back at a price exceeding the higher of i) share price of latest independent trade and ii) the highest current independent bid at Nasdaq Copenhagen at the time of trading.
The maximum number of A and B shares that may be pur-chased on each business day may not exceed 25% of the average daily trading volume of A and B shares, respec-tively, on Nasdaq Copenhagen or other regulated markets, on which the purchase is carried out, over last 20 trading days prior to the date of purchase.
Disposals of own shares are related to the Share Option Plans and the Restricted Shares Plan.
84 A.P. Moller - Maersk Annual Report 2020 Financials Consolidated financial statements Notes index Amounts in USD million

Note 11 Share capital and earnings per share – continuedThe basis for calculating earnings per share is the following:
Table 11.3
A.P. Møller - Mærsk A/S’ shareholders’ share of: 2020 2019
Profit/loss for the period of continuing operations 2,850 469Profit/loss for the period of discontinued operations - -553Profit/loss for the year 2,850 -84
Table 11.4 2020 2019
Issued shares 1 January 20,816,862 20,816,862Average number of own shares 729,307 275,236Average number of cancelled shares 456,795 - Average number of shares 19,630,760 20,541,626
Note 12 Share-based paymentTable 12.1 Members of
the Executive Board
Employees Total Total fair value 1
Outstanding restricted shares No. No. No. USD million
1 January 2019 1,002 12,786 13,788Granted 1,310 4,319 5,629 7Granted in connection with Maersk Drilling demerger 294 1,286 1,580Exercised - 4,756 4,756Forfeited 739 1,700 2,439Outstanding 31 December 2019 1,867 11,935 13,802
Granted 1,626 6,165 7,791 7Exercised - 3,777 3,777Forfeited - 125 125Outstanding 31 December 2020 3,493 14,198 17,691
Table 11.3DividendThe Board of Directors proposes a dividend to the share-holders of DKK 330 per share of DKK 1,000 – a total of DKK 6,611, equivalent to USD 1,092 at the exchange rate as per 31 December 2020. (DKK 150 per share of DKK 1,000 – total of DKK 3,123m equivalent to USD 468m). Payment of divi-dends is expected to take place on 26 March 2021.
Payment of dividends to shareholders does not trigger taxes to A.P. Moller - Maersk.
Table 11.4Earnings per shareAt 31 December 2020, there is dilution effect on earnings per share of the 66,971 (0) issued share options while there is no dilution effect on earnings per share of the 21,459 (67,825) issued shares options. The issued share options correspond to 0.33% (0%) and 0.11% (0.33%) of the total average number of shares in the Group respectively.
All the restricted shares of 17,691 have dilution effect. The issued restricted shares correspond to 0.09% of the total average number of shares in the Group.
Table 12.1Restricted shares planThe restricted shares plan was introduced in 2013, and grants have been awarded to employees on a yearly basis since 2013. Beginning in 2018, grants have also been awarded to members of the Executive Board.
The transfer of restricted shares is contingent upon the employee still being employed and not being under notice of termination and takes place when three years have passed from the time of granting. For members of the Executive Board the vesting period is five years.
The members of the Executive Board as well as other em-ployees are not entitled to any dividends during the vesting period. Special conditions apply regarding illness, death and resignation as well as changes in the company’s capital structure, etc. A part of A.P. Møller - Mærsk A/S’ holding of own B shares will be used to meet the company’s obliga-tions in connection with the restricted shares plan.
The fair value of restricted shares (A.P. Møller - Mærsk A/S B shares) granted to 96 (92) employees and five (five) members of the Executive Board was USD 7m (USD 7m) at the time of grant.
The fair value per restricted share at the time of grant is DKK 5,975 (DKK 8,668), which is equal to the volume weighted average share price on the date of grant, i.e. 1 April 2020.
The payroll expense related to the restricted shares plan is USD 6m (USD 5m).
On 1 April 2020, the restricted shares originally granted in 2017 were settled with the employees. The weighted average share price at that date was DKK 5,975.
The average remaining contractual life for the restricted shares as per 31 December 2020 is 1.8 years (1.7 years).
1 At the time of grant.
85 A.P. Moller - Maersk Annual Report 2020 Financials Consolidated financial statements Notes index Amounts in USD million

Note 12 Share-based payment – continuedTable 12.2 Members of
the Executive Board
Employees Total Average exercise price 1
Outstanding share options No. No. No. DKK
1 January 2019 9,985 36,707 46,692 10,006Granted 7,894 22,444 30,338 7,622Forfeited 6,080 3,125 9,205 9,141Outstanding 31 December 2019 11,799 56,026 67,825 9,057Exercisable 31 December 2019 - 18,435 18,435 10,630
Granted 8,741 31,383 40,124 8,639Exercised - 18,446 18,446 9,968Forfeited - 1,073 1,073 9,636Outstanding 31 December 2020 20,540 67,890 88,430 8,670Exercisable 31 December 2020 2,347 32,474 34,821 10,187
The following principal assumptions are used in the valuation:
Table 12.3 Share options granted to members of
the Executive Board
Share options granted to employees not members of
the Executive Board
2020 2019 2020 2019
Share price, volume weighted average at the date of grant, 1 April, DKK 5,975 8,668 5,975 8,668Share price, five days volume weighted average after publication of Annual Report, DKK 7,854 8,682 7,854 8,682Exercise price, DKK 8,639 9,550 8,639 9,550Exercise price following the demerger of Maersk Drilling, 2 April 2019, DKK N/A 7,670 N/A 7,605Expected volatility (based on historic volatility) 31% 32% 31% 32%Expected term (years) 5 5 5.75 5.75Expected dividend per share, DKK 150 150 150 150Risk free interest rate -0.66% -0.36% -0.63% -0.28%
Table 12.2Share option plansIn addition to the plan described above, A.P. Moller - Maersk has share option plans for members of the Executive Board and other employees. Each share option granted is a call option to buy an existing B share of nominal DKK 1,000 in A.P. Møller - Mærsk A/S.
The share options are granted at an exercise price cor-responding to 110% of the average of the market price on the first five trading days following the release of A.P. Møller - Mærsk A/S’ Annual Report. Exercise of the share options is contingent upon the option holder still being employed at the time of exercise. The share options can be exercised when at least three years and no more than six years (seven years for share options granted to employees not members of the Executive Board) have passed from the time of grant. Special conditions apply regarding illness, death and resignation as well as changes in the company’s capital structure, etc.
The share options can only be settled in shares. A part of A.P. Møller - Mærsk A/S’ holding of own B shares will be used to meet the company’s obligations in respect of the share option plans.
The fair value of awards granted to five (five) members of the Executive Board and 89 (75) employees was USD 4m (USD 9m) at the time of grant.
The payroll expense related to the share option plan is USD 5m (USD 5m).
The weighted average share price at the dates of exercise of share options was DKK 12,389. No share options were exercised during 2019.
The average remaining contractual life as per 31 December 2020 is 5.1 years (5.2 years) and the exercise price for out-standing share options is DKK 8,670 (DKK 9,057).
1 Average exercise prices were reduced following the demerger of Maersk Drilling.
Table 12.3The fair value per option granted to members of the Executive Board is calculated at DKK 625 (DKK 1,782) at the time of grant, based on Black & Scholes’ option pricing model. The fair value per option granted to em-ployees not members of the Executive Board is calcu-lated at DKK 697 (DKK 1,914) at the time of grant based on the same option pricing model.
86 A.P. Moller - Maersk Annual Report 2020 Financials Consolidated financial statements Notes index Amounts in USD million
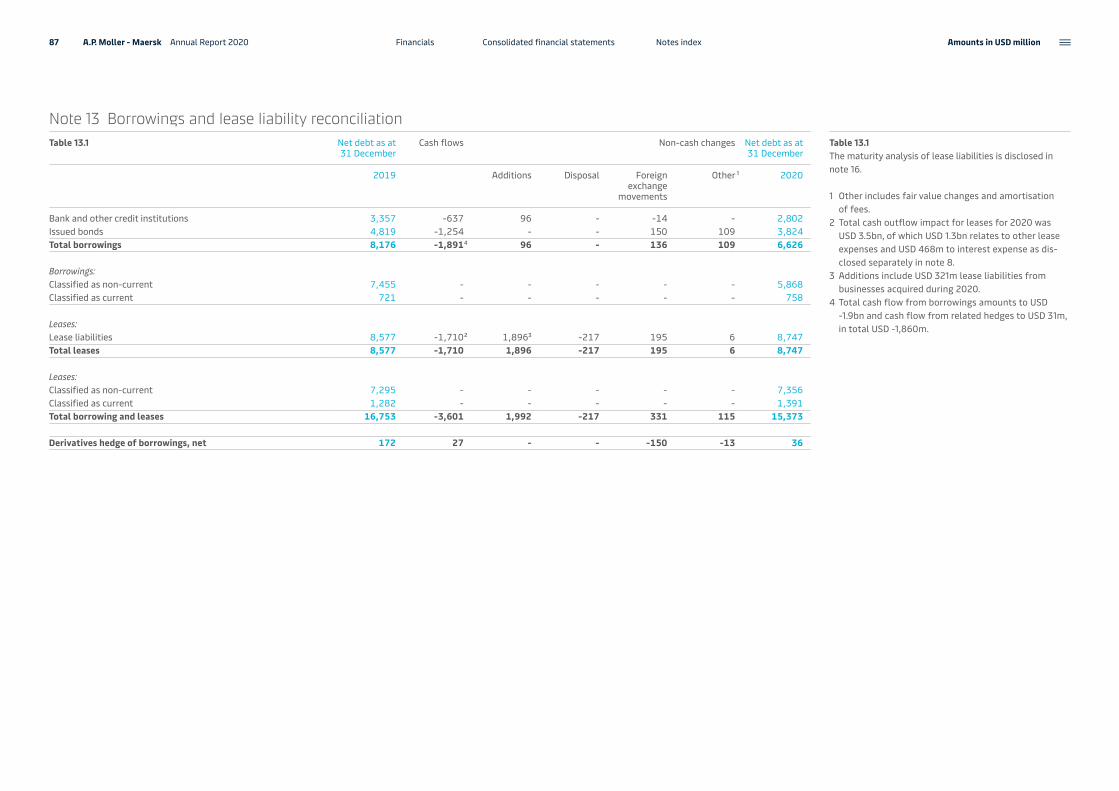
Note 13 Borrowings and lease liability reconciliationTable 13.1 Net debt as at
31 DecemberCash flows Non-cash changes Net debt as at
31 December
2019 Additions Disposal Foreign exchange
movements
Other 1 2020
Bank and other credit institutions 3,357 -637 96 - -14 - 2,802Issued bonds 4,819 -1,254 - - 150 109 3,824Total borrowings 8,176 -1,8914 96 - 136 109 6,626
Borrowings:Classified as non-current 7,455 - - - - - 5,868Classified as current 721 - - - - - 758
Leases:Lease liabilities 8,577 -1,7102 1,8963 -217 195 6 8,747Total leases 8,577 -1,710 1,896 -217 195 6 8,747
Leases:Classified as non-current 7,295 - - - - - 7,356Classified as current 1,282 - - - - - 1,391Total borrowing and leases 16,753 -3,601 1,992 -217 331 115 15,373
Derivatives hedge of borrowings, net 172 27 - - -150 -13 36
Table 13.1The maturity analysis of lease liabilities is disclosed in note 16.
1 Other includes fair value changes and amortisation of fees.
2 Total cash outflow impact for leases for 2020 was USD 3.5bn, of which USD 1.3bn relates to other lease expenses and USD 468m to interest expense as dis-closed separately in note 8.
3 Additions include USD 321m lease liabilities from businesses acquired during 2020.
4 Total cash flow from borrowings amounts to USD -1.9bn and cash flow from related hedges to USD 31m, in total USD -1,860m.
87 A.P. Moller - Maersk Annual Report 2020 Financials Consolidated financial statements Notes index Amounts in USD million

Note 13 Borrowings and lease liability reconciliation – continuedTable 13.2 Net debt as at
31 DecemberCash flows Non-cash changes Net debt as at
31 December
2018 IFRS 16 adoption
Additions Disposal Foreign exchange
movements
Other 1 2019
Bank and other credit institutions 4,249 -997 - - - 7 98 3,357Issued bonds 5,373 -543 - - - -57 46 4,819Total borrowings 9,622 -1,5403 - - - -50 144 8,176
Borrowings:Classified as non-current 8,036 - - - - - - 7,455Classified as current 1,586 - - - - - - 721
Leases:Lease liabilities 2,266 -1,3112 6,245 1,744 -323 5 -49 8,577Total leases 2,266 -1,311 6,245 1,744 -323 5 -49 8,577
Leases:Classified as non-current 1,858 - - - - - - 7,295Classified as current 408 - - - - - - 1,282Total borrowing and leases 11,888 -2,851 6,245 1,744 -323 -45 95 16,753
Derivatives hedge of borrowings, net 162 -84 - - - 57 37 172
Table 13.2The maturity analysis of lease liabilities is disclosed in note 16.
1 Other includes fair value changes and amortisation of fees.
2 Total cash outflow impact for leases for 2019 was USD 3.3bn, of which USD 1.5bn to other lease expenses and USD 477m relates to interest expense as disclosed separately in note 8.
3 Total cash flow from borrowings amounts to USD -1.5bn and cash flow from related hedges to USD 84m, in total USD -1.5bn.
88 A.P. Moller - Maersk Annual Report 2020 Financials Consolidated financial statements Notes index Amounts in USD million
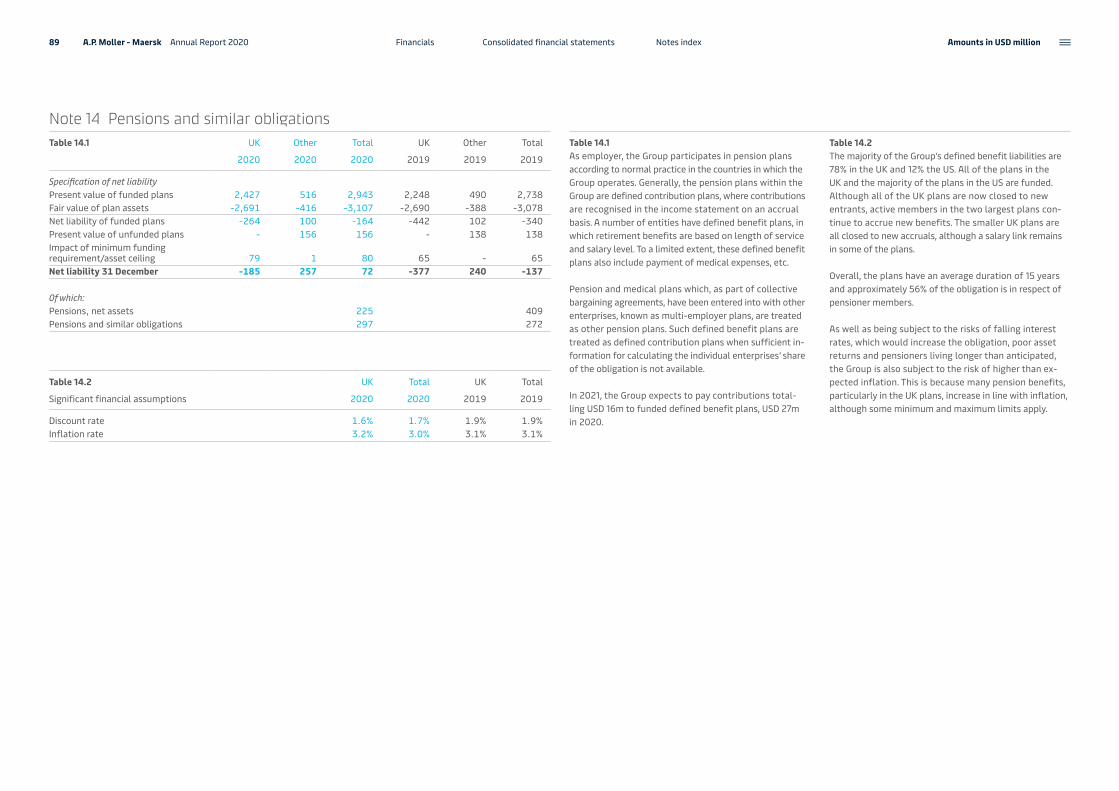
Note 14 Pensions and similar obligationsTable 14.1 UK Other Total UK Other Total
2020 2020 2020 2019 2019 2019
Specification of net liabilityPresent value of funded plans 2,427 516 2,943 2,248 490 2,738Fair value of plan assets -2,691 -416 -3,107 -2,690 -388 -3,078Net liability of funded plans -264 100 -164 -442 102 -340Present value of unfunded plans - 156 156 - 138 138Impact of minimum funding requirement/asset ceiling 79 1 80 65 - 65Net liability 31 December -185 257 72 -377 240 -137
Of which:Pensions, net assets 225 409Pensions and similar obligations 297 272
Table 14.2 UK Total UK Total
Significant financial assumptions 2020 2020 2019 2019
Discount rate 1.6% 1.7% 1.9% 1.9%Inflation rate 3.2% 3.0% 3.1% 3.1%
Table 14.1As employer, the Group participates in pension plans according to normal practice in the countries in which the Group operates. Generally, the pension plans within the Group are defined contribution plans, where contributions are recognised in the income statement on an accrual basis. A number of entities have defined benefit plans, in which retirement benefits are based on length of service and salary level. To a limited extent, these defined benefit plans also include payment of medical expenses, etc.
Pension and medical plans which, as part of collective bargaining agreements, have been entered into with other enterprises, known as multi-employer plans, are treated as other pension plans. Such defined benefit plans are treated as defined contribution plans when sufficient in-formation for calculating the individual enterprises’ share of the obligation is not available.
In 2021, the Group expects to pay contributions total-ling USD 16m to funded defined benefit plans, USD 27m in 2020.
Table 14.2The majority of the Group’s defined benefit liabilities are 78% in the UK and 12% the US. All of the plans in the UK and the majority of the plans in the US are funded. Although all of the UK plans are now closed to new entrants, active members in the two largest plans con-tinue to accrue new benefits. The smaller UK plans are all closed to new accruals, although a salary link remains in some of the plans.
Overall, the plans have an average duration of 15 years and approximately 56% of the obligation is in respect of pensioner members.
As well as being subject to the risks of falling interest rates, which would increase the obligation, poor asset returns and pensioners living longer than anticipated, the Group is also subject to the risk of higher than ex-pected inflation. This is because many pension benefits, particularly in the UK plans, increase in line with inflation, although some minimum and maximum limits apply.
89 A.P. Moller - Maersk Annual Report 2020 Financials Consolidated financial statements Notes index Amounts in USD million

Note 14 Pensions and similar obligations – continuedTable 14.3 31 December
Life expectancy 2020 2040 2019 2039
65-year-old male in the UK 21.8 23.2 21.6 23.0
The sensitivity of the liabilities and pension cost to the key assumptions are as follows:
Table 14.4 Increase Decrease
Sensitivities for key assumptions in the UK Factors ‘Change in liability’ 2020 2020
Discount rate Increase/(decrease) by 25 basis points -101 106Inflation rate Increase/(decrease) by 25 basis points 61 -59Life expectancy Increase/(decrease) by one year 140 -136
Table 14.5 UK Other Total UK Other Total
Specification of plan assets 2020 2020 2020 2019 2019 2019
Insurance contracts 1,734 69 1,803 199 58 257 Shares 77 137 214 179 131 310 Government bonds 379 107 486 1,403 99 1,502 Corporate bonds 331 86 417 652 79 731 Real estate 10 4 14 9 4 13 Other assets 160 13 173 248 17 265 Fair value 31 December 2,691 416 3,107 2,690 388 3,078
Table 14.3Rates of life expectancy reflect the most recent mortality investigations, and in line with market practice an allow-ance is made for future improvements in life expectancy. The Group assumes that future improvements will be in line with the latest projections of 1.25% for all UK plans.
Table 14.4The liabilities are calculated using assumptions that are the Group’s best estimate of future experience bearing in mind the requirements of IAS 19. The Group’s plans are funded in accordance with applicable local legislation. In the UK, each plan has a Trustee Board that is required to act in the best interests of plan mem-bers. Every three years, a formal valuation of the plan’s liabilities is carried out using a prudent basis, and if the plan is in deficit, the Trustees agree with the Group or the sponsoring employer on a plan for recovering that deficit. In 2020, the Trustees of one of the UK plans, Maersk Retirement Benefit Scheme (MRBS), entered into an in-surance contract to provide further security for all future benefit payments and annual increases to which members are entitled under the scheme. Following this MRBS buy-in transaction, over 70% of the UK liabilities are now covered by insurance policies. Therefore, movement in the liabilities due to change in assumptions would equally impact the assets value related to the buy-in policies, resulting in a reduced movement in the overall balance sheet position.
The expected contributions to the UK plans for 2021 are USD 11m (USD 23m in 2020) of which USD 9m (USD 20m in 2020) is deficit recovery contributions. In most of the UK plans, any surplus remaining after the last member dies may be returned to the Group. However, the Merchant Navy Ratings Pension Fund (MNRPF), and the Merchant Navy Officers Pension Fund (MNOPF) contributions paid by the Group are not refundable in any circumstance and the balance sheet liability reflects an adjustment for any agreed deficit recovery contributions in excess of defi-cit determined using the Group’s assumptions. In 2020 an adjustment of USD 3m (USD 2m) was applied in this respect.
Table 14.5Other than the insurance contracts and a small proportion of other holdings, the plan assets held by the Group are quoted investments.
90 A.P. Moller - Maersk Annual Report 2020 Financials Consolidated financial statements Notes index Amounts in USD million

Note 14 Pensions and similar obligations – continuedTable 14.6
Change in net liability
Present value of
obligations
Fair value of plan assets
Adjustments Net liability Of which:UK
1 January 2019 2,596 2,683 61 -26 -241
Current service cost, administration cost etc. 30 -5 - 35 9Calculated interest expense/income 73 77 - -4 -7Recognised in the income statement in 2019 103 72 - 31 2
Actuarial gains/losses from changes in financial and demographic assumptions, etc. 262 - - 262 207Return on plan assets, exclusive calculated interest income - 352 - -352 -310Adjustment for unrecognised asset due to asset ceiling - - -1 -1 -1Recognised in other comprehensive income in 2019 262 352 -1 -91 -104
Contributions from the Group and employees - 27 - -27 -22Benefit payments -141 -130 - -11 -Settlements -5 -5 - - -Internal transfers -1 - 1 - -Effect of business combinations and disposals -11 -11 - - -Exchange rate adjustment 73 90 4 -13 -1231 December 2019 2,876 3,078 65 -137 -377
Current service cost, administration cost etc. 26 -6 - 32 9Calculated interest expense/income 55 58 - -3 -7Recognised in the income statement in 2020 81 52 - 29 2
Actuarial gains/losses from changes in financial and demographic assumptions, etc. 180 - - 180 148Return on plan assets, exclusive calculated interest income - -15 - 15 50Adjustment for unrecognised asset due to asset ceiling - - 11 11 9Adjustment for minimum funding requirement - - 1 1 1Recognised in other comprehensive income in 2020 180 -15 12 207 208
Contributions from the Group and employees - 21 - -21 -16Benefit payments -139 -127 - -12 -Effect of business combinations and disposals 1 - - 1 -Exchange rate adjustment 100 98 3 5 -231 December 2020 3,099 3,107 80 72 -185
Multi-employer plansUnder collective agreements, certain entities in the Group participate together with other employers in de-fined benefit pension plans as well as welfare/medical plans (multi-employer plans). In general, the contribu-tions to the schemes are based on man hours worked or cargo tonnage handled, or a combination hereof.
For the defined benefit pension plans, the Group has joint and several liabilities to fund total obligations. While the welfare/medical plans are by nature contribution plans funded on a pay-as-you-go basis. In 2020, the Group’s contributions to the pension and welfare/medical plans are estimated at USD 91m (USD 83m) and USD 277m (USD 295m), respectively. The contributions to be paid in 2021 are estimated at USD 92m for the pension plans and USD 279m for the welfare/medical plans.
No reliable basis exists for allocation of the schemes’ obligations and plan assets to individual employer par-ticipants. For the pension plans where the Group has an interest and there is a deficit, the net obligations for all employers amounts to USD 0.3bn (USD 0.7bn). This net obligation is based on the most recent available financial data from the plan’s trustees, calculated in accordance with the rules for such actuarial calculation in US GAAP. The deficit in some of the schemes may necessitate increased contributions in the future. Welfare/medical plans are ‘pay as you go’, and form a part of the Group’s US collective bargain agreements. They cover a limited part of employees’ medical costs as occurred.
91 A.P. Moller - Maersk Annual Report 2020 Financials Consolidated financial statements Notes index Amounts in USD million

Note 15 ProvisionsTable 15.1 Restructuring Legal
disputes, etc.Other Total
1 January 2020 107 618 369 1,094Provision made 151 487 190 828Amount used 78 144 50 272Amount reversed 49 173 146 368Addition from business combinations - 3 10 13Exchange rate adjustment 5 -14 -5 -1431 December 2020 136 777 368 1,281
Of which:Classified as non-current 2 396 158 556Classified as current 134 381 210 725
Non-current provisions expected to be realised after more than five years - 57 10 67
Table 15.1Restructuring includes provisions for decided and publicly announced restructurings. Legal disputes, etc. include among other things indirect tax and duty disputes. Other includes provisions for warranties and risk under certain self-insurance programmes. The provisions are subject to considerable uncertainty, cf. note 24.
Reversals of provisions primarily relate to legal disputes and contractual disagreements, which are recognised in the income statement under operating costs and tax.
92 A.P. Moller - Maersk Annual Report 2020 Financials Consolidated financial statements Notes index Amounts in USD million
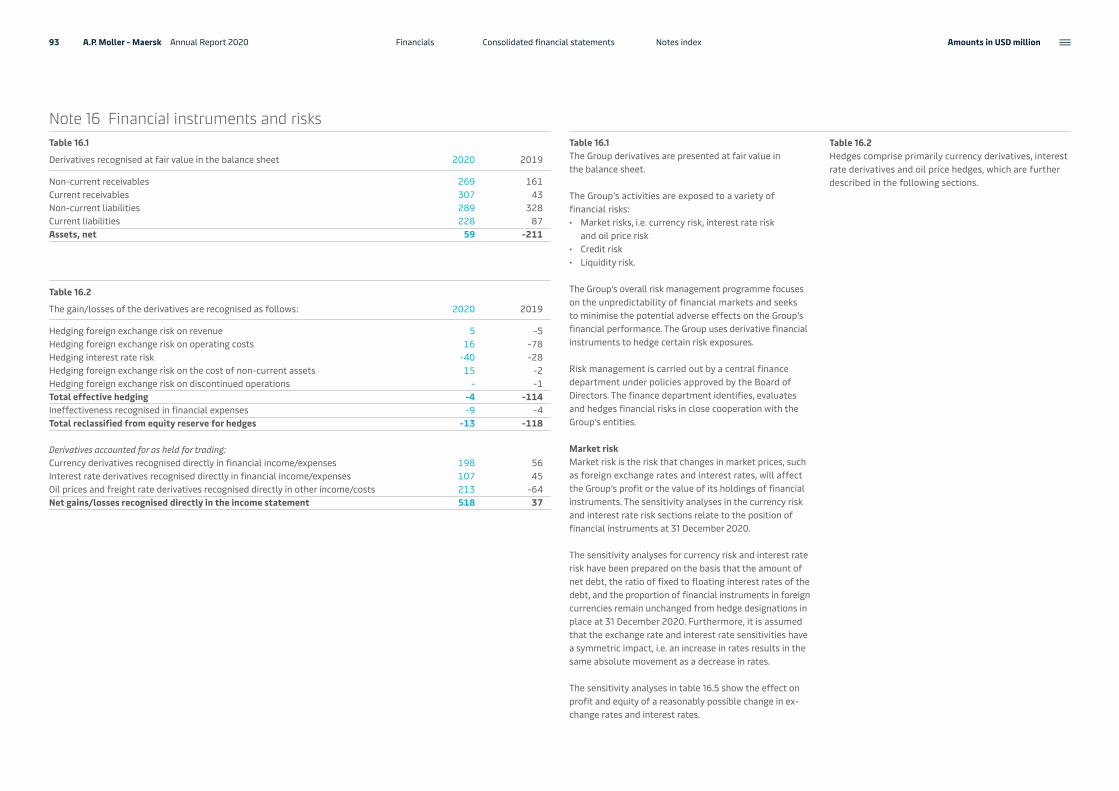
Note 16 Financial instruments and risksTable 16.1
Derivatives recognised at fair value in the balance sheet 2020 2019
Non-current receivables 269 161Current receivables 307 43Non-current liabilities 289 328Current liabilities 228 87Assets, net 59 -211
Table 16.2
The gain/losses of the derivatives are recognised as follows: 2020 2019
Hedging foreign exchange risk on revenue 5 -5Hedging foreign exchange risk on operating costs 16 -78Hedging interest rate risk -40 -28Hedging foreign exchange risk on the cost of non-current assets 15 -2Hedging foreign exchange risk on discontinued operations - -1Total effective hedging -4 -114Ineffectiveness recognised in financial expenses -9 -4Total reclassified from equity reserve for hedges -13 -118
Derivatives accounted for as held for trading:Currency derivatives recognised directly in financial income/expenses 198 56Interest rate derivatives recognised directly in financial income/expenses 107 45Oil prices and freight rate derivatives recognised directly in other income/costs 213 -64Net gains/losses recognised directly in the income statement 518 37
Table 16.1The Group derivatives are presented at fair value in the balance sheet. The Group’s activities are exposed to a variety of financial risks:• Market risks, i.e. currency risk, interest rate risk
and oil price risk• Credit risk• Liquidity risk.
The Group’s overall risk management programme focuses on the unpredictability of financial markets and seeks to minimise the potential adverse effects on the Group’s financial performance. The Group uses derivative financial instruments to hedge certain risk exposures.
Risk management is carried out by a central finance department under policies approved by the Board of Directors. The finance department identifies, evaluates and hedges financial risks in close cooperation with the Group’s entities.
Market riskMarket risk is the risk that changes in market prices, such as foreign exchange rates and interest rates, will affect the Group’s profit or the value of its holdings of financial instruments. The sensitivity analyses in the currency risk and interest rate risk sections relate to the position of financial instruments at 31 December 2020.
The sensitivity analyses for currency risk and interest rate risk have been prepared on the basis that the amount of net debt, the ratio of fixed to floating interest rates of the debt, and the proportion of financial instruments in foreign currencies remain unchanged from hedge designations in place at 31 December 2020. Furthermore, it is assumed that the exchange rate and interest rate sensitivities have a symmetric impact, i.e. an increase in rates results in the same absolute movement as a decrease in rates.
The sensitivity analyses in table 16.5 show the effect on profit and equity of a reasonably possible change in ex-change rates and interest rates.
Table 16.2Hedges comprise primarily currency derivatives, interest rate derivatives and oil price hedges, which are further described in the following sections.
93 A.P. Moller - Maersk Annual Report 2020 Financials Consolidated financial statements Notes index Amounts in USD million

Table 16.3Currency riskThe Group’s currency risk relates to the fact that while income from Ocean activities is denominated mainly in USD, the related expenses are incurred in both USD and a wide range of other currencies such as EUR, CNY, DKK, HKD, SGD and CAD. As the net income is in USD, this is also the primary financing currency. Income and expenses from other activities, including Terminals & Towage, are mainly denominated in local currencies, thus reducing the Group’s exposure to these currencies.
The main purpose of hedging the Group’s currency risk is to hedge the USD value of the Group’s net cash flow and reduce fluctuations in the Group’s profit. The Group uses various financial derivatives, including forwards, option contracts and cross-currency swaps, to hedge these risks. The key aspects of the currency hedging policy are:• Net cash flows in other significant currencies than
USD are hedged using a layered model with a 12-month horizon
• Significant capital commitments or divestments in other currencies than USD are hedged
• Most non-USD debt is hedged, however, depending on the asset-liability match and the currency of the generated cash flow.
Currency derivatives hedge future revenue, operating costs and investments/divestments, and are recognised when the hedged exposure occurs in the income statement or the cost of property, plant and equipment, respectively.
There is not any proxy hedging for the currency risk hedg-ing, and therefore the economic relationship between the hedged exposure and the hedge is high. Effectiveness is measured with critical terms match approach according to IFRS 9.
Hedges of future revenue and operating costs matures within a year. There are no hedges of investments at the end of 2020 (2019: Mature within a year).
For hedges related to operating cash flows and invest-ments, a gain of USD 95m in 2020 (gain of USD 48m) is recognised in other comprehensive income, and the cash flow hedge reserve amounts to a gain of USD 109m at 31 December (gain of USD 14m). For hedges where the cost of hedging is applied, the forward points are rec-ognised in other comprehensive income and transferred with the effective hedge when the hedged transaction occurs. The cost of hedging reserve amounts to USD 0m (USD 0m). Ineffectiveness related to hedge of acquisition amounts to a gain of USD 3m (USD 0m).
Table 16.4Besides the designated cash flow hedges in table 16.3, the Group enters into derivatives to hedge currency exposures that do not qualify for hedge accounting. These derivatives are classified as fair value through profit or loss.
Table 16.5The Group’s sensitivity to an increase in the USD exchange rate of 10% against all other significant currencies to which the Group is exposed is estimated to have the following impact in table 16.5.
The sensitivities are based only on the impact of financial instruments that are outstanding at the balance sheet date and are thus not an expression of the Group’s total currency risk.
Note 16 Financial instruments and risks – continuedTable 16.3
Hedge of operating cash flows and investments in foreign currencies
Fair value, asset
Fair value, liability
Nominal amount of derivative
Average hedge rate
Main currencies hedged2020EUR 36 1 681 1.17DKK 13 1 246 6.37HKD - - 161 7.76Other currencies 64 2 1,064 N/ATotal 113 4
2019EUR 3 7 647 1.14DKK 1 4 260 6.55HKD - - 165 7.82Other currencies 28 7 1,113 N/ATotal 32 18
Table 16.4 Fair value
Recognised at fair value through profit and loss 2020 2019
Currency derivatives -2 -28Interest derivatives 9 13Total 7 -15
Table 16.5 Profit before tax Equity before tax
Currency sensitivity for financial instruments 2020 2019 2020 2019
EUR -38 15 -101 -43CNY 15 53 8 44Other 81 94 -17 -22Total 58 162 -110 -21
94 A.P. Moller - Maersk Annual Report 2020 Financials Consolidated financial statements Notes index Amounts in USD million

Table 16.6Interest rate riskThe Group has most of its debt denominated in USD, but part of the debt (e.g. issued bonds) is in other currencies such as EUR, NOK, GBP and JPY. The Group strives to maintain a combination of fixed and floating interest rates on its net debt, reflecting expectations and risks.
The hedging of the interest rate risk is governed by a du-ration range and is primarily obtained using interest rate swaps. The duration of the Group’s debt portfolio is 2.1 years (2.2 years) excluding IFRS 16 leases.
A general increase in interest rates by one percentage point is estimated, all else being equal, to affect profit before tax and equity, excluding tax effect, positively by approx. USD 39m and positively by approx. USD 30m, respectively, (positively by approx. USD 11m and negatively by approx. USD 14m, respectively).
This analysis assumes that all other variables, in particular foreign currency rates, remain constant.
The hedging of the interest rate risk is done by cross- currency swaps and interest rate swaps. The hedging is a mix of fair value hedging, combined fair value hedging, and cash flow hedging.
Due to buy-back of issued bonds in 2020, ineffectiveness from cash flow hedges is recognised in the income state-ment with a loss of USD 12m (loss of USD 4m).
The hedges are expected to be highly effective due to the nature of the economic relationship between the exposure and the hedge. The source of ineffectiveness is the credit risk of the hedging instruments. For hedges where the cost of hedging is applied, the change in basis spread is recognised in other comprehensive income and is a time effect during the lifetime of the swap and at maturity amounts to 0. If the hedged transaction is prepaid, the change in basis spread will be recognised in profit or loss as ineffectiveness. The cost of hedging reserve amounts to a gain of USD 6m (gain of USD 6m).
1 Currency element of the cross-currency swaps is not designated into the hedge relationship and is recog-nised in financial items.
Note 16 Financial instruments and risks – continuedTable 16.61 Maturity
Interest rate hedging of borrowings
Fair value, asset
Fair value, liability
Nominal amount of derivative
0-1 year 2-4 years 5- years Gain/loss on hedged
item
Gain/loss on hedging instrument
Average hedge
rate
2020Combined fair value hedge, hedge of borrowingsEUR 45 - 559 - - 559 -61 44 1.8%GBP - 7 95 - 95 - -8 5 2.5%JPY 17 - 121 - 121 - -3 -2 1.8%NOK - 11 256 - - 256 -5 -2 2.5%
Fair value hedge, hedge of borrowingsUSD 80 - 900 - 500 400 -79 80 3.1%
Cash flow hedge, hedge of borrowingsEUR - 35 461 - - 461 - -34 4.2%GBP - 49 313 - 313 - - -11 4.6%NOK - 4 81 51 30 - - -1 2.4%USD 155 227 1,905 700 680 525 - -68 2.1%Total 297 333 4,691 751 1,739 2,201 -156 11
2019Combined fair value hedge, hedge of borrowingsEUR 17 35 733 - 224 509 -47 23 3.5%GBP - 14 92 - - 92 -5 2 4.2%JPY 10 11 206 92 - 114 -3 -3 3.6%NOK - 34 250 - - 250 10 -18 4.2%
Fair value hedge, hedge of borrowingsUSD 14 - 900 - - 900 -9 14 4.0%
Cash flow hedge, hedge of borrowingsEUR 23 60 867 - 447 420 - -17 3.9%GBP - 52 302 - - 302 - -1 4.6%NOK - 27 341 - 341 - - -4 3.5%USD 82 98 1,182 - 730 452 - -12 2.4%Total 146 331 4,873 92 1,742 3,039 -54 -16
95 A.P. Moller - Maersk Annual Report 2020 Financials Consolidated financial statements Notes index Amounts in USD million

Table 16.8Oil price riskThe majority of the Group’s trading of commodity prod-ucts is related to inventory stocks of crude oil and bunker oil, as the products are bought in large quantities and stored for processing and resale. The oil price risk arising from these oil price exposures is mitigated by entering into commodity derivative agreements. The overall risk limit is set in the Group’s risk policy, defining a maximum net open position for the Group. The sensitivity of the consolidated net open position is calculated daily on a one day Value-at-Risk (VaR) with a confidence level of 95% and 255 days of historical observations. The Group VaR limit is USD 6m, and position as of 31 December 2020 of USD 3m (USD 3m). Due to the use of portfolio hedg-ing, the Group does not use hedge accounting for these hedges. All gains and losses regarding these hedges are recognised in other income or other cost on a net basis, due to the nature of the hedging model.
Note 16 Financial instruments and risks – continuedTable 16.7 Carrying amount Next interest rate fixing
Borrowings by interest rate levels inclusive of interest rate swaps 0-1 year 2-4 years 5- years
20200-3% 4,560 4,381 -208 3873-6% 9,902 884 4,648 4,370
6%- 911 117 250 544Total 15,373 5,382 4,690 5,301
Of which:Bearing fixed interest 11,580Bearing floating interest 3,793
20190-3% 1,829 1,342 - 4873-6% 13,994 5,038 4,673 4,2836%- 930 106 253 571Total 16,753 6,486 4,926 5,341
Of which:Bearing fixed interest 11,584Bearing floating interest 5,169
Table 16.8 Maturity
Commodity hedges Fair value 0-1 year 2-4 years 5- years
2020Commodity swaps -13 -13 - -Commodity futures -19 -19 - -Commodity options 11 - 11 -Total -21 -32 11 -
2019Commodity swaps -12 -12 - -Commodity futures -13 -13 - -Commodity options - - - -Total -25 -25 - -
96 A.P. Moller - Maersk Annual Report 2020 Financials Consolidated financial statements Notes index Amounts in USD million
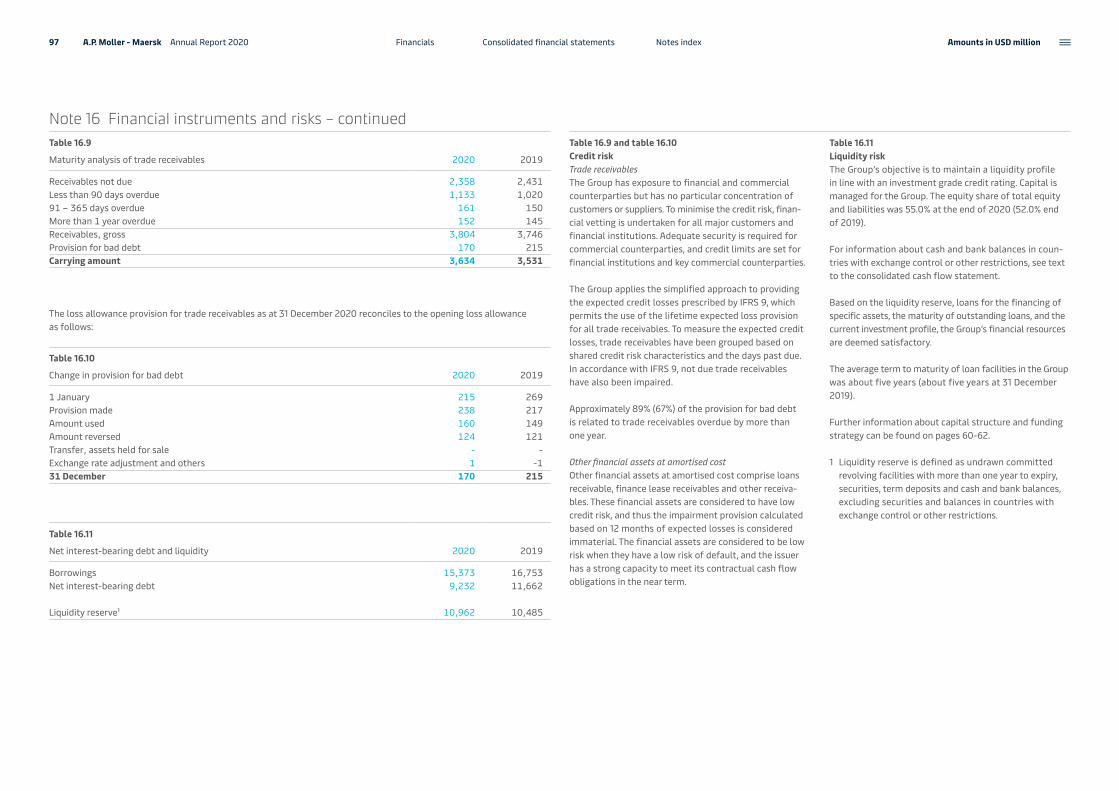
Table 16.9 and table 16.10Credit riskTrade receivablesThe Group has exposure to financial and commercial counterparties but has no particular concentration of customers or suppliers. To minimise the credit risk, finan-cial vetting is undertaken for all major customers and financial institutions. Adequate security is required for commercial counterparties, and credit limits are set for financial institutions and key commercial counterparties.
The Group applies the simplified approach to providing the expected credit losses prescribed by IFRS 9, which permits the use of the lifetime expected loss provision for all trade receivables. To measure the expected credit losses, trade receivables have been grouped based on shared credit risk characteristics and the days past due. In accordance with IFRS 9, not due trade receivables have also been impaired.
Approximately 89% (67%) of the provision for bad debt is related to trade receivables overdue by more than one year.
Other financial assets at amortised costOther financial assets at amortised cost comprise loans receivable, finance lease receivables and other receiva-bles. These financial assets are considered to have low credit risk, and thus the impairment provision calculated based on 12 months of expected losses is considered immaterial. The financial assets are considered to be low risk when they have a low risk of default, and the issuer has a strong capacity to meet its contractual cash flow obligations in the near term.
Table 16.11Liquidity riskThe Group’s objective is to maintain a liquidity profile in line with an investment grade credit rating. Capital is managed for the Group. The equity share of total equity and liabilities was 55.0% at the end of 2020 (52.0% end of 2019).
For information about cash and bank balances in coun-tries with exchange control or other restrictions, see text to the consolidated cash flow statement.
Based on the liquidity reserve, loans for the financing of specific assets, the maturity of outstanding loans, and the current investment profile, the Group’s financial resources are deemed satisfactory.
The average term to maturity of loan facilities in the Group was about five years (about five years at 31 December 2019).
Further information about capital structure and funding strategy can be found on pages 60-62.
1 Liquidity reserve is defined as undrawn committed revolving facilities with more than one year to expiry, securities, term deposits and cash and bank balances, excluding securities and balances in countries with exchange control or other restrictions.
Note 16 Financial instruments and risks – continuedTable 16.9
Maturity analysis of trade receivables 2020 2019
Receivables not due 2,358 2,431Less than 90 days overdue 1,133 1,02091 – 365 days overdue 161 150More than 1 year overdue 152 145Receivables, gross 3,804 3,746Provision for bad debt 170 215Carrying amount 3,634 3,531
The loss allowance provision for trade receivables as at 31 December 2020 reconciles to the opening loss allowance as follows:
Table 16.10
Change in provision for bad debt 2020 2019
1 January 215 269Provision made 238 217Amount used 160 149Amount reversed 124 121Transfer, assets held for sale - - Exchange rate adjustment and others 1 -131 December 170 215
Table 16.11
Net interest-bearing debt and liquidity 2020 2019
Borrowings 15,373 16,753Net interest-bearing debt 9,232 11,662
Liquidity reserve1 10,962 10,485
97 A.P. Moller - Maersk Annual Report 2020 Financials Consolidated financial statements Notes index Amounts in USD million

Table 16.12It is of great importance for the Group to maintain a financial reserve to cover the Group’s obligations and investment opportunities and to provide the capital necessary to offset changes in the Group’s liquidity due to changes in the cash flow from operating activities.
The flexibility of the financial reserve is subject to ongoing prioritisation and optimisation, among other things by focusing on the release of capital and following up on the development in working capital.
Note 16 Financial instruments and risks – continuedTable 16.12 Carrying
amountCash flows including interest
Maturities of liabilities and commitments 0-1 year 2-4 years 5- years Total
2020Bank and other credit institutions 2,802 476 1,135 1,502 3,113Lease liabilities 8,747 1,791 4,832 5,360 11,983 – hereof interest 400 1,140 1,695 3,235Issued bonds 3,824 461 2,108 1,909 4,478Trade payables 5,156 5,156 - - 5,156Other payables 1,360 1,279 69 12 1,360Non-derivative financial liabilities 21,889 9,163 8,144 8,783 26,090Derivatives 517 228 134 155 517Total recognised in balance sheet 22,406 9,391 8,278 8,938 26,607
Capital commitments 508 713 518 1,739Total 9,899 8,991 9,456 28,346
2019Bank and other credit institutions 3,357 564 2,074 1,291 3,929Lease liabilities 8,577 1,725 5,046 5,326 12,097 – hereof interest 444 1,331 1,745 3,520Issued bonds 4,819 429 2,295 2,901 5,625Trade payables 5,567 5,567 - - 5,567Other payables 1,214 1,170 32 12 1,214Non-derivative financial liabilities 23,534 9,455 9,447 9,530 28,432Derivatives 415 87 98 230 415Total recognised in balance sheet 23,949 9,542 9,545 9,760 28,847
Capital commitments 570 531 642 1,743Total 10,112 10,076 10,402 30,590
98 A.P. Moller - Maersk Annual Report 2020 Financials Consolidated financial statements Notes index Amounts in USD million
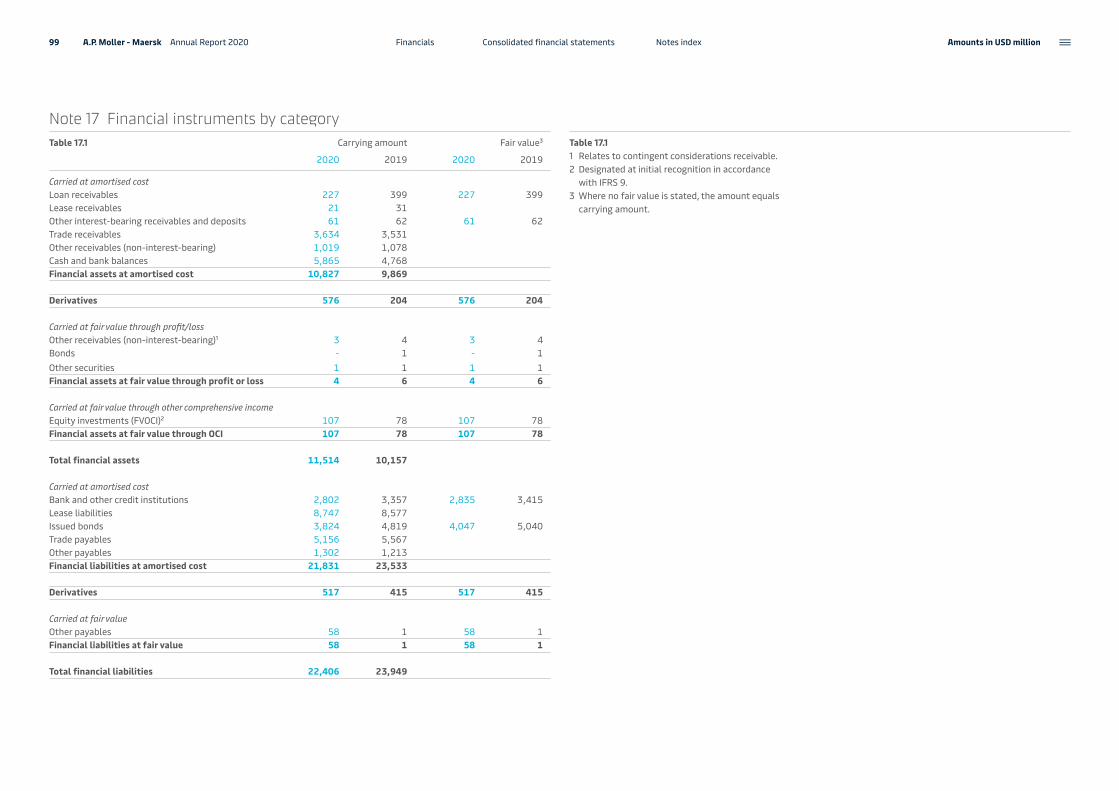
Note 17 Financial instruments by categoryTable 17.1 Carrying amount Fair value3
2020 2019 2020 2019
Carried at amortised costLoan receivables 227 399 227 399Lease receivables 21 31Other interest-bearing receivables and deposits 61 62 61 62Trade receivables 3,634 3,531Other receivables (non-interest-bearing) 1,019 1,078Cash and bank balances 5,865 4,768Financial assets at amortised cost 10,827 9,869
Derivatives 576 204 576 204
Carried at fair value through profit/lossOther receivables (non-interest-bearing)1 3 4 3 4Bonds - 1 - 1Other securities 1 1 1 1Financial assets at fair value through profit or loss 4 6 4 6
Carried at fair value through other comprehensive incomeEquity investments (FVOCI)2 107 78 107 78Financial assets at fair value through OCI 107 78 107 78
Total financial assets 11,514 10,157
Carried at amortised costBank and other credit institutions 2,802 3,357 2,835 3,415Lease liabilities 8,747 8,577Issued bonds 3,824 4,819 4,047 5,040Trade payables 5,156 5,567Other payables 1,302 1,213Financial liabilities at amortised cost 21,831 23,533
Derivatives 517 415 517 415
Carried at fair valueOther payables 58 1 58 1Financial liabilities at fair value 58 1 58 1
Total financial liabilities 22,406 23,949
Table 17.11 Relates to contingent considerations receivable.2 Designated at initial recognition in accordance
with IFRS 9.3 Where no fair value is stated, the amount equals
carrying amount.
99 A.P. Moller - Maersk Annual Report 2020 Financials Consolidated financial statements Notes index Amounts in USD million

Note 17 Financial instruments by category – continuedTable 17.2
Movement during the year in level 3
Other equityinvestments
(FVOCI)
Other receivables
Total financial
assets
Other payables
Total financial liabilities
Carrying amount 1 January 2019 26 4 30 - -Addition 38 -1 37 - - Disposal - - - - - Gains/losses recognised in the income statement - - - 1 1Gains/losses recognised in other comprehensive income -3 - -3 - - Transfer, assets held for sale -0 - -0 - - Exchange rate adjustment, etc. -2 -2 - - Carrying amount 31 December 2019 59 3 62 1 1
Addition 32 - 32 55 55Disposal 4 - 4 - - Gains/losses recognised in the income statement - - - 3 3Gains/losses recognised in other comprehensive income 2 - 2 - - Transfer, assets held for sale - - - - - Exchange rate adjustment, etc. - - - -1 -1Carrying amount 31 December 2020 89 3 92 58 58
Table 17.2Financial instruments measured at fair valueFinancial instruments measured at fair value can be divided into three levels:
Level 1 — Quoted prices (unadjusted) in active markets for identical assets or liabilities,
Level 2 — Inputs other than quoted prices included within level 1 that are observable for the asset or liability, either directly (i.e. as prices) or indirectly (i.e. derived from prices) and
Level 3 — Inputs for the asset or liability that are not based on observable market data.
Fair value of listed securities is within level 1 of the fair value hierarchy. Non-listed shares and other securities are within level 3 of the fair value hierarchy.
Fair value of derivatives is mainly within level 2 of the fair value hierarchy and is calculated based on observable market data as of the end of the reporting period. A minor amount of crude oil price derivatives is within level 1 of the fair value hierarchy.
Fair value of level 3 assets and liabilities is primarily based on the present value of expected future cash flows.
A reasonably possible change in the discount rate is not estimated to affect the Group’s profit or equity signifi-cantly.
Financial instruments carried at amortised costFair value of the short-term financial assets and other financial liabilities carried at amortised cost is not mate-rially different from the carrying amount. In general, fair value is determined primarily based on the present value of expected future cash flows. Where a market price was available, however, this was deemed to be the fair value.
Fair value of listed issued bonds is within level 1 of the fair value hierarchy. Fair value of the remaining borrowing items is within level 2 of the fair value hierarchy, and is calculated based on discounted future cash flows.
100 A.P. Moller - Maersk Annual Report 2020 Financials Consolidated financial statements Notes index Amounts in USD million

Note 18 Commitments – continuing operationsThe future charter and operating lease payments are:
Table 18.1
Lease commitments
Ocean Logistics & Services
Terminals & Towage
Manu-facturing & Others
Total
2020Within one year 152 2 19 4 177Total 152 2 19 4 177
2019Within one year 79 23 24 91 217Total 79 23 24 91 217
Table 18.2
Capital commitments
Ocean Logistics & Services
Terminals & Towage
Manu-facturing & Others
Total
2020Capital commitments relating to the acquisition of non-current assets 311 - 162 8 481Commitments towards concession grantors 294 - 964 - 1,258Total capital commitments 605 - 1,126 8 1,739
2019Capital commitments relating to the acquisition of non-current assets 345 12 202 2 561Commitments towards concession grantors 269 - 913 - 1,182Total capital commitments 614 12 1,115 2 1,743
Table 18.1Operating lease commitmentsAs part of the Group’s activities, customary agreements are entered into regarding charter and operating leases of ships, containers, port facilities, etc. From 1 January 2019, the Group has recognised right-of-use assets for these leases, except for short-term and low-value leases, see note 8 for further information.
Table 18.2, table 18.3 and table 18.4The decrease in capital commitments is primarily related to contractual payments during 2020.
USD 1.7bn relates to investments mainly within the Ocean and Terminals & Towage segments. Commitments related to the newbuilding programme for tugs is USD 18m.
101 A.P. Moller - Maersk Annual Report 2020 Financials Consolidated financial statements Notes index Amounts in USD million
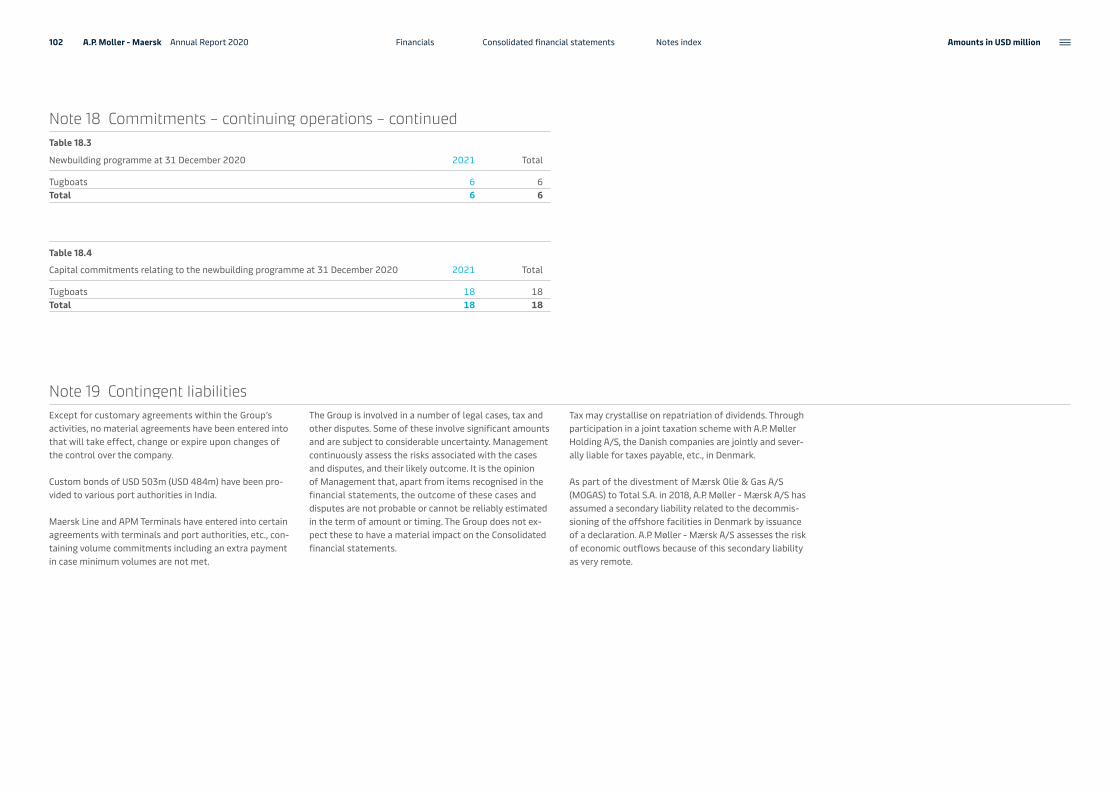
Note 18 Commitments – continuing operations – continuedTable 18.3
Newbuilding programme at 31 December 2020 2021 Total
Tugboats 6 6Total 6 6
Table 18.4
Capital commitments relating to the newbuilding programme at 31 December 2020 2021 Total
Tugboats 18 18Total 18 18
Except for customary agreements within the Group’s activities, no material agreements have been entered into that will take effect, change or expire upon changes of the control over the company.
Custom bonds of USD 503m (USD 484m) have been pro-vided to various port authorities in India.
Maersk Line and APM Terminals have entered into certain agreements with terminals and port authorities, etc., con-taining volume commitments including an extra payment in case minimum volumes are not met.
The Group is involved in a number of legal cases, tax and other disputes. Some of these involve significant amounts and are subject to considerable uncertainty. Management continuously assess the risks associated with the cases and disputes, and their likely outcome. It is the opinion of Management that, apart from items recognised in the financial statements, the outcome of these cases and disputes are not probable or cannot be reliably estimated in the term of amount or timing. The Group does not ex-pect these to have a material impact on the Consolidated financial statements.
Tax may crystallise on repatriation of dividends. Through participation in a joint taxation scheme with A.P. Møller Holding A/S, the Danish companies are jointly and sever-ally liable for taxes payable, etc., in Denmark.
As part of the divestment of Mærsk Olie & Gas A/S (MOGAS) to Total S.A. in 2018, A.P. Møller - Mærsk A/S has assumed a secondary liability related to the decommis-sioning of the offshore facilities in Denmark by issuance of a declaration. A.P. Møller - Mærsk A/S assesses the risk of economic outflows because of this secondary liability as very remote.
Note 19 Contingent liabilities
102 A.P. Moller - Maersk Annual Report 2020 Financials Consolidated financial statements Notes index Amounts in USD million

Note 20 Cash flow specificationsTable 20.1 2020 2019
Change in working capitalTrade receivables -115 195Other working capital movements -88 291Exchange rate adjustment of working capital -36 -10Total -239 476
Purchase of intangible assets and property, plant and equipmentAddition -2,929 -9,757Of which right-of-use assets, etc. 1,575 7,989Of which borrowing costs capitalised on assets 7 23Change in payables to suppliers regarding purchase of assets 25 -290Total -1,322 -2,035
Note 21 Acquisition/sale of subsidiaries and activitiesTable 21.1
Cash flow from acquisition Performance Team KGH Pipavav Total 2020
Fair value at time of acquisitionIntangible assets 192 161 240 593Property, plant and equipment 326 9 260 595Financial assets 2 1 48 51Deferred tax assets - 3 - 3Current assets 49 50 120 219Provisions -2 -9 -3 -14Liabilities -345 -155 -125 -625Net assets acquired 222 60 540 822Non-controlling interests - - -308 -308A.P. Møller - Mærsk A/S’ share 222 60 232 514Goodwill 95 172 - 267Gain on business acquisition - - -46 -46Purchase price 317 232 186 735Contingent consideration assumed -10 -44 - -54Derecognition of associate company - - -182 -182Cash and bank balances assumed 2 -16 -92 -106Cash flow used for acquisition of subsidiaries and activities 309 172 -88 393
Table 21.1Acquisitions during the year 2020Performance Team LLCOn 1 April 2020, the Group acquired 100% of the shares in Performance Team LLC, a US-based warehousing and distribution company, to further strengthen its capabili-ties as an integrated container logistics company, offering end-to-end supply chain solutions to its customers.
Taking control of Performance Team LLC has positioned A.P. Moller - Maersk among North America’s leading ware-house and distribution providers with 56 warehouses for customers and accelerates the company’s regional logis-tics and services model.
The total enterprise value of USD 622m consisted of a total purchase price of USD 317m on a cash and debt-free basis and acquired lease liabilities of around USD 305m. The purchase price mainly relates to fixed assets and customer list. The lease liabilities have been adjusted in accordance with IFRS 16 from the last communication.
The goodwill of USD 95m is attributable to workforce and commercial/operational synergies between Performance Team and A.P. Moller - Maersk and is deductible for tax purposes.
From the acquisition date to 31 December 2020, Perfor-mance Team LLC contributed with a revenue of USD 398m and a minor contribution to net profit.
If the acquisition had occurred on 1 January 2020, the im-pact on the Group’s revenue would have been USD 512m. The net profit contributed to the Group would have been minor.
The accounting for the business combination is consid-ered provisional at 31 December 2020 due to certain contingencies, indemnities etc.
103 A.P. Moller - Maersk Annual Report 2020 Financials Consolidated financial statements Notes index Amounts in USD million

Gujarat Pipavav Port LtdThe Group had a stake of 43.01% in Gujarat Pipavav Port Ltd (GPPL) and treated the entity as an associated com-pany. On 9 June 2020, the Group obtained the majority of seats on the Board of Directors of GPPL, thereby obtain-ing control of the entity.
The acquisition consists of net assets of USD 540m at fair value of which USD 240m is terminal rights and non-con-trolling interest of USD 308m, offset by the derecognition of associate company of USD 182m. A gain of USD 45m was recognised for disposing GPPL as an associate, and the cumulative translation reserve loss of USD 61m related to the associate was also recycled to profit/loss. Liquid funds acquired amounted to USD 92m. On the date of acquisi-tion, the fair value of the net assets acquired exceeded the listed share price, therefore, the transaction has been reported as the bargain purchase. The gain from bargain purchase has been reported at USD 46m.
From the acquisition date to 31 December 2020, Pipavav terminal contributed positively to the results with a revenue of USD 59m. If the acquisition had occurred on 1 January 2020, the impact on the Group’s revenue would have been USD 95m.
The accounting for the business combination is consid-ered provisional at 31 December 2020.
Dovana Holdings AB (KGH Customs Service Group)On 1 September 2020, the Group acquired 100% of the shares in Dovana Holding AB, KGH Customs Services, a leading Sweden-based specialist in trade and customs services management in Europe, further enhancing its
capabilities as an integrated container logistics company, offering end-to-end supply chain solutions to its global customers.
The total enterprise value of USD 294m consisted of a total purchase price of USD 288m on a cash and debt-free basis and acquired lease liabilities of around USD 6m.
Out of the purchase price of USD 288m, debt of USD 100m has been deducted, and discounted maximum earn-out of USD 45m has been added to arrive at the USD 233m in aggregate purchase consideration as reported.
The goodwill of USD 172m is mainly attributable to the synergies between KGH Customs Services and A.P. Moller - Maersk.
From the acquisition date to 31 December 2020, KGH Customs Services contributed positively to the results. If the acquisition had occurred on 1 January 2020, the impact on the Group’s revenue would have been USD 91m.
The accounting for the business combination is consid-ered provisional at 31 December 2020 due to certain contingencies, indemnities, etc.
In addition to the above acquisitions, there has been a small acquisition in Terminals & Towage and therefore the total of all acquisitions sums up to USD 425m.
For the year 2020, total acquisition cost for the acquisitions recognised in the income statement amounted to USD 8m.
Acquisitions during 2019No acquisitions of subsidiaries or activities, to an extent of significance to the Group, were completed in 2019.
Sales during 2020No material external sales were performed during 2020.
Sales during 2019No material external sales were performed during 2019.
Note 21 Acquisition/sale of subsidiaries and activities – continued
104 A.P. Moller - Maersk Annual Report 2020 Financials Consolidated financial statements Notes index Amounts in USD million
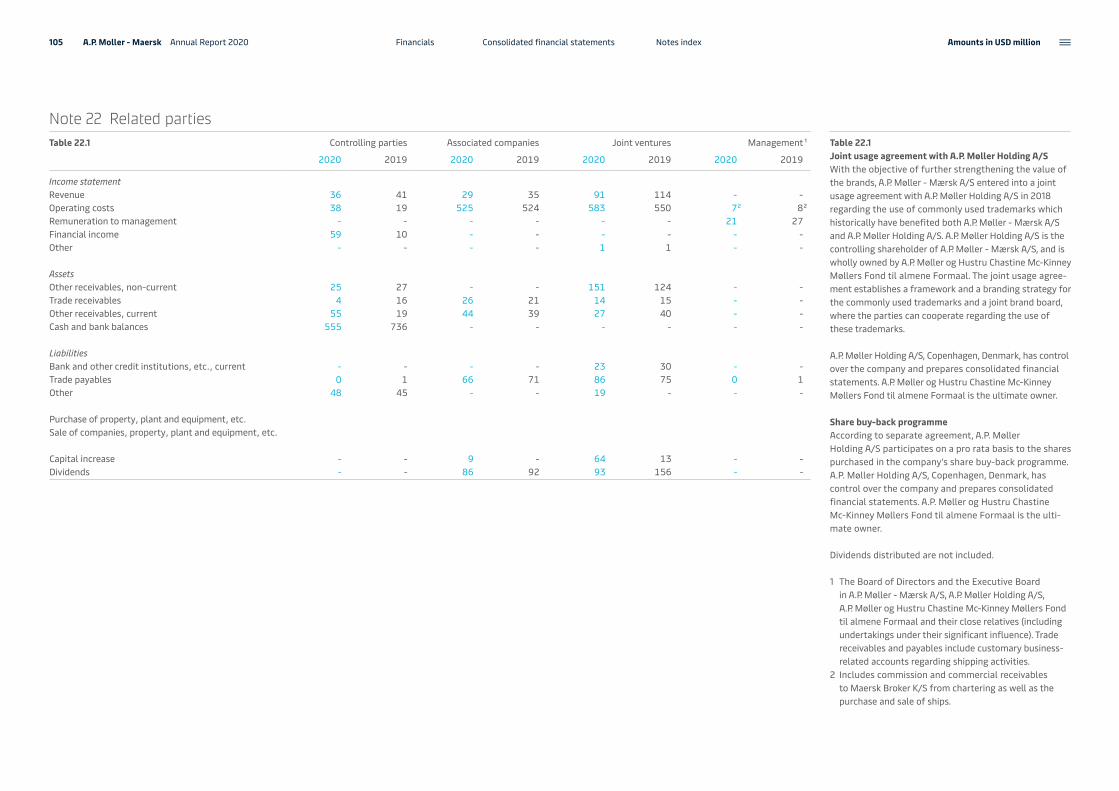
Note 22 Related partiesTable 22.1 Controlling parties Associated companies Joint ventures Management 1
2020 2019 2020 2019 2020 2019 2020 2019
Income statementRevenue 36 41 29 35 91 114 - -Operating costs 38 19 525 524 583 550 72 82Remuneration to management - - - - - - 21 27Financial income 59 10 - - - - - -Other - - - - 1 1 - -
AssetsOther receivables, non-current 25 27 - - 151 124 - -Trade receivables 4 16 26 21 14 15 - -Other receivables, current 55 19 44 39 27 40 - -Cash and bank balances 555 736 - - - - - -
LiabilitiesBank and other credit institutions, etc., current - - - - 23 30 - -Trade payables 0 1 66 71 86 75 0 1Other 48 45 - - 19 - - -
Purchase of property, plant and equipment, etc.Sale of companies, property, plant and equipment, etc.
Capital increase - - 9 - 64 13 - -Dividends - - 86 92 93 156 - -
Table 22.1Joint usage agreement with A.P. Møller Holding A/SWith the objective of further strengthening the value of the brands, A.P. Møller - Mærsk A/S entered into a joint usage agreement with A.P. Møller Holding A/S in 2018 regarding the use of commonly used trademarks which historically have benefited both A.P. Møller - Mærsk A/S and A.P. Møller Holding A/S. A.P. Møller Holding A/S is the controlling shareholder of A.P. Møller - Mærsk A/S, and is wholly owned by A.P. Møller og Hustru Chastine Mc-Kinney Møllers Fond til almene Formaal. The joint usage agree-ment establishes a framework and a branding strategy for the commonly used trademarks and a joint brand board, where the parties can cooperate regarding the use of these trademarks.
A.P. Møller Holding A/S, Copenhagen, Denmark, has control over the company and prepares consolidated financial statements. A.P. Møller og Hustru Chastine Mc-Kinney Møllers Fond til almene Formaal is the ultimate owner.
Share buy-back programmeAccording to separate agreement, A.P. Møller Holding A/S participates on a pro rata basis to the shares purchased in the company’s share buy-back programme.A.P. Møller Holding A/S, Copenhagen, Denmark, has control over the company and prepares consolidated financial statements. A.P. Møller og Hustru Chastine Mc-Kinney Møllers Fond til almene Formaal is the ulti-mate owner.
Dividends distributed are not included.
1 The Board of Directors and the Executive Board in A.P. Møller - Mærsk A/S, A.P. Møller Holding A/S, A.P. Møller og Hustru Chastine Mc-Kinney Møllers Fond til almene Formaal and their close relatives (including undertakings under their significant influence). Trade receivables and payables include customary business- related accounts regarding shipping activities.
2 Includes commission and commercial receivables to Maersk Broker K/S from chartering as well as the purchase and sale of ships.
105 A.P. Moller - Maersk Annual Report 2020 Financials Consolidated financial statements Notes index Amounts in USD million

Basis of preparationThe consolidated financial statements for 2020 for A.P. Moller - Maersk have been prepared on a going con-cern basis and in accordance with the International Finan-cial Reporting Standards (IFRS) as adopted by the EU and additional Danish disclosure requirements for listed com-panies. The consolidated financial statements are also in accordance with IFRS as issued by the International Accounting Standards Board (IASB).
The consolidated financial statements of A.P. Moller - Maersk are included in the consolidated financial statements of A.P. Møller Holding A/S.
The accounting policies are consistent with those applied in the consolidated financial statements for 2019, except for the changes to the accounting standards that were ef-fective from 1 January 2020 and were endorsed by the EU.
iXBRL reportingFrom 2020, A.P. Møller - Mærsk A/S is required to file the annual report in the new European Single Electronic Format (ESEF) and the annual report in 2020 is therefore prepared in the XHTML format that can be displayed in a standard browser. The primary statements in the consolidated financial statements are tagged using inline eXtensible Business Reporting Language (iXBRL). The iXBRL tags comply with the ESEF taxonomy, which is included in the ESEF Regulation and developed based on the IFRS taxonomy published by the IFRS Foundation. Where a financial statement line item is not defined in the ESEF taxonomy, an extension to the taxonomy has been created. Extensions are anchored to elements in the ESEF taxonomy, except for extensions which are subtotals.
The annual report submitted to the Danish Financial Supervisory Authority consists of the XHTML document together with certain technical files, all included in a file named APMM-2020-12-31.zip.
Change to reportable segmentsAs part of the refinement of A.P. Moller - Maersk’s seg-ment structure to further align with internal management structure and demarcation between the reportable seg-ment activities, a number of changes have been made.
The main changes involve moving the Maersk Oil Trading activity to the Ocean segment from Manufacturing & Others, and the intermodal activity in Hamburg Süd to Logistics & Services from Ocean.
Comparison figures for note 1 have been restated as if the changes had been implemented in 2019. The reportable segments are disclosed below.
A number of changes to accounting standards are effec-tive from 1 January 2020 and endorsed by the EU:• Amendments to IAS 1 and IAS 8: Definition of Material• Amendments to IFRS 3: Business Combinations.
A.P. Moller - Maersk follows the guidelines in the above amendments, and the implementation did not change the accounting policies.
ConsolidationThe consolidated financial statements comprise the parent company A.P. Møller - Mærsk A/S, its subsidiaries and proportionate shares in joint arrangements classified as joint operations.
Subsidiaries are entities controlled by A.P. Møller - Mærsk A/S. Control is based on the power to direct the relevant activities of an entity and the exposure, or right, to variable returns arising from it. In that connec-tion, relevant activities are those that significantly affect the investee’s returns. Control is usually achieved by directly or indirectly owning or in other ways controlling more than 50% of the voting rights or by other rights, such as agreements on management control.
Joint arrangements are entities in which A.P. Moller - Maersk, according to contractual agree-ments with one or more other parties, has joint control. The arrangements are classified as joint ventures, if the contracting parties’ rights are limited to net assets in the separate legal entities, and as joint operations, if the parties have direct and unlimited rights to the assets and obligations for the liabilities of the arrangement.
Entities in which A.P. Moller - Maersk exercises a signifi-cant but non-controlling influence are considered associ-
ated companies. A significant influence is usually achieved by directly or indirectly owning or controlling 20-50% of the voting rights. Agreements and other circumstances are considered when assessing the degree of influence.
Consolidation is performed by summarising the financial statements of the parent company and its subsidiaries, including the proportionate share of joint operations, part-owned vessels and pool arrangements, which have been prepared in accordance with A.P. Moller - Maersk’s accounting policies. Intra-group income and expenses, shareholdings, dividends, intra-group balances and gains on intra-group transactions are eliminated. Unrealised gains on transactions with associated companies and joint arrangements are eliminated in proportion to A.P. Moller - Maersk’s ownership share. Unrealised losses are eliminated in the same way, unless they indicate impairment.
Non-controlling interests’ share of profit/loss for the year and of equity in subsidiaries is included as part of A.P. Moller - Maersk’s profit and equity respectively, but shown as separate items.
Foreign currency translationThe consolidated financial statements are presented in USD, the functional currency of the parent company. In the translation to the presentation currency for subsidiaries, associates or joint arrangements with functional curren-cies other than USD, the total comprehensive income is translated into USD at average exchange rates, and the balance sheet is translated at the exchange rates as at the balance sheet date. Exchange rate differences arising from such translations are recognised directly in other compre-hensive income and in a separate reserve of equity.
The functional currency varies from business area to business area. For A.P. Moller - Maersk’s principal shipping activities, the functional currency is typically USD. This means, among other things, that the carrying amounts of property, plant and equipment and intangible assets and, hence, depreciation and amortisation, are main-tained in USD from the date of acquisition. For other activities, including container terminal activities and land-based container activities, the functional currency
is generally the local currency of the country in which such activities are performed, unless circumstances suggest a different currency is appropriate.
Transactions in currencies other than the functional cur-rency are translated at the exchange rate prevailing at the date of the transaction. Monetary items in foreign curren-cies not settled at the balance sheet date are translated at the exchange rate as at the balance sheet date. Foreign exchange gains and losses are included in the income statement as financial income or expenses.
Segment informationThe allocation of business activities into segments reflects A.P. Moller - Maersk’s character as an integrated container logistics business and is in line with the internal manage-ment reporting. The reportable segments are as follows:
Ocean Global container shipping activities including strategic transhipment hubs and sale of bunker oil
Logistics & Services
Freight forwarding, supply chain management, inland haulage and other logistics services
Terminals & Towage
Gateway terminal activities, towage and related marine activities
Manufacturing & Others
Production of reefer and dry containers, providing off-shore supply service and trading and other businesses
Operating segments have not been aggregated.
The reportable segments comprise:
OceanOcean activities Activities under Maersk Line, Safmarine, Sealand – A Maersk company, and Hamburg Süd brands with Ocean container freight being the main revenue stream. Ocean container freight is defined as the cost-per-weight measure of transporting goods on board a container vessel across the ocean, including demurrage and detention, terminal handling, documentation services, container services as well as container storage.
Note 23 Significant accounting policies
106 A.P. Moller - Maersk Annual Report 2020 Financials Consolidated financial statements Notes index Amounts in USD million
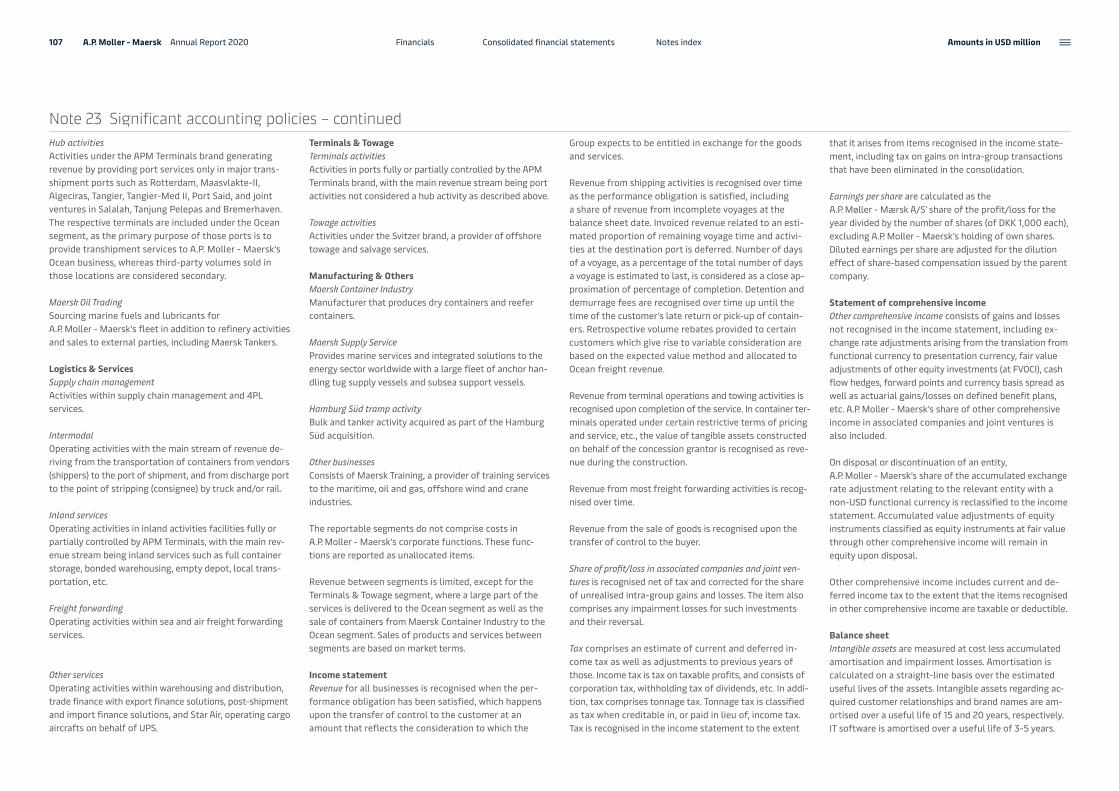
Hub activitiesActivities under the APM Terminals brand generating revenue by providing port services only in major trans-shipment ports such as Rotterdam, Maasvlakte-II, Algeciras, Tangier, Tangier-Med II, Port Said, and joint ventures in Salalah, Tanjung Pelepas and Bremerhaven. The respective terminals are included under the Ocean segment, as the primary purpose of those ports is to provide transhipment services to A.P. Moller - Maersk’s Ocean business, whereas third-party volumes sold in those locations are considered secondary.
Maersk Oil TradingSourcing marine fuels and lubricants for A.P. Moller - Maersk’s fleet in addition to refinery activities and sales to external parties, including Maersk Tankers.
Logistics & ServicesSupply chain managementActivities within supply chain management and 4PL services.
IntermodalOperating activities with the main stream of revenue de-riving from the transportation of containers from vendors (shippers) to the port of shipment, and from discharge port to the point of stripping (consignee) by truck and/or rail.
Inland servicesOperating activities in inland activities facilities fully or partially controlled by APM Terminals, with the main rev-enue stream being inland services such as full container storage, bonded warehousing, empty depot, local trans-portation, etc.
Freight forwardingOperating activities within sea and air freight forwarding services.
Other servicesOperating activities within warehousing and distribution, trade finance with export finance solutions, post-shipment and import finance solutions, and Star Air, operating cargo aircrafts on behalf of UPS.
Terminals & TowageTerminals activitiesActivities in ports fully or partially controlled by the APM Terminals brand, with the main revenue stream being port activities not considered a hub activity as described above.
Towage activitiesActivities under the Svitzer brand, a provider of offshore towage and salvage services.
Manufacturing & OthersMaersk Container IndustryManufacturer that produces dry containers and reefer containers.
Maersk Supply Service Provides marine services and integrated solutions to the energy sector worldwide with a large fleet of anchor han-dling tug supply vessels and subsea support vessels.
Hamburg Süd tramp activityBulk and tanker activity acquired as part of the Hamburg Süd acquisition.
Other businessesConsists of Maersk Training, a provider of training services to the maritime, oil and gas, offshore wind and crane industries.
The reportable segments do not comprise costs in A.P. Moller - Maersk’s corporate functions. These func-tions are reported as unallocated items.
Revenue between segments is limited, except for the Terminals & Towage segment, where a large part of the services is delivered to the Ocean segment as well as the sale of containers from Maersk Container Industry to the Ocean segment. Sales of products and services between segments are based on market terms.
Income statementRevenue for all businesses is recognised when the per-formance obligation has been satisfied, which happens upon the transfer of control to the customer at an amount that reflects the consideration to which the
Group expects to be entitled in exchange for the goods and services.
Revenue from shipping activities is recognised over time as the performance obligation is satisfied, including a share of revenue from incomplete voyages at the balance sheet date. Invoiced revenue related to an esti-mated proportion of remaining voyage time and activi-ties at the destination port is deferred. Number of days of a voyage, as a percentage of the total number of days a voyage is estimated to last, is considered as a close ap-proximation of percentage of completion. Detention and demurrage fees are recognised over time up until the time of the customer’s late return or pick-up of contain-ers. Retrospective volume rebates provided to certain customers which give rise to variable consideration are based on the expected value method and allocated to Ocean freight revenue.
Revenue from terminal operations and towing activities is recognised upon completion of the service. In container ter-minals operated under certain restrictive terms of pricing and service, etc., the value of tangible assets constructed on behalf of the concession grantor is recognised as reve-nue during the construction.
Revenue from most freight forwarding activities is recog-nised over time.
Revenue from the sale of goods is recognised upon the transfer of control to the buyer.
Share of profit/loss in associated companies and joint ven-tures is recognised net of tax and corrected for the share of unrealised intra-group gains and losses. The item also comprises any impairment losses for such investments and their reversal.
Tax comprises an estimate of current and deferred in-come tax as well as adjustments to previous years of those. Income tax is tax on taxable profits, and consists of corporation tax, withholding tax of dividends, etc. In addi-tion, tax comprises tonnage tax. Tonnage tax is classified as tax when creditable in, or paid in lieu of, income tax. Tax is recognised in the income statement to the extent
that it arises from items recognised in the income state-ment, including tax on gains on intra-group transactions that have been eliminated in the consolidation.
Earnings per share are calculated as the A.P. Møller - Mærsk A/S’ share of the profit/loss for the year divided by the number of shares (of DKK 1,000 each), excluding A.P. Moller - Maersk’s holding of own shares. Diluted earnings per share are adjusted for the dilution effect of share-based compensation issued by the parent company.
Statement of comprehensive incomeOther comprehensive income consists of gains and losses not recognised in the income statement, including ex-change rate adjustments arising from the translation from functional currency to presentation currency, fair value adjustments of other equity investments (at FVOCI), cash flow hedges, forward points and currency basis spread as well as actuarial gains/losses on defined benefit plans, etc. A.P. Moller - Maersk’s share of other comprehensive income in associated companies and joint ventures is also included.
On disposal or discontinuation of an entity, A.P. Moller - Maersk’s share of the accumulated exchange rate adjustment relating to the relevant entity with a non-USD functional currency is reclassified to the income statement. Accumulated value adjustments of equity instruments classified as equity instruments at fair value through other comprehensive income will remain in equity upon disposal.
Other comprehensive income includes current and de-ferred income tax to the extent that the items recognised in other comprehensive income are taxable or deductible.
Balance sheetIntangible assets are measured at cost less accumulated amortisation and impairment losses. Amortisation is calculated on a straight-line basis over the estimated useful lives of the assets. Intangible assets regarding ac-quired customer relationships and brand names are am-ortised over a useful life of 15 and 20 years, respectively. IT software is amortised over a useful life of 3-5 years.
Note 23 Significant accounting policies – continued
107 A.P. Moller - Maersk Annual Report 2020 Financials Consolidated financial statements Notes index Amounts in USD million

For container terminals operated under certain restrictive price and service conditions, etc., concessional rights to collect usage charges are included under intangible assets. The cost includes the present value of minimum payments under concession agreements and the cost of property, plant and equipment constructed on behalf of a grantor of a concession. The rights are amortised from the com-mencement of operations over the concession period.
Property, plant and equipment are valued at cost less ac-cumulated depreciation and impairment losses. Deprecia-tion is charged to the income statement on a straight-line basis over the useful lives at an estimated residual value. The useful lives of new assets are typically as follows:
Ships, etc. 20-25 years
Containers, etc. 12 years
Buildings 10-50 years
Terminal infrastructure 10-20 years or concession period, if shorter
Plant and machinery, cranes and other terminal equipment 5-20 years
Other operating equipment, fixtures, etc. 3-7 years
Estimated useful lives and residual values are reassessed on a regular basis.
The cost of an asset is divided into separate components, which are depreciated separately if the useful lives of the individual components differ. Dry-docking costs are recog-nised in the carrying amount of ships when incurred and depreciated over the period until the next dry-docking.
The cost of assets constructed by A.P. Moller - Maersk includes directly attributable expenses. For assets with a long construction period, borrowing costs during the construction period from specific as well as general borrowings are attributed to cost. In addition, the cost includes the net present value of estimated costs of re-moval and restoration.
Right-of-use assets: The Group mainly leases vessels, con-tainers, concessions arrangements and real estate prop-erty. Lease contracts for vessels and containers are typ-ically made for fixed periods of about five years but may have extension options as described below. Concession arrangements and real estate contracts are negotiated on an individual basis and contain a wide range of terms and conditions.
Leases are recognised as a right-of-use asset with a cor-responding leases liability at the date on which the leased asset is available for use by the Group. The right-of-use asset is depreciated over the shorter of the asset’s useful life and the lease term on a straight-line basis.
Intercompany leases will continue to be presented ac-cording to IFRS 8 – Segment Reporting, as operating leases in accordance with the old lease standard, IAS 17.
Impairment losses are recognised when the carrying amount of an asset or a cash-generating unit exceeds the higher of the estimated value in use and fair value less costs of disposal. Goodwill is attributed to cash-generat-ing units on acquisition and impaired before other assets.
Intangible assets and property, plant and equipment are tested for impairment if there is an indication of impair-ment. However, annual impairment tests are carried out for goodwill and other intangible assets with indefinite useful lives as well as intangible assets that are not yet in use.
Assets are held for sale, when the carrying amount of an individual non-current asset, or disposal groups, will be re-covered principally through a sale transaction rather than through continuing use. Assets are classified as held for sale when activities to carry out a sale have been initiated, when the activities are available for immediate sale in their present condition, and when the activities are expected to be disposed of within 12 months. Liabilities directly asso-ciated with assets held for sale are presented separately from other liabilities.
Assets held for sale are measured at the lower of car-rying amount immediately before classification as held
for sale and fair value less costs to sell, and impairment tests are performed immediately before classification as held for sale. Non-current assets are not depreciated or amortised while classified as held for sale. Measure-ment of deferred tax and financial assets and liabilities is unchanged.
Investments in associated companies and joint ventures are recognised as A.P. Moller - Maersk’s share of the equity value inclusive of goodwill less any impairment losses. Goodwill is an integral part of the value of associated companies and joint ventures and is therefore subject to an impairment test together with the investment as a whole. Impairment losses are reversed to the extent the original value is considered recoverable.
Equity instruments, etc., including shares, bonds and sim-ilar securities, are recognised on the trading date at fair value, and subsequently measured at the quoted market price for listed securities and at estimated fair value for non-listed securities. Fair value adjustments from equity investments at fair value through other comprehensive income (FVOCI) remain in equity upon disposal. Dividends are recognised in the income statement.
Inventories mainly consist of bunker, containers (manu-facturing), spare parts not qualifying for property, plant and equipment, and other consumables. Inventories are measured at cost, primarily according to the FIFO method. The cost of finished goods and work in progress includes direct and indirect production costs.
Loans and receivables are initially recognised at fair value, plus any direct transaction costs, and subsequently measured at amortised cost using the effective interest method. For loans and other receivables, write-down is made for anticipated losses based on specific individual or group assessments. For trade receivables, the loss al-lowance is measured in accordance with IFRS 9 applying a provision matrix to calculate the minimum impairment. The provision matrix includes an impairment for non-due receivables.
Equity includes total comprehensive income for the year comprising the profit/loss for the year and other com-
prehensive income. Proceeds on the purchase and sale of own shares and dividend from such shares are recognised in equity.
The translation reserve comprises A.P. Moller - Maersk’s share of accumulated exchange rate differences arising on translation from functional currency into presentation currency. The reserve for other equity investments com-prises accumulated changes in the fair value of equity investments (at FVOCI), net of tax. Reserve for hedges includes the accumulated fair value of derivatives qualify-ing for cash flow hedge accounting, net of tax, as well as forward points and currency basis spread.
Equity-settled restricted shares and share options allocated to the executive employees of A.P. Moller - Maersk as part of A.P. Moller - Maersk’s long-term incentive programme are recognised as staff costs over the vesting period at estimated fair value at the grant date and a corresponding adjustment in equity. Cash-settled performance awards allocated to employees below executive levels as part of A.P. Moller - Maersk’s long-term incentive programme are recognised as staff costs over the vesting period and a corresponding adjustment in other payables.
At the end of each reporting period, A.P. Moller - Maersk revises its estimates of the number of awards that are expected to vest based on the non-market vesting condi-tions and service conditions. Any impact of the revision is recognised in the income statement with a corresponding adjustment to equity and other payables.
Provisions are recognised when A.P. Moller - Maersk has a present legal or constructive obligation from past events. The item includes, among other things, legal disputes, provisions for onerous contracts, unfavourable contracts acquired as part of a business combination, as well as provisions for incurred, but not yet reported, incidents under certain insurance programmes, primarily in the US. Provisions are recognised based on best estimates, and are discounted where the time element is significant and where the time of settlement is reasonably determinable.
Pension obligations are the net liabilities of defined ben-efit obligations and the dedicated assets adjusted for
Note 23 Significant accounting policies – continued
108 A.P. Moller - Maersk Annual Report 2020 Financials Consolidated financial statements Notes index Amounts in USD million

the effect of minimum funding and asset ceiling require-ments. Plans with a funding surplus are presented as net assets on the balance sheet. The defined benefit obliga-tions are measured at the present value of expected fu-ture payments to be made in respect of services provided by employees up to the balance sheet date. Plan assets are measured at fair value. The pension cost charged to the income statement consists of calculated amounts for vested benefits and interest in addition to settlement of gains or losses, etc. Interest on plan assets is calculated with the same rates as used for discounting the obliga-tions. Actuarial gains/losses are recognised in other com-prehensive income.
Pension plans where A.P. Moller - Maersk, as part of col-lective bargaining agreements, participates together with other enterprises – so called multi-employer plans – are treated as other pension plans in the financial state-ments. Defined benefit multi-employer plans, where suf-ficient information to apply defined benefit accounting is not available, are treated as defined contribution plans.
Deferred tax is calculated on temporary differences be-tween the carrying amounts and tax bases of assets and liabilities. Deferred tax is not recognised for differences on the initial recognition of assets or liabilities, where at the time of the transaction neither accounting nor taxable profit/loss is affected, unless the differences arise in a business combination. In addition, no deferred tax is rec-ognised for undistributed earnings in subsidiaries, when A.P. Moller - Maersk controls the timing of dividends, and no taxable dividends are currently expected. A deferred tax asset is recognised to the extent that it is probable that it can be utilised within a foreseeable future.
Financial liabilities are initially recognised at fair value less transaction costs. Subsequently, the financial liabilities are measured at amortised cost using the effective inter-est method, whereby transaction costs and any premium or discount are recognised as financial expenses over the term of the liabilities. Fixed interest loans subject to fair value hedge accounting are measured at amortised cost with an adjustment for the fair value of the hedged inter-est component. Liabilities in respect of leases are meas-ured at the interest rate implicit in the lease, if practicable
to determine, or else at A.P. Moller - Maersk’s incremental borrowing rate.
Lease liabilities are initially measured at the present value of the lease payments over the lease term, discounted using the incremental borrowing rate.
The following lease payments are included in the net present value:• fixed payments (including in-substance fixed
payments), less any lease incentives receivable• variable lease payments that are based on an index
or a rate• amounts expected to be payable by the lessee under
residual value guarantees• the exercise price of a purchase option if the lessee is
reasonably certain to exercise that option, and pay-ments of penalties for terminating the lease, if the lease term reflects the lessee exercising that option.
Payments associated with short-term leases and leases of low-value assets are recognised on a straight-line basis as an expense in profit/loss.
Extension and termination options in lease contracts are included in contracts, where A.P. Moller - Maersk will probably exercise the options. These terms are used to maximise operational flexibility in terms of managing contracts. In determining the lease term, management considers all facts and circumstances that create an economic incentive to exercise an extension option, or not exercise a termination option. Extension options (or periods after termination options) are only included in the lease term if the lease is reasonably certain to be extended or not terminated. Most of the extension and termination options held are exercisable only by A.P. Moller - Maersk and not by the respective lessor. This assessment is reviewed if a significant event or a signif-icant change in circumstances occurs which affects this assessment, and which is within the control of the les-see. Where A.P. Moller - Maersk will probably exercise spe-cific purchase options, those options are included in the measurement of the lease liability with corresponding right-of-use asset depreciated over the asset’s useful life rather than lease term.
Lease payments are discounted at the implicit interest rate, to the extent this can be determined, otherwise discounted using incremental borrowing rates (IBRs). A.P. Moller - Maersk’s IBR reflects the Group’s credit risk, leased amount and contract duration, as well as the nature and quality of the asset’s security and economic environment in which the leased assets operate. To de-termine the IBR, where possible, A.P. Moller - Maersk uses recent third-party financing received by the individual lessee as a starting point, with adjustments to reflect changes in financing conditions since that financing was received. Where such financing is not available, A.P. Moller - Maersk uses a build-up approach that starts with a risk-free interest rate adjusted by credit risk and specific risks faced by the lessee such as asset type, geo-graphical risks, etc.
Subsequently, the lease liability is measured at amor-tised cost with each lease payment allocated between the repayment of the liability and financing cost. The finance cost is charged to the income statement over the lease period using the IBR that was used to discount the lease payments.
Derivative financial instrumentsDerivative financial instruments are recognised on the trading date and measured at fair value using generally acknowledged valuation techniques based on relevant observable swap curves and exchange rates.
The effective portion of changes in the value of derivative financial instruments designated to hedge highly proba-ble future transactions is recognised in other comprehen-sive income until the hedged transactions are realised. At that time, the accumulated gains/losses are transferred to the items under which the hedged transactions are rec-ognised. The effective portion of changes in the value of derivative financial instruments used to hedge the value of recognised financial assets and liabilities is recognised in the income statement together with changes in the fair value of the hedged assets or liabilities that can be attrib-uted to the hedging relationship. Currency basis spread and forward points are considered a cost of hedging and deferred in equity.
The ineffective portion of hedge transactions and changes in the fair values of derivative financial instru-ments, which do not qualify for hedge accounting, are recognised in the income statement as financial income or expenses for interest and currency-based instruments, and as other income/costs for oil price hedges and for-ward freight agreements.
Cash flow statementCash flow from operating activities includes all cash transactions other than cash flows arising from invest-ments and divestments, received dividends, principal payments of loans, instalments on lease liabilities, paid and received financial items and equity transactions. Capitalisation of borrowing costs is considered as a non-cash item, and the actual payments of these borrowing costs are included in cash flow from financing.
Cash and cash equivalents comprise cash and bank bal-ances net of bank overdrafts where overdraft facilities form an integral part of A.P. Moller - Maersk’s cash man-agement.
Business combinations and disposal of subsidiariesUpon acquisition of new entities, the acquired assets, liabilities and contingent liabilities are measured at fair value at the date when control was achieved using the acquisition method. Identifiable intangible assets are recognised if they arise from a contractual right or can other wise be separately identified. The difference be-tween the fair value of the acquisition cost and the fair value of acquired identifiable net assets is recognised as goodwill. Contingent consideration is measured at fair value and any subsequent changes to contingent consid-eration are recognised as other income or other costs in the income statement. Transaction costs are recognised as operating costs as they are incurred.
When A.P. Moller - Maersk ceases to have control of a subsidiary, the value of any retained investment is re-measured at fair value, and the value adjustment is recognised in the income statement as a gain/loss on the sale of non-current assets. The difference between sales proceeds and the carrying amount of the subsidiary is recognised in the income statement including fair value of
Note 23 Significant accounting policies – continued
109 A.P. Moller - Maersk Annual Report 2020 Financials Consolidated financial statements Notes index Amounts in USD million

contingent consideration at the time of sale. Contingent consideration is re-measured at fair value with changes recognised in the income statement.
The effect of the purchase and sale of non-controlling interests without changes in control is included directly in equity.
Discontinued operations and assets held for saleDiscontinued operations represent a separate major line of businesses disposed of or in preparation for sale.
The results of discontinued operations are presented separately in the income statement, and the cash flows from discontinued operations are presented separately in the cash flow statement with restatement of compar-ative figures.
Assets and liabilities held for sale from discontinued operations are presented as separate items in the bal-ance sheet with no restatement of comparative figures. Elimination between continuing and discontinued oper-ations is presented to reflect continuing operations as
post-separation, which entails the elimination of interest, borrowing, dividends and capital increases.
Assets and liabilities from discontinued operations and assets held for sale, except financial assets, etc., are measured at the lower of carrying amount immediately before classification as held for sale and fair value less cost to sell, and impairment tests are performed imme-diately before classification as held for sale. Non-current assets held for sale are not depreciated.
New financial reporting requirementsA.P. Moller - Maersk has not yet adopted the following accounting standards/requirements:
IFRS 17 - Insurance contractsIFRS 17: An analysis of the impact is being assessed and is expected to be concluded in due course ahead of the implementation date.
Other changes to IFRS are not expected to have any significant impact on recognition and measurement.
Note 23 Significant accounting policies – continued
The preparation of the consolidated financial statements requires management, on an ongoing basis, to make judgements and estimates and form assumptions that affect the reported amounts. Management forms its judgements and estimates based on historical experience, independent advice and external data points, as well as on in-house specialists and on other factors believed to be reasonable under the circumstances.
In certain areas, the outcome of business plans, including ongoing negotiations with external parties to execute those plans or to settle claims that are raised against A.P. Moller - Maersk, is highly uncertain. Therefore, as-sumptions may change, or the outcome may differ in the coming years, which could require a material upward or downward adjustment to the carrying amounts of assets and liabilities. This note includes the areas in which A.P. Moller - Maersk is particularly exposed to a material adjustment of the carrying amounts as at the end of 2020.
Significant accounting judgementsDetermination of cash-generating unitsJudgement is applied in the definition of cash-generating units and in the selection of methodologies and assump-tions for impairment tests.
The determination of cash-generating units differs for the various business areas. Ocean operates its fleet of
container vessels and hub terminals in an integrated network. Consequently, the Ocean activities are tested for impairment as a single cash-generating unit. In addi-tion, the intermodal activities reported under Logistics & Services are included in the Ocean cash-generating unit for impairment testing to apply consistency between the asset base and related cash flows. In Logistics & Services, apart from intermodal, each main product is defined as a cash-generating unit. In gateway terminals, each terminal is considered individually in impairment tests, except when the capacity is managed as a port-folio. Towage groups vessels according to type, size, etc. in accordance with the structure governing manage-ment’s ongoing follow-up. Projected cash flow models are used when fair value is not obtainable or when fair value is deemed lower than value in use. External data is used to the extent possible, and centralised processes, involving corporate functions, ensure that indices or data sources are selected consistently while observing differences in risks and other circumstances. Current market values for vessels, etc. are estimated using acknowledged brokers.
Operations in countries with limited access to repatriating surplus cashA.P. Moller - Maersk operates worldwide, and in this respect, has operations in countries where access to repatriating surplus cash is limited. In these coun-
tries, management makes judgements as to whether these cash positions can be recognised as cash or cash equivalents.
Significant accounting estimatesAspects of uncertaintyIn its assumption setting, management deals with dif-ferent aspects of uncertainty. One aspect of uncertainty is whether an asset or liability exists, where the assess-ment forms the basis for recognition or derecognition decisions, including assessment of control. Another as-pect is the measurement uncertainty, where management makes assumptions about the value of recognised assets and liabilities. These assumptions concern the timing and amount of future cash flows, and the risks inherent in these.
Impairment testsThe outcome of impairment tests is subject to estimates of the development of freight rates, volumes, bunker prices and discount rates.
The future development in freight rates is an uncertain and significant factor impacting especially the Ocean segment, whose financial results are directly affected by fluctuations in container freight rates. Freight rates are influenced by both regional and global economic environ-ment and trade patterns, as well as by industry-specific
trends in respect of capacity supply and demand. The long-term economic consequences of COVID-19 are still un-known and could cause a shift in freight rates or volumes.
The future development in the oil price is an uncertain and significant factor impacting accounting estimates across A.P. Moller - Maersk, either directly or indirectly. The Ocean segment is directly impacted by the price of bunker oil, where the competitive landscape determines the extent to which the development is reflected in the freight rates charged to the customer. APM Terminals is indirectly impacted by the oil price as terminals located in oil-producing countries, e.g. Nigeria, Angola, Egypt, Russia and Brazil, are indirectly impacted by the develop-ment in oil prices and the consequences on the countries’ economies, which not only affect volume handled in the terminals, but also exchange rates.
A.P. Moller - Maersk carries goodwill of USD 968m (USD 637m).
In Ocean, the cash flow projection is based on forecasts as per Q3 2020, covering plans for 2021-2025. Management has applied an assumption of growth in volumes, pressure on freight rates and continued cost efficiency. The im-pairment test continues to show headroom from value in use to the carrying amount. Management is of the opinion that the assumptions applied are sustainable.
Note 24 Significant accounting estimates and judgements
110 A.P. Moller - Maersk Annual Report 2020 Financials Consolidated financial statements Notes index Amounts in USD million
In Terminals & Towage, management assesses impair-ment triggers and based on these, estimates recoverable amounts on the individual terminals. For APM Terminals’ interest in Global Port Investments, being the share of equity and significant intangible assets acquired, manage-ment assesses the recoverable amount of its interest on an ongoing basis. Uncertain variables in the estimate are the economic outlook, local competition, effect on vol-umes, operating expenses and discount rate. The carrying amount of the investment may not be sustainable in the next few years if markets develop significantly adversely compared to current expectations. Estimates of recov-erable amounts were also prepared for other terminals where decreasing volumes triggered impairment tests. Key sensitivities are expected volumes, local port rates, concession right extensions as well as discount rate. The impairment tests showed headroom from fair value less cost of disposal and value in use calculations compared to carrying amount for all terminals in continued use. There-fore, no impairment was recognised in 2020 (USD 0m in 2019) related to terminals in markets with challenging commercial conditions. For assets held for sale, USD 62m was recognised in impairments. Continued economic de-terioration and a lack of cash repatriation opportunities in certain oil-producing countries can potentially put pres-sure on carrying amounts of individual terminals.
Reference is made to notes 6 and 7 for information about impairment losses, recoverable amounts and dis-count rates.
Amortisation, depreciation and residual valuesUseful lives are estimated based on experience. Manage-ment decides from time to time to revise the estimates for individual assets or groups of assets with similar char-acteristics due to factors such as quality of maintenance and repair, technical development and environmental requirements. Please refer to note 23 for the useful lives typically used for new assets.
Residual values are difficult to estimate given the long lives of vessels, the uncertainty as to future economic condi-tions and the future price of steel, which is considered the main determinant of the residual price. Generally, the residual values of vessels are initially estimated at 10% of
the purchase price excluding dry-docking costs. The long-term view is prioritised to disregard, to the extent possible, temporary market fluctuations, which may be significant.
Provisions for pension and other employee benefitsFor defined benefit schemes, management makes assump-tions about future remuneration and pension changes, employee attrition rates, life expectancy, inflation and discount rates. When setting these assumptions, manage-ment takes advice from the actuaries performing the valuation. The inflation and discount rates are determined centrally for the major plans on a country-by-country basis. All other assumptions are determined on a plan-by- plan basis. Refer to note 14 for information about key assump-tions and the sensitivity of the liability to changes in these assumptions.
Plan assets are measured at fair value by fund adminis-trators.
Provision for legal cases, disputes, uncertain tax positions etc.Management’s estimate of the provisions regarding le-gal cases and disputes, including disputes on taxes and duties, is based on the knowledge available on the actual substance of the cases and a legal assessment of these. The resolution of legal disputes, through either negotia-tions or litigation, can take several years to complete and the outcome is subject to considerable uncertainty.
A.P. Moller - Maersk is engaged in a number of disputes with tax authorities of varying scope. Appropriate pro-visions and recognition of uncertain tax positions have been made where the probability of the tax position being upheld in individual cases is considered less than 50%. Claims, for which the probability of A.P. Moller - Maersk’s tax position being upheld is assessed by management to be at least 50%, are not provided for. Such risks are in-stead evaluated on a portfolio basis by geographical area, and country risk provisions and uncertain tax liabilities are recognised where the aggregated probability of the tax position being upheld is considered less than 50%.
Deferred tax assetsJudgement has been applied in the measurement of deferred tax assets with respect to A.P. Moller - Maersk’s
ability to utilise the assets. Management considers the likelihood of utilisation based on the latest business plans and recent financial performances of the individual entities. Net deferred tax assets recognised in entities having suffered an accounting loss in either the current or preceding period amount to USD 87m (USD 98m) for con-tinuing operations, excluding entities participating in joint taxation schemes. These assets mainly relate to unused tax losses or deductible temporary differences generated during the construction of terminals, where taxable prof-its have been generated either in the current period or are expected within a foreseeable future.
Vessel-sharing agreements (Cost-sharing arrangements)Vessel-sharing agreements in shipping require that some vessels are committed towards specific service routes. The committed vessel’s capacity is then shared with one or more container shipping providers in proportion to each party’s contribution to the joint service service on multi-year agreements. In practice, it is not always possi-ble to provide tonnage precisely as agreed in the sharing arrangements, therefore financial settlement often takes place on the basis of relative capacity over/under utilised on a mutually agreed cycle. At A.P. Moller - Maersk, these capacity adjustments are settled as close to actual costs incurred as possible based on market rates applicable at that time.
Note 24 Significant accounting estimates and judgements – continued
111 A.P. Moller - Maersk Annual Report 2020 Financials Consolidated financial statements Notes index Amounts in USD million
Parent company financial statements 2020
Income statement
Statement of comprehensive income
Balance sheet at 31 December
Cash flow statement
Statement of changes in equity
Notes to the parent company financial statements
A.P. Møller - Mærsk A /S(In parenthesis, the corresponding figures for 2019)
112 A.P. Møller - Mærsk A/S Annual Report 2020 Financials Parent company financial statements
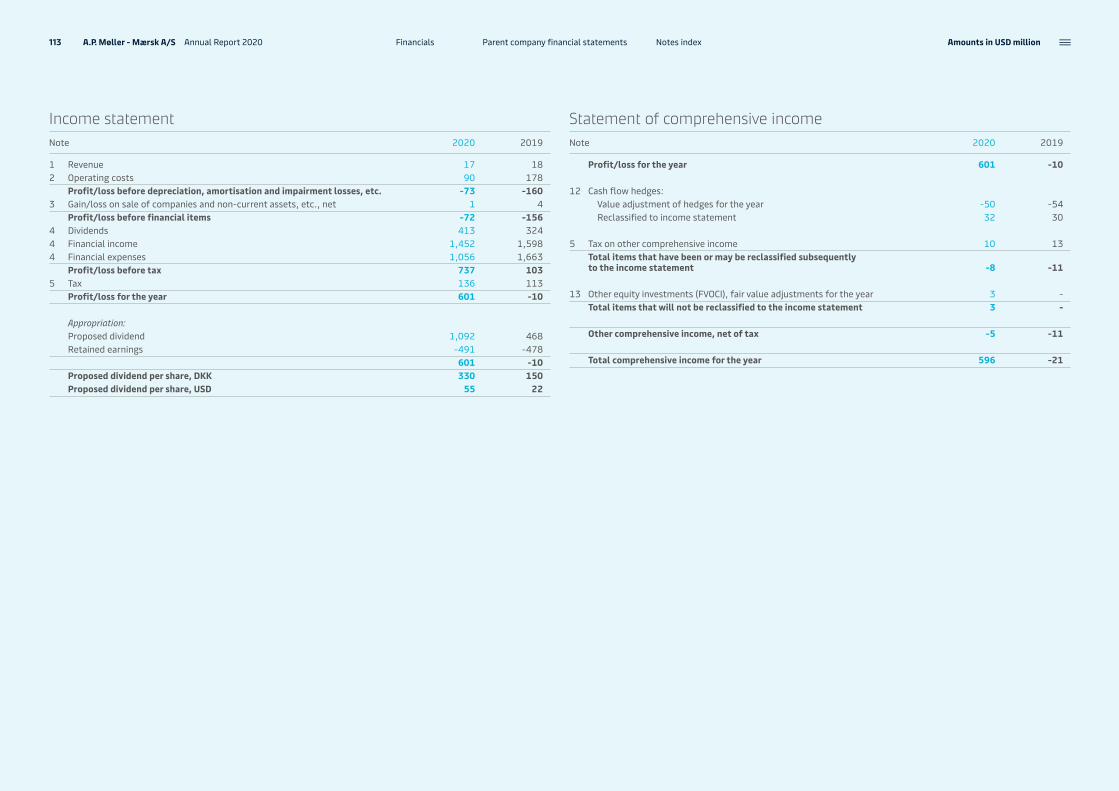
Income statementNote 2020 2019
1 Revenue 17 182 Operating costs 90 178
Profit/loss before depreciation, amortisation and impairment losses, etc. -73 -1603 Gain/loss on sale of companies and non-current assets, etc., net 1 4
Profit/loss before financial items -72 -1564 Dividends 413 3244 Financial income 1,452 1,5984 Financial expenses 1,056 1,663
Profit/loss before tax 737 1035 Tax 136 113
Profit/loss for the year 601 -10
Appropriation:Proposed dividend 1,092 468Retained earnings -491 -478
601 -10Proposed dividend per share, DKK 330 150Proposed dividend per share, USD 55 22
Statement of comprehensive incomeNote 2020 2019
Profit/loss for the year 601 -10
12 Cash flow hedges: Value adjustment of hedges for the year -50 -54 Reclassified to income statement 32 30
5 Tax on other comprehensive income 10 13Total items that have been or may be reclassified subsequently to the income statement -8 -11
13 Other equity investments (FVOCI), fair value adjustments for the year 3 - Total items that will not be reclassified to the income statement 3 -
Other comprehensive income, net of tax -5 -11
Total comprehensive income for the year 596 -21
113 A.P. Møller - Mærsk A/S Annual Report 2020 Amounts in USD million Notes indexParent company financial statementsFinancials
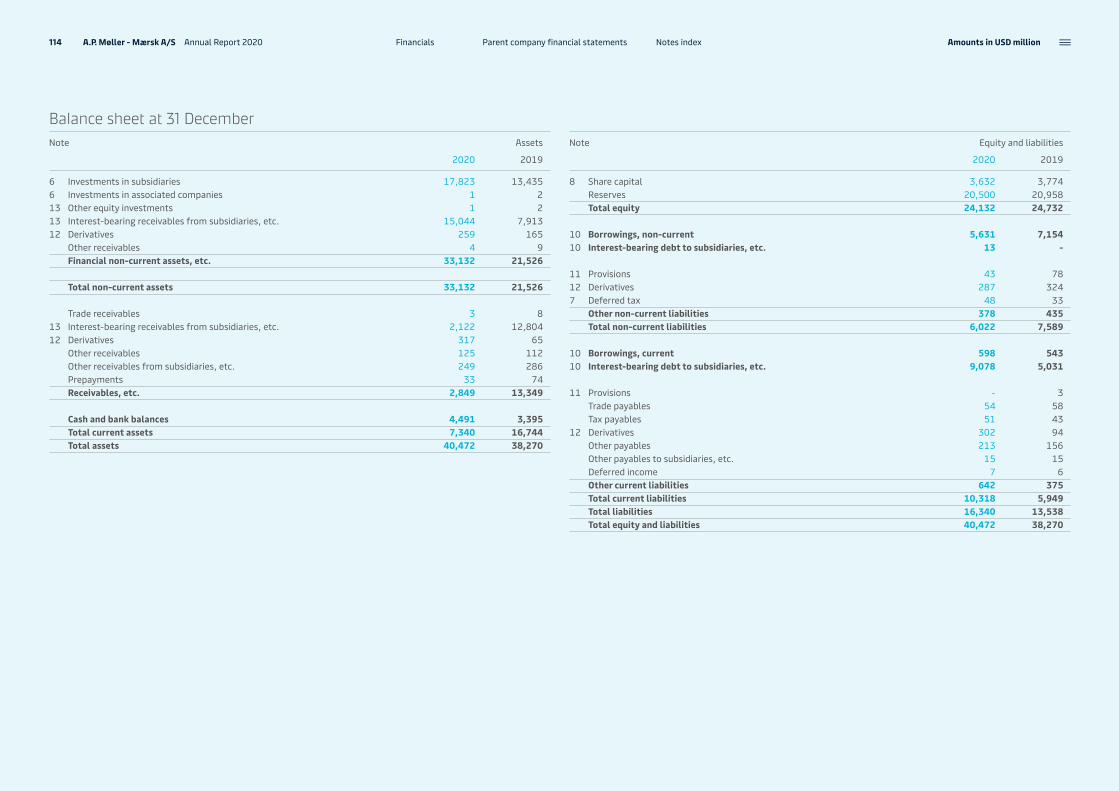
Balance sheet at 31 DecemberNote Assets
2020 2019
6 Investments in subsidiaries 17,823 13,4356 Investments in associated companies 1 213 Other equity investments 1 213 Interest-bearing receivables from subsidiaries, etc. 15,044 7,91312 Derivatives 259 165
Other receivables 4 9Financial non-current assets, etc. 33,132 21,526
Total non-current assets 33,132 21,526
Trade receivables 3 813 Interest-bearing receivables from subsidiaries, etc. 2,122 12,80412 Derivatives 317 65
Other receivables 125 112Other receivables from subsidiaries, etc. 249 286Prepayments 33 74Receivables, etc. 2,849 13,349
Cash and bank balances 4,491 3,395Total current assets 7,340 16,744Total assets 40,472 38,270
Note Equity and liabilities
2020 2019
8 Share capital 3,632 3,774Reserves 20,500 20,958Total equity 24,132 24,732
10 Borrowings, non-current 5,631 7,15410 Interest-bearing debt to subsidiaries, etc. 13 -
11 Provisions 43 7812 Derivatives 287 3247 Deferred tax 48 33
Other non-current liabilities 378 435Total non-current liabilities 6,022 7,589
10 Borrowings, current 598 54310 Interest-bearing debt to subsidiaries, etc. 9,078 5,031
11 Provisions - 3Trade payables 54 58Tax payables 51 43
12 Derivatives 302 94Other payables 213 156Other payables to subsidiaries, etc. 15 15Deferred income 7 6Other current liabilities 642 375Total current liabilities 10,318 5,949Total liabilities 16,340 13,538Total equity and liabilities 40,472 38,270
114 A.P. Møller - Mærsk A/S Annual Report 2020 Amounts in USD million Notes indexParent company financial statementsFinancials

Cash flow statementNote 2020 2019
Profit/loss before financial items -72 -1563 Gain/loss on sale of companies and non-current assets, etc., net - -417 Change in working capital 141 -37
Change in provisions, etc. -38 -Other non-cash items -3 14Cash from operating activities before tax 28 -183Taxes paid -104 -185Cash flow from operating activities -76 -368Capital increases in subsidiaries and activities -136 - Sale of subsidiaries and associates - 62Dividends received 123 2,792Other financial investments, net 6 - Cash flow used for investing activities -7 2,854Repayment of borrowings -2,941 -2,132Proceeds from borrowings 1,245 1,081Purchase of own shares -806 -791Financial income received 978 1,140Financial expenses paid -295 -423Sale of own shares 30 - Dividends distributed -430 -469Movements in interest-bearing loans to/from subsidiaries, etc., net 3,407 1,341Cash flow from financing activities 1,188 -253Net cash flow for the year 1,105 2,233Cash and cash equivalents 1 January 3,390 1,147Currency translation effect on cash and cash equivalents -7 10Cash and cash equivalents 31 December 4,488 3,390
Cash and cash equivalentsCash and bank balances 4,491 3,395Overdrafts 3 5Cash and cash equivalents 31 December 4,488 3,390
115 A.P. Møller - Mærsk A/S Annual Report 2020 Amounts in USD million Notes indexParent company financial statementsFinancials
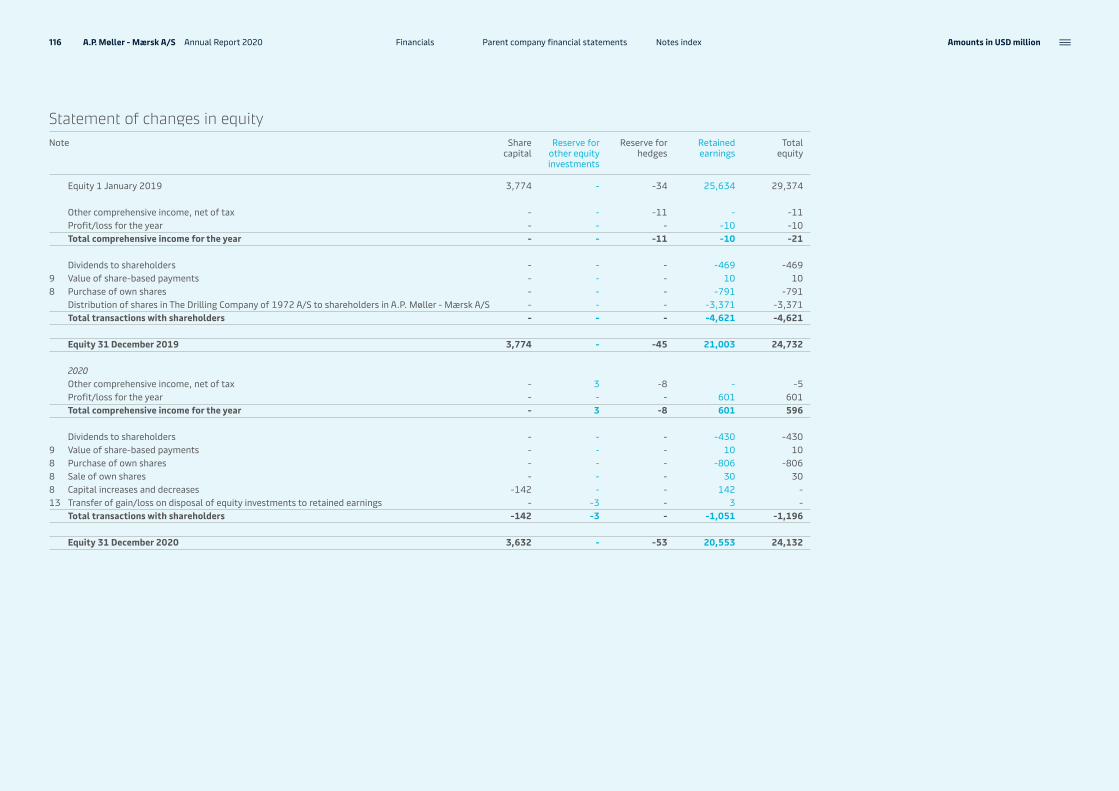
Statement of changes in equityNote Share
capitalReserve for
other equity investments
Reserve for hedges
Retained earnings
Total equity
Equity 1 January 2019 3,774 - -34 25,634 29,374
Other comprehensive income, net of tax - - -11 - -11 Profit/loss for the year - - - -10 -10Total comprehensive income for the year - - -11 -10 -21
Dividends to shareholders - - - -469 -4699 Value of share-based payments - - - 10 108 Purchase of own shares - - - -791 -791
Distribution of shares in The Drilling Company of 1972 A/S to shareholders in A.P. Møller - Mærsk A/S - - - -3,371 -3,371Total transactions with shareholders - - - -4,621 -4,621
Equity 31 December 2019 3,774 - -45 21,003 24,732
2020Other comprehensive income, net of tax - 3 -8 - -5Profit/loss for the year - - - 601 601Total comprehensive income for the year - 3 -8 601 596
Dividends to shareholders - - - -430 -4309 Value of share-based payments - - - 10 108 Purchase of own shares - - - -806 -8068 Sale of own shares - - - 30 308 Capital increases and decreases -142 - - 142 - 13 Transfer of gain/loss on disposal of equity investments to retained earnings - -3 - 3 -
Total transactions with shareholders -142 -3 - -1,051 -1,196
Equity 31 December 2020 3,632 - -53 20,553 24,132
116 A.P. Møller - Mærsk A/S Annual Report 2020 Amounts in USD million Notes indexParent company financial statementsFinancials

Notes Note 1118 Revenue
Note 2118 Operating costs
Note 3119 Gain on sale of companies and
non-current assets, etc., net
Note 4119 Financial income and expenses
Note 5120 Tax
Note 6121 Investments in subsidiaries and
associated companies
Note 7122 Deferred tax
Note 8122 Share capital
Note 9123 Share-based payment
Note 10125 Borrowings and lease liability
reconciliation
Note 11126 Provisions
Note 12126 Financial instruments and risks
Note 13131 Financial instruments
by category
Note 14132 Pledges
Note 15133 Commitments
Note 16133 Contingent liabilities
Note 17133 Cash flow specifications
Note 18134 Related parties
Note 19135 Significant accounting policies
Note 20135 Significant accounting estimates
and judgements
Parent company financial statementsActivities comprise holding of shares in subsidiaries and associated companies, as well as funding, procurement and cash management.
In the parent company financial statements, shares in subsidiaries and associated companies are recognised at cost, cf. note 19, less impairment losses, and in the income statement, dividends from subsidiaries and associated companies are recognised as income.
The net profit for the year was USD 601m (loss of USD 10m). The main difference is financial expenses as 2019 was impacted by impairment loss on the Maersk Drilling Holding A/S demerger. Furthermore, reversal of provi-sions, etc. reduces operational costs compared to 2019.
Cash flow from operating activities was negative USD 76 (negative USD 368). Total assets amounted to USD 40.5bn (USD 38.3bn) and total equity was USD 24.1bn (USD 24.7bn) at 31 December 2020.
117 A.P. Møller - Mærsk A/S Annual Report 2020 Parent company financial statementsFinancials

Note 1 RevenueTable 1.1 2020 2019
Other revenue 17 18Total revenue 17 18
Table 2.11 Wages and salaries USD 127m (USD 116m) and pension
plan contributions USD 22m (USD 8m). Staff costs included in integration and restructuring costs amount to USD 0m (USD 3m). For information about share-based payment, reference is made to note 9.
2 Other operating costs are positively impacted by USD 35m reversal of other provisions, ref. note 11, other reversals and recharging of cost, etc.
Table 2.2Contract of employment for the Executive Board contains terms customary in Danish listed companies, including termination notice and competition clauses. In connection with a possible takeover offer, neither the Executive Board nor the Board of Directors will receive special remunera-tion. Fees and remuneration do not include pension.
The Board of Directors has received fees of USD 3m (USD 3m).
Table 2.3Fees for other services than statutory audit of the financial statements provided by Pricewaterhouse-Coopers Statsautoriseret Revisionspartnerselskab to A.P. Møller - Mærsk A/S mainly consist of audit of non-statutory financial statements, financial due diligence and transaction advice, accounting advi-sory services, review of the interim report and other advisory accounting and tax services.
Table 1.1Other revenue is internal lease income.
Note 2 Operating costsTable 2.1 2020 2019
Rent and lease costs 11 14Staff costs reimbursed to Rederiet A.P. Møller A/S 1 149 124Other, including recharging of operating costs, net2 -70 40Total operating costs 90 178
Average number of employees directly employed by the company 2 2
Table 2.2
The company’s share of fees and remuneration to the Executive Board 2020 2019
Fixed base salary 6 5Short-term cash incentive 4 2Long-term share-based incentive plans 1 - Remuneration in connection with redundancy, resignation and release from duty to work - 5Total remuneration to the Executive Board 11 12
Table 2.3
Fees to the statutory auditors 2020 2019
Statutory audit 1 1Other assurance services - - Tax and VAT advisory services - - Other services 1 1Total fees 2 2
118 A.P. Møller - Mærsk A/S Annual Report 2020 Amounts in USD million Notes indexParent company financial statementsFinancials

Note 3 Gain on sale of companies and non-current assets, etc., netTable 3.1 2020 2019
Gains 1 4Gain/loss on sale of companies and non-current assets, etc., net 1 4
Table 3.1One subsidiary and two associated companies were liqui-dated in 2020 after activities ceased.
In 2019, gains were liquidation of two dormant subsidi-aries.
Table 4.1Reference is made to note 12 for an analysis of gains and losses from derivatives.
Refer to note 20 for significant accounting estimates.
Dividends1 Mainly dividend from A.P. Moller Finance SA (in 2019
Orion Limited, Maersk FPSOs A/S and A.P. Moller Finance SA each paid around USD 0.1bn).
Reversal of impairment losses2 Reversal of impairment losses mostly relates to
Maersk Oil Trading and Investments A/S (in 2019 A.P. Moller Finance SA, Star Air A/S and Maersk Container Industry A/S).
Impairment losses and fair value adjustments3 Impairment losses to recoverable amount relate to fair
value adjustment of A.P. Moller Finance SA and Maersk Supply Service A/S (in 2019 Maersk Supply Service A/S, Damco International A/S, Maersk FPSOs A/S and demerger of Maersk Drilling Holding A/S).
Reversal of write-down of loan receivables4 2019 reversal of write-down of loan concerns Maersk
Supply Service A/S and Maersk Container Industry A/S.
Note 4 Financial income and expensesTable 4.1 2020 2019
Interest expenses on liabilities 325 490Interest income on loans and receivables 887 1,143Fair value adjustment transferred from equity hedge reserve (loss) 25 26Net interest income 537 627
Exchange rate gains on bank balances, borrowings and working capital 76 71Exchange rate losses on bank balances, borrowings and working capital 190 30Net foreign exchange gains/losses -114 41
Fair value gains from derivatives 193 113Fair value losses from derivatives 49 73Net fair value gains/losses 144 40
Dividends received from subsidiaries, associated companies and joint ventures, net1 413 324Total dividend income 413 324
Reversal of impairment losses, investments in subsidiaries and associated companies2 296 116Impairment losses, investments in subsidiaries and associated companies3 467 1,042Reversal of write-down of loans4 - 155Write-down of loan receivables from subsidiaries - 2Financial income/expenses, net 809 259
Of which:Dividends 413 324Financial income 1,452 1,598Financial expenses 1,056 1,663
119 A.P. Møller - Mærsk A/S Annual Report 2020 Amounts in USD million Notes indexParent company financial statementsFinancials

Note 5 TaxTable 5.1 2020 2019
Tax recognised in the income statementCurrent tax on profit for the year 119 70Adjustment of tax provision -26 45Adjustment for current tax of prior periods 18 -49Withholding taxes 10 15Total current tax 121 81
Origination and reversal of temporary differences 2 24Adjustment for deferred tax of prior periods 13 8Total deferred tax 15 32Total tax expense 136 113
Tax reconciliation:Profit/loss before tax 737 103
Tax using the Danish corporation tax rate (22%) 162 23Non-deductible expenses 13 34Gains/losses related to shares, dividends, etc. -46 50Adjustment to previous years’ taxes 5 4Other differences, net 2 2Total income tax 136 113
Tax recognised in other comprehensive income and equity 10 13
Of which:Current tax 10 13
120 A.P. Møller - Mærsk A/S Annual Report 2020 Amounts in USD million Notes indexParent company financial statementsFinancials

Note 6 Investments in subsidiaries and associated companiesTable 6.1 Investments
in subsidiariesInvestments
in associated companies
2020 2020
Cost1 January 2019 21,305 819Addition1 850 - Return of capital2 5,780 - Disposal 250 - Transfer from assets held for sale3 1,465 - 31 December 2019 17,590 819Addition4 4,565 - Disposal 10 431 December 2020 22,145 815
Impairment losses1 January 2019 2,552 814Impairment losses5 480 3Disposal 226 - Reversal of impairment losses 116 - Transfer from assets held for sale3 1,465 - 31 December 2019 4,155 817Impairment losses5 467 1Disposal 4 4Reversal of impairment losses 296 - 31 December 2020 4,322 814
Carrying amount:31 December 2019 13,435 231 December 2020 17,823 1
Table 6.1Reference is made to pages 144-146 for a list of signifi-cant subsidiaries and associated companies.
1 Capital increase in Maersk Container Industry A/S, Maersk Supply Service A/S and Damco International A/S.
2 Maersk Oil Trading and Investments A/S returned USD 5.8bn after disposing the Total S.A. shares.
3 Maersk Supply Service A/S transferred back to continuing operations.
4 Capital increase in mainly Maersk A/S USD 2.8bn, Svitzer A/S USD 0.9bn, Maersk Holding B.V. USD 0.5bn and Damco International A/S USD 0.2bn.
5 Impairment losses are recognised when carrying amount exceeds recoverable amount as explained in notes 4, 19 and 20.
121 A.P. Møller - Mærsk A/S Annual Report 2020 Amounts in USD million Notes indexParent company financial statementsFinancials

Note 7 Deferred taxRecognised deferred tax assets and liabilities are attributable to the following:
Table 7.1 Assets Liabilities Net liabilities
2020 2019 2020 2019 2020 2019
Liabilities, etc. - - 48 33 48 33Total - - 48 33 48 33
Table 7.2
Change in deferred tax, net during the year 2020 2019
1 January 33 1Recognised in the income statement 15 3231 December 48 33
Table 7.1 and Table 7.2There are no unrecognised deferred tax assets.
There are no material unrecognised tax liabilities on investments in subsidiaries, associated companies and joint ventures.
Table 8.1All shares are fully issued and paid up.
One A share of DKK 1,000 holds two votes. B shares have no voting rights.
At the Annual General Meeting of the company on 23 March 2020, it was decided to decrease the company’s share capital by cancellation of treasury shares. The capital decrease was completed and registered with the Danish Business Authority on 2 June 2020.
Note 8 Share capitalDevelopment in the number of shares:
Table 8.1 A shares of B shares of Nominal value
DKK 1,000 DKK 500 DKK 1,000 DKK 500 DKK million USD million
1 January 2019 10,756,262 232 10,060,398 172 20,817 3,774 Conversion 3 -6 3 -6 - - 31 December 2019 10,756,265 226 10,060,401 166 20,817 3,774
Cancellation 156,977 - 627,938 - 785 142Conversion 5 -10 - - - -31 December 2020 10,599,293 216 9,432,463 166 20,032 3,632
Shareholder disclosure subject to section 104 of the Danish Financial Statements Act:
Table 8.2 Share capital Votes
A.P. Møller Holding A/S, Copenhagen, Denmark 40.29% 50.88%A.P. Møller og Hustru Chastine Mc-Kinney Møllers Familiefond, Copenhagen, Denmark 9.18% 13.31%Den A.P. Møllerske Støttefond, Copenhagen, Denmark 3.23% 6.07%
122 A.P. Møller - Mærsk A/S Annual Report 2020 Amounts in USD million Notes indexParent company financial statementsFinancials

Note 8 Share capital – continuedDevelopment in the holding of own shares:
Table 8.3 No. of shares of DKK 1,000 Nominal value DKK million % of share capital
Own shares 2020 2019 2020 2019 2020 2019
A shares1 January 134,279 - 134 - 0.65% 0.00%Addition 141,874 134,279 142 134 0.69% 0.65%Cancellation 156,977 - 157 - 0.75% 0.00%31 December 119,176 134,279 119 134 0.59% 0.65%
B shares1 January 587,949 55,515 588 56 2.82% 0.27%Addition 567,493 537,143 567 537 2.83% 2.57%Cancellation 627,938 - 628 - 3.02% 0.00%Disposal 22,223 4,709 22 5 0.11% 0.02%31 December 505,281 587,949 505 588 2.52% 2.82%
Table 8.3Note 11 in the consolidated financial statements includes rules for changing the share capital, and information regarding the authorisation of the Board of Directors to acquire own shares as well as the total number of own shares held by the Group.
Addition of own shares relates to the share buy-back programme announced in May 2019. Note 11 in the consolidated financial statements provides more information about the share buy-back programme. Disposal of own shares relates to the share option plan and the restricted shares plan.
Note 9 Share-based paymentTable 9.1 Members of
the Executive Board 1
Employees 1 Total Total fair value 1
Outstanding restricted shares No. No. No. USD million
1 January 2019 1,002 12,786 13,788Granted 1,310 4,319 5,629 7Granted in connection with Maersk Drilling demerger 294 1,286 1,580Exercised - 4,756 4,756Forfeited 739 1,700 2,439Outstanding 31 December 2019 1,867 11,935 13,802
Granted 1,626 6,165 7,791 7Exercised - 3,777 3,777Forfeited - 125 125Outstanding 31 December 2020 3,493 14,198 17,691
Table 9.1Restricted shares planThe restricted shares plan was introduced in 2013 and grants have been awarded to employees on a yearly basis since 2013. Beginning in 2018, grants have also been awarded to members of the Executive Board.
The transfer of restricted shares is contingent upon the employee still being employed and not being under notice of termination and takes place when three years have passed from the time of granting. For members of the Executive Board the vesting period is five years.
The members of the Executive Board as well as other employees are not entitled to any dividends during the vesting period. Special conditions apply regarding illness, death and resignation as well as changes in the company’s capital structure, etc. A part of A.P. Møller - Mærsk A/S’ holding of own B shares will be used to meet the company’s obligations in connection with the restricted shares plan.
The fair value of restricted shares (A.P. Møller - Mærsk A/S B shares) granted to 96 (92) employees and five (five) mem-bers of the Executive Board was USD 7m (USD 7m) at the time of grant.
The fair value per restricted share at the time of grant is DKK 5,975 (DKK 8,668), which is equal to the volume weighted average share price on the date of grant, i.e. 1 April 2020.
The payroll expense related to the restricted shares plan is USD 1m (USD 1m).
On 1 April 2020, the restricted shares originally granted in 2017 were settled with the employees. The weighted average share price at that date was DKK 5,975.
The average remaining contractual life for the restricted shares as per 31 December 2020 is 1.8 years (1.7 years).
1 At the time of grant.
123 A.P. Møller - Mærsk A/S Annual Report 2020 Amounts in USD million Notes indexParent company financial statementsFinancials

Note 9 Share-based payment – continuedTable 9.2 Members of the
Executive Board 1Employees 1 Total Average
exercise price 2Total fair
value 1
Outstanding share options No. No. No. DKK USD million
1 January 2019 9,985 36,707 46,692 12,791Granted 7,894 22,444 30,338 7,622 9Forfeited 6,080 3,125 9,205 9,141Outstanding 31 December 2019 11,799 56,026 67,825 12,156Exercisable 31 December 2019 - 18,435 18,435 10,630
Granted 8,741 31,383 40,124 8,639 4Exercised - 18,446 18,446 9,968Forfeited - 1,073 1,073 9,636Outstanding 31 December 2020 20,540 67,890 88,430 8,670Exercisable 31 December 2020 2,347 32,474 34,821 10,187
The following principal assumptions are used in the valuation:
Table 9.3 Share options granted to members of the Executive Board
Share options granted to employees not members of the
Executive Board
2020 2019 2020 2019
Share price, volume weighted average at the date of grant, 1 April, DKK 5,975 8,668 5,975 8,668Share price, five days volume weighted average after publication of Annual Report, DKK 7,854 8,682 7,854 8,682Exercise price, DKK 8,639 9,550 8,639 9,550Exercise price following the demerger of Maersk Drilling, 2 April 2019, DKK n/a 7,670 n/a 7,605Expected volatility (based on historic volatility) 31% 32% 31% 32%Expected term (years) 5.00 5.00 5.75 5.75Expected dividend per share, DKK 150 150 150 150Risk free interest rate -0.66% -0.36% -0.63% -0.28%
Table 9.2Share option plansIn addition to the plan described above, the company has share options plans for members of the Executive Board and other employees. Each share option granted is a call option to buy an existing B share of nominal DKK 1,000 in A.P. Møller - Mærsk A/S.
The share options were granted at an exercise price cor-responding to 110% of the average of the market price on the first five trading days following the release of A.P. Møller - Mærsk A/S’ Annual Report. Exercise of the share options is contingent on the option holder still be-ing employed at the time of exercise. The share options can be exercised when at least three years and no more than six years (seven years for share options granted to employees not members of the Executive Board) have passed from the time of granting. Special conditions apply regarding illness, death and resignation as well as changes in the company’s capital structure, etc.
The share options can only be settled in shares. A part of A.P. Møller - Mærsk A/S’ holding of own B shares will be used to meet the company’s obligations in respect of the share option plans.
The fair value of awards granted to five (five) members of the Executive Board and 89 (75) employees was USD 4m (USD 9m) at the time of grant.
The payroll expense related to the share options plan is USD 1m (USD 1m).
The weighted average share price at the dates of exercise of share options was DKK 12,389. No share options were exercised during 2019.
The average remaining contractual life as per 31 Decem-ber 2020 is 5.1 years (5.2 years) and the exercise price for outstanding share options is DKK 8,670 (DKK 9,057).
1 At the time of grant.2 Average exercise prices were reduced following the
demerger of Maersk Drilling in 2019.
Table 9.3The fair value per option granted to members of the Executive Board is calculated at DKK 625 (DKK 1,782) at the time of grant based on Black & Scholes’ option pricing model. The fair value per option granted to employees not members of the Executive Board is calculated at DKK 697 (DKK 1,914) at the time of grant based on the same option pricing model.
124 A.P. Møller - Mærsk A/S Annual Report 2020 Amounts in USD million Notes indexParent company financial statementsFinancials

Note 10 Borrowings and lease liability reconciliationTable 10.1 Net debt as at
31 DecemberCash flow Other changes Net debt as at
31 December
2019Foreign exchange
movements Other 1 2020
Bank and other credit institutions 2,865 -464 - - 2,401Lease liabilities 13 -9 - - 4Issued bonds 4,819 -1,254 150 109 3,824Subsidiaries, etc., net -15,686 3,407 32 4,172 -8,075Total borrowings, net -7,989 1,6802 182 4,281 -1,846
Derivatives hedge of borrowings, net 156 27 -150 -69 -36
Borrowings classification:Classified as non-current 7,154 5,644Classified as current 5,574 9,676
Table 10.2 Net debt as at 31 December
Cash flow Other changes Net debt as at 31 December
2018Foreign exchange
movements Other 1 2019
Bank and other credit institutions 3,373 -508 - - 2,865Lease liabilities - - - 13 13Issued bonds 5,373 -543 -57 46 4,819Subsidiaries, etc., net -14,426 1,341 -25 -2,576 -15,686Total borrowings, net -5,680 290 -82 -2,517 -7,989
Derivatives hedge of borrowings, net 187 -84 57 -4 156
Borrowings classification:Classified as non-current 7,573 7,154Classified as current 9,916 5,574
Table 10.1 and Table 10.21 Non-cash dividends, capital increases, fair value adjust-
ments, IFRS 16 lease liabilities, etc.2 Total cash flow from borrowings amounts to USD 1,680m
and cash flow from related hedges at USD 31m, in total USD 1,711m.
125 A.P. Møller - Mærsk A/S Annual Report 2020 Amounts in USD million Notes indexParent company financial statementsFinancials

Note 11 ProvisionsTable 11.1 Restructuring Other Total
1 January 2020 3 78 81Amount used 3 - 3Amount reversed - 35 3531 December 2020 - 43 43
Of which:Classified as non-current - 43 43
Table 11.1Other includes provisions for unsettled claims, legal dis-putes, etc.
The provisions are subject to considerably uncertainty, cf. note 20.
Note 12 Financial instruments and risksThe company’s derivatives are presented in the balance sheet with the following amounts:
Table 12.1 2020 2019
Non-current receivables 259 165Current receivables 317 65Non-current liabilities 287 324Current liabilities 302 94Assets/liabilities, net -13 -188
The gains/losses of the derivatives are recognised as follows:
Table 12.2 2020 2019
Hedging interest rate risk -25 -26Total effective hedging -25 -26Ineffectiveness recognised in financial expenses -12 -4Total reclassified from equity reserve for hedges -37 -30
Derivatives accounted for as held for tradingCurrency derivatives recognised directly in financial income/expenses 199 66Interest rate derivatives recognised directly in financial income/expenses 59 19Oil prices and freight rate derivatives recognised directly in other income/costs - -1Net gains/losses recognised directly in the income statement 258 84
Total 221 54
Table 12.1The company’s activities expose it to a variety of financial risks:
• Market risks, i.e. currency risk and interest rate risk • Credit risk• Liquidity risk.
The company’s overall risk management programme focuses on the unpredictability of financial markets and seeks to minimise the potential adverse effects on the company’s financial performance. The company uses derivative financial instruments to hedge certain risk exposures.
Risk management is carried out by a central finance department under policies approved by the Board of Directors. The finance department identifies, evaluates and hedges financial risks in close cooperation with the company’s entities.
Market riskMarket risk is the risk that changes in market prices, such as foreign exchange rates and interest rates, will affect the company’s profit or the value of its holdings of finan-cial instruments. The sensitivity analyses in the currency risk and interest rate risk sections relate to the position of financial instruments at 31 December 2020.
The sensitivity analyses for currency risk and interest rate risk have been prepared on the basis that the amount of net debt, the ratio of fixed to floating interest rates of the debt, and the proportion of financial instruments in foreign currencies remain unchanged from hedge desig-nations in place at 31 December 2020. Furthermore, it is assumed that the exchange rate and interest rate sensi-tivities have a symmetric impact, i.e. an increase in rates results in the same absolute movement as a decrease in rates.
The sensitivity analyses show the effect on profit and equity of a reasonably possible change in exchange rates and interest rates.
Table 12.2Hedges comprise primarily currency derivatives and in-terest rate derivatives, which are further described in the following sections.
126 A.P. Møller - Mærsk A/S Annual Report 2020 Amounts in USD million Notes indexParent company financial statementsFinancials

Note 12 Financial instruments and risks – continuedTable 12.3 Fair value
Recognised at fair value through profit and loss 2020 2019
Currency derivatives 13 -20Interest derivatives -62 1Total -49 -19
Table 12.4 Profit before tax Equity before tax
2020 2019 2020 2019
EUR -91 -307 -91 -307 Other currencies -65 -50 -65 -50 Total -156 -357 -156 -357
Table 12.3Currency riskThe company’s currency risk arises primarily from its treasury activities where financing is obtained and pro-vided in a wide range of currencies other than USD such as EUR, GBP and NOK.
The main purpose of hedging the company’s currency risk is to hedge the USD value of the company’s net cash flow and reduce fluctuations in the company’s profit. The company uses various financial derivatives, including forwards, option contracts and cross-currency swaps, to hedge these risks. The key aspects of the currency hedg-ing policy are as follows:
• Net cash flows in other significant currencies than USD are hedged using a layered model with a 12-month horizon
• Significant capital commitments or divestments in other currencies than USD are hedged
• Most non-USD debt is hedged, however, depending on the asset-liability match and the currency of the gen-erated cash flow.
Table 12.4The company enters into derivatives to hedge currency exposures that do not qualify for hedge accounting. These derivatives are classified as fair value through profit or loss.
An increase in the USD exchange rate of 10% against all other significant currencies to which the company is exposed is presented in the table.
127 A.P. Møller - Mærsk A/S Annual Report 2020 Amounts in USD million Notes indexParent company financial statementsFinancials
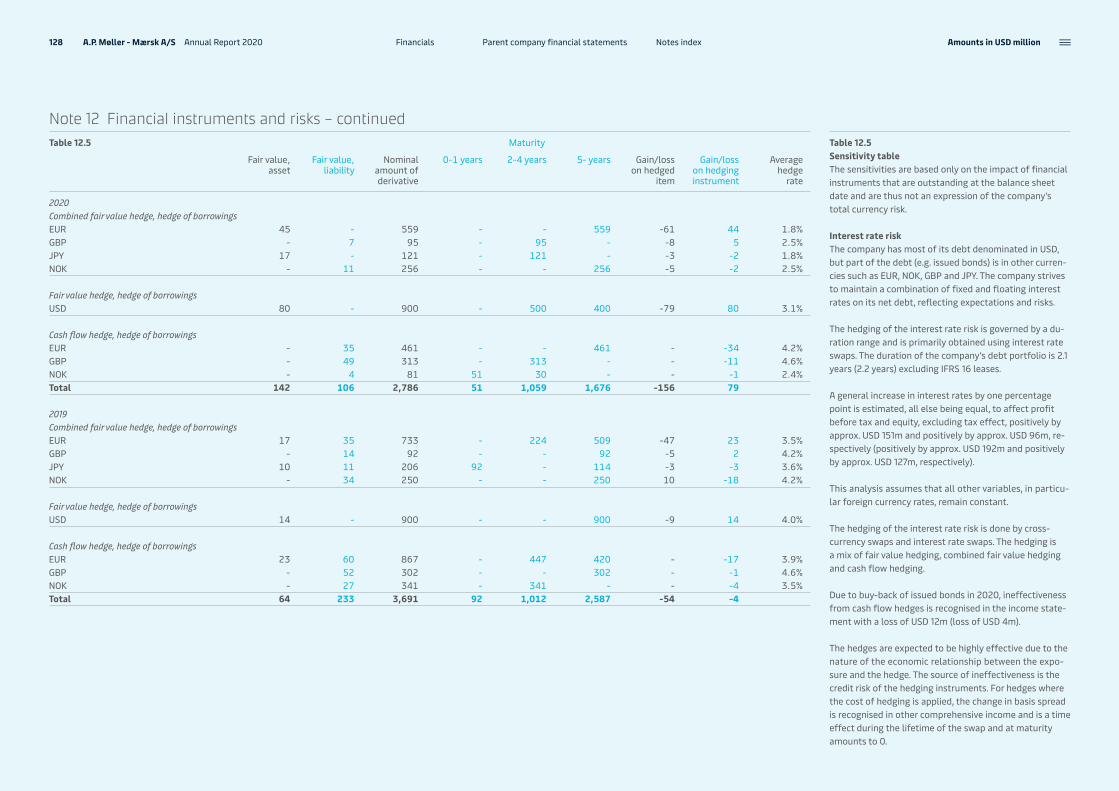
Table 12.5 Sensitivity tableThe sensitivities are based only on the impact of financial instruments that are outstanding at the balance sheet date and are thus not an expression of the company’s total currency risk.
Interest rate riskThe company has most of its debt denominated in USD, but part of the debt (e.g. issued bonds) is in other curren-cies such as EUR, NOK, GBP and JPY. The company strives to maintain a combination of fixed and floating interest rates on its net debt, reflecting expectations and risks.
The hedging of the interest rate risk is governed by a du-ration range and is primarily obtained using interest rate swaps. The duration of the company’s debt portfolio is 2.1 years (2.2 years) excluding IFRS 16 leases.
A general increase in interest rates by one percentage point is estimated, all else being equal, to affect profit before tax and equity, excluding tax effect, positively by approx. USD 151m and positively by approx. USD 96m, re-spectively (positively by approx. USD 192m and positively by approx. USD 127m, respectively).
This analysis assumes that all other variables, in particu-lar foreign currency rates, remain constant.
The hedging of the interest rate risk is done by cross- currency swaps and interest rate swaps. The hedging is a mix of fair value hedging, combined fair value hedging and cash flow hedging.
Due to buy-back of issued bonds in 2020, ineffectiveness from cash flow hedges is recognised in the income state-ment with a loss of USD 12m (loss of USD 4m).
The hedges are expected to be highly effective due to the nature of the economic relationship between the expo-sure and the hedge. The source of ineffectiveness is the credit risk of the hedging instruments. For hedges where the cost of hedging is applied, the change in basis spread is recognised in other comprehensive income and is a time effect during the lifetime of the swap and at maturity amounts to 0.
Note 12 Financial instruments and risks – continuedTable 12.5 Maturity
Fair value, asset
Fair value, liability
Nominal amount of derivative
0-1 years 2-4 years 5- years Gain/loss on hedged
item
Gain/loss on hedging instrument
Average hedge
rate
2020Combined fair value hedge, hedge of borrowingsEUR 45 - 559 - - 559 -61 44 1.8%GBP - 7 95 - 95 - -8 5 2.5%JPY 17 - 121 - 121 - -3 -2 1.8%NOK - 11 256 - - 256 -5 -2 2.5%
Fair value hedge, hedge of borrowingsUSD 80 - 900 - 500 400 -79 80 3.1%
Cash flow hedge, hedge of borrowingsEUR - 35 461 - - 461 - -34 4.2%GBP - 49 313 - 313 - - -11 4.6%NOK - 4 81 51 30 - - -1 2.4%Total 142 106 2,786 51 1,059 1,676 -156 79
2019Combined fair value hedge, hedge of borrowingsEUR 17 35 733 - 224 509 -47 23 3.5%GBP - 14 92 - - 92 -5 2 4.2%JPY 10 11 206 92 - 114 -3 -3 3.6%NOK - 34 250 - - 250 10 -18 4.2%
Fair value hedge, hedge of borrowingsUSD 14 - 900 - - 900 -9 14 4.0%
Cash flow hedge, hedge of borrowingsEUR 23 60 867 - 447 420 - -17 3.9%GBP - 52 302 - - 302 - -1 4.6%NOK - 27 341 - 341 - - -4 3.5%Total 64 233 3,691 92 1,012 2,587 -54 -4
128 A.P. Møller - Mærsk A/S Annual Report 2020 Amounts in USD million Notes indexParent company financial statementsFinancials

If the hedged transaction is prepaid, the change in basis spread will be recognised in profit or loss as ineffective-ness. The cost of hedging reserve amounts to a gain of USD 6m (gain of USD 6m).
The borrowing interest levels is specified in table 12.6
Table 12.6 Credit riskThe company has substantial exposure to financial and commercial counterparties but has no particular con-centration of customers or suppliers. To minimise the credit risk, financial vetting is undertaken for all major customers and financial institutions, adequate security is required for commercial counterparties, and credit limits are set for financial institutions and key commercial counterparties.
Financial assets at amortised cost comprise loans receiv-able, lease receivables, and other receivables. These are all considered to have low credit risk and thus the im-pairment provision calculated based on 12 months of ex-pected losses is considered immaterial. The financial as-sets are considered to be low risk when they have low risk of default and the issuer has a strong capacity to meet its contractual cash flow obligations in the near term.
A.P. Møller - Mærsk A/S applies the simple approach to providing the expected credit losses prescribed by IFRS 9, which permits the use of the lifetime expected loss pro-vision for all trade receivables. To measure the expected credit losses, trade receivables have been grouped based on shared credit risk characteristics and the days past due. In accordance with IFRS 9, also non-due trade receiv-ables have been impaired.
Other financial assets at amortised cost include loans to subsidiaries. As of 31 December 2020, the loans amount to USD 17.2bn (USD 20.7bn) and are considered to have a low credit risk, thus the impairment provision to be recognised during the period is limited to 12 months of expected losses. The credit risk has not increased sig-nificantly since the initial recognition and is considered low based on the investment grade credit rating for the Group and consequently the financial strength of the major subsidiaries within the Group. Prior years’ loan write-down balance on Maersk Supply Service A/S loan receivables remains recognised in 2020, while Maersk Container Industry A/S loan is settled.
Table 12.7 Liquidity riskIt is of great importance for the company to maintain a financial reserve to cover the company’s obligations and investment opportunities and to provide the capital necessary to offset changes in the company’s liquidity due to changes in the cash flow from operating activities.
The flexibility of the financial reserve is subject to on-going prioritisation and optimisation, among other things by focusing on the release of capital and following up on the development in working capital.
Note 12 Financial instruments and risks – continuedTable 12.6 Carrying
amountNext interest rate fixing
Borrowings and interest-bearing debt to subsidiariesby interest rate levels inclusive of interest rate swaps 0-1 year 2-4 years 5- years
20200-3% 12,942 13,172 -330 1003-6% 2,378 -366 1,853 891Total 15,320 12,806 1,523 991
Of which:Bearing fixed interest 2,668Bearing floating interest 12,652
20190-3% 6,081 6,181 -300 2003-6% 6,647 3,696 1,987 964Total 12,728 9,877 1,687 1,164
Of which:Bearing fixed interest 2,862Bearing floating interest 9,866
Table 12.7
Maturity analysis of trade receivables incl. subsidiaries, etc. 2020 2019
Receivables not due 2 1Less than 90 days overdue 1 7Receivables, gross 3 8Provision for bad debt - - Carrying amount 3 8
129 A.P. Møller - Mærsk A/S Annual Report 2020 Amounts in USD million Notes indexParent company financial statementsFinancials

Note 12 Financial instruments and risks – continuedTable 12.8 Carrying amount Cash flows including interest
Maturities of liabilities and commitments 0-1 year 2-4 years 5- years Total
2020Bank and other credit institutions 2,401 285 872 1,494 2,651Lease liabilities 4 4 - - 4Issued bonds 3,824 461 2,108 1,909 4,478Interest bearing loans from subsidiaries, etc. 9,091 9,085 13 - 9,098Trade payables 54 54 - - 54Other payables 213 213 - - 213Other payables to subsidiaries, etc. 15 15 - - 15Non-derivative financial liabilities 15,602 10,117 2,993 3,403 16,513Derivatives 589 302 132 155 589Total recognised in balance sheet 16,191 10,419 3,125 3,558 17,102
Total 10,419 3,125 3,558 17,102
2019Bank and other credit institutions 2,865 336 1,745 1,247 3,328Lease liabilities 13 9 4 - 13Issued bonds 4,819 429 2,295 2,901 5,625Interest bearing loans from subsidiaries, etc. 5,031 5,048 - - 5,048Trade payables 58 58 - - 58Other payables 156 156 - - 156Other payables to subsidiaries, etc. 15 15 - - 15Non-derivative financial liabilities 12,957 6,051 4,044 4,148 14,243Derivatives 418 94 94 230 418Total recognised in balance sheet 13,375 6,145 4,138 4,378 14,661
Total 6,145 4,138 4,378 14,661
130 A.P. Møller - Mærsk A/S Annual Report 2020 Amounts in USD million Notes indexParent company financial statementsFinancials

Note 13 Financial instruments by categoryTable 13.1 Carrying amount Fair value2
2020 2019 2020 2019
Carried at amortised costInterest-bearing receivables from subsidiaries, etc. 17,166 20,717 17,217 20,723Lease receivables 9 19Total interest-bearing receivables 17,175 20,736 17,217 20,723Trade receivables 3 8Other receivables (non-interest-bearing) 120 102Other receivables from subsidiaries, etc. 249 286Cash and bank balances 4,491 3,395Financial assets at amortised cost 22,038 24,527
Derivatives 576 230 576 230
Equity investments (FVOCI)1 1 2 1 2 Other financial assets 577 232 577 232
Total financial assets 22,615 24,759
Carried at amortised costBank and other credit institutions 2,401 2,865 2,428 2,918 Lease liabilities 4 13 Issued bonds 3,824 4,819 4,047 5,040 Interest-bearing loans from subsidiaries, etc. 9,091 5,031 9,091 5,031 Total borrowings 15,320 12,728 15,566 12,989 Trade payables 54 58Other payables 213 156Other payables to subsidiaries and associated companies, etc. 15 15Financial liabilities at amortised cost 15,602 12,957
Carried at fair valueDerivatives 589 418 589 418Financial liabilities at fair value 589 418 589 418
Total financial liabilities 16,191 13,375
Table 13.1Equity investments at fair value through other comprehensive income1 The company holds only minor equity investments
at fair value through other comprehensive income (FVOCI).
2 Where no fair value is stated the amount equals carrying amount.
131 A.P. Møller - Mærsk A/S Annual Report 2020 Amounts in USD million Notes indexParent company financial statementsFinancials
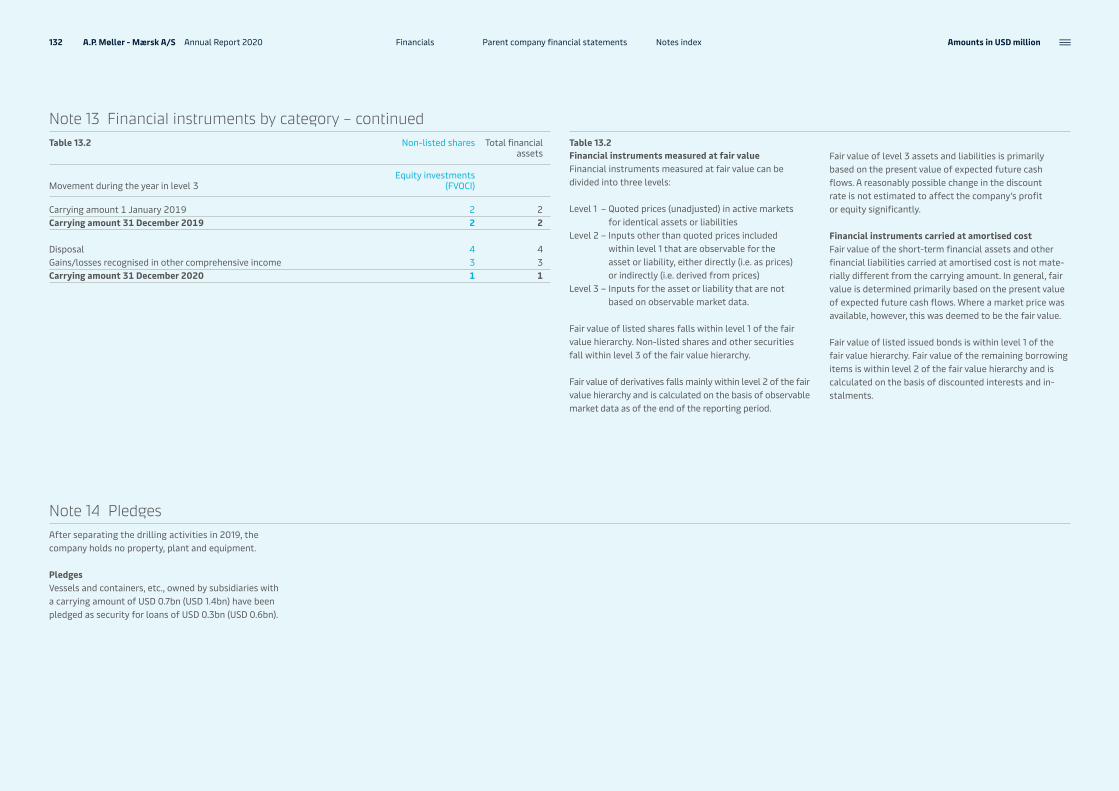
Note 13 Financial instruments by category – continuedTable 13.2 Non-listed shares Total financial
assets
Movement during the year in level 3Equity investments
(FVOCI)
Carrying amount 1 January 2019 2 2Carrying amount 31 December 2019 2 2
Disposal 4 4Gains/losses recognised in other comprehensive income 3 3Carrying amount 31 December 2020 1 1
Table 13.2Financial instruments measured at fair valueFinancial instruments measured at fair value can be divided into three levels:
Level 1 – Quoted prices (unadjusted) in active markets for identical assets or liabilities
Level 2 – Inputs other than quoted prices included within level 1 that are observable for the asset or liability, either directly (i.e. as prices) or indirectly (i.e. derived from prices)
Level 3 – Inputs for the asset or liability that are not based on observable market data.
Fair value of listed shares falls within level 1 of the fair value hierarchy. Non-listed shares and other securities fall within level 3 of the fair value hierarchy.
Fair value of derivatives falls mainly within level 2 of the fair value hierarchy and is calculated on the basis of observable market data as of the end of the reporting period.
Fair value of level 3 assets and liabilities is primarily based on the present value of expected future cash flows. A reasonably possible change in the discount rate is not estimated to affect the company’s profit or equity significantly.
Financial instruments carried at amortised costFair value of the short-term financial assets and other financial liabilities carried at amortised cost is not mate-rially different from the carrying amount. In general, fair value is determined primarily based on the present value of expected future cash flows. Where a market price was available, however, this was deemed to be the fair value.
Fair value of listed issued bonds is within level 1 of the fair value hierarchy. Fair value of the remaining borrowing items is within level 2 of the fair value hierarchy and is calculated on the basis of discounted interests and in-stalments.
After separating the drilling activities in 2019, the company holds no property, plant and equipment.
Pledges Vessels and containers, etc., owned by subsidiaries with a carrying amount of USD 0.7bn (USD 1.4bn) have been pledged as security for loans of USD 0.3bn (USD 0.6bn).
Note 14 Pledges
132 A.P. Møller - Mærsk A/S Annual Report 2020 Amounts in USD million Notes indexParent company financial statementsFinancials

Note 15 CommitmentsThe future charter and operating lease payments for continuing operations are:
Table 15.1 2020 2019
Within one year 5 5Total 5 5
Table 15.1Operating lease commitmentsAs part of the company’s activities, customary agree-ments are entered into regarding operating lease of vessels, equipment and office buildings, etc.
Total operating lease costs incurred are stated in note 2.
Capital commitmentsThe company has no material capital commitments at the end of 2020.
As part of the divestment of Mærsk Olie og Gas A/S (MOGAS) to Total S.A. in 2018, the company has assumed a secondary liability related to the decommissioning of the offshore facilities in Denmark by issuance of a declaration. The company assesses the risk of economic outflows due to this secondary liability as very remote.
Guarantees amount to USD 0.3bn (USD 0.4bn). Thereof, USD 0.3bn (USD 0.4bn) is related to subsidiaries. The guarantees are not expected to be realised, but they can mature within one year.
Except for customary agreements within the company’s activities, no material agreements have been entered into that will take effect, change or expire upon changes of the control over the company.
The company is involved in a number of legal cases, tax, and other disputes. Some of these involve significant amounts and are subject to considerable uncertainty. Management continuously assess the risks associated with the cases and disputes, and their likely outcome. It is the opinion of Management that, apart from items recog-
nized in the financial statements, the outcome of these cases and disputes are not probable or cannot be reliably estimated in the term of amount or timing. The Company does not expect these to have a material impact on the financial statements.
Tax may crystallise on repatriation of dividends. Through participation in joint taxation scheme with A.P. Møller Holding A/S, the company is jointly and severally liable for taxes payable, etc. in Denmark.
Note 16 Contingent liabilities
Note 17 Cash flow specificationsTable 17.1 2020 2019
Change in working capitalTrade receivables 5 -2Other receivables and prepayments 70 -64Trade payables and other payables, etc. 53 28Exchange rate adjustment of working capital 13 1Total 141 -37
133 A.P. Møller - Mærsk A/S Annual Report 2020 Amounts in USD million Notes indexParent company financial statementsFinancials

Note 18 Related partiesTable 18.1 Controlling parties Subsidiaries Associated companies Joint ventures Management 1
Continuing operations 2020 2019 2020 2019 2020 2019 2020 2019 2020 2019
Income statementRevenue - - 17 18 - - - - - - Operating costs - - 11 12 - - - - - - Remuneration to management - - - - - - - - 14 15Dividends - - 413 305 - - - 19 - - Financial income 59 12 895 1,151 - - - - - - Financial expenses - 2 169 141 - - - - - -
AssetsInterest-bearing receivables, non-current - - 15,044 7,913 - - - - - - Derivatives, non-current - - - 4 - - - - - - Other receivables, non-current 25 27 - - - - - - - - Trade receivables - - 3 8 - - - - - - Interest-bearing receivables, current - - 2,121 12,804 - - 1 - - - Derivatives, current - - 19 24 - - - - - - Other receivables, current 49 5 249 286 - - - - - - Cash and bank balances 487 644 - - - - - - - -
LiabilitiesInterest-bearing debt, non-current - - 13 - - - - - - - Derivatives, non-current - 33 6 1 - - - - - - Interest-bearing debt, current - - 9,078 5,031 - - - - - - Trade payables - - 23 20 - - - - - - Derivatives, current 44 5 107 35 - - - - - - Other liabilities, current 4 6 15 15 - - - - - -
Sale of companies, property, plant and equipment - - 10 - 4 - - - - - Capital increases and purchase of shares - - 4,565 850 - - - - - - Return of capital - - - 5,780 - - - - - -
Table 18.1Joint usage agreement with A.P. Møller Holding A/SWith the objective of further strengthening the value of the brands, A.P. Møller - Mærsk A/S entered into a joint usage agreement with A.P. Møller Holding A/S in 2018 regarding the use of commonly used trademarks which historically have benefited both A.P. Møller - Mærsk A/S and A.P. Møller Holding A/S. A.P. Møller Holding A/S is the controlling shareholder of A.P. Møller - Mærsk A/S, and is wholly owned by A.P. Møller og Hustru Chastine Mc-Kinney Møllers Fond til almene Formaal. The joint usage agree-ment establishes a framework and a branding strategy for the commonly used trademarks and a joint brand board,where the parties can cooperate regarding the use of these trademarks.
Share buy-back programmeAccording to separate agreement, A.P. Møller Holding A/S participates on a pro rata basis to the shares purchased in the company’s share buy-back programme.
A.P. Møller Holding A/S, Copenhagen, Denmark, has control over the company and prepares consolidated financial statements. A.P. Møller og Hustru Chastine Mc-Kinney Møllers Fond til almene Formaal is the ultimate owner.
Dividends distributed are not included.
1 The Board of Directors and the Executive Board in A.P. Møller - Mærsk A/S, A.P. Møller Holding A/S, A.P. Møller og Hustru Chastine Mc-Kinney Møllers Fond til almene Formaal and their close relatives (including undertakings under their significant influence).
134 A.P. Møller - Mærsk A/S Annual Report 2020 Amounts in USD million Notes indexParent company financial statementsFinancials

The financial statements for 2020 for A.P. Møller - Mærsk A/S have been prepared on a going concern basis and in accordance with the International Financial Reporting Standards (IFRS) as adopted by the EU and additional Danish disclosure requirements for listed companies. The consolidated financial statements are also in accordance with IFRS as issued by the Inter-national Accounting Standards Board (IASB).
The accounting policies of the company are consistent with those applied in the financial statements for 2019, apart from the fact that the company in December 2019 elected to early adopt the amendments to IFRS 9, IAS 39 and IFRS 7 included in IASB’s project ‘Interest Rate Benchmark Reform’.
The accounting policies are furthermore consistent with the accounting policies for the Group’s financial state-ments (note 23 in the consolidated financial statements) with the following exceptions:
• Shares in subsidiaries and associated companies are measured at cost or a lower recoverable amount
• Dividends from subsidiaries and associated companies are recognised as income at the time of declaration unless considered a return of capital in subsidiary
• No segment information is disclosed• Value of granted share options, restricted shares and
performance shares to employees in subsidiaries is expensed directly in the relevant subsidiary. At the time of the grant, the subsidiary settles the amount with A.P. Møller - Mærsk A/S and the counter posting is made in equity. At the time of exercising, the proceeds are included in the company’s equity.
New financial reporting requirementsThe company has not yet adopted the following accounting standards/requirements:
IFRS 17 – Insurance contractsIFRS 17: An analysis of the impact is being assessed and is expected to be concluded in due course ahead of the implementation date.
Other changes to IFRS are not expected to have any significant impact on recognition and measurement.
Note 19 Significant accounting policies
When preparing the financial statements of the company, management undertakes a number of accounting esti-mates and judgements to recognise, measure and classify the company’s assets and liabilities.
Estimates that are material to the company’s financial re-porting are made on the basis of, inter alia, determination of impairment of financial non-current assets including subsidiaries and associated companies (including assets held for sale) and recognition and measurements of pro-visions. Reference is made to notes 4, 6 and 11.
Management assesses impairment indicators for invest-ments in subsidiaries and associated companies and determines recoverable amount generally consistent with the assumptions described in notes 6, 7 and 24 of the consolidated financial statements.
The accounting estimates and judgements are described in further detail in note 24 of the consolidated financial statements.
Note 20 Significant accounting estimates and judgements
135 A.P. Møller - Mærsk A/S Annual Report 2020 Amounts in USD million Notes indexParent company financial statementsFinancials

Executive Board
Søren Skou — CEO
Patrick Jany — CFO
Vincent Clerc
Morten Engelstoft
Henriette Hallberg Thygesen
Board of Directors
Jim Hagemann Snabe — Chairman
Ane Mærsk Mc-Kinney Uggla — Vice Chairman
Dorothee Blessing
Bernard L. Bot
Marc Engel
Arne Karlsson
Thomas Lindegaard Madsen
Blythe S. J. Masters
Jacob Andersen Sterling
Robert Mærsk Uggla
Statement of the Board of Directors and the Executive Board
The Board of Directors and the Executive Board have today discussed and approved the Annual Report of A.P. Møller - Mærsk A/S for 2020.
The Annual Report for 2020 of A.P. Møller - Mærsk A/S has been prepared in accordance with International Financial Reporting Standards (IFRS) as adopted by the EU and further re quirements in the Danish Finan cial Statements Act, and in our opinion gives a true and fair view of A.P. Moller - Maersk’s and the company’s assets and liabilities and financial position at 31 Decem-ber 2020 and of the results of A.P. Moller - Maersk’s and the company’s operations and cash flows for the financial year 2020.
In our opinion, the Directors’ Report includes a fair review of the development in A.P. Moller - Maersk’s and the company’s operations and financial con-ditions, the results for the year, cash flows and financial position as well as a description of the most sig nificant risks and uncertainty factors that A.P. Moller - Maersk and the company face.
In our opinion, the annual report of A.P. Møller - Mærsk A/S for the financial year 1 January to 31 December 2020 identified as with the file name APMM-2020-12-31.zip is prepared, in all material respects, in compliance with the ESEF Regulation.
We recommend that the Annual Report be approved at the Annual General Meeting on 23 March 2021.
Copenhagen, 10 February 2021
136 A.P. Møller - Mærsk A/S Annual Report 2020 Statement of the Board of Directors and the Executive BoardFinancials
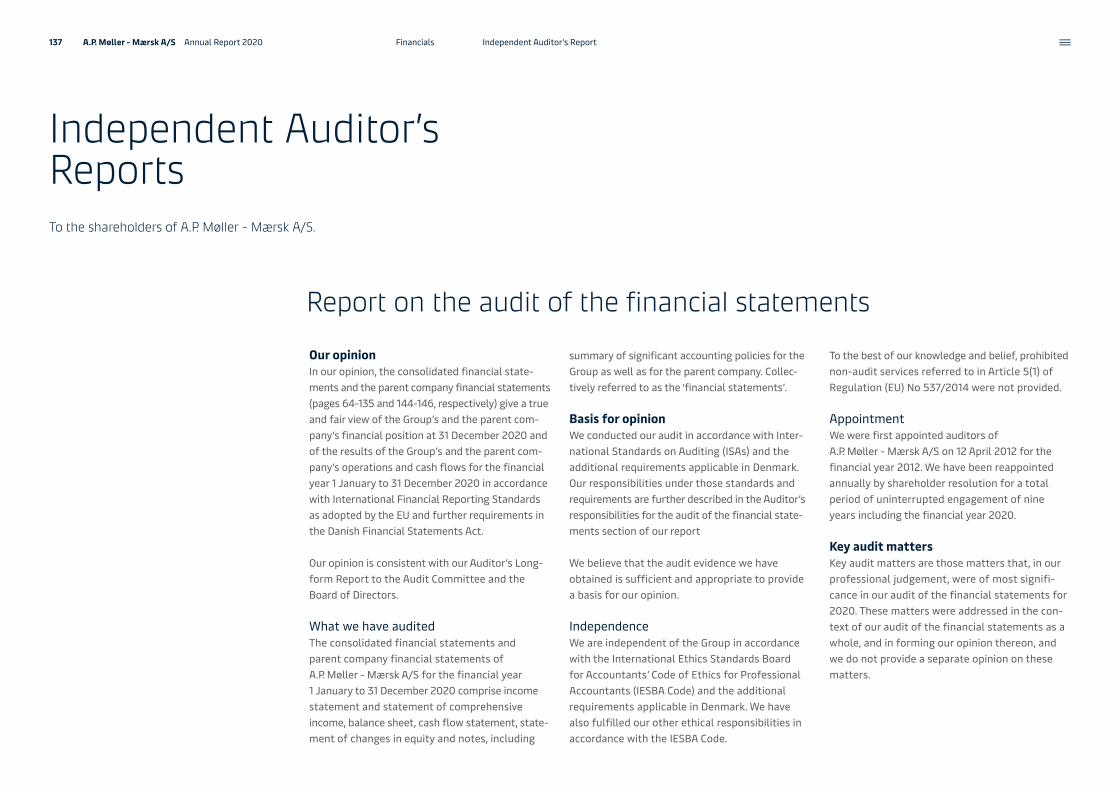
Our opinionIn our opinion, the consolidated financial state-ments and the parent company financial statements (pages 64-135 and 144-146, respectively) give a true and fair view of the Group’s and the parent com-pany’s financial position at 31 December 2020 and of the results of the Group’s and the parent com-pany’s operations and cash flows for the financial year 1 January to 31 December 2020 in accordance with International Financial Reporting Standards as adopted by the EU and further requirements in the Danish Financial Statements Act.
Our opinion is consistent with our Auditor’s Long-form Report to the Audit Committee and the Board of Directors.
What we have auditedThe consolidated financial statements and parent company financial statements of A.P. Møller - Mærsk A/S for the financial year 1 January to 31 December 2020 comprise income statement and statement of comprehensive income, balance sheet, cash flow statement, state-ment of changes in equity and notes, including
summary of significant accounting policies for the Group as well as for the parent company. Collec-tively referred to as the ‘financial statements’.
Basis for opinionWe conducted our audit in accordance with Inter-national Standards on Auditing (ISAs) and the additional requirements applicable in Denmark. Our responsibilities under those standards and requirements are further described in the Auditor’s responsibilities for the audit of the financial state-ments section of our report
We believe that the audit evidence we have obtained is sufficient and appropriate to provide a basis for our opinion.
IndependenceWe are independent of the Group in accordance with the International Ethics Standards Board for Accountants’ Code of Ethics for Professional Accountants (IESBA Code) and the additional requirements applicable in Denmark. We have also fulfilled our other ethical responsibilities in accordance with the IESBA Code.
To the best of our knowledge and belief, prohibited non-audit services referred to in Article 5(1) of Regulation (EU) No 537/2014 were not provided.
AppointmentWe were first appointed auditors of A.P. Møller - Mærsk A/S on 12 April 2012 for the financial year 2012. We have been reappointed annually by shareholder resolution for a total period of uninterrupted engagement of nine years including the financial year 2020.
Key audit mattersKey audit matters are those matters that, in our professional judgement, were of most signifi-cance in our audit of the financial statements for 2020. These matters were addressed in the con-text of our audit of the financial statements as a whole, and in forming our opinion thereon, and we do not provide a separate opinion on these matters.
Independent Auditor’s ReportsTo the shareholders of A.P. Møller - Mærsk A/S.
Report on the audit of the financial statements
137 A.P. Møller - Mærsk A/S Annual Report 2020 Independent Auditor’s ReportFinancials

Revenue recognitionKey audit matter How our audit addressed the key audit matter
Recognition of revenue is complex due to the volume of transactions and the variety of different revenue streams within the segments.
We focused on this area due to the significance of amounts involved and because recognition of revenue involves accounting policy decisions, and judgements made by Management originating from different customer behavior, market con-ditions, terms and nature of services in the various segments. Further, the volume of transactions and extent of different revenue streams require various IT setups to ensure correct revenue recognition, which are complex and introduce an inher-ent risk to the revenue recognition process.
Reference is made to notes 1 and 23 in the consolidated financial statements.
Our audit procedures included considering the appropriateness of the revenue rec-ognition accounting policies and assessing compliance with applicable accounting standards.
We tested the IT setups supporting the revenue recognition as well as relevant inter-nal controls and Management’s monitoring of internal controls.
We used data analytics on selected revenue streams and performed substantive pro-cedures over invoicing and relevant contracts in order to assess the accounting treat-ment and principles applied, and tested journal entries on revenue. Further, we tested timing to ensure that the revenue is recognised in the correct financial year.
Recoverability of the carrying amount of property, plant and equipmentKey audit matter How our audit addressed the key audit matter
The most significant risks in relation to Management’s assessment of the recov-erability of the carrying amount of property, plant and equipment relate to the definition of cash-generating units (CGUs), identification of CGUs with indicators of impairment and, where relevant, the estimate of the fair values less costs to sell and the values in use, including determination of key assumptions.
Bearing in mind the generally long-lived nature of the assets, the most critical assumptions in estimating the future cash flows are Management’s long-term outlook for freight and terminal rates, volume growth, bunker price and capital expenditures as well as determining the discount rates.
We focused on this area, as the carrying amounts are significant and because Management is required to exercise considerable judgement because of the inherent complexity in estimating the fair values less costs to sell or the values in use.
Reference is made to notes 7 and 23, 24 in the consolidated financial statements.
In addressing the risks, we considered the appropriateness of the defined CGUs within the businesses. We examined the methodology used by Management to assess the car-rying amount of property, plant and equipment assigned to CGUs, and the process for identifying CGUs that required impairment testing to determine compliance with IFRS as adopted by the EU.
We performed detailed testing for the assets where indicators of impairment were identified. For those assets, we reviewed Management’s testing of the fair values less costs to sell or the values in use, including analysed the reasonableness of key assump-tions in relation to the ongoing operation of the assets.
We corroborated Management’s estimates of future cash flows and challenged whether these are appropriate in respect of key assumptions, such as freight and terminal rates, volume growth, bunker price and capital expenditures.
We used our internal valuation specialists to independently challenge the discount rates. In calculating the discount rates, the key inputs used were independently sourced from market data, and we assessed the methodology applied.
Further, we tested the mathematical accuracy of the relevant fair value less cost to sell and value in use models prepared by Management.
Statement on Directors’ ReportManagement is responsible for Directors’ Report (pages 3-62, 142-143 and 149, respectively).
Our opinion on the financial statements does not cover Directors’ Report, and we do not express any form of assurance conclusion thereon.
In connection with our audit of the financial statements, our responsibility is to read Directors’ Report and, in doing so, consider whether Directors’ Report is materially inconsistent with the financial statements or our knowledge obtained in the audit, or otherwise appears to be materially misstated.
Moreover, we considered whether Directors’ Report includes the disclosures required by the Danish Financial Statements Act.
Based on the work we have performed, in our view, Directors’ Report is in accordance with the consol-idated financial statements and the parent com-pany financial statements and has been prepared in accordance with the requirements of the Danish Financial Statements Act. We did not identify any material misstatement in Directors’ Report.
Management’s responsibilities for the financial statementsManagement is responsible for the preparation of consolidated financial statements and parent company financial statements that give a true and fair view in accordance with International Financial Reporting Standards as adopted by the EU and further requirements in the Danish Financial Statements Act, and for such internal control as Management determines is necessary to enable the preparation of financial statements that are free from material misstatement, whether due to fraud or error.
138 A.P. Møller - Mærsk A/S Annual Report 2020 Independent Auditor’s ReportFinancials

In preparing the financial statements, Manage-ment is responsible for assessing the Group’s and the parent company’s ability to continue as a going concern, disclosing, as applicable, mat-ters related to going concern and using the going concern basis of accounting unless Management either intends to liquidate the Group or the par-ent company or to cease operations, or has no realistic alternative but to do so.
Auditor’s responsibilities for the audit of the financial statementsOur objectives are to obtain reasonable assurance about whether the financial statements as a whole are free from material misstatement, whether due to fraud or error, and to issue an Auditor’s Report that includes our opinion. Reasonable assurance is a high level of assurance, but is not a guarantee that an audit conducted in accordance with ISAs and the additional requirements applicable in Denmark will always detect a material misstatement when it exists. Misstatements can arise from fraud or error and are considered material if, individually or in the aggregate, they could reasonably be expected to influence the economic decisions of users taken on the basis of these financial statements.
As part of an audit in accordance with ISAs and the additional requirements applicable in Denmark, we exercise professional judgement and maintain pro-fessional scepticism throughout the audit. We also:• Identify and assess the risks of material mis-
statement of the financial statements, whether due to fraud or error, design and perform audit procedures responsive to those risks, and obtain audit evidence that is sufficient and appropri-ate to provide a basis for our opinion. The risk of not detecting a material misstatement resulting from fraud is higher than for one resulting from error, as fraud may involve collusion, forgery,
intentional omissions, misrepresentations, or the override of internal control.
• Obtain an understanding of internal control relevant to the audit in order to design audit procedures that are appropriate in the circum-stances, but not for the purpose of expressing an opinion on the effectiveness of the Group’s and the parent company’s internal control.
• Evaluate the appropriateness of account-ing policies used and the reasonableness of accounting estimates and related disclosures made by Management.
• Conclude on the appropriateness of Man-agement’s use of the going concern basis of accounting and based on the audit evidence obtained, whether a material uncertainty exists related to events or conditions that may cast significant doubt on the Group’s and the par-ent company’s ability to continue as a going concern. If we conclude that a material uncer-tainty exists, we are required to draw atten-tion in our Auditor’s Report to the related dis-closures in the financial statements or, if such disclosures are inadequate, to modify our opin-ion. Our conclusions are based on the audit evi-dence obtained up to the date of our Auditor’s Report. However, future events or conditions may cause the Group or the parent company to cease to continue as a going concern.
• Evaluate the overall presentation, struc-ture and content of the financial statements, including the disclosures, and whether the financial statements represent the underly-ing transactions and events in a manner that achieves fair presentation.
• Obtain sufficient appropriate audit evidence regarding the financial information of the enti-ties or business activities within the Group to express an opinion on the consolidated finan-cial statements. We are responsible for the
direction, supervision and performance of the Group audit. We remain solely responsible for our audit opinion.
We communicate with those charged with govern-ance regarding, among other matters, the planned scope and timing of the audit and significant audit findings, including any significant deficiencies in internal control that we identify during our audit.
We also provide those charged with governance with a statement that we have complied with rele-vant ethical requirements regarding independence, and to communicate with them all relationships and other matters that may reasonably be thought to bear on our independence, and where applica-ble, related safeguards.
From the matters communicated with those charged with governance, we determine those matters that were of most significance in the audit of the financial statements of the current period and are therefore the key audit matters. We describe these matters in our Auditor’s Report unless law or regulation precludes public disclo-sure about the matter or when, in extremely rare circumstances, we determine that a matter should not be communicated in our report because the adverse consequences of doing so would reason-ably be expected to outweigh the public interest benefits of such communication.
139 A.P. Møller - Mærsk A/S Annual Report 2020 Independent Auditor’s ReportFinancials
Copenhagen, 10 February 2021
PricewaterhouseCoopers Statsautoriseret RevisionspartnerselskabCVR no. 33 77 12 31
Mogens Nørgaard MogensenState Authorised Public Accountantmne21404
Lars BaungaardState Authorised Public Accountantmne23331
Report on compliance with the ESEF Regulation
As part of our audit of the financial statements we performed procedures to express an opinion on whether the annual report of A.P. Møller - Mærsk A/S for the financial year 1 January to 31 December 2020 with the filename APMM-2020-12-31.zip is prepared, in all material respects, in compliance with the Commission Delegated Regulation (EU) 2019/815 on the European Single Electronic For-mat (ESEF Regulation) which includes require-ments related to the preparation of the annual report in XHTML format and iXBRL tagging of the consolidated financial statements.
Management is responsible for preparing an annual report that complies with the ESEF Regulation. This responsibility includes:
• The preparing of the annual report in XHTML format;
• The selection and application of appropriate iXBRL tags, including extensions to the ESEF taxonomy and the anchoring thereof to ele-ments in the taxonomy, for all financial infor-mation required to be tagged using judgement where necessary;
• Ensuring consistency between iXBRL tagged data and the consolidated financial statements presented in human-readable format; and
• For such internal control as Management determines necessary to enable the preparation of an annual report that is compliant with the ESEF Regulation.
Our responsibility is to obtain reasonable assur-ance on whether the annual report is prepared, in all material respects, in compliance with the ESEF Regulation based on the evidence we have obtained, and to issue a report that includes our opinion. The nature, timing and extent of proce-dures selected depend on the auditor’s judgement, including the assessment of the risks of material departures from the requirements set out in the ESEF Regulation, whether due to fraud or error. The procedures include:
• Testing whether the annual report is prepared in XHTML format;
• Obtaining an understanding of the company’s iXBRL tagging process and of internal control over the tagging process;
• Evaluating the completeness of the iXBRL tag-ging of the consolidated financial statements;
• Evaluating the appropriateness of the com-pany’s use of iXBRL elements selected from the ESEF taxonomy and the creation of exten-sion elements where no suitable element in the ESEF taxonomy has been identified;
• Evaluating the use of anchoring of extension elements to elements in the ESEF taxonomy; and
• Reconciling the iXBRL tagged data with the audited consolidated financial statements.
In our opinion, the annual report of A.P. Møller - Mærsk A/S for the financial year 1 January to 31 December 2020 with the file name APMM-2020-12-31.zip is prepared, in all material respects, in compliance with the ESEF Regulation.
140 A.P. Møller - Mærsk A/S Annual Report 2020 Independent Auditor’s ReportFinancials
Additional information
Quarterly summary2
Company overview1
Stock exchange announcements
Definition of terms
External financial reporting for A.P. Moller - Maersk2
1 Part of Financials2 Part of the Directors’ Report
141 A.P. Moller - Maersk Annual Report 2020

Quarterly summary 1/22020 2019
Income statement Q4 Q3 Q2 Q1 Q4 Q3 Q2 Q1
Revenue 11,255 9,917 8,997 9,571 9,668 10,055 9,627 9,540Profit before depreciation, amortisation and impairment losses, etc. (EBITDA) 2,711 2,297 1,697 1,521 1,463 1,656 1,357 1,236Depreciation, amortisation and impairment losses, net 1,222 1,097 1,149 1,073 1,160 1,021 1,024 1,082Gain on sale of non-current assets, etc., net 30 8 145 19 1 36 16 18Share of profit/loss in joint ventures and associated companies 75 81 58 85 38 66 67 58Profit/loss before financial items (EBIT) 1,594 1,289 751 552 342 737 416 230Financial items, net -272 -160 -232 -215 -212 -148 -170 -228Profit/loss before tax 1,322 1,129 519 337 130 589 246 2Tax 21 182 76 128 191 69 92 106Profit/loss for the period – continuing operations 1,301 947 443 209 -61 520 154 -104Profit/loss for the period – discontinued operations - - - - - - -1 -552Profit/loss for the period 1,301 947 443 209 -61 520 153 -656A.P. Møller - Mærsk A/S’ share 1,299 927 427 197 -72 506 141 -659
Underlying profit/loss – continuing operations 1,361 1,043 359 197 29 452 134 -69
Balance sheet
Total assets 56,117 56,162 55,319 53,990 55,399 55,662 56,555 61,701Total equity 30,854 29,547 28,569 27,945 28,837 28,879 28,997 32,843Invested capital 40,121 40,404 40,186 39,977 40,555 40,938 41,910 46,491Net interest-bearing debt 9,232 10,804 11,564 11,978 11,662 12,056 12,910 12,565
Cash flow statement
Cash flow from operating activities 2,569 2,176 1,867 1,216 1,535 1,732 1,170 1,482Gross capital expenditure, excl. acquisitions and divestments (CAPEX) 370 280 362 310 469 343 445 778Cash flow from financing activities -2,400 -1,539 -59 -1,620 -1,209 -1,520 -769 -1,302Free cash flow 1,666 1,486 1,051 445 800 946 270 324Net cash flow from discontinued operations - - - - - - -419 47
142 A.P. Moller - Maersk Annual Report 2020 Additional information Quarterly summary Amounts in USD million
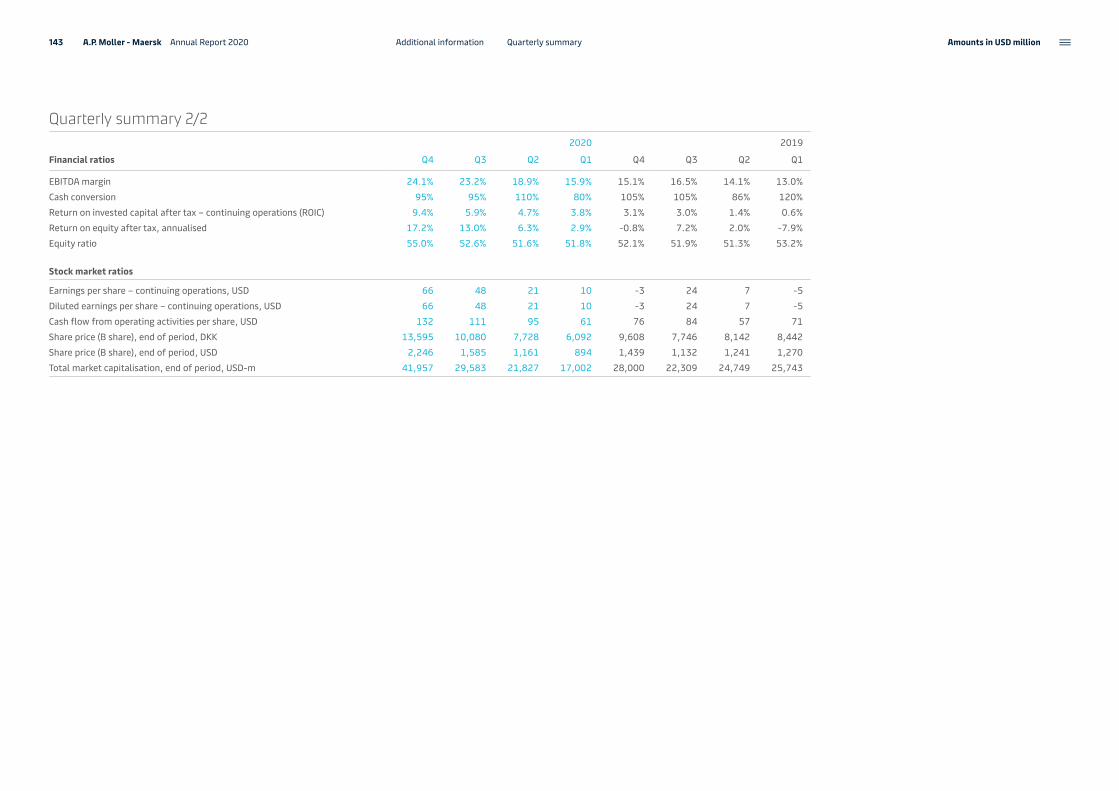
Quarterly summary 2/22020 2019
Financial ratios Q4 Q3 Q2 Q1 Q4 Q3 Q2 Q1
EBITDA margin 24.1% 23.2% 18.9% 15.9% 15.1% 16.5% 14.1% 13.0%Cash conversion 95% 95% 110% 80% 105% 105% 86% 120%Return on invested capital after tax – continuing operations (ROIC) 9.4% 5.9% 4.7% 3.8% 3.1% 3.0% 1.4% 0.6%Return on equity after tax, annualised 17.2% 13.0% 6.3% 2.9% -0.8% 7.2% 2.0% -7.9%Equity ratio 55.0% 52.6% 51.6% 51.8% 52.1% 51.9% 51.3% 53.2%
Stock market ratios
Earnings per share – continuing operations, USD 66 48 21 10 -3 24 7 -5Diluted earnings per share – continuing operations, USD 66 48 21 10 -3 24 7 -5Cash flow from operating activities per share, USD 132 111 95 61 76 84 57 71Share price (B share), end of period, DKK 13,595 10,080 7,728 6,092 9,608 7,746 8,142 8,442Share price (B share), end of period, USD 2,246 1,585 1,161 894 1,439 1,132 1,241 1,270Total market capitalisation, end of period, USD-m 41,957 29,583 21,827 17,002 28,000 22,309 24,749 25,743
143 A.P. Moller - Maersk Annual Report 2020 Additional information Quarterly summary Amounts in USD million

Company overviewA.P. Moller - Maersk comprises more than 790 companies of which the largest are listed below. The Danish Financial Statements Act section 97a, par. 4 has been applied in the company overview.
A more comprehensive list of companies is available at https://investor.maersk.com/financials.cfm
1 Hamburg Südamerikanische Dampfschifffahrts-Gesellschaft A/S & Co KG, Hamburg, is in accordance with paragraph 264b HGB (German commercial code) exempt from preparing, auditing and disclosing statutory financial statements as well as a management report in accordance with the German commercial law.
SubsidiariesCompany Country of
incorporationOwned share
SubsidiariesCompany Country of
incorporationOwned share
APM Terminals Inland Services S.A. Peru 100%
APM Terminals North America B.V. Netherlands 100%
APM Terminals Pacific LLC United States 90%
APM Terminals Rotterdam B.V. Netherlands 100%
APM Terminals Tangier SA Morocco 90%
Aqaba Container Terminal Company (Pvt) Co. Jordan 50%
Bermutine Transport Corporation Ltd. Bermuda 100%
Coman SA Benin 100%
Container Operators S.A. Chile 100%
Damco (UAE) FZE United Arab Emirates 100%
Damco A/S Denmark 100%
Damco Australia Pty. Ltd. Australia 100%
Damco Belgium NV Belgium 100%
Damco China Ltd. China 100%
Damco Distribution Services Inc. United States 100%
Damco France SAS France 100%
Damco India Pvt. Ltd. India 100%
Damco International A/S Denmark 100%
Damco Logistics Uganda Ltd. Uganda 100%
Damco Sweden AB Sweden 100%
Damco USA Inc. United States 100%
Farrell Lines Inc. United States 100%
Gateway Terminals India Pvt. Ltd. India 74%
Gujarat Pipavav Port Ltd. India 44%
Hamburg Südamerikanische Dampfschifffahrts-Gesellschaft A/S & Co KG1 Germany 100%
Lilypond Container Depot Nigeria Ltd. Nigeria 100%
Maersk (China) Shipping Company Ltd. China 100%
Maersk A/S Denmark 100%
Maersk Agency U.S.A. Inc. United States 100%
Maersk B.V. Netherlands 100%
Maersk Bangladesh Ltd. Bangladesh 100%
A.P. Moller Finance SA Switzerland 100%
A.P. Moller Singapore Pte. Ltd. Singapore 100%
Addicks & Kreye Container Service GmbH & Co. KG Germany 51%
Aliança Navegação e Logística Ltda. Brazil 100%
APM Terminals - Aarhus A/S Denmark 100%
APM Terminals Algeciras S.A. Spain 100%
APM Terminals Apapa Ltd. Nigeria 94%
APM Terminals B.V. Netherlands 100%
APM Terminals Bahrain B.S.C. Bahrain 64%
APM Terminals Callao S.A. Peru 64%
APM Terminals China Co. Ltd. Hong Kong 100%
APM Terminals Elizabeth, LLC United States 100%
APM Terminals Gothenburg AB Sweden 100%
APM Terminals India Pvt. Ltd. India 100%
144 A.P. Moller - Maersk Annual Report 2020 Company overviewAdditional information

SubsidiariesCompany Country of
incorporationOwned share
SubsidiariesCompany Country of
incorporationOwned share
Suez Canal Container Terminal SAE Egypt 55%
Svitzer A/S Denmark 100%
Svitzer Australia Pty Ltd Australia 100%
Svitzer Marine Ltd. United Kingdom 100%
Terminal 4 S.A. Argentina 100%
West Africa Container Terminal BVI Ltd. British Virgin Islands 100%
West Africa Container Terminal Nigeria Ltd. Nigeria 100%
Maersk Container Industry A/S Denmark 100%
Maersk Container Industry Qingdao Ltd. China 100%
Maersk Denizcilik A.S. Turkey 100%
Maersk Egypt For Maritime Transport SAE Egypt 100%
Maersk FPSOs A/S Denmark 100%
Maersk Gabon SA Gabon 100%
Maersk Global Service Centres (Chengdu) Ltd. China 100%
Maersk Global Service Centres (India) Pvt. Ltd. India 100%
Maersk Holding B.V. Netherlands 100%
Maersk Hong Kong Ltd. Hong Kong 100%
Maersk Inc. United States 100%
Maersk Inter Holding B.V. Netherlands 100%
Maersk Line Agency Holding A/S Denmark 100%
Maersk Line UK Ltd. United Kingdom 100%
Maersk Line, Limited United States 100%
Maersk Logistics Warehousing China Company Ltd. Hong Kong 100%
Maersk Oil Trading and Investments A/S Denmark 100%
Maersk Oil Trading Inc. United States 100%
Maersk Shipping Hong Kong Ltd. Hong Kong 100%
Maersk Supply Service (Angola) Lda. Angola 49%
Maersk Supply Service A/S Denmark 100%
Maersk Supply Service Canada Ltd. Canada 100%
Maersk Supply Service International A/S Denmark 100%
Maersk Supply Service UK Ltd. United Kingdom 100%
Maersk Vietnam Ltd. Vietnam 100%
New Times International Transport Service Co. Ltd. China 100%
Poti Sea Port Corporation Georgia 100%
PT Damco Indonesia Indonesia 98%
Rederiaktieselskabet Kuling Denmark 100%
Rederiet A.P. Møller A/S Denmark 100%
Safmarine (Pty) Ltd. South Africa 100%
Safmarine MPV NV Belgium 100%
Sealand Europe A/S Denmark 100%
Sealand Maersk Asia Pte. Ltd. Singapore 100%
Sogester - Sociedade Gestora De Terminais S.A. Angola 51%
145 A.P. Moller - Maersk Annual Report 2020 Company overviewAdditional information

Abidjan Terminal SA Côte d’Ivoire 49%
Brigantine International Holdings Ltd. Hong Kong 30%
Brigantine Services Ltd. Hong Kong 30%
Congo Terminal Holding SAS France 30%
Congo Terminal SA Republic of the Congo 15%
Cosco Ports (Nansha) Ltd. British Virgin Islands 34%
Guangzhou South China Oceangate Container Terminal Co. Ltd. China 20%
Höegh Autoliners Holdings AS Norway 39%
Meridian Port Services Ltd. Ghana 35%
Pelabuhan Tanjung Pelepas Sdn. Bhd. Malaysia 30%
Salalah Port Services Company SAOG Oman 30%
Shanghai Tie Yang Multimodal Transportation Co. Ltd. China 29%
South Asia Gateway Pvt. Ltd. Sri Lanka 33%
Tianjin Port Alliance International Container Terminal Co. Ltd. China 20%
Anchor Storage Ltd. Bermuda 51%
Brasil Terminal Portuario S.A. Brazil 50%
Cai Mep International Terminal Co. Ltd. Vietnam 49%
Douala International Terminal S.A. Cameroon 44%
Eurogate Container Terminal Wilhelmshaven Beteiligungsgesellschaft GmbH Germany 30%
First Container Terminal ZAO Russian Federation 31%
Global Ports Investments PLC Cyprus 31%
North Sea Terminal Bremerhaven Verwaltungsgesellschaft GmbH Germany 50%
Petrolesport Inc. Russian Federation 31%
Qingdao New Qianwan Container Terminal Co. Ltd. China 19%
Qingdao Qianwan Container Terminal Co. Ltd. China 20%
Shanghai East Container Terminal Co. Ltd. China 49%
Smart International Logistics Company Ltd. China 49%
South Florida Container Terminal LLC USA 49%
Vostochnaya Stevedore Company OOO Russian Federation 31%
Xiamen Songyu Container Terminal Co. Ltd. China 25%
Associated companiesCompany Country of
incorporationOwned share
Joint venturesCompany Country of
incorporationOwned share
146 A.P. Moller - Maersk Annual Report 2020 Company overviewAdditional information
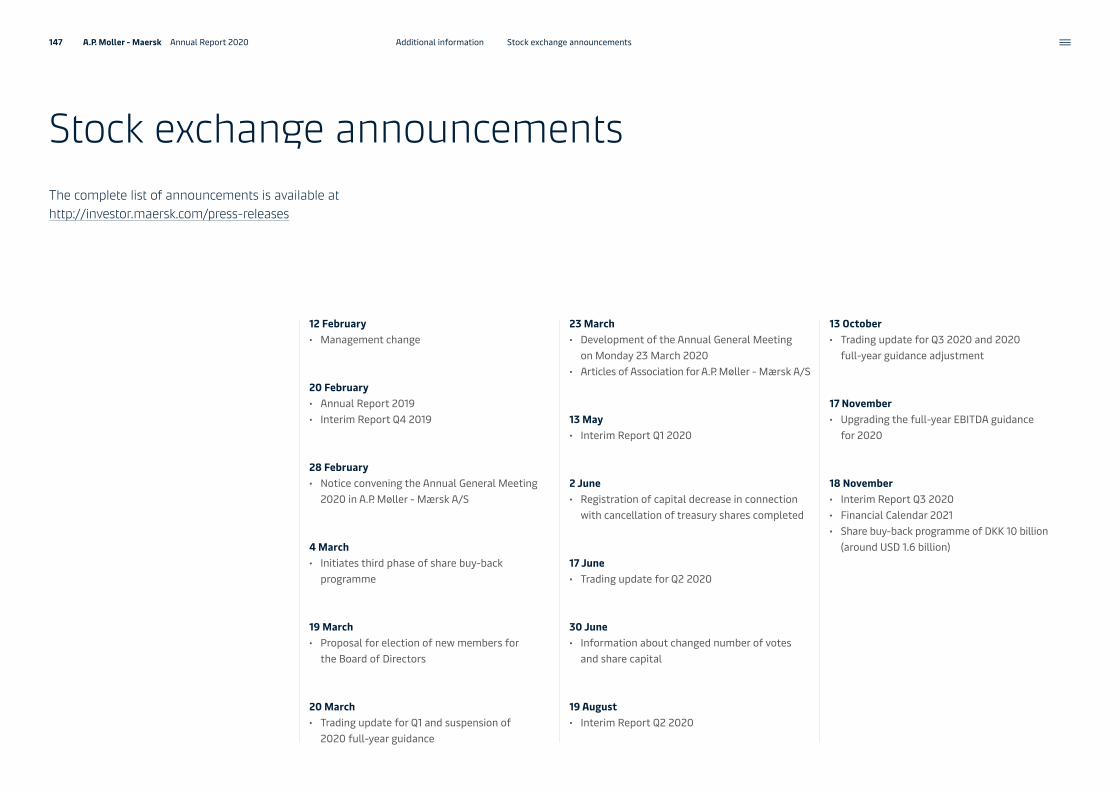
Stock exchange announcementsThe complete list of announcements is available at http://investor.maersk.com/press-releases
12 February • Management change
20 February• Annual Report 2019• Interim Report Q4 2019
28 February• Notice convening the Annual General Meeting
2020 in A.P. Møller - Mærsk A/S
4 March• Initiates third phase of share buy-back
programme
19 March• Proposal for election of new members for
the Board of Directors
20 March• Trading update for Q1 and suspension of
2020 full-year guidance
23 March• Development of the Annual General Meeting
on Monday 23 March 2020• Articles of Association for A.P. Møller - Mærsk A/S
13 May • Interim Report Q1 2020
2 June • Registration of capital decrease in connection
with cancellation of treasury shares completed
17 June• Trading update for Q2 2020
30 June• Information about changed number of votes
and share capital
19 August• Interim Report Q2 2020
13 October• Trading update for Q3 2020 and 2020
full-year guidance adjustment
17 November• Upgrading the full-year EBITDA guidance
for 2020
18 November• Interim Report Q3 2020• Financial Calendar 2021• Share buy-back programme of DKK 10 billion
(around USD 1.6 billion)
147 A.P. Moller - Maersk Annual Report 2020 Stock exchange announcementsAdditional information
per manent partial disability and lost workday cases.
Net interest-bearing debt (NIBD)Equals interest-bearing debt, including lease liabilities, fair value of derivatives hedging the underlying debt, less cash and bank balances as well as other interest- bearing assets.
Non-Ocean revenue growth, %Non-Ocean includes the current Logistics & Services, Terminals & Towage and Manufacturing & Others segments, but excludes Maersk Oil Trading and tramp activities acquired as part of the Hamburg Süd trans action.
Ocean, hub productivity (PMPH)Productivity is calculated as the average of the gross moves per hour for each call. Gross moves per hour for a single vessel call is defined as the total container moves (on load, off load and repositioning) divided by the number of hours for which the vessel is at berth.
Ocean, loaded freight rate (USD per FFE)Average freight rate per FFE for all the Maersk containers loaded in the period in either Maersk Line or Hamburg Süd vessels or third parties (excluding inter-modal). Hamburg Süd is not excluding intermodal.
Ocean, unit cost, fixed bunker (USD per FFE incl. VSA income)Cost per FFE assuming a bunker price at USD 200/tonne excluding intermodal but including hubs and time charter income. Hamburg Süd is not excluding intermodal.
Return on equity after taxCalculated as the profit/loss for the year divided by the average equity.
Definition of terms Technical terms, abbreviations and definitions of key figures and financial ratios.
on lease liabilities) are not included in the free cash flow.
Gross profitThe sum of revenue, less variable costs and loss on debtors.
HeadhaulThe direction of the trade route that has the highest volume, whereas the return direction is referred to as backhaul.
IMO 2020The International Maritime Organiza-tion’s (IMO) 0.5% global cap on sulphur dioxide (SOx) content in fuels for shipping has entered into force on 1 January 2020.
Infrastructure and Logistics revenue A sum of revenue for Terminals & Towage and Logistics & Services report-ing segments less freight forwarding revenue and excluding eliminations between the segments.
Invested capital Segment assets less liabilities.
kcbm1,000 cubic meter is the freight volume of the shipment for domestic and inter-national freight. Cubic meter (CBM) measurement is calculated by multi-plying the width, height and length together of the shipment.
Loaded volumesLoaded volumes refer to the number of FFEs loaded on a shipment which is loaded on first load at vessel departure time excluding displaced FFEs.
Lost-Time Injury frequency (LTIf)Measures the number of lost-time injuries per million exposure hours. Lost-time injuries are the sum of fatalities, permanent total disability,
AlphalinerAlphaliner is a worldwide provider of container shipping data and analyses.
BackhaulThe direction of the trade route that has the lowest volumes, whereas the opposite direction is referred to as headhaul.
CAPEXCash payments for intangible assets and property, plant and equipment, exclud-ing acquisitions and divestments.
Cash conversionCash flow from operating activities to EBITDA ratio.
Cash flow from operating activities per shareA.P. Moller - Maersk’s operating cash flow from continuing operations divided by the number of shares (of DKK 1,000 each), excluding A.P. Moller - Maersk’s holding of own shares.
Cash return on invested capital (CROIC), %Cash return on invested capital is cal culated as free cash flow excluding acquisitions/divestments (cash flow from operating activities less gross CAPEX) divided by average invested capital for continuing operations.
Cost baseEBIT costs including VSA income and hub income and adjustments for restructuring costs, the result from associated companies and gains/losses.
Demurrage and detentionCompensation payable when a cus-tomer holds A.P. Moller - Maersk’s con-tainers beyond the agreed amount of free time, including any storage costs that A.P. Moller - Maersk may have
incurred in connection there with as well as compensation by way of liquidated damages for not having the containers avail able for circulation.
Discontinued operationsDiscontinued operations are a major line of business (disposal group) that is either held for sale or has been sold in previous periods. The disposal group is reported separately in a single line in the income statement and cash flow statement. Comparison figures are restated. In the balance sheet assets and liabilities are classified and dis-closed separately on an aggregate level as assets held for sale and liabil-ities associated with assets held for sale. In the balance sheet comparison figures are not restated. Discontinued operations include Maersk Drilling up to demerger in April 2019.
EBITDAEarnings Before Interest, Taxes, Depre-ciation and Amortisation.
Equity ratioCalculated as equity divided by total assets.
Equity-weighted EBITDAEBITDA weighted on terminal ownership percentages of all entities (subsidiaries, joint ventures and associated companies).
FatalitiesThe headcount number of accidents leading to the death of the employee.
FFEForty Foot container Equivalent unit.
Free cash flowCash flow from operating activities less cash flow from investing activities. Lease payments (repayments of lease liabilities and financial expenses paid
Return on invested capital after tax (ROIC)Profit/loss before financial items for the year (EBIT) less tax on EBIT divided by the average invested capital.
Revenue backlogThe value of future revenue covered by contracts.
Terminals & Towage, annualised EBITDA per tug (terminal towage) (USD in ‘000)Annualised EBITDA per tug equivalent (pilot boats and others count for 0.5).
Terminals & Towage, number of operational tug jobs (harbour towage) (‘000)Tug jobs on which Svitzer performs the physical job, including jobs where Svitzer has the commercial contract with the customer as well as jobs that Svitzer receives from the competitor through over-flow or other agreements.
TEUTwenty-foot container Equivalent Unit.
Time charterHire of a vessel for a specified period.
Total market capitalisationTotal number of shares – excluding A.P. Møller - Mærsk A/S’ holding of own shares – multiplied by the end-of-year price quoted by Nasdaq Copenhagen.
Underlying profit/lossUnderlying profit/loss is profit/loss for the year from con tinuing opera-tions adjusted for net gains/losses from sale of non-current assets, etc., and net impairment losses as well as transaction, restructuring and integra-tion costs related to major transactions. The adjustments are net of tax and include A.P. Moller - Maersk’s share of
mentioned items in joint ventures and associated companies.
VSAA vessel sharing agreement is usually reached between various partners within a shipping consortium who agree to operate a liner service along a specified route using a specified number of vessels.
Women in leadershipThe percentage of women referenced as Senior Managers, Leaders, Senior Leaders, and Executives, compared to total headcount of the same levels.
4PLA 4PL is a fourth-party logistics pro-vider managing resources, technology, infrastructure, and managing external 3PLs to design, build and provide supply chain solutions for businesses.
148 A.P. Moller - Maersk Annual Report 2020 Definition of termsAdditional information
External financial reporting for A.P. Moller - Maersk
Annual reportThe statutory annual report is available in elec-tronic format at https://investor.maersk.com/financial-reports
The annual report has been prepared in accord-ance with the International Financial Reporting Standards (IFRS) as adopted by the EU and fur-ther requirements in the Danish Financial State-ments Act.
Interim reportsA.P. Moller- Maersk also produces quarterly interim reports.
Additional informationTo further add value and with a focus on the pro-fessional segment and others with more specific interests, detailed presentations are available each quarter following the release of the interim reports and the annual report.
The interim reports, presentations and webcasts can be found on our Investor Relations website at https://investor.maersk.com/
Quarterly figures for 2010-2020 are available at https://investor.maersk.com/financials.cfm
Recommendations for Corporate GovernanceThe Board of Directors of A.P. Møller - Mærsk A/S continues to consider the ’Recommendations for Corporate Governance’ implemented by Nasdaq Copenhagen. For further information, see page 51 of the annual report.
Remuneration reportThe remuneration report includes the total remuneration received by each member of the Board of Directors and the Executive Board of A.P. Møller - Mærsk A/S for 2020. The report is avail-able at https://investor.maersk.com/remuneration
A.P. Moller - Maersk provides additional disclosure to satisfy legal requirements and stakeholder interests. Supplementary reports can be downloaded from https://investor.maersk.com/financial-reports, while additional information can be found here.
Sustainability and gender composition of managementAn independently assured Sustainability Report for 2020 has been published, which provides detailed information on A.P. Moller - Maersk’s sustainability performance. The report serves as A.P. Moller - Maersk’s Communication on Progress as required by the UN Global Compact and ensures compliance with the requirements of Section 99a of the Danish Financial Statements Act on corpo-rate social responsibility.
The report further ensures compliance with the requirements of Section 99b of the Danish Finan-cial Statements Act on reporting on the gender composition of management.
Finally the report ensures compliance with section 107d of the Danish Financial Statements Act on A.P. Moller - Maersk’s statutory statement on social responsibility, underrepresented gender
and diversity. The report is available on Investor Relations website https://investor.maersk.com/ and at https://www.maersk.com/about/sustaina-bility/reports
Additional information on how A.P. Moller - Maersk manages issues and explains implementation, pro-gress and relevant commitments and frameworks can be found on the Sustainability website at https://www.maersk.com/about/sustainability
An overview of Environmental, Social and Govern-ance (ESG) performance data, including Sustaina-bility Accounting Standards Board (SASB) and Task force on Climate-Related Financial Disclosures (TCFD) indices, is available in the 2020 ESG data overview on the Investor Relations website at https://investor.maersk.com/
149 A.P. Moller - Maersk Annual Report 2020 External financial reporting for A.P. Moller - MaerskAdditional information
Colophon
EditorsStig FrederiksenFinn GlismandHenrik Jensen
Design and layoute-Types
Produced in Denmark 2021
Board of Directors, A.P. Møller - Mærsk A/S
Jim Hagemann Snabe, Chairman
Ane Mærsk Mc-Kinney Uggla, Vice Chairman
Dorothee Blessing
Bernard L. Bot
Marc Engel
Arne Karlsson
Thomas Lindegaard Madsen
Blythe S. J. Masters
Jacob Andersen Sterling
Robert Mærsk Uggla
Executive Board, A.P. Møller - Mærsk A/S
Søren Skou, Chief Executive Officer (CEO)
Patrick Jany (CFO)
Vincent Clerc
Morten H. Engelstoft
Henriette Hallberg Thygesen
Audit Committee
Arne Karlsson, Chairman
Bernard L. Bot
Jim Hagemann Snabe
Remuneration Committee
Jim Hagemann Snabe, Chairman
Arne Karlsson
Robert Mærsk Uggla
Nomination Committee
Ane Mærsk Mc-Kinney Uggla, Chairman
Jim Hagemann Snabe
Robert Mærsk Uggla
Transformation & Innovation Committee
Jim Hagemann Snabe, Chairman
Marc Engel
Blythe S. J. Masters
Robert Mærsk Uggla
Auditor
PricewaterhouseCoopersStatsautoriseret Revisionspartnerselskab
150 A.P. Moller - Maersk Annual Report 2020 Colophon

A.P. Møller - Mærsk A/SEsplanaden 50, DK-1098 Copenhagen K+45 33 63 33 [email protected]