romreal limited annual report 2020 - globenewswire
TRANSCRIPT
RomReal Limited Annual Report 2020 16 April 2021
RomReal is a Company focused on the Romanian real estate market. Established in 2005 and
owns a premium portfolio of properties in the Black Sea – Constanta region

Page 1 of 51
2020 Highlights
Net Asset Value (NAV)
Net Asset value was EUR 0.36 (NOK 3.87 before any tax) per share, that being 19% lower
compared to 2019.
The year-end 2020 valuation was concluded by Knight Frank in February 2021 and the
values of the Group’s investment property have been updated accordingly. The like for like
value of the investment properties has decreased by about 7.3% during 2020 reflecting the
general market challenges brought by the pandemic, according to the external valuer.
Operational highlights
During 2020, the Company sold a total of 10 plots of around 7,000 sq. meters from the Ovidiu
Lakeside project for a total consideration of EUR 1.23 million. Hitherto, in 2021, the Company
has sold 4 plots for a total EUR 0.21 million.
During 2020, EUR 1.1 million (ex VAT) have been further invested in infrastructure, primarily in
Industrial Park and Lakeside.
Industrial Park, a sale of in total 3 plots totalling about EUR 0.8 million has been terminated for
the time being. The Company is planning to file a law suit against the local water utility. The
Balada Market property is marketed for sale. However, a court case has been commenced
as the local Municipality has withdrawn a PUZ issued in 2015.
Financial Results
Net Result for the year was EUR 2.94 million loss compared to a EUR 0.81 million loss in 2019.
During November 2020 the Company decided to make a EUR 1.05 million payment in
relation to the tax dispute with the local tax authorities, to benefit a waiver of any potential
penalties.
At the end of 2020, the Company had a cash position of EUR 1.2 million plus a total of EUR
0.42 million in unsettled receivables related to binding sales agreements, totalling EUR 1.62
million or about EUR 0.04 per share.
Page 2 of 51
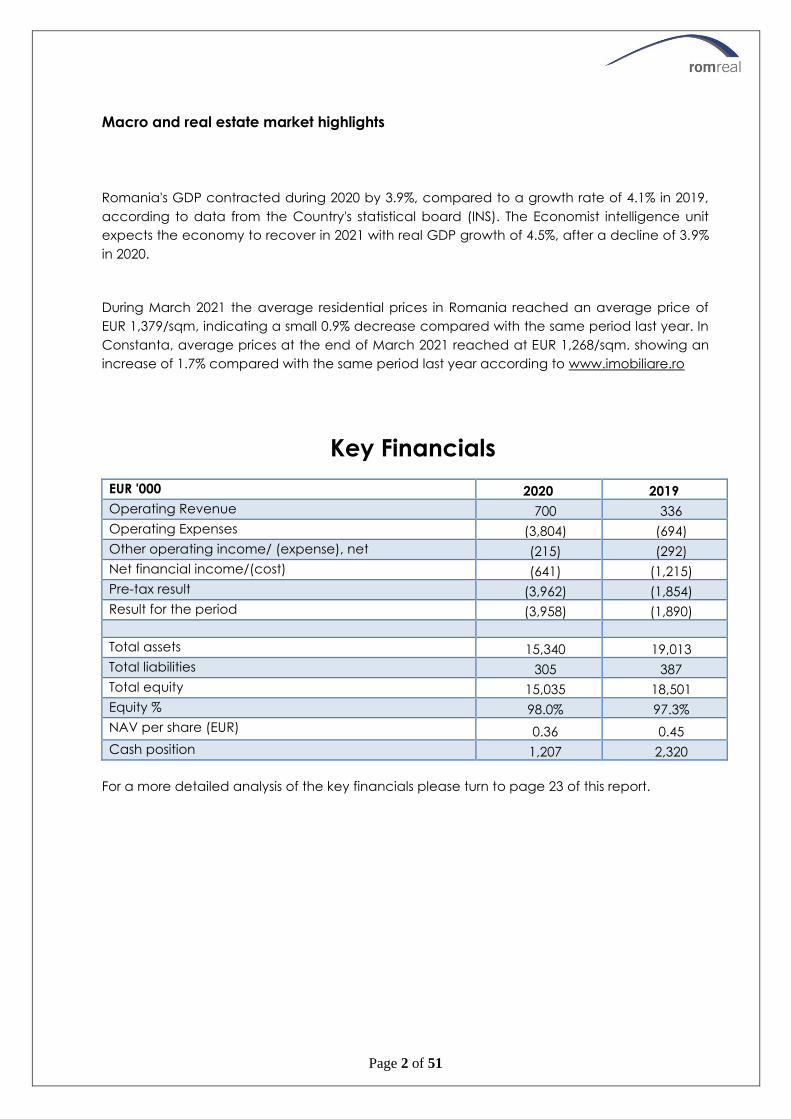
Macro and real estate market highlights
Romania's GDP contracted during 2020 by 3.9%, compared to a growth rate of 4.1% in 2019,
according to data from the Country's statistical board (INS). The Economist intelligence unit
expects the economy to recover in 2021 with real GDP growth of 4.5%, after a decline of 3.9%
in 2020.
During March 2021 the average residential prices in Romania reached an average price of
EUR 1,379/sqm, indicating a small 0.9% decrease compared with the same period last year. In
Constanta, average prices at the end of March 2021 reached at EUR 1,268/sqm. showing an
increase of 1.7% compared with the same period last year according to www.imobiliare.ro
Key Financials
EUR '000 2020 2019
Operating Revenue 700 336
Operating Expenses (3,804) (694)
Other operating income/ (expense), net (215) (292)
Net financial income/(cost) (641) (1,215)
Pre-tax result (3,962) (1,854)
Result for the period (3,958) (1,890)
Total assets 15,340 19,013
Total liabilities 305 387
Total equity 15,035 18,501
Equity % 98.0% 97.3%
NAV per share (EUR) 0.36 0.45
Cash position 1,207 2,320
For a more detailed analysis of the key financials please turn to page 23 of this report.
Page 3 of 51
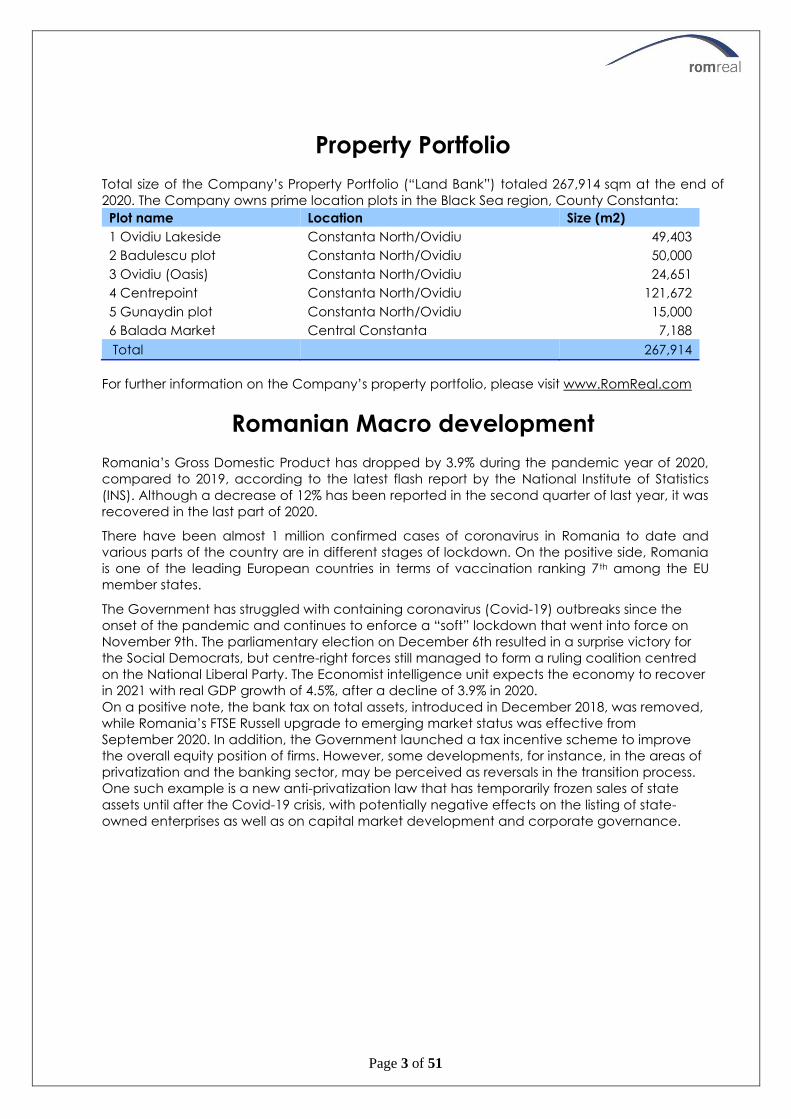
Property Portfolio Total size of the Company’s Property Portfolio (“Land Bank”) totaled 267,914 sqm at the end of
2020. The Company owns prime location plots in the Black Sea region, County Constanta:
Plot name Location Size (m2)
1 Ovidiu Lakeside Constanta North/Ovidiu 49,403
2 Badulescu plot Constanta North/Ovidiu 50,000
3 Ovidiu (Oasis) Constanta North/Ovidiu 24,651
4 Centrepoint Constanta North/Ovidiu 121,672
5 Gunaydin plot Constanta North/Ovidiu 15,000
6 Balada Market Central Constanta 7,188
Total 267,914
For further information on the Company’s property portfolio, please visit www.RomReal.com
Romanian Macro development Romania’s Gross Domestic Product has dropped by 3.9% during the pandemic year of 2020,
compared to 2019, according to the latest flash report by the National Institute of Statistics
(INS). Although a decrease of 12% has been reported in the second quarter of last year, it was
recovered in the last part of 2020.
There have been almost 1 million confirmed cases of coronavirus in Romania to date and
various parts of the country are in different stages of lockdown. On the positive side, Romania
is one of the leading European countries in terms of vaccination ranking 7th among the EU
member states.
The Government has struggled with containing coronavirus (Covid-19) outbreaks since the
onset of the pandemic and continues to enforce a “soft” lockdown that went into force on
November 9th. The parliamentary election on December 6th resulted in a surprise victory for
the Social Democrats, but centre-right forces still managed to form a ruling coalition centred
on the National Liberal Party. The Economist intelligence unit expects the economy to recover
in 2021 with real GDP growth of 4.5%, after a decline of 3.9% in 2020.
On a positive note, the bank tax on total assets, introduced in December 2018, was removed,
while Romania’s FTSE Russell upgrade to emerging market status was effective from
September 2020. In addition, the Government launched a tax incentive scheme to improve
the overall equity position of firms. However, some developments, for instance, in the areas of
privatization and the banking sector, may be perceived as reversals in the transition process.
One such example is a new anti-privatization law that has temporarily frozen sales of state
assets until after the Covid-19 crisis, with potentially negative effects on the listing of state-
owned enterprises as well as on capital market development and corporate governance.

Page 4 of 51
RomReal Ethical Policy Introduction
RomReal is only involved in minor
construction or development projects, but
aiming to maintain its principles with regards
to Ethical Policy since its listing to the Oslo
Stock Exchange. These can be found below:
Energy
From initial site surveys, through to the
specification of fixtures and fittings, the
Company aims to identify the most energy-
efficient solutions. The Company is seeking
more intelligent and sustainable approaches
to design, construction and materials.
Water
All of the developments consider ways in
which water usage can be reduced, both
during construction and occupancy. Where
possible, specifying ways of increasing the
efficiency of water usage within the
infrastructure of our developments, delivering
responsibility and cost-efficiency.
Materials
The Company is aiming to select all
construction materials carefully. The aim is to
protect natural resources and reduce carbon
emissions, thereby contributing to a healthy
environment for the residents in all
developments.
Waste
RomReal is aware of the need to reduce and
manage waste across our operations and is
aiming to fulfil all legal requirements. It also
supports and encourages residents in their
own recycling efforts.
Community
From introducing improvements to the local
infrastructure to including spaces for
socialising and local amenities, the aim is to
contribute to sustainable communities for
everyone.
Healthy Living
RomReal recognizes our responsibility to
support healthy lifestyles and meet the needs
and aspirations of residents. RomReal seeks to
maximize the natural benefits of sunlight,
daylight and open space within each
development.
Education
RomReal seeks to deliver sustainable
development through its ethical policy and
working practices. The terms of reference
include requirements for economic and
social progress at a local level. The Company
has supported educational initiatives, both
those that spread best practice in sustainable
development, and those that enhance the
local educational infrastructure in general.
Page 5 of 51
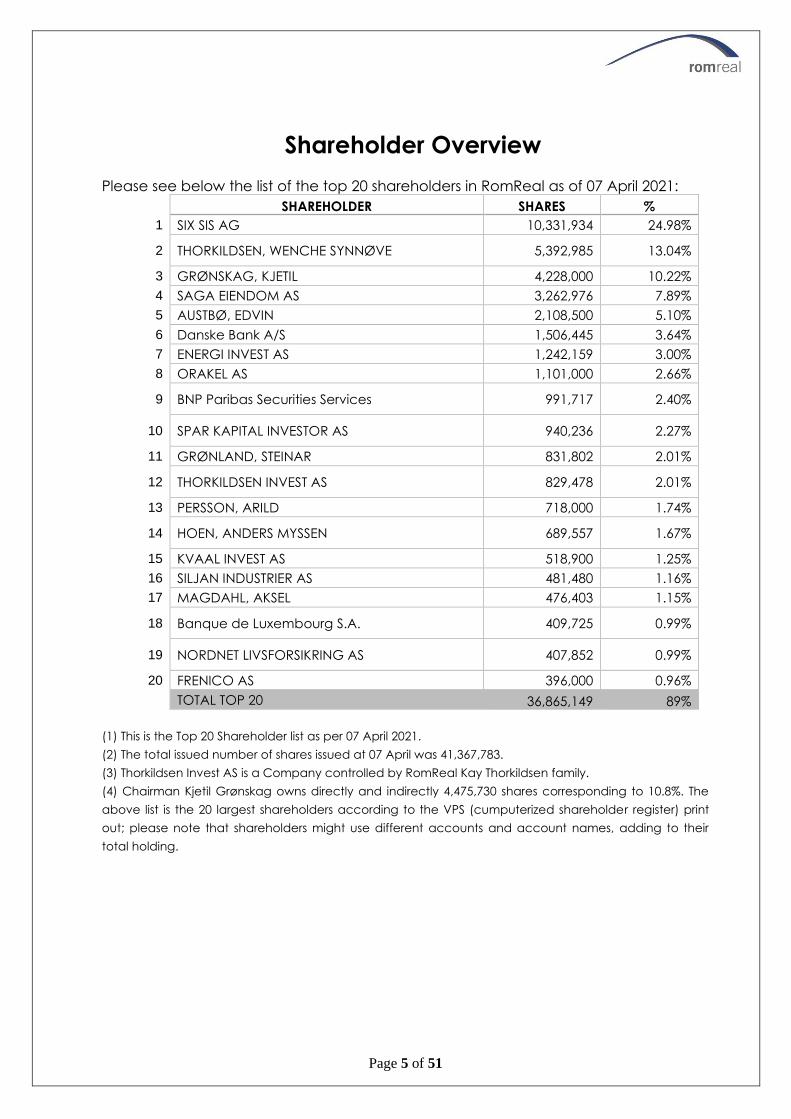
Shareholder Overview
Please see below the list of the top 20 shareholders in RomReal as of 07 April 2021:
SHAREHOLDER SHARES %
1 SIX SIS AG 10,331,934 24.98%
2 THORKILDSEN, WENCHE SYNNØVE 5,392,985 13.04%
3 GRØNSKAG, KJETIL 4,228,000 10.22%
4 SAGA EIENDOM AS 3,262,976 7.89%
5 AUSTBØ, EDVIN 2,108,500 5.10%
6 Danske Bank A/S 1,506,445 3.64%
7 ENERGI INVEST AS 1,242,159 3.00%
8 ORAKEL AS 1,101,000 2.66%
9 BNP Paribas Securities Services 991,717 2.40%
10 SPAR KAPITAL INVESTOR AS 940,236 2.27%
11 GRØNLAND, STEINAR 831,802 2.01%
12 THORKILDSEN INVEST AS 829,478 2.01%
13 PERSSON, ARILD 718,000 1.74%
14 HOEN, ANDERS MYSSEN 689,557 1.67%
15 KVAAL INVEST AS 518,900 1.25%
16 SILJAN INDUSTRIER AS 481,480 1.16%
17 MAGDAHL, AKSEL 476,403 1.15%
18 Banque de Luxembourg S.A. 409,725 0.99%
19 NORDNET LIVSFORSIKRING AS 407,852 0.99%
20 FRENICO AS 396,000 0.96%
TOTAL TOP 20 36,865,149 89%
(1) This is the Top 20 Shareholder list as per 07 April 2021.
(2) The total issued number of shares issued at 07 April was 41,367,783.
(3) Thorkildsen Invest AS is a Company controlled by RomReal Kay Thorkildsen family.
(4) Chairman Kjetil Grønskag owns directly and indirectly 4,475,730 shares corresponding to 10.8%. The
above list is the 20 largest shareholders according to the VPS (cumputerized shareholder register) print
out; please note that shareholders might use different accounts and account names, adding to their
total holding.

Page 6 of 51
Board of Directors
Kjetil Grønskag - Chairman of the Board and CEO
Lacramioara Isarescu - Board member
Bendt Thorkildsen – Board Member
Heidi Sørensen Austbø – Board member
Mr. Grønskag holds a master of General Business (siviløkonom) from
Handelshøyskolen BI and is a Certified Financial Analyst (CFA) from
Norwegian School of Economics and Business Administration. Mr.
Grønskag has a long experience within international banking and Real
Estate. Mr Grønskag has significant Directorship experience from both
listed and private companies. He is a Norwegian citizen and resides in
London, UK.
Ileana Lacramioara Isarescu is a corporate professional with over 15 years
of international experience in business development in real estate,
finance and IT. Having worked in Vienna and New York, Ileana is currently
the Governmental Programs Executive for IBM South East Europe, and
resides in Bucharest, Romania. Ileana holds a MBA degree from Harvard
Business School and a MSc in International Economics from the Academy
of Economic Studies Bucharest.
Mr. Thorkildsen holds a Master of Science (MSc) in International
Marketing and Strategy from the Norwegian School of Economics and
Business Administration. Mr. Thorkildsen has more than 20 years with
varied experience with particular focus on business development/sales
(IT). During the last 10 years Mr. Thorkildsen also has held various
Directorship including in the real-estate industry. He is a Norwegian
citizen.
Mrs Austbø is a State Authorised Public Accountant from
Handelshøyskolen BI in Oslo. Mrs Austbø has 14 years’ experience from
both audit and Management with Norwegian and global equities,
working for KPMG and long equity funds at Terra Fondsforvaltning and
Arctic Fund Management. Mrs Austbø also has Directorship and CEO
experience from privately held companies. She is a Norwegian citizen
and resides in Oslo.

7
Today, the Board of Directors and the Chief Executive Officer reviewed and approved the
Board of Directors Report and the RomReal Ltd consolidated and annual financial statements as
of 31 December 2020. To the best of our knowledge, we confirm that RomReal Ltd and RomReal
Group’s consolidated annual financial statements for 2020 have been prepared in accordance
with IFRSs and IFRICs as adopted by the European Union (EU), IFRSs as issued by the International
Accounting Standards Board (IASB).
The information presented in the financial statements gives a true and fair view of the
Company’s and the Group’s assets, liabilities, financial position and results for the
period viewed in their entirety.
DIRECTORS REPORT 2020
RomReal Directors
The Board of Directors of RomReal is responsible for the supervision and administration of the
Company’s affairs and for ensuring that the Company’s operations are organized in a
satisfactory manner.
The Directors are shown below together with their interest in the number of shares in the
Company per 31 December 2020 and per 31 December 2019:
31 December 2020 31 December 2019
Kjetil Grønskag Appointed Nov 2006 4,451,626 4,422,475
Heidi Sørensen Austbø Appointed April 2017 Nil Nil
Bendt Thorkildsen Appointed April 2016 6,245,234 6,245,234
Lacramioara Isarescu Appointed April 2014 Nil Nil
TOTAL 10,696,860 10,667,709
8
Operations Update
The Management is focused on divesting plots at commercially profitable prices as well as to
increase the attractiveness of land plots and upgrade of its land’s planning permits. Below are
operational highlights that took place during the year:
Lake Side (No.1 on the table) –The Company has several on-going processes for selling plots in
the area.
During the fourth quarter 2020, the Company sold a total of 16 plots from the Lake side project
for a total consideration of EUR 0.356m. So far during 2021, the Company sold 4 plots for a
total EUR 0.21m.
Oasis (No. 3 on the table) –The Company is going to re-authorise the works for finalising the
blocks erected on site in order to add more value to the whole plot and authorise the works
for constructing the utilities in the area.
The Company expects more specific sales processes to commence when the pending
regulation and utility issues are granted.
Industrial Park (No. 4 on the table) – A conditional sale of in total 3 plots totalling about EUR
0.8m has been terminated. The Company is planning to file a Court case against the local
water utility, as in the Company’s opinion, the water Company has penetrated the land
and located pipes on the property without the Company’s consent.
Balada Market (No. 6 on the table) - The plot and building is marketed for sale. A court case
has been commenced as the local Municipality has withdrawn a PUZ issued in 2015.
Badulescu plot (No. 2 on the table) – Located close to the Lakeside, the Company is planning
to regulate the plot for residential use. The plot is located very close to the Lake Side project.
Restitution claim, plot of 1,453 sqm, Constanta Court case no. 2567/118/2016
After an eight-year battle in Court, including an application to the Romanian High Court of
Justice and Constanta Court of Appeal, the Company successfully obtained late 2020 a final
and irrevocable order of Constanta Court of Appeal who decided restitution of the land in
full.
The Court decision shows the impartiality of the Romanian Courts and respect to the rule of
law, as well as the integration of Romanian Court of law system into the European law system.
The piece of land is already agreed to be sold for about EUR 0.39m to the buyer of the
Company’s previous Mamaia North plots, as soon as the Court verdict will be received in
official writing, and the administrative procedures for the transfer of the plot to the Company
are finalised. This is expected during 2Q 2021.
Contestation against the Tax Authority Decision No. F-CT 344/29.05.2018
The Constanta Court of Appeal rejected the Company’s contestation. As soon as the
Company will receive the written decision issued by Court of Appeal, it will appeal the
decision to High Court of Justice in Bucharest, which is the highest and ultimate decision body.
9
Key features of the real estate market
Office: At the end of 2020, Bucharest modern office stock reached at 2.95 mln. sq m of office
space, more than half, respectively 63% being class A. Regarding the most developed areas,
18% of the modern office stock is located in Calea Floreasca/ Barbu Vacarescu sub-market,
followed by Center-West and Dimitrie Pompeiu with an equal share of 15%.
Retail: Stock reached at the end of 2020 at 3.90 mln. sq m of shopping centers and retail
parks, as circa 139,000 sq m were delivered throughout the year in defiance of a restrictive
year when most of the retailers found themselves on the non-essentials list. As concerns the
modern stock layout, 31% is concentrated in Bucharest while the rest is scattered throughout
the regional cities. When looking at the stock’s format, retail parks prevail with 63% of the total
modern area.
Industrial: Stock in Romania reached at the end of 2020 at approx. 5.1 million sqm after more
than half a million, respectively, 574,000 sqm were delivered over the year. About 65% of the
total 2020 delivered area is in Bucharest, Romania’s largest industrial hub, while the remaining
35% is scattered throughout the country in regional cities such as Deva, Oradea, Sibiu, etc. In
addition, increased competition amongst developers and constant demand for high
standard logistics spaces led to a permanent progress in the quality of new supply; at the end
of 2020, 87% of the total modern area being class A.
According to CBRE report, in spite of a challenging 2020, developers continued their search
for land plots best suitable for their projects. The most active real estate sector proved to be
the residential market with numerous investors either entered as new players on this market,
either increased their portfolio strategizing for the next place to be.
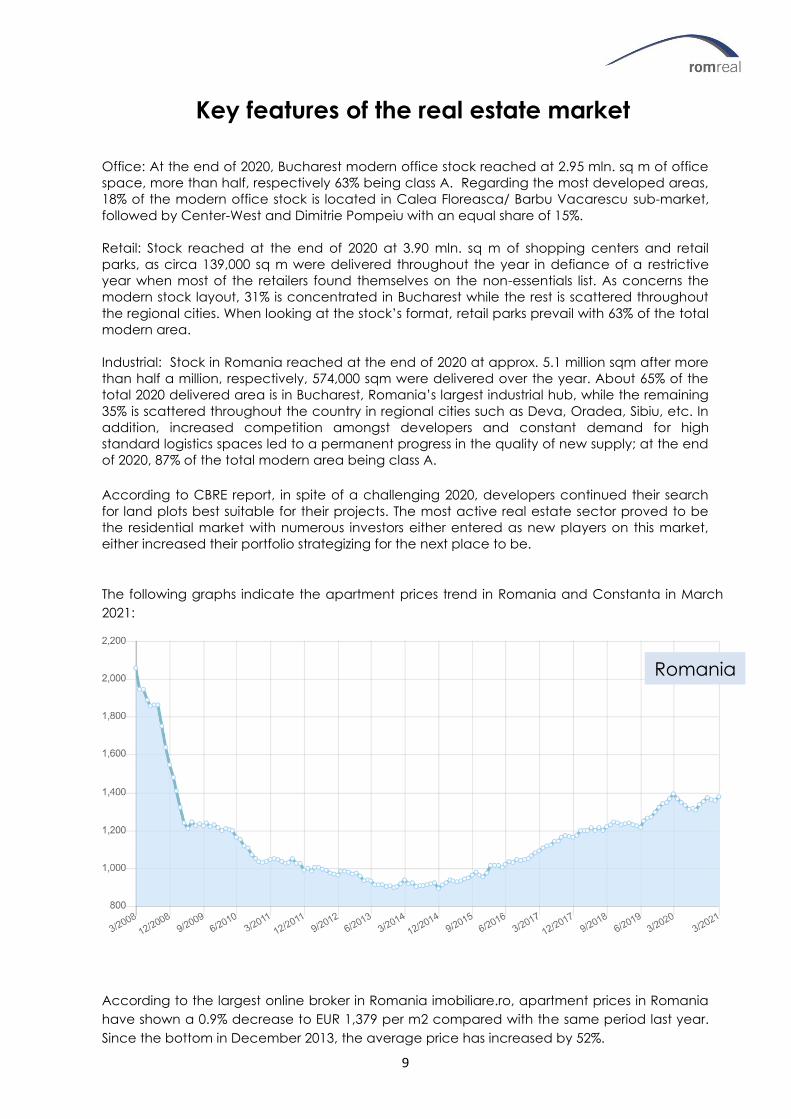
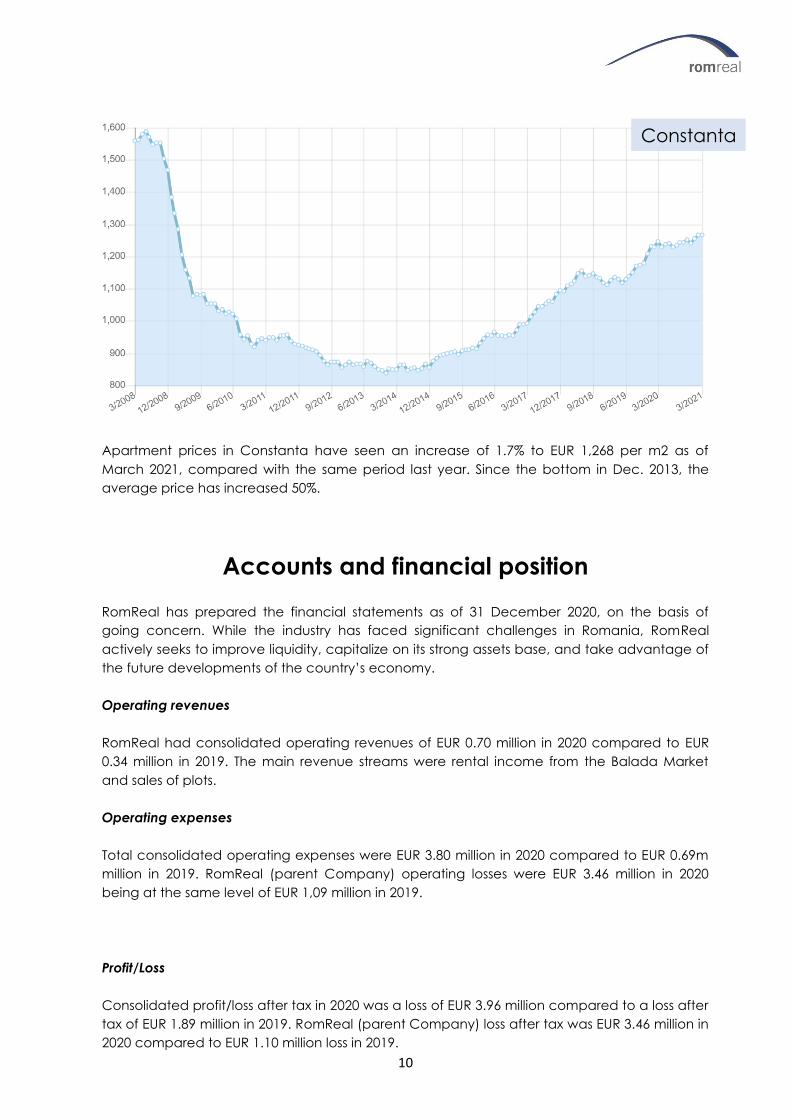
The following graphs indicate the apartment prices trend in Romania and Constanta in March
2021:
According to the largest online broker in Romania imobiliare.ro, apartment prices in Romania
have shown a 0.9% decrease to EUR 1,379 per m2 compared with the same period last year.
Since the bottom in December 2013, the average price has increased by 52%.
Romania
10
Apartment prices in Constanta have seen an increase of 1.7% to EUR 1,268 per m2 as of
March 2021, compared with the same period last year. Since the bottom in Dec. 2013, the
average price has increased 50%.
Accounts and financial position
RomReal has prepared the financial statements as of 31 December 2020, on the basis of
going concern. While the industry has faced significant challenges in Romania, RomReal
actively seeks to improve liquidity, capitalize on its strong assets base, and take advantage of
the future developments of the country’s economy.
Operating revenues
RomReal had consolidated operating revenues of EUR 0.70 million in 2020 compared to EUR
0.34 million in 2019. The main revenue streams were rental income from the Balada Market
and sales of plots.
Operating expenses
Total consolidated operating expenses were EUR 3.80 million in 2020 compared to EUR 0.69m
million in 2019. RomReal (parent Company) operating losses were EUR 3.46 million in 2020
being at the same level of EUR 1,09 million in 2019.
Profit/Loss
Consolidated profit/loss after tax in 2020 was a loss of EUR 3.96 million compared to a loss after
tax of EUR 1.89 million in 2019. RomReal (parent Company) loss after tax was EUR 3.46 million in
2020 compared to EUR 1.10 million loss in 2019.
Constanta
11
The end of year 2019 independent land bank portfolio valuation has shown a decrease of
7.3% on a like for like basis compared to the end of year 2019 valuation representing a
decrease in value of EUR 1.05 million on a like for like basis.
Dividends
The Directors are not proposing any dividends for the period.
Balance sheet
RomReal had on a consolidated basis a total balance sheet of EUR 15.03 million at 31
December 2020. RomReal (parent Company) had a total balance sheet of EUR 15.09 million.
Total consolidated equity at 31 December 2020 amounted to EUR 15.04 million (parent
Company EUR 15.03 million) compared with EUR 18.50 million in 2019 (parent Company EUR
18.50 million). The Company has total current liabilities of EUR 0.02 million at 31 December 2020
(parent Company EUR 0.06 million).
Net cash flow from consolidated operations was negative EUR 1.91 million at December 31
2020 compared to negative EUR 0.55 million in 2019 (parent Company negative EUR 0.26
million compared to negative EUR 0.25 million in 2019). Consolidated current assets were EUR
10.65 million at 31 December 2020 compared to EUR 12.93 million at 31 December 2019
(parent Company EUR 0.20 million in 2020 compared to EUR 1.51 million in 2019).
Financial risk
The Company will continue to pursue all available legal means for challenging the effects of
such reassessment, in order to cancel the additional tax liabilities.
During November 2020 the Company decided to make a EUR 1.05 million payment in
relation to the tax dispute with the local tax authorities, to benefit a waiver of any potential
penalties. The legal process regarding the tax dispute is set to continue unchanged.
Organization
RomReal Ltd operates in Romania through its fully owned subsidiary S.C. Westhouse Group SRL
(WHG). WHG holds an office in Constanta, Romania, and a small team of five employees, legal
operations of the subsidiary companies being supervised by Cristea & Partners Law office
headed by Mr. Adrian Cristea. The employees mainly deal with managing the assets,
accounting compliance and reporting as well as sales/ marketing.
Working Conditions, Equal Opportunities, Health and Environmental issues
RomReal works continuously on facilitating employee development, good health, enthusiasm
and commitment among its employees. The Company also encourages employees to use
public transport on travelling to reduce pollution. Women and men in comparable jobs
receiving the same pay.
12
Corporate Governance
RomReal Ltd (RomReal) is trying to focus on practicing good corporate governance, which will
strengthen confidence in the Group and thereby contribute to the best possible long-term value
creation to the benefit of the shareholders, the employees and other stakeholders. The purpose
of its principles for corporate governance is to regulate the division of roles between
shareholders, the Board and the Executive Management more comprehensively than is required
by legislation.
The Norwegian code of practice for corporate governance (the code) has been issued by the
Norwegian Corporate Governance Board (NCGB). It builds on the principle of “comply or
explain”, whereby companies must either comply with the code or explain why they may have
chosen an alternative approach. It also requires the Company’s report on its corporate
governance to address all 15 sections of the code. The Oslo Stock Exchange stipulates that listed
companies must provide an overall presentation of their corporate governance principles in
accordance with the applicable code, and that this must be included in their annual report.
RomReal’s principles for corporate governance are based on the recommendation of 17
October 2018, which can be found at www.nues.no.
1. Implementation and reporting on corporate governance
Confidence in its Management and business are crucial for RomReal’s present and future
competitiveness. The Group practices open Management, and thereby builds trust both in-
house and externally.
The Board of RomReal is responsible for implementing sound corporate governance principles in
the Group according to Bermuda Corporate Governance standards. RomReal’s corporate
governance does not deviate from the requirements of the code in a significant way which
requires more detailed explanation. Relations between owners and the Group will be
characterized by respect for the owners, good and timely information, and equal treatment of
shareholders.
2. Business
RomReal owns a portfolio of prime location plots in the Black Sea region, more specifically
Constanta and Ovidiu. The plots are well suited for residential and commercial developments.
RomReal is involved in several construction or development projects for the time being. The
ethical guidelines observed by RomReal reflect its values base; please see separate Ethical
Policy Section.
The objective of the Company for 2021 is to:
• Focus on land value enhancing activities in order to improve the shareholder value.
• Key action points are increased & more professional sales & marketing efforts
• Some infra-structure investments and, if necessary, engage more resources into
regulation processes.
• Conclude the several on-going court cases in a satisfactory manner.
13
• Implement Covid-19 cost reductions and liquidity measures, to ensure on-going
operations.
3. Equity and dividends
RomReal aims to maintain a solid equity and good liquidity appropriate to its objectives,
strategy, and risk profile
Dividend
The Company is fully financed without any external debt, and when/if certain additional
disposals are realized, tax cases concluded and Covid-19 effects a potential re-distribution of
cash to the shareholders will reappear on the Board of Directors agenda.
Under Bermuda law, a Company’s Board of Directors may declare and pay dividends from time
to time unless there are reasonable grounds for believing that the Company is, or would after
the payment be, unable to pay its liabilities as they become due or that the realizable value of
its assets would thereby be less than the aggregate of its liabilities and issued share capital and
share premium accounts. Under the Company’s Bye-Laws, each share is entitled to dividends if,
as and when dividends are declared by the Board, subjects to any preferred divided right of the
holders of any preference shares. There are no restrictions on the Company’s ability to transfer
funds (other than funds denominated in Bermuda dollars) in and out of Bermuda or to pay
dividends to Norwegian residents who are holders of the Company’s Shares.
4. Equal treatment of shareholders and transactions with close associates
Share Issues
Only the General Meeting considers Board mandates to increase the share capital for each
purpose after assessing the requirements set by the Board.
Different Classes of Shares
RomReal has a single share class, and each share carries one vote. Shareholders will be treated
equally unless qualified grounds exist for an alternative approach.
Efforts will be made to conduct possible transactions by the Company in its own shares through
the stock exchange or in others ways at prevailing stock exchange prices.
Transactions with close associates
RomReal’s routines specify that, in general, no transactions should be conducted between the
Group and its shareholders, Directors, senior executives or their close associates. Should any of
these have an interest in a transaction involving the Group, the Board must be informed and
take up the matter for consideration if necessary. Unless the transaction is insignificant, the Board
will secure third-party assessments of the transaction and otherwise assure itself that no form of
unfair treatment of shareholders, elected officers, employees or others is involved. The related
parties, including shareholders and close associates, are reported to the stock exchange via
www.newspoint.no. During 2020, there was one insider transaction by Chairman Kjetil Gronskag.
14
5. Shares and negotiability
RomReal’s articles of association place no restrictions on transferability, and its shares are freely
negotiable. RomReal received a listing on the Oslo Stock Exchange’s Oslo Axess list on 11 June
2007.
6. General Meetings
RomReal facilitates the participation of as many shareholders as possible at the General
Meeting and ensures that it functions as much as possible as an effective meeting place for the
shareholders and the Board so that the owners can exercise their rights. Notice of the Meeting
and supporting documents are prepared no later than 21 days before the Meeting is to take
place and posted on the Company’s website. The documents are sent to all shareholders with a
known address in the Norwegian Central Securities Depository (VPS) in good time before the
General Meeting takes place. This is facilitated by RomReal’s register keeper DNB, which
ensures that documents, including proxies and notifications, are carried by email and/or regular
post to all shareholders. The notifications and proxies clearly specify the deadline for returning
the proxies which provide the shareholders between 2 to 3 weeks to return their vote depending
on their accessibility more i.e., email or post.
The Meeting takes place in our registered office in Bermuda, and it is accessible to all Board
members and shareholders. Shareholders unable to attend in person will be given an
opportunity to vote by proxy. The Company provides information on the procedure for:
(a) Appointing a proxy
(b) appoint a person who can act as proxy for the shareholder
(c) allowing separate voting instructions for each matter but not for each one of the
candidates nominated.
The Board will propose to vote for each individual Board Member as of Ordinary General
Meeting scheduled for 23 April 2021.
Representatives of the Board always attend the Annual General Meeting, together with
representatives of the Executive Management, and normally a representative from EY auditors
either in person or via conference calling.
The Board determines the agenda for the General Meeting. The main items on the agenda
comply with the requirements of the Public Limited Companies Act as well as the parent
Company’s articles of association. As recommended by the code, each General Meeting
appoints a person to act as its independent Chair. Minutes of general meetings are published on
www.RomReal.com and on the Oslo Stock Exchange website at www.newsweb.no.
For 2021, the Annual General Meeting of the Company will take place on the 23rd April at 13:00
(local time), at the Company’s registered office in Bermuda.
7. Nomination Committee
RomReal has chosen not to comply with the directive 7 for appointing a Nomination
Committee. This is due to the current size, resources and activity of the Company, the Company
considers that the cost of running a separate nomination committee should be avoided.
15
8. Board of Directors: composition and independence
RomReal’s Board of Directors consisted at 31 December 2020 of four Directors:
Kjetil Grønskag
Bendt Thorkildsen
Lacramioara Isarescu
Heidi Sørensen Austbø
The Directors have long and varied experience in real estate, banking and finance which
ensures that the Board can function effectively as a collegiate body. An overview of the
Directors expertise, role and attendance can be found on the Company’s website,
www.RomReal.com.
The composition of the Board ensures that it serves the common interest and that it can operate
as independently as possible of special interests. Chairman Kjetil Gronskag holds an executive
position as Chief Executive of RomReal following Board approval on the 26 May 2016.
The Chairman of the Board, as well as the Vice Chairman, Secretary, and assistant Secretary are
elected by the Board of Directors during the first meeting of the newly elected Board. The term
office for members of the Board is one year.
To be proposed as of Ordinary General Meeting in April 2021, the General Meeting should elect
the Chairman of the Board as the Company’s highest governing body.
9. The work of the Board of Directors
The Board of Directors is the Company’s highest body, and answerable only to the General
Meeting. It has overall responsibility for planning and execution of the Group’s strategy and
activities, including its organization, remuneration policy and risk Management.
The Board also has overall responsibility for control and supervision. It produces an annual plan
for its work with objectives, strategy and implementation. This is supported by a 2-3-year forecast
plan or budget, which is updated on a quarterly basis during Board meetings. During Board
meetings decisions are taken and tasks are delegated to the Executive Management. The
Board discusses all matters relating to the Group’s activities which are of significant importance
or of a special character.
The duties and responsibilities of the Board are dictated by applicable legislation, the parent
Company’s articles of association, and mandates and instructions adopted by the general
meeting. The Board will exercise supervision to ensure that the Group meets its business goals
and manages risk in a wise and satisfactory manner. The Board is responsible for appointing the
chief executive.
The Chairman is responsible for ensuring that the work of the Board is conducted in an efficient
and proper manner and in compliance with applicable legislation. During 2018 nine (9) Board
meetings were conducted. In addition to the Chairman, the Board has two independent chairs
16
to lead the discussion on issues where the chair has a conflict of interest or is unable to attend.
The Board carries out an annual assessment of its work
The Board of Directors ensures that members of the board of Directors and executive personnel
make the Company aware of any material interests that they may have in items to be
considered by the board of Directors, prior to each Annual General Meeting.
The Board does not hold any Independent Committees due to the small size and limited activity
of the Company. Four out of five Board members are independent therefore their direct
judgement and decision-making during Board meetings, ensures that the Board is aligned to
shareholders’ value in decisions related to audit and remuneration of the executive personnel.
10. Risk Management and internal control
The Board and Executive Management of RomReal place great emphasis on establishing and
maintaining routines for risk Management and internal control. An annual review of the most
important risks affecting the business is conducted by the Board.
Economic conditions and Emerging markets risk
The financial market climate and especially the price of property/plots and general rental
levels in Romania represents risk, as it will affect the Group’s limited rental income. There is risk
associated with the general development of lease levels of commercial property for various
segments and the locations where the Group owns properties. This especially applies to the
market conditions at the expiration of lease contracts on the Group’s properties. The
Company aims to reduce this type of fluctuations, by holding tenants’ deposits and/or bank
guarantees. If fluctuations occur, it will have a negative impact on the Group’s earnings and
financial position.
The risk of market slowdown due to Covid-19 is evaluated and monitored by the
Management on a weekly basis.
Financial reporting
Quarterly operational and accounting reports are prepared for Board approval using
International Financial Reporting Standards.
Counterparty risk
RomReal conducts an annual review of both clients and suppliers to identify counterparty
risk. New clients are also subject to a thorough assessment to identify any risk they may
present.
Financial risk
The Company will continue to pursue all available legal means for challenging the effects of
such reassessment, in order to cancel the additional tax liabilities.
During November 2020 the Company decided to make a EUR 1.05 million payment in
relation to the tax dispute with the local tax authorities, to benefit a waiver of any potential
penalties.
17
Foreign Exchange risk
The Company’s main reporting currency is the EUR, which is used to facilitate loans to its
subsidiaries. At the subsidiary level in Romania, the operational currency is RON. Due to its
operational exposure in Romania, the financial reporting currency used to value the Company’s
assets is the RON. Due to the difference between reporting and operational currency the
Company is exposed to foreign exchange risk. To manage this, the Company holds most of its
deposits in EUR. The average exchange rate during 2020 was 1.00 EUR to 4.85 RON.
Tax risk
Changes in laws and rules regarding tax and duties may involve new and changed
parameters for investors and the Company. This may involve a reduction in the profitability of
investing in property and the profit after tax for the Company. Tax implications of
transactions and dispositions conducted by the Company are to a certain extent based on
judgment of applicable tax laws and regulations. Even if the Company is of the opinion that
it has assessed tax law in good faith, it could not be ruled out that the authorities are of a
different opinion. A change in regulation status in parts or all of the Land Bank may also
normally change the applicable tax.
The Company is required to calculate its current income tax at a flat rate of 16%. Starting
2013, the companies in the Group with turnover below a EUR 65,000 threshold are subject to
a 3% tax calculated on total revenue. This is the case for 7 of the Group companies while 3 of
them are subject to 16% on taxable profits. In order to simplify and optimize the Romanian
sub-holding structure, a number of merger processes of the Romanian subsidiaries is under
way.
The new fiscal code implemented 01 Jan 2016 has applied a land tax increase of 500% on
idle plots that lack cleaning. The Board has allocated a budget for the Management to
maintain all of the Company’s idle plots in a clean condition.
Director’s Liability risk
The Company holds a Directors and Officers liability insurance policy with the reputable
insurance Company, Chartis.
11. Remuneration of the Board of Directors
The General Meeting determines Directors’ fees. The remuneration is not linked to the
Company’s performance in any way.
During 2020, the Directors received the following remuneration:
Lacramioara Isarescu EUR 6,000
Heidi Sørensen Austbø EUR 6,000
Bendt Thorkildsen EUR 6,000
18
During 2020, Chairman Kjetil Grønskag abstained from receiving any remuneration as a Board
Member during the year. There are no outstanding share options. The Company does not grant
share options to board members.
12. Remuneration of the Executive Management
The Board determines the Chief Executive’s terms of employment. The main principle applied by
RomReal for determining the pay of the Chief executive and other senior executives is that these
persons will be offered competitive terms. In addition, RomReal will offer terms which encourage
value creation for the Group and its shareholders, and which strengthen the loyalty of senior
employees to the business.
The Executive Management of RomReal comprises three executives with good knowledge
within their job functions and with senior Management experience from across the industry. The
Executive Management of RomReal currently includes the following persons with the yearly
outlined remuneration:
Name Position Yearly fees Benefits/Bonuses
Kjetil Gronskag CEO RomReal €58,800 0.7% on asset sales
Adrian Cristea Board member of Rom
subsidiaries and legal advisor
€54,000 2% on asset sales *
Claudia Oprisan Chief Accountant €23,000 N/A
* The incentive lawyer fee is applied on the net proceeds received by RomReal or any of its
subsidiary net of any transactions fees and vat to be added (net proceeds in Euro). These net
proceeds have to be approved by the CEO of RomReal’s subsidiaries Board of Directors and
paid by RomReal’s subsidiaries.
13. Information and communication
RomReal takes the view that objective, detailed and frequent information to the market is
essential for a correct valuation of its share, and accordingly pursues a continuous dialogue with
analysts and investors.
Information about important events in RomReal as well as its periodic reporting of results is
published in accordance with the guidelines to which the Group became subject through its
listing on Oslo Axess. RomReal seeks continuously to publish all relevant information to the market
in a timely, efficient and non-discriminatory manner. The Company constantly improves its
Investor Relation material by upgrading its reporting format, content, and website.
All stock exchange announcements are made available on www.RomReal.com and the Oslo
Stock Exchange website www.newsweb.no . The Group will provide the same information to all
shareholders at the same time. To the extent that analysts or shareholders ask for further details,
RomReal and the Board will ensure that only information which has already been made public is
provided.
19
The Group holds quarterly and interim presentations. These provide an overview of operational
and financial developments in the previous quarter as well as an overview of market prospects
and the outlook for the business. Interim reports, and presentation materials are made available
on the Group’s website for a period of at least 5 years.
The Board determines the Group’s financial calendar, which specifies the dates for publication
of interim reports, the annual general meeting and the payment of dividends. This calendar is
published by the end of December via the Oslo Stock Exchange’s information system and on the
RomReal website.
2021 Financial Calendar includes the following dates:
Q4 2020 Report 26/02/2021
AGM 2020 23/04/2021
Q1 2021 Report 28/05/2021
Q2 2021 Report 27/08/2021
Q3 2021 Report 26/11/2021
14. Takeovers
In the event of a bid for the parent Company’s shares, the Board and the Executive
Management will try to ensure that everyone gets access to sufficient information to be able to
reach a decision on the offer. Unless otherwise instructed by the general meeting, the Board will
not try to deploy defensive mechanisms to prevent the implementation of the bid.
The Board will provide shareholders with its view of the offer and, providing they have reached a
decision on this, Directors are duty-bound to inform shareholders whether they personally intend
to accept the bid. Should the Board find that it is unable to recommend whether the
shareholders should accept the bid, it will explain the reasons why such a recommendation
cannot be given. An explanation must be provided if the Board’s decision is not unanimous. The
Board will consider whether an assessment should be obtained from an independent expert.
15. Auditors and advisors
RomReal is audited by Ernst & Young AS. Ernst & Young AS, registration number 976 389 387, has
been the Company’s auditor since its incorporation in 2005. The registered business address of
Ernst & Young AS is Thormøhlens gate 53 D, NO-5008 Bergen, Norway, and Ernst & Young AS is a
member of the Norwegian Institute of Public Accountants (Nw. “Den Norske Revisorforeningen”).
The Group will not use the auditor as a consultant unless this has been approved in advance by
the Board or its Chair. A plan for their work is submitted annually by the external auditor to the
Board, and this plan will specify planned services other than auditing.
The auditor attends Board meetings which deal with the annual accounts and is also present
during the AGM. During these meetings, the auditor will review possible changes to the
Company’s auditing principles, assessments of significant accounting estimates and all cases
where disagreement has arisen between the auditor and the Executive Management.
At least once a year, the auditor will conduct a review of the Company’s internal control system
and possible weaknesses. The auditor will also propose improvements. In addition, the Board and
the auditor will hold at least one meeting a year without the chief executive or other executive
20
personnel being present. A briefing on the audit work and an assessment of the Group’s internal
control will be provided by the auditor to the general meeting.
The Board of Director’s Reports the auditor remuneration to the general meeting, including
details of the fee paid for audit work and any fees paid for other specific assignments.
Prospects
RomReal is focusing on land value enhancing activities in order to improve the shareholder
value and exit. This includes, among others, increased sales & marketing efforts, and if
deemed required some infra-structure investments, and more resources into regulation
processes.
The ongoing tax dispute and two new cases (Balada Market and Industrial Park) adds
uncertainty and reduces the financial flexibility and any capital optimizing activities are
currently not a realistic alternative.
According to recent EU statistics, Romania has managed to vaccinate around 14% of its
population and currently ranking 25th in Europe. An improved vaccination coverage during
the second half of 2021 is key in allowing the real estate market to open up, accelerating
opportunities for the Company to divest more of its land-bank.
Bermuda, 16.04.2021
The Board of Directors of RomReal
.......................................... ..........................................
Kjetil Grønskag (Chairman & CEO) Bendt Thorkildsen (Director)
........................................... ...........................................
Heidi Sørensen Austbø (Director) Lacramioara Isarescu (Director)
21
FINANCIAL STATEMENTS AS OF
31 DECEMBER 2020

22
Income Statement
Figures in EUR Consolidated Parent company
Notes 2020 2019 2020 2019
Rent revenue 12 253,268 161,328 - -
Sales of investment property 1,388,201 447,031
Cost of sales- investment property 4, 11 (941,935) (271,991) - -
Profit / (loss) on sales of
investment property 446,265 175,041
- -
Total income 699,533 336,369
- -
Payroll and related expenses 13 (214,305) (207,890) (18,000) (24,000)
Depreciation and amortisation
expense
3 (32,853) (22,859)
- -
Other operating (losses)/gains 15 (1,313,737) (3,584) (3,213,656) (811,093)
Inventory (write off )/ reversal 5 (1,688,047) 93,672
General and administrative
expenses 14 (555,314) (553,087)
(224,614) (253,538)
Operating expenses (3,804,256) (693,749)
(3,456,270) (1,088,631)
Profit/(loss) before other operating
items
(3,104,723) (357,380)
(3,456,270) (1,088,631)
Net gain/(loss) from revaluation of
investment properties 4, 12 (215,840) (292,348)
- -
Profit/(loss) from operations (3,320,562) (649,728) (3,456,270) (1,088,631)
Interest income 16 5,039 10,867 (9,710) 3
Interest expense 16 (9,710) (13,586) 570 (13,586)
Foreign exchange, net 16 (637,160) (1.201,083) - -
Profit/(loss) before taxes (3,962,394) (1,853,529) (3,465,410) (1,102,213)
Tax expense 17 3,898 (36,436) - -
Result of the period (3,958,495) (1,889,965) (3,465,410) (1,102,213)
Attributable to:
-Equity holders of the parent (3,958,495) (1,889,965) (3,465,410) (1,102,213)
Basic earnings/(losses) per share
from continuing operations 23 (0.10) (0.05)
(0.08) (0.03)
Basic earnings/(losses) per share
from continuing - diluted 23 (0.10) (0.05)
(0.08) (0.03)
23
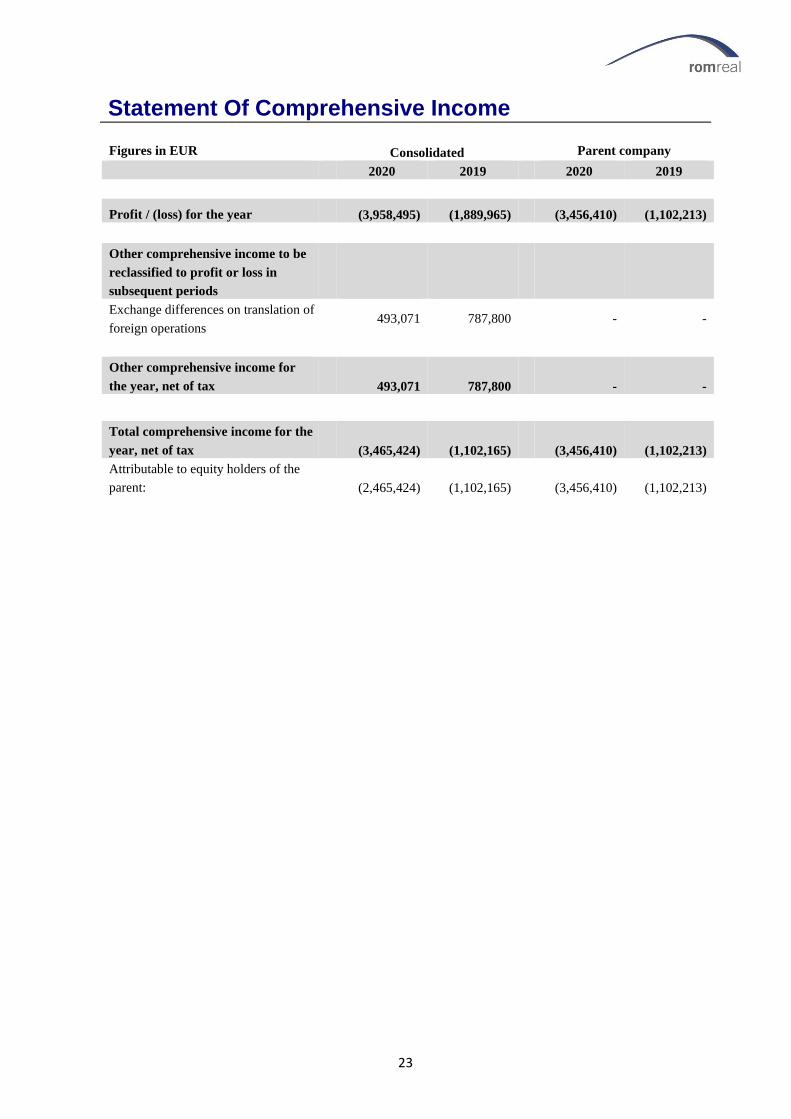
Statement Of Comprehensive Income
Figures in EUR Consolidated Parent company
2020 2019 2020 2019
Profit / (loss) for the year (3,958,495) (1,889,965)
(3,456,410) (1,102,213)
Other comprehensive income to be
reclassified to profit or loss in
subsequent periods
Exchange differences on translation of
foreign operations
493,071 787,800
- -
Other comprehensive income for
the year, net of tax 493,071 787,800
- -
Total comprehensive income for the
year, net of tax (3,465,424) (1,102,165)
(3,456,410) (1,102,213)
Attributable to equity holders of the
parent:
(2,465,424) (1,102,165)
(3,456,410) (1,102,213)
24
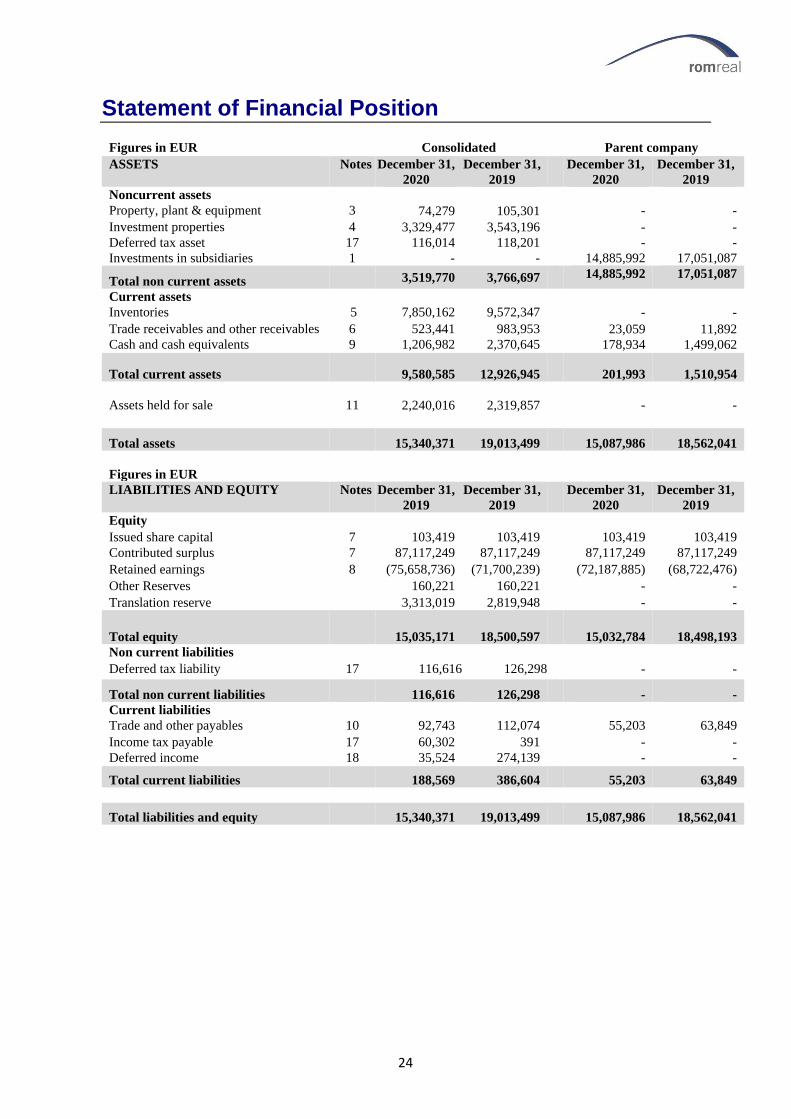
Statement of Financial Position
Figures in EUR Consolidated Parent company
ASSETS Notes December 31,
2020
December 31,
2019
December 31,
2020
December 31,
2019
Noncurrent assets
Property, plant & equipment 3 74,279 105,301 - -
Investment properties 4 3,329,477 3,543,196 - -
Deferred tax asset 17 116,014 118,201 - -
Investments in subsidiaries 1 - - 14,885,992 17,051,087
Total non current assets 3,519,770 3,766,697 14,885,992 17,051,087
Current assets
Inventories 5 7,850,162 9,572,347 - -
Trade receivables and other receivables 6 523,441 983,953 23,059 11,892
Cash and cash equivalents 9 1,206,982 2,370,645 178,934 1,499,062
Total current assets 9,580,585 12,926,945
201,993 1,510,954
Assets held for sale 11 2,240,016 2,319,857 - -
Total assets 15,340,371 19,013,499
15,087,986 18,562,041
Figures in EUR
LIABILITIES AND EQUITY Notes December 31,
2019
December 31,
2019
December 31,
2020
December 31,
2019
Equity
Issued share capital 7 103,419 103,419 103,419 103,419
Contributed surplus 7 87,117,249 87,117,249 87,117,249 87,117,249
Retained earnings 8 (75,658,736) (71,700,239) (72,187,885) (68,722,476)
Other Reserves 160,221 160,221 - -
Translation reserve 3,313,019 2,819,948 - -
Total equity 15,035,171 18,500,597
15,032,784 18,498,193
Non current liabilities
Deferred tax liability 17 116,616 126,298 - -
Total non current liabilities 116,616 126,298
- -
Current liabilities
Trade and other payables 10 92,743 112,074 55,203 63,849
Income tax payable 17 60,302 391 - -
Deferred income 18 35,524 274,139 - -
Total current liabilities 188,569 386,604 55,203 63,849
Total liabilities and equity 15,340,371 19,013,499
15,087,986 18,562,041
25
Signed on behalf of the Board of Directors
.......................................... ..........................................
Kjetil Grønskag (Chairman & CEO) Bendt Thorkildsen (Director)
........................................... ...........................................
Heidi Sørensen Austbø (Director) Lacramioara Isarescu (Director)

26
Consolidated Statement Of Changes in Equity Figures in EUR Attributable to equity holders of the parent
Share
Capital
(Note 7)
Contributed
Surplus (Note
7)
Retained
Earnings
(Note 8)
Translation
Reserve
Other
Reserves Total
Balance as of
01 January 2019 103,419 87,117,249 (69,810,278) 2,032,148 160,221 19,602,759
Profit / (loss) for the period - - (1,889,965) - - (1,889,965)
Other comprehensive income - - - 787,800 - 787,800
Total comprehensive income and
expense for the year - - (1,889,965) 787,800 - (1,102,165)
Balance as of
31 December 2019 103,419 87,117,249 (71,700,239) 2,819,948 160,221 18,500,597
Profit / (loss) for the period - - (3,958,497) - - (3,958,497)
Other comprehensive income - - - 1,280,871 - 1,280,871
Total comprehensive income and
expense for the year - - (3,958,497) 1,280,871 - (2,677,626)
Balance as of
31 December 2020 103,419 87,117,249 (75,658,736) 3,313,019 160,221 15,035,172
27
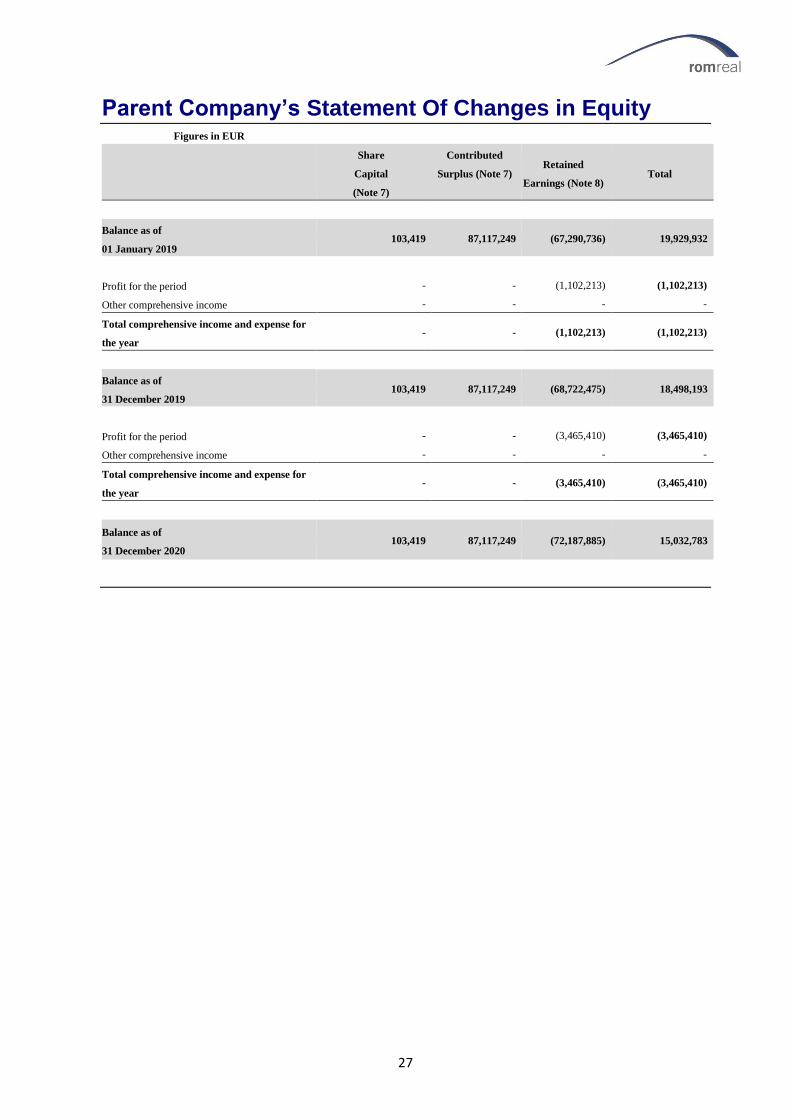
Parent Company’s Statement Of Changes in Equity Figures in EUR
Share
Capital
(Note 7)
Contributed
Surplus (Note 7) Retained
Earnings (Note 8) Total
Balance as of
01 January 2019 103,419 87,117,249 (67,290,736) 19,929,932
Profit for the period - - (1,102,213) (1,102,213)
Other comprehensive income - - - -
Total comprehensive income and expense for
the year - - (1,102,213) (1,102,213)
Balance as of
31 December 2019 103,419 87,117,249 (68,722,475) 18,498,193
Profit for the period - - (3,465,410) (3,465,410)
Other comprehensive income - - - -
Total comprehensive income and expense for
the year - - (3,465,410) (3,465,410)
Balance as of
31 December 2020 103,419 87,117,249 (72,187,885) 15,032,783
28
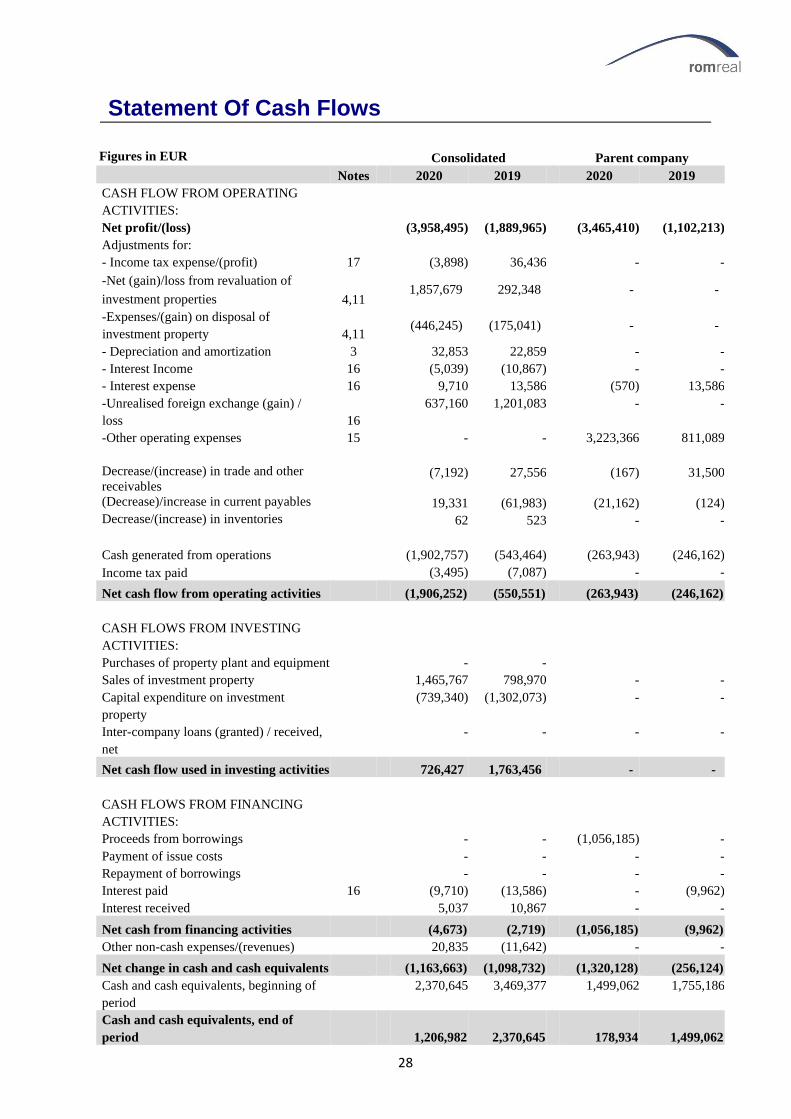
Statement Of Cash Flows
Figures in EUR Consolidated Parent company
Notes 2020 2019 2020 2019
CASH FLOW FROM OPERATING
ACTIVITIES:
Net profit/(loss) (3,958,495) (1,889,965) (3,465,410) (1,102,213)
Adjustments for:
- Income tax expense/(profit) 17 (3,898) 36,436 - -
-Net (gain)/loss from revaluation of
investment properties 4,11 1,857,679 292,348
- -
-Expenses/(gain) on disposal of
investment property 4,11 (446,245) (175,041)
- -
- Depreciation and amortization 3 32,853 22,859 - -
- Interest Income 16 (5,039) (10,867) - -
- Interest expense 16 9,710 13,586 (570) 13,586
-Unrealised foreign exchange (gain) /
loss 16
637,160 1,201,083 - -
-Other operating expenses 15 - - 3,223,366 811,089
Decrease/(increase) in trade and other
receivables (7,192) 27,556 (167) 31,500
(Decrease)/increase in current payables 19,331 (61,983) (21,162) (124)
Decrease/(increase) in inventories 62 523 - -
Cash generated from operations (1,902,757) (543,464) (263,943) (246,162)
Income tax paid (3,495) (7,087) - -
Net cash flow from operating activities (1,906,252) (550,551) (263,943) (246,162)
CASH FLOWS FROM INVESTING
ACTIVITIES:
Purchases of property plant and equipment - -
Sales of investment property 1,465,767 798,970 - -
Capital expenditure on investment
property
(739,340) (1,302,073) - -
Inter-company loans (granted) / received,
net
- - - -
Net cash flow used in investing activities 726,427 1,763,456 - -
CASH FLOWS FROM FINANCING
ACTIVITIES:
Proceeds from borrowings - - (1,056,185) -
Payment of issue costs - - - -
Repayment of borrowings - - - -
Interest paid 16 (9,710) (13,586) - (9,962)
Interest received 5,037 10,867 - -
Net cash from financing activities (4,673) (2,719) (1,056,185) (9,962)
Other non-cash expenses/(revenues) 20,835 (11,642) - -
Net change in cash and cash equivalents (1,163,663) (1,098,732) (1,320,128) (256,124)
Cash and cash equivalents, beginning of
period
2,370,645 3,469,377 1,499,062 1,755,186
Cash and cash equivalents, end of
period 1,206,982 2,370,645
178,934 1,499,062

29
Notes To The Financial Statements
The consolidated financial statements of RomReal Limited and its subsidiaries (collectively the “Group” or the
“Company”) for the year ended 31 December 2020 were authorised for issue in accordance with a resolution of
the directors on the [x] April 2021.
These financial statements cover RomReal Ltd. and its subsidiaries. RomReal Ltd. is incorporated in Bermuda
whereas the subsidiaries Westhouse Group SRL, Concorde Group SRL, Investate SRL, Rofrench Connection
SRL, Westhouse Invest SRL, Terra del Sol SRL are incorporated in Romania. RomReal Ltd and its subsidiaries
(the Group) are principally engaged in property investments and development in Romania.
Also, for reference, single financial statements of the parent company, RomReal Ltd. have been prepared. As a
general rule, all comments refer to the consolidated financial statements of the Group, unless specifically
mentioned otherwise.
Both consolidated financial statements and those of the parent have been prepared on a going concern basis.
The registered office address of RomReal Ltd is located at Burnaby Building, 16 Burnaby street, Hamilton
HM11, Bermuda.
The investment in subsidiaries at the Parent Company have been impaired, mainly as a result of the decrease in
land bank valuations after the 2008 crisis as well as due to the ongoing operational expenditure. The vast majority
of the impairment is concentrated in Westhouse Group SRL where most of the assets are located.
Entity Country of business Owner’s share Number of shares
Westhouse Group SRL Romania 100% 19,392,043
Concorde Group SRL Romania 100% 222,020
Rofrench Connection SRL Romania 100% 100
Investate SRL Romania 100% 351,300
Westhouse Invest SRL Romania 100% 68,000
Terra del Sol SRL Romania 100% 15,020
Note 1 ORGANIZATION AND OPERATIONS
Note 4 INVESTMENTS PROPERTIES
Note 4 INVESTMENTS PROPERTIES
30
2.1 Basis for preparation
The consolidated financial statements of the
RomReal Group and those of the parent company
have been prepared in accordance with International
Financial Reporting Standards (IFRS) as issued by
the International Accounting Standards Board
(IASB), adopted by the EU. All IFRS standards
adopted have effective date 1 January 2020 or
earlier. The consolidated financial statements and
those of the parent company are presented in euros.
The financial statements have been prepared on the
basis of historical cost except for Investment
Properties which is presented at fair value and
Assets Held for sale which are measured at the
lower of carrying amount before the reclassification
and the fair value less cost to sell.
2.2 Consolidation
The consolidated financial statements comprise the
financial statements of RomReal Ltd. and its
subsidiaries as of 31 December 2020 and 31
December 2019; the Group was established in the
autumn 2005. Subsidiaries are fully consolidated
from the date of acquisition, being the date on
which the Group obtains control, and continue to be
consolidated until the date that such control ceases.
The financial statements of the subsidiaries are
prepared for the same reporting year as the parent
company, using consistent accounting policies. All
intra-group balances, transactions, income and
expenses and profits and losses resulting from intra-
group transactions are eliminated in full.
A subsidiary is a company which the Company
controls. The control is typically evidenced if an
only if the Company has:
• Power over the investee (i.e. existing rights
that give it the current ability to direct the
relevant activities of the investee)
• Exposure, or rights, to variable returns from
its involvement with the investee, and
• The ability to use its power over the investee
to affect its returns
2.3 Significant accounting judgements, estimates
and assumptions
The preparation of the Group's financial statements
requires management to make judgements,
estimates and assumptions that affect the reported
amounts of revenues, expenses, assets and
liabilities, and the disclosure of contingent
liabilities, at the reporting date. Uncertainty about
these assumptions and estimates could result in
outcomes that require a material adjustment to the
carrying amount of the asset or liability affected in
future periods.
Judgements
In the process of applying the Group's accounting
policies, management has made the following
judgements, which have the most significant effect
on the amounts recognised in the consolidated
financial statements.
Classification of property
The Group determines whether a property is
classified as investment property, assets held for
sale or inventory:
-Investment property comprises land and buildings
which are not occupied substantially for use by, or
in the operations of, the Group, nor for sale in the
ordinary course of business, but are held primarily
to earn rental income and capital appreciation.
-Assets held for sale comprises property which is
available for immediate sale and for which the sale
is highly probable and expected to be substantially
completed within a year from the date of
classification.
-Inventory comprises property that is held for sale
in the ordinary course of business. Principally, this
is residential property that the Group develops and
intends to sell before or on completion of
construction.
Estimates and assumptions
The key assumptions concerning the future and
other key sources of estimation uncertainty at the
reporting date, that have a significant risk of causing
a material adjustment to the carrying amounts of
assets and liabilities within the next financial year,
are described below. The Group based its
assumptions and estimates on parameters available
when the consolidated financial statements were
prepared. Existing circumstances and assumptions
about future developments, however, may change
due to market changes or circumstances arising that
are beyond the control of the Group. Such changes
are reflected in the assumptions when they occur.
Estimate of fair value of investment properties
Fair values are determined based on an annual
evaluation performed by an accredited external,
independent valuer that is certified by the Romanian
Institute of Valuers. Valuation has been made such,
in accordance with the International Valuation
Standards, to reflect market value of the properties,
namely “The amount for which an asset could be
exchanged or a liability settled, between
knowledgeable, willing parties, in an arm’s length
transaction”. No account has been taken of any
additional prospective purchaser with a special
interest. No allowance has been made with regard to
any expenses of realization, or for any taxation
arising in case of disposal. The determined fair
Note 2 SUMMARY OF SIGNIFICANT ACCOUNTING POLICIES
Note 4 INVESTMENTS PROPERTIES
Note 4 INVESTMENTS PROPERTIES
31
value of the investment properties is most sensitive
to the degree to which comparable transactions are
available, including the degree of judgement and
adjustments necessary to make such market
transactions comparable to the investment property
being valued. The determination of the fair value of
investment property may also require the use of
estimates such as future cash flows from assets and
discount rates applicable to those assets. In addition,
development risks (such as construction and letting
risks) are also taken into consideration when
determining the fair value of investment properties
under construction. These estimates are based on
local market conditions existing at reporting date.
Taking into account the characteristics of the
Group’s properties, as well as the features of the
local market, the market comparison approach was
considered in these circumstances as the most
suitable in estimating the market value of the
properties.
The management believes that the valuation
assumptions used reflect the best estimate of the
investment properties’ fair value at the date of the
balance sheet. The key assumptions used to
determine the fair value of the investment properties
are further explained in Note 4.
Estimation of net realisable value for inventory
Inventory is stated at the lower of cost and net
realisable value (NRV). NRV for completed
inventory property is assessed with reference to
market conditions and prices existing at the
reporting date. NRV in respect of inventory
property under construction is assessed with
reference to market prices at the reporting date for
similar completed property, less estimated costs to
complete construction and less the estimated costs
to make the sale.
NRV is determined by the Group based on an
annual evaluation performed by an accredited
external, independent valuer. However, given the
limited liquidity of the market, there is a significant
degree of uncertainty in estimating the NRV.
Recognition of the deferred tax asset
When determining the deferred tax liabilities and
deferred tax assets, the Group considers, at the
balance sheet date, the manner in which it expects
to recover or settle the carrying amount of its assets
and liabilities. A deferred tax asset is recognised for
the carry forward of unused tax losses and unused
tax credits to the extent that it is probable that future
taxable profit will be available against which the
unused tax losses and unused tax credits can be
utilised. Where the group considered that it is not
probable enough future taxable profits will be
available within the legal time framework of seven
years to utilise the tax losses against, the group has
not recognised such deferred tax assets.
Capitalised costs
Costs are capitalised when future cash generation is
expected. Such costs include the construction costs
of the inventories. See note 2.9.
2.4 Property, plant and equipment
Plant and equipment is stated at cost net of
accumulated depreciation and/or accumulated
impairment losses, if any. Such cost includes the
cost of replacing part of such plant and equipment
when that cost is incurred if the recognition criteria
are met. Depreciation is calculated on a straight-line
basis over the useful life of the assets. The carrying
values of plant and equipment are reviewed for
impairment when events or changes in
circumstances indicate that the carrying value may
be impaired.
Depreciation is calculated on a straight-line basis
over the estimated useful lives of the assets as
follows:
IT equipment Motor vehicles Other fixtures
and fittings
2-4 years 4 years 3-9 years
An item of property, plant and equipment is
derecognised upon disposal or when no future
economic benefits are expected from its use or
disposal. Any gain or loss arising on derecognition
of the asset (calculated as the difference between
the net disposal proceeds and the carrying amount
of the asset) is included in the income statement in
the year the asset is derecognised.
The asset's residual values, useful lives and methods
of depreciation are reviewed, and adjusted if
appropriate, at each financial year end.
2.5 Investment properties
Property that is held for long-term rental yields or
for capital appreciation or both, and that is not
occupied by the companies in the consolidated
Group, is classified as investment property.
Investment property comprises freehold land and
freehold buildings.
Investment properties are measured initially at cost,
including transaction costs.
Subsequent to initial recognition, investment
properties are stated at fair value which reflects
market conditions at the reporting date. Gains or
losses arising from changes in the fair values are
included in the income statement in the year in
which they arise. Please see 2.3 above for details
about fair values estimations.
Investment properties are derecognised when they
have been disposed of or permanently withdrawn
from use and no future economic benefit is expected
from their disposal. The difference between the net
disposal proceeds and the carrying amount of the
asset is recognised in the income statement in the
period of derecognition.

32
Subsequent expenditure is charged to the asset’s
carrying amount only when it is probable that future
economic benefit associated with the item will flow
to the Group and the cost of the item can be
measured reliably. All other repairs and
maintenance are charged to the income statement
during the financial period in which they are
incurred.
Transfers are made to or from investment property
only when there is a change in use. For a transfer
from investment property to owner-occupied
property, the deemed cost for subsequent
accounting is the fair value at the date of change in
use. If owner-occupied property becomes an
investment property, the Group accounts for such
property in accordance with the policy stated under
property, plant and equipment up to the date of
change in use. Property being constructed for sale in
the ordinary course of business, rather than to be
held for rental or capital appreciation, is held as
inventory property and is measured at the lower of
cost and net realisable value (NRV).
If an item of property, plant and equipment becomes
an investment property because its use has changed,
any differences resulting between the carrying value
and the fair value of this item at the date of transfer
is recognised in equity as a revaluation of property,
plant and equipment under IAS 16. However, if it is
a fair value gain, such is recognised in the income
statement.
2.6 Cash and cash equivalents
Cash includes cash in hand and at bank. Cash
equivalents are short-term liquid investments that
can be converted into cash within three months and
to a known amount, and which contain insignificant
risk elements.
For the purpose of the consolidated cash flow
statement, cash and cash equivalents consist of cash
and cash equivalents as defined above, net of
outstanding bank overdrafts.
2.7 Financial assets
Financial assets are classified, at initial recognition,
as financial assets at fair value through profit or
loss, loans and receivables, held-to-maturity
investments, available-for-sale financial assets, or as
derivatives designated as hedging instruments in an
effective hedge, as appropriate. All financial assets
are recognised initially at fair value plus, in the case
of financial assets not recorded at fair value through
profit or loss, transaction costs that are attributable
to the acquisition of the financial asset.
Available for Sale (AFS) financial investments
include equity investments and debt securities. Debt
securities in this category are those that are intended
to be held for an indefinite period of time and that
may be sold in response to needs for liquidity or in
response to changes in the market conditions.
Interest earned whilst holding AFS financial
investments is reported as interest income using the
effective interest rate method. The Group evaluates
whether the ability and intention to sell its AFS
financial assets in the near term is still appropriate.
2.8 Inventories
Property acquired or being constructed for sale in
the ordinary course of business, rather than to be
held for rental or capital appreciation, is held as
inventory and is measured at the lower of cost and
net realisable value. Net realisable value is the
estimated selling price in the ordinary course of
business less cost to complete development and
selling expenses. The cost of inventory recognised
in profit or loss on disposal is determined with
reference to the specific costs incurred on the
property sold and an allocation of any non-specific
costs based on the relative size of the property sold.
2.9 Trade and other receivables
Trade and other receivables are non-derivative
financial assets with fixed or determinable
payments that are not quoted in an active market.
After initial measurement, such financial assets are
subsequently measured using the effective interest
rate method, less an allowance for any uncollectible
amounts. This is calculated by taking into account
any discount or premium on acquisition and fee or
costs that are an integral part of the effective interest
rate. Allowance is made when there is objective
evidence that the Group will not be able to collect
the debts. Bad debts are written off when identified.
2.10 Non-current assets held for sale
Non-current assets are classified as held for sale if
their carrying amount will be recovered through a
sale transaction rather than through continuing use.
This condition is regarded as met only when the sale
is highly probable and the asset is available for sale
in its immediate condition. The sale should be
expected within one year from the date of
classification as held for sale.
Immediately before classification as held for sale,
the assets are remeasured in accordance with the
Group’s accounting policies. Thereafter, the assets
are recognised at the lower of their carrying amount
and fair value less cost to sell. Assets classified as
held for sale are not depreciated. Impairment losses
on initial classification as held for sale and
subsequent gains or losses on remeasurement are
included in the income statement. Gains are not
recognised in excess of any cumulative impairment
loss. In case conditions for classification of non-
current assets are no longer met, classification as
held for sale ceases. Non-current assets that ceases
to be classified as held for sale are remeasured at
the lower of their carrying amount before
classification as held for sale, adjusted for any
depreciation, amortisation or revaluations that

33
would have been recognised had the asset or
disposal group not been classified as held for sale,
and its recoverable amount at the date of the
subsequent decision to sell.
2.11 Provisions
Provisions are recognised when, and only when, the
company has a valid liability (legal or constructive)
as a result of past events and it can be proven
probable (more likely than not) that an outflow of
resources embodying economic benefits will be
required to settle the obligation, and that the size of
the amount can be measured reliably. Provisions are
reviewed on each balance sheet date and their level
reflects the best estimate of the liability.
2.12 Equity
Transaction costs relating to equity transactions are
recognised directly in equity.
2.13 Operating lease contracts – the Group as a
lessor
The Group has entered into commercial property
leases on its investment property portfolio. The
Group has determined, based on an evaluation of
the terms and conditions of the arrangements (such
as the lease term not constituting a major part of the
economic life of the commercial property and the
present value of the minimum lease payments not
amounting to substantially all of the fair value of the
commercial property), that it retains all the
significant risks and rewards of ownership of these
properties and accounts for the contracts as
operating leases.
2.14 Revenue recognition
Revenue is recognised to the extent that it is
probable that the economic benefits will flow to the
Group and the revenue can be reliably measured.
Revenue is measured at the fair value of the
consideration received, excluding discounts,
rebates, and sales taxes or duty. The Group assesses
its revenue arrangements against specific criteria in
order to determine if it is acting as principal or
agent. The Group has concluded that it is acting as a
principal in all of its revenue arrangements
Revenue includes rental income, service charges
and management charges from properties, and
income from property trading.
Rental income: Rental income is recognised over
the life of the rental period. Rental income related to
rent yielding assets of the Group in respect of
properties let to third parties.
Other income: Other income is recognised as it is
earned.
Income from sales of investment property plots:
Deposits cashed by the Group for the sale of plots
are not recognised as revenue until the Group has
transferred to the buyer the significant risks and
rewards of ownership of the plots.
2.15 Foreign currency translation
The consolidated financial statements are presented
in euros, which is the parent company's functional
and presentation currency. Each entity in the group
determines its own functional currency and items
included in the financial statements of each entity
are measured using that functional currency.
Transactions in foreign currencies are initially
recorded by the Group entities at their respective
functional currency rates prevailing at the date of
the transaction. Monetary assets and liabilities
denominated in foreign currencies are retranslated
at the functional currency spot rate of exchange
ruling at the reporting date. All differences are taken
to the income statement. Non-monetary items that
are measured in terms of historical cost in a foreign
currency are translated using the exchange rates as
at the dates of the initial transactions. Non-monetary
items measured at fair value in a foreign currency
are translated using the exchange rates at the date
when the fair value is determined. On disposal of a
foreign operation, the component of other
comprehensive income relating to that particular
foreign operation is recognised in the income
statement.
The functional currency of the Romanian operations
is the Romanian New Leu. As at the reporting date,
the assets and liabilities of these subsidiaries are
translated into the presentation currency of
RomReal Ltd. Group (the euro) at the rate of
exchange ruling at the balance sheet date and, their
income statements are translated at the average
exchange rates for each month unless there have
been significant fluctuations in the exchange rate
over the applicable period, in which case the
exchange rate at each transaction date is applied.
The exchange differences arising on the translation
are recognised in other comprehensive income.
December 31,
2020
December 31,
2019
Closing 4.8694 4.7773
2.16 Taxes
RomReal Ltd. is incorporated in the Islands of
Bermuda so is not subject to any income,
withholding or capital gains taxes under current
Bermuda law. The subsidiaries are registered in
Romania and are subject to Romanian taxation
rules.
Current income tax assets and liabilities are
measured at the amount expected to be recovered
from or paid to taxation authorities. The tax rates
and tax laws used to compute the amount are those
that are enacted or substantively enacted by the
reporting date. Current income tax relating to items
recognised directly in equity is recognised in equity
and not in profit or loss. Management periodically
evaluates positions taken in tax returns with respect
to situations in which applicable tax regulations are

34
subject to interpretation and establishes provisions
where appropriate.
Deferred income tax is provided using the liability
method on temporary differences at the balance
sheet date between the tax bases of assets and
liabilities and their carrying amounts for financial
reporting purposes at the reporting date. Deferred
income tax assets are recognised for all deductible
temporary differences, carry-forward of unused tax
credits and unused tax losses. Deferred income tax
assets are recognised to the extent that it is probable
that taxable profit will be available against which
the deductible temporary differences, and the carry-
forward of unused tax credits and unused tax losses
can be utilised.
The carrying amount of deferred income tax assets
is reviewed at each balance sheet date and reduced
to the extent that it is no longer probable that
sufficient taxable profit will be available to allow all
or part of the deferred income tax asset to be
utilised. Unrecognised deferred income tax assets
are reassessed at each balance sheet date and are
recognised to the extent that it has become probable
that future taxable profit will allow the deferred tax
asset to be recovered.
Deferred income tax assets and liabilities are
measured at the tax rates that are expected to apply
to the year when the asset is realised or the liability
is settled, based on tax rates (and tax laws) that have
been enacted or substantively enacted at the balance
sheet date.
Deferred tax assets and deferred tax liabilities are
offset, if a legally enforceable right exists to set off
current tax assets against current tax liabilities and
the deferred taxes relate to the same taxable entity
and the same taxation authority.
2.17 Loans and Borrowings
Borrowing costs generally are expensed as incurred.
Borrowing costs are capitalized if they are directly
attributable to the acquisition, construction or
production of a qualifying asset. Capitalization of
borrowing costs commences when the activities to
prepare the asset are in progress and expenditures
and borrowing costs are being incurred. Borrowing
costs are capitalized until the assets are substantially
ready for their intended use.
Borrowings are classified as current liabilities
unless the group has an unconditional right to defer
settlement of the liability for at least 12 months after
the balance sheet date.
Loan is accounted for at fair value, at the time of
disbursement, reduced for any transaction costs.
After initial recognition, interest bearing loans and
borrowings are subsequently measured at amortised
cost using the effective interest rate method. Gains
and losses are recognised in the income statement
when the liabilities are derecognised as well as
through the effective interest rate method
amortisation process. Amortised cost is calculated
by taking into account any discount or premium on
acquisition and fee or costs that are an integral part
of the effective interest rate. The effective interest
rate amortisation is included in finance cost in the
income statement.
2.18 Operating segments
For management purposes, the group is organised
into a single business unit and consequently has
only one operating segment which the management
monitors in terms of performance assessment.
2.19 Changes in accounting policies and
disclosures
The accounting policies adopted are consistent with
those of the previous financial year. The Group
applied, for the first time, the amendment below
which is effective for annual periods beginning on
or after 1 January 2019. The Group has not early
adopted any other standard, interpretation or
amendment that has been issued but is not yet
effective.
Amendments to IAS 7 Statement of Cash Flows:
Disclosure Initiative: the amendments require
entities to provide disclosure of changes in their
liabilities arising from financing activities,
including both changes arising from cash flows and
non-cash changes (such as foreign exchange gains
or losses). The Group no longer has any financial
liabilities hence no disclosure is applicable.
IFRS 16 Leases
IFRS 16 was issued in January 2016 and it replaces
IAS 17, IFRIC 4, SIC-15 and SIC-27.
IFRS 16 sets out the principles for the recognition,
measurement, presentation and disclosure of leases
and requires lessees to account for all leases under a
single on-balance sheet model similar to the
accounting for finance leases under IAS 17. Lessor
accounting under IFRS 16 is substantially
unchanged from today’s accounting under IAS 17.
Lessors will continue to classify all leases using the
same classification principle as in IAS 17 and
distinguish between two types of leases: operating
and finance leases. IFRS 16 also requires lessees
and lessors to make more extensive disclosures than
under IAS 17. IFRS 16 is effective for annual
periods beginning on or after 1 January 2019.
Considering the Group mainly acts as a lessor and
the limited amounts and number of leases, the
adopting IFRS 16 is immaterial to its balance sheet
(current lease cost is circa EUR 6,800 p.a.).
IFRIC Interpretation 23 Uncertainty over Income
Tax Treatment
The Interpretation addresses the accounting for
income taxes when tax treatments involve
uncertainty that affects the application of IAS 12
and does not apply to taxes or levies outside the
scope of IAS 12, nor does it specifically include
requirements relating to interest and penalties
associated with uncertain tax treatments.
35
The Interpretation specifically addresses the
following:
• Whether an entity considers uncertain tax
treatments separately
• The assumptions an entity makes about the
examination of tax treatments by taxation
authorities
• How an entity determines taxable profit (tax loss),
tax bases, unused tax losses, unused tax credits and
tax rates
• How an entity considers changes in facts and
circumstances
An entity must determine whether to consider each
uncertain tax treatment separately or together with
one or more other uncertain tax treatments. The
approach that better predicts the resolution of the
uncertainty should be followed. The interpretation is
effective for annual reporting periods beginning on
or after 1 January 2019, but certain transition reliefs
are available.
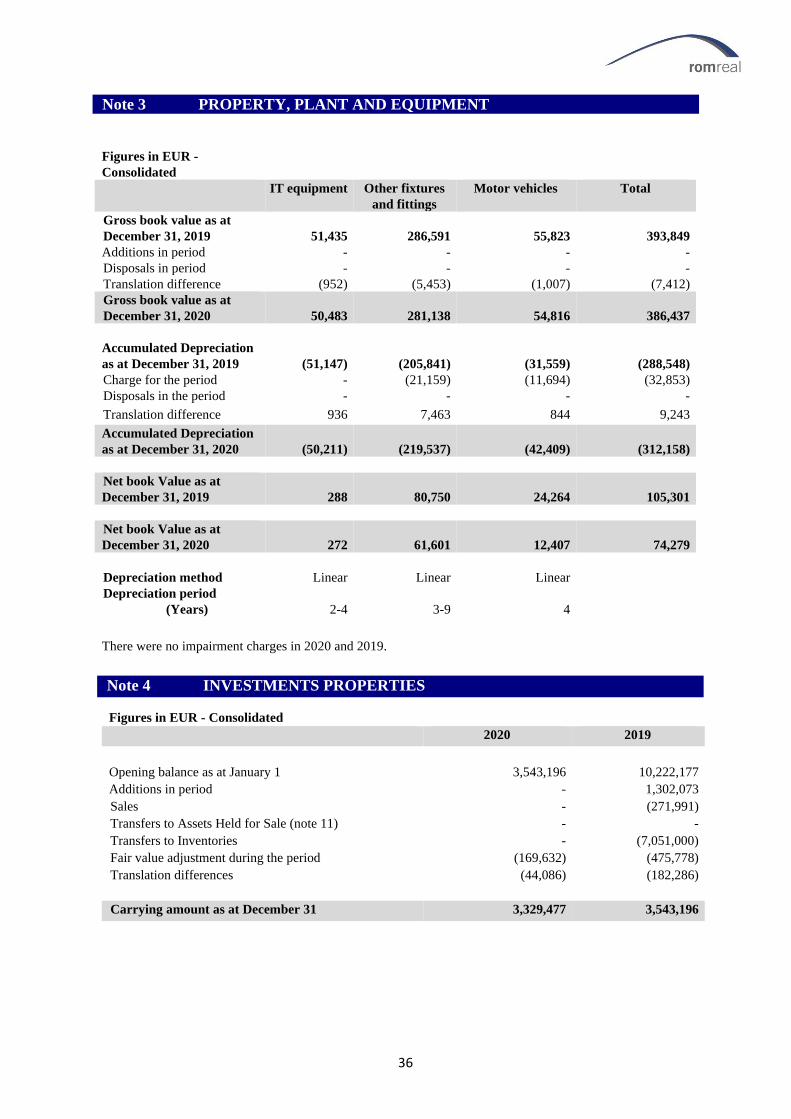
36
Figures in EUR -
Consolidated
IT equipment Other fixtures
and fittings
Motor vehicles Total
Gross book value as at
December 31, 2019 51,435 286,591 55,823 393,849
Additions in period - - - -
Disposals in period - - - -
Translation difference (952) (5,453) (1,007) (7,412)
Gross book value as at
December 31, 2020 50,483 281,138 54,816 386,437
Accumulated Depreciation
as at December 31, 2019 (51,147) (205,841) (31,559) (288,548)
Charge for the period - (21,159) (11,694) (32,853)
Disposals in the period - - - -
Translation difference 936 7,463 844 9,243
Accumulated Depreciation
as at December 31, 2020 (50,211) (219,537) (42,409) (312,158)
Net book Value as at
December 31, 2019 288 80,750 24,264 105,301
Net book Value as at
December 31, 2020 272 61,601 12,407 74,279
Depreciation method Linear Linear Linear
Depreciation period
(Years) 2-4 3-9 4
There were no impairment charges in 2020 and 2019.
Figures in EUR - Consolidated
2020 2019
Opening balance as at January 1 3,543,196 10,222,177
Additions in period - 1,302,073
Sales - (271,991)
Transfers to Assets Held for Sale (note 11) - -
Transfers to Inventories - (7,051,000)
Fair value adjustment during the period (169,632) (475,778)
Translation differences (44,086) (182,286)
Carrying amount as at December 31 3,329,477 3,543,196
Note 4 INVESTMENTS PROPERTIES
Note 4 INVESTMENTS PROPERTIES
Note 4 INVESTMENTS PROPERTIES
Note 3 PROPERTY, PLANT AND EQUIPMENT
Note 4 INVESTMENTS PROPERTIES
Note 4 INVESTMENTS PROPERTIES
37
Investment properties consist of land and buildings at various locations in Romania. The fair value of investment
property as at 31 December 2020 is based on a valuation by an independent valuer who holds a recognised and
relevant professional qualification in Romania and who has recent experience in the location and categories of the
investment property being valued. Additionally, for those properties where pre-sale agreements were in place, the
sale value included in the respective sale agreements has been used for the purposes of the valuation.
Valuation has been made such, in accordance with the International Valuation Standards, to reflect market value
of the properties, namely “The amount for which an asset could be exchanged or a liability settled, between
knowledgeable, willing parties, in an arm’s length transaction”. No account has been taken of any additional
prospective purchaser with a special interest. No allowance has been made with regard to any expenses of
realization, or for any taxation arising in case of disposal.
With regard to the valuation methodology, two approaches were used: (i) the direct market comparison approach
and (ii) the residual approach. Both approaches were utilised, and the degree to which either, or both, are relevant
depended upon the nature of the specific land plot and the availability of information. When data is available, the
market comparison approach is the most direct and systematic approach as it recognizes that property prices are
determined by the market. Valuation by comparison is essentially objective since it is based on an analysis of the
price achieved or offered for sites with broadly similar development characteristics with the land being valued.
The residual approach estimates the land value considering the value of the proposed project upon completion
and the deduction of the development costs, including the developer’s profit. This method requires the input of a
large amount of data and involves a large number of assumptions. Even small changes in any of the inputs can
cumulatively lead to a large change in the land value. Thus, the application of this method requires a high level of
expertise, being mainly used as an alternative approach when there are no or limited comparable to apply the
direct market comparison approach. In line with the market practice, the valuation of assets is determined and
quoted in EUR. While the basis for preparation of accounting records is RON the EUR/RON exchange rate
movements result into currency differences which are reflected as an adjustment to the carrying value of the
investment property.
Taking into account the characteristics of the Group’s properties, as well as the features of the local market, the
market comparison approach was considered in these circumstances as the most suitable in estimating the market
value of the properties. For each property, several comparable were selected and the following elements of
comparison were considered: price, real property rights transferred, financing terms, conditions of sale,
expenditures made immediately after the purchase, location, area, visibility and frontage, utilities, access, public
transportation, existing buildings, existing potential building permitting and best use. Land price varies depending
on the size of the plot. In case of development sites, the larger the plot, the lower the price per square meter. In
terms of size, based on market evidence, land plots were grouped in several intervals, as follows: smaller than
1,000 sq m, between 1,000 and 5,000 sq m, between 5,000 and 10,000 sq m, between 10,000 and 50,000 sq m
and larger than 50,000 sq m. If comparison was made with sites that are in different size intervals, a 5%
adjustment was applied.
The properties have been inspected along with the surrounding neighbourhood and location from which
comparable data was drawn where possible. The limited liquidity of the market has resulted in comparable being
mainly based on the most recent asking prices. In such cases, several adjustments ranging on average between 10-
30% were applied to the asking prices to adjust for reduced liquidity, difference in size, accessibility, permitting,
etc.
Within the fair value hierarchy, based on the lowest level input that is significant to the fair value measurement
the above described valuation of investment properties is categorised as Level 3 — Valuation techniques for
which the lowest level input that is significant to the fair value measurement is unobservable. In arriving at their
estimates of market values the valuators used their market knowledge and professional judgement and did not

38
rely solely on historical transactional comparable. In these circumstances, there was a greater degree of
uncertainty than which exists in a more active market in estimating the market values of investment property.
Furthermore, given the rapid change on the market, significant alterations of value can be encountered within
short periods of time. Unforeseen macroeconomic or political crises can have a sudden and dramatic effect on
markets. This could manifest itself by either panic buying or selling, or simply disinclination to trade until it is
clear how prices in the market will be affected in the longer term. There have been no transfers between Levels in
the hierarchy as compared to the previous reporting period.
There were no disposals to investment properties during 2020.
Figures in EUR - Consolidated
2020 2019
Opening balance 9,572,347 2,504,218
Additions 1,086,617 -
Disposals (941,935) (15,624)
Transfers from Investment Properties - 7,051,000
Change in provisions (1,688,047) 93,777
F/X reserve (178,819) (61,024)
Balance as at December 31 7,850,162 9,572,347
Inventories consist of the development projects of the Group. These are carried at the lower of cost and net
realisable value. Net realisable value is the estimated selling price in the ordinary course of business less
estimated costs of completion and the estimated costs to make the sale. At year-end 2020, inventories relate to
the Oasis project (EUR 2.3 million) and Rofrench (EUR 5.5 million). The cost for the Oasis project is EUR 5.5
million. The net realisable value test in 2020 resulted in an additional provision.
Within the fair value hierarchy, based on the lowest level input that is significant to the fair value measurement
the above-described estimate of net realisable value is categorised as Level 3 — Valuation techniques for which
the lowest level input that is significant to the fair value measurement is unobservable. In arriving at their
estimates of market values the valuators used their market knowledge and professional judgement. The net
realisable value was assessed with reference to market prices at the reporting date for similar completed property,
less estimated costs to complete construction and less the estimated costs to make the sale. There have been no
transfers between Levels in the hierarchy as compared to the previous reporting period.
Figures in EUR Consolidated Parent company
2020 2019 2020 2019
Trade receivables 336,481 631,024 - -
VAT receivable 160,135 284,121 - -
Other prepayments 1,004 1,145 23,059 11,892
Other short-term receivables 21,445 67,658
Total 523,441 983,948 23,059 11,892
Note 5 INVENTORIES
Note 6 INVENTORIES
Note 6 INVENTORIES
Note 4 INVESTMENTS PROPERTIES
Note 4 INVESTMENTS PROPERTIES
Note 6 TRADE RECEIVABLES AND OTHER RECEIVABLES
Note 6 INVENTORIES
Note 6 INVENTORIES
Note 4 INVESTMENTS PROPERTIES
Note 4 INVESTMENTS PROPERTIES
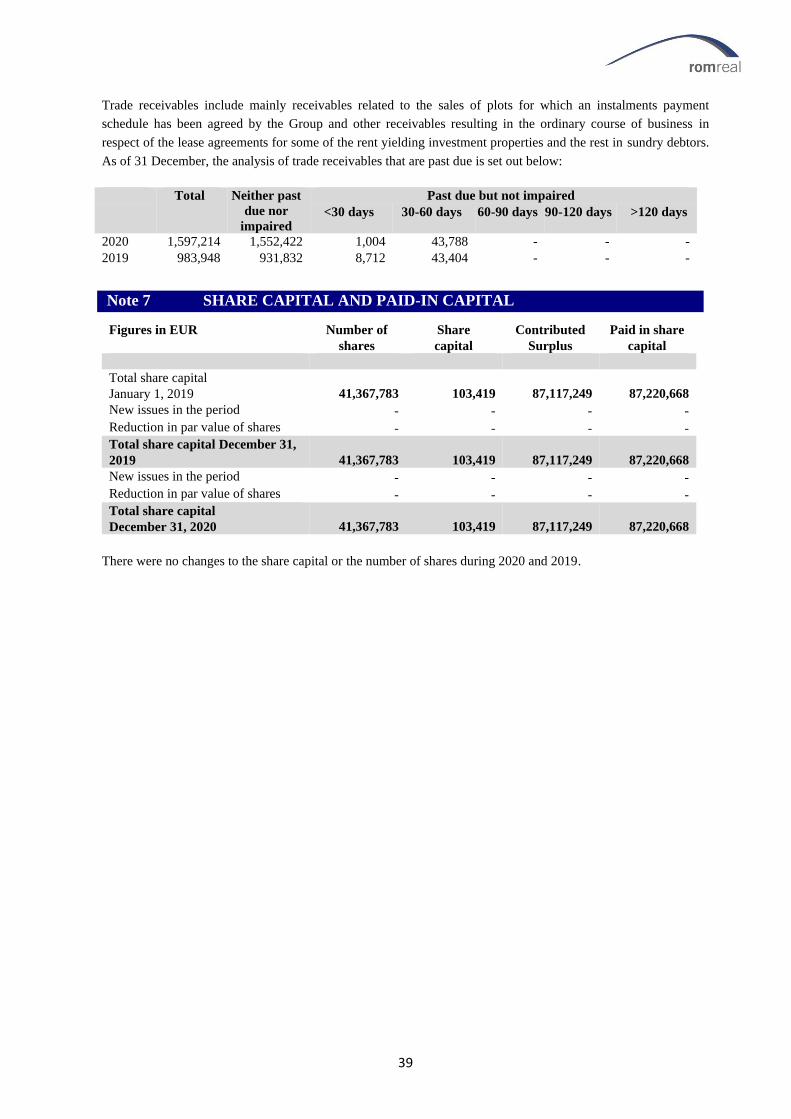
39
Trade receivables include mainly receivables related to the sales of plots for which an instalments payment
schedule has been agreed by the Group and other receivables resulting in the ordinary course of business in
respect of the lease agreements for some of the rent yielding investment properties and the rest in sundry debtors.
As of 31 December, the analysis of trade receivables that are past due is set out below:
Total Neither past
due nor
impaired
Past due but not impaired
<30 days 30-60 days 60-90 days 90-120 days >120 days
2020 1,597,214 1,552,422 1,004 43,788 - - -
2019 983,948 931,832 8,712 43,404 - - -
Figures in EUR Number of
shares
Share
capital
Contributed
Surplus
Paid in share
capital
Total share capital
January 1, 2019 41,367,783 103,419 87,117,249 87,220,668
New issues in the period - - - -
Reduction in par value of shares - - - -
Total share capital December 31,
2019 41,367,783 103,419 87,117,249 87,220,668
New issues in the period - - - -
Reduction in par value of shares - - - -
Total share capital
December 31, 2020 41,367,783 103,419 87,117,249 87,220,668
There were no changes to the share capital or the number of shares during 2020 and 2019.
Note 7 SHARE CAPITAL AND PAID-IN CAPITAL
Note 6 INVENTORIES
Note 6 INVENTORIES
Note 4 INVESTMENTS PROPERTIES
Note 4 INVESTMENTS PROPERTIES

40
Shareholders rights
There are no restrictions on voting rights or the transferability of shares in RomReal Ltd. The below summarised
the largest shareholder with shareholdings in excess of 1% as of 07 April 2021.
Ranking Name Holding Percentage
1 SIX SIS AG 10,331,934 24.98%
2 THORKILDSEN, WENCHE SYNNØVE 5,392,985 13.04%
3 GRØNSKAG, KJETIL 4,228,000 10.22%
4 SAGA EIENDOM AS 3,262,976 7.89%
5 AUSTBØ, EDVIN 2,108,500 5.10%
6 Danske Bank A/S 1,506,445 3.64%
7 ENERGI INVEST AS 1,242,159 3.00%
8 ORAKEL AS 1,101,000 2.66%
9 BNP Paribas Securities Services 991,717 2.40%
10 SPAR KAPITAL INVESTOR AS 940,236 2.27%
11 GRØNLAND, STEINAR 831,802 2.01%
12 THORKILDSEN INVEST AS 829,478 2.01%
13 PERSSON, ARILD 718,000 1.74%
14 HOEN, ANDERS MYSSEN 689,557 1.67%
15 KVAAL INVEST AS 518,900 1.25%
16 SILJAN INDUSTRIER AS 481,480 1.16%
17 MAGDAHL, AKSEL 476,403 1.15%
18 Banque de Luxembourg S.A. 409,725 0.99%
19 NORDNET LIVSFORSIKRING AS 407,852 0.99%
20 FRENICO AS 396,000 0.96%
Total Top 20 36,865,149 89.00%
(1) This is the Top 20 Shareholder list as per 07 April 2021.
(2) The total issued number of shares issued at 07 aPRIL 2021 was 41,367,783.
(3) Thorkildsen Invest AS is a Company controlled by RomReal Kay Thorkildsen family.
(4) Chairman Kjetil Grønskag owns directly and indirectly 4,475,730 shares corresponding to 10.8%.
(5) The above list is the 20 largest shareholders according to the VPS print out; please note that shareholders might use
different accounts and account names, adding to their total holding.
Movements in retained earnings for the Group can be analysed as follows:
Figures in EUR Consolidated Parent
Company
Retained earnings as of December 31, 2019 (71,700,239) (68,722,475)
Net profit in the period (3,958,497) (3,465,410)
Retained earnings as of December 31, 2020 (75,658,736) (72,187,885)
No dividends will be distributed by the Group in respect of 2020.
Note 8 RETAINED EARNINGS
Note 6 INVENTORIES
Note 6 INVENTORIES
Note 4 INVESTMENTS PROPERTIES
Note 4 INVESTMENTS PROPERTIES

41
Cash and cash equivalents amount to EUR 1,206,982 at 31 December 2020 (EUR 2,370,645 at 31 December
2019).
At parent company level, cash and cash equivalents amount to EUR 178,934 at 31 December 2020 (EUR
1,499,062 at 31 December 2019). There are no restrictions on the cash balances.
Trade payables are recognised initially at fair value and subsequently measured at amortised cost using the
effective interest method.
Figures in EUR Consolidated Parent Company
2020 2019 2020 2019
Trade payables 27,768 40,025 - -
Employee taxes 2,572 6,822 - -
Other payables 62,407 65,228 55,203 63,043
Trade payables 92,743 112,075 55,203 63,043
At 31 December 2020, the balance of EUR 92,743 Other payables for the group as well as the balance of Other
payables of EUR 55,203 for the parent company, include EUR 27,775 accrued expenses related to the 2020 audit
fees.
Figures in EUR - Consolidated
2020 2019
Opening balance as at January 1 2,319,857 2,200,000
Sales - -
Transfers from investment Properties (note 4) - -
Fair value adjustment during the period (46,209) 183,430
Translation differences (33,633) (63,572)
Carrying amount as at December 31 2,240,016 2,319,857
The Group considers the completion of the transactions highly probable while the assets are available for
immediate sale in its present condition.
Figures in EUR - Consolidated
2020 2019
Rent revenue 253,268 161,328
Sales of inventories 4 1,388,201 447,031
Cost of sales- inventories 4 (941,935) (271,991)
Total operating income 699,533 336,369
Balada market is the main rent generating property. Total rent generated during the year amounted to EUR
253,268 (2019: EUR 161,328). Future minimum rentals receivable under non-cancellable operating leases as at
31 December are, as follows:
Note 10 TRADE AND OTHER PAYABLES
Note 6 INVENTORIES
Note 6 INVENTORIES
Note 4 INVESTMENTS PROPERTIES
Note 4 INVESTMENTS PROPERTIES
Note 9 CASH AND CASH EQUIVALENTS
Note 6 INVENTORIES
Note 6 INVENTORIES
Note 4 INVESTMENTS PROPERTIES
Note 4 INVESTMENTS PROPERTIES
Note 12 OPERATING INCOME
Note 6 INVENTORIES
Note 6 INVENTORIES
Note 4 INVESTMENTS PROPERTIES
Note 4 INVESTMENTS PROPERTIES
Note 11 ASSETS HELD FOR SALE
Note 6 INVENTORIES
Note 6 INVENTORIES
Note 4 INVESTMENTS PROPERTIES
Note 4 INVESTMENTS PROPERTIES
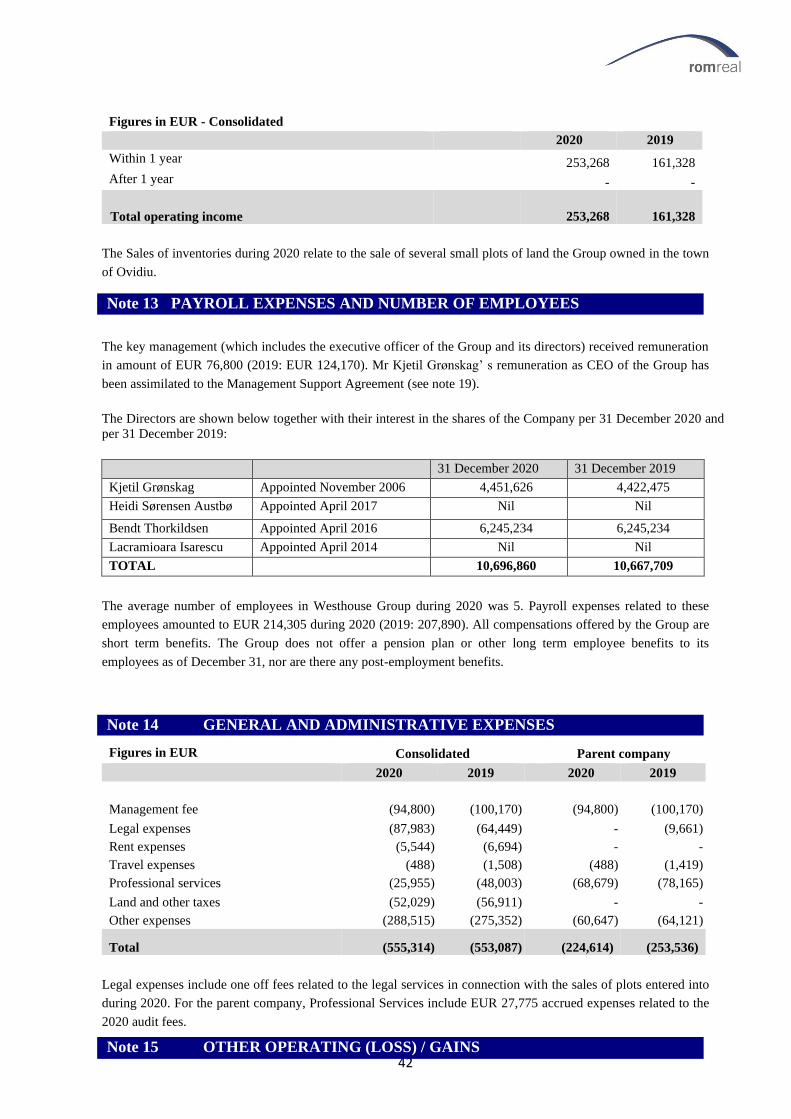
42
Figures in EUR - Consolidated
2020 2019
Within 1 year 253,268 161,328
After 1 year - -
Total operating income 253,268 161,328
The Sales of inventories during 2020 relate to the sale of several small plots of land the Group owned in the town
of Ovidiu.
The key management (which includes the executive officer of the Group and its directors) received remuneration
in amount of EUR 76,800 (2019: EUR 124,170). Mr Kjetil Grønskag’ s remuneration as CEO of the Group has
been assimilated to the Management Support Agreement (see note 19).
The Directors are shown below together with their interest in the shares of the Company per 31 December 2020 and
per 31 December 2019:
31 December 2020 31 December 2019
Kjetil Grønskag Appointed November 2006 4,451,626 4,422,475
Heidi Sørensen Austbø Appointed April 2017 Nil Nil
Bendt Thorkildsen Appointed April 2016 6,245,234 6,245,234
Lacramioara Isarescu Appointed April 2014 Nil Nil
TOTAL 10,696,860 10,667,709
The average number of employees in Westhouse Group during 2020 was 5. Payroll expenses related to these
employees amounted to EUR 214,305 during 2020 (2019: 207,890). All compensations offered by the Group are
short term benefits. The Group does not offer a pension plan or other long term employee benefits to its
employees as of December 31, nor are there any post-employment benefits.
Figures in EUR Consolidated Parent company
2020 2019 2020 2019
Management fee (94,800) (100,170) (94,800) (100,170)
Legal expenses (87,983) (64,449) - (9,661)
Rent expenses (5,544) (6,694) - -
Travel expenses (488) (1,508) (488) (1,419)
Professional services (25,955) (48,003) (68,679) (78,165)
Land and other taxes (52,029) (56,911) - -
Other expenses (288,515) (275,352) (60,647) (64,121)
Total (555,314) (553,087) (224,614) (253,536)
Legal expenses include one off fees related to the legal services in connection with the sales of plots entered into
during 2020. For the parent company, Professional Services include EUR 27,775 accrued expenses related to the
2020 audit fees.
Note 13 PAYROLL EXPENSES AND NUMBER OF EMPLOYEES
Note 6 INVENTORIES
Note 6 INVENTORIES
Note 4 INVESTMENTS PROPERTIES
Note 4 INVESTMENTS PROPERTIES
Note 14 GENERAL AND ADMINISTRATIVE EXPENSES
Note 6 INVENTORIES
Note 6 INVENTORIES
Note 4 INVESTMENTS PROPERTIES
Note 4 INVESTMENTS PROPERTIES
Note 15 OTHER OPERATING (LOSS) / GAINS
Note 6 INVENTORIES
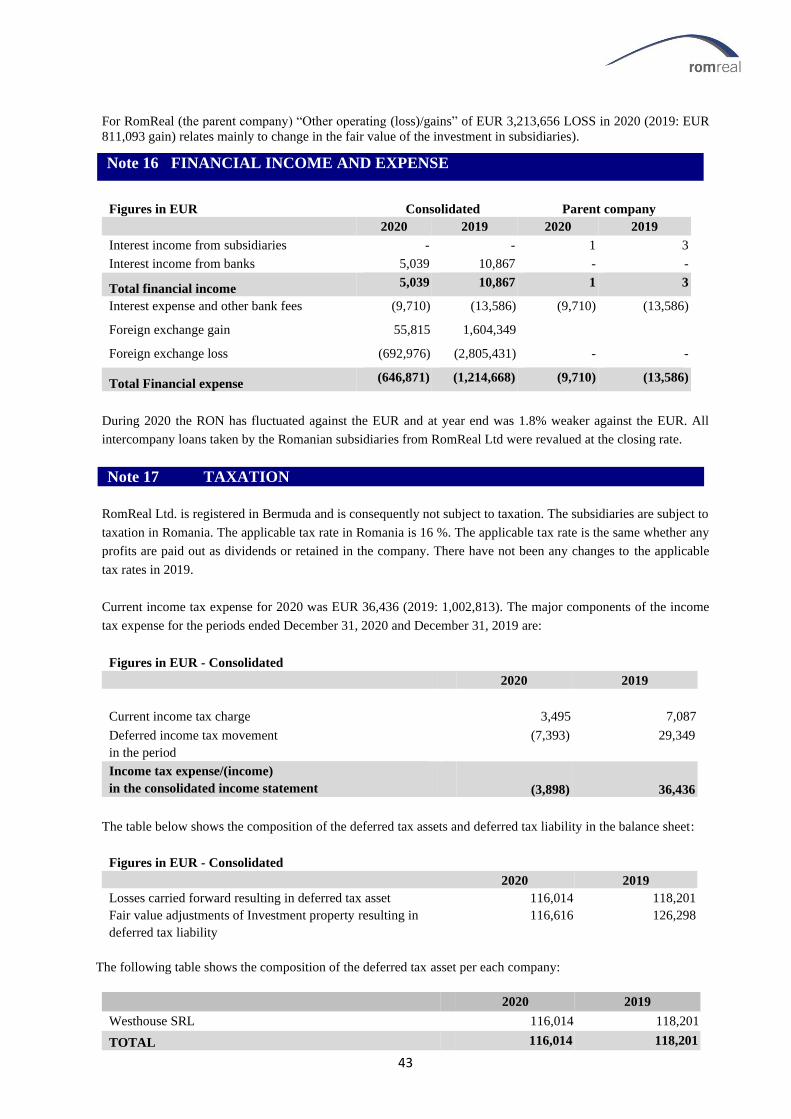
43
For RomReal (the parent company) “Other operating (loss)/gains” of EUR 3,213,656 LOSS in 2020 (2019: EUR
811,093 gain) relates mainly to change in the fair value of the investment in subsidiaries).
The fair value of investment property as at 31 December 2007 is based on a valuation by an independent valuer.
Figures in EUR Consolidated Parent company
2020 2019 2020 2019
Interest income from subsidiaries - - 1 3
Interest income from banks 5,039 10,867 - -
Total financial income 5,039 10,867 1 3
Interest expense and other bank fees (9,710) (13,586) (9,710) (13,586)
Foreign exchange gain 55,815 1,604,349
Foreign exchange loss (692,976) (2,805,431) - -
Total Financial expense (646,871) (1,214,668) (9,710) (13,586)
During 2020 the RON has fluctuated against the EUR and at year end was 1.8% weaker against the EUR. All
intercompany loans taken by the Romanian subsidiaries from RomReal Ltd were revalued at the closing rate.
RomReal Ltd. is registered in Bermuda and is consequently not subject to taxation. The subsidiaries are subject to
taxation in Romania. The applicable tax rate in Romania is 16 %. The applicable tax rate is the same whether any
profits are paid out as dividends or retained in the company. There have not been any changes to the applicable
tax rates in 2019.
Current income tax expense for 2020 was EUR 36,436 (2019: 1,002,813). The major components of the income
tax expense for the periods ended December 31, 2020 and December 31, 2019 are:
The table below shows the composition of the deferred tax assets and deferred tax liability in the balance sheet:
Figures in EUR - Consolidated
2020 2019
Losses carried forward resulting in deferred tax asset 116,014 118,201
Fair value adjustments of Investment property resulting in
deferred tax liability
116,616 126,298
The following table shows the composition of the deferred tax asset per each company:
2020 2019
Westhouse SRL 116,014 118,201
TOTAL 116,014 118,201
Figures in EUR - Consolidated
2020 2019
Current income tax charge 3,495 7,087
Deferred income tax movement
in the period
(7,393) 29,349
Income tax expense/(income)
in the consolidated income statement
(3,898) 36,436
Note 16 FINANCIAL INCOME AND EXPENSE
Note 6 INVENTORIES
Note 6 INVENTORIES
Note 4 INVESTMENTS PROPERTIES
Note 4 INVESTMENTS PROPERTIES
Note 17 TAXATION
Note 6 INVENTORIES
Note 6 INVENTORIES
Note 4 INVESTMENTS PROPERTIES
Note 4 INVESTMENTS PROPERTIES
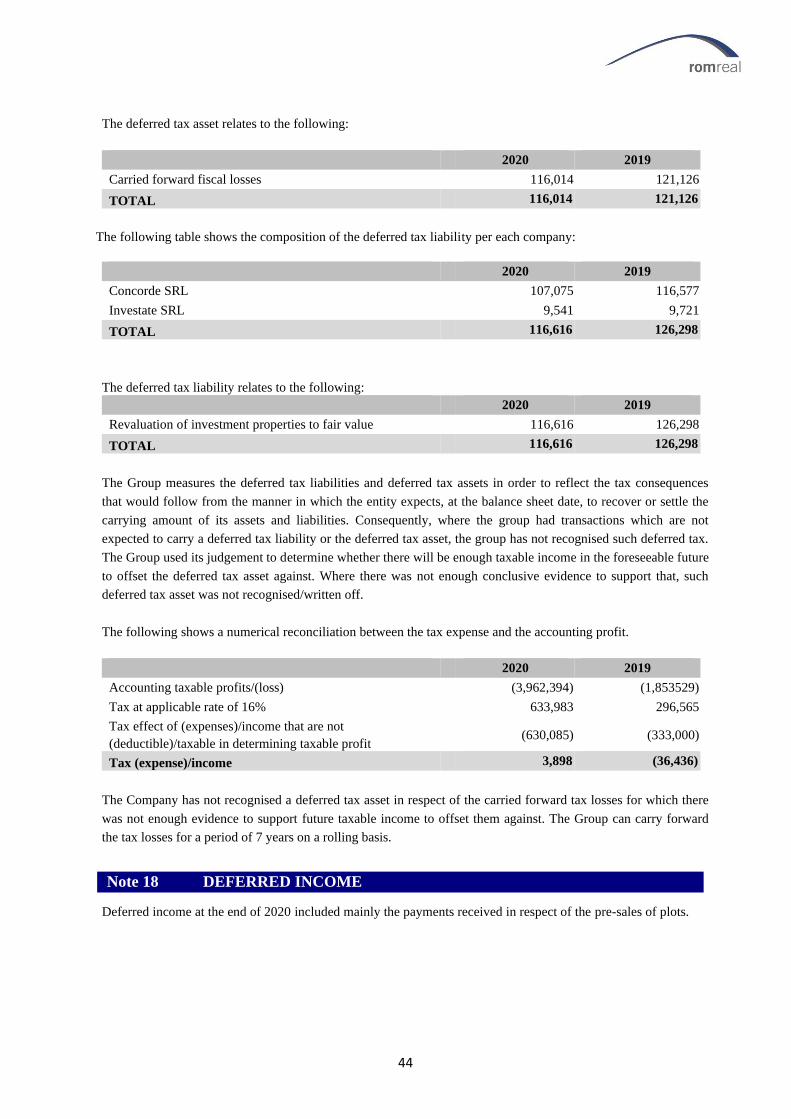
44
The deferred tax asset relates to the following:
2020 2019
Carried forward fiscal losses 116,014 121,126
TOTAL 116,014 121,126
The following table shows the composition of the deferred tax liability per each company:
2020 2019
Concorde SRL 107,075 116,577
Investate SRL 9,541 9,721
TOTAL 116,616 126,298
The deferred tax liability relates to the following:
2020 2019
Revaluation of investment properties to fair value 116,616 126,298
TOTAL 116,616 126,298
The Group measures the deferred tax liabilities and deferred tax assets in order to reflect the tax consequences
that would follow from the manner in which the entity expects, at the balance sheet date, to recover or settle the
carrying amount of its assets and liabilities. Consequently, where the group had transactions which are not
expected to carry a deferred tax liability or the deferred tax asset, the group has not recognised such deferred tax.
The Group used its judgement to determine whether there will be enough taxable income in the foreseeable future
to offset the deferred tax asset against. Where there was not enough conclusive evidence to support that, such
deferred tax asset was not recognised/written off.
The following shows a numerical reconciliation between the tax expense and the accounting profit.
2020 2019
Accounting taxable profits/(loss) (3,962,394) (1,853529)
Tax at applicable rate of 16% 633,983 296,565
Tax effect of (expenses)/income that are not
(deductible)/taxable in determining taxable profit
(630,085) (333,000)
Tax (expense)/income 3,898 (36,436)
The Company has not recognised a deferred tax asset in respect of the carried forward tax losses for which there
was not enough evidence to support future taxable income to offset them against. The Group can carry forward
the tax losses for a period of 7 years on a rolling basis.
Deferred income at the end of 2020 included mainly the payments received in respect of the pre-sales of plots.
Note 18 DEFERRED INCOME
Note 6 INVENTORIES
Note 6 INVENTORIES
Note 4 INVESTMENTS PROPERTIES
Note 4 INVESTMENTS PROPERTIES
45
Transactions with subsidiary
RomReal Ltd. has granted its subsidiary Westhouse Group SRL loans amounting to a total of EUR 25,039,049,
interest to 31 December 2020 included. Intergroup loans are for a term of 11 months. The loans are interest free.
The loan has been provisioned in the stand-alone financial statements of the parent. The loans shall be repaid out
based on availability of cash flows resulting from the monetization of the land bank assets.
Transactions with other related parties
During 2020 the Company paid a direct remuneration of EUR 94,800 per year to Chairman and CEO Kjetil
Grønskag. The Chairman and CEO agreement has a yearly remuneration of EUR 94,800 and a variable element
of 0.7% of all realized sales.
The Group’s Chairman Kjetil Gronskag, holds an executive position as Chief Executive of RomReal following
Board approval on the 26 May 2016.
All transactions with related parties have been conducted following the principle of arm’s length.
The Group’s principal financial liabilities comprise trade and other payables.
Fair value
The fair value of the financial assets and liabilities are the amounts at which the instrument could be exchanged in
a current transaction between willing parties, other than in a forced or liquidation sale. Cash and short-term
deposits, trade receivables, trade payables, and other current liabilities approximate their carrying amounts largely
due to the short-term maturities of these instruments. The fair value of borrowings is estimated by discounting
future cash flows using rates currently available for debt or similar terms and remaining maturities. The fair value
approximates their carrying values gross of unamortised transaction costs.
The fair value of the Group’s financial assets and liabilities is equal to the carrying amount.
Note 20 FINANCIAL RISK
Note 6 INVENTORIES
Note 6 INVENTORIES
Note 4 INVESTMENTS PROPERTIES
Note 4 INVESTMENTS PROPERTIES
Note 19 TRANSACTIONS WITH RELATED PARTIES
Note 6 INVENTORIES
Note 6 INVENTORIES
Note 4 INVESTMENTS PROPERTIES
Note 4 INVESTMENTS PROPERTIES

46
Credit risk
Credit risk is the risk that counterparty will not meet its obligations under a financial instrument or customer
contract, leading to a financial loss. The Group is exposed to credit risk from its operating activities, from its
financial investments and from its deposits with banks.
The carrying amounts of the Group’s cash and cash equivalents, other current assets and receivables represented
the maximum exposure to credit risk in relation to financial assets. Cash is placed with reputable banks.
As of 31 December 2020, no trade and other receivables were impaired (see note 6).
Interest rate risk
Interest rate risk is the risk that the fair value or future cash flows of a financial instrument will fluctuate because
of changes in market interest rates. At 31 December 2020, the Group’s had no exposure bearing the risk of
changes in market interest rates
Liquidity risk
The Group’s objective is to maintain a balance between continuity of funding and flexibility through the use of
bank deposits and loans. The objective of the Group is to ensure that sufficient cash is maintained to cover the
operating costs until the market recovers. Equally, the Group is actively looking to divest some of smaller plots in
order to strengthen its cash position. The table below summarises the maturity profile of the Group’s financial
liabilities based on contractual undiscounted payments.
Year ended 31 December
2020
On
demand
Less than 3
months
3 to 12
months
1 to 5 years > 5 years Total
Other payables - 92,743 - - - 92,743
Deferred income - - 35,524 - - 35,524
Tax payable - 347 - - - 347
Total -
93,090 35,524 - -
128,614
Year ended 31 December
2019
On
demand
Less than 3
months
3 to 12
months
1 to 5 years > 5 years Total
Other payables - 112,074 - - - 112,074
Deferred income - - 274,139 - - 274,139
Tax payable - 387 - - - 387
Total -
112,461 274,139 - -
386,600
Foreign currency risk
Foreign currency risk is the risk that the fair value or future cash flows of a financial instrument will fluctuate
because of changes in foreign exchange rates. The Group is subject to foreign exchange risk as the Romanian
subsidiaries have business activities denominated in RON, which is different from the currency of the parent
company and the one in which loans are denominated, EUR. All investment properties are owned by the
Romanian subsidiaries and thus denominated in RON. However, it is the market practice that investment
properties are valued with reference to EUR denominated values, thus minimising the foreign exchange risk of
the Group. From an operational point of view, the Group’s policy is to mitigate these effects by retaining as much
cash in EUR as possible and also by denominating receivables in EUR. The Group’s interest-bearing loans are
also denominated in EUR. The Group perceives the risk as moderate on a Group-wide basis and has not entered
into any foreign exchange forward contracts to hedge against foreign currency fluctuation. A 10% depreciation of
the RON against EUR, with all other variables held constant, would result in a EUR 1.8 million negative impact
in the profit before tax and a EUR 0.2 million decrease in equity. The impact on the Group’s profit before tax is
due to changes in the fair value of monetary assets and liabilities of the subsidiaries before they get translated into
the functional currency of the Group. The impact on the Group’s equity is due to the translation reserves.

47
Capital management
The primary objective of the Group’s capital management is to ensure that it maintains a strong credit rating and
healthy capital ratios in order to support its business and maximise shareholder value. The Group manages its
capital structure and makes adjustments to it, in light of changes in economic conditions.
The Group monitors capital primarily using a loan to value ratio, which is calculated as the amount of outstanding
debt divided by the valuation of the investment property portfolio. The Group’s policy is to keep a low average
loan to value ratio of the Group and in any event not higher than 70%. To maintain or adjust the capital structure,
the Group may adjust the dividend payment to shareholders, return capital to shareholders or issue new shares.
The Group complies with its target loan to value ratio and no changes were made in the objectives, policies or
processes during the years ended 31 December 2020 and 31 December 2019 and had no financial debt.
In mid-2018, during the latest routine tax audit performed at the level of RomReal Romanian
subsidiary Westhouse Group, covering the period 1 January 2011 – 31 December 2016, the tax
authorities reassessed the loans granted by RomReal to Westhouse Group as contribution to share
capital instead of inter-Company loans. In this respect, the Company received the tax audit report
(“Tax Report”) and the corresponding tax assessment decision (“Tax Decision”), whereby the tax
authorities imposed an extraordinary tax-bill on the Company, in excess of EUR 1.7 million (including
penalties), as profit tax for the period covered by the tax audit.
Due to a 2020 legal regulation issued by the Government in order to protect the interests of the local
companies, which means that subject to certain conditions local companies will be exempted of
important debts/claims to the state, the Company has reassessed the position in respect of this case with
the assistance of local EY tax advisory team. The Company has paid the main claim totalling EUR 1.05
million during 4th quarter 2020, being therefore exempted for payment of penalties, irrespective of the
outcome of the final Court decision to be issued in this case.
By forwarding this tax claim of EUR 1.05m, the Company’s “worst case loss” has been reduced by Eur
0.65 million from previously EUR 1.7 million. The Company is continuing the legal process in the
Court, to obtain a satisfactory decision and obtain reimbursement of the amounts paid as well as
applicable interest. A new comprehensive report has been presented to the Court by the experts
appointed in this case, who rejects in full Tax Authority allegations. The Group’s plea was rejected by
the Constanta Court and the company is currently waiting for the Court;s written decision in order to
apply to the High Court in Bucharest.
The Group has not issued any guarantees on behalf of external parties.
The directors of the Parent Company have issued a support letter to its operating subsidiaries stating its intentions
to continue to support the subsidiaries if issues regarding their viability subsequently arose.
Note 21 TAX DISPUTE
Note 6 INVENTORIES
Note 6 INVENTORIES
Note 4 INVESTMENTS PROPERTIES
Note 4 INVESTMENTS PROPERTIES
Note 22 GUARANTEE OBLIGATIONS
Note 6 INVENTORIES
Note 6 INVENTORIES
Note 4 INVESTMENTS PROPERTIES
Note 4 INVESTMENTS PROPERTIES
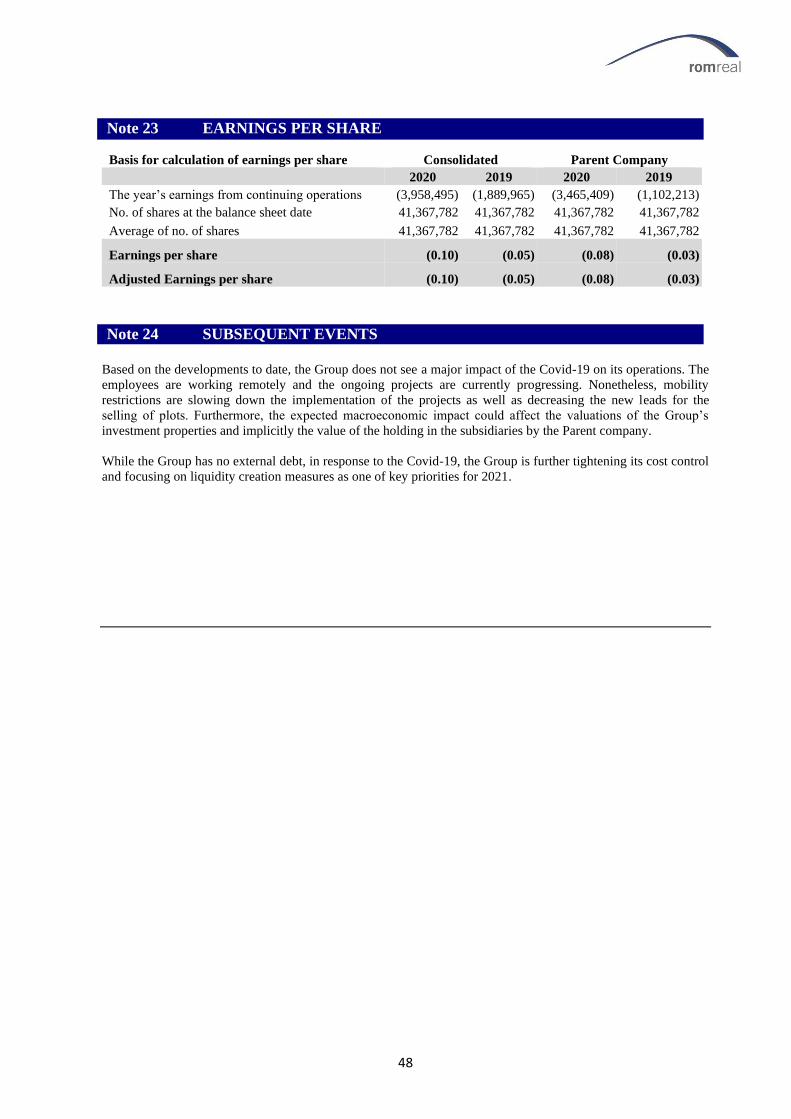
48
Basis for calculation of earnings per share Consolidated Parent Company
2020 2019 2020 2019
The year’s earnings from continuing operations (3,958,495) (1,889,965) (3,465,409) (1,102,213)
No. of shares at the balance sheet date 41,367,782 41,367,782 41,367,782 41,367,782
Average of no. of shares 41,367,782 41,367,782 41,367,782 41,367,782
Earnings per share (0.10) (0.05) (0.08) (0.03)
Adjusted Earnings per share (0.10) (0.05) (0.08) (0.03)
Based on the developments to date, the Group does not see a major impact of the Covid-19 on its operations. The
employees are working remotely and the ongoing projects are currently progressing. Nonetheless, mobility
restrictions are slowing down the implementation of the projects as well as decreasing the new leads for the
selling of plots. Furthermore, the expected macroeconomic impact could affect the valuations of the Group’s
investment properties and implicitly the value of the holding in the subsidiaries by the Parent company.
While the Group has no external debt, in response to the Covid-19, the Group is further tightening its cost control
and focusing on liquidity creation measures as one of key priorities for 2021.
Note 23 EARNINGS PER SHARE
Note 6 INVENTORIES
Note 6 INVENTORIES
Note 4 INVESTMENTS PROPERTIES
Note 4 INVESTMENTS PROPERTIES Note 24 SUBSEQUENT EVENTS
Note 6 INVENTORIES
Note 6 INVENTORIES
Note 4 INVESTMENTS PROPERTIES
Note 4 INVESTMENTS PROPERTIES
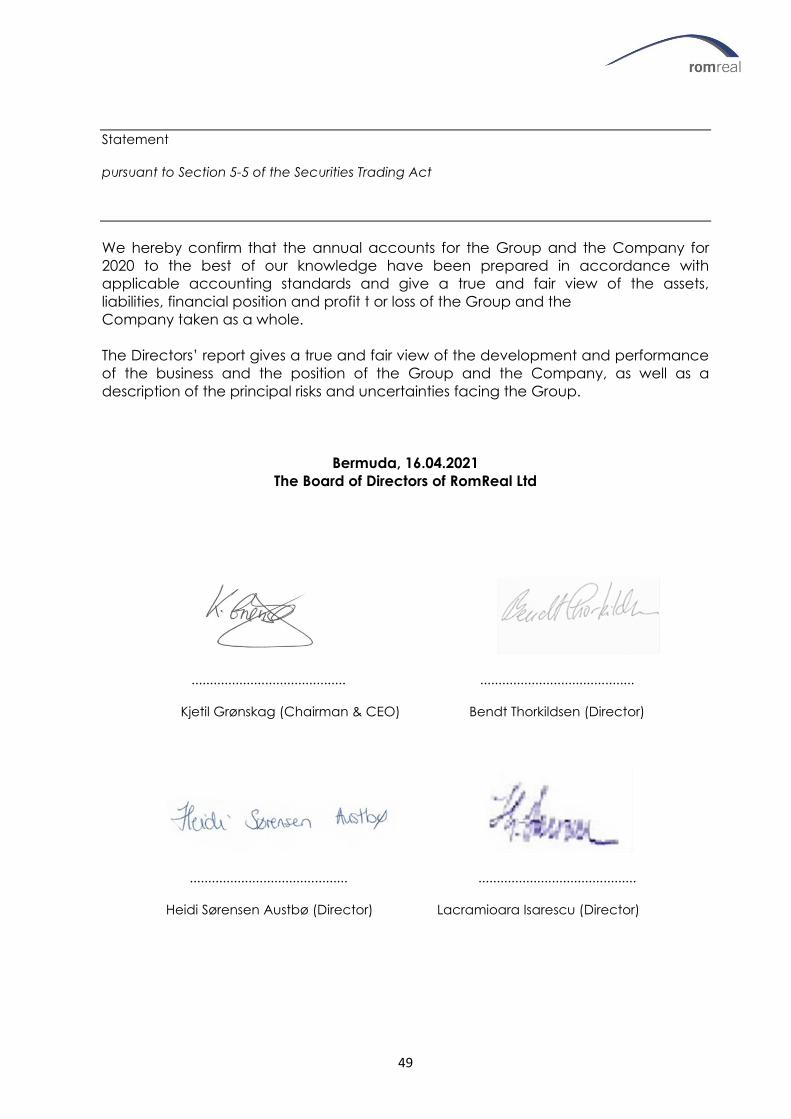
49
Statement
pursuant to Section 5-5 of the Securities Trading Act
We hereby confirm that the annual accounts for the Group and the Company for
2020 to the best of our knowledge have been prepared in accordance with
applicable accounting standards and give a true and fair view of the assets,
liabilities, financial position and profit t or loss of the Group and the
Company taken as a whole.
The Directors’ report gives a true and fair view of the development and performance
of the business and the position of the Group and the Company, as well as a
description of the principal risks and uncertainties facing the Group.
Bermuda, 16.04.2021
The Board of Directors of RomReal Ltd
.......................................... ..........................................
Kjetil Grønskag (Chairman & CEO) Bendt Thorkildsen (Director)
........................................... ...........................................
Heidi Sørensen Austbø (Director) Lacramioara Isarescu (Director)

50
Company Addresses
Westhouse Group srl Westhouse Group SRL, 54 Cuza-Voda Street, ap. 3, ground floor,
Constanta, Romania, 900682
RomReal Ltd Burnaby Building, 16 Burnaby Street, Hamilton, HM11, Bermuda
Auditors Ernst & Young SRL, Premium Plaza Building, 3rd Floor, 63-69 Dr. Iacob Felix
Street, Sector 1, 011033, Bucharest, Romania
Auditors Ernst & Young AS, Thormøhlens gate 53 D, PO Box 6163, Postterminalen,
Bergen, N5892, Norway
Legal Advisors Wakefield Quin Limited, Victoria Place, 31 Victoria Street, Hamilton, HM10,
Bermuda
Bank in Norway Nordea Bank Norge ASA, Olav Tryggvasons gt. 39/4, 7005 Trondheim,
Norway
Bank in Romania Alpha Bank Constanta, 175 Mamaia Boulevard, 900540, Constanta,
Romania
IR | [email protected]
For further information on RomReal, including presentation material relating to this interim report and
financial information, please visit www.RomReal.com
DISCLAIMER
The information included in this Report contains certain forward-looking statements that address
activities, events or developments that RomReal Limited (“the Company”) expects, projects, believes or
anticipates will or may occur in the future. These statements are based on various assumptions made by
the Company, which are beyond its control and are subject to certain additional risks and uncertainties.
The Company is subject to a large number of risk factors including but not limited to economic and
market conditions in the geographic areas and markets in which RomReal is or will be operating,
counterparty risk, interest rates, access to financing, fluctuations in currency exchange rates, and
changes in governmental regulations. As a result of these and other risk factors, actual events and our
actual results may differ materially from those indicated in or implied by such forward-looking statements.
The reservation is also made that inaccuracies or mistakes may occur in the information given above
about current status of the Company or its business. Any reliance on the information above is at the risk
of the reader, and RomReal disclaims any and all liability in this respect.