consolidated - globenewswire
TRANSCRIPT

CONSOLIDATED FINANCIAL STATEMENTS – GROUP ANNUAL REPORT 2018
SAGA TANKERS 2018 ANNUAL REPORT > PAGE 2
CONTENTS 2018 Annual Report
Board of Director’s Report 2018 > page 3 – page 5
Consolidated statement of comprehensive income 2018 > page 6
Consolidated statement of financial position 2018 > page 7 - page 8
Consolidated cash flow statement 2018 > page 9
Consolidated statement of changes in equity 2018 > page 10
Notes to the consolidated financial statements > page 11 – page 31
Responsibility statement > page 32
Corporate Governance > page 33
Separate income statement 2018 > page 35
Separate financial position 2018 > page 36
Separate cash flow statement 2018 > page 37
Notes to the separate financial statements > page 38 – page 49
Independent auditor’s report 2018 > page 50

SAGA TANKERS 2018 ANNUAL REPORT > PAGE 3
BOARD OF DIRECTORS’ REPORT The business activity of the Group is investment and management related to shipping, rig, real estate, stock trading and similar business activities. A LOOK BACK ON 2018 During the first quarter of 2018 Oslo Benchmark index moved sideways with only minor movements. Oslo Benchmark index had a strong second and third quarter with an increase of approximately 16% from the end of first quarter and 15% YTD. During the fourth quarter the Oslo Benchmark index fell approximately 15% from the end of third quarter. For the year 2018, Oslo Børs Benchmark Index was down 2 %, while the Energy Index increased by approximately 2 %. The major change in the investments has been the disposal of the available-for-sale investment in Pareto Bank ASA.
The Group’s largest investments at the end of the year were SD Standard Drilling Plc, Vistin Pharma ASA and the Vallhall subsidiaries. The Group distributed MNOK 40 in dividends in 2018, corresponding to NOK 0.15 per share. The Group’s investment in SD Standard Drilling Plc, has been reclassified from associated company to Available-for-sale financial assets. This as a result of dilution of ownership following an equity issue in SD Standard Drilling Plc. The classification is based on an overall assessment by the management. The changes in the group structure during 2018, has all been related to subsidiaries. The fully owned subsidiary Saga Agnes AS, has been dissolved, and the group’s additional four fully owned subsidiaries were per the end of 2018 in the process of merging with Saga Tankers ASA, with completion in 2019. The reorganization of the 100 % owned subsidiaries is merely an optimization of the group structure, and does not impact net assets or liabilities for the Group. FINANCIAL RESULTS 2018 (GROUP) The Group reports a total comprehensive income for 2018 of MNOK -66.7 (2017: MNOK 20.5). The major items of the Group’s net comprehensive income consist of income from lease and operation of property of MNOK 20.7 and net loss on available-for-sale financial assets of MNOK 85.2. Gross income for 2018 was MNOK 21.2 (2017: MNOK 74.0).
Total operating expenses for 2018 were MNOK 108.9 (2017: MNOK 21.8). The operating expenses of 2018 include MNOK 85.2 in net loss on available-for-sale assets. Net operating loss for 2018 was MNOK 87.7 (2017: profit of MNOK 52.2). Operating loss before interest, taxes, depreciation and amortization (EBITDA) for 2018 was MNOK 61.7 (2017: profit of MNOK 59.4). The EBITDA can be derived as described directly and unadjusted from the statement of income. Net financial items for 2018 were NOK -1.1 million (2017: MNOK 0.8). Earnings per share for 2018 were NOK -0.26 (2017: NOK 0.20), based on the net profit to shareholders of MNOK -68.4 (2017: MNOK 54.4). As of year-end, the Company had 409 shareholders and 266,149,831 shares outstanding. The average number of shares outstanding throughout the year was also 266,149,831. The Company’s 20 largest shareholders controlled about 92.6% of the total number of shares outstanding at year-end. LIQUIDITY AND CASH FLOW The net cash balance as of 31 December 2018 was TNOK 143,084 (2017: TNOK 27,084). The net change in cash over the year was TNOK 116,220 (2017: TNOK -411,976). Of the change in cash in 2018, TNOK 188,567 is from disposal of available-for-sale financial assets. FINANCIAL POSITION As of 31 December 2018, the Group’s total assets amounted to MNOK 392.7 (2017: MNOK 491.7). Total equity to shareholders of parent company was MNOK 302.1 (2017: MNOK 410.9). It is the opinion of the Board of Directors that the Group is in a sound financial position with an equity ratio of about 82.1 % (2017: 88.9 %.) Please see further information described under the Going Concern section. RISK FACTORS The Group is exposed to a limited number of risk factors. The most significant risk factors are market risk, legal risk, credit risk and liquidity risk. Market risk: The Group's investments in shares and other financial instruments expose the Group to market risk in terms of equity price risk. The Group
SAGA TANKERS 2018 ANNUAL REPORT > PAGE 4
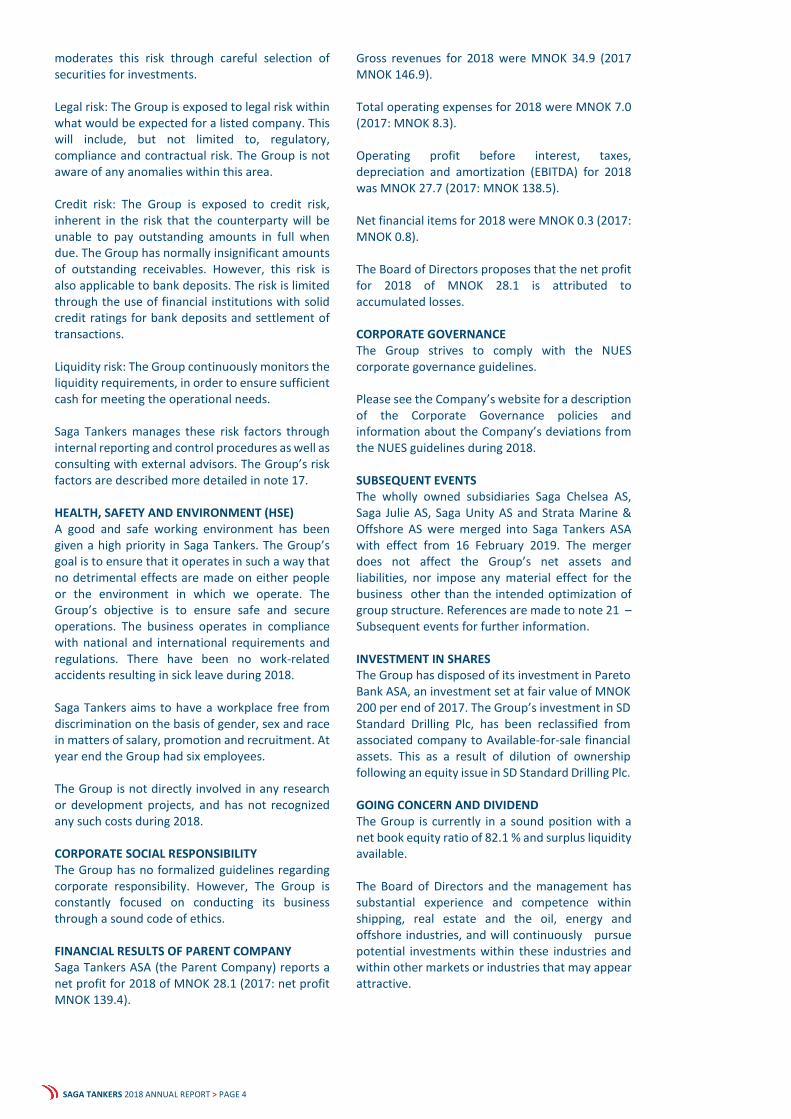
moderates this risk through careful selection of securities for investments. Legal risk: The Group is exposed to legal risk within what would be expected for a listed company. This will include, but not limited to, regulatory, compliance and contractual risk. The Group is not aware of any anomalies within this area. Credit risk: The Group is exposed to credit risk, inherent in the risk that the counterparty will be unable to pay outstanding amounts in full when due. The Group has normally insignificant amounts of outstanding receivables. However, this risk is also applicable to bank deposits. The risk is limited through the use of financial institutions with solid credit ratings for bank deposits and settlement of transactions. Liquidity risk: The Group continuously monitors the liquidity requirements, in order to ensure sufficient cash for meeting the operational needs. Saga Tankers manages these risk factors through internal reporting and control procedures as well as consulting with external advisors. The Group’s risk factors are described more detailed in note 17. HEALTH, SAFETY AND ENVIRONMENT (HSE) A good and safe working environment has been given a high priority in Saga Tankers. The Group’s goal is to ensure that it operates in such a way that no detrimental effects are made on either people or the environment in which we operate. The Group’s objective is to ensure safe and secure operations. The business operates in compliance with national and international requirements and regulations. There have been no work-related accidents resulting in sick leave during 2018. Saga Tankers aims to have a workplace free from discrimination on the basis of gender, sex and race in matters of salary, promotion and recruitment. At year end the Group had six employees. The Group is not directly involved in any research or development projects, and has not recognized any such costs during 2018. CORPORATE SOCIAL RESPONSIBILITY The Group has no formalized guidelines regarding corporate responsibility. However, The Group is constantly focused on conducting its business through a sound code of ethics. FINANCIAL RESULTS OF PARENT COMPANY Saga Tankers ASA (the Parent Company) reports a net profit for 2018 of MNOK 28.1 (2017: net profit MNOK 139.4).
Gross revenues for 2018 were MNOK 34.9 (2017 MNOK 146.9). Total operating expenses for 2018 were MNOK 7.0 (2017: MNOK 8.3). Operating profit before interest, taxes, depreciation and amortization (EBITDA) for 2018 was MNOK 27.7 (2017: MNOK 138.5). Net financial items for 2018 were MNOK 0.3 (2017: MNOK 0.8). The Board of Directors proposes that the net profit for 2018 of MNOK 28.1 is attributed to accumulated losses. CORPORATE GOVERNANCE The Group strives to comply with the NUES corporate governance guidelines. Please see the Company’s website for a description of the Corporate Governance policies and information about the Company’s deviations from the NUES guidelines during 2018. SUBSEQUENT EVENTS The wholly owned subsidiaries Saga Chelsea AS, Saga Julie AS, Saga Unity AS and Strata Marine & Offshore AS were merged into Saga Tankers ASA with effect from 16 February 2019. The merger does not affect the Group’s net assets and liabilities, nor impose any material effect for the business other than the intended optimization of group structure. References are made to note 21 – Subsequent events for further information. INVESTMENT IN SHARES The Group has disposed of its investment in Pareto Bank ASA, an investment set at fair value of MNOK 200 per end of 2017. The Group’s investment in SD Standard Drilling Plc, has been reclassified from associated company to Available-for-sale financial assets. This as a result of dilution of ownership following an equity issue in SD Standard Drilling Plc. GOING CONCERN AND DIVIDEND The Group is currently in a sound position with a net book equity ratio of 82.1 % and surplus liquidity available. The Board of Directors and the management has substantial experience and competence within shipping, real estate and the oil, energy and offshore industries, and will continuously pursue potential investments within these industries and within other markets or industries that may appear attractive.
SAGA TANKERS 2018 ANNUAL REPORT > PAGE 6
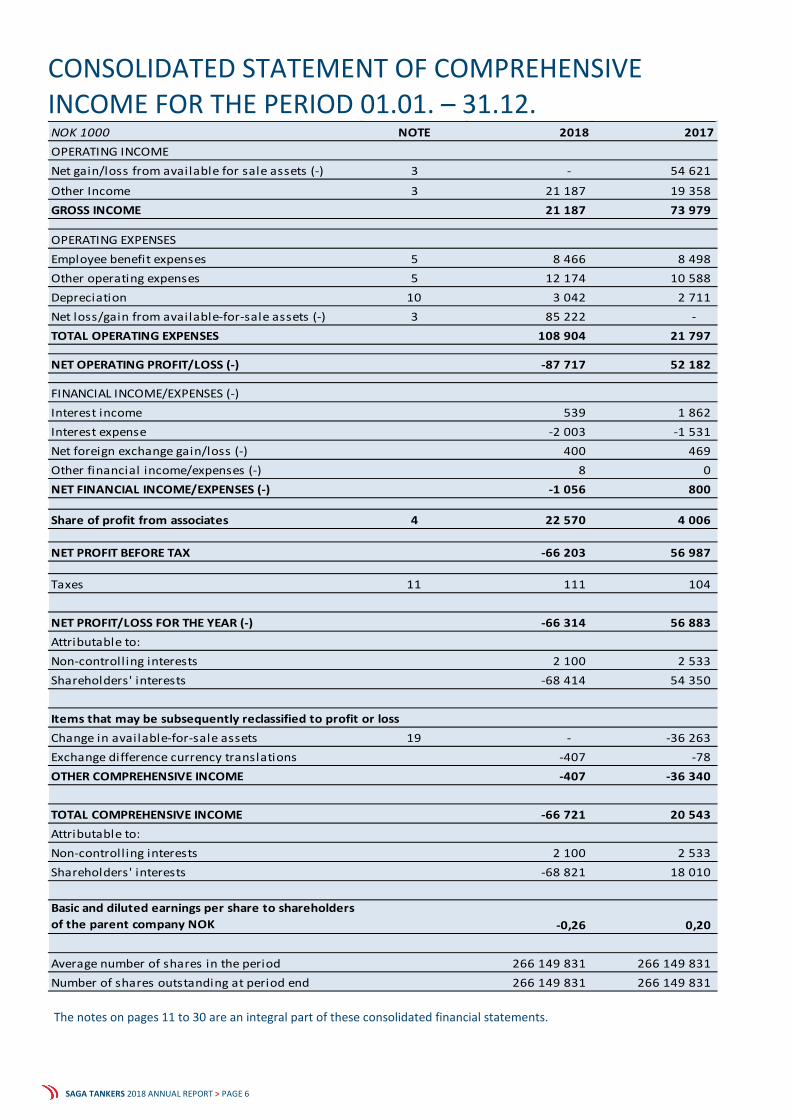
CONSOLIDATED STATEMENT OF COMPREHENSIVE INCOME FOR THE PERIOD 01.01. – 31.12. NOK 1000 NOTE 2018 2017OPERATING INCOMENet gain/loss from available for sale assets (-) 3 - 54 621
Other Income 3 21 187 19 358 GROSS INCOME 21 187 73 979
OPERATING EXPENSESEmployee benefit expenses 5 8 466 8 498 Other operating expenses 5 12 174 10 588 Depreciation 10 3 042 2 711 Net loss/gain from available-for-sale assets (-) 3 85 222 - TOTAL OPERATING EXPENSES 108 904 21 797
NET OPERATING PROFIT/LOSS (-) -87 717 52 182
FINANCIAL INCOME/EXPENSES (-)Interest income 539 1 862 Interest expense -2 003 -1 531 Net foreign exchange gain/loss (-) 400 469 Other financial income/expenses (-) 8 0 NET FINANCIAL INCOME/EXPENSES (-) -1 056 800
Share of profit from associates 4 22 570 4 006
NET PROFIT BEFORE TAX -66 203 56 987
Taxes 11 111 104
NET PROFIT/LOSS FOR THE YEAR (-) -66 314 56 883 Attributable to:Non-controll ing interests 2 100 2 533 Shareholders' interests -68 414 54 350
Items that may be subsequently reclassified to profit or lossChange in available-for-sale assets 19 - -36 263 Exchange difference currency translations -407 -78 OTHER COMPREHENSIVE INCOME -407 -36 340
TOTAL COMPREHENSIVE INCOME -66 721 20 543 Attributable to:Non-controll ing interests 2 100 2 533 Shareholders' interests -68 821 18 010
Basic and diluted earnings per share to shareholders of the parent company NOK -0,26 0,20
Average number of shares in the period 266 149 831 266 149 831 Number of shares outstanding at period end 266 149 831 266 149 831
The notes on pages 11 to 30 are an integral part of these consolidated financial statements.

SAGA TANKERS 2018 ANNUAL REPORT > PAGE 7
CONSOLIDATED STATEMENT OF FINANCIAL POSITION AS AT 31 DECEMBER NOK 1000 NOTE 31 Dec 2018 31 Dec 2017
ASSETSNon-current assetsAvailable-for-sale financial assets 17,19 156 462 230 152 Fixed assets 10 91 821 92 611 Associates 4 - 139 323 Total non-current assets 248 282 462 085
Current assetsTrade receivables and other receivables 8 666 1 233 Other current assets 7 414 1 278 Cash and equivalents 6,17 143 304 27 084 Total current assets 144 384 29 594
TOTAL ASSETS 392 667 491 679
The notes on pages 11 to 30 are an integral part of these consolidated financial statements.


SAGA TANKERS 2018 ANNUAL REPORT > PAGE 9
CONSOLIDATED CASH FLOW STATEMENT FOR THE PERIOD 01.01. – 31.12. NOK 1000 NOTE 2018 2017
Profit before tax -66 203 56 987 Profit share from associates -22 570 -4 006 Depreciation 10 3 042 2 711 Net loss/(-gain) from AVA asset 85 222 -54 621 Foreign exchange losses/(gains) -401 -480 Interest paid 1 865 1 571 Interest received -513 -1 833 Income tax paid -36 -14 Increase/decrease receivables and prepayments 1 431 -1 885 Increase/decrease payables and accruals -1 306 2 387 Net cash flow from operating activities 531 817
Investment in AVA Financial assets 19 -46 425 -98 698 Divestment in AVA Financial assets 188 567 86 697 Net divestment/(-investment) trading 135 - Dividends received 8 084 - Net cash effect new subsidiaries - - Net cash effect disposal of subsidiaries - - Interest received 513 1 833 Investment in fixed assets -2 252 -5 809 Net cash flow from investing activities 148 621 -15 978
Repayments of long term borrowings 12 -7 000 -4 000 Drawdown long term borrowings 24 000 - Payment of interest 12 -1 865 -1 571 Dividends paid to non-controll ing interests -8 139 - Dividends and repayments to controll ing interests -39 922 -391 240 Acquisition of own shares - -
Net cash flow from financing activities -32 926 -396 811
Net change in cash and cash equivalents 116 226 -411 972
Cash and equivalents at beginning of period 27 084 439 060 Net foreign exchange differences (unrealised) -6 -5 Cash and equivalents at end of period 143 304 27 084
The notes on pages 11 to 30 are an integral part of these consolidated financial statements.

SAGA TANKERS 2018 ANNUAL REPORT > PAGE 10
CONSOLIDATED STATEMENT OF CHANGES IN EQUITY FOR THE YEAR ENDED 31 DECEMBER
2018
NOK 1000Issued capital
Own shares
Other equity
Accumulated losses
Available for sale reserve
Exchange difference currency translations
Non-controlling interests Total
Equity as of 31 December 2017 - as previously reported 2 661 - 859 577 -503 799 54 654 -2 241 26 218 437 071 Changes in accounting principles IFRS 9 - Note 1 54 654 -54 654 Equity as at 1 January 2018 2 661 - 859 577 -449 144 - -2 241 26 218 437 071 Net profit/(-loss) - - - -68 414 2 100 -66 314 Other comprehensive income - - - -407 -407 Total comprehensive income - - - -68 414 - -407 2 100 -66 721 Dividends to controll ing interests -39 922 -39 922 Dividends to non-controll ing interests -8 139 -8 139
Equity per ending balance 31 December 2018 2 661 - 819 655 -517 559 - -2 648 20 179 322 288
2017
NOK 1000Issued capital
Own shares
Other equity
Accumulated losses
Available for sale reserve
Exchange difference currency translations
Non-controlling interests Total
Equity as at 1 January 2017 286 733 -20 583 987 329 -558 149 90 917 -2 164 23 685 807 768 Net profit/(-loss) - - - 54 350 2 533 56 883 Other comprehensive income - - - -36 263 -78 -36 340 Total comprehensive income - - - 54 350 -36 263 -78 2 533 20 543 Cancellation of own shares -20 583 20 583 - - - - - - Dividends/repayment to shareholders -263 488 - -127 752 - - - - -391 240
Equity per ending balance 31 December 2017 2 661 - 859 577 -503 799 54 654 -2 241 26 218 437 071
Other capital
Paid-in-capital Other capital
Paid-in-capital
The notes on pages 11 to 30 are an integral part of these consolidated financial statements.

SAGA TANKERS 2018 ANNUAL REPORT > PAGE 11
NOTES TO CONSOLIDATED FINANCIAL STATEMENT NOTE 1 – CORPORATE INFORMATION Saga Tankers ASA (“the Company”) is a public limited liability company incorporated and domiciled in Norway. The address of the head office is Sjølyst Plass 2, 0278 Oslo. The Company was incorporated on 24 March 2010 and was listed on the Oslo Stock Exchange “Axess”-list on 18 June 2010. The consolidated financial statements for the year ended 31 December 2018, were approved by the Board of Directors on 25 April 2019, and will be presented for approval at the Annual General Meeting on 23 May 2019. The business activity of the Group is investment and management related to shipping, rig, real estate, stock trading and similar business activities. NOTE 2 – ACCOUNTING POLICIES The principal accounting policies applied in the preparation of these consolidated financial statements are set out below. These policies have been applied to all the years presented, unless otherwise stated. Basis of preparation The financial statements for Saga Tankers for the financial year 2018 have been prepared in accordance with International Financial Reporting Standards (IFRS) as adopted by the EU. The IFRS principles have been applied consistently since incorporation. Below is a summary of the Group’s accounting policies to be applied in the consolidated financial statements. The consolidated financial statements are presented in NOK and all numbers are rounded to the nearest thousands, except where otherwise indicated. The statement of comprehensive income is presented on a mixed basis (a blend of expenses by nature and function), as this is assessed to be the most relevant and reliable presentation. Going concern The financial statements have been prepared on the going concern assumption. For additional information see Board of Director’s report. Basis of consolidation The consolidated financial statements comprise the financial statements of Saga Tankers ASA and its subsidiaries (the “Group”) as of 31 December each year. Subsidiaries Subsidiaries are all entities (including structured entities) over which the group has control. The group controls an entity when the group is exposed to, or has rights to, variable returns from its involvement with the entity and has the ability to affect those returns through its power over the entity. Subsidiaries are fully consolidated from the date on which control is transferred to the group. They are deconsolidated from the date the control ceases. All inter-company transactions and balances are eliminated in the consolidated financial statements. Associates Associates are all entities over which the group has significant influence but not control or joint control. This is generally the case when the group holds between 20% and 50% of the voting rights. Investments in associates are accounted for using the equity method of accounting. Under the equity method, the investment is initially recognized at cost, and the carrying amount is
SAGA TANKERS 2018 ANNUAL REPORT > PAGE 12
increased or decreased to recognize the investor’s share of the profit or loss of the investee after the date of acquisition. The group’s investment in associates includes goodwill identified on acquisition. If the ownership interest in an associate is reduced, but significant influence is retained, only a proportionate share of the amounts previously recognized in other comprehensive income is reclassified to profit or loss where appropriate. The group’s share of post-acquisition profit or loss is recognized in the income statement, and its share of post-acquisition movements in other comprehensive income is recognized in other comprehensive income with a corresponding adjustment to the carrying amount of the investment. When the group’s share of losses in an associate equals or exceeds its interest in the associate, including any other unsecured receivables, the group does not recognize further losses, unless it has incurred legal or constructive obligations or made payments on behalf of the associate. The group determines at each reporting date whether there is any objective evidence that the investment in the associate is impaired. If this is the case, the group calculates the amount of impairment as the difference between the recoverable amount of the associate and its carrying value and recognizes the amount adjacent to share of profit/ (loss) of associates in the income statement. Dilution gains and losses arising in investments in associates are recognized in the income statement. Significant accounting judgments, estimates and assumptions The preparation of financial statements in accordance with IFRS requires management to make judgments, estimates and assumptions that may affect assets, liabilities, revenues, expenses and information in notes to the financial statement. Estimates are management’s best knowledge based on information available at the date the financial statements are authorized for issue. Actual results may differ from these estimates. Such changes will be recognized when new estimates can be determined with certainty. Associates The judgement of whether the group imposes significant influence or not over the investment is subject to an assessment of several factors, whereas share of voting-rights is the principle factor. If the share of votes controlled by the group is 20 % or more, significant influence is considered present unless hard evidence state otherwise. This hard evidence could be in form of shareholders agreements that clearly curtails the investors’ leeway. For investments where the group controls less than 20 %, factors as board representation, shareholder-structure and other factors that could give rise to further influence is also taken into consideration in order to assess on whether significant influence is presented regardless of voting rights below the 20 % threshold. The investment in SD Standard Drilling Plc was at 2 March 2018 diluted from 20.219 % to 18.375 % ownership of the outstanding shares. The dilution resulted in a reclassification from associated entity to available-for-sale, as the investment was assessed to be an Available-for-sale financial asset as of this period. The company assessed that it did not have significant influence. Actual ownership and influence in a listed company was considered to be the decisive factor. The fact that the company had mutual chairman and received certain services did not in fact lead to significant influence. The assessment is further supported by the fact that it is an independent nomination committee in SDSD, there are no shareholder agreement/voting agreement in place and that Saga Tankers does not have any active management role on behalf of SDSD. References are made to note 4 for further information. Available-for-sale financial assets Available-for-sale financial assets are valued at fair value. In cases where the fair value is not available through market values in quoted prices, the marked value is estimated through benchmarking, estimates from independent values and other sources. Summary of significant accounting policies Depreciation of fixed assets Fixed assets are depreciated on a straight-line basis over their expected useful lives. Land is not depreciated. Recognition other income Other income related to lease of property and related services. The income is recognised as soon as the services are rendered to the recipients. Revenue is measured at the fair value of the consideration received or receivable and represents amounts receivable for services rendered, stated net of discounts, returns and value added taxes. Revenue from investment and trading of financial instruments The group recognizes revenue when the amount of revenue can be reliably measured; when it is probable that future economic benefits will flow to the entity; and when specific criteria have been met for the group’s activity (i.e. at trade date). The group indulges in investment and trading of financial instruments as part of its core business. All such instruments are classified as available-for-sale assets, unless the Group exercises significant influence of the investment, in which case the investment will be classified as associate. See the group accounting policy describing Financial Instruments below.
SAGA TANKERS 2018 ANNUAL REPORT > PAGE 13
In cases where as an investment changes classification between associate and available-for-sale assets either way, the investment is derecognized and recognized in its new classification based on its fair value as of time of derecognition/recognition. The highest level achievable according to the IFRS fair-value hierarchy will be applied. Dividend Income Dividend income is recognised when the right to receive payment is established. The company classifies such income as 'Other Income' on the face of Consolidated Statement of Comprehensive Income. Foreign currency The financial statements are presented in NOK, which is also the functional currency for all the companies in the Group. Transactions in foreign currencies are recorded at the exchange rate in effect at the date of the transaction. Monetary assets and liabilities denominated in foreign currencies are retranslated at the exchange rate at the financial position date. Non-monetary items that are measured at historical cost in a foreign currency are translated using the exchange rates as at the dates of the initial transactions. Impairment of non-financial assets Fixed assets Fixed assets are reviewed for indication of impairment at each reporting date, and whenever events or changes in circumstances indicate that the carrying amount of an asset may not be recoverable. Whenever the carrying amount of an asset exceeds its recoverable amount, an impairment loss is recognized. The recoverable amount is the higher of an assets net selling price and its value in use. The net selling price is the amount obtainable from the sale of an asset in an arm’s length transaction less the costs of disposal, while value in use is the present value of estimated future cash flows expected to arise from the continuing use of an asset and from its disposal at the end of its useful life. Recoverable amounts are estimated for individual assets if possible, or else for the cash-generating unit. Financial assets Financial assets are classified, at initial recognition, as subsequently measured at amortised cost, fair value through other comprehensive income (OCI), and fair value through profit or loss. The classification of financial assets at initial recognition depends on the financial asset’s contractual cash flow characteristics and the Group’s business model for managing them. The groups financial assets and liabilities can be classified in the following categories: loan and receivables, other financial liabilities and available-for-sale, whereas the latter category is the most crucial for the Group. Available-for-sale assets The group’s available-for-sale assets are characterised in addition to the groups intention of sale, that this sale could typically be expected to occur within a tree year time frame The available-for-sale assets are therefore treated at fair value through profit or loss. Financial assets at fair value through profit or loss include financial assets held for trading, financial assets designated upon initial recognition at fair value through profit or loss, or financial assets mandatorily required to be measured at fair value. Financial assets are classified as held for trading if they are acquired for the purpose of selling or repurchasing in the near term. Derivatives, including separated embedded derivatives, are also classified as held for trading unless they are designated as effective hedging instruments. Financial assets with cash flows that are not solely payments of principal and interest are classified and measured at fair value through profit or loss, irrespective of the business model. Notwithstanding the criteria for debt instruments to be classified at amortised cost or at fair value through OCI, as described above, debt instruments may be designated at fair value through profit or loss on initial recognition if doing so eliminates, or significantly reduces, an accounting mismatch. Financial assets at fair value through profit or loss are carried in the statement of financial position at fair value with net changes in fair value recognised in the statement of profit or loss. This category includes derivative instruments and listed equity investments which the Group had not irrevocably elected to classify at fair value through OCI. Dividends on listed equity investments are also recognised as other income in the statement of profit or loss when the right of payment has been established. A derivative embedded in a hybrid contract, with a financial liability or non-financial host, is separated from the host and accounted for as a separate derivative if: the economic characteristics and risks are not closely related to the host; a separate instrument with the same terms as the embedded derivative would meet the definition of a derivative; and the hybrid contract is

SAGA TANKERS 2018 ANNUAL REPORT > PAGE 14
not measured at fair value through profit or loss. Embedded derivatives are measured at fair value with changes in fair value recognised in profit or loss. Reassessment only occurs if there is either a change in the terms of the contract that significantly modifies the cash flows that would otherwise be required or a reclassification of a financial asset out of the fair value through profit or loss category. A derivative embedded within a hybrid contract containing a financial asset host is not accounted for separately. The financial asset host together with the embedded derivative is required to be classified in its entirety as a financial asset at fair value through profit or loss. Trade receivables and other receivables Current trade receivables and other receivables are initially recorded at their fair value and subsequently measured at amortized cost using the effective interest method, less provision for impairment. Trade payables and other payables Current trade and other payables are recognized initially at fair value and subsequently measured at amortized cost using the effective interest method. Impairment of financial assets The Group recognises an allowance for expected credit losses (ECLs) for all debt instruments not held at fair value through profit or loss. ECLs are based on the difference between the contractual cash flows due in accordance with the contract and all the cash flows that the Group expects to receive, discounted at an approximation of the original effective interest rate. The expected cash flows will include cash flows from the sale of collateral held or other credit enhancements that are integral to the contractual terms. ECLs are recognised in two stages. For credit exposures for which there has not been a significant increase in credit risk since initial recognition, ECLs are provided for credit losses that result from default events that are possible within the next 12-months (a 12-month ECL). For those credit exposures for which there has been a significant increase in credit risk since initial recognition, a loss allowance is required for credit losses expected over the remaining life of the exposure, irrespective of the timing of the default (a lifetime ECL). For trade receivables and contract assets, the Group applies a simplified approach in calculating ECLs. Therefore, the Group does not track changes in credit risk, but instead recognises a loss allowance based on lifetime ECLs at each reporting date. The Group has established a provision matrix that is based on its historical credit loss experience, adjusted for forward-looking factors specific to the debtors and the economic environment. The Group considers a financial asset in default when contractual payments are 90 days past due. However, in certain cases, the Group may also consider a financial asset to be in default when internal or external information indicates that the Group is unlikely to receive the outstanding contractual amounts in full before taking into account any credit enhancements held by the Group. A financial asset is written off when there is no reasonable expectation of recovering the contractual cash flows. Financial liabilities Initial recognition and measurement Financial liabilities are classified, at initial recognition, as financial liabilities at fair value through profit or loss, loans and borrowings, payables, or as derivatives designated as hedging instruments in an effective hedge, as appropriate. All financial liabilities are recognised initially at fair value and, in the case of loans and borrowings and payables, net of directly attributable transaction costs. The Group’s financial liabilities include trade and other payables, loans and borrowings including bank overdrafts, and derivative financial instruments. Subsequent measurement After initial recognition, interest-bearing loans and borrowings are subsequently measured at amortised cost using the EIR method. Gains and losses are recognised in profit or loss when the liabilities are derecognised as well as through the EIR amortisation process. Amortised cost is calculated by taking into account any discount or premium on acquisition and fees or costs that are an integral part of the EIR. The EIR amortisation is included as finance costs in the statement of profit or loss. Derecognition
SAGA TANKERS 2018 ANNUAL REPORT > PAGE 15
A financial liability is derecognised when the obligation under the liability is discharged or cancelled or expires. When an existing financial liability is replaced by another from the same lender on substantially different terms, or the terms of an existing liability are substantially modified, such an exchange or modification is treated as the derecognition of the original liability and the recognition of a new liability. The difference in the respective carrying amounts is recognised in the statement of profit or loss. Cash, cash equivalents and cash flow statement Cash represents cash on hand and deposits with bank that is callable on demand. Cash equivalents represent short-term, highly liquid investments which are readily convertible into known amounts of cash with original maturities of three months or less and that are subject to an insignificant risk of change in value. The cash flow statement is prepared using the indirect method. Provisions Provisions are recognized when the Group has a present obligation (legal or constructive) as a result of a past event, it is probable that an outflow of resources embodying economic benefits will be required to settle the obligation and a reliable estimate can be made of the amount of the obligation. If the effect of the time value of money is material, provisions are discounted using a current pre-tax rate that reflects, where appropriate, the risks specific to the liability. Where discounting is used, the increase in the provision due to the passage of time is recognized as financial expense. Equity Transaction costs related to an equity transaction are recognized directly in equity after deduction of tax. Ordinary taxation At year end, all subsidiaries within the Group are subject to the ordinary Norwegian taxation regime. Current income taxes are measured at the amount expected to be paid to (recover from) authorities, deferred tax assets/liabilities are calculated based on temporary differences at the reporting date. Deferred tax assets are recognized to the extent that it is probable that they can be utilized in the future. Dividends and capital gains are taxed according to the Norwegian exemption model. Financial position classification Current assets and current liabilities include items due less than one year from the financial position date, and items tied to the operating cycle. The current portion of long-term debt is included as current liabilities. Related parties Parties are related if one party has the ability, directly or indirectly, to control the other party or exercise significant influence over the other party in making financial and operating decisions. Parties are also related if they are subject to common control or common significant influence. All transactions between the related parties have been made on an arm’s length basis and are settled on a regular basis. Contingent liabilities Contingent liabilities are defined as possible obligations that arises from past events whose existence depends on one or more future events not wholly within the control of the entity, or present obligations that are not recognized because it is not probable that they will lead to an outflow or resources. Contingent liabilities are not recognized on the balance sheet unless arising from assuming assets and liabilities in a business combination. Significant contingent liabilities are disclosed unless the possibility of an outflow of resources embodying economic benefit is a remote one. Contingent assets are not accounted for unless virtually certain. Events after financial position date New information regarding the Group’s situation on the financial position date is taken into account in the financial statements. Events occurring after the financial position date, that do not affect the Group on the financial position date but will affect the Group’s situation in the future, are disclosed if significant. New and amended standards adopted by the group IFRS 9 Financial Instruments
SAGA TANKERS 2018 ANNUAL REPORT > PAGE 16
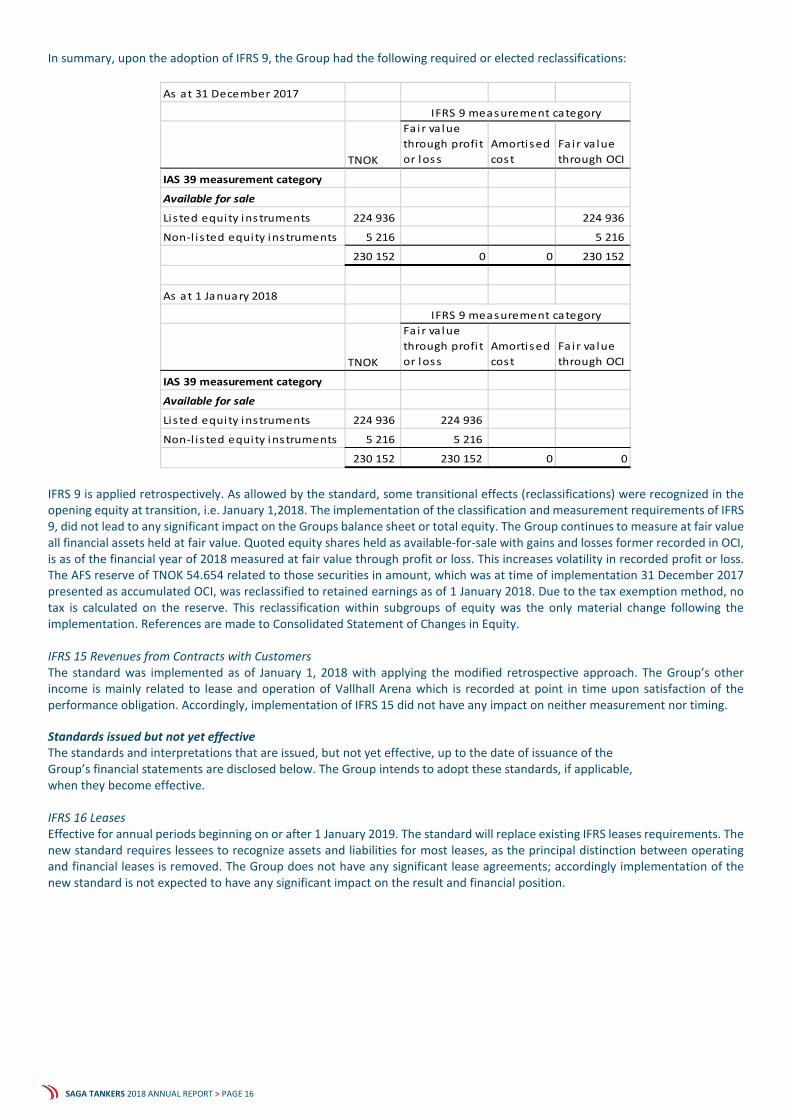
In summary, upon the adoption of IFRS 9, the Group had the following required or elected reclassifications:
As at 31 December 2017
TNOK
Fair va lue through profi t or loss
Amortised cost
Fa i r va lue through OCI
IAS 39 measurement category
Available for sale
Lis ted equity instruments 224 936 224 936
Non-l i s ted equity instruments 5 216 5 216
230 152 0 0 230 152
As at 1 January 2018
TNOK
Fair va lue through profi t or loss
Amortised cost
Fa i r va lue through OCI
IAS 39 measurement category
Available for sale
Lis ted equity instruments 224 936 224 936
Non-l i s ted equity instruments 5 216 5 216
230 152 230 152 0 0
IFRS 9 measurement category
IFRS 9 measurement category
IFRS 9 is applied retrospectively. As allowed by the standard, some transitional effects (reclassifications) were recognized in the opening equity at transition, i.e. January 1,2018. The implementation of the classification and measurement requirements of IFRS 9, did not lead to any significant impact on the Groups balance sheet or total equity. The Group continues to measure at fair value all financial assets held at fair value. Quoted equity shares held as available-for-sale with gains and losses former recorded in OCI, is as of the financial year of 2018 measured at fair value through profit or loss. This increases volatility in recorded profit or loss. The AFS reserve of TNOK 54.654 related to those securities in amount, which was at time of implementation 31 December 2017 presented as accumulated OCI, was reclassified to retained earnings as of 1 January 2018. Due to the tax exemption method, no tax is calculated on the reserve. This reclassification within subgroups of equity was the only material change following the implementation. References are made to Consolidated Statement of Changes in Equity. IFRS 15 Revenues from Contracts with Customers The standard was implemented as of January 1, 2018 with applying the modified retrospective approach. The Group’s other income is mainly related to lease and operation of Vallhall Arena which is recorded at point in time upon satisfaction of the performance obligation. Accordingly, implementation of IFRS 15 did not have any impact on neither measurement nor timing. Standards issued but not yet effective The standards and interpretations that are issued, but not yet effective, up to the date of issuance of the Group’s financial statements are disclosed below. The Group intends to adopt these standards, if applicable, when they become effective. IFRS 16 Leases Effective for annual periods beginning on or after 1 January 2019. The standard will replace existing IFRS leases requirements. The new standard requires lessees to recognize assets and liabilities for most leases, as the principal distinction between operating and financial leases is removed. The Group does not have any significant lease agreements; accordingly implementation of the new standard is not expected to have any significant impact on the result and financial position.
SAGA TANKERS 2018 ANNUAL REPORT > PAGE 17
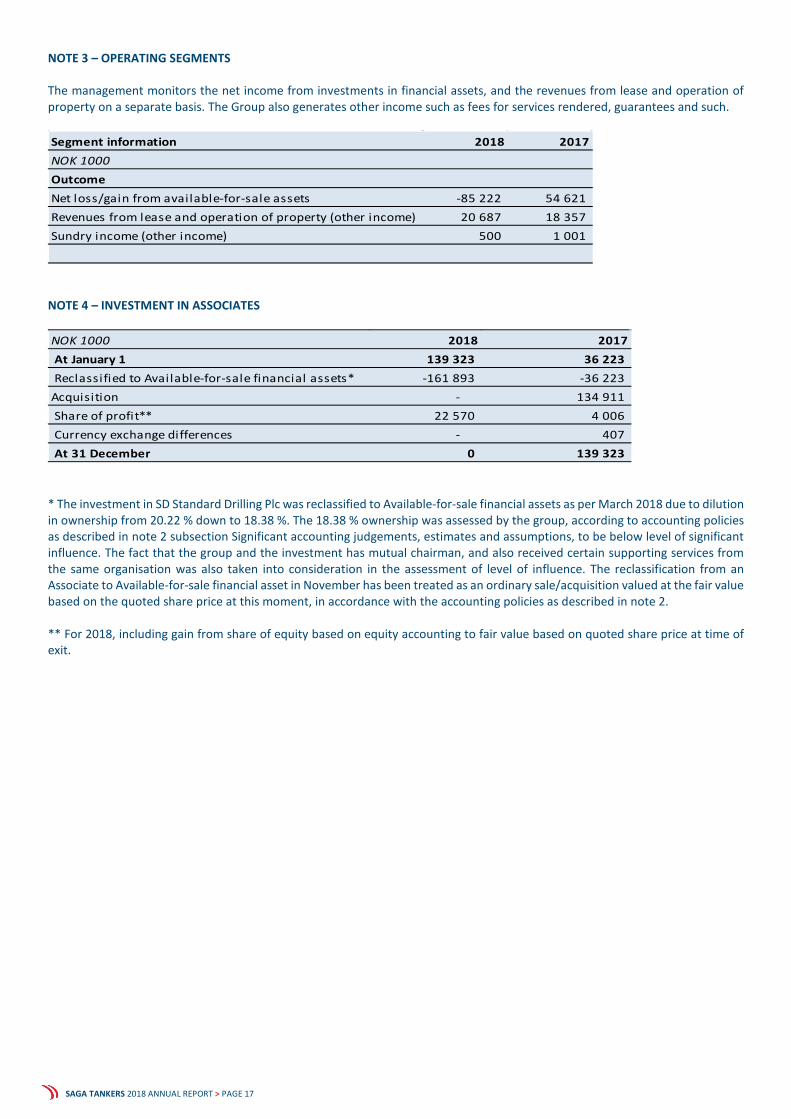
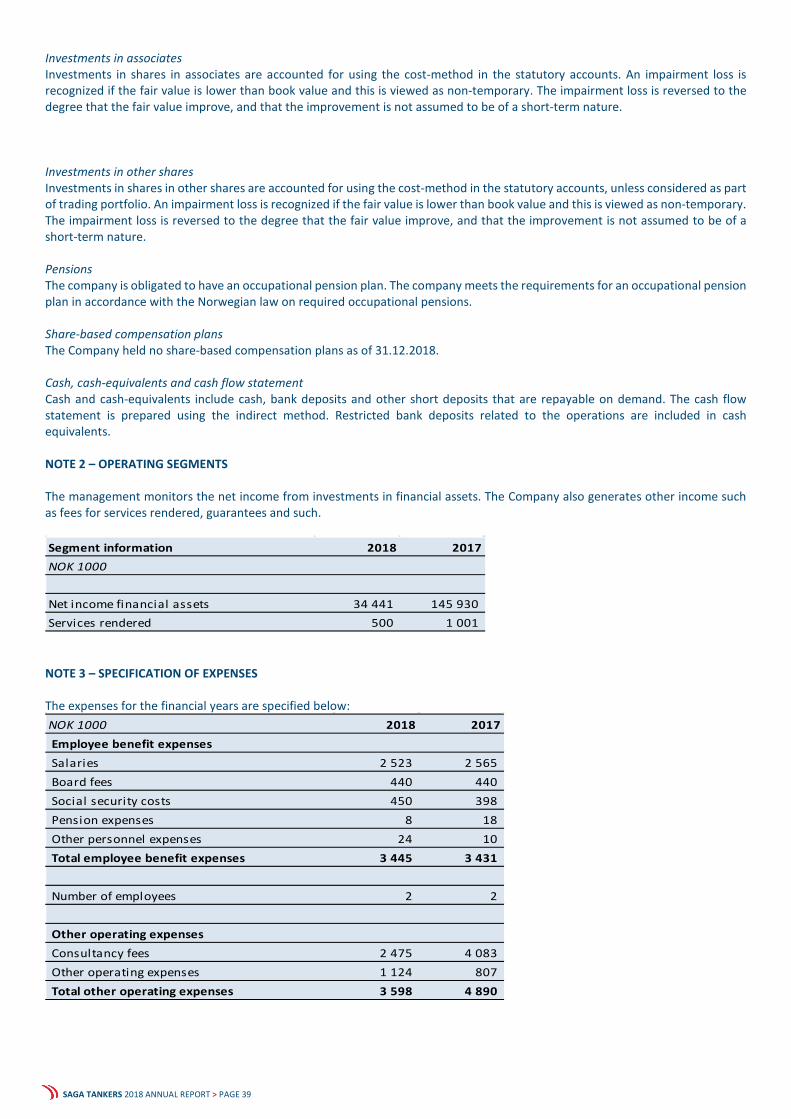
NOTE 3 – OPERATING SEGMENTS The management monitors the net income from investments in financial assets, and the revenues from lease and operation of property on a separate basis. The Group also generates other income such as fees for services rendered, guarantees and such. Segment information 2018 2017NOK 1000OutcomeNet loss/gain from available-for-sale assets -85 222 54 621 Revenues from lease and operation of property (other income) 20 687 18 357 Sundry income (other income) 500 1 001
NOTE 4 – INVESTMENT IN ASSOCIATES NOK 1000 2018 2017At January 1 139 323 36 223 Reclassified to Available-for-sale financial assets* -161 893 -36 223
Acquisition - 134 911 Share of profit** 22 570 4 006 Currency exchange differences - 407 At 31 December 0 139 323
* The investment in SD Standard Drilling Plc was reclassified to Available-for-sale financial assets as per March 2018 due to dilution in ownership from 20.22 % down to 18.38 %. The 18.38 % ownership was assessed by the group, according to accounting policies as described in note 2 subsection Significant accounting judgements, estimates and assumptions, to be below level of significant influence. The fact that the group and the investment has mutual chairman, and also received certain supporting services from the same organisation was also taken into consideration in the assessment of level of influence. The reclassification from an Associate to Available-for-sale financial asset in November has been treated as an ordinary sale/acquisition valued at the fair value based on the quoted share price at this moment, in accordance with the accounting policies as described in note 2. ** For 2018, including gain from share of equity based on equity accounting to fair value based on quoted share price at time of exit.
SAGA TANKERS 2018 ANNUAL REPORT > PAGE 18
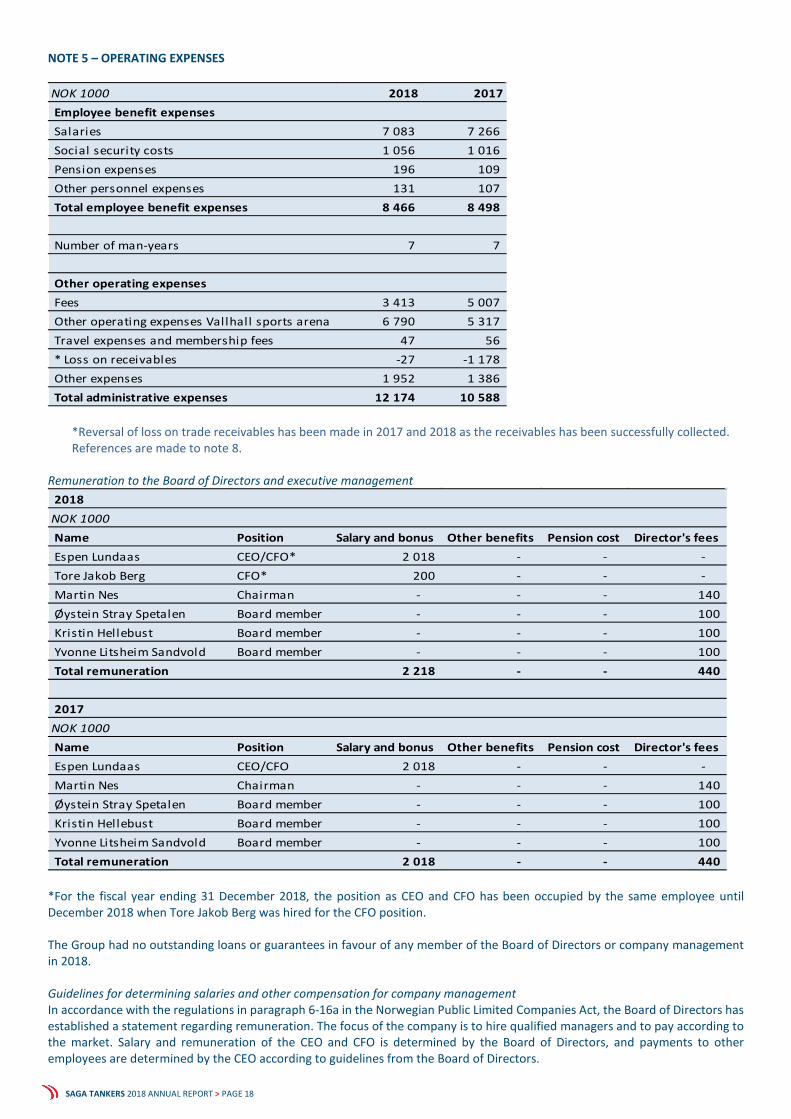
NOTE 5 – OPERATING EXPENSES NOK 1000 2018 2017Employee benefit expensesSalaries 7 083 7 266 Social security costs 1 056 1 016 Pension expenses 196 109 Other personnel expenses 131 107 Total employee benefit expenses 8 466 8 498
Number of man-years 7 7
Other operating expensesFees 3 413 5 007 Other operating expenses Vallhall sports arena 6 790 5 317 Travel expenses and membership fees 47 56 * Loss on receivables -27 -1 178 Other expenses 1 952 1 386 Total administrative expenses 12 174 10 588
*Reversal of loss on trade receivables has been made in 2017 and 2018 as the receivables has been successfully collected. References are made to note 8.
Remuneration to the Board of Directors and executive management
2018NOK 1000Name Position Salary and bonus Other benefits Pension cost Director's feesEspen Lundaas CEO/CFO* 2 018 - - - Tore Jakob Berg CFO* 200 - - - Martin Nes Chairman - - - 140 Øystein Stray Spetalen Board member - - - 100 Kristin Hellebust Board member - - - 100 Yvonne Litsheim Sandvold Board member - - - 100 Total remuneration 2 218 - - 440
2017NOK 1000Name Position Salary and bonus Other benefits Pension cost Director's feesEspen Lundaas CEO/CFO 2 018 - - - Martin Nes Chairman - - - 140 Øystein Stray Spetalen Board member - - - 100 Kristin Hellebust Board member - - - 100 Yvonne Litsheim Sandvold Board member - - - 100 Total remuneration 2 018 - - 440
*For the fiscal year ending 31 December 2018, the position as CEO and CFO has been occupied by the same employee until December 2018 when Tore Jakob Berg was hired for the CFO position. The Group had no outstanding loans or guarantees in favour of any member of the Board of Directors or company management in 2018. Guidelines for determining salaries and other compensation for company management In accordance with the regulations in paragraph 6-16a in the Norwegian Public Limited Companies Act, the Board of Directors has established a statement regarding remuneration. The focus of the company is to hire qualified managers and to pay according to the market. Salary and remuneration of the CEO and CFO is determined by the Board of Directors, and payments to other employees are determined by the CEO according to guidelines from the Board of Directors.
SAGA TANKERS 2018 ANNUAL REPORT > PAGE 19
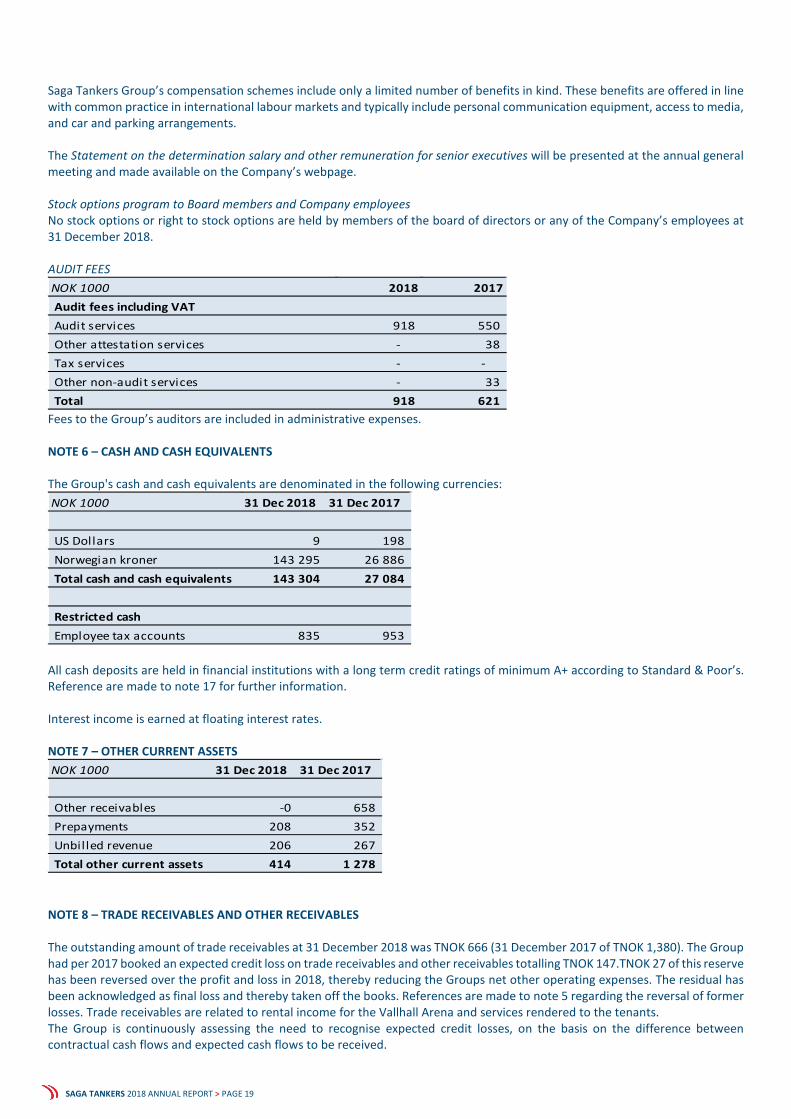
Saga Tankers Group’s compensation schemes include only a limited number of benefits in kind. These benefits are offered in line with common practice in international labour markets and typically include personal communication equipment, access to media, and car and parking arrangements. The Statement on the determination salary and other remuneration for senior executives will be presented at the annual general meeting and made available on the Company’s webpage. Stock options program to Board members and Company employees No stock options or right to stock options are held by members of the board of directors or any of the Company’s employees at 31 December 2018. AUDIT FEES NOK 1000 2018 2017Audit fees including VATAudit services 918 550 Other attestation services - 38 Tax services - - Other non-audit services - 33 Total 918 621
Fees to the Group’s auditors are included in administrative expenses. NOTE 6 – CASH AND CASH EQUIVALENTS The Group's cash and cash equivalents are denominated in the following currencies: NOK 1000 31 Dec 2018 31 Dec 2017
US Dollars 9 198 Norwegian kroner 143 295 26 886 Total cash and cash equivalents 143 304 27 084
Restricted cashEmployee tax accounts 835 953
All cash deposits are held in financial institutions with a long term credit ratings of minimum A+ according to Standard & Poor’s. Reference are made to note 17 for further information. Interest income is earned at floating interest rates. NOTE 7 – OTHER CURRENT ASSETS NOK 1000 31 Dec 2018 31 Dec 2017
Other receivables -0 658 Prepayments 208 352 Unbilled revenue 206 267 Total other current assets 414 1 278
NOTE 8 – TRADE RECEIVABLES AND OTHER RECEIVABLES The outstanding amount of trade receivables at 31 December 2018 was TNOK 666 (31 December 2017 of TNOK 1,380). The Group had per 2017 booked an expected credit loss on trade receivables and other receivables totalling TNOK 147.TNOK 27 of this reserve has been reversed over the profit and loss in 2018, thereby reducing the Groups net other operating expenses. The residual has been acknowledged as final loss and thereby taken off the books. References are made to note 5 regarding the reversal of former losses. Trade receivables are related to rental income for the Vallhall Arena and services rendered to the tenants. The Group is continuously assessing the need to recognise expected credit losses, on the basis on the difference between contractual cash flows and expected cash flows to be received.

SAGA TANKERS 2018 ANNUAL REPORT > PAGE 20
NOTE 9 – OTHER CURRENT LIABILITIES NOK 1000 31 Dec 2018 31 Dec 2017
Public duties payable 1 169 1 316 Deferred revenue 104 105 Accrued interest 337 199 Other current l iabil ities 2 928 4 538 Total other current liabilities 4 537 6 158
Other current liabilities are non-interest bearing. Other current liabilities are normally settled on 30 to 60 day terms. Deferred revenues are revenues invoiced, but not earned per 31 December. NOTE 10 – FIXED ASSETS
Bulidings Machinery & equipement
Capitalized costs - work in progress Land Total
2018NOK 1000Aquisition cost, opening balance 01.01.18 97 259 4 436 38 199 101 931 Acquisitions during the period 1 882 370 - - 2 252 Diposals during the period - - - - - Aquisition cost at 31.12.18 99 141 4 806 38 199 104 184
Accumulated depreciation, opening balance 01.01.18 -7 961 -1 360 - - -9 321 Depreciation -2 893 -149 - - -3 042 Accumulated depreciation disposed assets - - - - - Accumulated depreciation at 31.12.18 -10 853 -1 510 - - -12 363
Net book value at 31.12.18 88 288 3 296 38 199 91 821
Buildings Machinery & equipment
Capitalized costs - work in progress Land Total
2017NOK 1000Acquisition cost, opening balance 01.01.17 91 529 4 357 38 199 96 122 Acquisitions during the period 5 730 79 - - 5 809 Disposals during the period - - - - - Acquisition cost at 31.12.17 97 259 4 436 38 199 101 931
Accumulated depreciation, opening balance 01.01.17 -5 441 -1 169 - - -6 609 Depreciation -2 520 -192 - - -2 711 Accumulated depreciation disposed assets - - - - - Accumulated depreciation at 31.12.17 -7 961 -1 360 - - -9 321
Net book value at 31.12.17 89 298 3 075 38 199 92 611

SAGA TANKERS 2018 ANNUAL REPORT > PAGE 21
Depreciation Assets have been depreciated on a straight-line basis over their expected useful lives as follows: Buildings: 67 years Machinery and equipment: 5-10 years Capitalized cost - Work in progress: No depreciation before utilization Land: No depreciation The fixed assets are subject to impairment testing if impairment indicators are identified. NOTE 11 – TAX NOK 1000 2018 2017
Current tax expense 90 36 Deferred tax expense 21 68 Tax expense 111 104
Reconciliation of tax expensesNet profit before tax -66 203 56 987
Tax expense based on nominal tax rate of 23 % (24% for 2017) -15 227 13 677 Permanente differences 27 900 -8 714 Change in other tax benefits receivables -15 085 -6 168 Change in not recognized deferred tax assets 2 535 1 319 Tax effect on deferred tax due to change of tax rate* -12 -10 Tax expense 111 104
Reconciliation of deferred tax (-)/deferred tax assets*Fixed and other assets 97 531 117 048 Net tax loss carried forward 13 448 11 931 Share in partnership -349 -340 Deferred tax assets 110 630 128 638 Net deferred tax assets not recognized 110 891 128 879 Deferred tax (-)/deferred tax assets in the balance sheet -262 -241
Tax on other comprehensive incomeOther comprehensive income -407 36 340 Income tax related to other comprehensive income - -
* Tax rate for 2017 was 24 %, and for 2018 it was 23 %. Tax rate for 2019 as set by the Norwegian Parliament 12 December 2018 is 22 %. The rate of 22 % has therefore been applied to calculate future tax liabilities and assets as at 31 December 2018.
SAGA TANKERS 2018 ANNUAL REPORT > PAGE 22
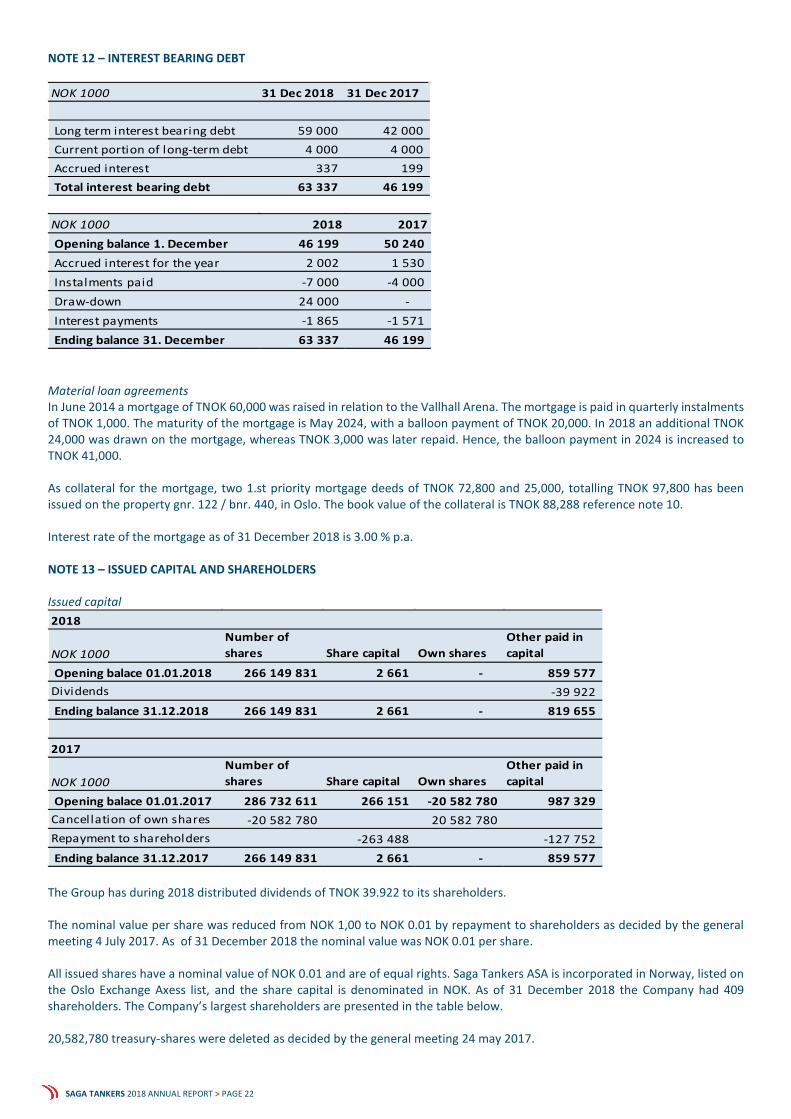
NOTE 12 – INTEREST BEARING DEBT NOK 1000 31 Dec 2018 31 Dec 2017
Long term interest bearing debt 59 000 42 000 Current portion of long-term debt 4 000 4 000 Accrued interest 337 199 Total interest bearing debt 63 337 46 199
NOK 1000 2018 2017Opening balance 1. December 46 199 50 240 Accrued interest for the year 2 002 1 530 Instalments paid -7 000 -4 000 Draw-down 24 000 - Interest payments -1 865 -1 571 Ending balance 31. December 63 337 46 199
Material loan agreements In June 2014 a mortgage of TNOK 60,000 was raised in relation to the Vallhall Arena. The mortgage is paid in quarterly instalments of TNOK 1,000. The maturity of the mortgage is May 2024, with a balloon payment of TNOK 20,000. In 2018 an additional TNOK 24,000 was drawn on the mortgage, whereas TNOK 3,000 was later repaid. Hence, the balloon payment in 2024 is increased to TNOK 41,000. As collateral for the mortgage, two 1.st priority mortgage deeds of TNOK 72,800 and 25,000, totalling TNOK 97,800 has been issued on the property gnr. 122 / bnr. 440, in Oslo. The book value of the collateral is TNOK 88,288 reference note 10. Interest rate of the mortgage as of 31 December 2018 is 3.00 % p.a. NOTE 13 – ISSUED CAPITAL AND SHAREHOLDERS Issued capital 2018
NOK 1000Number of shares Share capital Own shares
Other paid in capital
Opening balace 01.01.2018 266 149 831 2 661 - 859 577 Dividends -39 922 Ending balance 31.12.2018 266 149 831 2 661 - 819 655
2017
NOK 1000Number of shares Share capital Own shares
Other paid in capital
Opening balace 01.01.2017 286 732 611 266 151 -20 582 780 987 329 Cancellation of own shares -20 582 780 20 582 780 Repayment to shareholders -263 488 -127 752 Ending balance 31.12.2017 266 149 831 2 661 - 859 577
The Group has during 2018 distributed dividends of TNOK 39.922 to its shareholders. The nominal value per share was reduced from NOK 1,00 to NOK 0.01 by repayment to shareholders as decided by the general meeting 4 July 2017. As of 31 December 2018 the nominal value was NOK 0.01 per share. All issued shares have a nominal value of NOK 0.01 and are of equal rights. Saga Tankers ASA is incorporated in Norway, listed on the Oslo Exchange Axess list, and the share capital is denominated in NOK. As of 31 December 2018 the Company had 409 shareholders. The Company’s largest shareholders are presented in the table below. 20,582,780 treasury-shares were deleted as decided by the general meeting 24 may 2017.

SAGA TANKERS 2018 ANNUAL REPORT > PAGE 23
Overview of the largest shareholders as per 31 December 2018 NAME Of total shares
1 *ØYSTEIN STRAY SPETALEN 64,94 %2 TORSTEIN INGVALD TVENGE 3,76 %3 AF CAPITAL MANAGEMENT AS 3,49 %4 PARK LANE FAMILY OFFICE AS 2,81 %5 TANJA A/S 2,16 %6 BORGEN INVESTMENT GROUP NORWAY AS 1,88 %7 BJØRN BAKKEN 1,56 %8 UTHALDEN AS 1,46 %9 DnB NOR MARKETS, AKSJEHAND/ANALYSE 1,45 %
10 LEOVILLE AS 1,45 %11 PORTIA AS 1,39 %12 KRISTIAN HODNE AS 1,09 %13 WIECO AS 0,96 %14 VALHALL INVEST AS 0,94 %15 BJØRN HÅVARD BRÆNDEN 0,71 %16 State Street Bank and Trust Comp 0,66 %17 SILVERCOIN INDUSTRIES AS 0,65 %18 BJØRN OLSEN 0,45 %19 BHB CAPITAL MANAGEMENT AS 0,42 %20 SPAR KAPITAL INVESTOR AS 0,40 %
Total 92,64 %
* Board member. Shareholders per country per 31 December 2018
Shares Owner's share %Norway 263 800 182 99,117 %United States 1 779 597 0,669 %United Kingdom 179 553 0,067 %Portugal 159 300 0,060 %Sweden 92 513 0,035 %Belgium 52 000 0,020 %Switzerland 30 158 0,011 %Denmark 23 936 0,009 %Germany 10 000 0,004 %Poland 9 501 0,004 %The Netherlands 8 586 0,003 %Finland 4 500 0,002 %Pakistan 5 0,000 %Total 266 149 831 100,000 %
Total paid in capital Please see table above. Shareholders rights There are currently no limitations in voting rights or trade limitations related to the Saga Tankers share. Power of attorney to increase the share capital through issuance of new shares The Board held as per 31 December 2018 authorization to issue up to 133,074,915 new shares. The authorization may be utilised on one or several occasions.
SAGA TANKERS 2018 ANNUAL REPORT > PAGE 24
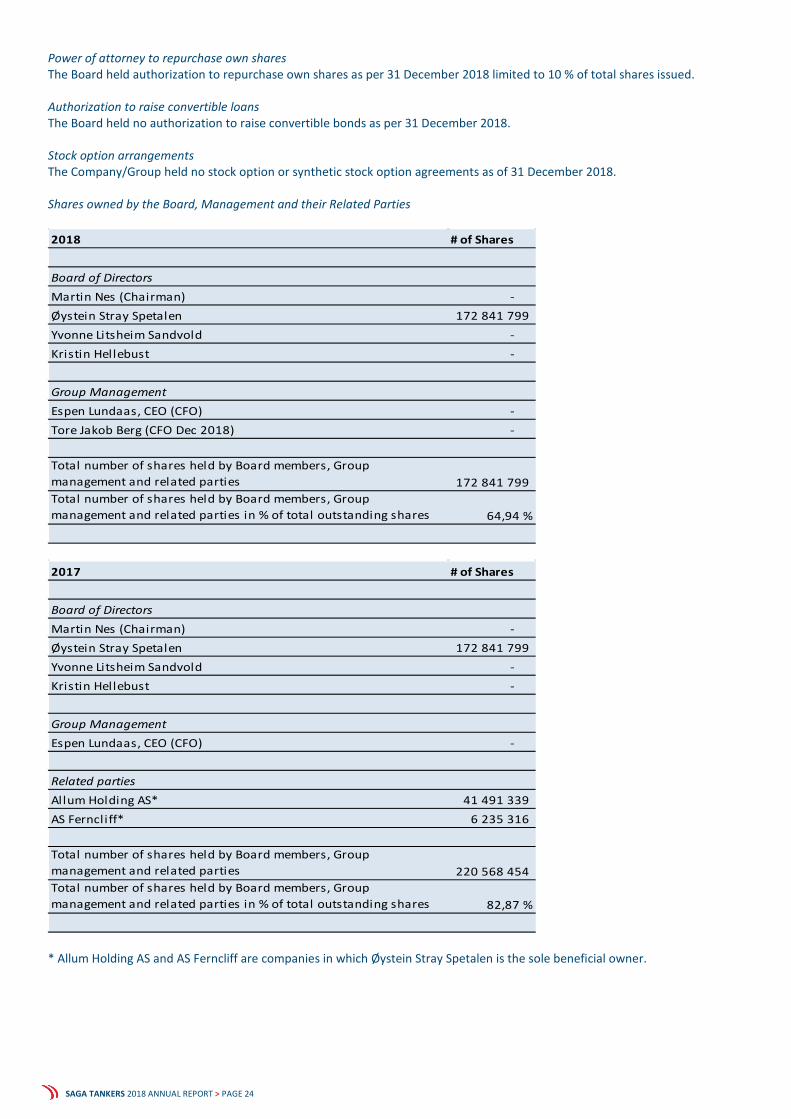
Power of attorney to repurchase own shares The Board held authorization to repurchase own shares as per 31 December 2018 limited to 10 % of total shares issued. Authorization to raise convertible loans The Board held no authorization to raise convertible bonds as per 31 December 2018. Stock option arrangements The Company/Group held no stock option or synthetic stock option agreements as of 31 December 2018. Shares owned by the Board, Management and their Related Parties 2018 # of Shares
Board of DirectorsMartin Nes (Chairman) - Øystein Stray Spetalen 172 841 799 Yvonne Litsheim Sandvold - Kristin Hellebust -
Group ManagementEspen Lundaas, CEO (CFO) - Tore Jakob Berg (CFO Dec 2018) -
Total number of shares held by Board members, Group management and related parties 172 841 799 Total number of shares held by Board members, Group management and related parties in % of total outstanding shares 64,94 %
2017 # of Shares
Board of DirectorsMartin Nes (Chairman) - Øystein Stray Spetalen 172 841 799 Yvonne Litsheim Sandvold - Kristin Hellebust -
Group ManagementEspen Lundaas, CEO (CFO) -
Related partiesAllum Holding AS* 41 491 339 AS Ferncliff* 6 235 316
Total number of shares held by Board members, Group management and related parties 220 568 454 Total number of shares held by Board members, Group management and related parties in % of total outstanding shares 82,87 %
* Allum Holding AS and AS Ferncliff are companies in which Øystein Stray Spetalen is the sole beneficial owner.

SAGA TANKERS 2018 ANNUAL REPORT > PAGE 25
NOTE 14 – EARNINGS PER SHARE Basic earnings per share are calculated by dividing net profit for the year attributable to ordinary equity holders by the weighted average number of ordinary shares outstanding during the year, excluding ordinary shares purchased by the company and held as treasury shares. The company held no such treasury shares as of 31 December 2018. Diluted earnings per share are calculated by dividing the net profit attributable to ordinary equity holders by the weighted average number of ordinary shares outstanding during the year plus the weighted average number of ordinary shares that would be issued on the conversion of all dilutive potential ordinary shares to ordinary shares. The Company does not have any potential dilutive ordinary shares in addition to its ordinary outstanding number of shares as per 31 December 2018. NOK 1000 2018 2017
Net profit/(loss) attributable to the shareholders -68 414 54 350 Number of shares
Weighted average number of ordinary shares outstanding 266 149 831 266 149 831 Weighted average number of shares outstanding, diluted 266 149 831 266 149 831 Number of shares outstanding at period end 266 149 831 266 149 831
NOK per shareBasic and diluted earnings per share -0,26 0,20
NOTE 15 – RELATED PARTIES The company is sharing office locations for its head office with Ferncliff Holding AS, a company controlled by Øystein Stray Spetalen, board member, and the Company's largest shareholder. Transactions with related parties during 2018 are limited to office rent including mutual costs, deliverance of strategic management services and services rendered regarding support for financial reporting. All transactions with related parties have been made on an arm's length basis and are settled on a regular basis. Goods and/or services purchased from related parties have been priced at industry standard rates. Transactions with related parties are specified below: RELATED PARTY TRANSACTIONS 2018
NOK 1000 Sales to related parties
Purchase from related parties
Amounts owed by related parties
Amounts owed to related parties
Tycoon Industrier AS - 1 870 - - 2017
NOK 1000 Sales to related parties
Purchase from related parties
Amounts owed by related parties
Amounts owed to related parties
Tycoon Industrier AS - 986 - - NOTE 16 – SUBSIDIARIES The consolidated financial statements include the financial statements of Saga Tankers ASA and its subsidiaries listed in the table below:
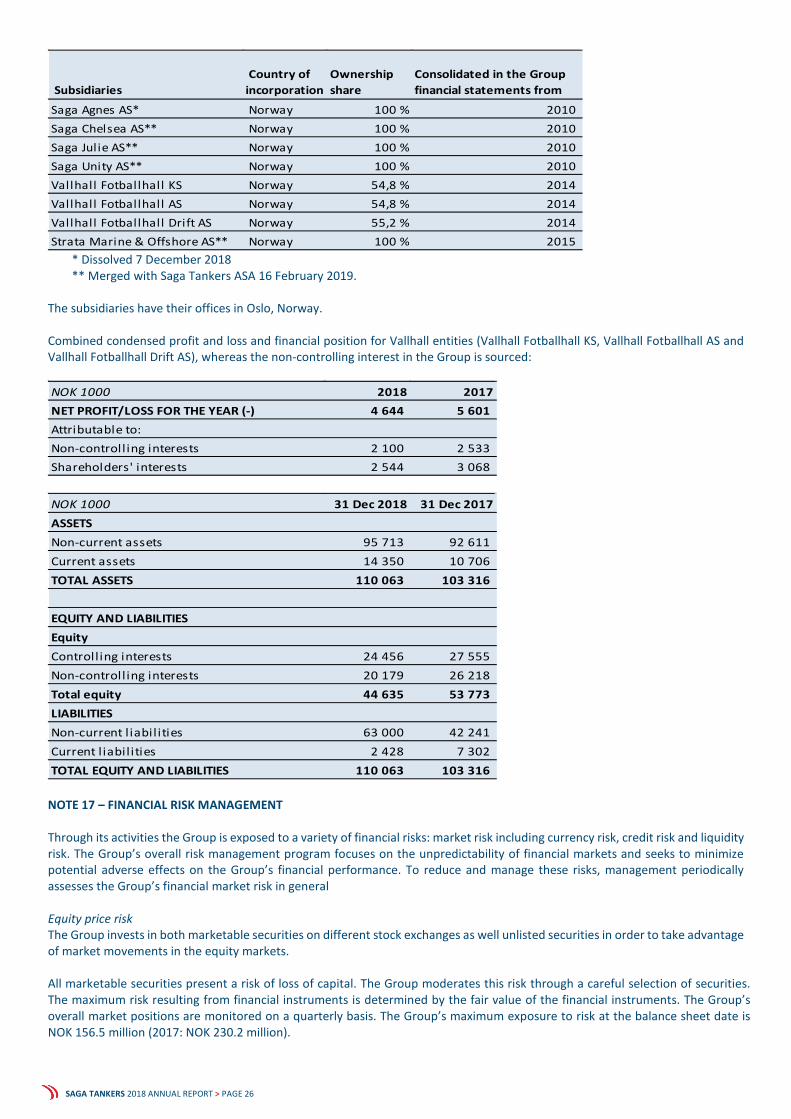
SAGA TANKERS 2018 ANNUAL REPORT > PAGE 26
Subsidiaries Country of incorporation
Ownership share
Consolidated in the Group financial statements from
Saga Agnes AS* Norway 100 % 2010Saga Chelsea AS** Norway 100 % 2010Saga Julie AS** Norway 100 % 2010Saga Unity AS** Norway 100 % 2010Vallhall Fotballhall KS Norway 54,8 % 2014Vallhall Fotballhall AS Norway 54,8 % 2014Vallhall Fotballhall Drift AS Norway 55,2 % 2014Strata Marine & Offshore AS** Norway 100 % 2015
* Dissolved 7 December 2018 ** Merged with Saga Tankers ASA 16 February 2019.
The subsidiaries have their offices in Oslo, Norway. Combined condensed profit and loss and financial position for Vallhall entities (Vallhall Fotballhall KS, Vallhall Fotballhall AS and Vallhall Fotballhall Drift AS), whereas the non-controlling interest in the Group is sourced: NOK 1000 2018 2017NET PROFIT/LOSS FOR THE YEAR (-) 4 644 5 601 Attributable to:Non-controll ing interests 2 100 2 533 Shareholders' interests 2 544 3 068
NOK 1000 31 Dec 2018 31 Dec 2017ASSETSNon-current assets 95 713 92 611 Current assets 14 350 10 706 TOTAL ASSETS 110 063 103 316
EQUITY AND LIABILITIESEquityControll ing interests 24 456 27 555 Non-controll ing interests 20 179 26 218 Total equity 44 635 53 773 LIABILITIESNon-current l iabil ities 63 000 42 241 Current l iabil ities 2 428 7 302 TOTAL EQUITY AND LIABILITIES 110 063 103 316
NOTE 17 – FINANCIAL RISK MANAGEMENT Through its activities the Group is exposed to a variety of financial risks: market risk including currency risk, credit risk and liquidity risk. The Group’s overall risk management program focuses on the unpredictability of financial markets and seeks to minimize potential adverse effects on the Group’s financial performance. To reduce and manage these risks, management periodically assesses the Group’s financial market risk in general Equity price risk The Group invests in both marketable securities on different stock exchanges as well unlisted securities in order to take advantage of market movements in the equity markets. All marketable securities present a risk of loss of capital. The Group moderates this risk through a careful selection of securities. The maximum risk resulting from financial instruments is determined by the fair value of the financial instruments. The Group’s overall market positions are monitored on a quarterly basis. The Group’s maximum exposure to risk at the balance sheet date is NOK 156.5 million (2017: NOK 230.2 million).
SAGA TANKERS 2018 ANNUAL REPORT > PAGE 27
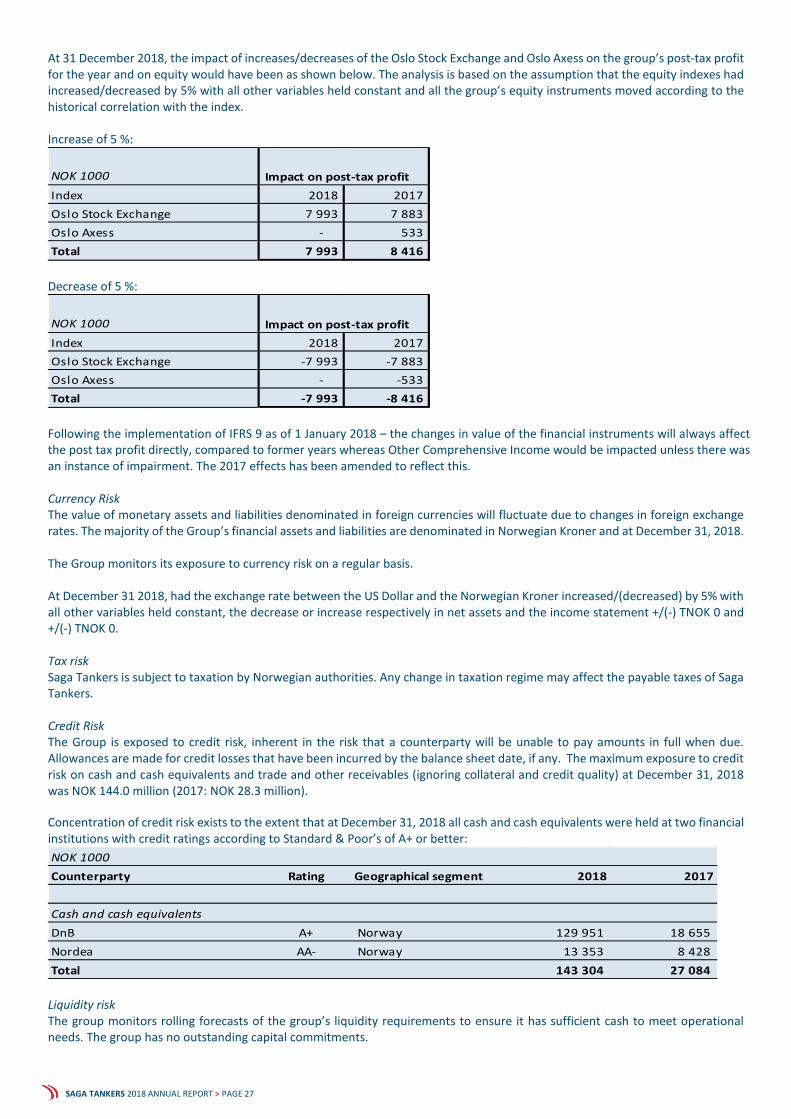
At 31 December 2018, the impact of increases/decreases of the Oslo Stock Exchange and Oslo Axess on the group’s post-tax profit for the year and on equity would have been as shown below. The analysis is based on the assumption that the equity indexes had increased/decreased by 5% with all other variables held constant and all the group’s equity instruments moved according to the historical correlation with the index. Increase of 5 %:
NOK 1000
Index 2018 2017Oslo Stock Exchange 7 993 7 883 Oslo Axess - 533 Total 7 993 8 416
Impact on post-tax profit
Decrease of 5 %:
NOK 1000
Index 2018 2017Oslo Stock Exchange -7 993 -7 883 Oslo Axess - -533 Total -7 993 -8 416
Impact on post-tax profit
Following the implementation of IFRS 9 as of 1 January 2018 – the changes in value of the financial instruments will always affect the post tax profit directly, compared to former years whereas Other Comprehensive Income would be impacted unless there was an instance of impairment. The 2017 effects has been amended to reflect this. Currency Risk The value of monetary assets and liabilities denominated in foreign currencies will fluctuate due to changes in foreign exchange rates. The majority of the Group’s financial assets and liabilities are denominated in Norwegian Kroner and at December 31, 2018. The Group monitors its exposure to currency risk on a regular basis. At December 31 2018, had the exchange rate between the US Dollar and the Norwegian Kroner increased/(decreased) by 5% with all other variables held constant, the decrease or increase respectively in net assets and the income statement +/(-) TNOK 0 and +/(-) TNOK 0. Tax risk Saga Tankers is subject to taxation by Norwegian authorities. Any change in taxation regime may affect the payable taxes of Saga Tankers. Credit Risk The Group is exposed to credit risk, inherent in the risk that a counterparty will be unable to pay amounts in full when due. Allowances are made for credit losses that have been incurred by the balance sheet date, if any. The maximum exposure to credit risk on cash and cash equivalents and trade and other receivables (ignoring collateral and credit quality) at December 31, 2018 was NOK 144.0 million (2017: NOK 28.3 million).
Concentration of credit risk exists to the extent that at December 31, 2018 all cash and cash equivalents were held at two financial institutions with credit ratings according to Standard & Poor’s of A+ or better: NOK 1000Counterparty Rating Geographical segment 2018 2017
Cash and cash equivalentsDnB A+ Norway 129 951 18 655 Nordea AA- Norway 13 353 8 428 Total 143 304 27 084
Liquidity risk The group monitors rolling forecasts of the group’s liquidity requirements to ensure it has sufficient cash to meet operational needs. The group has no outstanding capital commitments.

SAGA TANKERS 2018 ANNUAL REPORT > PAGE 28
Long term debt of TNOK 60 000 was raised in the subsidiary Vallhall Fotballhall KS in May 2014. Fixed assets in the subsidiary are used as collateral. No group guarantees has been issued related to the debt. The debt has an instalment plan of TNOK 1 000 per quarter until final settlement in May 2024. Hence the loan will have a revolving current portion of TNOK 4 000 until May 2023. Additional TNOK 24 000 was drawn on the facility in 2018, whereas TNOK 3 000 of this was subsequently repaid. NOK 1000
Instalment plan long term debtInitial loan May 2014
Jun 2014 - Dec 2018
Jan 2019 - Feb 2024 May 2024
Opening balance loan - 60 000 63 000 37 000 Release loan 60 000 24 000 - - Instalment 1 000 per quarter - -21 000 -26 000 - Balloon-payment - - -37 000
Closing balance loan 60 000 63 000 37 000 -
Interest payed/estimated interest payments* 8 323 7 636 365 * Accrued interest is settled at each instalment. Estimated future interest payments are made at current interest rate at 3.00 % per annum. The interest rate is floating and hence subject to change. At the reporting date, the Group held cash and cash equivalents of TNOK 143,304 (2017: TNOK 27,084) and other liquid assets of TNOK 666 (2017: TNOK 1,233) that are expected to readily generate cash inflows for managing liquidity risk. Based on the financial status at balance sheet date, an increase of the general interest level of one percentile would impact the profit and loss accounts with TNOK +803. A decrease in the general interest level of one percentile would impact the profit and loss accounts with TNOK -660.
Capital Management The group’s objectives when managing capital are to safeguard the group’s ability to continue as a going concern in order to provide returns for shareholders and benefits for other stakeholders and to maintain an optimal capital structure to reduce the cost of capital. In order to maintain or adjust the capital structure, the group may adjust the amount of dividends paid to shareholders, return capital to shareholders, issue new shares or sell assets to reduce debt. The Group monitors the available cash and projected capital expenditure requirements so that they can capitalize on attractive investment opportunities when such arise. The Group considers the available cash and the existing credit lines, if any, to be at an appropriate level for the short to medium term. Fair value estimation The table below analyses financial instruments carried at fair value, by valuation method. The estimated fair value has been determined by the Group using appropriate market information and valuation methodologies. The different levels have been defined as follows:
• Quoted prices (unadjusted) in active markets for identical assets or liabilities (Level 1). • Inputs other than quoted prices included within Level 1 that are observable for the asset or liability, either directly (that
is, as prices) or indirectly (that is, derived from prices) (Level 2). • Inputs for the asset or liability that are not based on observable market data (that is, unobservable inputs) (Level 3).
The following table presents the group’s financial assets and liabilities that are measured at fair value at 31 December 2018. The fair value of financial instruments does not significantly deviate from their carrying amount. NOK 1000Available-for-sale financial assets (Equity securities) in NOK 2018 2017
Listed shares (Level 1) 149 959 224 936 Non-listed shares (Level 2) 6 503 5 216 Total 156 462 230 152
There were no transfers between the levels during the year. (a) Financial instruments in level 1

SAGA TANKERS 2018 ANNUAL REPORT > PAGE 29
The fair value of financial instruments traded in active markets is based on quoted market prices at the balance sheet date. A market is regarded as active if quoted prices are readily and regularly available from an exchange, dealer, broker, industry group, pricing service, or regulatory agency, and those prices represent actual and regularly occurring market transactions on an arm’s length basis. The quoted market price used for financial assets held by the group is the current bid price. These instruments are included in Level 1. Instruments included in Level 1 comprise primarily Oslo Axess, OSE, DAX and FTSE 100 equity investments classified as trading securities or available for sale. (a) Financial instruments in level 2 The fair value of financial instruments that are not traded in an active market (for example, over-the-counter derivatives) is determined by using valuation techniques. These valuation techniques maximize the use of observable market data where it is available and rely as little as possible on entity specific estimates. If all significant inputs required to fair value an instrument are observable, the instrument is included in level 2. If one or more of the significant inputs is not based on observable market data, the instrument is included in Level 3. Specific valuation techniques used to value financial instruments include:
• Quoted market prices or dealer quotes for similar instruments; • Other techniques, such as discounted cash flow analysis, are used to determine fair value for the remaining financial
instruments. NOTE 18 – FINANCIAL INSTRUMENTS Set out below is a comparison by category for carrying amounts and fair values of all of the Group's financial instruments that are carried in the financial statements. 2018
NOK 1000Carrying amount Fair value
Fair value Hierarchy
Loans and receivablesCash and cash equivalents 143 304 143 304 1 Trade receivables 666 666 2
Available-for-sale assetsAvailable-for-sale shares 156 462 156 462 1 & 2
Other financial liabilitiesLong term interest bearing debt 59 000 59 000 2 Short term interest bearing debt 4 000 4 000 2 Trade payables 2 489 2 489 2 Other current l iabil ities 4 537 4 537 2
SAGA TANKERS 2018 ANNUAL REPORT > PAGE 30
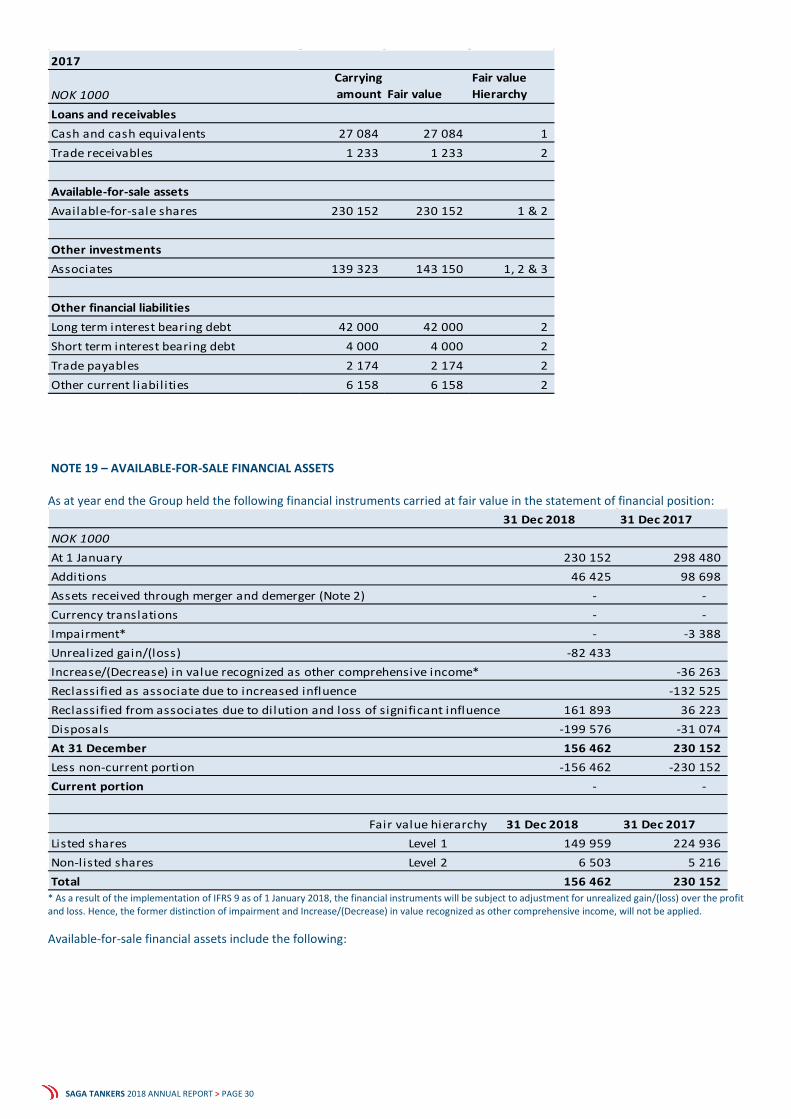
2017
NOK 1000Carrying amount Fair value
Fair value Hierarchy
Loans and receivablesCash and cash equivalents 27 084 27 084 1 Trade receivables 1 233 1 233 2
Available-for-sale assetsAvailable-for-sale shares 230 152 230 152 1 & 2
Other investmentsAssociates 139 323 143 150 1, 2 & 3
Other financial liabilitiesLong term interest bearing debt 42 000 42 000 2 Short term interest bearing debt 4 000 4 000 2 Trade payables 2 174 2 174 2 Other current l iabil ities 6 158 6 158 2
NOTE 19 – AVAILABLE-FOR-SALE FINANCIAL ASSETS As at year end the Group held the following financial instruments carried at fair value in the statement of financial position:
31 Dec 2018 31 Dec 2017NOK 1000At 1 January 230 152 298 480 Additions 46 425 98 698 Assets received through merger and demerger (Note 2) - - Currency translations - - Impairment* - -3 388 Unrealized gain/(loss) -82 433 Increase/(Decrease) in value recognized as other comprehensive income* -36 263 Reclassified as associate due to increased influence -132 525 Reclassified from associates due to dilution and loss of significant influence 161 893 36 223 Disposals -199 576 -31 074 At 31 December 156 462 230 152 Less non-current portion -156 462 -230 152 Current portion - -
Fair value hierarchy 31 Dec 2018 31 Dec 2017Listed shares Level 1 149 959 224 936 Non-listed shares Level 2 6 503 5 216 Total 156 462 230 152
* As a result of the implementation of IFRS 9 as of 1 January 2018, the financial instruments will be subject to adjustment for unrealized gain/(loss) over the profit and loss. Hence, the former distinction of impairment and Increase/(Decrease) in value recognized as other comprehensive income, will not be applied. Available-for-sale financial assets include the following:

SAGA TANKERS 2018 ANNUAL REPORT > PAGE 31
Equity securities 2018 2017
Pareto Bank ASA, market price - 199 576 SD Standard Dril l ing Plc, market price 108 810 - Northern Supply AS, fair value assessment from third parties 6 503 5 216 Vistin Pharma ASA, market price 41 149 25 361
All the available-for-sale financial assets shown above are denominated in NOK and are measured at fair value as of year-end. NOTE 20 – DIVIDENDS PAID AND PROPOSED Dividends have been paid during 2018. References are made to Consolidated changes in equity regarding this repayment. The board of Directors has decided not to distribute any dividends in 2019 based on the financial year of 2018. NOTE 21 – SUBSEQUENT EVENTS The merger between Saga Tankers ASA and its four wholly owned subsidiaries was finalized 16 February 2019. Consequently the subsidiaries was dissolved as independent entities.
SAGA TANKERS 2018 ANNUAL REPORT > PAGE 33
CORPORATE GOVERNANCE The Group endeavours to comply with the NUES corporate governance guidelines. Please see the Company’s website for information about the Company’s deviations from the NUES guidelines during 2018.
SAGA TANKERS 2018 ANNUAL REPORT > PAGE 34
SEPARATE FINANCIAL STATEMENT SAGA TANKERS ASA

SAGA TANKERS 2018 ANNUAL REPORT > PAGE 35
PARENT COMPANY INCOME STATEMENT FOR THE PERIOD 01.01. – 31.12.
NOK 1000 NOTE 2018 2017OPERATING INCOMENet gain on financial assets 2 34 441 145 930 Other Income 2 500 1 001 TOTAL OPERATING INCOME 34 941 146 931
OPERATING EXPENSESNet loss on financial assets - - Employee benefit expenses 3 3 445 3 431 Administration expenses 3 3 598 4 890 Depreciation 5 4 - TOTAL OPERATING EXPENSES 7 048 8 321
NET OPERATING PROFIT/LOSS (-) 27 893 138 610
FINANCIAL INCOME/EXPENSES (-)Interest income 474 998 Interest expense - -0 Reversal of impairment /(impairment of financial assets) 6 -24 715 25 698 Net foreign exchange gain/(loss) 24 482 -25 857 Net other financial items 8 - NET FINANCIAL INCOME/EXPENSES (-) 250 839
NET PROFIT BEFORE TAX 28 143 139 449
Taxes 10 - -
NET PROFIT/LOSS (-) FOR THE YEAR 28 143 139 449
ATTRIBUTABLE TOAccumulated losses 28 143 139 449

SAGA TANKERS 2018 ANNUAL REPORT > PAGE 37
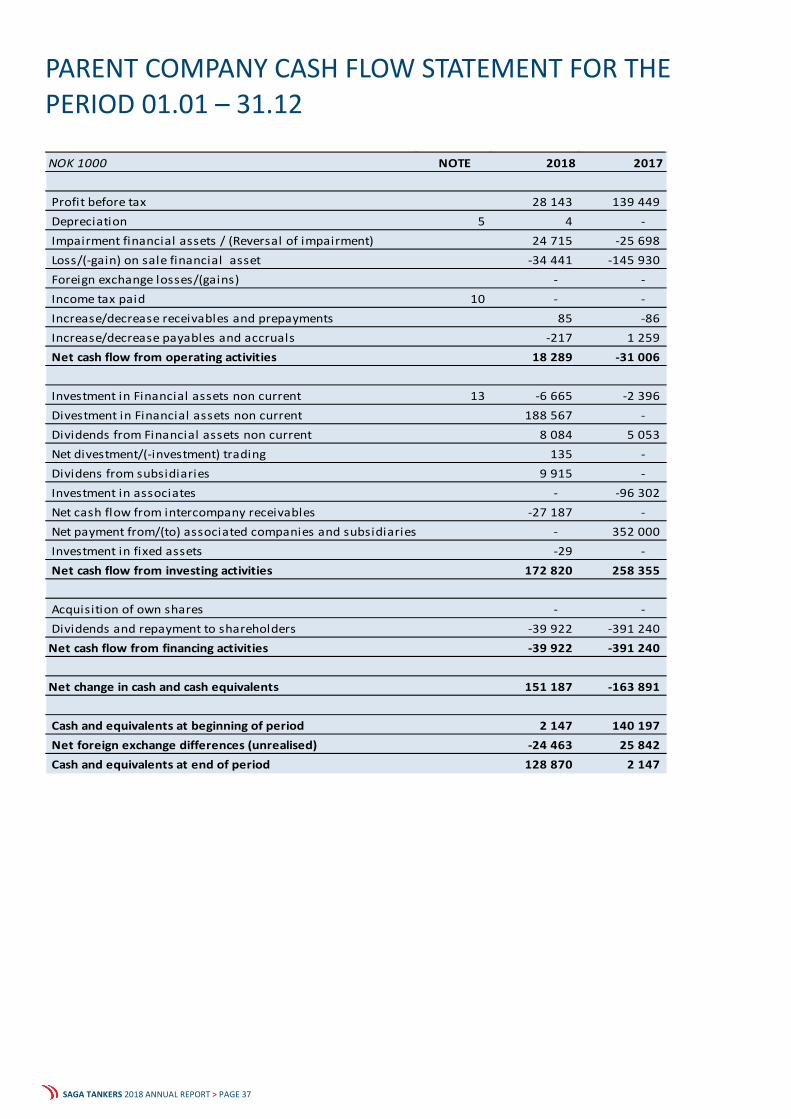
PARENT COMPANY CASH FLOW STATEMENT FOR THE PERIOD 01.01 – 31.12
NOK 1000 NOTE 2018 2017
Profit before tax 28 143 139 449 Depreciation 5 4 - Impairment financial assets / (Reversal of impairment) 24 715 -25 698 Loss/(-gain) on sale financial asset -34 441 -145 930 Foreign exchange losses/(gains) - - Income tax paid 10 - - Increase/decrease receivables and prepayments 85 -86 Increase/decrease payables and accruals -217 1 259 Net cash flow from operating activities 18 289 -31 006
Investment in Financial assets non current 13 -6 665 -2 396 Divestment in Financial assets non current 188 567 - Dividends from Financial assets non current 8 084 5 053 Net divestment/(-investment) trading 135 - Dividens from subsidiaries 9 915 - Investment in associates - -96 302 Net cash flow from intercompany receivables -27 187 - Net payment from/(to) associated companies and subsidiaries - 352 000 Investment in fixed assets -29 - Net cash flow from investing activities 172 820 258 355
Acquisition of own shares - - Dividends and repayment to shareholders -39 922 -391 240
Net cash flow from financing activities -39 922 -391 240
Net change in cash and cash equivalents 151 187 -163 891
Cash and equivalents at beginning of period 2 147 140 197 Net foreign exchange differences (unrealised) -24 463 25 842 Cash and equivalents at end of period 128 870 2 147

SAGA TANKERS 2018 ANNUAL REPORT > PAGE 38
NOTES TO THE PARENT COMPANY FINANCIAL STATEMENT NOTE 1 – ACCOUNTING POLICIES General The financial statements are presented in accordance with the Norwegian Accounting Act and Norwegian general accepted accounting principles in Norway (NGAAP). The accompanying notes are an integral part of the financial statements. The parent company accounts are presented in NOK which also is the functional currency for the parent company. Estimates The management has used estimates and assumptions that may have effect on revenues, costs and the valuation of assets and liabilities in the reporting of the annual financial statements. These assumptions are in accordance with generally accepted accounting policies in Norway. Currency Transactions in foreign currencies are recorded at the exchange rate in effect at the date of the transaction. Monetary assets and liabilities denominated in foreign currencies are retranslated at the exchange rate at the financial position date. Realized currency exchange gains or losses are recorded at the time of payment and recognised as financial income/expense. Non-monetary items that are measured at historical cost in a foreign currency are translated using the exchange rates as at the dates of the initial transactions. Measurement of revenues and costs Revenues are recognized as they are earned. Cost is recognized in the same reporting period as the corresponding revenues. Classification and evaluation of balance sheet items Current assets and short-term liabilities consist of items due for payment within a year after establishment. Other items are recognized as long-term assets or liabilities. Current assets are valued at the lowest of acquisition value or fair value. Short-term liabilities are recorded at the nominal value at the time of establishment. Non-current assets are valued to the value at the time of acquisition less accumulated depreciation. Long-term loans are valued at nominal value at the time of establishment. Receivables Receivables are recorded in the balance sheet at nominal value less provision for doubtful accounts. Provisions for doubtful accounts are based on an individual assessment of the different receivables. Taxes The income tax in the profit and loss statement consists of taxes payable and changes in deferred taxes. Deferred tax and deferred tax benefit is calculated based on temporary differences between tax bases of assets and liabilities and their carrying amount for financial reporting purposes, and is based on nominal values. Net deferred tax benefit is recorded in the balance sheet only in the event that it is probable that is can be utilized in the foreseeable future. Taxes payable and deferred taxes are recorded directly in equity in the event that the tax items are related to equity transactions. Shares in subsidiaries Investments in shares in subsidiaries are accounted for using the cost-method in the statutory accounts. An impairment loss is recognized if the fair value is lower than book value and this is viewed as non-temporary. The impairment loss is reversed to the degree that the fair value improve, and that the improvement is not assumed to be of a short-term nature. Dividends, Group contribution and other distributions are recognized in the same year as they are recognized in the subsidiary’s financial statement. If dividends / Group contribution exceed withheld profits after acquisition, the excess amount represents repayment of invested capital, and the distribution will be deducted from the recognized value of the acquisition in the balance sheet for the parent company.
SAGA TANKERS 2018 ANNUAL REPORT > PAGE 39
Investments in associates Investments in shares in associates are accounted for using the cost-method in the statutory accounts. An impairment loss is recognized if the fair value is lower than book value and this is viewed as non-temporary. The impairment loss is reversed to the degree that the fair value improve, and that the improvement is not assumed to be of a short-term nature. Investments in other shares Investments in shares in other shares are accounted for using the cost-method in the statutory accounts, unless considered as part of trading portfolio. An impairment loss is recognized if the fair value is lower than book value and this is viewed as non-temporary. The impairment loss is reversed to the degree that the fair value improve, and that the improvement is not assumed to be of a short-term nature. Pensions The company is obligated to have an occupational pension plan. The company meets the requirements for an occupational pension plan in accordance with the Norwegian law on required occupational pensions. Share-based compensation plans The Company held no share-based compensation plans as of 31.12.2018. Cash, cash-equivalents and cash flow statement Cash and cash-equivalents include cash, bank deposits and other short deposits that are repayable on demand. The cash flow statement is prepared using the indirect method. Restricted bank deposits related to the operations are included in cash equivalents. NOTE 2 – OPERATING SEGMENTS The management monitors the net income from investments in financial assets. The Company also generates other income such as fees for services rendered, guarantees and such. Segment information 2018 2017NOK 1000
Net income financial assets 34 441 145 930 Services rendered 500 1 001
NOTE 3 – SPECIFICATION OF EXPENSES The expenses for the financial years are specified below: NOK 1000 2018 2017Employee benefit expensesSalaries 2 523 2 565 Board fees 440 440 Social security costs 450 398 Pension expenses 8 18 Other personnel expenses 24 10 Total employee benefit expenses 3 445 3 431
Number of employees 2 2
Other operating expensesConsultancy fees 2 475 4 083 Other operating expenses 1 124 807 Total other operating expenses 3 598 4 890

SAGA TANKERS 2018 ANNUAL REPORT > PAGE 40
Fees to the Group’s auditors are included in administration expenses. NOK 1000 2018 2017Audit fees including VATAudit services 547 316 Other attestation services - 38 Tax services - - Other non-audit services - 33 Total 547 387
Remuneration to the Board of Directors and executive management for the period 01.01.18 – 31.12.18
2018NOK 1000Name Position Salary and bonus Other benefits Pension cost Director's feesEspen Lundaas CEO/CFO* 2 018 - - - Tore Jakob Berg CFO* 200 - - - Martin Nes Chairman - - - 140 Øystein Stray Spetalen Board member - - - 100 Kristin Hellebust Board member - - - 100 Yvonne Litsheim Sandvold Board member - - - 100 Total remuneration 2 218 - - 440
2017NOK 1000Name Position Salary and bonus Other benefits Pension cost Director's feesEspen Lundaas CEO/CFO 2 018 - - - Martin Nes Chairman - - - 140 Øystein Stray Spetalen Board member - - - 100 Kristin Hellebust Board member - - - 100 Yvonne Litsheim Sandvold Board member - - - 100 Total remuneration 2 018 - - 440
*For the fiscal year ending 31 December 2018, the position as CEO and CFO has been occupied by the same employee until December 2018 when Tore Jakob Berg was hired for the CFO position. The company had no outstanding loans, guarantees or securities in favour of any member of the Board of Directors, company management or other related parties at year end 2018. Guidelines for determining salaries and other compensation for company management: In accordance with the regulations in paragraph 6-16a in the Norwegian Public Limited Companies Act, the Board of Directors has established a statement regarding remuneration. The focus of the company is to hire qualified managers and to pay according to the market. Salary and remuneration of the CEO and CFO is determined by the Board of Directors, and payments to other employees are determined by the CEO according to guidelines from the Board of Directors. Saga Tankers Group’s compensation schemes include only a limited number of benefits in kind. These benefits are offered in line with what is common practice in international labor markets and typically include personal communication equipment, access to media, and car and parking arrangements. The CEO/CFO of Saga Tankers ASA has no set bonus scheme. A bonus of TNOK 500 to the CEO, and TNOK 150 to the CFO has been granted for the year 2018. The senior executive has a mutual three months termination period, and no contractual agreements for severance compensation in case of termination of employment except for salary through the termination period. The “Statement on the determination salary and other remuneration for senior executives” will be presented at the annual general meeting and made available on the Company’s webpage.

SAGA TANKERS 2018 ANNUAL REPORT > PAGE 41
Stock options program to Board members and Company employees No stock options or rights to stock options are held by members of the board of directors or any of the Company’s employees at 31 December 2018. NOTE 4 – CASH AND CASH EQUIVALENTS The Company’s cash and cash equivalents are denominated in the following currencies: NOK 1000 31 Dec 2018 31 Dec 2017
US Dollars 8 197 Norwegian kroner 128 862 1 950 Total cash and cash equivalents 128 870 2 147
Restricted cashEmployee tax accounts 434 446
Interest income is earned at floating interest rates. Restricted cash consists of salary related tax. NOTE 5 – FIXED ASSETS
Machinery & equipement Total
2018NOK 1000Aquisition cost, opening balance 01.01.18 - - Acquisitions during the period 29 29 Diposals during the period - - Aquisition cost at 31.12.18 29 29
Accumulated depreciation, opening balance 01.01.18 - - Depreciation -4 -4 Accumulated depreciation disposed assets - - Accumulated depreciation at 31.12.18 -4 -4
Net book value at 31.12.18 25 25 NOTE 6 – LOANS TO GROUP COMPANIES Net book value NOK 1000 31 Dec 2018 31 Dec 2017
Saga Agnes* - 1 457 Saga Chelsea AS 248 285 Saga Julie AS 182 217 Saga Unity AS 217 253 Strata Marine & Offshore AS 29 500 23 000 Intercompany short-term loans 30 147 25 212
Impairment/ (reversal of impairment)

SAGA TANKERS 2018 ANNUAL REPORT > PAGE 42
NOK 1000 2018 Accumulated
Saga Agnes* - - Saga Chelsea AS 5 765 102 704 Saga Julie AS 8 449 151 055 Saga Unity AS 10 358 185 279 Strata Marine & Offshore AS - - Impairment of loan 24 571 439 038
* Saga Agnes AS has been dissolved in 2018, and debt to Saga Tankers ASA exceeding the subsidiary’s financial capabilities was waived. Due to former impairment of said loan, the waiver did not cause any significant impact to Saga Tankers ASA financial statement for 2018. Intercompany loans consist of loans to the subsidiaries provided prior years from the parent company for acquisitions of vessels and working capital purposes. The loans are denominated in USD. The Company has, as per NGAAP, evaluated if there are reasons to believe that any negative change in value adjusted equity of the subsidiaries are permanent and should lead to an impairment of the intercompany receivables, and consequently written down the receivables with NOK 439 million to a book value of NOK 25 million. An impairment of 24.6 million has been made in 2018, but this is in all materiality a result of the currency effect, not changing the net book value of the loans. Face value and net value of intercompany loans NOK 1000 31 Dec 2018 31 Dec 2017
Face value 469 185 534 002 Impairment -439 038 -508 790 Net book value 30 147 25 212
NOTE 7 –LEASE AGREEMENTS The company currently hold no own fixed assets. Annual rental of non-financial assets The company has a lease agreement for office space, with a contract period until 1 December 2021 and a mutual termination span of six months. The annual rent for 2018 was TNOK 76. Additional costs TNOK 54 for other mutual costs relating to the premises was also incurred in 2018. It is expected for these costs will increase as of 2019 due to increased lease of office space following the merger as well as the hiring of dedicated CFO. NOTE 8 – RELATED PARTIES Remuneration to executives is disclosed in note 3, and balance with group companies is disclosed in note 6 and note 15. Company is sharing office locations for its head office with Ferncliff Holding AS, the holding company of a board member, and the Company's largest shareholder. Transactions with related parties during 2018 are limited to office rent including mutual costs, deliverance of strategic management services, and services rendered regarding support for financial reporting. All transactions with related parties have been made on an arm's length basis and are settled on a regular basis. Goods and/or services purchased from related parties have been priced at industry standard rates. Transactions with related parties are specified below: RELATED PARTY TRANSACTIONS
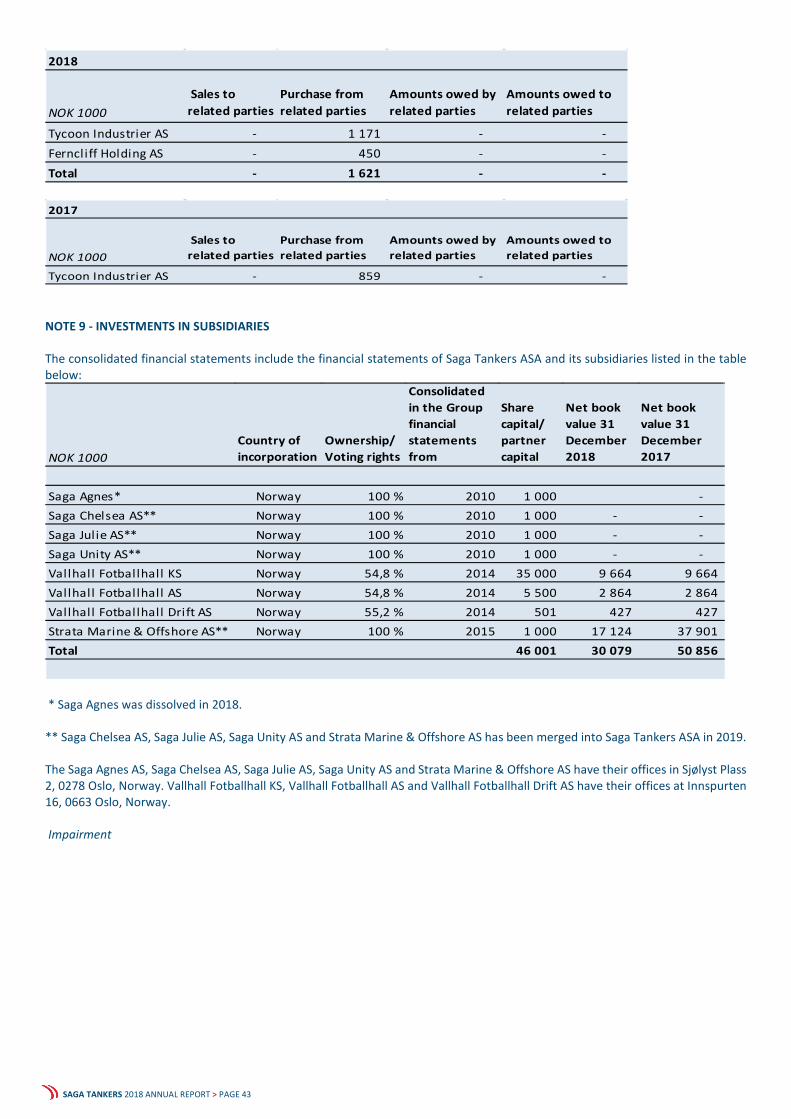
SAGA TANKERS 2018 ANNUAL REPORT > PAGE 43
2018
NOK 1000 Sales to related parties
Purchase from related parties
Amounts owed by related parties
Amounts owed to related parties
Tycoon Industrier AS - 1 171 - - Ferncliff Holding AS - 450 - - Total - 1 621 - -
2017
NOK 1000 Sales to related parties
Purchase from related parties
Amounts owed by related parties
Amounts owed to related parties
Tycoon Industrier AS - 859 - - NOTE 9 - INVESTMENTS IN SUBSIDIARIES The consolidated financial statements include the financial statements of Saga Tankers ASA and its subsidiaries listed in the table below:
NOK 1000Country of incorporation
Ownership/ Voting rights
Consolidated in the Group financial statements from
Share capital/ partner capital
Net book value 31 December 2018
Net book value 31 December 2017
Saga Agnes* Norway 100 % 2010 1 000 - Saga Chelsea AS** Norway 100 % 2010 1 000 - - Saga Julie AS** Norway 100 % 2010 1 000 - - Saga Unity AS** Norway 100 % 2010 1 000 - - Vallhall Fotballhall KS Norway 54,8 % 2014 35 000 9 664 9 664 Vallhall Fotballhall AS Norway 54,8 % 2014 5 500 2 864 2 864 Vallhall Fotballhall Drift AS Norway 55,2 % 2014 501 427 427 Strata Marine & Offshore AS** Norway 100 % 2015 1 000 17 124 37 901 Total 46 001 30 079 50 856
* Saga Agnes was dissolved in 2018. ** Saga Chelsea AS, Saga Julie AS, Saga Unity AS and Strata Marine & Offshore AS has been merged into Saga Tankers ASA in 2019. The Saga Agnes AS, Saga Chelsea AS, Saga Julie AS, Saga Unity AS and Strata Marine & Offshore AS have their offices in Sjølyst Plass 2, 0278 Oslo, Norway. Vallhall Fotballhall KS, Vallhall Fotballhall AS and Vallhall Fotballhall Drift AS have their offices at Innspurten 16, 0663 Oslo, Norway. Impairment

SAGA TANKERS 2018 ANNUAL REPORT > PAGE 44
NOK 1000Recognized 2018
Accumulated as at 31 December 2018
Saga Agnes* - 100 452 Saga Chelsea AS* - 114 874 Saga Julie AS* - 112 939 Saga Unity AS* - 113 987 Strata Marine & Offshore AS** 20 777 229 512 Impairment subsidiaries 20 777 671 766
*The impairment of the subsidiaries has been made on basis of their equity as an estimate of recoverable amount. The subsidiaries have for the time being no substantial assets other than cash. ** The impairment of Strata Marine & Offshore AS has been made on basis of the equity as an estimate of recoverable amount. The impairment was initially a result of dividends paid to Saga Tankers ASA during 2017.

SAGA TANKERS 2018 ANNUAL REPORT > PAGE 45
NOTE 10 – INCOME TAX NOK 1000 2018 2017
Current tax expense - - Deferred tax expense - - Tax effect of group contribution - - Tax expense - -
Reconciliation of tax expenseNet income before tax 28 143 351 572
Tax expense based on nominal tax rate* 6 473 33 468 Tax effect of permanent differences 12 302 -34 563 Not recognized deferred tax assets -18 775 1 095 Tax expense - -
Reconciliation of deferred tax (-) / deferred tax assets*Tangible assets -1 -3 Receivables 82 642 105 968 Net tax loss carried forward** 3 808 3 161 Net deferred tax assets 86 449 109 126 Net deferred tax assets not recognized -86 449 -109 126 Deferred tax (-)/ deferred tax assets in the balance sheet - -
Tax payableCurrent tax expense - - Deferred tax expense - - Tax payable - -
* Tax rate for 2017 was 24%, and for 2018 it was 23%. Tax rate for 2019 as set by the Norwegian Parliament 12 December 2018 is 22%. The rate of 22% has therefore been applied to calculate future tax liabilities and assets as at 31 December 2018. ** Net tax loss carried forward is available indefinitely for offset against future taxable profits.

SAGA TANKERS 2018 ANNUAL REPORT > PAGE 46
NOTE 11 – ISSUED CAPITAL AND SHAREHOLDERS Issued capital 2018
Number of shares issued
Number of outstanding shares
Share capital
Own shares
Other equity
Accumu-lated losses Total
NOK 1000
Equity per 31 December 2016 286 732 609 266 149 829 286 733 -20 583 987 329 -697 676 555 803 Net profit/loss (-) for the year 2017 - 139 449 139 449 Cancellation of own shares -20 582 780 -20 583 20 583 - Repayment to shareholders -263 488 -127 752 -391 240 Equity per 31 December 2017 266 149 829 266 149 829 2 661 - 859 577 -558 227 304 012
Net profit/loss (-) for the year 2018 28 143 28 143 Cancellation of own shares - - - Dividends -39 922 -39 922 Equity per 31 December 2018 266 149 829 266 149 829 2 661 - 819 655 -530 084 292 232
The nominal value per share as of 31 December 2016 was NOK 1 per share, for all of the Company’s shares. Through repayment to shareholders as decided by the general meeting 4 July 2017, this was reduced by NOK 0.99 per share. The nominal value per share is thereby NOK 0.01 per share as of 31 December 2017 and as of 31 December 2018. All issued shares have a nominal value of NOK 0.01 and are of equal rights. Saga Tankers ASA is incorporated in Norway, listed on the Oslo Exchange Axess list, and the share capital is denominated in NOK. Board authorizations: Power of attorney to increase the share capital through issuance of new shares The Board held as per 31 December 2018 authorization to issue up to 133,074,915 new shares. The authorization may be utilised on one or several occasions. Power of attorney to repurchase own shares The Board held authorization to repurchase own shares as per 31 December 2018 limited to 10 % of total shares issued. Authorization to raise convertible loans The Board held no authorization to raise convertible bonds as per 31 December 2018. Stock option arrangements The Company/Group held no stock option or synthetic stock option agreements as of 31 December 2018. As of 31 December 2018 the Company had 409 shareholders.
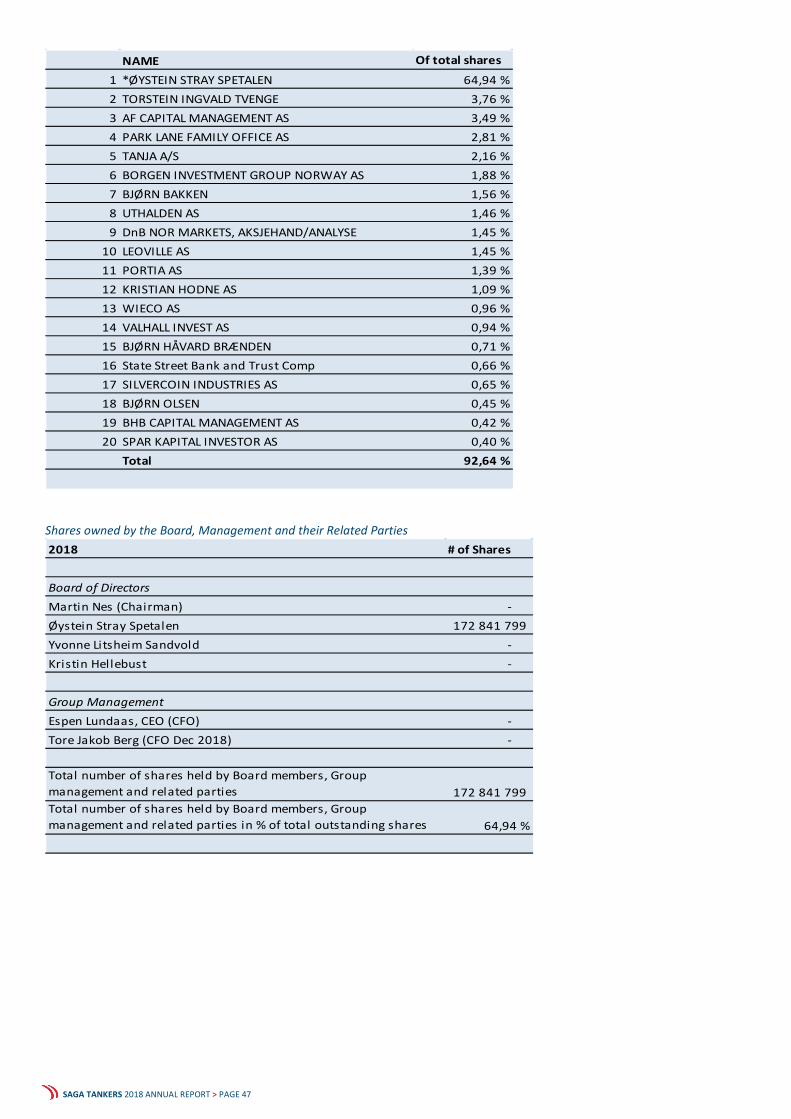
SAGA TANKERS 2018 ANNUAL REPORT > PAGE 47
NAME Of total shares
1 *ØYSTEIN STRAY SPETALEN 64,94 %2 TORSTEIN INGVALD TVENGE 3,76 %3 AF CAPITAL MANAGEMENT AS 3,49 %4 PARK LANE FAMILY OFFICE AS 2,81 %5 TANJA A/S 2,16 %6 BORGEN INVESTMENT GROUP NORWAY AS 1,88 %7 BJØRN BAKKEN 1,56 %8 UTHALDEN AS 1,46 %9 DnB NOR MARKETS, AKSJEHAND/ANALYSE 1,45 %
10 LEOVILLE AS 1,45 %11 PORTIA AS 1,39 %12 KRISTIAN HODNE AS 1,09 %13 WIECO AS 0,96 %14 VALHALL INVEST AS 0,94 %15 BJØRN HÅVARD BRÆNDEN 0,71 %16 State Street Bank and Trust Comp 0,66 %17 SILVERCOIN INDUSTRIES AS 0,65 %18 BJØRN OLSEN 0,45 %19 BHB CAPITAL MANAGEMENT AS 0,42 %20 SPAR KAPITAL INVESTOR AS 0,40 %
Total 92,64 %
Shares owned by the Board, Management and their Related Parties 2018 # of Shares
Board of DirectorsMartin Nes (Chairman) - Øystein Stray Spetalen 172 841 799 Yvonne Litsheim Sandvold - Kristin Hellebust -
Group ManagementEspen Lundaas, CEO (CFO) - Tore Jakob Berg (CFO Dec 2018) -
Total number of shares held by Board members, Group management and related parties 172 841 799 Total number of shares held by Board members, Group management and related parties in % of total outstanding shares 64,94 %

SAGA TANKERS 2018 ANNUAL REPORT > PAGE 48
2017 # of Shares
Board of DirectorsMartin Nes (Chairman) - Øystein Stray Spetalen 172 841 799 Yvonne Litsheim Sandvold - Kristin Hellebust -
Group ManagementEspen Lundaas, CEO (CFO) -
Related partiesAllum Holding AS* 41 491 339 AS Ferncliff* 6 235 316
Total number of shares held by Board members, Group management and related parties 220 568 454 Total number of shares held by Board members, Group management and related parties in % of total outstanding shares 82,87 %
* Allum Holding AS and AS Ferncliff are companies in which Øystein Stray Spetalen are the sole beneficial owner. Shares and stock options by Board members and Group management No stock options or rights to stock options are held by members of the board of directors or any of the Company's employees at 31 December 2018. NOTE 12 –RISKS The risk exposure of Saga Tankers ASA is considered to be similar as the risks described for the Saga Tankers Group. References are made to note 17 in the Saga Tankers Group consolidated accounts. The sensitivity analysis for the equity instruments in the consolidated accounts will not be applicable to the Company's accounts, due to differences in accounting principles. NOTE 13 – SHARES AND OTHER FINANCIAL ASSETS
2018 2017
NOK 1000 At 1 January 155 612 156 604 Additions 6 665 2 396 Disposals -150 396 - Reclassified from associates 96 302 - Impairment -1 087 -3 388 At 31 December 107 096 155 612
Shares and other financial assets include the following NOK 1000
2018 2017
Listed shares 100 593 150 396 Non-listed shares 6 503 5 216 Total 107 096 155 612
The financial assets are denominated in NOK and are measured at cost.

SAGA TANKERS 2018 ANNUAL REPORT > PAGE 49
NOTE 14 – ASSOCIATES Book value of associates
SD Standard Drilling Plc
NOK 1000At 1 January 2018 96 302 Dereconition due to dil lution of ownership -96 302 At 31 December 2018 -
* The investment of 20.219 % share in SD Standard Drilling Plc had a carrying value of TNOK 96.302 at the end of 2017. As a result of capital increases in the investment, the ownership was diluted to 18.375%, and assessed by the company to no longer be an investment of which it could oppose significant influence, thereby reclassified from associate to other shares and other financial assets.. NOTE 15 – INTERCOMPANY PAYABLES Net book value
NOK 100031 December 2018
31 December 2017
Strata Marine & Offshore AS - 22 000 Intercompany payables - 22 000
NOTE 16 – SUBSEQUENT EVENTS All four 100% owned subsidiaries was of 16 February 2019 merged into the parent company.
SAGA TANKERS 2018 ANNUAL REPORT > PAGE 50
AUDITOR’S REPORT


SAGA TANKERS 2018 ANNUAL REPORT > PAGE 55
SAGA TANKERS ASA +47 92 43 14 17 Sjølyst Plass 2, 0278 Oslo Norway
INVESTOR RELATIONS Phone: +47 92 43 14 17 e-mail: [email protected]

SAGA TANKERS 2018 ANNUAL REPORT > PAGE 56
www.sagatankers.com