interim report - globenewswire
TRANSCRIPT
Interim report1 May 2018 - 31 October 2018

Industrivej Nord 25, 7400 HerningTel. no.: +45 97 11 88 11www.egecarpets.come-mail: [email protected]
Registration No.CVR-no.: 38 45 42 18
Board of DirectorsEbbe Malte Iversen, director (chairman)Hans Olesen Damgaard, director (deputy chairman)Kaja Møller, directorSøren Mygind Eskildsen, directorJørgen Stender Clausen, smith (staff representative)Maja Lorenzen, office clerk (staff representative)
ManagementJohn Vestergaard, CEOSvend Aage Færch Nielsen, CCO
AuditorsErnst & Young Morten Friis, state authorised public accountant Karsten Mehlsen, state authorised public accountant
SolicitorsDAHL, Herning
BankersDanske BankHandelsbanken
egetæpper a/s

1
Management statement . . . . . . . . . . . . . . . . . . . . . . . . . . . . . . . . . . . . . . . . . . . . . . . . . . . . . . . . . . . . . . . . . . . . . . . . . . . . . . . . . . . . . . . . . . . . . . . . . . . 2Management report. . . . . . . . . . . . . . . . . . . . . . . . . . . . . . . . . . . . . . . . . . . . . . . . . . . . . . . . . . . . . . . . . . . . . . . . . . . . . . . . . . . . . . . . . . . . . . . . . . . . . . . 4Financial highlights for the ege Group . . . . . . . . . . . . . . . . . . . . . . . . . . . . . . . . . . . . . . . . . . . . . . . . . . . . . . . . . . . . . . . . . . . . . . . . . . . . . . . . . . . . . . 5Accounting policy . . . . . . . . . . . . . . . . . . . . . . . . . . . . . . . . . . . . . . . . . . . . . . . . . . . . . . . . . . . . . . . . . . . . . . . . . . . . . . . . . . . . . . . . . . . . . . . . . . . . . . . . 10Profit and loss account for the period 1 May 2018 – 31 October 2018 . . . . . . . . . . . . . . . . . . . . . . . . . . . . . . . . . . . . . . . . . . . . . . . . . . . . . . . . 12Consolidated income statement for the period 1 May 2018 – 31 October 2018 . . . . . . . . . . . . . . . . . . . . . . . . . . . . . . . . . . . . . . . . . . . . . . . 13Balance as of 31 October 2018 . . . . . . . . . . . . . . . . . . . . . . . . . . . . . . . . . . . . . . . . . . . . . . . . . . . . . . . . . . . . . . . . . . . . . . . . . . . . . . . . . . . . . . . . . . . . 14Cash flow statement for the period 1 May 2018 – 31 October 2018 . . . . . . . . . . . . . . . . . . . . . . . . . . . . . . . . . . . . . . . . . . . . . . . . . . . . . . . . . . 16Statement of capital and reserves. . . . . . . . . . . . . . . . . . . . . . . . . . . . . . . . . . . . . . . . . . . . . . . . . . . . . . . . . . . . . . . . . . . . . . . . . . . . . . . . . . . . . . . . . . 18Notes . . . . . . . . . . . . . . . . . . . . . . . . . . . . . . . . . . . . . . . . . . . . . . . . . . . . . . . . . . . . . . . . . . . . . . . . . . . . . . . . . . . . . . . . . . . . . . . . . . . . . . . . . . . . . . . . . . . . 19
Contents
Contacts:Mr. John Vestergaard, CEOTel: +45 97118811
Mr. Svend Aage Færch Nielsen, CCOTel: +45 97118811
egetæpper a/s
Herning, 11 December 2018

2 MANAGEMENT STATEMENT
Management statement
The management and the Board of Directors have today pre-sented and approved the interim report for the period 1 May 2018 – 31 October 2018.
The interim report, which has not been audited or reviewed by the company auditors, has been prepared in accordance with IAS 34 ”Presentation of interim financial reports” as approved by EU as well as additional Danish disclosure requirements for listed companies.
In our opinion the interim report gives a true and fair view of
the Group’s assets, liabilities and financial state as per 31 Octo-ber 2018 as well as of the result of the Group’s activities and cash flows for the period 1 May 2018 – 31 October 2018.
Moreover, we find that the management report gives a true statement of the development of the Group’s activities and fi-nancial state, of the profit for the period and of the Group’s fi-nancial state as a whole, as well as a description of the major risks and elements of uncertainties the Group is facing.
Herning 11 december 2018
Management:
John Vestergaard Svend Aage Færch Nielsen CEO CCO
Board of directors:
Ebbe Malte Iversen Hans Olesen Damgaard Kaja Møller Chairman Deputy chairman
Søren Mygind Eskildsen Jørgen Stender Clausen Maja Lorenzen Staff representative Staff representative

HIGHLINE 80/20 1400 STADHUIS ROTTERDAM – THE NETHERLANDS

4 MANAGEMENT REPORT
First six months in numbers (Group level)
Turnover of the first 6 months of the financial year 2018/19 amounts to DKK 550.5m and has decreased by 2% compared to last year. The development is as expected and is primarily attrib-utable to Hammer Carpets and to some extent Carpet Concept.
EBIT makes up DKK 30.1m which is a 23% decrease compared to last year. The result is slightly below our expectations for the first six months of the financial year and can be attributed to Q1 (costs associated with an international sales conference and a decline in revenue at Carpet Concept). The development in revenue during Q2 exceeds the level of last year as well as our expectations.
Turnovert.DKK
EBITt.DKK
2014/15 2014/152015/16 2015/162016/17 2016/172017/18 2017/182018/19 2018/19
406 41
469
57
457
38
561
39
551
30
Management report
The EBIT margin makes up 5.5% and is slightly below our overall expections for the first six months of the financial year. The EBIT margin of Q2 constitutes 6.6%.
Return on invested capital (RoIC) makes up 5.5%.
EBIT-margin%
ROIC (after tax)%
2014/15 2014/152015/16 2015/162016/17 2016/172017/18 2017/182018/19 2018/19
10.0
12.4
12.1
8.3
10.0
6.9
8.85.5
5.5
The financial year 2015/16 is affected by profit from the sale of our property in Vejle (before taxation DKK 20m – after taxation DKK 16m).
16.2

5
t.DKK H1 H2 2018 2017 2017/18
Net turnover 551 561 1.157 Result before financial entries and taxation (EBIT) 30 39 79 Financial entries (net) -7 -10 -17 Result before taxation 23 29 62
Group net result 17 22 44
Total assets at end of period 1,075 1,007 1,019 Share capital 26 26 26 Equity at end of period excl. of minority holdings 505 485 506 Net working capital 271 270 285 Cash flows from operating activity 63 19 60
Number of employees 731 712 707 Investments in long-term assets (excl. acquisition of subsidiary) 62 22 49 Investments in long-term assets (excl. of acquisition of factory) 0 0 174
Depreciations 22 22 43
Net profit ratio (EBIT-margin) 5 7 7 Return on invested capital (RoIC) 6 9 7 Return on equity after taxation (p.a.) 6 9 9 Solvency ratio 47 48 50 Net working capital in percentage of turnover 25 24 25
Share capital, nominal t.DKK 26,210 26,210 26,210 Number of A-shares 330,340 330,340 330,340 Number of B-shares in circulation 2,290,720 2,290,720 2,290,720 Recommended dividend per share, DKK - - 6.50 Net asset value of share, DKK 192.80 185.08 193.07 Stock exchange price 224.00 255.00 250.00 Stock exchange price/net asset value 1.16 1.38 1.29
Financial highlights of the Group
FINANCIAL HIGHLIGHTS OF THE GROUP

6
Internal trade and sourcing of products in the Group entail inter-nal profit etc. These are eliminated at Group level. Eliminations constitute overall approx. DKK 3.5m for the first six months of
the financial year and primarily consist of depreciations at Group level on intangible assets (customer relations Hammer Carpets and Carpet Concept) as well as internal profit.
Turnover per brand
EBIT per brand
t.DKK
2017/18 2018/19
t.DKK
2017/18 2018/19
ege
ege
Bentzon Carpets
Bentzon Carpets
Carpet Concept
Carpet Concept
Hammer Carpets
Hammer Carpets
Internal trade
Intra-group/
Group depreciations
ege Group
ege Group
404.2
22.4
68.4
10.5
88.7
5.1
68.8
6.0
÷68.7
561.4
39.0
426.5
20.6
64.9
12.1
80.348.6
2.0
÷69.8
550.5
30.1
÷5.0÷1.1
÷3.5
MANAGEMENT REPORT

7
Accounting report
Group
TurnoverThe Group turnover amounts to DKK 550.5m against DKK 561.4m last year, representing a decrease of 2%. The develop-ment is mainly attributable to Hammer Carpets and Carpet Con-cept and is as expected.
CostsOther external costs amount to DKK 103.1m and have increased by DKK 3.6m compared to last year. Staff charges amount to DKK 167.1m against DKK 156.1m last year. Overall, the increase in costs amounts to DKK 14.6m corresponding to 6%.
Depreciations amount to DKK 22.4m against DKK 22.2m last year.
Financial entriesFinancial entries amount to DKK -7.0m against DKK -9.6m last year.
EBIT for the first six monthsEBIT constitutes DKK 30.1m against 39.0m last year.
EquityEquity of the Group excl. of minority holdings amounts to DKK 505.3m against DKK 485.1m last year. The solvency ratio consti-tutes 47% against 48% last year.
Cash flow statementCash flows from operation amount to DKK 62.6m against DKK 19.2m last year.
Cash flows for investments amount to DKK -69.9m against DKK -30.0m last year.
EmployeesAs of 31 October 2018 the number of employees is 731, corre-sponding to an increase of 24 compared to 30 April 2018. Both sales and production capacity have expanded during the period.
MANAGEMENT REPORT

8
The past six months
egeTurnover of the past six months amounts to DKK 426.5m corre-sponding to organic growth a little under 6% which meets with our expectations.
Scandinavia has not quite met with our expectations. We have seen a decline in Denmark and an increase in Norway.
Our core growth markets in the UK, France and DACH (Ger-many, Austria and Switzerland) have lived up to expectations. Amongst our minor export markets it continues to be Benelux and USA who perform satisfactorily.
EBIT of the first six months makes up DKK 20.6m and is con-sistent with our expectations. EBIT of Q2 makes up DKK 13.8m corresponding to an increase of DKK 6.6m compared to Q2 last year.
Carpet ConceptCarpet Concept has during Q2 experienced growth in turnover at just over 3% compared to last year. After a period of “drought” with decline we begin to see the effect of the effort aimed on increasing the competitiveness of Carpet Concept. The decline in turnover of the past sixt months makes up 9%.
EBIT of the past six months makes up DKK -1.1m which is on par with our expectations.
MANAGEMENT REPORT
Turnover EBITt.DKK
2017/18 2018/19
404.2
426.5
22.4 20.6
2017/18 2018/19
88.7
80.3
5.1
÷1.1

9
Bentzon CarpetsCompared to last year Bentzon Carpets has recorded a decline in turnover of approx. 5%. The decline is attributable to Group in-ternal sales to ege and Carpet Concept, as revenue for external customers has increased by 3% compared to last year.
Our expectations in terms of revenue are met.
Hammer CarpetsIn terms of turnover Hammer Carpets has not met the level of last year with a decline of 29% during the past six months. This does not live up to our expectations. The development is due to postponement of orders to following quarters. The first major deliveries have been shipped in November. Based on agreed de-livery times and order portfolios Hammer Carpets is anticipated to live up to our expectations for the financial year.
EBIT of the first six months makes up DKK 2.0m and is reduced by approx. 2/3 as a result of decline in turnover. Despite the de-cline EBIT exceeds our expectations. The primary reasons for this are due to optimization and efficiency improvements of pur-chasing and production.
MANAGEMENT REPORT
2017/18 2018/19
68.464.9
10.5 12.1
2017/18 2018/19
68.8
48.6
6.0 2.0
10
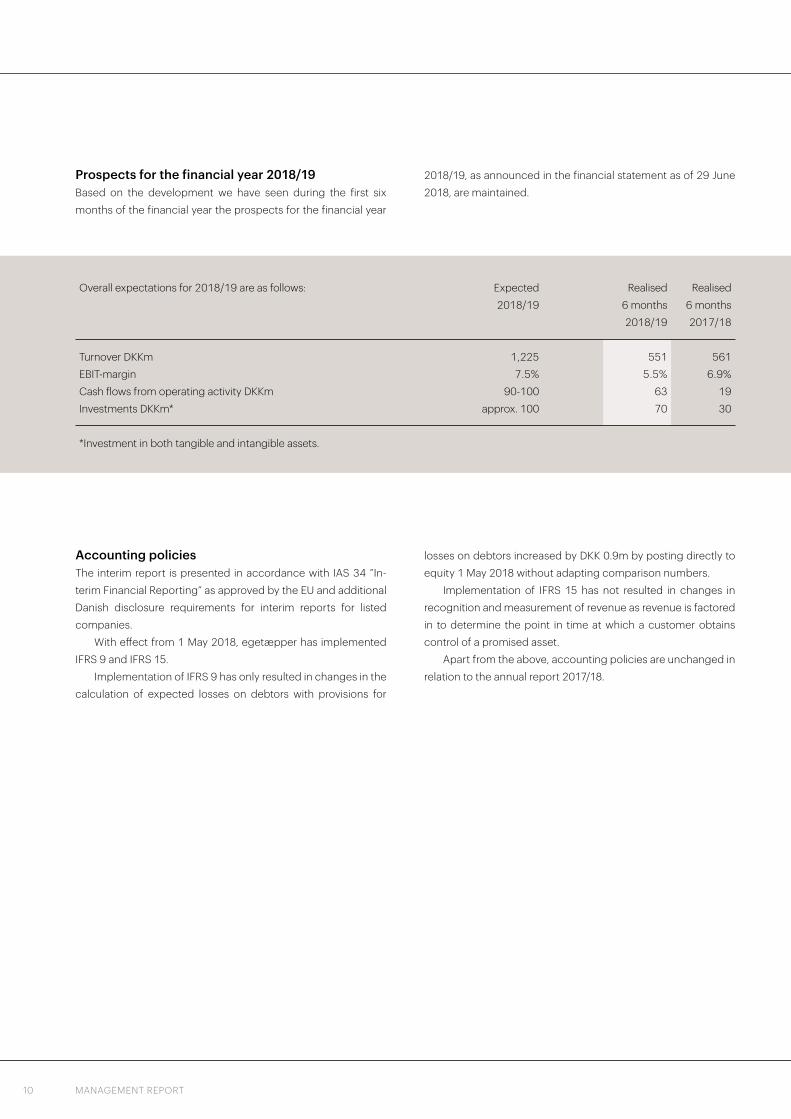
Overall expectations for 2018/19 are as follows: Expected Realised Realised 2018/19 6 months 6 months 2018/19 2017/18
Turnover DKKm 1,225 551 561 EBIT-margin 7.5% 5.5% 6.9% Cash flows from operating activity DKKm 90-100 63 19 Investments DKKm* approx. 100 70 30
*Investment in both tangible and intangible assets.
Prospects for the financial year 2018/19Based on the development we have seen during the first six months of the financial year the prospects for the financial year
2018/19, as announced in the financial statement as of 29 June 2018, are maintained.
Accounting policiesThe interim report is presented in accordance with IAS 34 ”In-terim Financial Reporting” as approved by the EU and additional Danish disclosure requirements for interim reports for listed companies.
With effect from 1 May 2018, egetæpper has implemented IFRS 9 and IFRS 15.
Implementation of IFRS 9 has only resulted in changes in the calculation of expected losses on debtors with provisions for
losses on debtors increased by DKK 0.9m by posting directly to equity 1 May 2018 without adapting comparison numbers.
Implementation of IFRS 15 has not resulted in changes in recognition and measurement of revenue as revenue is factored in to determine the point in time at which a customer obtains control of a promised asset.
Apart from the above, accounting policies are unchanged in relation to the annual report 2017/18.
MANAGEMENT REPORT

HIGHLINE 910 YORK THEATRE ROYAL – GREAT BRITAIN

12
PROFIT AND LOSS ACCOUNT
Profit and loss account 1 May - 31 October
Note t.DKK H1 H1 Q2 Q2 2018/19 2017/18 2018/19 2017/18
Turnover 550,508 561,407 276,769 277,205 Change in stock of finished goods, work in progress and commercial goods 22,716 19,739 20,500 16,005 Costs for raw materials, auxiliaries and commercial goods -251,944 -266,347 -130,397 -138,045 Other external costs -103,109 -99,531 -50,259 -50,135
Gross profit 218,171 215,268 116,613 105,030
Other operating income 1,536 2,037 1,064 1,420 Staff costs -167,095 -156,098 -88,215 -80,709 Depreciations -22,383 -22,200 -11,158 -11,102 Other operating costs -81 -20 -69 0 Profit before financial entries and taxation 30,148 38,987 18,235 14,639
Profit after tax in joint venture 138 567 102 275 Financial income 42 48 0 25 1 Financial expenses -7,196 -10,180 -3,390 -4,666
Profit before tax 23,132 29,422 14,947 10,273
Tax on profit for the period -6,338 -7,539 -3,932 -2,093
Profit for the period 16,794 21,883 11,015 8,180
Divided between: Shareholders of egetæpper a/s 16,026 20,634 10,692 7,519 Minority shareholders 768 1,249 323 661
16,794 21,883 11,015 8,180
Earnings per diluted share, DKK (EPS-D) 6.11 7.87 4.07 2.87 Earnings per share, DKK (EPS) 6.11 7.87 4.07 2.87

13
CONSOLIDATED INCOME STATEMENT
Consolidated income statement 1 May - 31 October
t.DKK H1 H1 Q2 Q2 2018/19 2017/18 2018/19 2017/18
Financial entries which might be reclassified to the profit and loss account Exchange rate adjustment of foreign subsidiaries 296 -935 81 904 Tax on other consolidated income 0 0 0 0
Other consolidated income after tax 296 -935 81 904 Profit for the period 16,794 21,883 11,015 8,180
Total recognised consolidated income 17,090 20,948 11,096 9,084
Divided between: Shareholders of egetæpper a/s 16,322 19,699 10,773 8,423 Minority shareholders 768 1,249 323 661
17,090 20,948 11,096 9,084

14 BALANCE SHEET
Balance sheet
t.DKK 31/10 31/10 30/4 2018 2017 2018
Assets
Long-term assets
Intangible assets Completed development costs 170 1,082 698 Customer relations 8,620 11,191 10,198 Agency rights 1,610 1,610 1,610 Goodwill 148,252 148,087 148,252 Intangible projects under construction 35,814 19,604 27,843
Total intangible assets 194,466 181,574 188,601 Tangible fixed assets Land and buildings 171,203 163,269 165,342 Plant and machinery 132,345 133,496 143,971 Fixtures and fittings, tools and equipment 22,759 22,935 25,581 Property plant and equipment under construction 70,933 29,075 20,570
397,240 348,775 355,464 Financial fixed assets Capital investments in joint venture 23,300 26,748 23,162
23,300 26,748 23,162
Total long-term assets 615,006 557,097 567,227
Short-term assets Inventories 285,155 272,530 269,285 Trade receivables 146,085 149,560 168,109 Cash at bank and in hand 29,249 28,296 13,973
Total short-term assets 460,489 450,386 451,367 Total assets 1,075,495 1,007,483 1,018,594

15BALANCE SHEET
Note t.DKK 31/10 31/10 30/4 2018 2017 2018
Equity and liabilities
Equity Share capital 26,210 26,210 26,210 Reserve for exchange rate adjustments -1,690 -1,095 -1,986 Retained earning 480,820 459,986 464,794 Proposed dividends 0 0 17,037
505,340 485,101 506,055 Minority shareholders’ part 4,456 4,933 5,242
Total equity 509,796 490,034 511,297
Liabilities Long-term liabilities Deferred tax 30,379 30,387 30,381 Credit institutions 95,076 65,144 55,017 2 Engagement relating to acquisition of minority shareholding 54,400 54,889 54,189
179,855 150,420 139,587
Short-term liabilities Trade payables 63,438 57,083 55,863 Debts to joint venture 7,159 5,532 6,772 Debts to associates 33,146 0 25,000 Credit institutions 99,632 126,499 93,453 Engagement relating to acquisition of minority shareholding 79,422 80,342 87,089 Corporation tax 13,767 7,897 9,666 Other payables 89,280 89,676 89,867 385,844 367,029 367,710
Total liabilities 565,699 517,449 507,297 Total equity and liabilities 1,075,495 1.007,483 1,018,594

16 CASH FLOW STATEMENT
t.DKK H1 H1 2018/19 2017/18
Turnover and other operating income 552,228 562,509 Operating costs -521,896 -525,953 Depreciations 22,383 22,200 Change in working capital 13,529 -27,169
Cash flow from activities before financial items 66,244 31,587 Interest receipts or similar 42 513 Interest payments or similar -1,485 -3,369
Cash flow from ordinary operation before taxation 64,801 28,731 Corporation tax paid -2,239 -9,550
Cash flows from operating activity 62,562 19,181
Acquisition of tangible assets -62,047 -21,832 Sale of tangible assets 106 1,770 Acquisition of intangible assets -7,971 -9,928
Cash flows to investment activity -69,912 -29,990
Borrowing 59,000 0 Loan repayment -25,000 0 Instalments -10,795 -9,791 Change in operation credits 31,179 41,574 Dividend paid -17,037 -17,037 Dividend paid to minority shareholders -14,686 -8,476
Cadh flows from financing acitivities 22,661 6,270
Cash flow of the period 15,311 -4,539 Cash equivalents at beginning of period 13,973 33,300 Value adjustment of cash equivalents -35 -465
Cash equivalents at end of period 29,249 28,296
Cash flow statement 1 May - 31 October

17HIGHLINE 910 – INDUSTRIAL LANDSCAPE BY TOM DIXON RIVER PARK HOTEL – HUNGARY

18
Statement of capital and reserves
t.DKK Share Reserve for Retained Proposed Total Minority Total capital exchange earnings dividends share- equity rate holders adjustment Equity 1 May 2017 26,210 -160 439,352 17,037 482,439 5,349 487,788
Profit for the period 0 0 20,634 0 20,634 1,249 21,883 Exchange rate adjustments 0 -935 0 0 -935 0 -935 Dividend paid 0 0 0 -17,037 -17,037 -1,665 -18,702
Total equity 31 October 2017 26,210 -1,095 459,986 0 485,101 4,933 490,034
Equity 1 November 2017 26,210 -1,095 459,986 0 485,101 4,933 490,034
Profit for the period 0 0 4,808 17,037 21,845 309 22,154 Exchange rate adjustments 0 -891 0 0 -891 0 -891 Dividend paid 0 0 0 0 0 0 0
Total equity 30 April 2018 26,210 -1,986 464,794 17,037 506,055 5,242 511,297
Equity 1 May 2018 26,210 -1,986 464,794 17,037 506,055 5,242 511,297
Profit for the period 0 0 16,026 0 16,026 768 16,794 Exchange rate adjustments 0 296 0 0 296 0 296 Dividend paid 0 0 0 -17,037 -17,037 -1,554 -18,591
Total equity 31 October 2018 26,210 -1,690 480,820 0 505,340 4,456 509,796
STATEMENT OF CAPITAL AND RESERVES

19NOTES
Notes
Note t.DKK H1 H1 Q2 Q2 2018/19 2017/18 2018/19 2017/18
1 Financial costs Other interest expenses 1,493 1,529 721 866 Exchange rate adjustments 27 951 -252 -268 Value adjustment on liability commitment on purchase of minority entry 5,676 7,700 2,921 4,068
7,196 10,180 3,390 4,666
31/10 31/10 30/4 2018 2017 2018
2 Liability commitment relating to acquisition of minority shareholding Noncurrent At the beginning of the period 54,189 53,622 53,622 Regulation on deposit accounts 0 0 288 Regulation of the year 211 1,267 279
54,400 54,889 54,189
Current At the beginning of the period 87,089 80,720 80,720 Dividend paid -13,132 -6,811 -6,811 Regulation of the year 5,465 6,433 13,180
79,422 80,342 87,089
Long-term liabilities incorporate the value of put option on purchase of the remaining 25% of Carpet Concept. According to the contract the remaining shares of Carpet Concept will be taken over at the earliest 1 December 2021. The shares are taken over at an agreed price of DKK 58.0m (EUR 7.8m). The debt is increased/reduced yearly by the minority’s share of dividend payments.
Short-term liabilities incorporate the value of put option on purchase of the remaining 49% of Bentzon Carpets ApS and Hammer Carpets A/S. According to the contracts the remaining shares of Bentzon Carpets ApS will be taken over no later than 1 May 2020 and Hammer Carpets A/S no later than 1 October 2021. According to the contracts minorities can require redemption earlier if desired. With regard to both contracts the shares are taken over at net asset value. The debt is increased/reduced yearly by the minority’s share of the the year result and will be reduced by the minority’s share of the dividend distribution.

20 NOTES WITHOUT REFERENCE
Notes without references
As per 1 May 2018 we have established a new Group structure with 4 equal brands (areas of business) and a number of Group functions. Based on this situation the segment reporting will be adjusted to reflect the established structure.
The segmentation is prepared on the basis of the Group’s internal management reporting and is based on the individual brand (operating segment). Consolidation to reportable segments is based on differences in customers and influents.
EBIT is used as segment result. Segment information Carpet Hammer Bentzon Total reportable 2018/19 ege Concept Carpets Carpets segments
Revenue external customers 395,395 80,312 45,324 29,477 550,508 Internal revenue between segments 31,071 0 3,286 35,425 69,782
Total segment revenue 426,466 80,312 48,610 64,902 620,290
Profit from sale of assets 6 106 0 0 112 Depreciations 15,278 1,715 2,268 1,155 20,416 Segment profit before tax (EBIT) 20,621 -1,092 2,039 12,067 33,635 Segment assets 725,574 112,888 144,600 88,730 1,071,792
Carpet Hammer Bentzon Total reportable 2017/18 ege Concept Carpets Carpets segments
Revenue external customers 379,329 88,673 64,660 28,745 561,407 Internal revenue between segments 24,905 0 4,153 39,687 68,745
Total segment revenue 404,234 88,673 68,813 68,432 630,152
Profit from sale of assets 619 0 950 0 1,569 Depreciations 15,727 1,744 1,476 1,125 20,072 Segment profit before tax (EBIT) 22,359 5,141 6,026 10,481 44,007 Segment assets 660,620 104,205 143,299 90,254 998,378
21NOTES WITHOUT REFERENCE
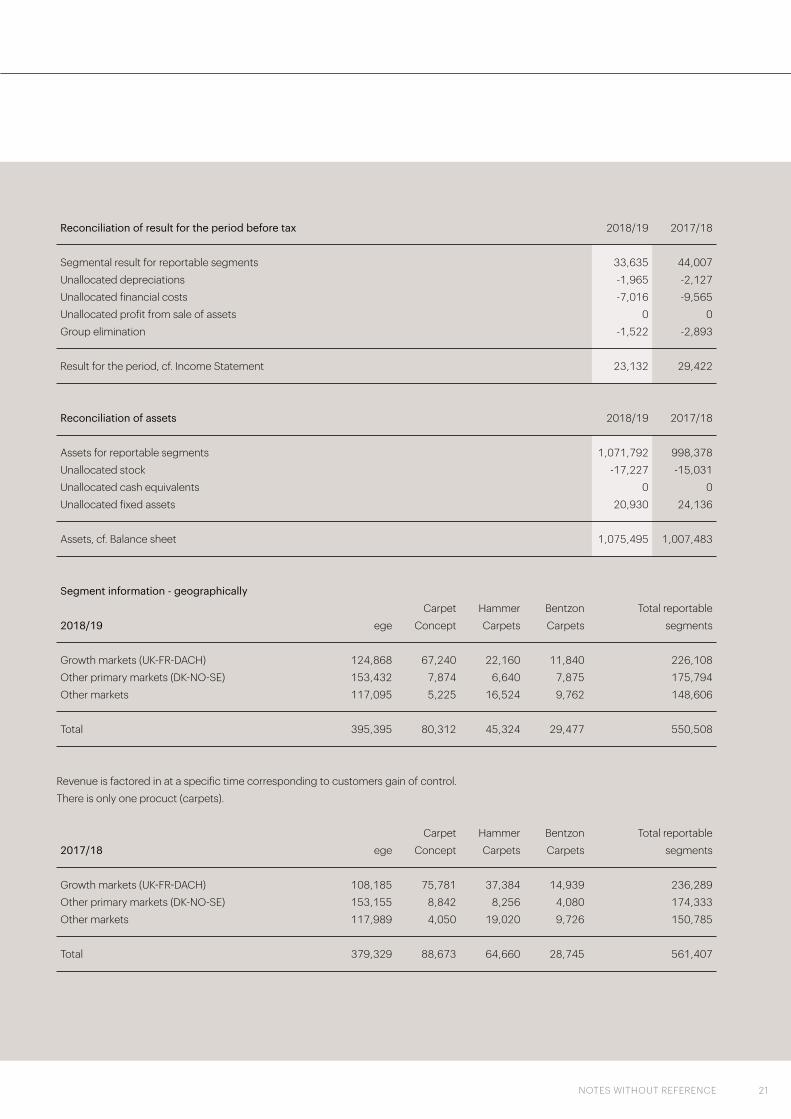
Reconciliation of result for the period before tax 2018/19 2017/18
Segmental result for reportable segments 33,635 44,007 Unallocated depreciations -1,965 -2,127 Unallocated financial costs -7,016 -9,565 Unallocated profit from sale of assets 0 0 Group elimination -1,522 -2,893
Result for the period, cf. Income Statement 23,132 29,422
Reconciliation of assets 2018/19 2017/18
Assets for reportable segments 1,071,792 998,378 Unallocated stock -17,227 -15,031 Unallocated cash equivalents 0 0 Unallocated fixed assets 20,930 24,136
Assets, cf. Balance sheet 1,075,495 1,007,483
Segment information - geographically Carpet Hammer Bentzon Total reportable 2018/19 ege Concept Carpets Carpets segments
Growth markets (UK-FR-DACH) 124,868 67,240 22,160 11,840 226,108 Other primary markets (DK-NO-SE) 153,432 7,874 6,640 7,875 175,794 Other markets 117,095 5,225 16,524 9,762 148,606
Total 395,395 80,312 45,324 29,477 550,508
Revenue is factored in at a specific time corresponding to customers gain of control.There is only one procuct (carpets).
Carpet Hammer Bentzon Total reportable 2017/18 ege Concept Carpets Carpets segments
Growth markets (UK-FR-DACH) 108,185 75,781 37,384 14,939 236,289 Other primary markets (DK-NO-SE) 153,155 8,842 8,256 4,080 174,333 Other markets 117,989 4,050 19,020 9,726 150,785
Total 379,329 88,673 64,660 28,745 561,407

www.egecarpets.com