rovio q1 2020 interim report - globenewswire
TRANSCRIPT

Rovio Entertainment Corporation
Interim Report
April 28, 2020
INTERIM REPORT FOR JANUARY-MARCH 2020

1
Improved profitability, cash flow and Angry Birds 2 performance January-March 2020 highlights • Rovio group revenue was EUR 66.6 million (70.9) and declined 6.0% year-on-year
• Group adjusted operating profit grew to EUR 13.0 million (7.5) and adjusted operating profit margin to 19.6% (10.5%) on the back of quite stable games revenues despite much lower level of user acquisition
• Games revenue declined by 5.3% year-on-year to EUR 62.7 million (66.3). In comparable currencies, games revenue declined approximately by 7%. The Games gross bookings were EUR 62.1 million (65.8) and declined 5.7% year-on-year. In comparable currencies, the gross bookings declined by approximately 8%.
• Angry Birds 2, gross bookings were EUR 25.0 million and increased slightly from Q4-19. The game has had stable revenues with continued low amount of user acquisition. Game performance improved during the quarter.
• Angry Birds Dream Blast, launched on 24th January 2019, gross bookings were EUR 16.1 million and the user acquisition investments were significantly decreased from last year’s level
• User acquisition investments were EUR 13.5 million (23.7), or 21.5% of the Games segment’s revenue (35.8%)
• Brand Licensing revenue was EUR 3.9 million (4.6) and declined 15.9% year-on-year
• Group adjusted operating profit excluding Hatch Entertainment was EUR 15.8 million (9.3) and adjusted operating profit margin 23.7% (13.1%)
• Operating cash flow was EUR 11.5 million (3.3)
• Earnings per share was EUR 0.11 (0.08)
Key figures 1-3/ 1-3/ Change, 1-12/ EUR million 2020 2019 % 2019
Revenue 66.6 70.9 -6.0% 289.1
EBITDA 15.9 10.5 51.4% 32.3
EBITDA margin 23.8% 14.8% - 11.2%
Adjusted EBITDA 16.2 10.5 54.4% 32.6
Adjusted EBITDA margin, % 24.3% 14.8% - 11.3%
Operating profit 12.7 7.5 70.6% 18.1
Operating profit margin, % 19.1% 10.5% - 6.3%
Adjusted operating profit 13.0 7.5 74.8% 18.3
Adjusted operating profit margin, % 19.6% 10.5% - 6.3%
Profit before tax 11.5 7.5 52.8% 17.7
Capital expenditure 0.8 0.7 18.7% 3.1
User acquisition 13.5 23.7 -43.3% 99.7
Return on equity (ROE), % 13.3% 19.5% - 10.8%
Net gearing ratio, % -69.5% -67.4% - -65.7%
Equity ratio, % 80.8% 78.4% - 80.5%
Earnings per share, EUR 0.11 0.08 50.4% 0.17
Earnings per share, diluted EUR 0.11 0.07 51.9% 0.17
Net cash flows from operating activities 11.5 3.3 253.8% 10.5
Employees (average for the period) 466 422 10.4% 450
2
Unless otherwise stated, the comparison figures in brackets refer to the corresponding period in the previous year. Calculations and definitions are presented in the Performance Measures section.
The changes in comparable currencies have been calculated by translating the reporting period figures with the average USD/EUR exchange rates of the comparison period for the US dollar dominated in-app-purchases in United States and global ad network sales.
Kati Levoranta, CEO: Rovio’s first quarter of 2020 was characterized by an improvement in profitability and operating cash
flow. Group adjusted operating profit increased to EUR 13.0 million (7.5) or 19.6% margin (10.5) year-on-year. Operating cash flow increased to EUR 11.5 (3.3) million and was driven by the improved profitability. The group revenue was EUR 66.6 (70.9) million, which declined by 6.0% year-on-year.
The high operating profit of the quarter was driven by the low level of user acquisition and the stability of our key games, especially Angry Birds 2. We introduced a series of updates for Angry Birds 2, Angry Birds Dream Blast and Sugar Blast that were well received by the players. As a result, the performance of these games improved gradually during the quarter.
In the beginning of the first quarter we scaled down user acquisition to meet our payback targets and the daily user acquisition investments were quite stable throughout the quarter. Now as we have entered the second quarter, the user acquisition has continued at a similar level. We are ready to invest more in user acquisition when we see an opportunity in the market, improvement in live games performance and when we launch new games.
Brand Licensing performed in line with our expectations: revenue was lower year-on-year while being profitable. The highlight for the Brand Licensing in the quarter was the announcement of a new long-form Angry Birds animation series with Netflix, scheduled to be released in 2021.
During the first quarter, several new game concepts were added to the early phase of our roadmap. Additionally, we had new games entering the marketability test. These are part of our continuous effort to build and maintain a healthy game pipeline - a key enabler for long-term growth. We are also happy to announce the launch of our next game, Small Town Murders, which is scheduled for launch in June 2020. The game is a new IP puzzle game embedded in a narrative of mysteries.
Rovio has taken the Covid-19 and the impact it has had on individuals and society very seriously. It has been our top priority to minimize the risk of the pandemic to our employees and to our business. On March 12th, we instructed everyone at Rovio to work from home until further notice to safeguard the health of our employees and business continuity. Nevertheless, we have continued during this time to hire new talent to strengthen our competence
In our games, we have seen an increase in the number of downloads as well as user engagement and also some uptick in revenues in March and April. However, it is too early to quantify and distinguish the impact of the corona pandemic and game improvements.
We are grateful for all Rovians for the fast transformation to “working from home -mode” and the continued positive spirit during these challenging times.

3
Outlook for 2020 (unchanged) During 2020 we aim to launch 1-3 new games. The timing of new game launches depends on how the
games progress in soft launch. Therefore, we do not give a full year 2020 revenue guidance. We start the year at a lower user acquisition level than we ended last year. Due to lower user acquisition investments and the planned cost savings in Hatch Entertainment Ltd., our adjusted operating profit improves.
Basis for outlook Our strategy is to seek growth in the Games business through improving the performance of our key
games and developing new games. Brand Licensing segment is optimized for profit at a lower revenue which is expected to decline
approximately 50% year-on-year in 2020. Hatch Entertainment annualized expenses are expected to be approximately EUR 5 million (2019: EUR
10.9 million) on an adjusted basis after restructuring and aligning with its new strategy. More detailed outlook per games category is given below: Grow: We believe Angry Birds Dream Blast will grow on an annual basis but starts the year at a lower
quarterly run-rate compared to the end of 2019. The game has a strong feature roadmap focusing on improvements to long term retention and monetization. We are continuing to develop Sugar Blast through live operations for its core audience and improve retention and monetization in order to scale the game up.
Earn: The revenues of Angry Birds 2 stabilized despite much lower user acquisition investments y-on-y. We further focus on improving the performance of the game through introducing new updates that increase engagement with our core users. The revenue of other games (Angry Birds Match, Angry Birds Friends and Angry Birds Pop) is expected to continue decline at a steady slow pace. We have lowered or stopped user acquisition investments into these three games.
Catalogue: We expect these games to continue declining over time. They still receive substantial organic downloads, but the active user base and revenues are expected to decline over time as we do not develop these games further.
New games: We aim to launch 1-3 new games in 2020. Currently we have three games in soft launch and several games in other phases of production.
Games in soft launch are available in a selected number of countries and operated with a limited number of gamers. Soft launch games have advanced far in the game development process. They are being tested and developed in order to verify their commercial potential and scalability. There is no guarantee that games in soft launch will be published.

4
Audiocast and conference call: Rovio will host an English language audiocast and conference call on the first quarter 2020 financial
results, including a Q&A session for analysts, media and institutional investors at 14:00-15:00 EEST on April 28, 2020. The audiocast can be viewed live at: https://investors.rovio.com/en , and later on the same day as a recording.
Conference call details: PIN: 76415854# Finland Toll: +358 981 710 310 Sweden Toll: +46 856 642 651 United Kingdom Toll: +44 333 300 0804 United States +1 855 857 0686
More information: Kati Levoranta, CEO, tel. +358 40 485 8985 René Lindell, CFO, tel. +358 40 485 8985 Distribution: Nasdaq Helsinki, key media, www.rovio.com
Rovio in brief Rovio Entertainment Corporation is a global, games-first entertainment company that creates,
develops and publishes mobile games, which have been downloaded 4.5 billion times so far. Rovio is best known for the global Angry Birds brand, which started as a popular mobile game in 2009, and has since evolved from games to various entertainment and consumer products in brand licensing. Today, Rovio offers multiple mobile games, animations and has produced The Angry Birds Movie, which opened number one in theatres in 50 countries. Its sequel, The Angry Birds Movie 2, released worldwide in August 2019. Rovio is headquartered in Finland and the company's shares are listed on the main list of NASDAQ Helsinki stock exchange with the trading code ROVIO. (www.rovio.com )

5
Rovio Entertainment Corporation Interim Report 1–3/2020
A description of the accounting standards applied in the preparation of this Interim Report is provided in the notes to this Interim Report, in Note 1 Accounting principles.
Market review According to market intelligence provider Newzoo’s latest global games market report published in
March 2020, the global mobile gaming market size in end-user generated revenue was estimated to be USD 68.2 billion in 2019 which represented 9.7% year-on-year growth. In 2020, Newzoo estimates the global mobile gaming market to grow by 11.6% to USD 76.1 billion. The higher growth rate in 2020 compared to 2019 is driven by higher growth expectations for the North America, Middle East and China. Especially the Chinese market is expected to grow faster and return to double-digit annual growth.
In the long-term, the global mobile gaming market is expected to continue its double-digit growth of 10.8% CAGR during 2018-2022. The Western market is expected to grow at 9.2% CAGR during 2018-2022.
During the coronavirus pandemic the gaming market has continued to grow, and market intelligence providers have not changed their market growth estimates.
Revenue and result
January-March 2020 In the first quarter 2020, Rovio group revenue declined 6.0% year-on-year to EUR 66.6 million (70.9). The Games segment revenue declined 5.3% year-on-year and amounted to EUR 62.7 million (66.3). In
comparable currencies, games revenue declined by approximately 7%. During the comparable period January-March 2019, the revenue was higher on the back of high user acquisition investments for Angry Birds 2 during 2018 as well as due to successful launch of new game Angry Birds Dream Blast.
In the reporting period, the gross bookings of Rovio’s largest game Angry Birds 2 were EUR 25.0 million and grew somewhat from the previous quarter (2019 Q4: EUR 24.9 million). Rovio’s second largest game Angry Birds Dream Blast declined in the reporting period and reached gross bookings of EUR 16.1 million (2019 Q4: EUR 18.8 million) due to significantly lower user acquisition investments.
The revenue of the Brand Licensing segment was EUR 3.9 million (4.6) and declined 15.9% year-on-year. The revenue consisted of EUR 2.4 million (3.2) from Content Licensing, the majority of which was income from the first Angry Birds movie, and EUR 1.4 million (1.4) from Consumer Products.
The Group’s adjusted EBITDA was EUR 16.2 million (10.5), or 24.3% (14.8%) of revenues. The Group’s adjusted operating profit was EUR 13.0 million (7.5) and adjusted operating profit margin
19.6% (10.5%). Excluding Hatch Entertainment cost, the Group’s adjusted profit was EUR 15.8 million (9.3) and adjusted operating profit margin 23.7% (13.1%). The adjustments during the reporting period amounted to EUR 0.3 million and were related to the restructuring of Brand Licensing and Hatch Entertainment. There were no adjustments in the comparable period.
The Games segment’s adjusted EBITDA was EUR 17.8 million (11.2) or 28.4% (16.8%) of revenues. Games EBITDA margin was higher compared to last year due to significantly lower user acquisition investments in the reporting period: EUR 13.5 million (23.7) or 21.5% of revenues (35.8%) as well due to quite stable revenues despite lower user acquisition.
The Brand Licensing segment’s adjusted EBITDA was EUR 2.6 million (2.5) and adjusted EBITDA margin was 66.4% (54.1%). The higher adjusted EBITDA margin was due to lower operating expenses.
The Group’s profit before taxes was EUR 11.5 million (7.5) and earnings per share EUR 0.11 (0.08).

6
Financing and investments Rovio’s capital expenditure was EUR 0.8 million (0.7) in the first quarter of 2020. In the first quarter of
2019, Rovio announced a USD 3.0 million investment in a gaming startup focused venture capital fund managed by Play Ventures. The second instalment of USD 0.6 million (EUR 0.5 million) was invested during the reporting period. After the second instalment, total investment for the fund was USD 1.5 million (EUR 1.3 million).
Rovio refers to the user acquisition costs of the Games segment as investments, but pursuant to accounting regulations, they are recognized as expenses rather than investments due to their average payback period being about a year.
The Games segment’s capital expenditure was EUR 0.6 million (0.1) in the first quarter and related to external game development. Brand Licensing Unit capital expenditure was EUR 0.1 million (0.0) and related to external TV animated series development. The Other-segment’s investments were EUR 0.1 million (0.5) for the quarter and consisted mainly of machinery and equipment.
Cash flow from financing amounted to EUR -14.6 million (3.0) in the first quarter and consisted mainly of acquisition costs of treasury shares of EUR 11.1 million, repayment of Hatch Entertainment’s convertible note to NTT DoCoMo Ventures of EUR 3.0 million and EUR 0.7 million of finance lease repayments.
At the end of the first quarter, Rovio’s total interest-bearing loans and financial liabilities amounted to EUR 10.5 million (16.4) consisting of EUR 3.2 million product development loans from Business Finland (the Finnish Funding Agency for Innovation) and EUR 7.3 million leasing liabilities.
Rovio’s cash and cash equivalents at the end of the review period amounted to EUR 121.1 million (128.8).
Development per business segment
Games
January-March 2020 The Games segment’s revenue in the reporting period amounted to EUR 62.7 million (66.3), a year-on-
year decline of 5.3%. In comparable currencies, the revenue decreased approximately by 7%. Angry Birds 2 remained Rovio’s biggest game. After stabilizing revenues in Q4 2019, its gross bookings
increased slightly in Q1 2020 to EUR 25.0 million. Rovio’s top five games remained unchanged from the previous quarter and were Angry Birds 2, Angry Birds Dream Blast, Angry Birds Friends, Angry Birds Match and Angry Birds Pop.
The Games segment’s EBITDA increased by 59.4% and was EUR 17.8 million (11.2). The EBITDA increase was a mainly a result of reduced user acquisition investments in the reporting period as well as good stability of revenues despite the lower level of user acquisition.
The Games segment’s user acquisition investments were reduced to EUR 13.5 million (23.7), or 21.5% (35.8%) of the Games segment’s revenue in the reporting period to adhere with the 12-month payback requirement. The largest reduction was for Angry Birds Dream Blast while for Angry Birds 2, the user acquisition investments were at the same level as in the previous quarter. Towards the end of the reporting period, the user acquisition for the Angry Birds 2 started to slightly increase as paybacks were on target.

7
The user acquisition investments in the first quarter were divided between the different categories of games as follows: 66.2% into the “Grow” games (Angry Birds Dream Blast and Sugar Blast) and 33.6% into the “Earn” games (Angry Birds 2, Angry Birds Match, Angry Birds Friends and Angry Birds Pop), of which majority into Angry Birds 2.
The Games segment’s capital expenditure in the reporting period amounted to EUR 0.6 million (0.1) EUR million
1-3/ 2020
1-3/ 2019
Change, %
1–12/ 2019
Gross bookings 62.1 65.8 -5.7% 263.2
Revenue 62.7 66.3 -5.3% 264.8
Adjusted EBITDA 17.8 11.2 59.4% 35.6
Adjusted EBITDA margin, % 28.4 % 16.8% 13.4%
EBITDA 17.8 11.2 59.4% 35.6
EBITDA margin, % 28.4 % 16.8% 13.4%
User acquisition 13.5 23.7 -43.3% 99.7 User acquisition share of revenue, % 21.5 % 35.8% 37.7%
Capital expenditure 0.6 0.1 383.4% 1.1
Key performance indicators of the Games segment The key performance indicators of the Games segment use gross bookings in place of revenue as it
gives a more accurate view of Rovio’s operating performance at a specific point in time. Gross bookings represent in-app purchases and in-app advertising sales in the given calendar month, reported based on the date of purchase/sale. Gross bookings do not include revenue from custom contracts, revenue deferrals or accounting adjustments due to, for example, foreign exchange rate differences between revenue accruals and actual payments, and thus differ from the reported revenue. The reconciliation of gross bookings to revenue is presented in the notes.
In the first quarter of 2020, the Games segment’s gross bookings decreased by 5.7% to EUR 62.1 million (65.8) and by approximately 8% year-on-year in comparable currencies.
The number of active users decreased after the user acquisition investments were reduced in the quarter as well as due to some older games (Angry Birds Rio, Angry Birds Star Wars 1 & 2) being removed from the application stores. Angry Birds 2 daily active users (DAU) increased slightly, but for the rest of the portfolio, the DAU decreased. The change was especially visible in Angry Birds Dream Blast, where also the user acquisition was most reduced.
The amount of daily active users for the top 5 games decreased from Q4 to Q1 from 4.1 to 3.7 million and for the total portfolio from 5.9 to 5.4 million.
The amount of monthly unique payers (MUP) followed the same trend and decreased slightly from the fourth quarter 497 thousand to 454 thousand for the whole portfolio and from 426 thousand to 393 thousand for the top 5 games.
The decline in player base impacted the monetization KPI’s and the average revenue per daily active user (ARPDAU) improved from the previous quarter for the top 5 games from 15 cents to 16 cents and for all games from 12 cents to 13 cents.

8
EUR million 1-3/2020 10-12/2019 7-9/2019 4-6/2019 1-3/2019 10-12/2018
Gross bookings top 5 53.7 57.6 57.3 56.7 56.1 57.7
Gross bookings total 62.1 67.0 65.1 65.2 65.8 66.7
Million 1-3/2020 10-12/2019 7-9/2019 4-6/2019 1-3/2019 10-12/2018
DAU top 5 3.7 4.1 3.8 3.4 3.5 3.5
DAU all 5.4 5.9 5.9 6.6 7.0 7.0
MAU top 5 19.7 21.0 20.7 16.2 17.1 18.0
MAU all 36.5 37.3 40.7 45.3 49.3 50.1 Thousand 1-3/2020 10-12/2019 7-9/2019 4-6/2019 1-3/2019 10-12/2018
MUP top 5 393 426 428 394 422 444
MUP all 454 497 489 460 495 504
EUR 1-3/2020 10-12/2019 7-9/2019 4-6/2019 1-3/2019 10-12/2018
ARPDAU top 5 0.16 0.15 0.16 0.18 0.18 0.18 ARPDAU all 0.13 0.12 0.12 0.11 0.10 0.10
MARPPU top 5 39.6 38.3 38.0 41.5 39.0 38.7
MARPPU all 39.6 38.3 37.7 40.4 38.5 38.9
Game-specific performance in the Games segment Angry Birds 2, released in 2015, remained the biggest game in Rovio’s portfolio. Its gross bookings
increased from the previous quarter by 0.5% to EUR 25.0 million. The year-on-year decline of 21.7% was due to much lower user acquisition investments during the quarter and the end of 2019.
Rovio’s second biggest game in the reporting period was Angry Birds Dream Blast, a puzzle game released in January 2019. The gross bookings of Angry Birds Dream Blast in the first quarter were EUR 16.1 million, increasing significantly year-on-year, but declining from the fourth quarter’s EUR 18.8 million, due to lower user acquisition investments.
Rovio’s third biggest game in the reporting period was Angry Birds Friends, which was released already in 2012. Angry Birds Friends’ gross bookings were EUR 5.6 million (7.2).
Angry Birds Match, a puzzle game released in 2017, recorded gross bookings of EUR 4.4 million (6.8), and was Rovio’s fourth biggest game in the quarter. The drop in Angry Birds Match revenue was due to lower user acquisition investments.
Angry Birds Pop, released in 2015, remained Rovio’s fifth biggest game in the reporting period. The gross bookings of Angry Birds Pop were EUR 2.6 million (3.3) and were stable quarter-on-quarter.
Sugar Blast, which was launched in September 2019, generated EUR 2.3 million gross bookings in the first quarter, increasing from EUR 2.2 million in Q4 and was Rovio’s sixth largest game and has scaled up slower than expected.
The Other games category includes less actively maintained titles of Rovio’s game portfolio and generated total gross bookings of EUR 6.1 million during the quarter (9.7).
Gross bookings, EUR million
1-3/2020
10-12/2019 7-9/2019 4-6/2019 1-3/2019 10-12/2018
AB 2 25.0 24.9 25.0 26.5 32.0 35.2
AB Dream Blast 16.1 18.8 17.8 14.0 6.9 0.5
AB Friends 5.6 5.9 6.2 6.6 7.2 7.9
AB Match 4.4 5.3 5.7 6.6 6.8 6.7
AB Pop 2.6 2.7 2.7 3.0 3.3 3.8 Sugar Blast 2.3 2.2 0.5
Other games 6.1 7.3 7.3 8.5 9.7 12.7
Total 62.1 67.0 65.1 65.2 65.8 66.7
9
Brand Licensing
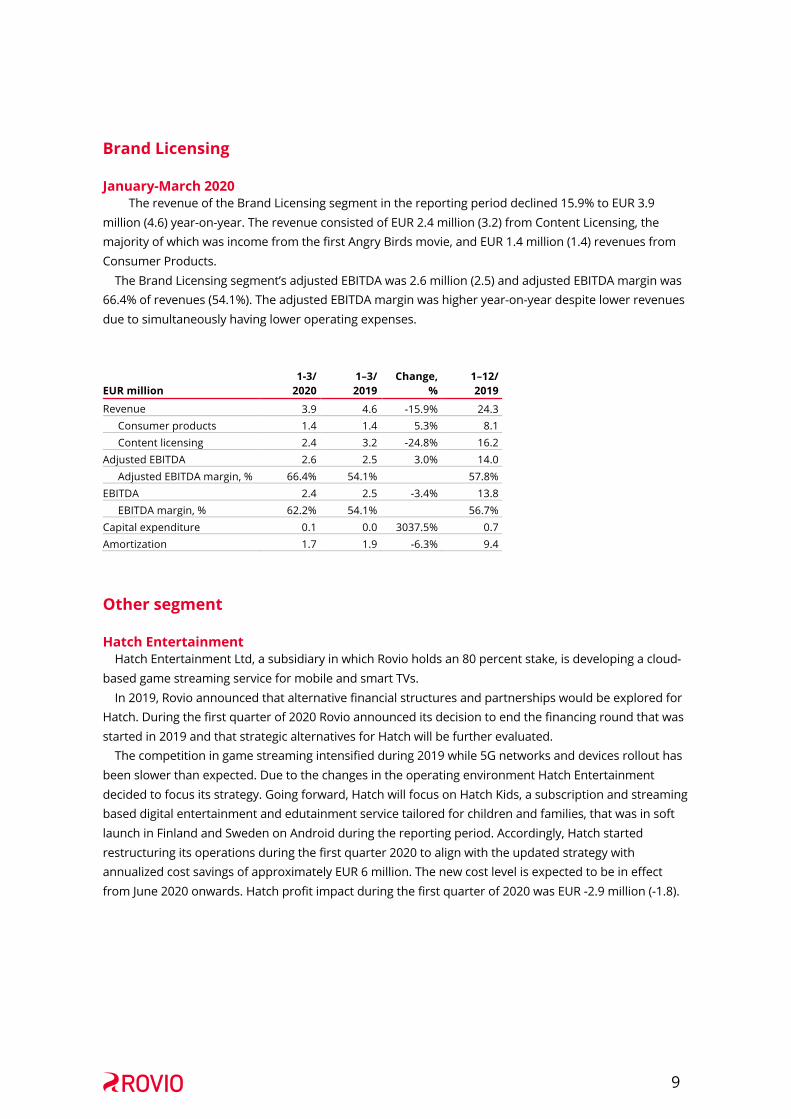
January-March 2020 The revenue of the Brand Licensing segment in the reporting period declined 15.9% to EUR 3.9
million (4.6) year-on-year. The revenue consisted of EUR 2.4 million (3.2) from Content Licensing, the majority of which was income from the first Angry Birds movie, and EUR 1.4 million (1.4) revenues from Consumer Products.
The Brand Licensing segment’s adjusted EBITDA was 2.6 million (2.5) and adjusted EBITDA margin was 66.4% of revenues (54.1%). The adjusted EBITDA margin was higher year-on-year despite lower revenues due to simultaneously having lower operating expenses.
EUR million 1-3/
2020 1–3/ 2019
Change, %
1–12/ 2019
Revenue 3.9 4.6 -15.9% 24.3 Consumer products 1.4 1.4 5.3% 8.1 Content licensing 2.4 3.2 -24.8% 16.2
Adjusted EBITDA 2.6 2.5 3.0% 14.0 Adjusted EBITDA margin, % 66.4% 54.1% 57.8%
EBITDA 2.4 2.5 -3.4% 13.8 EBITDA margin, % 62.2% 54.1% 56.7%
Capital expenditure 0.1 0.0 3037.5% 0.7 Amortization 1.7 1.9 -6.3% 9.4
Other segment
Hatch Entertainment Hatch Entertainment Ltd, a subsidiary in which Rovio holds an 80 percent stake, is developing a cloud-
based game streaming service for mobile and smart TVs. In 2019, Rovio announced that alternative financial structures and partnerships would be explored for
Hatch. During the first quarter of 2020 Rovio announced its decision to end the financing round that was started in 2019 and that strategic alternatives for Hatch will be further evaluated.
The competition in game streaming intensified during 2019 while 5G networks and devices rollout has been slower than expected. Due to the changes in the operating environment Hatch Entertainment decided to focus its strategy. Going forward, Hatch will focus on Hatch Kids, a subscription and streaming based digital entertainment and edutainment service tailored for children and families, that was in soft launch in Finland and Sweden on Android during the reporting period. Accordingly, Hatch started restructuring its operations during the first quarter 2020 to align with the updated strategy with annualized cost savings of approximately EUR 6 million. The new cost level is expected to be in effect from June 2020 onwards. Hatch profit impact during the first quarter of 2020 was EUR -2.9 million (-1.8).

10
Consolidated statement of financial position Consolidated statement of financial position. EUR million 31 Mar 2020 31 Mar 2019 31 Dec 2019
Non-current assets 44.0 52.9 44.9 Current receivables 40.1 43.8 47.6 Cash and cash equivalents 121.1 128.8 124.7 Total assets 205.2 225.6 217.3 Equity 159.1 166.9 168.0 Financial liabilities 10.5 16.4 14.4 Advances received and deferred income 8.2 12.6 8.6 Other payables 27.4 29.7 26.3 Total equity and liabilities 205.2 225.6 217.3
Rovio’s consolidated statement of financial position amounted to EUR 205.2 million on March 31, 2020
(225.6), with equity representing EUR 159.1 million (166.9) of the total. Cash and cash equivalents amounted to EUR 121.1 million (128.8). The cash deposits amounted to EUR 52.7 million and the cash equivalents to EUR 68.4 million, consisting of investments in money market funds. The change in cash and cash equivalents was mainly attributable to cash from operating activities amount of EUR 11.5 million that were negatively offset by acquisition of treasury shares EUR 11.1 million and repayment of the convertible note to NTT DoCoMo Ventures amount of EUR 3.0 million.
Total advances received, and deferred income were 8.2 million (12.6). On March 31, 2020 Rovio’s non-current assets were EUR 44.0 million (52.9). The intangible asset
decrease is due to amortization, mainly of development expenses of the first Angry Birds Movie. Rovio recognizes amortization on the first Angry Birds movie in each reporting period in an amount that corresponds to 67% of movie’s revenue for the period. Amortization for the Angry Birds Movie 2 corresponds to 100% of the movie’s revenue for the period.
Rovio’s net debt on March 31, 2020 amounted to negative EUR 110.6 million. Rovio’s debt consisted of loans from Business Finland (the Finnish Funding Agency for Innovation) of EUR 3.2 and EUR 7.3 million in leasing debt.
Cash flow and financing Consolidated statement of cash flows, EUR million 1-3/2020 1-3/2019
1–12/2019
Cash flow from operating activities 11.5 3.3 10.5
Cash flow from investing activities -1.3 -1.4 -3.9
Cash flow from financing activities -14.6 3.0 -6.1 Change in cash and cash equivalents -4.4 4.8 0.6
Net foreign exchange difference 0.8 0.4 0.5
Cash and cash equivalents at the beginning of the period 124.7 123.6 123.6 Cash and cash equivalents at the end of the period 121.1 128.8 124.7
Rovio’s net cash flow from operating activities amounted to EUR 11.5 million (3.3) in the first quarter.
The increase year-on-year was mainly attributable to the increased profit in the reporting period. Cash flows used in investing activities amounted to EUR -1.3 million (-1.4) in the first quarter. The cash
flows used in investing activities were driven by Play Ventures investment of EUR 0.5 million, capital expenditure in Brand Licensing - segment of EUR 0.1 million in TV animation series development, investments in Games -segment of EUR 0.6 million and Other-segment of EUR 0.1 million.
Cash flows used in financing activities amounted to EUR -14.6 million (3.0) in the first quarter. The cash flows used in financing activities in the first quarter 2020 were mainly due to acquisition of treasury shares in total of EUR 11.1 million, repayment of EUR 3.0 million convertible note to NTT DocoMo Ventures from Hatch Entertainment, and finance lease repayments.

11
Personnel From January to March 2020, Rovio’s average number of employees was 466 (422). Games business
unit employed 366 people (324), Brand Licensing business unit 21 people (31), administrative functions 38 (35) and Hatch Entertainment 41 (32).
1-3/
2020 1-3/
2019 Change,
% 1–12/ 2019
Employees (average for the Period) 466 422 10.4% 450 Employees (end of period) 462 426 8.5% 466
Flagging notifications Rovio did not receive any flagging notifications during the reporting period.
Shares and shareholders On March 31, 2020, Rovio’s share capital amounted to EUR 0.7 million and the number of shares was
81,268,111. The shareholdings of the 10 largest shareholders are presented in the table below (nominee-registered
holdings excluded). Oivor AB’s shareholding is nominee-registered and not explicitly shown in the table. On March 31, 2020 Rovio Entertainment Corporation held 4,303,502 of its own shares.
Shareholder
Number of Shares
Percentage of shares
and votes Rovio Entertainment Oyj 4,303,502 5.3% Hed Niklas Peter 1,921,746 2.4%
Ilmarinen Mutual Pension Insurance Company 1,700,000 2.1%
Danske Invest Finnish Institutional Equity Fund 1,160,000 1.4%
Vesterbacka Jan-Peter Edvin 1,064,579 1.3%
Elo Mutual Pension Insurance Company 1,003,004 1.2% The State Pension Fund 1,000,000 1.2%
Sijoitusrahasto Aktia Capital 875,074 1.1%
Sijoitusrahasto Aktia Nordic Small Cap 534,196 0.7%
Säästöpankki Kotimaa 506,567 0.6%
Total 14,068,668 17.3%
Other shareholders 67,199,443 82.7%
Number of shares total 81,268,111 100% A monthly updated table of Rovio’s shareholders is available online at
https://investors.rovio.com/en/share-shareholders/major-shareholders
12
Share-based incentive program Rovio has a long-term incentive program that consists of an option plan for all employees, including
the CEO and Rovio’s management, and a restricted share plan for selected key employees. The option plan provides for the issuance of up to 5,000,000 options. Each option entitles its holder to
subscribe for one share. The option plan includes three lots of options that can be allocated to 2017, 2018, and 2019. Options have a vesting period of two years. The subscription price for the 2017 options is the share price in Rovio’s Initial Public Offering. The subscription price for the 2018 options is the trading volume-weighted average quotation of the shares on Nasdaq Helsinki during May 2 -31, 2018, and, for the 2019 options, the trading volume-weighted average quotation of the shares on Nasdaq Helsinki during May 2 -31, 2019.
A total of 853 150 options were allocated under the 2017 option program as of March 31, 2020, a total of 927 750 options were allocated under the 2018 option program as of March 31, 2020 and a total of 1 116 500 options were allocated under the 2019 option program as of March 31, 2020.
The option plan participants can execute their reward during a one-year subscription period following each vesting period through either subscribing for shares or selling options. The option plan participants generally lose the right to their reward if their employment terminates during the vesting period.
The restricted share plan is constructed as a restricted share pool from which a predetermined number of Rovio shares can be allocated to a limited number of selected key employees. The Company’s Board of Directors decides for each participant separately the length of the restricted period (1–3 years) relating to the shares allocated to the employee under the restricted share plan. The restricted share plan participants must be working at Rovio when the shares are transferred. The maximum number of shares that can be distributed through the restricted share plan is 1,300,000. Once the maximum number of shares has been allocated, the Board of Directors can decide on a new maximum number. A total of 370 845 rights entitling to shares had been allocated under the restricted share plan as of March 31, 2020.
On January 24, 2020 Rovio Entertainment Corporation announced that the Company has decided to
establish a performance share plan for key employees including CEO and members of the leadership team. The objective of the Performance Share Plan is to motivate the key employees to work to increase shareholder value in the long term by offering them a share-based reward for achieving the set performance criteria established by the Board of Directors of Rovio. The Performance Share Plan consists of three (3) annually commencing performance periods, covering the consecutive calendar years of 2020, 2021 and 2022. Each performance period is directly followed by a one-year waiting period. Waiting periods cover calendar years 2021, 2022 and 2023. The Performance Share Plan offers the participants a possibility to earn shares for reaching the required levels set for the performance criteria.
The performance criteria for the plan are Rovio’s Adjusted Operating Profit (EBIT, %, Hatch Entertainment Ltd. excluded) and Relative Games Revenue Growth (%). The required performance levels will be decided by the Rovio Board of Directors on annual basis for each performance period at a time. The potential rewards will be paid partly in shares and partly in cash after the end of each relevant waiting period in spring 2022, 2023 and 2024. The cash proportion is intended to cover taxes and tax-related costs arising from the rewards. As a rule, no reward will be paid if a participant´s employment or service ends before the reward payment. The rewards to be paid on the basis of the performance period 2020 correspond to the value of an approximate maximum total of 738,000 Rovio Entertainment Corporation shares, including the proportion to be paid in cash.

13
On January 24, 2020 Rovio Entertainment Corporation announced that the Company establishes an Employee Share Savings (ESS) program. The objective of the ESS Plan is to motivate employees to invest in Rovio shares by offering them additional shares in relation to their investment after a designated holding period.
The ESS Plan consists of annually commencing plan periods, each one consisting of a 12-month savings period and a holding period following the savings period. The ESS plan is offered to approximately 460 Rovio employees, excluding employees in China, United States, United Kingdom and Hatch Entertainment Ltd.
The employees will have an opportunity to save a proportion of their salaries and invest those savings in Rovio shares. The savings will be used for acquiring Rovio shares quarterly after the publication dates of the respective interim reports. Dividends paid for the shares will be reinvested in additional shares to be purchased from the market on the next potential acquisition date. As a reward for the commitment, Rovio grants the participating employees one free matching share (gross) for every two savings shares acquired with their savings, including the proportion to be paid in cash to cover applicable taxes and tax-related costs. The prerequisites for receiving the matching shares are continued employment and holding of savings shares until the end of the holding period. In the first plan period, the savings shares and the matching shares will be acquired by purchasing shares from the market.
Participation in the ESS plan is voluntary and the employees will be invited to participate in one plan period at a time. The first plan period commences on April 1, 2020 and ends on August 31, 2022. The holding period of the first plan period ends on August 31, 2022, after which matching shares will be paid out as soon as practicably possible. The total amount of all savings during the plan period may not exceed 2,100,000 euros. The Board of Directors will decide on potential following plan periods and their details separately.
Risks As a result of the worldwide coronavirus pandemic COVID-19 the company’s business environment has
changed, and changes are expected to continue. The pandemic and especially the impact it has on the global economy, may affect Rovio’s business and business performance either directly or indirectly.
The Company’s liquidity and cash flow is strong, and the profitability outlook remains positive, which enables the Company to continue to execute its business in accordance with its strategy.
Based on the Company’s assessment, there were no material changes in the risks and uncertainties during the review period.
The most significant risks are related to the financial performance of Rovio’s top games in the market, the continuous development of these games, and ability to develop new successful games. Risks in user acquisition relate to the accuracy of the profit models and the impact on the Group’s net profit. New games introduced by competitors and changes in the competitive landscape may also impact the success of Rovio’s games revenues, size of user acquisition investments, and the Group’s profit. Changes in governmental regulations in different countries can have both short- and long-term implications for the business.
Other significant risks relate to the demand for Angry Birds branded consumer products and other content that may impact the revenues of the Brand Licensing business unit.
The Company engages in business in several currencies, with the euro and U.S. dollar being the most significant. Fluctuations in exchange rates, particularly between the euro and the U.S. dollar could have a material impact on the Company’s result.
More details on the risks, uncertainties, and Rovio’s risk management can be found online at www.rovio.com and in the most recent published financial statements.

14
Outlook for 2020 (unchanged) During 2020 we aim to launch 1-3 new games. The timing of new game launches depends on how the
games progress in soft launch. Therefore, we do not give a full year 2020 revenue guidance. We start the year at a lower user acquisition level than we ended last year. Due to lower user acquisition investments and the planned cost savings in Hatch Entertainment Ltd., our adjusted operating profit improves.
Basis for outlook Our strategy is to seek growth in the Games business through improving the performance of our key
games and developing new games. Brand Licensing segment is optimized for profit at a lower revenue which is expected to decline
approximately 50% year-on-year in 2020. Hatch Entertainment annualized expenses are expected to be approximately EUR 5 million (2019: EUR
10.9 million) on an adjusted basis after restructuring and aligning with its new strategy. More detailed outlook per games category is given below: Grow: We believe Angry Birds Dream Blast will grow on an annual basis but starts the year at a lower
quarterly run-rate compared to the end of 2019. The game has a strong feature roadmap focusing on improvements to long term retention and monetization. We are continuing to develop Sugar Blast through live operations for its core audience and improve retention and monetization in order to scale the game up.
Earn: The revenues of Angry Birds 2 stabilized despite much lower user acquisition investments y-on-y. We further focus on improving the performance of the game through introducing new updates that increase engagement with our core users. The revenue of other games (Angry Birds Match, Angry Birds Friends and Angry Birds Pop) is expected to continue decline at a steady slow pace. We have lowered or stopped user acquisition investments into these three games.
Catalogue: We expect these games to continue declining over time. They still receive substantial organic downloads, but the active user base and revenues are expected to decline over time as we do not develop these games further.
New games: We aim to launch 1-3 new games in 2020. Currently we have three games in soft launch and several games in other phases of production.
Games in soft launch are available in a selected number of countries and operated with a limited number of gamers. Soft launch games have advanced far in the game development process. They are being tested and developed in order to verify their commercial potential and scalability. There is no guarantee that games in soft launch will be published.

15
Decisions of the Annual General Meeting and the organizing meeting of the Board of Directors
The Annual General Meeting of Rovio Entertainment Corporation was held on March 31, 2020. Strict precautionary measures were taken to ensure safety at the meeting despite the corona virus epidemic while at the same time ensuring the shareholders' possibility to exercise their rights.
The Annual General Meeting adopted all the proposals to the General Meeting by the Board of Directors, approved the financial statements for the financial year 2019, approved the remuneration policy for the company’s governing bodies and discharged the company's management from liability.
The Annual General Meeting decided that the Board of Directors shall comprise seven (7) members. Mr. Kaj Hed, Ms. Camilla Hed-Wilson, Mr. Kim Ignatius, Mr. Fredrik Löving, Mr. Jeferson Valadares, Mr. Björn Jeffery and Ms. Leemon Wu were elected members of the Board of Directors for the term of office ending at the closure of the Annual General Meeting in 2021.Mr. Kim Ignatius was elected Chairman of the Board of Directors. Mr. Kaj Hed was elected Vice Chairman of the Board of Directors.
The remuneration of the members of the Board of Directors was kept unchanged and monthly remuneration will be paid as follows: to the Chairman of the Board of Directors EUR 9,500, to the Vice Chairman of the Board of Directors EUR 7,500, to the other members of the Board of Directors EUR 5,000 each, and as additional monthly compensation to the Chairman of the Audit Committee EUR 2,500. If the Chairman of the Audit Committee is the Chairman or Vice Chairman of the Board of Directors, no additional compensation will be paid. The company will compensate reasonable travel expenses of the Board members and committee members arising from Board or committee work.
Ernst & Young Oy, authorized public accountants, was re-elected auditor of the company. The Annual General Meeting authorized the Board of Directors to decide on the repurchase and/or on
the acceptance as pledge of the company's own shares up to a maximum of 8,126,811 shares, which corresponds to approximately 10 percent of all the current shares of the company.
The Annual General Meeting authorized the Board of Directors to decide on the issuance of shares and the issuance of special rights entitling to shares up to a maximum of 8,126,811 shares, which corresponds to approximately 10 percent of all the current shares of the company. In addition to the authorization to issue new shares, the Board of Directors may decide on the conveyance of an aggregate maximum of 8,126,811 own shares held by the company.
Both authorizations will be in force until the closing of the next Annual General Meeting, however no longer than until June 30, 2021.
In its organizing meeting, which was held immediately after the General Meeting, the Board of Directors elected from amongst its members Mr. Kim Ignatius, (Chair), Ms. Camilla Hed-Wilson and Ms. Leemon Wu as members of the Audit Committee, and Ms. Camilla Hed-Wilson (Chair), Mr. Kim Ignatius and Mr. Fredrik Löving as members of the Remuneration Committee.
Dividend Distribution The Annual General Meeting decided, in accordance with the proposal of the Board of Directors, to
distribute a dividend of EUR 0.09 per share, EUR 6,926,814.81 in total. The dividend was paid on April 9, 2020 to shareholders who on the record date of the dividend payment April 2, 2020 were recorded in the company’s shareholders’ register held by Euroclear Finland Ltd.
16
Events after the review period Rovio’s related parties include its subsidiaries, associates, key persons belonging to the management
and their close family members and entities controlled by them, and entities with significant influence on Rovio. Oivor AB is an entity, that has significant influence over the Rovio Group. In April 2020, EUR 2.9 million was paid out as dividend between the Rovio Group and Oivor AB.
ROVIO ENTERTAINMENT CORPORATION Board of Directors

17
Performance measures 1-3/ 1-3/ Change, 1-12/ EUR million 2020 2019 % 2019
Revenue 66.6 70.9 -6.0 % 289.1
EBITDA 15.9 10.5 51.4 % 32.3
EBITDA margin 23.8 % 14.8% - 11.2%
Adjusted EBITDA 16.2 10.5 54.4 % 32.6
Adjusted EBITDA margin, % 24.3 % 14.8% - 11.3%
Operating profit 12.7 7.5 70.6 % 18.1
Operating profit margin, % 19.1 % 10.5% - 6.3%
Adjusted operating profit 13.0 7.5 74.8 % 18.3
Adjusted operating profit margin, % 19.6 % 10.5% - 6.3%
Profit before tax 11.5 7.5 52.8 % 17.7
Capital expenditure 0.8 0.7 18.7 % 3.1
User acquisition 13.5 23.7 -43.3 % 99.7
Return on equity (ROE), % 13.3 % 19.5% - 10.8%
Net gearing ratio, % -69.5% -67.4% - -65.7%
Equity ratio, % 80.8% 78.4% - 80.5%
Earnings per share, EUR 0.11 0.08 50.4 % 0.17
Earnings per share, diluted EUR 0.11 0.07 51.9 % 0.17
Net cash flows from operating activities 11.5 3.3 253.8% 10.5
Employees (average for the period) 466 422 10.4% 450 Rovio presents alternative performance measures as additional information to financial measures
presented in the consolidated income statements, consolidated balance sheets, and consolidated statements of cash flows prepared in accordance with IFRS. In Rovio’s view, the alternative performance measures provide the management, investors, securities analysts, and other parties with significant additional information related to Rovio’s results of operations, financial position or cash flows, and are often used by analysts, investors, and other parties.
Rovio presents adjusted EBITDA and adjusted operating profit, which have been adjusted for material items outside the ordinary course of business such as material net gains and losses from business disposals, direct transaction costs related to business acquisitions, restructuring costs for business operations, and costs relating to enlargement of the ownership base of the Company. Adjusted EBITDA and adjusted operating profit are presented as complementing measures to the measures included in the consolidated income statement presented in accordance with IFRS as, in Rovio’s view, they increase understanding of Rovio’s results of operations.
EBITDA, EBITDA margin, adjusted EBITDA, adjusted EBITDA margin, operating profit, operating profit margin, adjusted operating profit, and adjusted operating profit margin are shown as complementing measures to assess the profitability and efficiency of Rovio’s operations. User acquisition costs, user acquisition costs share of Games business unit’s revenue, %, and gross bookings are presented to enhance the comparability to other actors in the industry. Dividend per share, equity ratio, return on equity (ROE), net gearing, and capital expenditure are useful measures in assessing the efficiency of Rovio’s operations, and Rovio’s ability to obtain financing and service its debts.
The alternative performance measures should not be considered in isolation or as substitutes to the measures under IFRS. All companies do not calculate alternative performance measures in a uniform way and, therefore, the alternative performance measures presented here may not be comparable with similarly named measures presented by other companies.

18
Reconciliation of adjusted operating profit
EUR million 1-3/2020
Items affecting comparability
Income statement excluding items affecting
comparability
Revenue 66.6 66.6
Other operating income 0.0 0.0
Materials and services -18.1 -18.1
Employee benefits expense -11.2 0.2 -11.0
Depreciation and amortization -3.1 -3.1
Other operating expenses -21.5 0.1 -21.3
Operating profit 12.7 0.3 13.0
EUR million 1-3/2019
Items affecting
comparability
Income statement excluding items affecting
comparability
Revenue 70.9 70.9 Other operating income 0.0 0.0 Materials and services -19.7 -19.7 Employee benefits expense -9.4 -9.4 Depreciation and amortization -3.0 -3.0 Other operating expenses -31.2 -31.2 Operating profit 7.5 7.5
EUR million 1–12/2019
Items affecting
comparability
Income statement excluding items affecting
comparability Revenue 289.1 289.1 Other operating income 0.6 0.6 Materials and services -77.3 -77.3 Employee benefits expense -41.7 0.3 -41.4 Depreciation and amortization -14.3 -14.3 Other operating expenses -138.3 0.0 -138.3 Operating profit 18.1 0.3 18.3
Reconciliation of adjusted operating profit EUR million 1-3/2020 1-3/2019 1–12/2019 Operating profit 12.7 7.5 18.1
Restructuring costs arising from employee benefits expenses 0.2 0.3
Restructuring costs in Other operating expenses 0.1 0.0
Restructuring costs in Depreciation and amortization Adjusted operating profit 13.0 7.5 18.3

19
Reconciliation of EBITDA and Adjusted EBITDA EUR million 1-3/2020 1–3/2019 1–12/2019 Operating profit 12.7 7.5 18.1 Depreciation and amortization 3.1 3.0 14.3
EBITDA 15.9 10.5 32.3 Restructuring costs arising from employee benefits expenses 0.2 0.3 Restructuring costs in Other operating expenses 0.1 0.0 Adjusted EBITDA 16.2 10.5 32.6 Reconciliation of equity ratio, %, return on equity, %, net gearing ratio, %, and net debt EUR million 1-3/2020 1-3/2019 1–12/2019
Equity ratio, % 80.8% 78.4% 80.5% Equity 159.1 166.9 168.0
Advances received 2.1 6.4 3.4
Deferred revenue 6.2 6.2 5.2
Total assets 205.2 225.6 217.3
Return on equity, % 13.3% 19.5% 10.8% Profit/loss before tax 21.7 30.8 17.7 Shareholder's equity beginning of period 166.9 149.0 159.4 Shareholder's equity end of period 159.1 166.9 168.0
Net gearing ratio, % -69.5% -67.4% -65.7% Total interest-bearing debt 10.5 16.4 14.4
Cash and cash equivalents 121.1 128.8 124.7
Equity 159.1 166.9 168.0 Non-current interest-bearing loans and borrowings 6.9 10.8 7.7 Current interest-bearing loans and borrowings 3.6 5.6 6.7
Cash and cash equivalents 121.1 128.8 124.7 Net debt -110.6 -112.5 -110.4

20
Gross bookings The following table sets out reconciliation of gross bookings used in key operational metrics and
reported revenue:
Reconciliation of gross bookings to revenue EUR million 1-3/2020 1-3/2019 1–12/2019
Gross bookings 62.1 65.8 263.2
Change in deferred revenue 0.0 0.0 1.2
Custom contracts 0.2 0.2 1.0
Other adjustments 0.5 0.3 -0.6
Revenue 62.7 66.3 264.8 Custom contracts are distribution contracts that are signed with partners who pre-download Rovio’s
games onto their own devices or distribute Rovio’s games through their proprietary distribution platforms. Custom contracts usually contain a minimum guarantee and revenue share to Rovio. Rovio recognizes corresponding minimum guarantee revenue over the contract period. Custom contracts do not include the application stores operated by Apple and Google.
Calculation principles of alternative performance measures EBITDA (Earnings before interest, taxes, depreciation and amortization), which is operating profit
before depreciations and amortizations. EBITDA margin, %, which is defined as EBITDA as a percentage of revenue. Items affecting comparability, which are defined as material items outside the ordinary course of
business such as material net gains and losses from business disposals, direct transaction costs related to business acquisitions, restructuring costs for business operations, and costs relating to enlargement of the ownership base of the company.
Adjusted EBITDA, which is defined as EBITDA excluding items affecting comparability. Adjusted EBITDA margin, %, which is defined as comparable EBITDA as a percentage of revenue. Operating profit margin, %, which is operating profit as a percentage of revenue. Adjusted operating profit, which is defined as operating profit excluding items affecting
comparability. Adjusted operating profit margin, %, which is defined as adjusted operating profit as a percentage of
revenue. User acquisition, which relate to acquisition of new players in the Company’s games through
performance marketing campaigns. User acquisition share of Games revenue, %, which is user acquisition costs as a percentage of
Games revenue. Dividend per share, which is total dividend divided by number of shares, adjusted for share issues, at
the end of the financial period less treasury shares. Earnings per share, which is the net result for the review period divided by the average number of
shares in the review period, less treasury shares. Equity ratio, %, which is calculated by dividing (i) Total equity by (ii) Total equity and liabilities less
advances received and deferred revenue. Return on equity (ROE), which is calculated by dividing profit before tax, quarterly reports adjusted to
correspond with 12 months, by the average of total equity in the opening and closing balance sheet. Capital expenditure, which is cash flow of purchase of tangible and intangible assets.
21
Net debt, which is calculated by subtracting cash and cash equivalents from current and non-current interest-bearing loans and borrowings.
Net gearing %, which is calculated by dividing net debt by the total equity. Gross bookings represent in-app purchases and in-app advertising sales in the given calendar month,
reported on the basis of the date of purchase/sale. Gross bookings do not include revenue from custom contracts, revenue deferrals or accounting adjustments due to e.g., foreign exchange rate differences between revenue accruals and actual payments, and thus differs from the actual reported revenue.
Player, which is defined as the user who plays one of Rovio’s games on at least one device. A player can continue playing the game on multiple devices by synchronizing the game progress. Under the following metrics, a player who plays a given game in two devices is counted as one player.
DAU (Daily Active Users), which is defined as the number of players that played one of our games during a particular day. Under this metric, a player that plays two different games on the same day is counted as two DAUs. We primarily use information provided by Rovio’s own technology, but we also use third-party tracking solutions for historical data and in cases when a game does not contain Rovio’s tracking tools. Average DAUs for a particular period is the average of the DAUs for each day during that period.
MAU (Monthly Active Users), which is defined as the number of players that played one of our games during a particular calendar month. Under this metric, a player that plays two different games in the same month is counted as two MAUs. We primarily use information provided by Rovio’s own technology, but we also use third party tracking solutions for historical data and in cases when a game does not contain Rovio’s tracking tools.
MUP (Monthly Unique Payers), which is defined as the number of players that made a payment at least once during the calendar month through a payment method for which we can quantify the number of individuals, including payers from our mobile games. MUPs does not include individuals who use certain payment methods for which we cannot quantify the number of unique payers. We only use information provided by Rovio’s own payment verification technology.
ARPDAU (Average Revenue Per Daily Active User), which is defined as Sum of quarterly Gross Bookings divided by number of days in the quarter divided by average DAU for the quarter.
MARPPU (Monthly Average Revenue Per Paying User), which is defined as Monthly Gross IAP Bookings divided by MUP from verified purchases. MARPPU does not include revenue from custom contracts, revenue deferrals or accounting adjustments such as foreign exchange rate differences between revenue accruals and actual payments.

22
Interim Report January 1–March 31, 2020 - Tables
The figures in the Interim report are unaudited
Statement of consolidated profit or loss and other comprehensive income
EUR million
1-3/ 2020
1-3/ 2019
1–12/ 2019
Revenue 66.6 70.9 289.1 Other operating income 0.0 0.0 0.6 Materials and services 18.1 19.7 77.3 Employee benefits expense 11.2 9.4 41.7 Depreciation and amortization 3.1 3.0 14.3 Other operating expenses 21.5 31.2 138.3
Operating profit 12.7 7.5 18.1 Finance income and expenses -1.2 0.1 -0.3 Share of profit of associates 0.0 0.0 0.0 Profit (loss) before tax 11.5 7.5 17.7 Income tax expense -2.6 1.6 4.5 Profit for the period 8.9 6.0 13.2 Attributable to: Non-controlling interests 0.0 0.0 0.0 Equity holders of the parent company 8.9 6.0 13.2 Other comprehensive income/expense
Other comprehensive income to be reclassified to profit or loss in subsequent periods (net of tax):
Translation differences -0.2 0.1 0.0 Total comprehensive income for the period net of tax 8.7 6.0 13.2 Attributable to: Non-controlling interests 0.0 0.0 0.0 Equity holders of the parent company 8.7 6.0 13.2
Earnings per share for net result attributable to owners of the parent:
Earnings per share, EUR 0.11 0.08 0.17 Earnings per share, diluted EUR 0.11 0.07 0.17
23
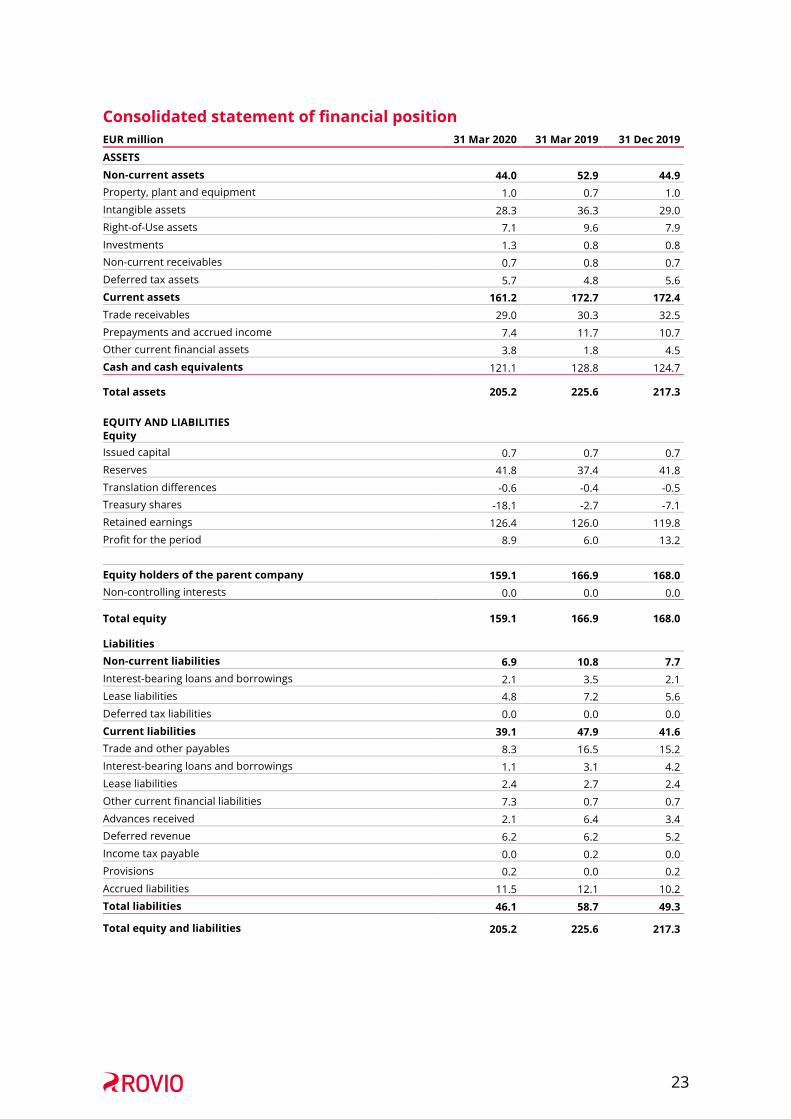
Consolidated statement of financial position EUR million 31 Mar 2020 31 Mar 2019 31 Dec 2019 ASSETS
Non-current assets 44.0 52.9 44.9 Property, plant and equipment 1.0 0.7 1.0 Intangible assets 28.3 36.3 29.0 Right-of-Use assets 7.1 9.6 7.9 Investments 1.3 0.8 0.8 Non-current receivables 0.7 0.8 0.7 Deferred tax assets 5.7 4.8 5.6 Current assets 161.2 172.7 172.4 Trade receivables 29.0 30.3 32.5 Prepayments and accrued income 7.4 11.7 10.7 Other current financial assets 3.8 1.8 4.5 Cash and cash equivalents 121.1 128.8 124.7
Total assets 205.2 225.6 217.3
EQUITY AND LIABILITIES Equity
Issued capital 0.7 0.7 0.7 Reserves 41.8 37.4 41.8 Translation differences -0.6 -0.4 -0.5 Treasury shares -18.1 -2.7 -7.1 Retained earnings 126.4 126.0 119.8 Profit for the period 8.9 6.0 13.2
Equity holders of the parent company 159.1 166.9 168.0 Non-controlling interests 0.0 0.0 0.0
Total equity 159.1 166.9 168.0
Liabilities Non-current liabilities 6.9 10.8 7.7 Interest-bearing loans and borrowings 2.1 3.5 2.1 Lease liabilities 4.8 7.2 5.6 Deferred tax liabilities 0.0 0.0 0.0 Current liabilities 39.1 47.9 41.6 Trade and other payables 8.3 16.5 15.2 Interest-bearing loans and borrowings 1.1 3.1 4.2 Lease liabilities 2.4 2.7 2.4 Other current financial liabilities 7.3 0.7 0.7 Advances received 2.1 6.4 3.4 Deferred revenue 6.2 6.2 5.2 Income tax payable 0.0 0.2 0.0 Provisions 0.2 0.0 0.2 Accrued liabilities 11.5 12.1 10.2 Total liabilities 46.1 58.7 49.3
Total equity and liabilities 205.2 225.6 217.3

24
Consolidated statement of changes in equity
Attributable to the equity holders of the parent on March 31, 2019
EUR million
Issued capital
Unrestricted
equity reserve
Treasury shares
Retained earnings
Foreign currency
translation reserve
Total
Non-
controlling interests
Total
equity
Balance at Jan 1, 2019 0.7 36.7 -2.7 125.3 -0.5 159.4 0.0 159.4
Profit for the period 6.0 6.0 6.0
Option subscriptions 0.7 0.7 0.7 Other comprehensive income 0.1 0.1 0.1
Share-based payments 0.8 0.8 0.8 March 31, 2019 0.7 37.4 -2.7 132.0 -0.4 166.9 0.0 166.9
Attributable to the equity holders of the parent on March 31, 2020
EUR million
Issued capital
Unrestricted
equity reserve
Treasury shares
Retained earnings
Foreign currency
translation reserve
Total
Non-
controlling interests
Total
equity Balance at Jan 1, 2020 0.7 41.8 -7.1 133.0 -0.5 168.0 0.0 168.0
Profit for the period 8.9 8.9 8.9
Treasury shares acquisition -11.1 -11.1 -11.1 Other comprehensive income -0.2 -0.2 -0.2
Cash dividends -6.9 -6.9 -6.9
Share-based payments 0.1 0.4 0.4 0.4 March 31, 2020 0.7 41.8 -18.1 135.3 -0.6 159.1 0.0 159.1

25
Consolidated statement of cash flows
EUR million 1-3/
2020 1-3/
2019 1–12/ 2019
Operating activities
Profit (loss) before tax 11.5 7.5 17.7 Adjustments:
Depreciation and amortization on tangible and intangible assets 3.1
3.0 14.3 Net foreign exchange differences -0.8 -0.4 -0.5 Gain on disposal of property, plant and equipment -0.0 -0.0 -0.0 Finance costs 0.2 0.3 0.8 Share of profit of an associate and a joint venture 0.0 0.0 0.0 Other adjustments 0.0 0.0 0.0 Other non-cash items 0.5 0.8 2.1 Change in working capital:
Change in trade and other receivables and prepayments 6.0 -8.6 -9.8 Change in trade and other payables -6.8 4.9 -3.4 Interest received 0.1 0.0 0.5 Interest paid -0.3 -0.3 -1.1 Income tax paid (received) -2.0 -4.0 -10.1
Net cash flows from operating activities
11.5
3.3 10.5
Investing activities
Purchase of tangible and intangible assets -0.8 -0.7 -3.1 Other investments -0.5 -0.8 -0.8 Proceeds from sales of tangible and intangible assets 0.0 0.0 0.0 Proceeds from sale of investments 0.0 0.0 0.0 Acquisition of subsidiaries, net of cash acquired 0.0 0.0 0.0 Proceeds from sale of investments in associates and joint ventures 0.0 0.0 0.0
Net cash flows used in investing activities
-1.3
-1.4 -3.9
Financing activities Acquisition of non-controlling interests 0.0 0.0 0.0 Finance lease repayments -0.7 -0.6 -2.7 Proceeds from and repayments of borrowings -3.0 3.0 3.0 Share subscriptions based on option rights 0.1 0.7 5.1 Acquisition of treasury shares -11.1 0.0 -5.1 Share-based payments 0.0 0.0 0.8 Proceeds of share issue 0.0 0.0 0.0 Share issue transaction costs 0.0 0.0 0.0 Dividends paid to equity holders of the parent 0.0 0.0 -7.1 Net cash flows from/(used in) financing activities -14.6 3.0 -6.1
Change in cash and cash equivalents
-4.4
4.8 0.6 Net foreign exchange difference 0.8 0.4 0.5 Cash and cash equivalents at beginning of period 124.7 123.6 123.6 Cash and cash equivalents at the end of the period 121.1 128.8 124.7

26
Notes
1. Key accounting principles Rovio’s consolidated financial statements are prepared in accordance with the International Financial
Reporting Standards (IFRS) adopted by the EU. The interim financial statements are not presented in accordance with IAS 34 standard, as Rovio applies the statutes of the Finnish Securities Markets Act (1278/2015) regarding the regular disclosure requirements. The accounting principles and methods used in the preparation of the interim report are essentially the same as those applied in the consolidated financial statements for the year 2019.
The figures in the consolidated interim financial statements have been rounded and consequently the sum of individual figures may deviate from the sum presented. Key figures have been calculated using exact figures.
This interim report does not include all the information or disclosures as presented in the consolidated financial statements of December 31, 2019.
The figures in this report are unaudited.
2. Notes to the statement of profit or loss 2.1 Segment disclosures
Rovio has defined its operating segments as Games, Brand Licensing (BLU) and Other. Rovio defines the Group’s Board of Directors as its chief operating decision maker (CODM). The CODM
follows Rovio’s performance on the segment level, which is presented in section 2.2 Segment operating performance. EBITDA is the primary performance measure that CODM follows. There are no revenues between the operating segments of Rovio Group.
The segment assets and liabilities except for non-current assets are not reported and reviewed by the chief operating decision maker and have not been included in the table below. Rovio did not during the interim period have customers that would require disclosure (i.e. 10% or more of revenues from transactions with a single customer).

27
2.2 Segment operating performance The allocations between segments consist of shared functions employee benefits expense as well as
general and administrative expenses that are recognized centrally and allocated to the reportable segments as a separate line item in management reporting.
Segment profit and loss 1-3/2020
EUR million
Games
Brand Licensing
Other
Allocation
Total IFRS segments
Revenue 62.7 3.9 0.0 66.6 Other operating income 0.0 0.0 0.0 0.0 Materials and services 17.8 0.3 0.0 18.1
Employee benefits expense 8.1 0.5 1.9 0.7 11.2
User acquisition 13.5 0.0 0.1 13.5
Other operating expenses 4.4 0.5 2.1 1.0 7.9
Allocations 1.2 0.2 0.3 -1.7 0.0 EBITDA 17.8 2.4 -4.3 0.0 15.9 Depreciation and amortization 1.2 1.7 0.2 3.1 Operating profit 16.6 0.7 -4.5 12.7
EBITDA 17.8 2.4 -4.3 15.9 Adjustments 0.0 0.2 0.2 0.3
Adjusted EBITDA 17.8 2.6 -4.2 16.2
Operating profit 16.6 0.7 -4.5 12.7 Adjustments 0.0 0.2 0.2 0.3 Adjusted operating profit 16.6 0.8 -4.4 13.0
Segment Capital expenditure 1-3/2020
EUR million
Games
Brand Licensing
Other
Total IFRS segments
Capital expenditure 0.6 0.1 0.1 0.8
Segment assets March 31,2020
EUR million
Games
Brand Licensing
Other
Total IFRS segments
Non-current assets 6.9 19.5 17.6 44.0

28
Segment profit and loss 1-3/2019
EUR million
Games
Brand Licensing
Other
Allocation
Total IFRS segments
Revenue 66.3 4.6 0.0 70.9 Other operating income 0.0 0.0 0.0 0.0
Materials and services 19.5 0.2 0.0 19.7
Employee benefits expense 6.2 1.0 1.6 0.7 9.4 User acquisition 23.7 0.0 0.0 23.7
Other operating expenses 4.6 0.6 1.2 0.9 7.5
Allocations 1.0 0.3 0.3 -1.6 0.0
EBITDA 11.2 2.5 -3.2 0.0 10.5 Depreciation and amortization 1.0 1.9 0.1 3.0 Operating profit 10.1 0.6 -3.3 7.5
EBITDA 11.2 2.5 -3.2 10.5 Adjustments 0.0 0.0 0.0 0.0
Adjusted EBITDA 11.2 2.5 -3.2 10.5
Operating profit 10.1 0.6 -3.3 7.5 Adjustments 0.0 0.0 0.0 0.0 Adjusted operating profit 10.1 0.6 -3.3 7.5
Segment Capital expenditure 1-3/2019
EUR million
Games
Brand Licensing
Other
Total IFRS segments
Capital expenditure 0.1 0.0 0.5 0.7
Segment assets March 31, 2019
EUR million
Games
Brand Licensing
Other
Total IFRS segments
Non-current assets 7.5 27.9 17.5 52.9

29
Segment profit and loss 1–12/2019 EUR million
Games
Brand Licensing
Other
Allocation
Total IFRS segments
Revenue 264.8 24.3 0.0 289.1 Other operating income 0.6 0.0 0.0 0.6
Materials and services 75.7 1.6 0.0 77.3
Employee benefits expense 28.7 3.5 6.9 2.6 41.7
User acquisition 99.7 0.0 0.1 99.8
Other operating expenses 21.3 4.3 8.8 4.1 38.5 Allocations 4.3 1.1 1.3 -6.7 0.0
EBITDA 35.6 13.8 -17.0 0.0 32.3 Depreciation and amortization 4.3 9.4 0.6 14.3 Operating profit 31.3 4.3 -17.6 18.1
EBITDA 35.6 13.8 -17.0 32.3 Adjustments 0.0 0.3 0.0 0.3 Adjusted EBITDA 35.6 14.0 -17.0 32.6
Operating profit 31.3 4.3 -17.6 18.1 Adjustments 0.0 0.3 0.0 0.3
Adjusted Operating profit 31.3 4.6 -17.6 18.3
Segment Capital expenditure 1–12/2019
EUR million
Games
Brand Licensing
Other
Total IFRS segments
Capital expenditure 1.1 0.7 1.4 3.1
Segment assets December 31, 2019
EUR million
Games
Brand Licensing
Other
Total IFRS segments
Non-current assets 6.9 21.2 16.8 44.9

30
3.Changes in contingent liabilities or contingent assets Future minimum rentals payable under non-cancelable operating leases and other commitments are
as follows.
EUR million At March 31,
2020 At March 31,
2019 At December 31,
2019 Equipment lease commitments
Due within one year 0.0 0.0 0.0 Due in subsequent years 0.0 0.0 0.0
Total
Office rental commitments
0.0 0.0 0.0
Due within one year 0.0 0.0 0.0 Due in subsequent years 0.0 0.0 0.0
Total
Other commitments
0.0 0.0 0.0
Enterprise mortgages 0.0 0.0 0.0 Venture Capital investment commitment 1.4 1.9 1.9 Total 1.4 1.9 1.9
4.Related party transactions Rovio’s related parties include its subsidiaries, associates, key persons belonging to the management
and their close family members and entities controlled by them, and entities with significant influence on Rovio. There were no related party transactions during the reporting period.
6.Calculation of earnings per share 1-3/
2020 1–3/ 2019
1-12/ 2019
Earnings per share, EUR 0.11 0.08 0.17 Earnings per share, diluted, EUR 0.11 0.07 0.17 Shares outstanding at the end of the period (thousands) 76,965 78,870 79,612 Weighted average adjusted number of shares during the financial period, basic (thousands) 78,414 78,864 79,697 Weighted average adjusted number of shares during the financial period, diluted (thousands) 78,527 79,779 79,886