22 levine
TRANSCRIPT
TPC Benchmarks
Charles LevineMicrosoft
Western Institute of Computer ScienceStanford, CA
August 6, 1999
Outline
� Introduction� History of TPC� TPC-A/B Legacy� TPC-C� TPC-H/R� TPC Futures
Benchmarks: What and Why
� What is a benchmark?� Domain specific
� No single metric possible� The more general the benchmark, the less useful it is for anything in
particular.� A benchmark is a distillation of the essential attributes of a workload
� Desirable attributes� Relevant meaningful within the target domain� Understandable� Good metric(s) linear, orthogonal, monotonic� Scaleable applicable to a broad spectrum of hardware/architecture� Coverage does not oversimplify the typical environment� Acceptance Vendors and Users embrace it

Benefits and Liabilities
� Good benchmarks� Define the playing field� Accelerate progress
� Engineers do a great job once objective is measureable and repeatable
� Set the performance agenda� Measure release-to-release progress� Set goals (e.g., 100,000 tpmC, < 10 $/tpmC) � Something managers can understand (!)
� Benchmark abuse � Benchmarketing� Benchmark wars
� more $ on ads than development
Benchmarks have a Lifetime
� Good benchmarks drive industry and technology forward.� At some point, all reasonable advances have been made.� Benchmarks can become counter productive by encouraging
artificial optimizations.� So, even good benchmarks become obsolete over time.

Outline
� Introduction� History of TPC� TPC-A Legacy� TPC-C� TPC-H/R� TPC Futures

What is the TPC?
� TPC = Transaction Processing Performance Council� Founded in Aug/88 by Omri Serlin and 8 vendors.� Membership of 40-45 for last several years
� Everybody who’s anybody in software & hardware
� De facto industry standards body for OLTP performance
� Administered by:Shanley Public Relations ph: (408) 295-8894650 N. Winchester Blvd, Suite 1 fax: (408) 271-6648San Jose, CA 95128 email: [email protected]
� Most TPC specs, info, results are on the web page: http: www.tpc.org
Two Seminal Events Leading to TPC
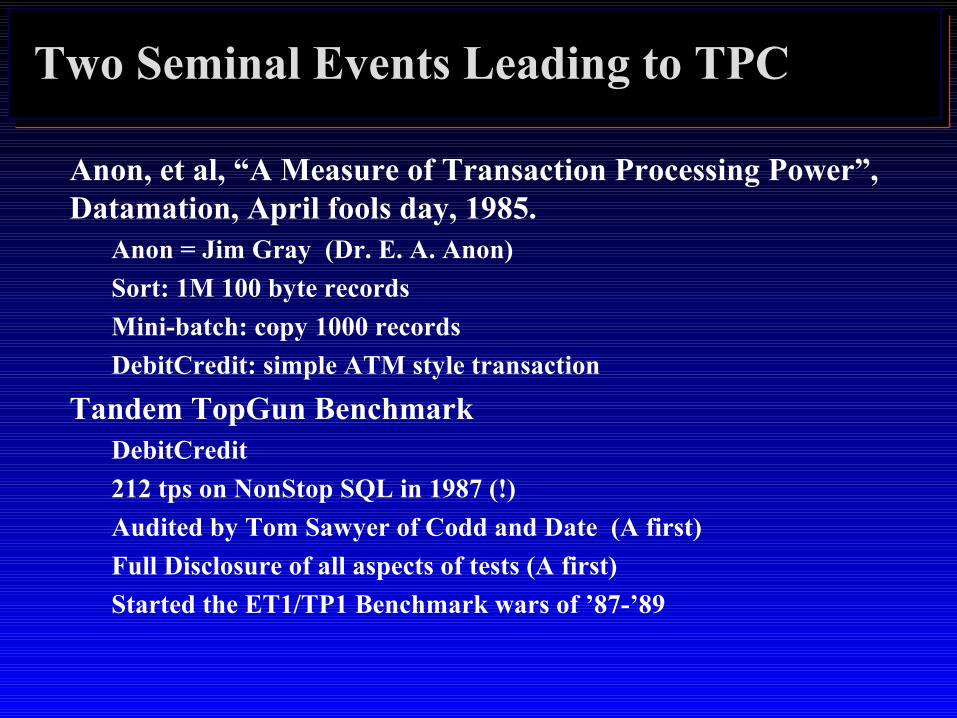
� Anon, et al, “A Measure of Transaction Processing Power”, Datamation, April fools day, 1985.
� Anon = Jim Gray (Dr. E. A. Anon)� Sort: 1M 100 byte records� Mini-batch: copy 1000 records� DebitCredit: simple ATM style transaction
� Tandem TopGun Benchmark� DebitCredit� 212 tps on NonStop SQL in 1987 (!)� Audited by Tom Sawyer of Codd and Date (A first)� Full Disclosure of all aspects of tests (A first)� Started the ET1/TP1 Benchmark wars of ’87-’89
TPC Milestones
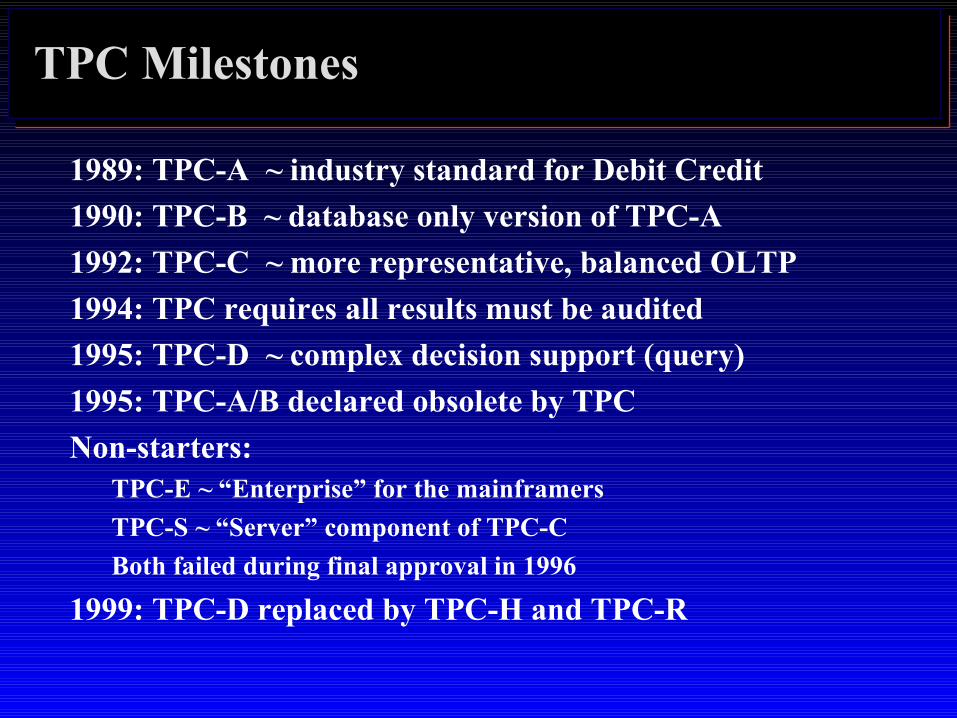
� 1989: TPC-A ~ industry standard for Debit Credit� 1990: TPC-B ~ database only version of TPC-A� 1992: TPC-C ~ more representative, balanced OLTP� 1994: TPC requires all results must be audited� 1995: TPC-D ~ complex decision support (query)� 1995: TPC-A/B declared obsolete by TPC� Non-starters:
� TPC-E ~ “Enterprise” for the mainframers� TPC-S ~ “Server” component of TPC-C� Both failed during final approval in 1996
� 1999: TPC-D replaced by TPC-H and TPC-R

TPC vs. SPEC
� SPEC (System Performance Evaluation Cooperative)� SPECMarks
� SPEC ships code� Unix centric� CPU centric
� TPC ships specifications� Ecumenical� Database/System/TP centric� Price/Performance
� The TPC and SPEC happily coexist� There is plenty of room for both
Outline
� Introduction� History of TPC� TPC-A/B Legacy� TPC-C� TPC-H/R� TPC Futures
TPC-A Legacy
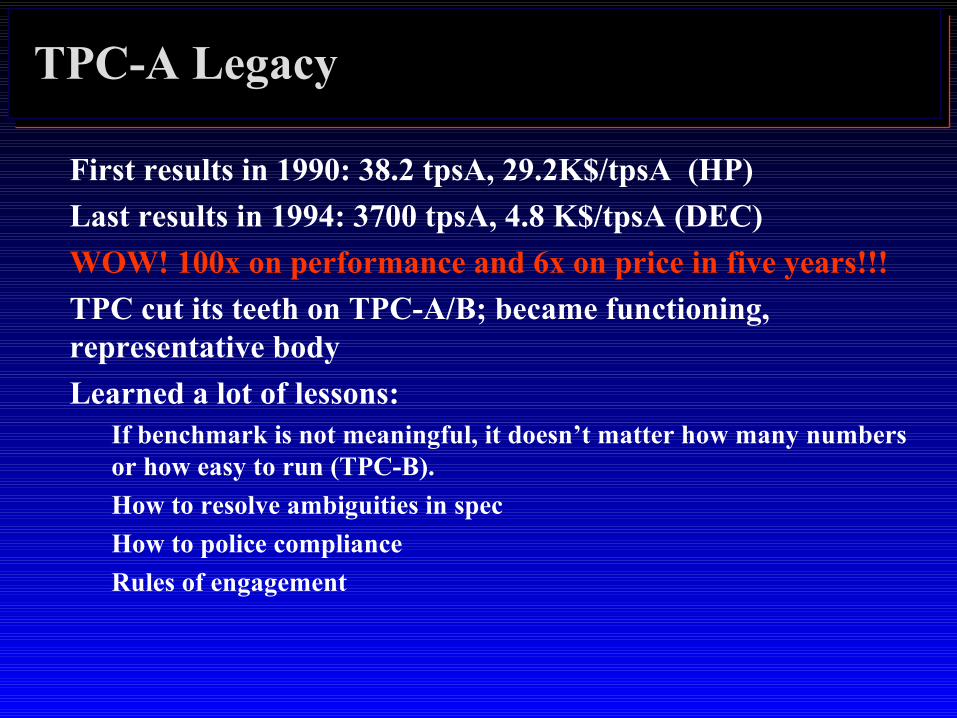
� First results in 1990: 38.2 tpsA, 29.2K$/tpsA (HP)� Last results in 1994: 3700 tpsA, 4.8 K$/tpsA (DEC)� WOW! 100x on performance and 6x on price in five years!!!� TPC cut its teeth on TPC-A/B; became functioning,
representative body� Learned a lot of lessons:
� If benchmark is not meaningful, it doesn’t matter how many numbers or how easy to run (TPC-B).
� How to resolve ambiguities in spec� How to police compliance� Rules of engagement

TPC-A Established OLTP Playing Field
� TPC-A criticized for being irrelevant, unrepresentative, misleading
� But, truth is that TPC-A drove performance, drove price/performance, and forced everyone to clean up their products to be competitive.
� Trend forced industry toward one price/performance, regardless of size.
� Became means to achieve legitimacy in OLTP for some.

Outline
� Introduction� History of TPC� TPC-A/B Legacy� TPC-C� TPC-D� TPC Futures

TPC-C Overview
� Moderately complex OLTP� The result of 2+ years of development by the TPC� Application models a wholesale supplier managing orders.� Order-entry provides a conceptual model for the benchmark;
underlying components are typical of any OLTP system.� Workload consists of five transaction types.� Users and database scale linearly with throughput.� Spec defines full-screen end-user interface.� Metrics are new-order txn rate (tpmC) and
price/performance ($/tpmC)� Specification was approved July 23, 1992.
TPC-C’s Five Transactions
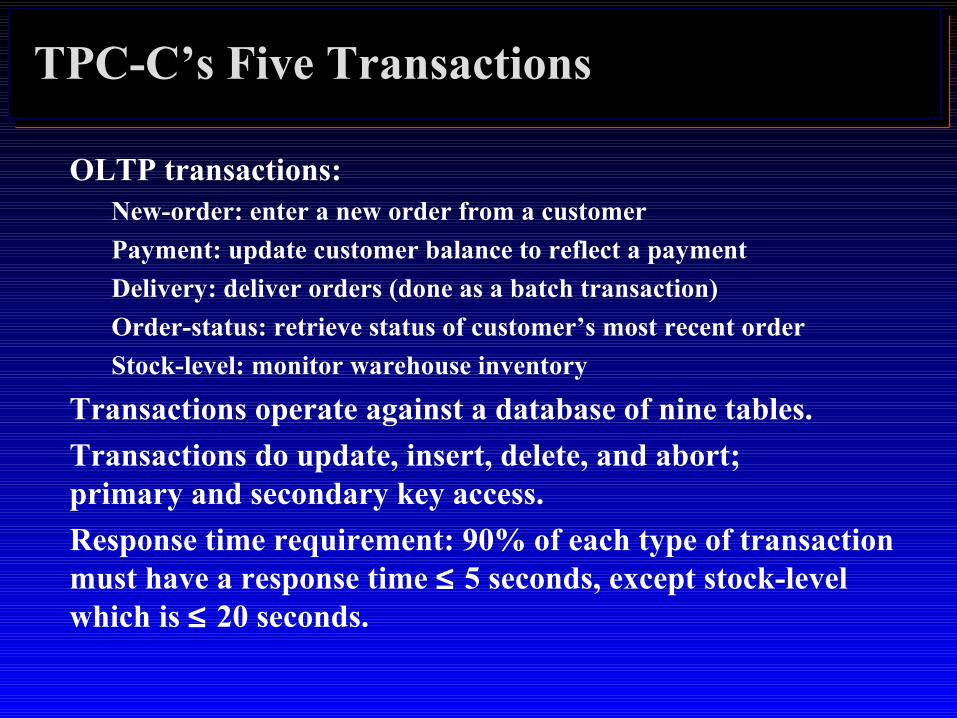
� OLTP transactions:� New-order: enter a new order from a customer� Payment: update customer balance to reflect a payment� Delivery: deliver orders (done as a batch transaction)� Order-status: retrieve status of customer’s most recent order� Stock-level: monitor warehouse inventory
� Transactions operate against a database of nine tables.� Transactions do update, insert, delete, and abort;
primary and secondary key access.� Response time requirement: 90% of each type of transaction
must have a response time ≤ 5 seconds, except stock-level which is ≤ 20 seconds.

TPC-C Database Schema
WarehouseWarehouseWW
LegendLegend
Table NameTable Name<cardinality><cardinality>
one-to-manyone-to-manyrelationshiprelationship
secondary indexsecondary index
DistrictDistrictW*10W*10
1010
CustomerCustomerW*30KW*30K
3K3K
HistoryHistoryW*30K+W*30K+
1+1+
ItemItem100K (fixed)100K (fixed)
StockStockW*100KW*100K100K100K WW
OrderOrderW*30K+W*30K+1+1+
Order-LineOrder-LineW*300K+W*300K+
10-1510-15
New-OrderNew-OrderW*5KW*5K0-10-1

22
TPC-C Workflow
11
Select txn from menu:Select txn from menu:1. New-Order 1. New-Order 45%45%2. Payment 2. Payment 43%43%3. Order-Status3. Order-Status 4%4%4. Delivery 4. Delivery 4%4%5. Stock-Level 5. Stock-Level 4%4%
Input screenInput screen
Output screenOutput screen
Measure menu Response TimeMeasure menu Response Time
Measure txn Response TimeMeasure txn Response Time
Keying time
Think time
33
Go back to 1Go back to 1
Cycle Time DecompositionCycle Time Decomposition(typical values, in seconds,(typical values, in seconds, for weighted average txn)for weighted average txn)
Menu = 0.3Menu = 0.3
Keying = 9.6Keying = 9.6
Txn RT = 2.1Txn RT = 2.1
Think = 11.4Think = 11.4
Average cycle time = 23.4Average cycle time = 23.4
Data Skew
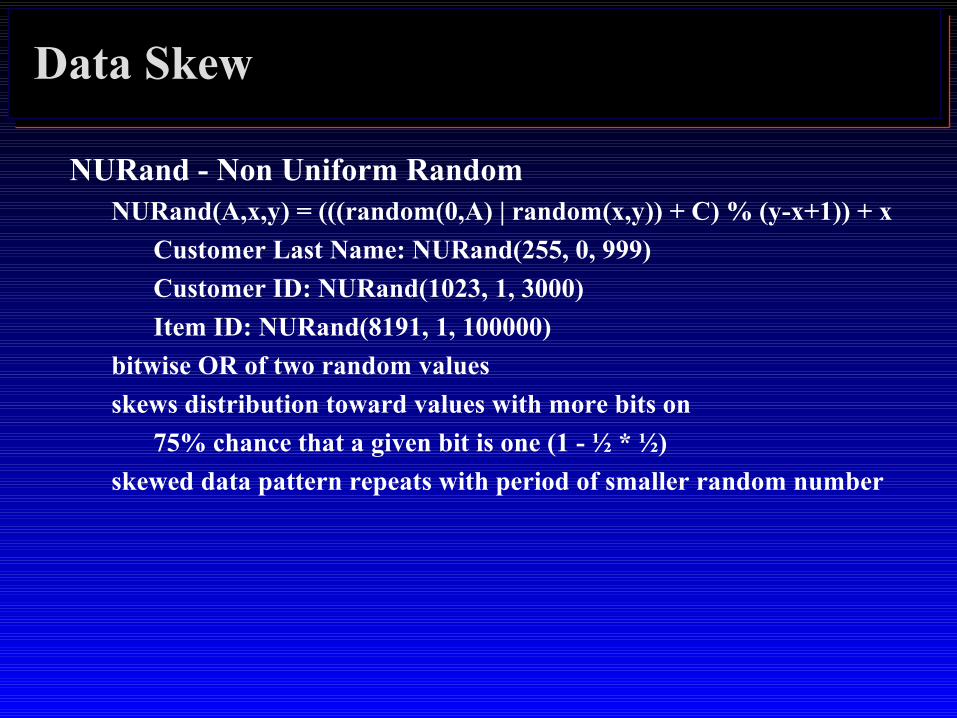
� NURand - Non Uniform Random� NURand(A,x,y) = (((random(0,A) | random(x,y)) + C) % (y-x+1)) + x
� Customer Last Name: NURand(255, 0, 999)� Customer ID: NURand(1023, 1, 3000)� Item ID: NURand(8191, 1, 100000)
� bitwise OR of two random values� skews distribution toward values with more bits on
� 75% chance that a given bit is one (1 - ½ * ½)� skewed data pattern repeats with period of smaller random number

NURand Distribution
T P C - C N U R a n d f u n c t i o n : f r e q u e n c y v s 0 . . . 2 5 5
R e c o r d I d e n t i t i y [ 0 . . 2 5 5 ]
Rel
ativ
e F
requ
ency
of
Acc
ess
to T
his
Rec
ord
0
0 .0 1
0 .0 2
0 .0 3
0 .0 4
0 .0 5
0 .0 6
0 .0 7
0 .0 8
0 .0 9
0 .1
0
10 20 30 40 50 60 70 80 90
100
110
120
130
140
150
160
170
180
190
200
210
220
230
240
250
c u m u l a t i v ed i s t r i b u t i o n

ACID Tests
� TPC-C requires transactions be ACID.� Tests included to demonstrate ACID properties met.� Atomicity
� Verify that all changes within a transaction commit or abort.
� Consistency� Isolation
� ANSI Repeatable reads for all but Stock-Level transactions.� Committed reads for Stock-Level.
� Durability� Must demonstrate recovery from
� Loss of power� Loss of memory� Loss of media (e.g., disk crash)
1-1001-100
Transparency
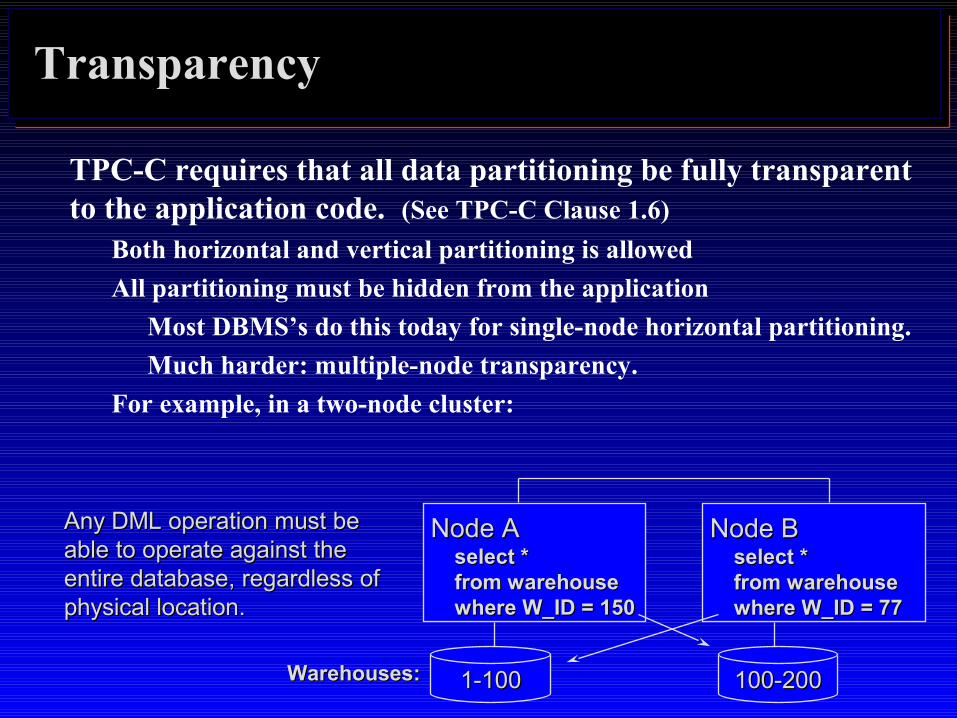
� TPC-C requires that all data partitioning be fully transparent to the application code. (See TPC-C Clause 1.6)
� Both horizontal and vertical partitioning is allowed� All partitioning must be hidden from the application
� Most DBMS’s do this today for single-node horizontal partitioning. � Much harder: multiple-node transparency.
� For example, in a two-node cluster:
Warehouses:Warehouses:
Node ANode Aselect * select * from warehousefrom warehousewhere W_ID = 150where W_ID = 150
Node BNode Bselect * select * from warehousefrom warehousewhere W_ID = 77where W_ID = 77
Any DML operation must beAny DML operation must beable to operate against the able to operate against the entire database, regardless of entire database, regardless of physical location.physical location.
100-200100-200
Transparency (cont.)
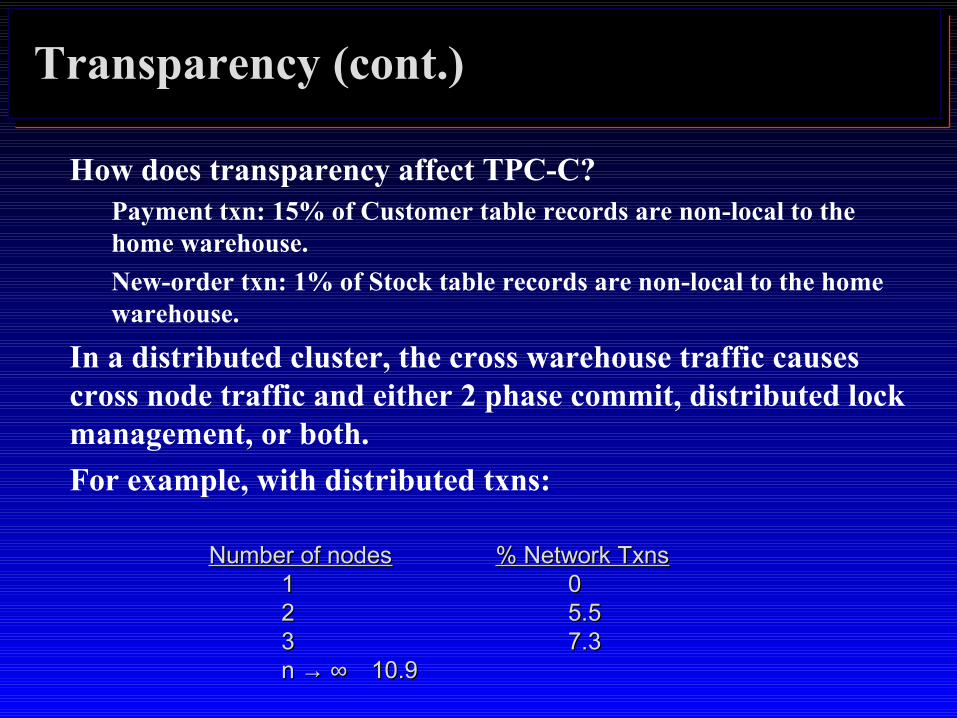
� How does transparency affect TPC-C?� Payment txn: 15% of Customer table records are non-local to the
home warehouse.� New-order txn: 1% of Stock table records are non-local to the home
warehouse.
� In a distributed cluster, the cross warehouse traffic causes cross node traffic and either 2 phase commit, distributed lock management, or both.
� For example, with distributed txns:
Number of nodesNumber of nodes % Network Txns% Network Txns11 0022 5.55.533 7.37.3nn → ∞ → ∞ 10.910.9

TPC-C Rules of Thumb
� 1.2 tpmC per User/terminal (maximum)� 10 terminals per warehouse (fixed)� 65-70 MB/tpmC priced disk capacity (minimum)� ~ 0.5 physical IOs/sec/tpmC (typical)� 100-700 KB main memory/tpmC (how much $ do you have?)� So use rules of thumb to size 5000 tpmC system:
� How many terminals?� How many warehouses?� How much memory?� How much disk capacity?� How many spindles?
» 4170 = 5000 / 1.2» 4170 = 5000 / 1.2
» 417 = 4170 / 10» 417 = 4170 / 10
» 1.5 - 3.5 GB » 1.5 - 3.5 GB
» 325 GB = 5000 * 65» 325 GB = 5000 * 65
» Depends on MB capacity vs. physical IO. » Depends on MB capacity vs. physical IO. Capacity: 325 / 18 = 18 or 325 / 9 = 36 spindlesCapacity: 325 / 18 = 18 or 325 / 9 = 36 spindles
IO: 5000*.5 / 18 = 138 IO/sec IO: 5000*.5 / 18 = 138 IO/sec TOO HOT!TOO HOT!IO: 5000*.5 / 36 = 69 IO/sec IO: 5000*.5 / 36 = 69 IO/sec OKOK

Response TimeResponse Timemeasured heremeasured here
Typical TPC-C Configuration (Conceptual)
DatabaseDatabaseServerServer
......
ClientClient
C/SLAN
Term.LAN
Presentation ServicesPresentation Services Database FunctionsDatabase FunctionsEmulated User LoadEmulated User Load
Har
dwar
eH
ardw
are
RTERTE, e.g.:, e.g.:Performix,Performix,LoadRunner,LoadRunner,or proprietaryor proprietaryS
oftw
are
Sof
twar
e TPC-C application +TPC-C application +Txn Monitor and/orTxn Monitor and/ordatabase RPC librarydatabase RPC librarye.g., Tuxedo, ODBCe.g., Tuxedo, ODBC
TPC-C application TPC-C application (stored procedures) + (stored procedures) + Database engineDatabase enginee.g., SQL Servere.g., SQL Server
Driver SystemDriver System

Competitive TPC-C Configuration 1996
� 5677 tpmC; $135/tpmC; 5-yr COO= 770.2 K$� 2 GB memory, 91 4-GB disks (381 GB total)� 4xPent 166 MHz� 5000 users
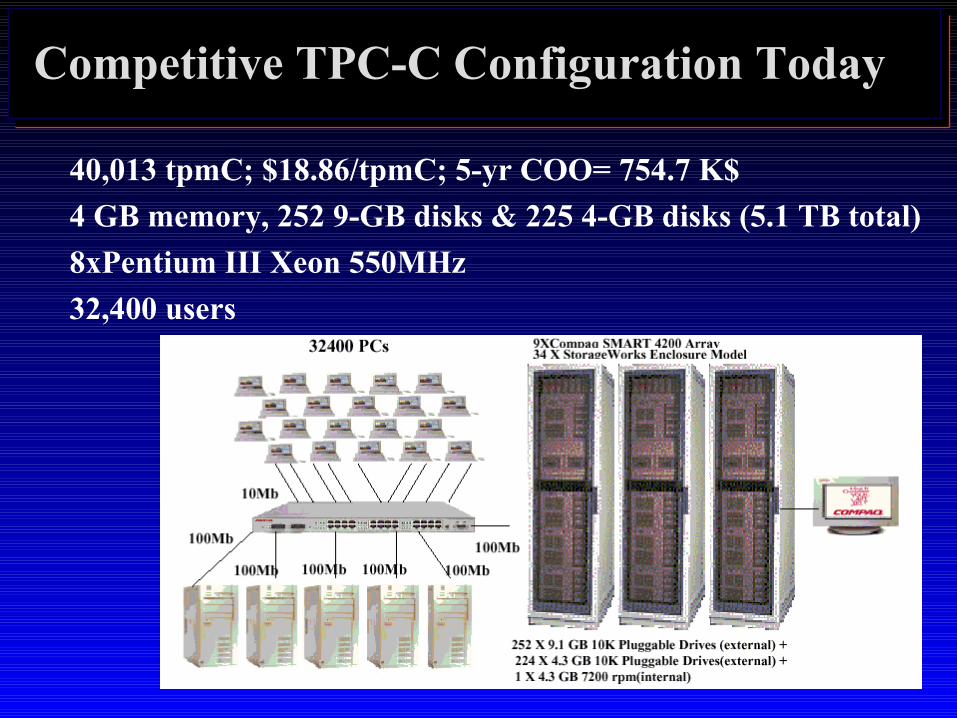
Competitive TPC-C Configuration Today
� 40,013 tpmC; $18.86/tpmC; 5-yr COO= 754.7 K$� 4 GB memory, 252 9-GB disks & 225 4-GB disks (5.1 TB total)� 8xPentium III Xeon 550MHz� 32,400 users

The Complete Guide to TPC-C
� In the spirit of The Compleat Works of Wllm Shkspr (Abridged)…� The Complete Guide to TPC-C:
� First, do several years of prep work. Next,� Install OS� Install and configure database� Build TPC-C database� Install and configure TPC-C application� Install and configure RTE� Run benchmark� Analyze results� Publish
� Typical elapsed time: 2 – 6 months� The Challenge: Do it all in the next 30 minutes!

Resp
on
se Tim
eR
espo
nse T
ime
measu
red h
erem
easured
here
TPC-C Demo Configuration
DB ServerDB Server
......
C/SLAN
Brow
serLA
N
Presentation ServicesPresentation Services Database FunctionsDatabase FunctionsEmulated User LoadEmulated User Load
Driver SystemDriver System ClientClient
COM+COM+RemoteRemoteTerminalTerminalEmulatorEmulator
(RTE)(RTE)
COMPONENTCOMPONENT
ODBC APPODBC APP
UI APPUI APP
ODBCODBC
SQLSQLServerServerWeb ServerWeb Server
New-OrderNew-Order
PaymentPayment
DeliveryDelivery
Stock-LevelStock-Level
Order-StatusOrder-Status
Application CodeApplication Code
ProductsProducts
Legend:Legend:

TPC-C Current Results - 1996
� Best Performance is 30,390 tpmC @ $305/tpmC (Digital)� Best Price/Perf. is 6,185 tpmC @ $111/tpmC (Compaq)
$0
$50
$100
$150
$200
$250
$300
$350
$400
0 5000 10000 15000 20000 25000 30000 35000
CompaqCompaq
DigitalDigital
HPHPIBMIBM
SunSun
$100/tpmC not yet. Soon!

$0
$20
$40
$60
$80
$100
$120
$140
$160
0 20,000 40,000 60,000 80,000 100,000 120,000
Sun
IBM
CompaqSequent
HP
Unisys
TPC-C Current Results
� Best Performance is 115,395 tpmC @ $105/tpmC (Sun)� Best Price/Perf. is 20,195 tpmC @ $15/tpmC (Compaq)
$10/tpmC not yet. Soon!

TPC-C Summary
� Balanced, representative OLTP mix� Five transaction types� Database intensive; substantial IO and cache load� Scaleable workload� Complex data: data attributes, size, skew
� Requires Transparency and ACID� Full screen presentation services� De facto standard for OLTP performance
Preview of TPC-C rev 4.0
� Rev 4.0 is major revision. Previous results will not be comparable; dropped from result list after six months.
� Make txns heavier, so fewer users compared to rev 3.� Add referential integrity.� Adjust R/W mix to have more read, less write.� Reduce response time limits (e.g., 2 sec 90th %-tile vs 5 sec)� TVRand – Time Varying Random – causes workload activity
to vary across database

Outline
� Introduction� History of TPC� TPC-A/B Legacy� TPC-C� TPC-H/R� TPC Futures
TPC-H/R Overview
� Complex Decision Support workload� Originally released as TPC-D
� the result of 5 years of development by the TPC� Benchmark models ad hoc queries (TPC-H) or
reporting (TPC-R)� extract database with concurrent updates� multi-user environment
� Workload consists of 22 queries and 2 update streams� SQL as written in spec
� Database is quantized into fixed sizes (e.g., 1, 10, 30, … GB)� Metrics are Composite Queries-per-Hour (QphH or QphR),
and Price/Performance ($/QphH or $/QphR)� TPC-D specification was approved April 5, 1995
TPC-H/R specifications were approved April, 1999
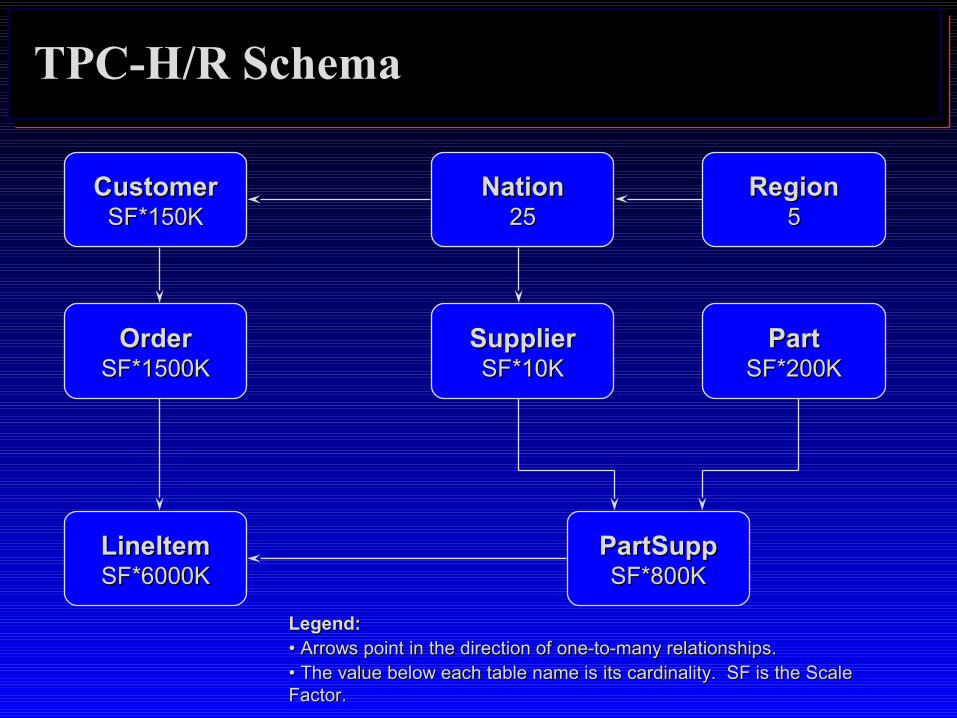
TPC-H/R Schema
CustomerCustomerSF*150KSF*150K
LineItemLineItemSF*6000KSF*6000K
OrderOrderSF*1500KSF*1500K
SupplierSupplierSF*10KSF*10K
NationNation2525
RegionRegion55
PartSuppPartSuppSF*800KSF*800K
PartPartSF*200KSF*200K
Legend:Legend:• • Arrows point in the direction of one-to-many relationships.Arrows point in the direction of one-to-many relationships.• • The value below each table name is its cardinality. SF is the Scale The value below each table name is its cardinality. SF is the Scale Factor.Factor.
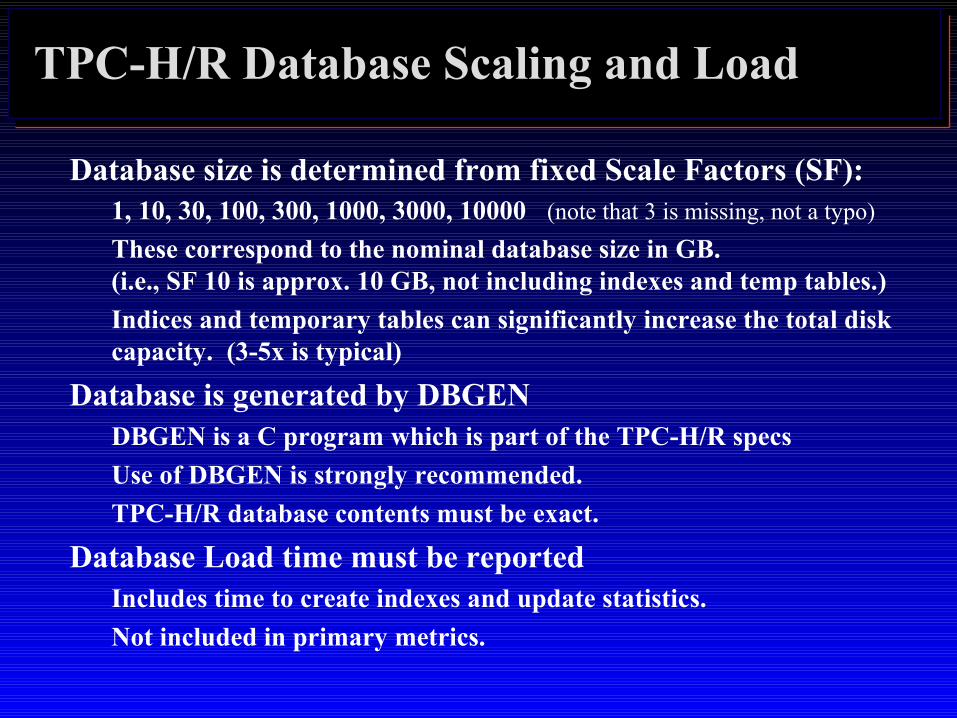
TPC-H/R Database Scaling and Load
� Database size is determined from fixed Scale Factors (SF):� 1, 10, 30, 100, 300, 1000, 3000, 10000 (note that 3 is missing, not a typo)
� These correspond to the nominal database size in GB. (i.e., SF 10 is approx. 10 GB, not including indexes and temp tables.)
� Indices and temporary tables can significantly increase the total disk capacity. (3-5x is typical)
� Database is generated by DBGEN� DBGEN is a C program which is part of the TPC-H/R specs� Use of DBGEN is strongly recommended.� TPC-H/R database contents must be exact.
� Database Load time must be reported� Includes time to create indexes and update statistics.� Not included in primary metrics.
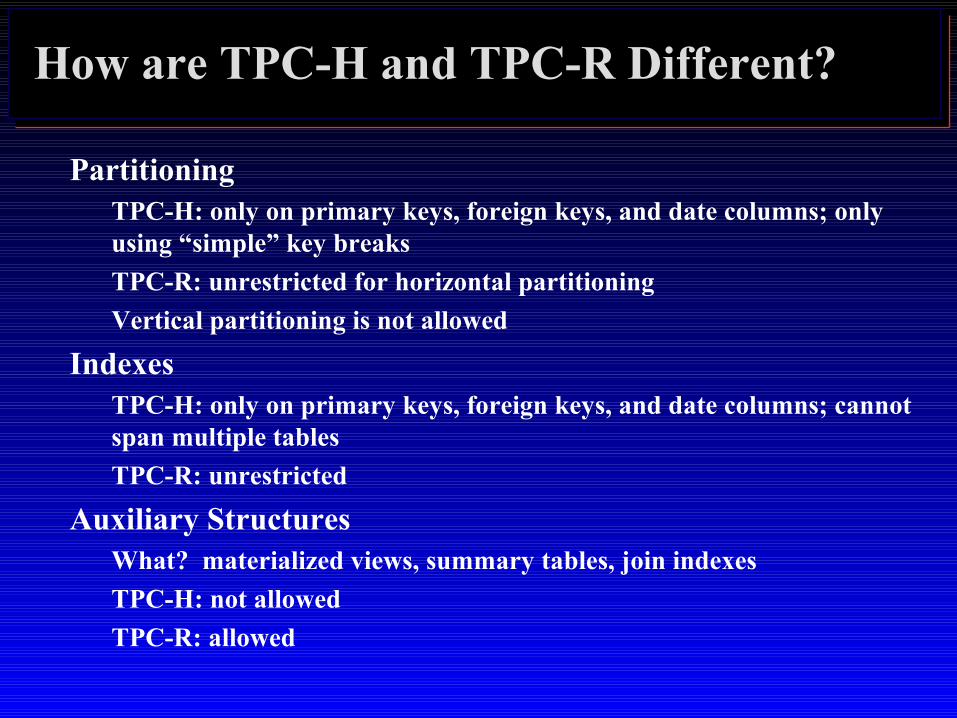
How are TPC-H and TPC-R Different?
� Partitioning� TPC-H: only on primary keys, foreign keys, and date columns; only
using “simple” key breaks� TPC-R: unrestricted for horizontal partitioning� Vertical partitioning is not allowed
� Indexes� TPC-H: only on primary keys, foreign keys, and date columns; cannot
span multiple tables� TPC-R: unrestricted
� Auxiliary Structures� What? materialized views, summary tables, join indexes� TPC-H: not allowed� TPC-R: allowed

TPC-H/R Query Set
� 22 queries written in SQL92 to implement business questions.� Queries are pseudo ad hoc:
� Substitution parameters are replaced with constants by QGEN� QGEN replaces substitution parameters with random values� No host variables� No static SQL
� Queries cannot be modified -- “SQL as written”� There are some minor exceptions.� All variants must be approved in advance by the TPC
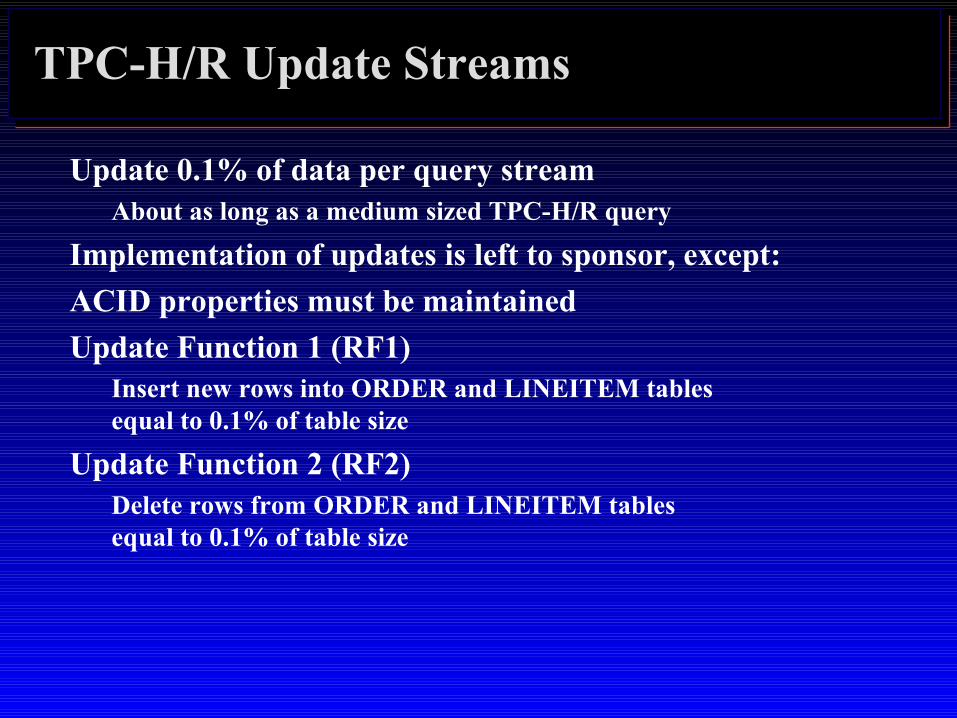
TPC-H/R Update Streams
� Update 0.1% of data per query stream� About as long as a medium sized TPC-H/R query
� Implementation of updates is left to sponsor, except:� ACID properties must be maintained� Update Function 1 (RF1)
� Insert new rows into ORDER and LINEITEM tables equal to 0.1% of table size
� Update Function 2 (RF2)� Delete rows from ORDER and LINEITEM tables
equal to 0.1% of table size
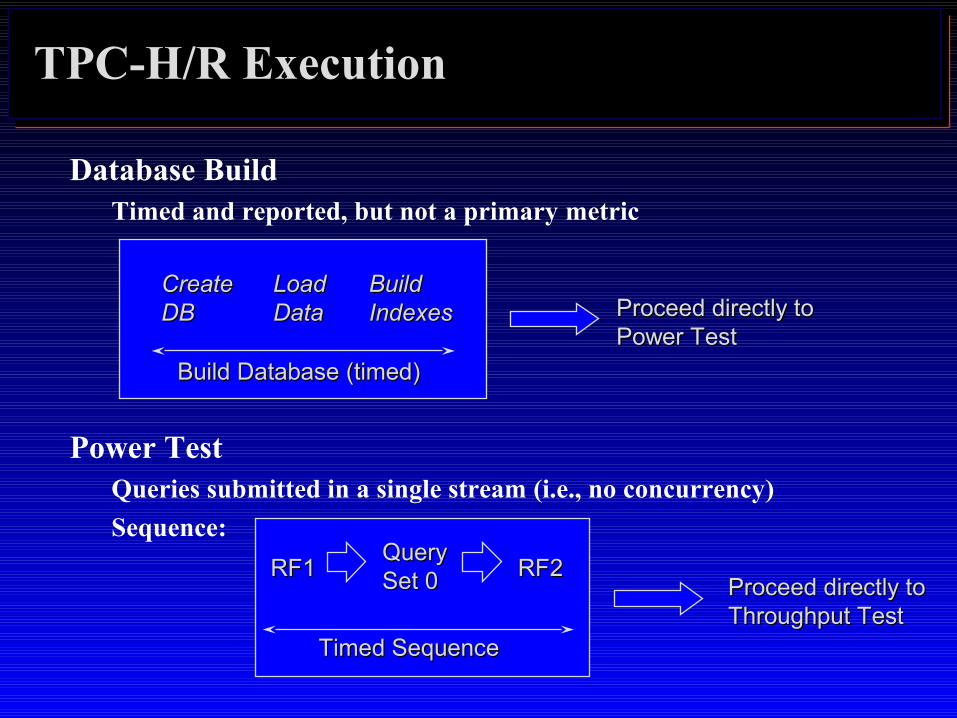
� Database Build� Timed and reported, but not a primary metric
� Power Test� Queries submitted in a single stream (i.e., no concurrency)� Sequence:
TPC-H/R Execution
RF1RF1QueryQuerySet 0Set 0 RF2RF2
Timed SequenceTimed Sequence
Build Database (timed)Build Database (timed)
CreateCreateDBDB
LoadLoadDataData
BuildBuildIndexesIndexes Proceed directly to Proceed directly to
Power TestPower Test
Proceed directly to Proceed directly to Throughput TestThroughput Test

TPC-H/R Execution (cont.)
� Throughput Test� Multiple concurrent query streams� Number of Streams (S) is determined by Scale Factor (SF)
� e.g.: SF=1 S=2; SF=100 S=5; SF=1000 S=7� Single update stream � Sequence:
Query Set 1Query Set 1Query Set 2Query Set 2
Query Set NQuery Set N
RF1 RF2 RF1 RF2 … RF1 RF2RF1 RF2 RF1 RF2 … RF1 RF2 1 2 … N1 2 … N
Updates:Updates:
.... ..

TPC-H/R Secondary Metrics
� Power Metric� Geometric queries per hour times SF
� Throughput Metric� Linear queries per hour times SF
24
22
1
2
1
)0,()0,(
3600@
∏ ∏=
=
=
=
•
•=i
i
j
j
jRIiQI
SFSizePower
where QI(i,0) ≡ Timing Interval for Query i, stream 0 RI(j,0) ≡ Timing Interval for refresh function RFj SF ≡ Scale Factor

TPC-R/H Primary Metrics
� Composite Query-Per-Hour Rating (QphH or QphR)� The Power and Throughput metrics are combined to get
the composite queries per hour.
� Reported metrics are:� Composite: QphH@Size� Price/Performance: $/QphH@Size� Availability Date
� Comparability:� Results within a size category (SF) are comparable.� Comparisons among different size databases are strongly discouraged.
SizeThroughputSizePowerSizeQphH @@@ •=
TPC-H/R Results
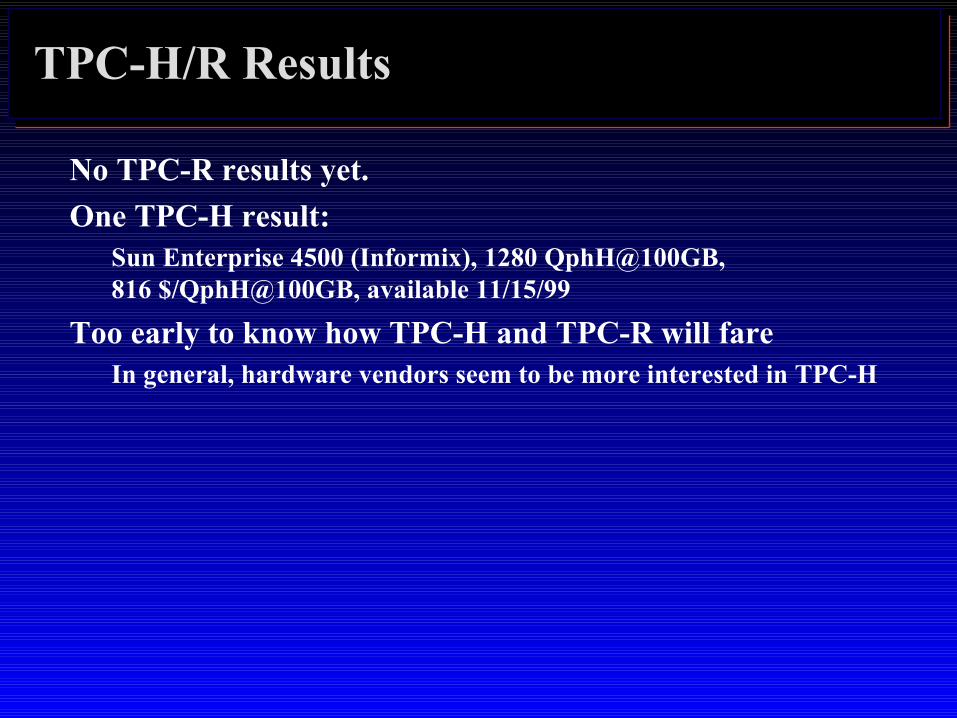
� No TPC-R results yet.� One TPC-H result:
� Sun Enterprise 4500 (Informix), 1280 QphH@100GB, 816 $/QphH@100GB, available 11/15/99
� Too early to know how TPC-H and TPC-R will fare� In general, hardware vendors seem to be more interested in TPC-H
Outline
� Introduction� History of TPC� TPC-A/B� TPC-C� TPC-H/R� TPC Futures
Next TPC Benchmark: TPC-W
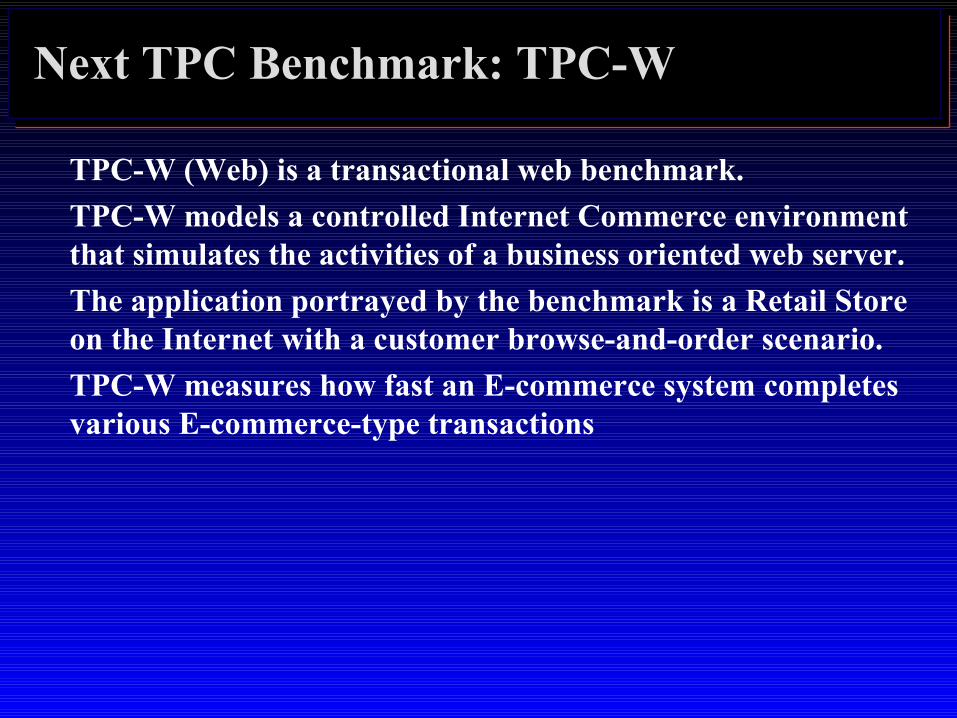
� TPC-W (Web) is a transactional web benchmark.� TPC-W models a controlled Internet Commerce environment
that simulates the activities of a business oriented web server. � The application portrayed by the benchmark is a Retail Store
on the Internet with a customer browse-and-order scenario.� TPC-W measures how fast an E-commerce system completes
various E-commerce-type transactions
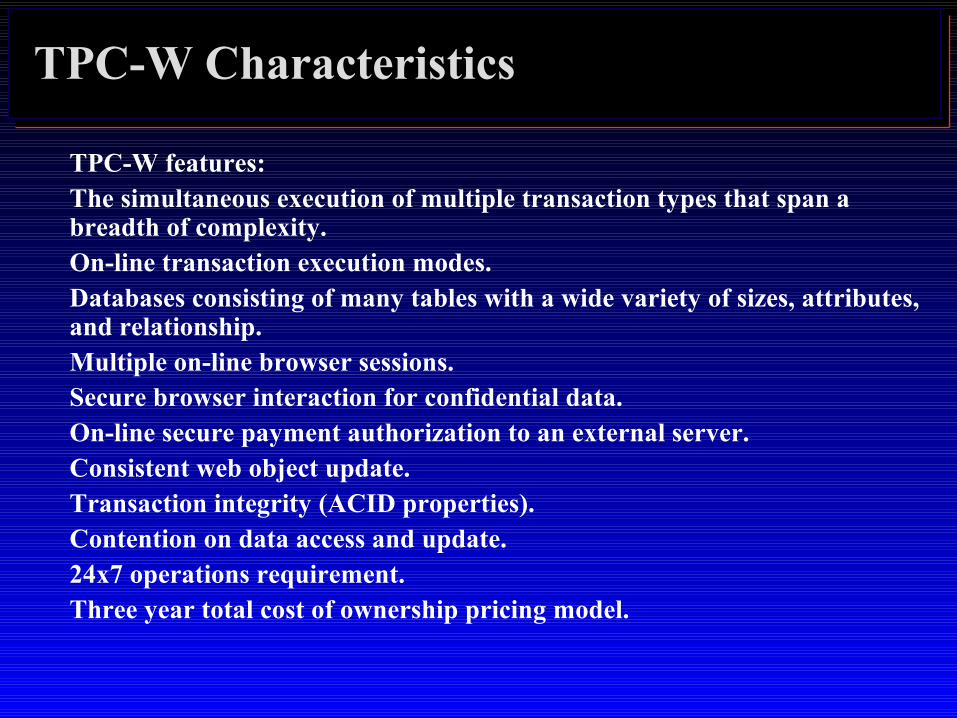
TPC-W Characteristics
� TPC-W features: � The simultaneous execution of multiple transaction types that span a
breadth of complexity. � On-line transaction execution modes. � Databases consisting of many tables with a wide variety of sizes, attributes,
and relationship. � Multiple on-line browser sessions. � Secure browser interaction for confidential data. � On-line secure payment authorization to an external server. � Consistent web object update. � Transaction integrity (ACID properties). � Contention on data access and update. � 24x7 operations requirement. � Three year total cost of ownership pricing model.
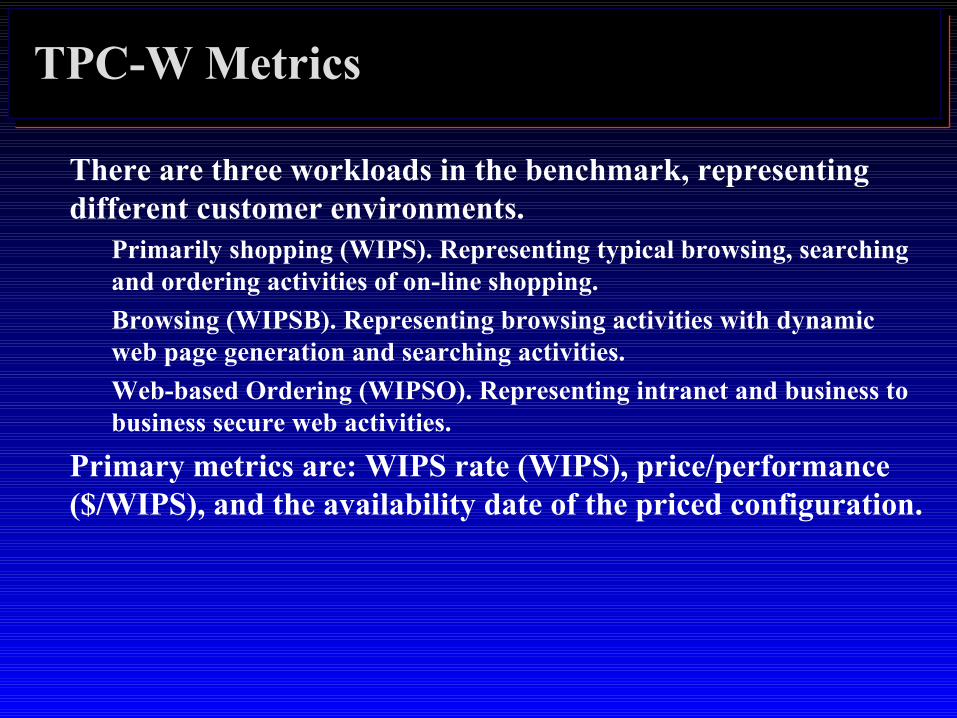
TPC-W Metrics
� There are three workloads in the benchmark, representing different customer environments.
� Primarily shopping (WIPS). Representing typical browsing, searching and ordering activities of on-line shopping.
� Browsing (WIPSB). Representing browsing activities with dynamic web page generation and searching activities.
� Web-based Ordering (WIPSO). Representing intranet and business to business secure web activities.
� Primary metrics are: WIPS rate (WIPS), price/performance ($/WIPS), and the availability date of the priced configuration.

TPC-W Public Review
� TPC-W specification is currently available for public review on TPC web site.
� Approved standard likely in Q1/2000

Reference Material
� Jim Gray, The Benchmark Handbook for Database and Transaction Processing Systems, Morgan Kaufmann, San Mateo, CA, 1991.
� Raj Jain, The Art of Computer Systems Performance Analysis: Techniques for Experimental Design, Measurement, Simulation, and Modeling, John Wiley & Sons, New York, 1991.
� William Highleyman, Performance Analysis of Transaction Processing Systems, Prentice Hall, Englewood Cliffs, NJ, 1988.
� TPC Web site: www.tpc.org� IDEAS web site: www.ideasinternational.com

The End
Background Material on TPC-A/B

TPC-A Overview
� Transaction is simple bank account debit/credit� Database scales with throughput� Transaction submitted from terminal
Read 100 bytes including Aid, Tid, Bid, Delta from terminal (see Clause 1.3)BEGIN TRANSACTION
Update Account where Account_ID = Aid:Read Account_Balance from AccountSet Account_Balance = Account_Balance + DeltaWrite Account_Balance to Account
Write to History:Aid, Tid, Bid, Delta, Time_stamp
Update Teller where Teller_ID = Tid:Set Teller_Balance = Teller_Balance + DeltaWrite Teller_Balance to Teller
Update Branch where Branch_ID = Bid:Set Branch_Balance = Branch_Balance + DeltaWrite Branch_Balance to Branch
COMMIT TRANSACTIONWrite 200 bytes including Aid, Tid, Bid, Delta, Account_Balance to terminal
TPC-A TransactionTPC-A Transaction

TPC-A Database Schema
LegendLegend
Table NameTable Name<cardinality><cardinality>
one-to-manyone-to-manyrelationshiprelationship
BranchBranchBB
AccountAccountB*100KB*100K
100K100K
HistoryHistoryB*2.6MB*2.6M
TellerTellerB*10B*101010
10 Terminals per Branch row10 Terminals per Branch row10 second cycle time per terminal10 second cycle time per terminal1 transaction/second per Branch row1 transaction/second per Branch row

TPC-A Transaction
� Workload is vertically aligned with Branch� Makes scaling easy� But not very realistic
� 15% of accounts non-local� Produces cross database activity
� What’s good about TPC-A?� Easy to understand� Easy to measured � Stresses high transaction rate, lots of physical IO
� What’s bad about TPC-A?� Too simplistic! Lends itself to unrealistic optimizations

TPC-A Design Rationale
� Branch & Teller� in cache, hotspot on branch
� Account� too big to cache ⇒ requires disk access
� History� sequential insert� hotspot at end� 90-day capacity ensures reasonable ratio of disk to cpu
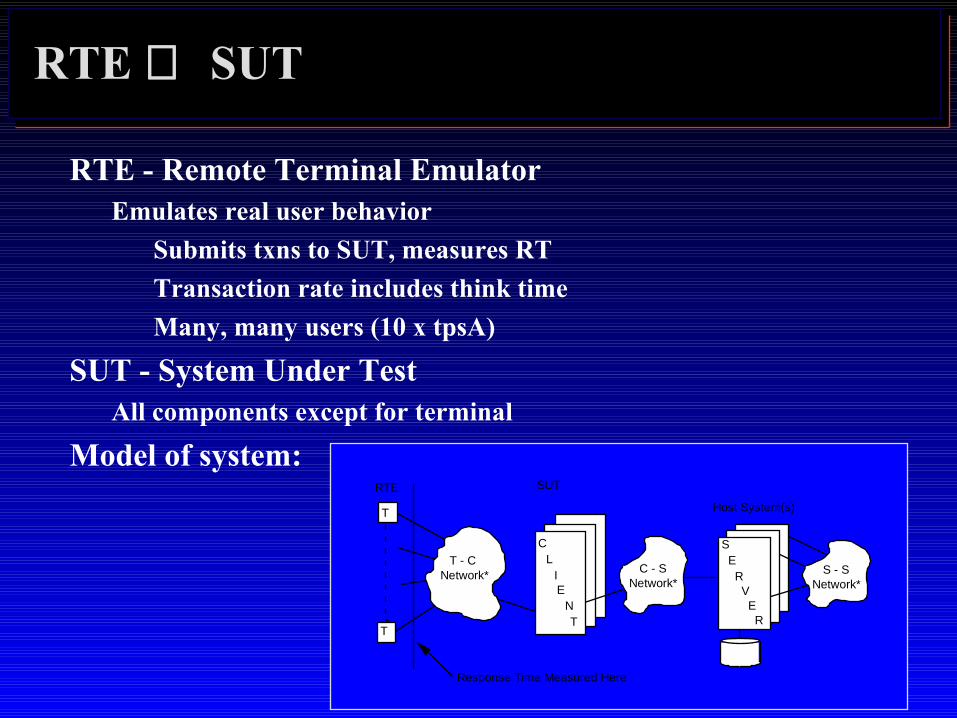
RTE ⇔ SUT
� RTE - Remote Terminal Emulator� Emulates real user behavior
� Submits txns to SUT, measures RT� Transaction rate includes think time� Many, many users (10 x tpsA)
� SUT - System Under Test� All components except for terminal
� Model of system:
T
T
T - C Network*
CL
IE
NT
C - S Network*
SUTRTE
Response Time Measured Here
Host System(s)
S - S Network*
SERVER
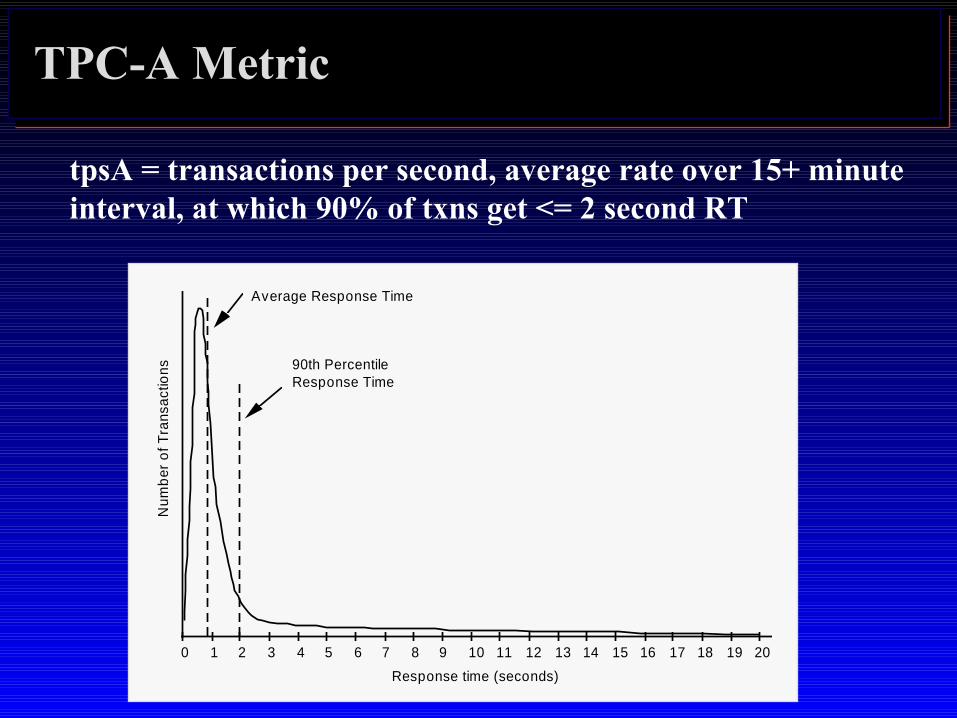
TPC-A Metric
� tpsA = transactions per second, average rate over 15+ minute interval, at which 90% of txns get <= 2 second RT
0 1 2 3 4 5 6 7 8 9 10 11 12 13 14 15 16 17 18 19 20
Response time (seconds)
Num
ber
of T
rans
actio
ns
Average Response Time
90th Percentile Response Time

TPC-A Price
� Price� 5 year Cost of Ownership: hardware, software, maintenance� Does not include development, comm lines, operators, power, cooling,
etc.� Strict pricing model ⇒ one of TPC’s big contributions� List prices� System must be orderable & commercially available� Committed ship date
Differences between TPC-A and TPC-B
� TPC-B is database only portion of TPC-A� No terminals� No think times
� TPC-B reduces history capacity to 30 days� Less disk in priced configuration
� TPC-B was easier to configure and run, BUT� Even though TPC-B was more popular with vendors,
it did not have much credibility with customers.

TPC Loopholes
� Pricing� Package pricing� Price does not include cost of five star wizards needed to get optimal
performance, so performance is not what a customer could get.
� Client/Server� Offload presentation services to cheap clients, but report performance
of server
� Benchmark specials� Discrete transactions� Custom transaction monitors� Hand coded presentation services