25 august 2021 fy21 results
TRANSCRIPT

FY21 Results25 August 2021
— Investor presentation

Important notice and disclaimer
This presentation is provided for information purposes only. The information in this presentation
is in a summary form, does not purport to be complete and is not intended to be relied upon
as advice to investors or other persons. The information contained in this presentation was
prepared by Whispir Limited (Whispir) as of its date, and remains subject to change without
notice. This presentation has been provided to you solely for the purpose of giving you
background information about Whispir.
Forward-looking statements
This presentation may include forward-looking statements. Such statements can generally be
identified by the use of words such as ‘may’, ‘will’, ‘expect’, ‘intend’, ‘plan’, ‘estimate’, ‘anticipate’,
‘believe’, ‘continue’, ‘objectives’, ‘outlook’, ‘guidance‘, ‘forecast’ and similar expressions.
Indications of plans, strategies, management objectives, sales and financial performance are
also forward-looking statements.
Such statements are not guarantees of future performance, and involve known and unknown
risks, uncertainties, assumptions, contingencies and other factors, many of which are outside
the control of Whispir Limited (Whispir or Company). No representation is made or will be
made that any forward-looking statements will be achieved or will prove to be correct. Actual
results, performance, operations or achievements may vary materially from any forward-looking
statements. Circumstances may change and the contents of this presentation may become
outdated as a result. Readers are cautioned not to place undue reliance on forward-looking
statements and Whispir assumes no obligation to update such statements.
No representation or warranty, expressed or implied, is made as to the accuracy, reliability,
adequacy or completeness of the information contained in this presentation.
Past performance
Past performance information given in this presentation is given for illustrative purposes only
and should not be relied upon as (and is not) an indication of future performance.
Information is not advice or offer of securities
This presentation is not, and is not intended to constitute, financial advice, or an offer or an
invitation, solicitation or recommendation to acquire or sell Whispir shares or any other financial
products in any jurisdiction and is not a prospectus, product disclosure statement, disclosure
document or other offering document under Australian law or any other law. This presentation
also does not form the basis of any contract or commitment to sell or apply for securities in
Whispir or any of its subsidiaries. It is for information purposes only.
Whispir does not warrant or represent that the information in this presentation is free from errors,
omissions or misrepresentations or is suitable for your intended use. The information contained in
this presentation has been prepared without taking account of any person’s investment objectives,
financial situation or particular needs and nothing contained in this presentation constitutes
investment, legal, tax or other advice. The information provided in this presentation may not
be suitable for your specific needs and should not be relied up on by you in substitution of you
obtaining independent advice. Subject to any terms implied by law and which cannot be excluded,
Whispir accepts no responsibility for any loss, damage, cost or expense (whether direct, or indirect,
consequential, exceptional or special damages including but not limited to loss of revenue, profits,
time, goodwill, data, anticipated savings, opportunity, business reputation, future reputation,
production or profit, any delay costs, economic loss or damage) incurred by you as a result of any
error, omission or misrepresentation in this presentation.
Preparation of information
All financial information has been prepared and reviewed in accordance with Australian
Accounting Standards. Certain financial data included in this presentation is ‘non-IFRS financial
information’. The Company believes that this non-IFRS financial information provides useful
insight in measuring the financial performance and condition of Whispir. Readers are cautioned
not to place undue reliance on any non-IFRS financial information including ratios included in
this presentation.
Presentation of information
• Currency All amounts in this presentation are in Australian dollars unless otherwise stated.
• FY refers to the full year to 30 June.
• Rounding Amounts in this document have been rounded to the nearest $0.1m. Any differences
between this document and the accompanying financial statements are due to rounding.
Third party information and market data
The views expressed in this presentation contain information that has been derived from publicly
available sources that have not been independently verified. No representation or warranty is
made as to the accuracy, completeness or reliability of the information. This presentation should
not be relied upon as a recommendation or forecast by Whispir. Market share information is
based on management estimates except where explicitly identified.
No liability or responsibility
The information in this presentation is general in nature and is provided in summary form and is
therefore does not purport to be complete.
To the maximum extent permitted by law, Whispir and each of its affiliates, directors, employees,
officers, partners, agents and advisers and any other person involved in the preparation of this
presentation disclaim all liability and responsibility (including without limitation, any liability arising
from fault or negligence) for any direct or indirect loss or damage which may arise or be suffered
through use or reliance on anything contained in, or omitted from, this presentation. Whispir
accepts no responsibility or obligation to inform you of any matter arising or coming to their notice,
after the date of this presentation, which may affect any matter referred to in this presentation.
This presentation should be read in conjunction with Whispir’s other periodic and continuous
disclosure announcements lodged with ASX.
FY21 Results – Investor presentation Page – 02

FY21 Results – Investor presentation Page – 03
Whispir todayA global scale SaaS company providing a communications workflow platform that automates interactions between organisations and people to innovate engagement and solve a growing range of business challenges.
Leading industry channel partners provide efficient routes to market
3 Regions
Global customer base
60 Countries171 net new customers through FY21
801 customers
Worldwide and growing
200+ Staff
New customers Growth customers Channel partners

Agenda
FY21 Results – Investor presentation Page – 04
Business updateStrong ARR and customer growth
Strategic focusProduct development and performance across ANZ, Asia and North America
Financial resultsWell positioned to continue accelerating growth
FY22 outlookGlobal mega trends provide strong and enduring tailwinds Jeromy Wells — CEO Justin Owen — CFO

FY21 Results – Investor presentation Page – 05
Business update

FY21 Results – Investor presentation
Annualised recurring revenue growthContinued growth year-on-year as existing customers extract more value from the platform
$53.6mFY21 Annualised Recurring Revenue
Page – 06
FY20 ARR: $41.7m
28.5% YOY GROWTH

H1-
13
H1-
17
H1-
11
H1-
09
H1-
10
H2-
09
H2-
10
H1-
15
H1-
19
H1-
14
H1-
18
H1-
12
H1-
16
H1-
20
H1-
21
H2-
21
H2-
13
H2-
17
H2-
11
H2-
15
H2-
19
H2-
14
H2-
18
H2-
12
H2-
16
H2-
20
Providing revenue surety for years to come
Strong customer revenue retention of 115.9% for FY21
• Long-term, sticky nature of customer base continues to provide future revenue surety, as they spend more over time
• New customers on boarded in FY21 provide a platform for future revenue growth in FY22 and beyond
Page – 07FY21 Results – Investor presentation
$0
$10
$5
$15
$50
$55
$35
$45
$30
$40
$25
$20
$m
*Excludes fluctuating transactional customers, ARR is on a gross basis
IPO
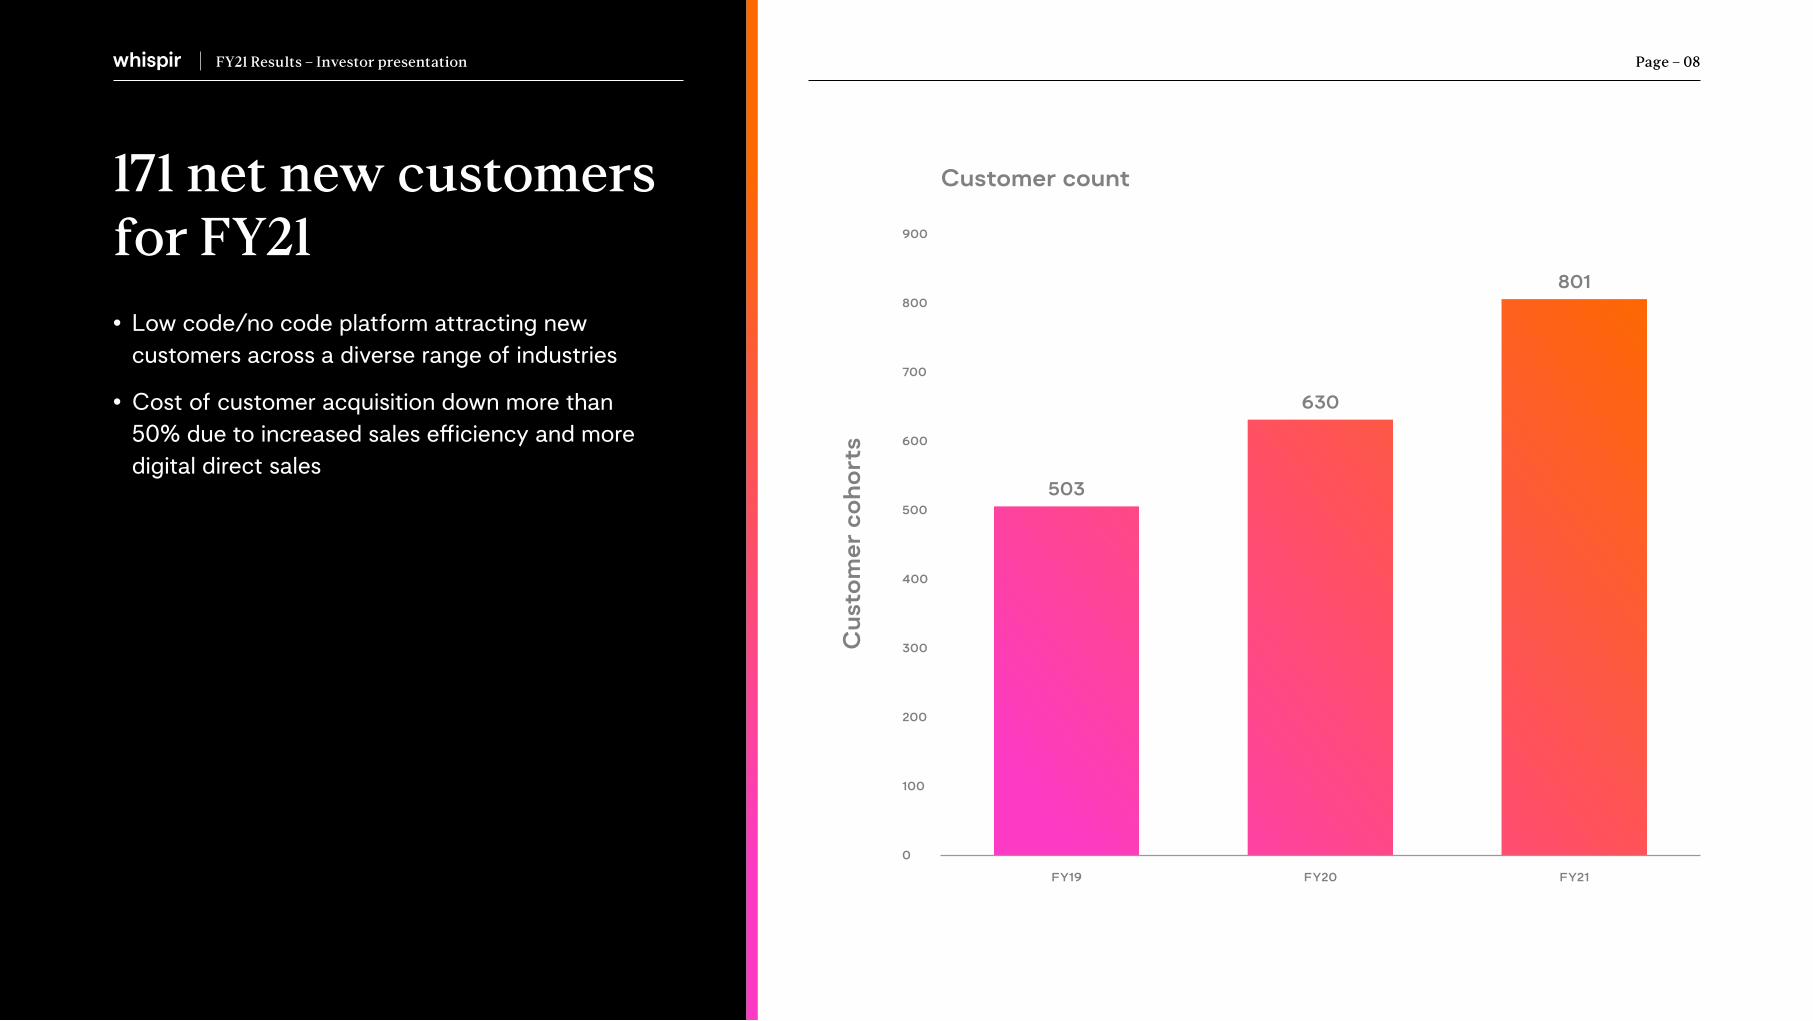
171 net new customers for FY21
• Low code/no code platform attracting new customers across a diverse range of industries
• Cost of customer acquisition down more than 50% due to increased sales efficiency and more digital direct sales
Page – 08FY21 Results – Investor presentation
0
200
100
700
800
900
400
600
500
300
503
FY19
630
FY20
801
FY21
Cus
tom
er c
ohor
ts
Customer count
FY21 Results – Investor presentation
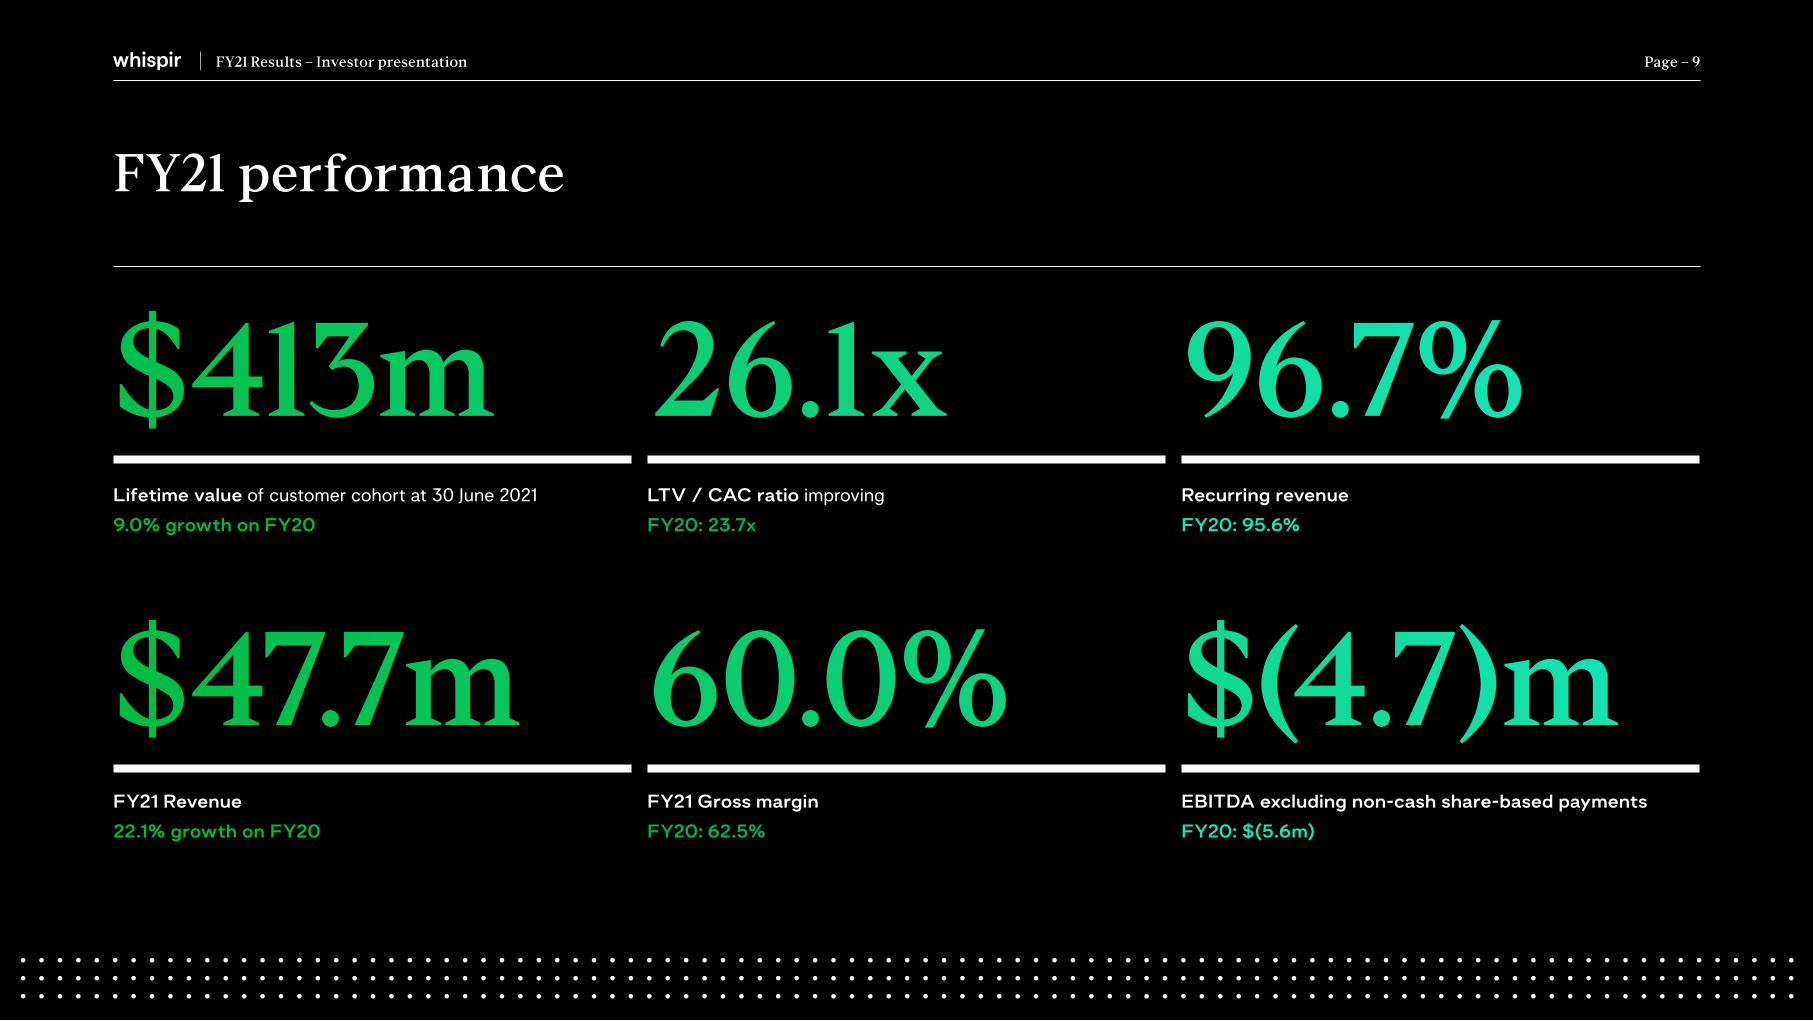
FY21 performance
Lifetime value of customer cohort at 30 June 2021
9.0% growth on FY20
FY21 Revenue
22.1% growth on FY20
LTV / CAC ratio improving
FY20: 23.7x
Recurring revenue
FY20: 95.6%
FY21 Gross margin
FY20: 62.5%
EBITDA excluding non-cash share-based payments
FY20: $(5.6m)
$413m
$47.7m
26.1x
60.0% $(4.7)m
96.7%
Page – 9

FY21 Results – Investor presentation
Strong momentum heading into FY22New customer cohorts yet to have material impact on ARR but provide momentum for FY22 and beyond as they increase platform usage over time
Page – 10
ARR contribution from new customers by half yearly customer cohort (Jun’19 - Jun’21)
$m
Customer cohorts
June-19 ARR H2FY20
$3.2m
H1FY21
$3.7m
Install Base
$12.4m
H1FY20
$1.6m
H2FY21
$1.3m
June-21 ARR
25
0
10
20
30
50
45
40
35
$31.3m
$53.6m
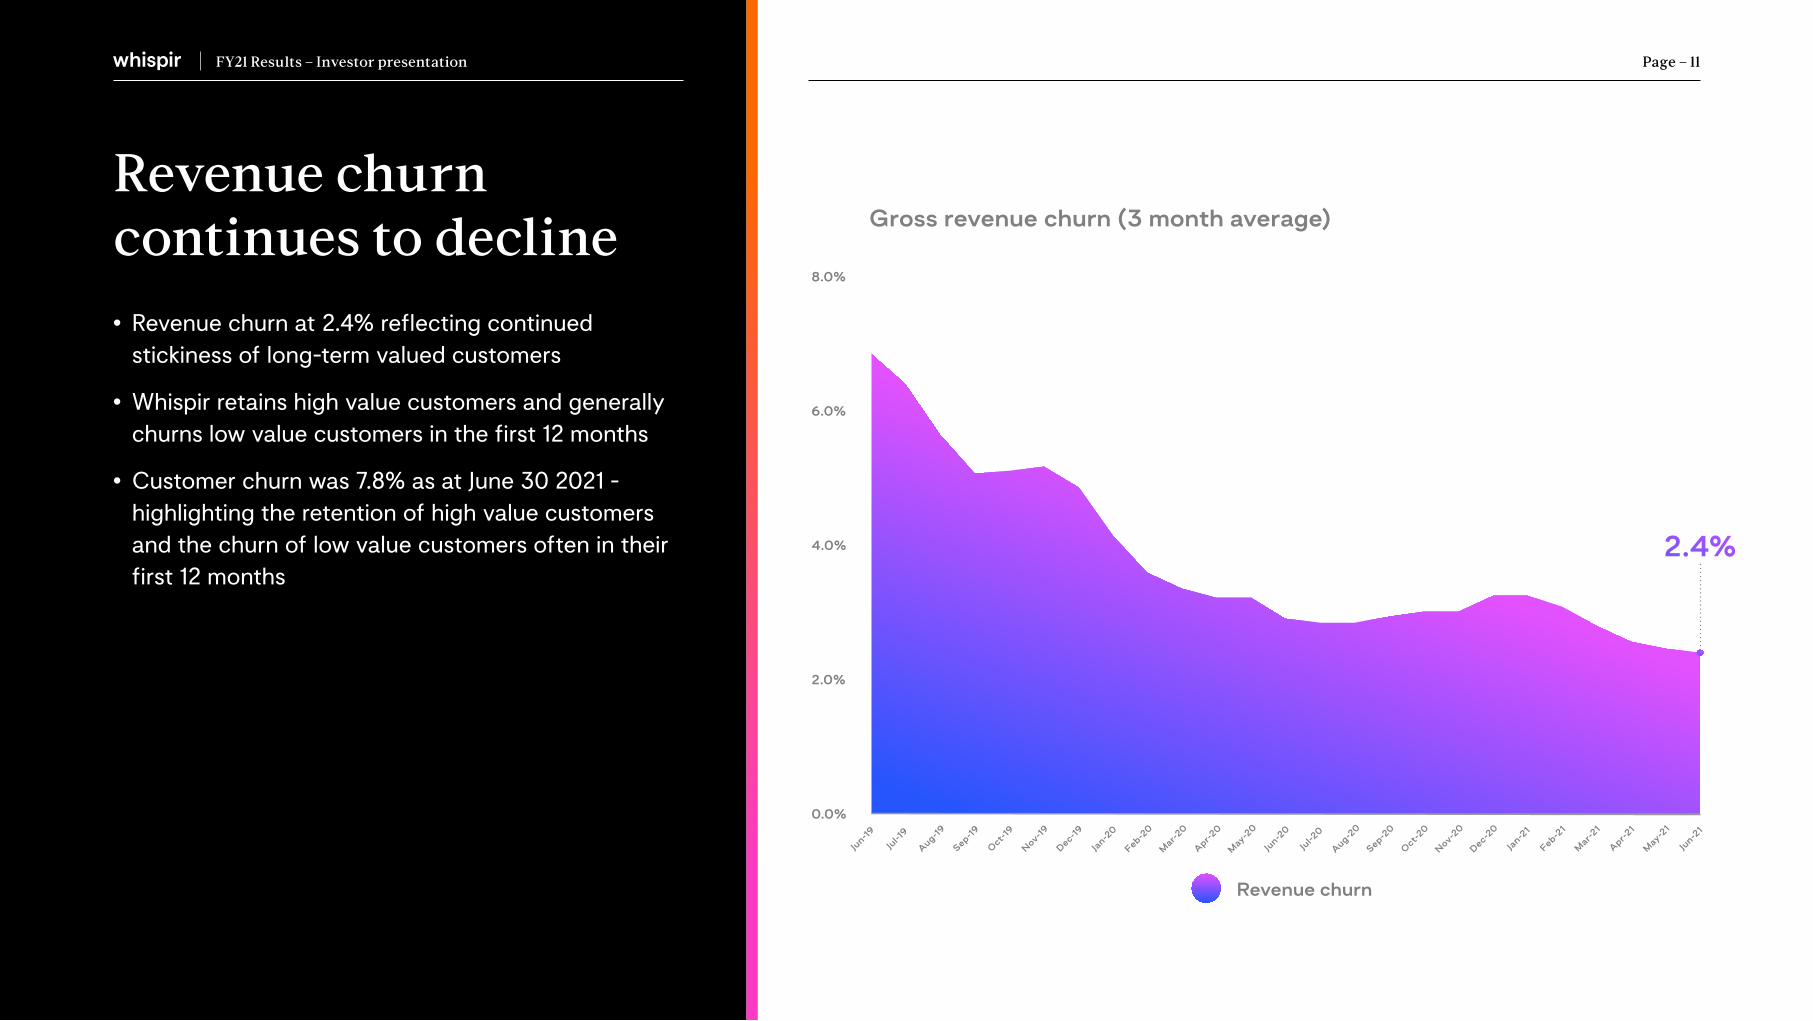
Revenue churn continues to decline
• Revenue churn at 2.4% reflecting continued stickiness of long-term valued customers
• Whispir retains high value customers and generally churns low value customers in the first 12 months
• Customer churn was 7.8% as at June 30 2021 - highlighting the retention of high value customers and the churn of low value customers often in their first 12 months
Page – 11FY21 Results – Investor presentation
Gross revenue churn (3 month average)
0.0%
4.0%
2.0%
6.0%
8.0%
Dec-19
Jul-1
9
Apr-20
Apr-21
Aug-20
Feb-20
Feb-21
Sep-19
Jun-2
0
Jun-2
1
Oct-2
0
Jan-2
0
Jan-2
1
Aug-19
May-2
0
May-2
1
Sep-20
Jun-19
Mar-2
0
Mar-2
1
Nov-19
Oct-1
9
Jul-2
0
Nov-20
Dec-20
Revenue churn
2.4%

FY21 Results – Investor presentation
Land and expand strategy Network effect within customers growing revenue and utilisation over time
Page – 12
1 Use Case+42% YOY
500 Customers
FY21
352 Customers
FY20
297 Customers
FY19
AVG MRR
$943
2-3 Use Cases+10% YOY FY21
210 Customers
FY20
191 Customers
FY19
152 Customers
AVG MRR
$5,576
4+ Use Cases+5% YOY FY21
91 Customers
FY20
87 Customers
FY19
54 Customers
AVG MRR
$31,016
4+ Use Cases Average MRR per customer
34% on FY20$31k
Average ARR per customer
$67k

Chemist WarehouseA land and expand customer
Chemist Warehouse are the largest pharmacy retailer in Australia, servicing
both Australia and New Zealand. They implemented Whispir with one use
case, which has now grown to six use cases including ePrescriptions and
COVID-19 vaccination communications.
Using Whispir, Chemist Warehouse has enhanced the customer experience
through frictionless online sales, contactless click and collect services and
automating operational processes.
Case Study Page – 13
2016
2019
2020
2021
Whispir engaged to facilitate ‘Click and Collect’
notifications across Australia and New Zealand
IT incident notification use case created to streamline
and enhance IT maintenance across all retail stores
In-Store pick-up notification use case
to align with COVID safety protocols
ePrescription service goes live with COVID vaccination
booking, confirmation and reminders rolled out in June

Financial results
FY21 Results – Investor presentation Page – 14

FY21($m’s)
FY20 ($m’s)
YOY Change* (%)
Software revenue 46.3 37.4 23.9%
Professional services revenue 1.4 1.7 (16.0)%
Revenue 47.7 39.1 22.1%
Gross Margin 28.7 24.4 17.3%
Gross Margin % 60.0% 62.5% (4.0)%
Sales and marketing (16.9) (14.2) (18.4)%
Research and development (5.0) (4.3) (17.3)%
General and administration (13.0) (13.2) 1.7%
Total operating expenses (34.9) (31.7) (9.9)%
EBITDA (6.2) (7.3) 15.1%
EBITDA (ex non-cash, share-based payments)
(4.7) (5.6) 17.5%
FY21 Results – Investor presentation
Financial performance
• Revenue increased 22.1% YOY to $47.7m with significant contribution from ANZ region
• Gross margin percentage reflecting investment for future growth
• Operating EBITDA measures leverage to revenue growth and investment in R&D, sales and marketing
• General and administration demonstrating effective cost management with growing revenue
Page – 15
*YOY percentage movement based upon values denominated in $’000’s

FY21 Results – Investor presentation
Driving growth through the platformContinued growth in platform and transactional revenue
Page – 16
Transactional revenue
Platform revenue
Services
Transactional revenue
30.6%
Platform revenue
10.4%
68.0%
28.9%
3.1%0%
20%
10%
30%
40%
FY21 Revenue growth PCPFY21 Revenue composition
Group revenue
$47.7m

FY21 Results – Investor presentation Page – 17
Balance sheet
Whispir is well-funded to execute its growth strategy
• Net investment in Whispir platform increased 36% year on year
• Cash balance strengthened by capital raise
• Well positioned to execute on strategic objectives
• No debt
A$(‘m)
30 June 2021 Statutory
Assets
Current assets
Cash and cash equivalents 49.2
Trade and other receivables 6.5
Contract acquisition costs 2.3
Other current assets 2.4
Total current assets 60.4
Non-current assets
Intangibles 10.8
Contract acquisition costs 1.4
Other non-current assets 3.2
Total non-current assets 15.4
Total Assets 75.8
Liabilities
Total liabilities
Trade and other payables (13.4)
Contract liabilities (2.0)
Other liabilities (4.7)
Total liabilities (20.1)
Net (liability)/assets 55.7
4.0
0.0
10.0
6.0
2.0
14.0
18.0
16.0
12.0
8.0
FY21 Results – Investor presentation
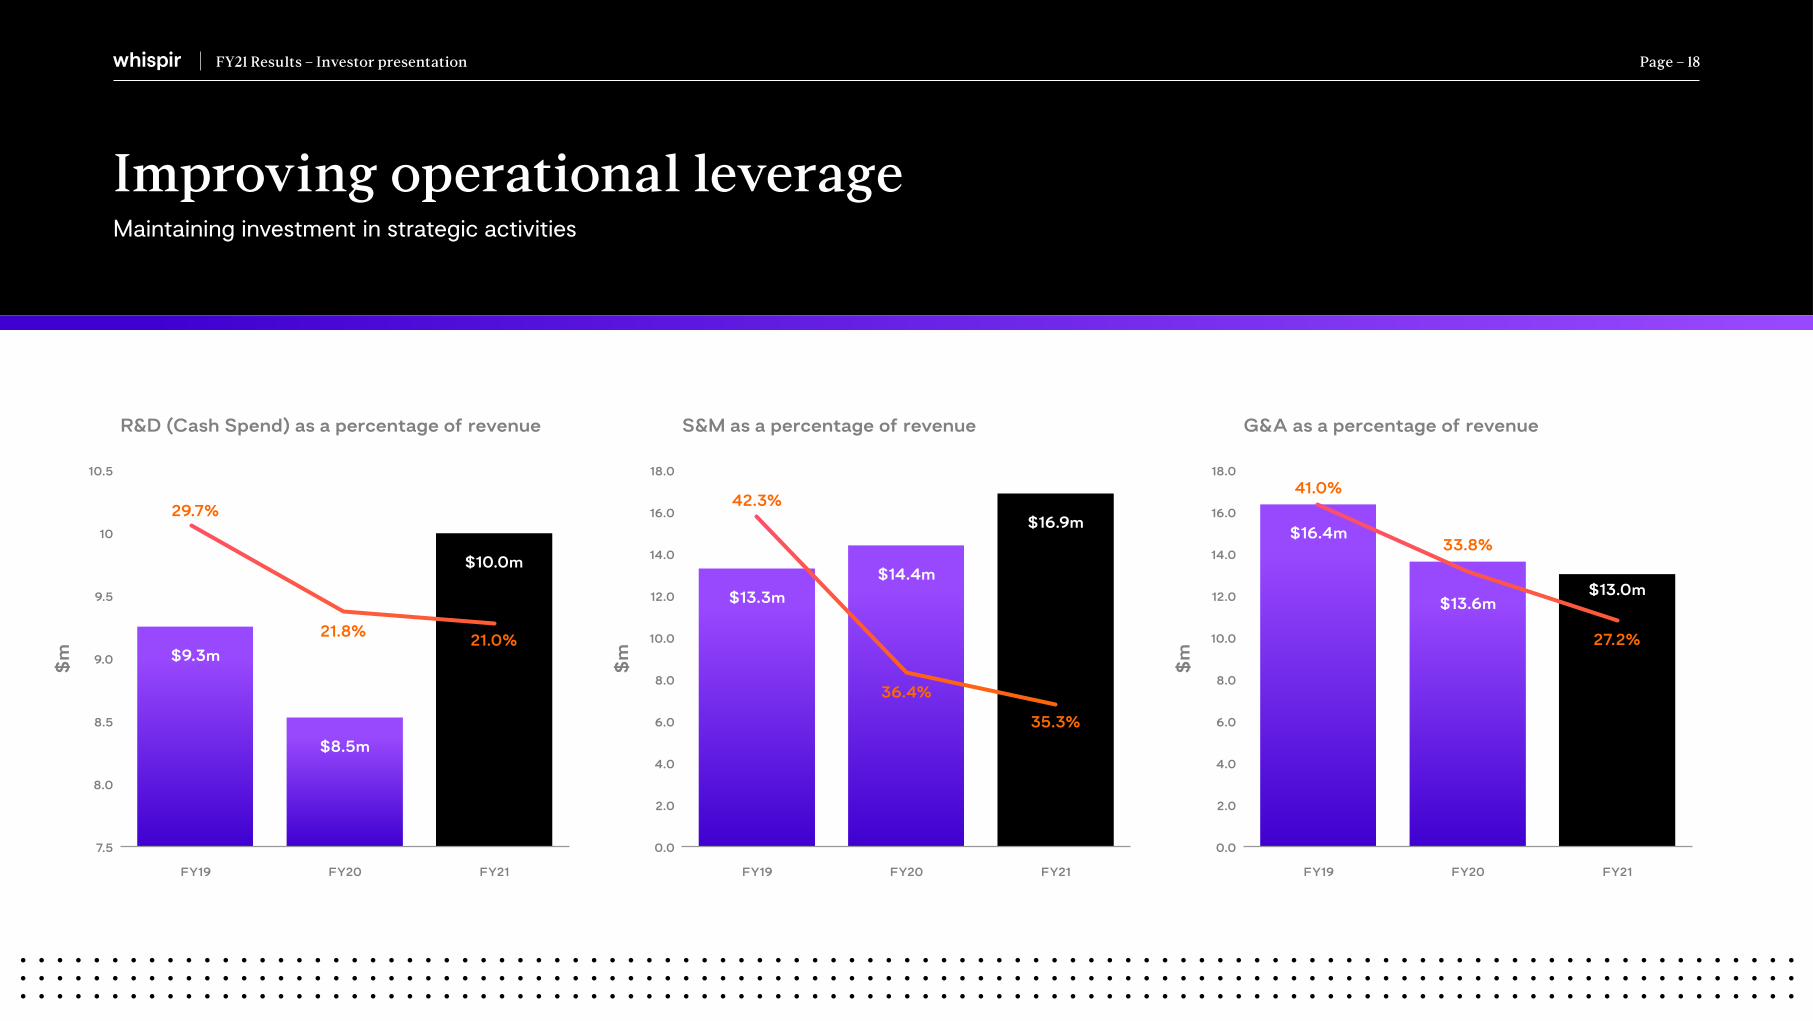
Improving operational leverageMaintaining investment in strategic activities
Page – 18
R&D (Cash Spend) as a percentage of revenue S&M as a percentage of revenue G&A as a percentage of revenue
FY21 FY21FY20 FY20FY19 FY19
$10.0m
$16.9m
35.3%$8.5m
$14.4m
36.4%
$9.3m
29.7%
21.8% 21.0%
$13.3m
42.3%
8.5
7.5
9.5
9.0
8.0
10
10.5
4.0
0.0
10.0
6.0
2.0
14.0
18.0
16.0
12.0
8.0
FY21FY20FY19
$m
$m
$m
$13.0m
27.2%
$13.6m
33.8%$16.4m
41.0%

FY21 Results – Investor presentation Page – 19
Strategic focus
FY21 Results – Investor presentation Page – 20
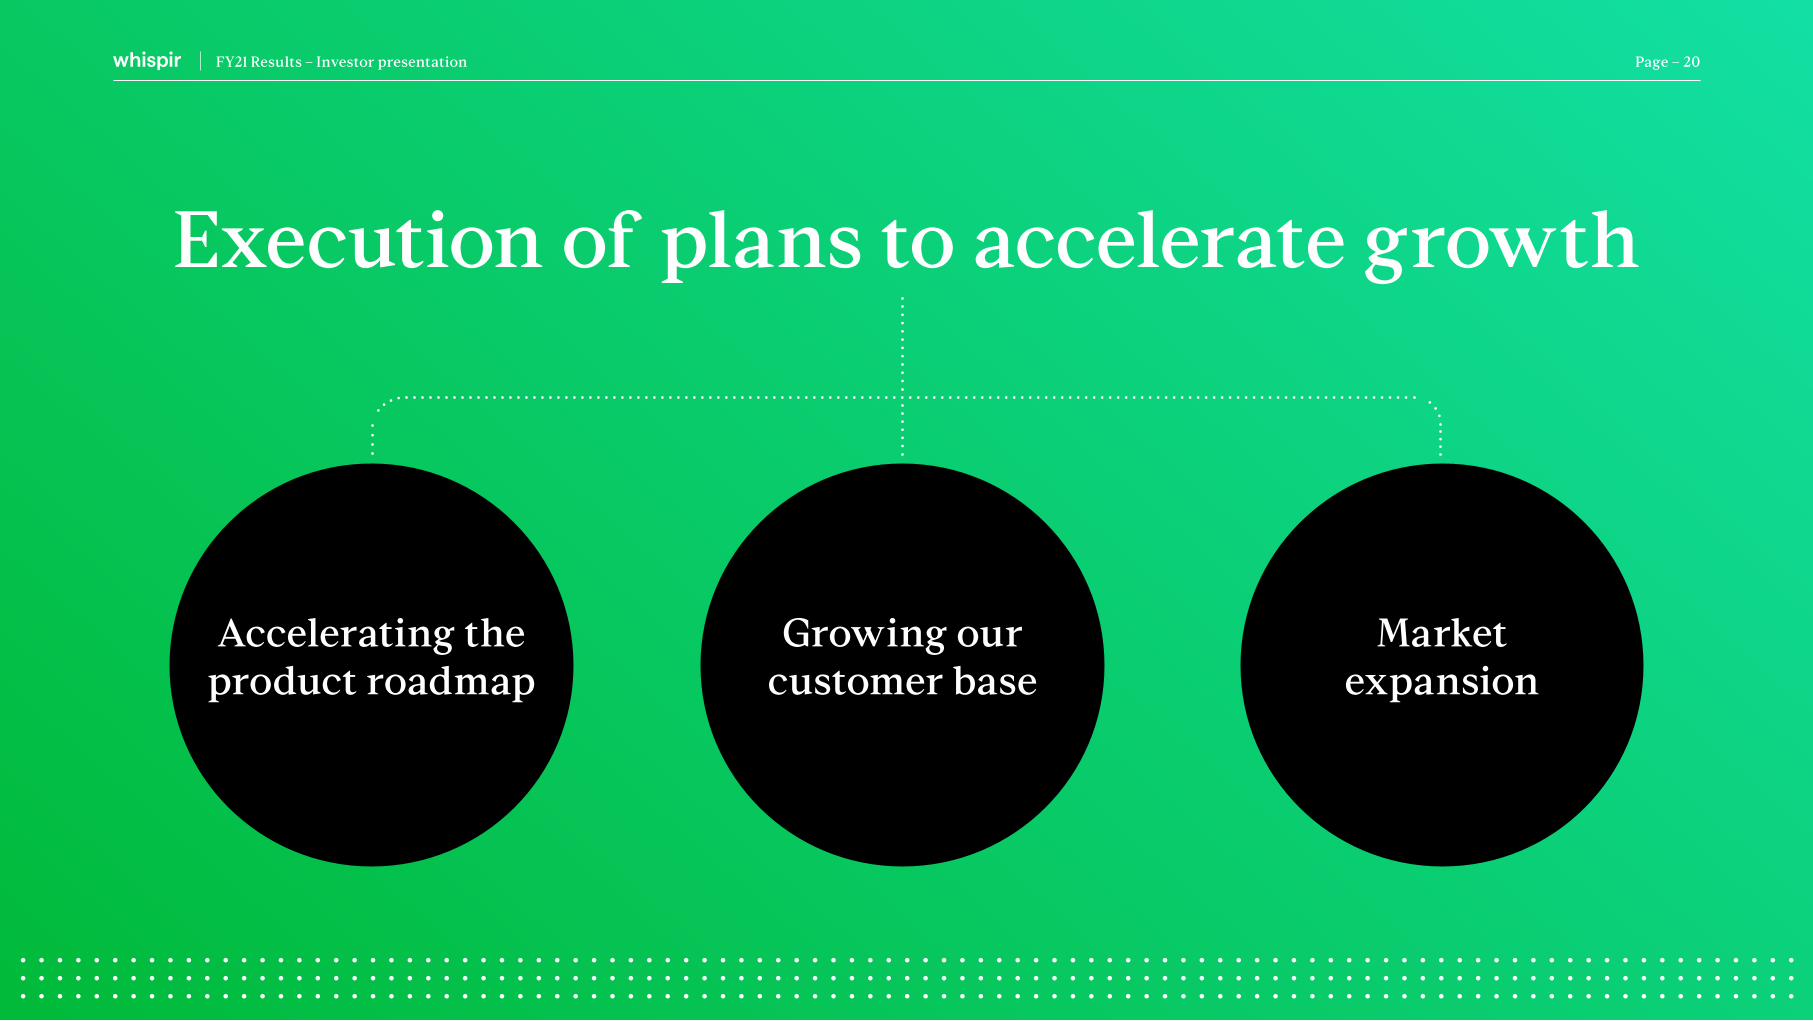
Execution of plans to accelerate growth
Accelerating the product roadmap
Growing our customer base
Market expansion

FY21 Results – Investor presentation
Accelerating the product roadmapCommitted to investing in our people, their capacity and capability, to deliver brilliant basics and enhance product intelligence
AI/ML
Messages
Workflows
AI/ML
AI/ML
Messages
AI/ML
SMS Response FilterWhen someone replies, take that content and kick start a workflow that saves you time
Tone of Voice/Sentiment Analysis
Detect if your messages are on-brand before they go out, creating a consistent voice for your business
Engagement Score Report
Know the difference between engaged customers and those who just openend the message
Data Lake Deployment
A new ocean of information that allows Whispir to effectively mine and learn from billions of messages
API Key Management
Customers can now quickly and easily manage API keys for their enterprise applications
WhatsApp Channel
Communicate on one of the worlds most popular OTT messaging platforms, with a key focus in Asia
Message Content Analysis
We can now read, using machine learning, what a message content contains based on algorithms we built in house that outperform the market
Page – 21

FY21 Results – Investor presentation Page – 22
The Product Intelligence team
Whispir has a dedicated product intelligence and strategy function, tasked with enabling various departments at Whispir to make better decisions using data science and statistical methods. This means we can rely more on intellect instead of sheer volumes of people to get ahead of the competition. To date, it’s found us more profitable customers, better markets to pursue, and helped teams prioritise features that deliver more value with less effort.
“It’s clear that online communication is changing drastically. My team play a part in ensuring the changes will benefit humanity, rather than degrade it, by applying scientific methods to problem solving and strategy at Whispir.”
Dr Brian Oakely Product Analyst
Statistics
ProductStrategy
DataScience
GameTheory
Better
Decisions
Products
Markets
Customers
Procedures

FY21 Results – Investor presentation Page – 23
Several projects completed and dozens more in the pipeline
FY21
Data lake project
Natural language processing project
Intelligent prediction applications
FY22
Intelligent messaging paths
Contact enrichment
High performance messaging channels
• Accelerate monetisation of machine learning prediction models
• Incorporate diversity in language detection tools
• Speed up automation pathways
• Accelerate contact enrichment programs
• Monetise data lake
0
5.0
20.0
15.0
25.0
10.0
FY19 FY20 FY21 FY22 Plan FY23 Plan
R&D Investment
$m
$4.3m
$4.5m
$4.6m
$4.5m $5.0m
$5.0m
$17.5m
$23.3m
Capitalised Expensed Plan
Embedding prediction, detection and automation to increase engagement and message value

FY21 Results – Investor presentation
ANZ - driving new & existing customer growth
Long-term enterprise customers increasing platform activity and record new customer growth
• 83% of Group revenue
• 107 net new customers in FY21 (FY20: 118)
Strategic Focus
• New customers being acquired through digital direct strategy at attractive acquisition cost
• Digital transformation tailwinds provide future growth opportunities from new and existing customers
Partnerships
• Telstra Partnership 2.0 renewed until FY24
• Leveraging existing channel partners with IBM, Juvare and digital direct for cost-efficient CAC
Page – 24
84%16%ChannelDirect
Revenue by distribution model - Australia & New Zealand
$39.7m Revenue

Christchurch City CouncilCrisis communications within the ring of fire
Christchurch sees a high occurrence of earthquakes and seismic activity year-round. The Christchurch City Council (CCC) uses Whispir for crisis management and disaster response.
Use Case
• Automated workflows to create end-to-end messaging to be used in the event of a crisis
• Communications across multiple channels - SMS, email, and more
• Integrated with the Pacific Tsunami Warning Centre (PTWC), to automatically alert CCC Civil Defence Emergency Management duty officers to upcoming event
Benefits
• Respond in real-time and send a notification using multiple channels to key contacts within minutes
• Immediate and swift response is paramount to the safety to the citizens of Christchurch City Council
Case Study Page – 25
This customer persona and suite of use cases can be replicated across
all three regions, Australia and New Zealand, Asia and North America.
FY21 Results – Investor presentation
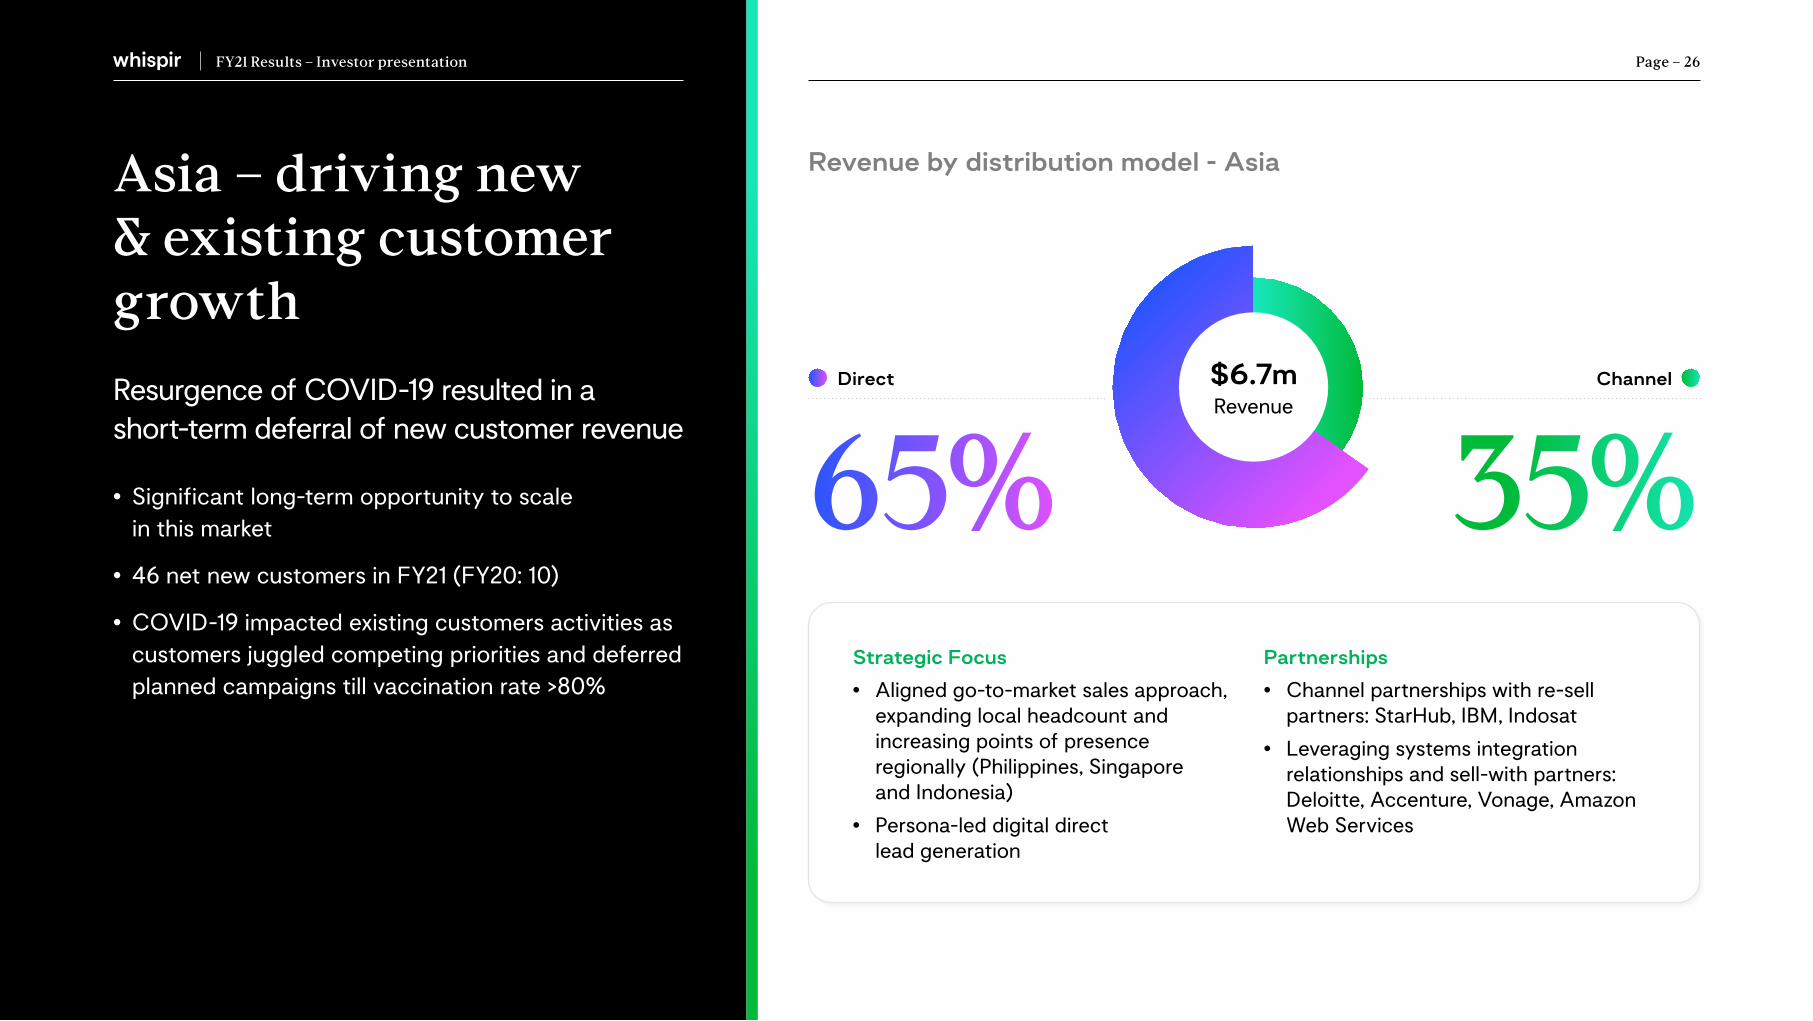
Asia – driving new & existing customer growth
Page – 26
Revenue by distribution model - Asia
Resurgence of COVID-19 resulted in a short-term deferral of new customer revenue
• Significant long-term opportunity to scale in this market
• 46 net new customers in FY21 (FY20: 10)
• COVID-19 impacted existing customers activities as customers juggled competing priorities and deferred planned campaigns till vaccination rate >80%
35%65%ChannelDirect
Strategic Focus
• Aligned go-to-market sales approach, expanding local headcount and increasing points of presence regionally (Philippines, Singapore and Indonesia)
• Persona-led digital direct lead generation
Partnerships
• Channel partnerships with re-sell partners: StarHub, IBM, Indosat
• Leveraging systems integration relationships and sell-with partners: Deloitte, Accenture, Vonage, Amazon Web Services
$6.7m Revenue

M1Dramatically improving customer response rates from 20% to 80%
M1 is one of Singapore’s most vibrant and dynamic communications companies, providing mobile and fixed services to over two million customers.
Use case
• Internal communications workflows so retail teams can, send real-time information automatically escalated to the correct channels
• Business Continuity Communications with pre configured and approved templates automated in response to an issue
• Automated incident communications expediting recognition and resolution of issues
• Automated workflows alerting subscribers to network issues
Benefits
• Increase customer satisfaction through real time alerts regarding network downtime, maintenance, outages and resumption of services
• Pre approved communications templates enhance and optimise automated communications workflows saving time and resources
• Track and report engagement to refine internal processes and procedures
Case Study Page – 27
This customer persona and suite of use cases can be replicated across
all three regions, Australia & New Zealand, Asia and North America.
FY21 Results – Investor presentation Page – 28
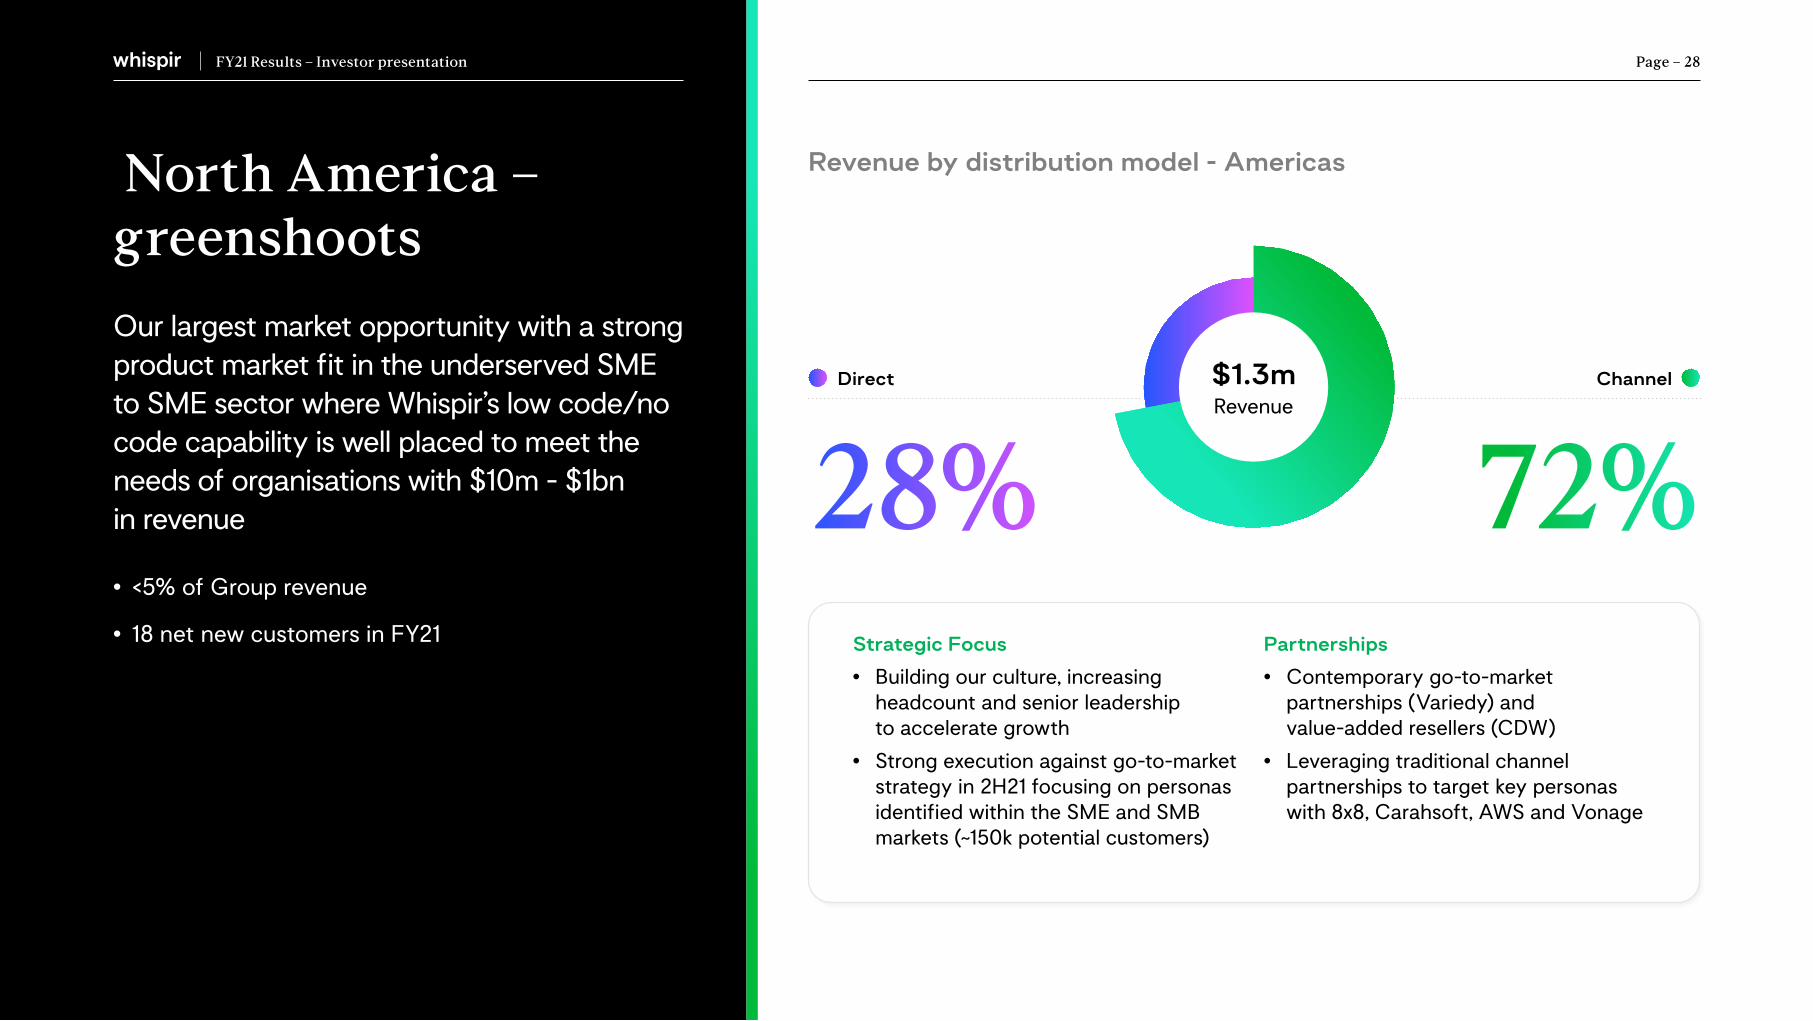
Revenue by distribution model - Americas North America – greenshoots
Our largest market opportunity with a strong product market fit in the underserved SME to SME sector where Whispir’s low code/no code capability is well placed to meet the needs of organisations with $10m - $1bn in revenue
• <5% of Group revenue
• 18 net new customers in FY21
72%28%ChannelDirect
Strategic Focus
• Building our culture, increasing headcount and senior leadership to accelerate growth
• Strong execution against go-to-market strategy in 2H21 focusing on personas identified within the SME and SMB markets (~150k potential customers)
Partnerships
• Contemporary go-to-market partnerships (Variedy) and value-added resellers (CDW)
• Leveraging traditional channel partnerships to target key personas with 8x8, Carahsoft, AWS and Vonage
$1.3m Revenue

uniqueTAXx Whispir’s low code/no code capability has strong product market fit with under serviced SME and SMB sectors across North America
uniqueTAXx is an accounting firm specialising in tax preparation, and managing companies’ bookkeeping.
Use case
• Multi-channel communications platform to send SMS and emails to effectively manage clients
• 2-way mass communication to request and receive tax and financial documents
• Automated workflows to send reminders regarding deadlines and upcoming appointments
Benefits
• Sophisticated workflows saves hours in having to manually send communications
• Automated deadline reminders and requests for additional documents save on resourcing
• Streamlined and automated communications saves on admin and allows uniqueTAXx to focus on acquiring new customers
• Easily manage a large portfolio of customers
Case Study Page – 29
This customer persona and suite of use cases can be replicated across
all three regions, Australia and New Zealand, Asia and North America.

FY21 Results – Investor presentation Page – 30
Our bench strength is our people and their capability
Fiona MilneHead of AI & Data
Matt LambieCTO
Wayne LeeVP ANZ
Marta JamesDirector of Digital
Transformation and Transition
Kristy PinsonDirector of Sales
Northern Australia
Justin OwenCFO
Chris ReganChief People Officer
Dima VovchakVP of Group Services
Kerry BoysHead of Diversity
& Inclusion
David GilbertVP Americas
Tobias BrixCOO
Andrew FryVP ASIA
Patrick ArmitageCMO
Jeromy WellsCEO and Founder
Brad DunnCPO
We have built a strong leadership team to support our talented staff in driving innovation, and generating positive customer experiences.
We have made some key changes to support our growth and commitment in becoming a communications intelligence company, including appointing:
• Chris Regan as Chief People Officer, to strengthen our people team as we continue to expand globally
• Patrick Armitage as Chief Marketing Officer based in Colarado, driving our Marketing-led growth strategy right from the heart of our target growth market
• Kerry Boys, Head of Diversity and Inclusion, already making a significant impact in creating an inclusive workplace
The past year marked the first of many ‘Women of Whispir’ event’s with the aim of connecting our global network of women to support each other in maximizing their potential.
51%parents
Our diversity makes us stronger
Benchmark: 3% Benchmark: 37%
15%LGBTQI+
37%multi-ethnicity
45%of non-white ethnicity

FY22 Outlook
FY21 Results – Investor presentation Page – 31

FY21 Results – Investor presentation
Digital transformation a global mega trend
Automation & digitisation trends providing short and long-term growth opportunities
• Studies suggest the efficiency and rate of adaptation of digitally transformed businesses to a post-pandemic era are much higher than traditional businesses
• Global technology investment rapidly increasing
• Digital experience accounts for majority of global information & communications tech investment
• Digital transformation projects fast-tracked by years
• Digital now main form of customer/stakeholder engagement
• Process automation increasing productivity
• Increased budgets for digital transformation
Page – 32
(USD) Digital transformation market size value in 2020
Digital transformation market size CAGR from 2021 to 2028
$336bn
23.6%Source: www.grandviewresearch.com/industry-analysis/digital-transformation-market

FY21 Results – Investor presentation
Whispir’s US$4.7bn North American TAM
Leveraging ANZ blue-chip customer references across operational coordination, customer engagement & crisis communications
• Five key industries collectively account for just 5% of US CPaaS TAM of US$98bn
• US$4.74bn opportunity in Whispir’s North American target markets
• Targeting four key personas where we have proven expertise within ANZ and Asia
• Underserviced SME and SMB organisations
• US$10m - US$1bn in revenue
• Ideal product market fit
• Aligns with no code/now code capability
Page – 33
US Communications Platform as a Service (CPaaS) 2022 TAM
US$93.3bn
5%
Whispir’s targeted North American TAM by 2022*
US$4.7bn
*Forrester, ‘Market Insight Study for Whispir’, February 2021
FY21 Results – Investor presentation Page – 34
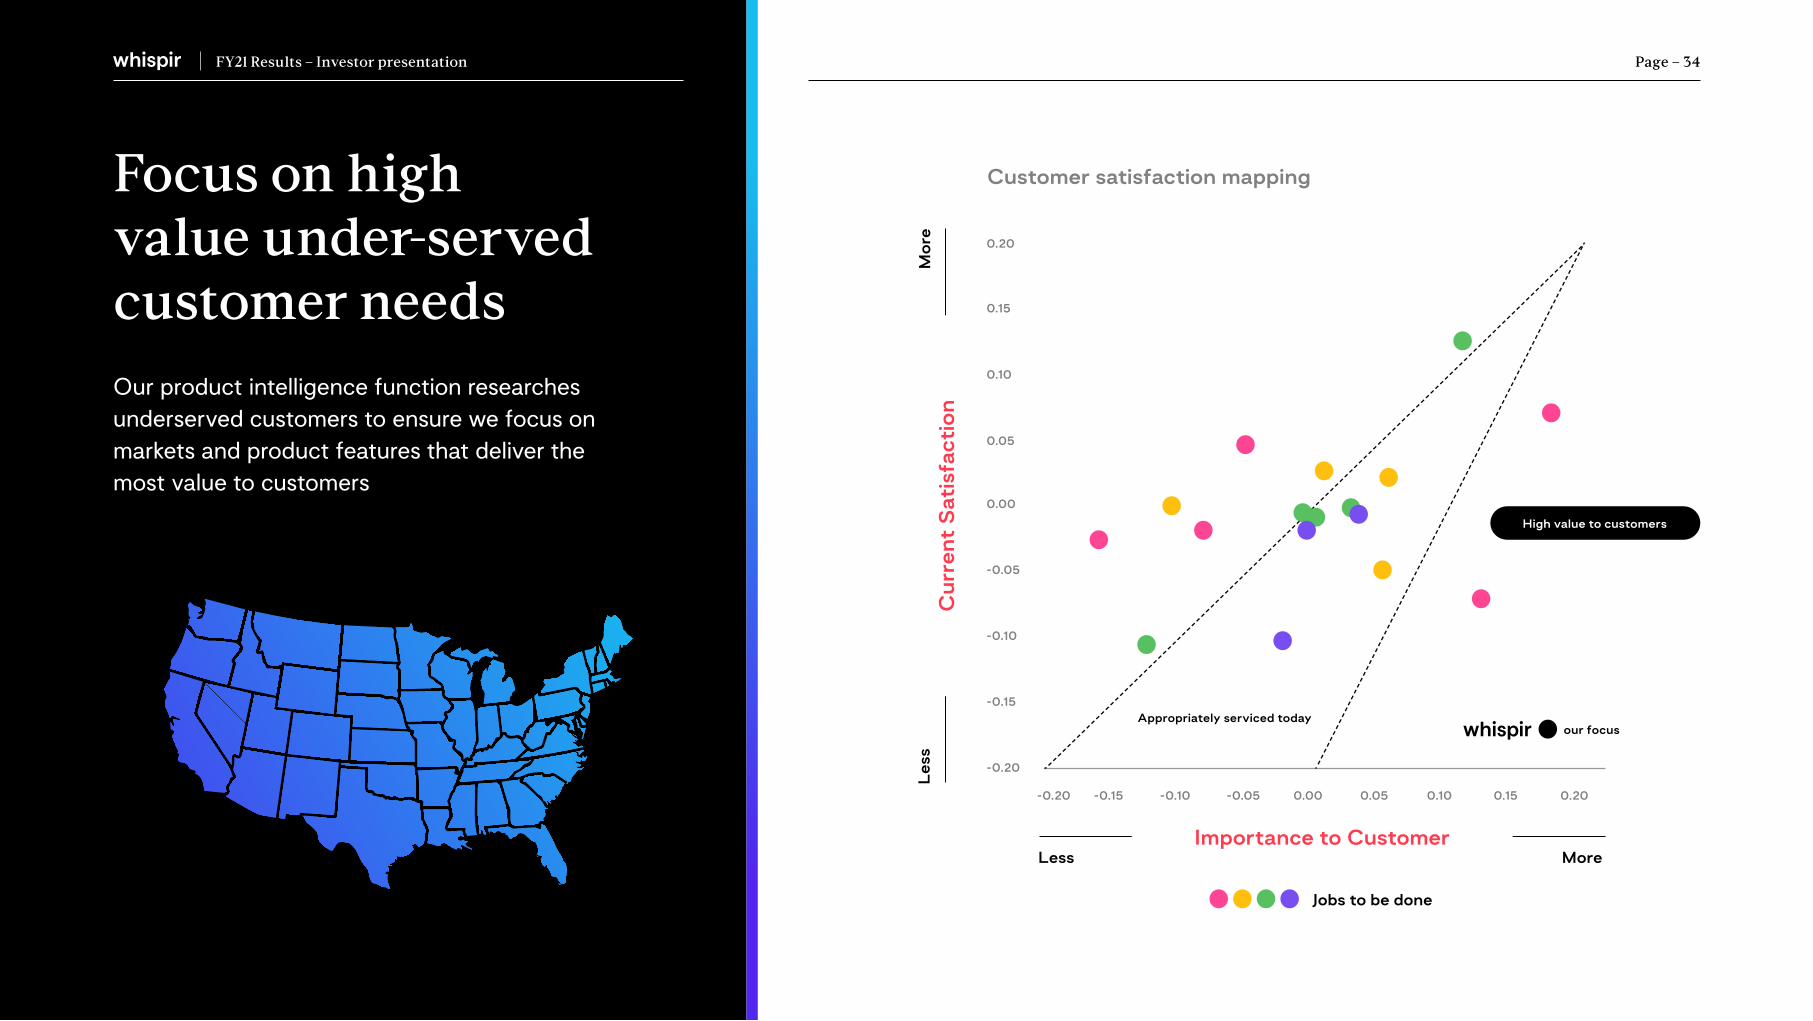
Focus on high value under-served customer needs
Our product intelligence function researches underserved customers to ensure we focus on markets and product features that deliver the most value to customers
-0.20
-0.20
-0.10
-0.15
-0.15 -0.10 -0.05 0.00 0.05 0.10 0.15 0.20
-0.05
0.15
0.20
0.10
0.00
0.05
Cur
rent
Sat
isfa
ctio
n
Customer satisfaction mapping
Les
sM
ore
Importance to CustomerLess More
our focus
Jobs to be done
High value to customers
Appropriately serviced today

FY22 guidance*
22-31% YOY growth 20-26% YOY growth
$65.4m - $70.0m $57.2m - $60.2m
$(15.5)m - $(13.0)m $17m - $18m
*We are providing a range given the current global situation; which provides many opportunities for Whispir, but makes planning and forecasting with certainty – challenging.
FY21 Results – Investor presentation Page – 35
EBITDA (excl. SBP)
230-177% down on FY21
R&D
70-80% increase on FY21
FY22ARR FY22 Revenue

FY21 Results – Investor presentation
Our Purpose
Page – 36
Change the way the world communicates

FY21 Results – Investor presentation
Our Vision
Page – 37
A world where organisations communicate like people

FY21 Results – Investor presentation
We Believe
Page – 38
Value is created, when people are engaged

FY21 Results – Investor presentation
Our Promise
Page – 39
Enabling you to master connection and engagement with other people at scale

Connect Engage Thrive
FY21 Results – Investor presentation Page – 40

FY21 Results – Investor presentation
Appendix
Financial Performance
• Operating EBITDA performance reported in $’000
Page – 41
FY21($’000)
FY20 ($’000)
YOY Change* (%)
Software revenue 46,275 37,361 23.9%
Professional services revenue 1,456 1,734 (16.0)%
Revenue 47,731 39,095 22.1%
Gross Margin 28,658 24,430 17.3%
Gross Margin % 60.0% 62.5% (4.0)%
Sales and marketing (16,862) (14,241) (18.4)%
Research and development (4,982) (4,249) (17.3)%
General and administration (12,990) (13,216) 1.7%
Total operating expenses (34,834) (31,706) (9.9)%
EBITDA (6,176) (7,276) 15.1%
EBITDA (ex non-cash, share-based payments)
(4,653) (5,638) 17.5%
*YOY percentage movement based upon values denominated in $’000’s

Glossary
Profit or loss
• Software revenue: revenue generated from collecting contracted monthly licence
and transaction fees from customers based on a contracted fee per user and cost per
transaction;
• Professional services revenue: professional fees in respect of implementation,
configuration, training and integration fees;
• Cost of service: the costs relating to the delivery of the software including the costs of
running the data centre, wages and salaries of data centre based Whispir staff and the carrier
cost in delivering transactions;
• Gross profit: total revenue less cost of services;
• EBITDA: earnings (or losses) before interest, income tax, depreciation and amortisation.
Amortisation of contract acquisition costs are included within EBITDA. Management uses
EBITDA to evaluate the operating performance of the business. EBITDA can be useful
to help understand the cash generation potential of the business. EBITDA should not be
considered as an alternative to measures of cash flow under IFRS and investors should not
consider EBITDA in isolation from, or as a substitute for, an analysis of the results of Whispir’s
operations; and
• EBIT: earnings (or losses) before interest and income tax.
Definitions
• MRR: Monthly Recurring Revenue
• CAGR: Compound Annual Growth Rate
• S&M: Sales & Marketing;
• G&A: General & Administration;
• TAM: Total Addressable Market;
• SME: Small to Medium Enterprise;
• SMB: Small to Medium Business.
Cash flow
• Capitalised development: proportion of the wages and salaries of employees whose
activities relate to the development of software;
• Capital expenditure: investment in property, plant and equipment including leasehold
improvements and IT equipment;
• Working capital: trade and other receivables, contract acquisition costs, other current
assets, less trade and other payables and income received in advance;
• Operating cash flow: EBITDA after the removal of non-cash items in EBITDA (such as
share-based payments, amortisation of contract acquisition costs and net foreign exchange
difference) less net interest paid and changes in working capital; and
• Free cash flow: operating cash flow less capital expenditure and IPO offer costs.
Financial metrics
• Annualised recurring revenue (ARR): recurring revenue (licence and transaction revenue)
from the final month in a period (MRR) multiplied by 12 months;
• Gross margin: gross profit divided by revenue expressed as a percentage;
• Contract acquisition cost: commission costs incurred in winning new customers;
• Customer acquisition cost (CAC): expenses directly incurred in winning new customers,
which includes the contract acquisition costs, divided by the total number of new customers
won in the period;
• Install base: tolling customers existed before the reporting period
• Customer revenue retention %: revenue earned from customers in the referenced period
divided by the revenue from the same customer cohort in the corresponding prior period.
The calculation has been updated in June 2021 to exclude customers who were not with
Whispir for the full 12 months in the corresponding prior period.
• Customer churn %: number of customers lost in the last twelve months (LTM) divided by
number of opening customers in the period;
• Revenue churn %: Opening MRR of customers churned in LTM compared to opening MRR
of customer cohort;
• Lifetime value of customer (LTV): ARR per customer multiplied by the gross margin for
the period, divided by the customer churn in the period. The LTV of the customer cohort
represents the LTV multiplied by the number of customers at the period end;
• LTV/CAC: The ratio of the Lifetime value (LTV) of new customers to the CAC;
• Recurring Revenue %: recurring revenue as a % of total revenue; and
• Research and development % spend of revenue: The total of the research and
development expenditure recorded in the statement of profit or loss (excluding amortisation)
and the capitalised spend in the period divided by revenue.
FY21 Results – Investor presentation Page – 42