fy21 results presentation
TRANSCRIPT

FY21 Results Presentation
February 2020August 30, 2021

Important notices and disclaimer
2
This presentation has been prepared by Keypath Education International, Inc. ("Keypath") on 30 August 2021 . It contains summary information about Keypath, its activities and its financials which are current as at the date of this presentation.
Preparation of financial informationThis presentation is prepared in US dollars, Keypath's functional and presentation currency. This presentation contains unaudited financial information prepared by Keypath’s management and you should not place undue reliance on this information. Keypath's results are prepared in accordance with US-GAAP. Some financial data is non-IFRS information under Regulatory Guide 230 (Disclosing non-IFRS financial information) published by ASIC or non-GAAP financial measures within the meaning of Regulation G of the US Securities Exchange Act of 1 934. Keypath is not required to comply with Regulation G and it may not provide a reconciliation and other disclosures about its non-IFRS information or non-GAAP financial measures that would be required by Regulation G. Such non-IFRS financial information/non-GAAP financial measures do not have a standardized meaning prescribed by the Australian Accounting Standards ("AAS") or IFRS. Therefore, the non-IFRS financial information may not be comparable to similarly titled measures presented by other entities and should not be construed as an alternative to other financial measures determined in accordance with AAS or IFRS. Although Keypath believes this information provides useful information for investors and forms key performance indicators, Keypath investors are cautioned not to place undue reliance on any non-IFRS financial information/non-GAAP financial measures included in this presentation. Financial information in this presentation including totals and percentages may be subject to rounding.
Forward Looking Statements This presentation may contain forward-looking statements, including guidance and forecasts. Forward-looking statements are not guarantees of future performance and involve known and unknown risks, uncertainties, assumptions and other important factors, many of which are beyond Keypath's control, and speak only as of the date of this presentation. These forward-looking statements should be read in conjunction with, and are qualified by reference to, risks as set out in Section 5 of Keypath's prospectus dated 1 1 May 2021 , general assumptions, specific assumptions and the sensitivity analysis as set out in Section 4 of that prospectus, and other information in this presentation. No representation is made that any of these statements or forecasts will occur or that any forecast result will be achieved. No representation or warranty is made as to the reliability, accuracy, adequacy, correctness or completeness of the information set out in this presentation. You must not place undue reliance on any such forward-looking statements and Keypath assumes no obligation to update such statements (except as required by applicable regulations or by law).
Past performancePast performance is not indicative of future performance. The past performance information in this presentation is given for illustrative purposes only. Nothing in this presentation or any other information which is made available to you, can be relied upon as a promise, representation, warranty or guarantee as to the past, present or future performance of Keypath.
Third party informationSome material in this presentation may be derived from publicly available sources prepared by third parties which has not been independently verified by Keypath. No representation or warranty is made as to the accuracy, reliability, adequacy or completeness of the information. This presentation should not be relied upon as a recommendation or forecast by Keypath.
No advice givenThis presentation does not and is not intended to constitute financial advice or an offer, invitation, inducement, solicitation or recommendation to purchase or sell any Keypath securities or any other financial product in any jurisdiction. This presentation is not a disclosure document or any other offering document under Australian or any other law; it is for information purposes only. The distribution of this presentation in jurisdictions outside Australia may be restricted by law and you should observe any such restrictions. Any failure to comply with such restrictions may constitute a violation of applicable securities laws. Nothing in this presentation constitutes legal, financial, tax, accounting or other advice, and does not take into account the particular investment objectives, financial situation, taxation position or needs of any person. The information provided in this presentation may not be suitable for your specific needs and should not be relied upon as advice in substitution of you obtaining independent advice. Before making any investment decision, you should consider the appropriateness of the information with regard to your specific needs, including financial, legal and taxation advice or other professional advice appropriate to your jurisdiction.
No responsibility or liabilityTo the maximum extent permitted by law, Keypath and its related body corporate, affiliates, directors, officers, employees, agents, advisers and any other person involved in the preparation of this presentation will not be liable for any direct or indirect loss, damage, claim, demand, cost or expense arising from reliance on information contained within this presentation or in connection with this presentation, including any fault, negligence, error or omission within this presentation. Keypath does not accept any responsibility to inform you of any matter arising or coming to its notice after the date of this presentation which may affect any matter referred to in this presentation. This presentation should be read in conjunction with the Company's other periodic and continuous disclosure announcements lodged with ASX.
Restriction on purchases of CDIs by US personsKeypath is incorporated in the US State of Delaware and none of its securities have been registered under the US Securities Act of 1 933 or the laws of any state or other jurisdiction in the United States. Trading of Keypath’s CHESS Depositary Interests (“CDIs”) on the Australian Securities Exchange (ASX) is not subject to the registration requirements of the US Securities Act in reliance on Regulation S under the US Securities Act and a related ‘no action’ letter issued by the US Securities and Exchange Commission to the ASX in 2000. As a result, the CDIs are “restricted securities” (as defined in Rule 1 44 under the US Securities Act) and may not be sold or otherwise transferred except in transactions exempt from, or not subject to, the registration requirements of the US Securities Act. For instance, US persons who are qualified institutional buyers (“QIBs”, as defined in Rule 1 44A under the US Securities Act) may purchase CDIs in reliance on the exemption from registration provided by Rule 1 44A. To enforce the transfer restrictions, the CDIs bear a FOR Financial Product designation on the ASX. This designation restricts any CDIs from being sold on ASX to US persons excluding QIBs. In addition, hedging transactions with regard to the CDIs may only be conducted in compliance with the US Securities Act.

Today’s presenters
3
Founded Keypath in 2014
Over 25 years of experience in higher education
Specialises in guiding universities to reach their full growth potential
Previously partnered with some of the world’s top institutions to help universities better serve the next generation of students
Previous experience includes CEO of Embanet, which sold to Pearson Education in 2012
Over 30 years of experience as a proven finance leader for both public and privately-owned organisations
Primary background in software, technology and manufacturing
Successful experience guiding business through transformative growth and value creation opportunities
Previous experience includes CFO at BravoSolution, Avatar Solutions and Servigistics
Founded Keypath Australia in 2014
Over 20 years of experience leading and scaling businesses in the education sector
Has built successful teams and models across the UK, USA, Australia and Asia-Pacific
Pioneered the Online Program Management (OPM) industry in Australia a decade ago
Previous experience includes leadership roles at Achieve Global Australia and Pearson Asia-Pacific
Steve Fireng
FOUNDER, GLOBAL CHIEF EXECUTIVE OFFICER
PeterVlerick
CHIEF FINANCIAL OFFICER
RyanO’Hare
CEO, AUSTRALIA & ASIA-PAC

4
PRESENTATION AGENDA
Highlights of FY2021
Financial Analysis of FY2021
FY2022 Progress and Outlook
Appendix: OPM Industry and Keypath Business Overview
1
2
3

5
Highlights of FY2021
1
FY21 financial highlights
6
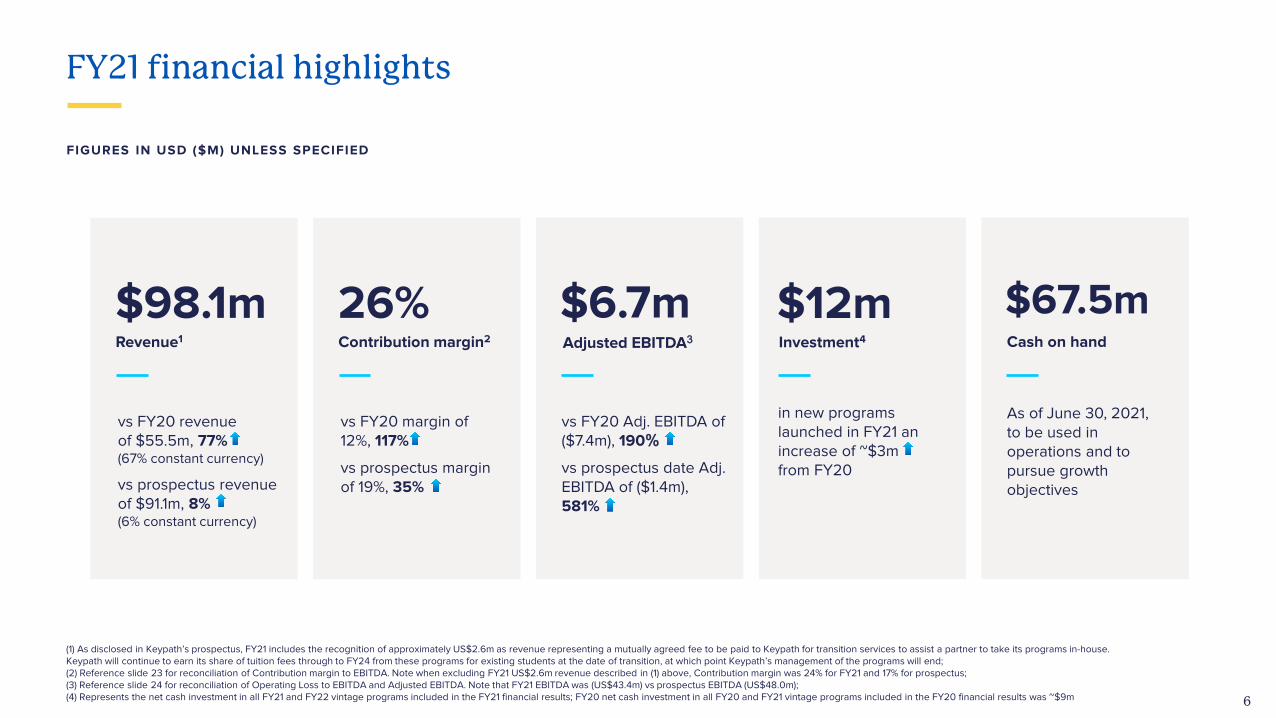
(1) As disclosed in Keypath’s prospectus, FY21 includes the recognition of approximately US$2.6m as revenue representing a mutually agreed fee to be paid to Keypath for transition services to assist a partner to take its programs in-house. Keypath will continue to earn its share of tuition fees through to FY24 from these programs for existing students at the date of transition, at which point Keypath’s management of the programs will end; (2) Reference slide 23 for reconciliation of Contribution margin to EBITDA. Note when excluding FY21 US$2.6m revenue described in (1) above, Contribution margin was 24% for FY21 and 17% for prospectus;(3) Reference slide 24 for reconciliation of Operating Loss to EBITDA and Adjusted EBITDA. Note that FY21 EBITDA was (US$43.4m) vs prospectus EBITDA (US$48.0m); (4) Represents the net cash investment in all FY21 and FY22 vintage programs included in the FY21 financial results; FY20 net cash investment in all FY20 and FY21 vintage programs included in the FY20 financial results was ~$9m
FIGURES IN USD ($M) UNLESS SPECIFIED
Contribution margin2
26%
vs FY20 margin of 12%, 117%
vs prospectus margin of 19%, 35%
Investment4
in new programs launched in FY21 an increase of ~$3m from FY20
$12mAdjusted EBITDA3
$6.7m
vs FY20 Adj. EBITDA of ($7.4m), 190%vs prospectus date Adj. EBITDA of ($1.4m), 581%
Cash on hand
As of June 30, 2021, to be used in operations and to pursue growth objectives
$67.5mRevenue1
$98.1m
vs FY20 revenue of $55.5m, 77%(67% constant currency)
vs prospectus revenue of $91.1m, 8%(6% constant currency)

FY21 operational highlights
7
(1) Active programs refers to degree-granting programs for which a term sheet has been signed as of the respective date and excludes discontinued programs; (2) 106 programs in FY20 includes 16 non-revenue generating programs signed during FY20, in addition to the 90 revenue generating programs in FY20 as disclosed in Keypath's prospectus; (3) Note that marketing for the 1st program began in July 2021 with an expected first student intake planned for October 2021. The Company signed its 2nd term sheet with this same partner in July 2021;(4) Includes estimates for enrollments pending invoicing;(5) Weighted by FY21 revenue.
140Total active programs1
6 programs signed since the prospectus date (May 1 1 , 2021 )
+34 programs since FY202
85,358Course enrollments4
vs prospectus forecast of 79,000, up +8%
vs FY20 of 56,546, up +51%
32Global university partners
vs 23 in FY20, up +39%
Expansion in South-East Asia3
Global expansion continues with first program term sheet signed in Malaysia in May 2021 with more opportunities being explored
~9 yrsAvg. weighted contract length per program5
Typically 7 – 10 years

Expanding global footprint
8
Keypath is a global OPM provider and partners with a diverse set of globally ranked universities
17
6 new programs signed in Q4 and since date of prospectus, across the US, Canada, Australia and Malaysia, with more opportunities being explored in Southeast Asia
Keypath partner locationNumber of partners
32 UniversityPartners1
17 US News globally ranked partners2
Times Higher Education ranked partners in Australia39Ranked Young University partners4
Partnerships launched in Australia since 2014 (as many as all competitors combined in Australia)1,5
89
Note: Revenue split based FY21 revenue, North America comprises the US and Canada, Rest of World comprises the United Kingdom and APAC revenue comprises Australia and Malaysia (not revenue generating in FY21);(1) Active as of June 2021; (2) 2021 Global University Rankings published by US News & World Report L.P. in October 2020; (3) The Times Higher Education University Rankings 2021 from Times Higher Education World University Rankings published by THE World Universities Insights Limited in June 2020; (4) The Times Higher Education Young University Rankings 2020 from Times Higher Education World University Rankings published by THE World Universities Insights Limited in June 2020; (5) HolonIQ Education Market Intelligence Platform
North America APAC Rest of world
2
2
1
9
FY21reven ue
3%
51%46%

Multiple strategies for further growth
9
Data-driven approach to growing enrollments through EDGE platform in 140 current active programs1
Grow enrollments within existing portfolio
ENROLLMENTS PER ACTIVE PROGRAM 2
533610
FY20 FY21
1
Continued growth of university partners in existing markets
Sign new university partners in existing markets
2
12
1923
32
FY18 FY19 FY20 FY21
NUMBER OF PARTNERS 3
Launching new programs with existing partners
67additional programs have been launched with existing partners since their original signing and partnership
Add new programs with existing university partners
3
(1) As of June 2021; (2) Calculated as number of student course enrollments at end of period divided by number of active programs at end of period; (3) Figures shown as at end of period indicated
Drive expansion into new markets, notably South-East Asia
FY15: First US partner
FY18: First UK partner
FY15: First Australian
partner
FY21: First Malaysian
partner
FY17: First Canadian partner
Expand into new markets
4
Continue to pursue targeted M&A, assessing opportunities based on market expansion, strategic relevance and value-creation
Execute targeted mergers and acquisitions
5
Powered by KeypathEDGE

Nursing24%
Business40%3
STEM14%
Health & Social Services
12%
Education9%
Nursing35%
Business27%
STEM16%
Health & Social Services
13%
Education8%
Other1%
Diversified business model – revenue by discipline
Keypath delivers online programs across a diverse mix of disciplines
REVENUE BY DISCIPLINE
FY22 ProspectusFY21
(1) STEM includes engineering, IT and data science; (2) Other primarily includes law; (3) The Business vertical in FY21 includes the recognition of approximately US$2.6m as revenue representing a mutually agreed fee to be paid to Keypath for transition services to assist a partner to take its programs in-house
1
10
Keypath has strategically diversified across a range of disciplines to meet market demand and diversify the offering away from programs that were historically business focused
Since Keypath launched its placement services two years ago it has been in high demand. The Nursing discipline is currently experiencing high demand levels that are, in some cases, exceeding partner capacity; 10 of the Company’s 32 partners currently utilize placement services
Contribution from the Nursing vertical grew in FY21 and is expected to increase to 35% of revenue by FY22F, driven in part by the launch of large Nursing programs in FY21
The KeypathEDGE platform provides unique intelligence on emerging areas of demand which enables the efficient targeting of programs in those disciplines that will attract strong enrollments across multiple geographies
2
C O M M E N T A R Y
STEM16%
Other1%
Other2%

Operational metrics
11
PARTNERS AND ACTIVE PROGRAMS GROWTH OVER TIME 1 ,2
Partners, active programs and student enrollments have continued to grow
(1) Active programs refers to degree-granting programs (excludes diplomas and certificates) signed by Keypath, excluding discontinued programs; Figures shown as at end of period indicated(2) 106 programs in FY20 includes 16 non-revenue generating programs signed during FY20, in addition to the 90 revenue generating programs in FY20 as disclosed in Keypath's prospectus(3) Reflects real change based on whole numbers not rounded
STUDENT COURSE ENROLLMENTS IN ACTIVE PROGRAMS OVER TIME 2
COMMENTARY
• Student demand remains strong across all key
disciplines, especially in certain disciplines utilizing
placement services where we continue to look to
increase capacity to meet this demand
• New partnerships signed in US, Australia, Canada
and Malaysia in FY21
• New programs signed growing at 32% YoY with
programs signed in multiple verticals, notably
Nursing and STEM.
• 51% enrollment growth YoY based on newer
vintages (FY18-FY20) scaling well.
• Recent momentum sets stage for upcoming growth
YoY growth
23
32
106
140
0
20
40
60
80
100
120
140
FY20 FY21
Number of partners Number of active programs
+39%
+32%
YoY growth
+51%3
+14%
Course enrollments ( ‘000s)Course enrollments per active program

People update
12
595As of June 30, 2021
100%Employee Choice Flexibility
Return to Office
149New employeesAdded in FY21
3 yrsAverage tenure across organization
EMPLOYEE RATINGS
Gallup Employee Engagement Score, placing Keypath in the 72nd percentile against other companies
4.37/5Seek ratings
4.1/5Glassdoor ratings
4.4/5
AN AWARD-WINNING CULTURE
Best Places to Work – Australia 2021
Australian LGBTQ Inclusion Awards 2021
Great Place to Work -Canada 2021-2022
Best Place to Work in Chicago by Crain's Chicago Business – 2021

13
Financial Analysis of FY2021
2

FY21 financial performance
14
• Revenue increased by 67% compared to prior
period when adjusted for favorable foreign
exchange impacts of US$5.6m
• FY21 revenue is up US$7.0m (8% ; 6% constant
currency) to the prospectus
• Adjusted EBITDA outperformance vs. the
prospectus is due primarily to revenue
overperformance coupled with favorable timing
on staffing costs; stock compensation variance
is all Fx related; constant currency Adjusted
EBITDA is US$7.5m favorable to the prospectus
C O M M E N T A R Y
Keypath has exceeded FY21 prospectus forecasts
US $m FY21 FY20 % change Prospectus FY21F % change
Revenue 98.1 55.5 77% 91.1 8%
Salaries and wages (47.8) (32.9) 45% (49.6) (4%)
Direct marketing (33.2) (22.2) 50% (33.1) 0%
General and administration expenses (10.5) (7.7) 36% (9.7) 9%
Depreciation and amortization (4.2) (3.3) 25% (4.6) (10%)
Stock-based compensation expense (one-time) (41.7) - (38.2) 9%
Stock-based compensation expense (ongoing) (0.2) - (0.3) (31%)
Legacy Long-Term Incentive Plan Cash Awards (3.2) - (3.2) -%
IPO transaction costs expensed (4.9) - (4.9) (0%)
Other income and (expense), net 0.2 (0.1) (227%) -
EBIT1 (47.5) (10.8) 341% (52.6) (10%)
EBIT % of revenue (48%) (19%) 150% (58%) (16%)
EBITDA1 (43.4) (7.4) 484% (48.0) (10%)
EBITDA % of revenue (44%) (13%) 230% (53%) (16%)
Adjusted EBITDA1 6.7 (7.4) (190%) (1.4) (581%)
Adjusted EBITDA % of revenue 7% (13%) (151%) (2%) (546%)
Net Loss Attributable to Keypath Education International, Inc. Shareholders
(78.7) (11.4) 590% (88.0) (11%)
(1) When excluding US$2.6m revenue for transition services to be provided by the Company to assist a partner to take its programs in-house from US$98.1m FY21 Actual and US$91.1m FY21 Forecast: - EBIT % was (52%) for FY21 Actual and (62%) for FY21 Forecast, - EBITDA % was (48%) for FY21 Actual and (57%) for FY21 Forecast, and - Adjusted EBITDA % was 4% for FY21 Actual and (4%) for FY21 Forecast.

Drivers of revenue outperformance
15
Course enrollment growth: ~8% higher than prospectus estimate of 79,000.
Increased retention: Retention across all regions lead to strong course enrollment growth
Strong NA performance: Overperformance in NA was driven by a number of factors including better retention, increased individual student course load and related credit hours
'Short-course' enrollments in Australia: Boost in Graduate Certificate enrollments across many partners in Australia's program portfolio drove revenue upside
1
2
3
4
COMMENTARY

Revenue summary
16
REVENUE BY GEOGRAPHY
Revenue has increased 77% (67% constant currency) from FY20 and is 8% above prospectus forecasts
39% CAGR
46% CAGR
57% CAGR
FY18-FY21 CAGR
Re
ven
ue
, fig
ure
s in
US
$M
Revenue increased by 67% compared
to prior period when adjusted for
favorable foreign exchange impacts of
US$5.6m
Strong revenue performance is
underpinned by:
• course enrollment growth (~8% favorable to the prospectus estimate of 79,000);
• strong student retention; and
• the launch of new programs in key disciplines.
Revenues are primarily earned in the US
and Australian markets where
approximately 93% of its revenue is
generated
(1) APAC currently includes Australia and Malaysia. There was no Malaysian revenue in FY21; (2) Rest of World currently includes United Kingdom
1 2
42% CAGR
1219
29
46 4411
17
25
5045
0
1
2
32
24
37
55
9891
0
20
40
60
80
100
120
FY18 FY19 FY20 FY21 FY21F Prospectus
North America APAC ROW
COMMENTARY

Revenue by vintage
17
Newer vintages continue to expand rapidly
REVENUE BY VINTAGE1
(1) Vintage refers to the financial year in which a new program starts to be delivered to students. Revenue from the first year of a vintage reflects a combination of the timing of when programs start (because Keypath does not earn revenue until the first student intake on a program) and the number of programs that start; (2) FY21 the 2018 vintage revenue includes the recognition (in accordance with Keypath’s accounting policies) of approximately US$2.6m as revenue representing a mutually agreed fee to be paid to Keypath for transition services to assist a partner to take its programs in-house.
FY21 actuals illustrate growth across
most vintages, driven by 51% overall
growth in course enrollments YoY
FY20 & FY21 vintages significantly larger
than prior year vintages, primarily driven
by KeypathEDGE (e.g. Clinical programs
in North America)
The FY21 vintage represents the
largest in Keypath’s history in terms of
the number of programs but also the
overall revenue trajectory (2x the FY20
vintage in yr. 1); this vintage alone is
expected to be a significant driver of
near-term growth
Re
ven
ue
, fig
ure
s in
US
$M
FY21F ProspectusFY21
24
37
55
98 91
0
20
40
60
80
100
120
FY18 FY19 FY20
FY15 and Prior FY16 FY17 FY18 FY19 FY20 FY21
COMMENTARY

(24%)
(3%)
12%
26%
19%
0
0
0
0
0
0
0
FY18 FY19 FY20 FY21 FY21F Prospectus
43%
Contribution margin
18
Contribution margin continues to improve as the unit economic model plays out and mature vintages reach our targeted margins of 40-60%
Contribution margins will continue to
improve as a greater % of the overall
portfolio of programs reach maturity
(i.e., are in market for 4+ yrs.)
Larger vintages and a maturing portfolio
drive margin expansion; over performance
vs. the prospectus is due primarily
to revenue overperformance coupled
with favorable timing on staffing costs
FY21 actual and prospectus contribution
margins are aided by the 1x transition
fee revenue referenced previously
% of Revenue from Vintages Aged 4 Years or more
KEYPATH CONTRIBUTION MARGIN
42% 47% 52% 52%
Note: Contribution margin is revenue less direct costs, which consists of salaries and wages and general and administration expenses attributable to direct departments, and direct marketing. Contribution margin is not a US GAAP based measure. It is used by Keypath to monitor and evaluate individual programs financial performance relative to planned performance targets over the whole-of-life of the program. Contribution margin is not a replacement for the financial performance of the Company as a whole as determined in accordance with US GAAP. Reference slide 23 for a reconciliation of contribution margin to EBITDA
COMMENTARY

Income statement
19
• Strong revenue performance is underpinned by course enrollment
growth (~8% favorable to the prospectus estimate of 79,000), strong
student retention and the launch of new programs in key disciplines
• Salaries and wages expenses increased due to the addition of 149
employees YoY primarily in direct cost departments as well as in
Corporate areas as a result of growth and the IPO; as a % of revenue,
salaries and wages decreased from 59% in FY20 to 50% in FY21
demonstrating continuing cost leverage
• Direct marketing costs increased due to an increased number of
searches conducted and enquiries made by prospective students, an
increased volume of marketing reflective of the increased number of
active programs and a higher proportion of new programs in FY21 in
their development and launch phase; as a % of revenue, direct
marketing decreased from 40% in FY20 to 35% in FY21
• G&A costs increased as a result of the overall growth of the business
and the infrastructure required to support a public company; as a % of
revenue G&A decreased from 14% in FY20 to 11% in FY21
• Stock-based compensation includes ~$3.5m of unfavorable fx vs.
prospectus; ongoing stock compensation represents one month of
expense in all FY21 periods
• Interest expense includes interest paid, early termination fees and a
non-cash write-off of unamortized borrowing costs
• Loss on redemption increase is due to differences in payout values
and carrying values for these interests
• Income tax benefit in FY21 is related to the utilization of foreign net
operating losses and the release of several valuation allowances as
subsidiaries became profitable during the year; the favorability to the
prospectus is due to a better ability to access NOLs and the overall
legal entity reorganization
(1) Revenue growth is calculated excluding a fee to be paid to Keypath and recognized in full in FY21 revenue of US$2.6m for transition services to be provided by
Keypath to assist a partner to take its programs in-house as discussed in prospectus Section 4.8.1.1. Similarly, the percentage that each expense item represents of
revenue in FY21 Actual and FY21 Forecast is based on revenue of US$98.1m and US$91.1m, respectively, less the fee of US$2.6m.
COMMENTARY US $m FY21 FY20 % change Prospectus FY21F % change
Revenue 98.1 55.5 77% 91.1 8%
Salaries and wages (47.8) (32.9) 45% (49.6) (4%)
Direct marketing (33.2) (22.2) 50% (33.1) 0%
General and administration expenses (10.5) (7.7) 36% (9.7) 9%
Depreciation and amortization (4.2) (3.3) 25% (4.6) (10%)
Stock-based compensation expense (one-time) (41.7) - (38.2) 9%
Stock-based compensation expense (ongoing) (0.2) - (0.3) (31%)
Legacy Long-Term Incentive Plan Cash Awards (3.2) - (3.2) -%
IPO transaction costs expensed (4.9) - (4.9) (0%)
Operating Loss (47.7) (10.6) 348% (52.6) (9%)
Interest expense (2.3) (0.3) 599% (2.5) (8%)
Loss on redemption of non-controlling interest (27.7) - (27.7) 0%
Other income and (expense), net 0.2 (0.1) (227%) -
Loss before income taxes (77.5) (11.1) 598% (82.8) (6%)
Income tax benefit (expense) 0.4 1.3 (69%) (3.6) (111%)
Net loss (77.1) (9.8) 686% (86.4) (11%)
Non-controlling interest redemption increment (1.6) (1.6) -% (1.6) -%
Net loss attributable to Keypath Education International, Inc. shareholders (78.7) (11.4) 590% (88.0) (11%)
Revenue growth %1 72% 49% 47% 60% 21%
Salaries and wages % of revenue1 50% 59% (16%) 56% (11%)
Direct marketing % of revenue1 35% 40% (13%) 37% (7%)
General and administration % of revenue1 11% 14% (21%) 11% 1%

Balance sheet statement
20
• Cash balance is relatively unchanged with the December 2020
pro forma view presented in the prospectus
• Accounts receivable and other current assets have increased
YoY as a result of the growth of the business, increase in
insurance premiums and the timing of invoicing and collections
• Accounts payable and other current liabilities changes are
related to the LTIP cash awards accrual, increased bonus costs
and overall business growth
• Other non-current assets increased primarily 1x termination
revenue of $2.6M
• Debt was repaid out of IPO proceeds
• All non-controlling interests were redeemed from the proceeds
received from the IPO at or immediately after the IPO date
(1) Under US GAAP, the redeemable non-controlling interests are considered to be mezzanine equity, a concept which does not exist under AAS
(2) Consistent with the prospectus, the pro forma balance sheet reflects adjustments related to the IPO as if it had occurred on this date.
COMMENTARY
US $m June 30, 2021
June 30, 2020 % change
December 31, 2020 Prospectus Pro forma 2
% change
Cash and restricted cash 67.5 14.7 359% 68.4 (1%)
Accounts receivable and other current assets21.9 7.3
199% 5.0 342%
Accounts payable and other current liabilities(23.0) (13.0)
77% (16.5) 39%
Net Working Capital 66.3 9.0 634% 56.8 17%
Property and equipment, net1.7 1.4
22% 1.6 8%
Goodwill8.8 8.8
-% 8.8 -%
Intangible assets, net5.8 5.6
4% 5.9 (1%)
Other non-current assets8.8 5.7
55% 4.4 102%
Borrowings- (9.0)
(100%) -
Other non-current liabilities (1.0) (1.5) (39%) (1.5) (35%)
Net Assets 90.4 19.9 355% 75.9 19%
Redeemable non-controlling interests1 - 29.4 (100%) -
Preferred shares - 16.1 (100%) -
Common stock2.1 -
-
Additional Paid-in Capital246.2 54.1
355% 233.0 6%
Accumulated losses (157.8) (79.7) 98% (157.1) 0%
Keypath shareholder’s equity/(deficit) 90.4 (9.5) (1055%) 75.9 19%
Total Equity 90.4 19.9 355% 75.9 19%

Cash flow statement
21
• As of June 30, 2021 total cash on hand is US$67.5m
• Cash will be used in operations and to pursue the
Company’s growth objectives
• For FY21, cash flow used in operations was US$11.2m
compared to US$6.1m in FY20; cash flow from operations
for FY21 includes US$4.9m of non-capitalizable expenses
related to the public offering; investment in new vintages was
US$12m in FY21 vs. US$9m in FY20
• Per the FY21 statutory prospectus forecast, cash flow used
in operations was US$12.9m
• For FY21, net cash used in investing activities was US$4.1m,
primarily representing the capitalized value of employee and
contractor costs directly involved in the development of
programs and eligible for capitalization under US GAAP
• For FY21, net cash provided by financing activities was
US$67.5m; the Company received aggregate net proceeds
of US$154.4m after deducting underwriting and offering
expenses, of which US$58.6m was used to payout non-
controlling interests, US$18.3m to pay the non-participating
securityholders and US$10.0m to repay the outstanding loan
COMMENTARY US $m FY21 FY20 % changeProspectus
FY21F%
changeEBITDA (43.4) (7.4) 484% (48.0) (10%)
Stock-based compensation expense 41.9 - 38.5 9%
Other non-cash items 0.2 (1.8) (111%)-
Change in net working capital (11.8) 3.4 (447%) -5.1 131%
Legacy Long-Term Incentive Plan Cash Awards 3.2 - 3.2 -%
Interest paid (1.4) (0.3) 367% (1.5) (7%)
Income taxes paid - - -
Cash flow from operating activities (11.2) (6.1) 83% (12.9) (13%)
Additions of amortizable intangible assets (3.1) (3.2) (3%) (3.4) (9%)
Purchases of property and equipment (1.0) (0.6) 67% (0.7) 43%
Cash flow from investing activities (4.1) (3.8) 8% (4.1) -%
(Repayments of) proceeds from long-term debt (10.0) 10.0 (200%) (10.0) -%
Proceeds of initial public offering, net of issuance and transaction costs
154.4 - 143.9 7%
Payments to redeemable non-controlling interests (58.6) - (58.6) -%
Payments to non-participating securityholders (18.3) - (18.7) (2%)
Proceeds from issuance of preferred units to non-controlling interests in subsidiary entities
- 5.0 -
Proceeds from capital contributions - 5.0 -
Payments of debt issuance costs - (0.5) -
Cash flow from financing activities 67.5 19.5 246% 56.6 19%
Effect of exchange rate changes 0.6 0.1 500% 0.9 (33%)
Net cash flows 52.8 9.7 445% 40.5 30%
Cash and restricted cash at beginning of year 14.7 5.0 14.7
Cash and restricted cash at end of year 67.5 14.7 55.2

1219
29
45 4410
17
27
4845
0
1
2
32
23
37
58
96
91
0
20
40
60
80
100
120
FY18 FY19 FY20 FY21 FY21F Prospectus
North America APAC ROW
Keypath revenue – constant currency
22
Year ended
June 30FY18 FY19 FY20 FY21
FY21F
Prospectus
North America
CAD:USD 0.78 0.76 0.75 0.78 0.76
APAC
AUD:USD 0.77 0.72 0.67 0.75 0.73
Rest of World
GBP:USD 1.34 1.29 1.26 1.35 1.31
Note: Compares all periods using the FY21 prospectus foreign exchange rates;(1) Excludes Malaysian ringgit as the Malaysian had $nil revenue in FY21; (2) ROW is comprised of the United Kingdom
REVENUE BY GEOGRAPHY
Re
ven
ue
, fig
ure
s in
US
$M
1 2

Contribution margin
23
• Contribution margin is revenue less direct costs, which consists
of salaries and wages and general and administration expenses
attributable to direct departments, and direct marketing
• Contribution margin is not a US GAAP based measure; it is
used by Keypath to monitor and evaluate individual programs
financial performance relative to planned performance targets
over the whole-of-life of the program
• Contribution margin is not a replacement for the financial
performance of the Company as a whole as determined in
accordance with US GAAP
• Stock-based compensation (ongoing) includes one month of
expense
RECONCILIATION OF CONTRIBUTION MARGIN TO EBITDA
(1) When excluding US$2.6m revenue for transition services to be provided by the Company to assist a partner to take its programs in-house from US$98.1m FY21 Actual and US$91.1m FY21 Forecast: - Contribution margin was 24% for FY21 Actual and 17% for FY21 Forecast and - EBITDA % was (48%) for FY21 Actual and (57%) for FY21 Forecast.
COMMENTARY
US $m FY21 FY20 % change Prospectus FY21F % change
Revenue 98.1 55.5 77% 91.1 8%
Direct salaries and wages net of capitalized costs (37.2) (24.1) 54% (35.9) 3%
Direct marketing expenses (33.2) (22.2) 50% (33.1) 0%
General and administration expenses allocated to direct departments (2.0) (2.5) (18%) (4.3) (54%)
Contribution margin 25.7 6.7 283% 17.6 46%
Corporate costs (23.9) (14.1) 69% (23.9) 0%
Stock-based compensation expense (one-time) (41.7) - (38.2) 9%
Stock-based compensation expense (ongoing) (0.2) - (0.3) (31%)
Legacy Long-Term Incentive Plan Cash Awards (3.2) - (3.2) -%
EBITDA (43.4) (7.4) 484% (48.0) (10%)
Contribution margin %1 26% 12% 117% 19% 35%
EBITDA %1 (44%) (13%) 230% (53%) (16%)
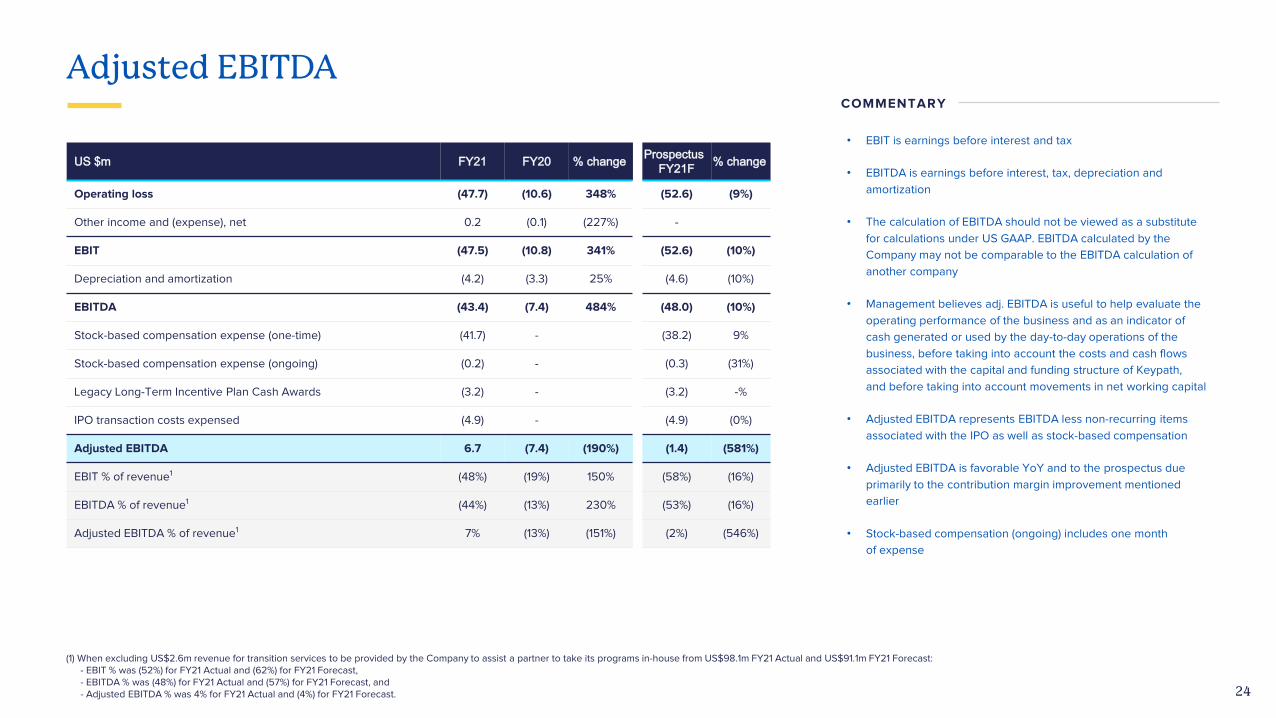
Adjusted EBITDA
24
• EBIT is earnings before interest and tax
• EBITDA is earnings before interest, tax, depreciation and
amortization
• The calculation of EBITDA should not be viewed as a substitute
for calculations under US GAAP. EBITDA calculated by the
Company may not be comparable to the EBITDA calculation of
another company
• Management believes adj. EBITDA is useful to help evaluate the
operating performance of the business and as an indicator of
cash generated or used by the day-to-day operations of the
business, before taking into account the costs and cash flows
associated with the capital and funding structure of Keypath,
and before taking into account movements in net working capital
• Adjusted EBITDA represents EBITDA less non-recurring items
associated with the IPO as well as stock-based compensation
• Adjusted EBITDA is favorable YoY and to the prospectus due
primarily to the contribution margin improvement mentioned
earlier
• Stock-based compensation (ongoing) includes one month
of expense
(1) When excluding US$2.6m revenue for transition services to be provided by the Company to assist a partner to take its programs in-house from US$98.1m FY21 Actual and US$91.1m FY21 Forecast: - EBIT % was (52%) for FY21 Actual and (62%) for FY21 Forecast, - EBITDA % was (48%) for FY21 Actual and (57%) for FY21 Forecast, and - Adjusted EBITDA % was 4% for FY21 Actual and (4%) for FY21 Forecast.
COMMENTARY
US $m FY21 FY20 % change Prospectus FY21F % change
Operating loss (47.7) (10.6) 348% (52.6) (9%)
Other income and (expense), net 0.2 (0.1) (227%) -
EBIT (47.5) (10.8) 341% (52.6) (10%)
Depreciation and amortization (4.2) (3.3) 25% (4.6) (10%)
EBITDA (43.4) (7.4) 484% (48.0) (10%)
Stock-based compensation expense (one-time) (41.7) - (38.2) 9%
Stock-based compensation expense (ongoing) (0.2) - (0.3) (31%)
Legacy Long-Term Incentive Plan Cash Awards (3.2) - (3.2) -%
IPO transaction costs expensed (4.9) - (4.9) (0%)
Adjusted EBITDA 6.7 (7.4) (190%) (1.4) (581%)
EBIT % of revenue1 (48%) (19%) 150% (58%) (16%)
EBITDA % of revenue1 (44%) (13%) 230% (53%) (16%)
Adjusted EBITDA % of revenue1 7% (13%) (151%) (2%) (546%)

Unit economic model
25
Keypath continues to target program contribution margin in the 40-60% range
Pre Enrolment Year 1 Year 2 Year 3 Years 4-10
ILLUSTRATIVE TARGET PROGRAM UNIT ECONOMICS
Program revenue
Program contribution margin
D E V E L O P M E N T & L A U N C H G R O W O P T I M I Z E
15 – 24 months
To initial cashbreakeven
Tuition sharewith partners140 – 60%Avg. total cash investment
by Keypath per programUS$500k— US$1M
30 – 40 months
To generate cash equal to total cash investment
Note: The diagram above is an illustrative example only and not representative of any particular online program facilitated by Keypath. It is possible that Keypath’s university partners’ online programs may not perform in accordance with the illustrative diagram above. The diagram has not been drawn to scale; Contribution margin is revenue less direct costs, which consists of salaries and wages and general and administration expenses attributable to Direct Departments, and direct marketing. Contribution margin is not a US GAAP based measure. It is used by Keypath to monitor and evaluate individual programs financial performance relative to planned performance targets over the whole-of-life of the program. Contribution margin is not a replacement for the financial performance of the Company as a whole as determined in accordance with US GAAP;(1) Keypath’s revenue share varies by university partner, program offering and the Keypath services being provided for the program, but is generally between 40-60% of the tuition fees from students enrolled under the program
Pre Enrollment

26
FY2022 Progress and Outlook
3
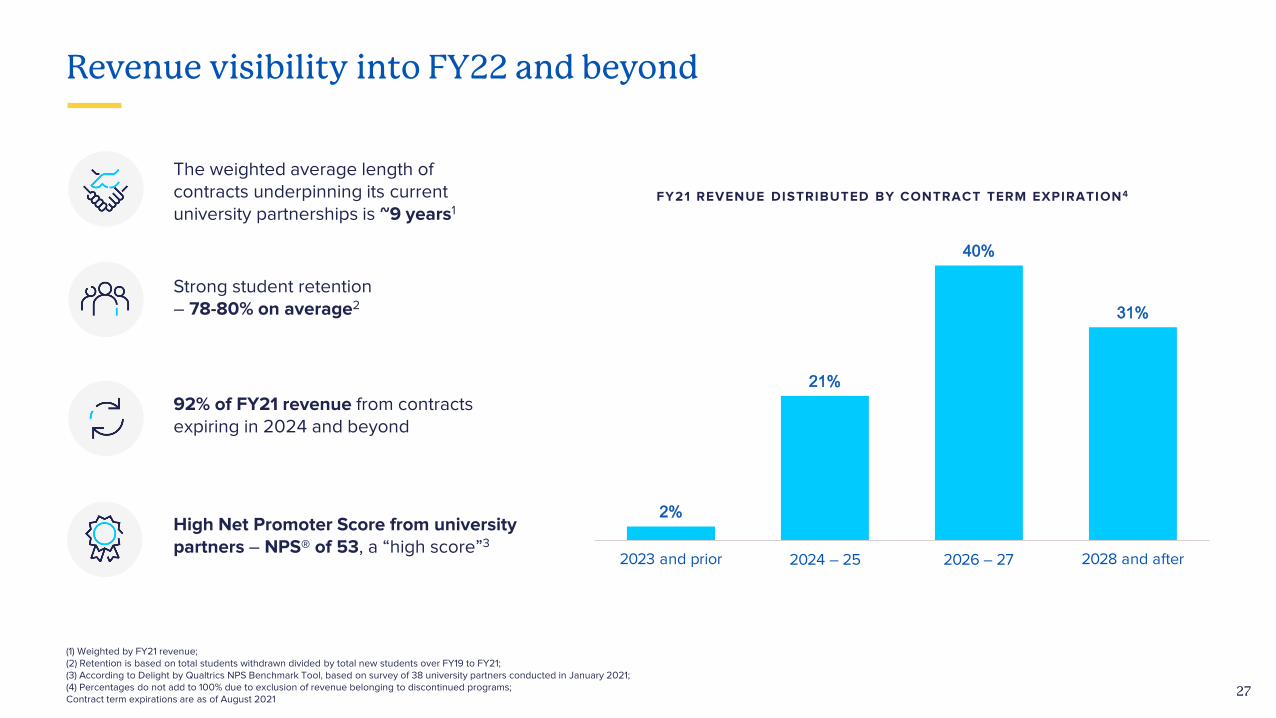
Revenue visibility into FY22 and beyond
27
FY21 REVENUE DISTRIBUTED BY CONTRACT TERM EXPIRATION4
The weighted average length of contracts underpinning its current university partnerships is ~9 years1
92% of FY21 revenue from contracts expiring in 2024 and beyond
High Net Promoter Score from university partners – NPS® of 53, a “high score”3
Strong student retention – 78-80% on average2
(1) Weighted by FY21 revenue; (2) Retention is based on total students withdrawn divided by total new students over FY19 to FY21;(3) According to Delight by Qualtrics NPS Benchmark Tool, based on survey of 38 university partners conducted in January 2021; (4) Percentages do not add to 100% due to exclusion of revenue belonging to discontinued programs; Contract term expirations are as of August 2021
2%
21%
40%
31%
0%
5%
1 0%
1 5%
20%
25%
30%
35%
40%
45%
2023 and prior 2024 – 25 2026 – 27 2028 and after

EdTech industry growth
The global EdTech & Online Program Management (OPM) industries are accelerating at their fastest rates in years. Keypath – with its unique global footprint – sits at the forefront of this growth.
Source: HolonIQ

FY22 progress and outlook
29
• Keypath is well positioned with growing acceptance among universities and a clear trajectory of accelerating global growth in online learning
Revenue in FY21 +67% YoY (constant currency) and contribution margin of 26% , up from 1 2% in FY20, gives the Company strong momentum into FY22
We are on track with new university and program signings
Healthcare expansion, including Nursing, continues to drive growth and new program pipeline
KeypathEDGE investments giving operational leverage and scale as shown with our results in FY21
We are reaffirming the prospectus forecast for FY22 Revenue of $1 1 6.4m and EBITDA of ($23.0m)

Q&A

31
OPM Industry
Appendix A
A

What is OPM (Online Program Management)?
32
• Universities typically own and are responsible for the academic content
• OPM providers work with the university to design the delivery of that content through an online format
• Each program design is bespoke to the university partner including branding of the program
OPM providers offer a set of services and commercial model to assist universities to build and launch online programs in a faster and more effective manner than it may take universities to develop them in-house Wide global footprint with a market leading
position in Australia. Keypath has partnered with as many universities since 2014 as all of its competitors combined in Australia1
Key competitors with large customer base and/or global footprint
COMPETITIVE LANDSCAPE
Source: HolonIQ

(1) World Economic Forum (October 2020); (2) Holon IQ, Online Degree Market Size (April 2020); (3) ICEF Monitor, Global Higher Education Growth Through 2040 (October 2018)
Why universities need OPM and Keypath
33
Both the future of work and education are experiencing unprecedented change
Acceleratingskills imbalance
More than one billion jobs are expected to be disrupted by technology in the next 5 years, requiring modern, scalable education solutions1
University operating model
Significant lead time and investment in new program launch causing higher education providers to revisit approach, turning to OPMs for assistance
Acceptance of online learning
Accelerating shift to digital learning underscored by large addressable market –online education represents just 2% of the total higher education market2
Lack of partner expertise in digital
Higher education providers can lack digital expertise –driving the need for seasoned partners to assist with program development, marketing & recruitment
Limited campus & faculty capacity
Universities will need to adopt scalable learning models to absorb the additional 180M students entering higher education over the next decade3

1.3
4.7
9.6
0.4
1.0
3.7
1.7
5.7
13.3
2015 2020 2025E
RoW
U.S.
15% CAGR
2020-25E CAGR
30% CAGR
28% CAGR
19% CAGR
OPM – A large and growing market
34
GLOBAL OPM MARKET SIZE1Growth in the online degree market is expected to be influenced by COVID-19 as government restrictions impact the adoption of the online education model and universities look to online programs as a viable way to expand revenues.
Forced exposure of many students to online learning brought about by COVID-19 has accelerated the consideration of online learning as a feasible alternative to on-campus learning, which may drive a longer-term integration of digital technologies and transition to greater adoption of online education in the future.
(1) “Global Online Degree and Micro-Credential Market”, HolonIQ, March 2021; (2) HolonIQ estimates; ‘Pre-COVID’ published May 2020; ‘Mid-COVID’ published March 2021. Source: “Global Online Degree and Micro-Credential Market”, HolonIQ, March 2021
US
$ in
bill
ion
s
O N L I N E H I G H E R E D U C A T I O N M A R K E T E S T I M A T E S , P R E - C O V I D - 1 9 A N D M I D C O V I D - 1 9 2
US
$ in
bill
ion
s
36
74
97
2019 2025EPre-COVID-19 Mid-COVID-19
13% CAGR
18% CAGR
2019-2025E CAGR:
With a 2020-2025E CAGR of 30%, growth in the RoW OPM market is expected to significantly outpace that of the US OPM market
Underscored by favorable industry trends OPM MARKET DYNAMICS

35
Business Overview
Appendix B
B

Keypath Education
36
We are a leading global education technology company enabling universities to grow students and deliver education online.
UNIVERSITIES
Increased speed to market, student enrollment &
extension of institutional mission
STUDENTS
Access to online degrees with enhanced user
experience & flexibility
INDUSTRY
Workforce-aligned programs addressing skills gaps, with identified differentiators to fit industry needs
~85kCourse enrollments
in FY21
>1 BillionJobs disrupted by technology in the
next 5 years1
32global university
partners
(1) ) World Economic Forum, Future of Jobs Report 2020

Keypath at a glance
37
Large and attractive market opportunity• OPM market expected to grow at 19% within the US$2T+ global higher education market1
• Identified growth opportunities in markets and disciplines that are aligned to global skills shortages
Attractive unit economic model and high degree of revenue visibility• Targeting 40-60% contribution margin at steady state
• Long-term contracts, typically 7-10 years
• 92% of FY21 revenue is from contracts expiring in 2024 and beyond
Global footprint powered by KeypathEDGE tech and data platform• Global footprint and data give us competitive advantage – market leader in Australia, early mover in SE Asia
• Predicting markets, customer behavior and student experience, driving all investment decisions and delivering strong outcomes for students, partners, and Keypath
(1) 2020-2025E OPM market size CAGR of 19%; Source: “Global Online Degree and Micro-Credential Market”, HolonIQ, March 2021;
1
Both the future of work and education are experiencing unprecedented change
2
3

University partnerships
38
Powered by our technology, data platform and employees, we partner with universities to deliver online programs, enabling working professionals to up-skill or re-skill to prepare them for the future of work.
End-to-End Student Lifecycle Support Powered by KeypathEDGE
Keypath’s purpose is to transform education by delivering programs that meet the needs of the future of work, and help solve our global, social and economic challenges.
OPTIMIZE

Proprietary, scalable and end-to-end tech platform
39
DESIGNProgram Design & Development
Leading learning programs seeking to deliver on skills gaps, and exceed
student expectations
GROWProgram Marketing
& Student RecruitmentAgile & scalable marketing,
recruitment & placement systems. Based on predictive analytics
EXPLOREPredictive Analytics & Market AssessmentData analysis to assess market opportunities globally
EXPERIENCEStudent ExperienceData-driven customer experience design to support and optimise the learning experience
KeypathEDGE is the integrated technology and data platform that underpins Keypath’s ability to launch successful partnerships and programs, and acquire and retain students.

End-to-end offering across the program lifecycle
40
All Keypath services are performed in-house and in the partner location to ensure smooth operation and integration
KEY SERVICE FEATURES
Keypath has developed a searchable library of more than 250 proprietary course design templates to provide its university partners a wide choice of “pre-built” learning experience to include or adapt in their courses
The KeypathEDGE platform maintains Keypath’s network and database of healthcare providers in the US, providing access to over 13,000 clinical and field placement relationships across 49 states with specific access to approximately 300 of the major US health systems1
Keypath launched its student placement services in 2019 and has since been able to grow this service to 10 university partners
Note: Illustrates roles typically (but not necessarily solely) undertaken by the relevant party; (1) An organization that includes at least one hospital and at least one group of physicians that provides comprehensive care (including primary and specialty care)

Deakin University
Edith Cowan University University of New South Wales Sunway University
Southern Cross University RMIT University James Cook University Victoria University University of Technology
Sydney University of Canberra
Central Christian College Kettering University Florida State University Aston University Baylor University Emerson College Elmhurst University
Spring Arbor University St Bonaventure University Wilfrid Laurier University University of Exeter Carson -Newman
UniversityTexas Woman’s
University Keuka College
Walsh University Michigan Technology University Marymount University
Suffolk University University of Ottawa
Wilkes University
Worcester Polytechnic Institute
Global customer base of leading universities
41
Keypath has grown its network of globally ranked universities and is a market leader in Australia, where it has partnered with as many universities since 2014 as its competitors combined1
Note: Year indicates fiscal year during which Keypath first entered into a partnership with each active university partner; (1) HolonIQ Education Market Intelligence Platform, accessed 1 March 2021; (2) Rest of World comprises the United Kingdom
2018
AP
AC
NO
RT
H A
ME
RIC
A
& R
OW
2
2015 2016 2017 2018 2019 2020 2021
AU 1ST PARTNER
US 1ST PARTNER
CA 1ST PARTNER
UK 1ST PARTNER
S.E.A 1ST PARTNER