interim results presentation – clarification · interim results presentation – clarification...
TRANSCRIPT
Australian Pipeline Ltd ACN 091 344 704 | Australian Pipeline Trust ARSN 091 678 778 | APT Investment Trust ARSN 115 585 441
Level 19, 580 George Street Sydney NSW 2000 | PO Box R41 Royal Exchange NSW 1225 Phone +61 2 9693 0000 | Fax +61 2 9693 0093
APA Group | apa.com.au
22 February 2017
ASX ANNOUNCEMENT
APA Group (ASX: APA)
(also for release to APT Pipelines Limited (ASX: AQH))
Interim Results Presentation – clarification
APA Group (ASX: APA) refers to its interim results presentation released earlier today. Attached is a revised
presentation, with a clarified structure chart on page 25.
Nevenka Codevelle
Company Secretary
Australian Pipeline Limited
For further information please contact:
Investor enquiries: Media enquiries:
Yoko Kosugi Louise Watson
Telephone: +61 2 9693 0049 Telephone: +61 2 8079 2970
Mob: +61 438 010 332 Mob: +61 419 185 674
Email: [email protected] Email: [email protected]
About APA Group (APA)
APA is Australia’s largest natural gas infrastructure business, owning and/or operating around $20 billion of energy infrastructure
assets. Its gas transmission pipelines span every state and territory on mainland Australia, delivering approximately half of the nation’s gas usage. APA has direct management and operational control over its assets and the majority of its investments. APA also holds
ownership interests in a number of energy infrastructure enterprises including SEA Gas Pipeline, SEA Gas (Mortlake) Partnership, Energy
Infrastructure Investments and GDI Allgas Gas Networks.
APT Pipelines Limited is a wholly owned subsidiary of Australian Pipeline Trust and is the borrowing entity of APA Group.
For more information visit APA’s website, apa.com.au
financial results for half year ended 31 December 2016.
22 February 2017
2
disclaimer
This presentation has been prepared by Australian Pipeline Limited (ACN 091 344 704) as responsible entity of the Australian Pipeline Trust (ARSN 091 678 778) and APT
Investment Trust (ARSN 115 585 441) (APA Group).
The information in this presentation does not contain all the information which a prospective investor may require in evaluating a possible investment in APA Group and
should be read in conjunction with the APA Group’s other periodic and continuous disclosure announcements which are available at www.apa.com.au.
All references to dollars, cents or ‘$’ in this presentation are to Australian currency, unless otherwise stated.
Not financial product advice: Please note that Australian Pipeline Limited is not licensed to provide financial product advice in relation to securities in the APA Group. This
presentation is for information purposes only and is not financial product or investment advice or a recommendation to acquire APA Group securities and has been
prepared without taking into account the objectives, financial situation or needs of individuals. Before making an investment decision, prospective investors should
consider the appropriateness of the information having regard to their own objectives, financial situation and needs and seek professional advice if necessary.
Past performance: Past performance information should not be relied upon as (and is not) an indication of future performance.
Forward looking statements: This presentation contains certain forward looking information, including about APA Group, which is subject to risk factors. “Forward-looking
statements” may include indications of, and guidance on, future earnings and financial position and performance. Forward-looking statements can generally be
identified by the use of forward-looking words such as, 'expect', 'anticipate', 'likely', 'intend', 'could', 'may', 'predict', 'plan', 'propose', 'will', 'believe', 'forecast', 'estimate',
'target', 'outlook', 'guidance' and other similar expressions and include, but are not limited to, forecast EBIT and EBITDA, operating cashflow, distribution guidance and
estimated asset life.
APA Group believes that there are reasonable grounds for these forward looking statements and due care and attention have been used in preparing this presentation.
However, the forward looking statements, opinions and estimates provided in this presentation are based on assumptions and contingencies which are subject to
change without notice, as are statements about market and industry trends, which are based on interpretations of current market conditions and are subject to risk
factors associated with the industries in which APA Group operates. Forward-looking statements, opinions and estimates are not guarantees or predictions of future
performance and involve known and unknown risks and uncertainties and other factors, many of which are beyond the control of APA Group, and may involve
significant elements of subjective judgement and assumptions as to future events which may or may not be correct. There can be no assurance that actual outcomes
will not materially differ from these forward-looking statements, opinions and estimates. A number of important factors could cause actual results or performance to differ
materially from such forward-looking statements, opinions and estimates.
Investors should form their own views as to these matters and any assumptions on which any forward-looking statements are based. APA Group assumes no obligation to
update or revise such information to reflect any change in expectations or assumptions.
Investment risk: An investment in securities in APA Group is subject to investment and other known and unknown risks, some of which are beyond the control of APA
Group. APA Group does not guarantee any particular rate of return or the performance of APA Group.
Non-IFRS financial measures: APA Group results are reported under International Financial Reporting Standards (IFRS). However, investors should be aware that this
presentation includes certain financial measures that are non-IFRS financial measures for the purposes of providing a more comprehensive understanding of the
performance of the APA Group. These non-IFRS financial measures include EBIT, EBITDA and other “normalised” measures. Such non-IFRS information is unaudited,
however the numbers have been extracted from the audited financial statements.
Not an offer: This presentation does not constitute an offer, invitation or recommendation to subscribe for or purchase any security. In particular, this presentation does
not constitute an offer to sell, or a solicitation of an offer to buy, any securities in the United States. Securities may not be offered or sold, directly or indirectly, in the United
States or to persons that are acting for the account or benefit of persons in the United States, unless they have been registered under the U.S. Securities Act of 1933, as
amended (the U.S. Securities Act), or are offered and sold in a transaction exempt from, or not subject to, the registration requirements of the U.S. Securities Act and any
other applicable state securities laws.
Non-GAAP financial measures: Investors should be aware that certain financial data included in this presentation are "non-GAAP financial measures" under Regulation G
of the U.S. Securities Exchange Act of 1934, as amended. These measures are EBITDA, normalised EBITDA and statutory EBITDA. The disclosure of such non-GAAP financial
measures in the manner included in the presentation may not be permissible in a registration statement under the U.S. Securities Act. These non-GAAP financial measures
do not have a standardised meaning prescribed by Australian Accounting Standards and therefore may not be comparable to similarly titled measures presented by
other entities, and should not be construed as an alternative to other financial measures determined in accordance with Australian Accounting Standards. Although APA
Group believes these non-GAAP financial measures provide useful information to users in measuring the financial performance and condition of its business, investors are
cautioned not to place undue reliance on any non-GAAP financial measures included in this presentation.
3
results overview and strategic highlights Mick McCormack Managing Director and CEO.
4
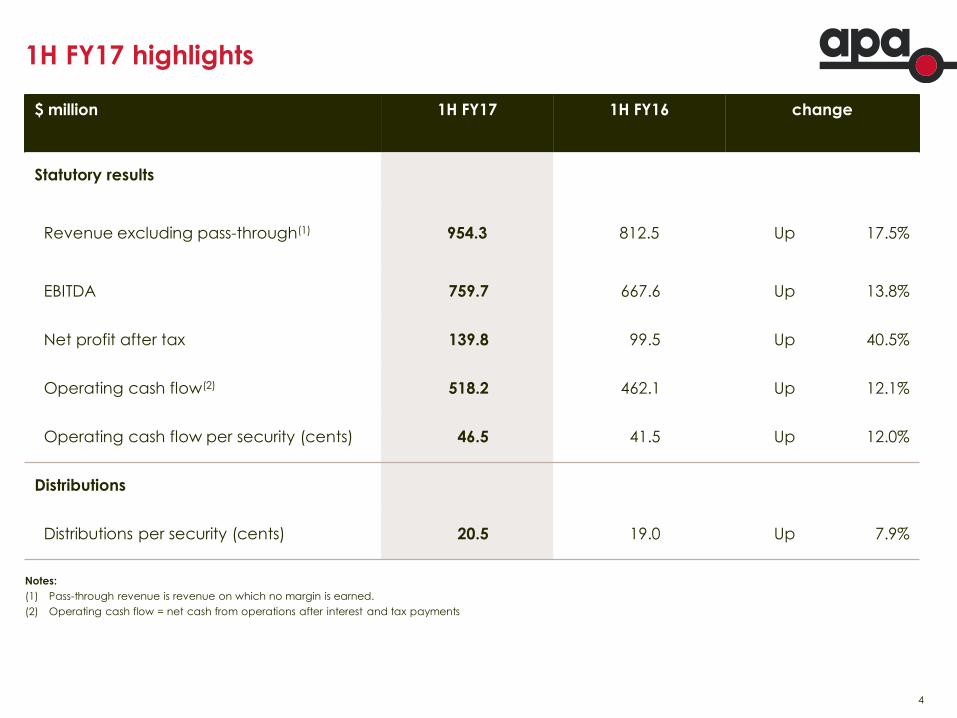
1H FY17 highlights
$ million 1H FY17 1H FY16 change
Statutory results
Revenue excluding pass-through(1) 954.3 812.5 Up 17.5%
EBITDA 759.7 667.6 Up 13.8%
Net profit after tax 139.8 99.5 Up 40.5%
Operating cash flow(2) 518.2 462.1 Up 12.1%
Operating cash flow per security (cents) 46.5 41.5 Up 12.0%
Distributions
Distributions per security (cents) 20.5 19.0 Up 7.9%
Notes:
(1) Pass-through revenue is revenue on which no margin is earned.
(2) Operating cash flow = net cash from operations after interest and tax payments
5
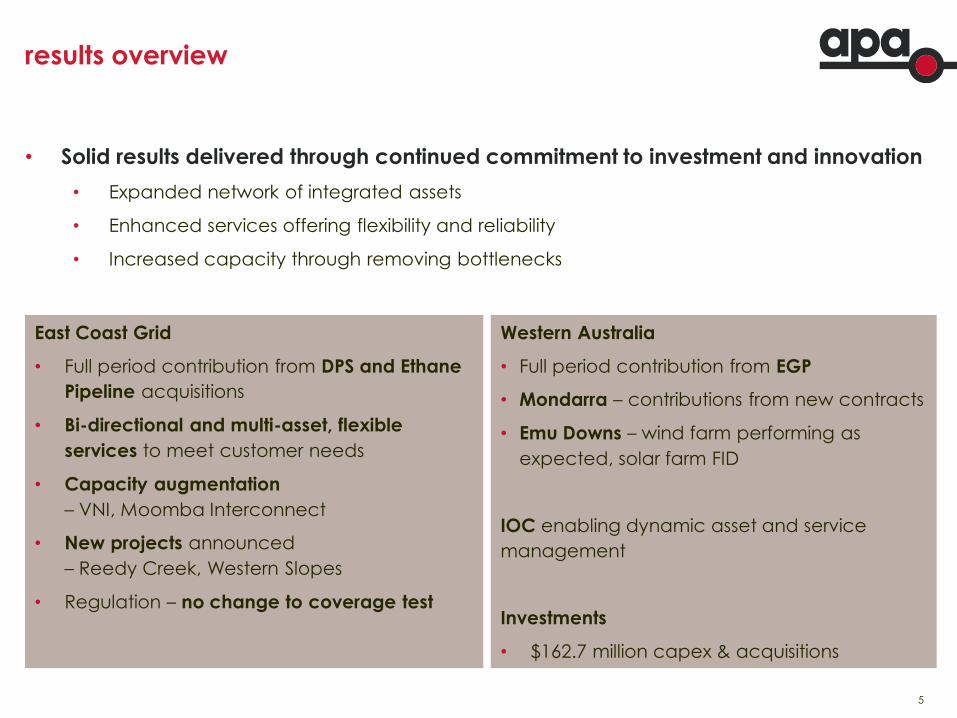
results overview
• Solid results delivered through continued commitment to investment and innovation
• Expanded network of integrated assets
• Enhanced services offering flexibility and reliability
• Increased capacity through removing bottlenecks
East Coast Grid
• Full period contribution from DPS and Ethane
Pipeline acquisitions
• Bi-directional and multi-asset, flexible
services to meet customer needs
• Capacity augmentation
– VNI, Moomba Interconnect
• New projects announced
– Reedy Creek, Western Slopes
• Regulation – no change to coverage test
Western Australia
• Full period contribution from EGP
• Mondarra – contributions from new contracts
• Emu Downs – wind farm performing as
expected, solar farm FID
IOC enabling dynamic asset and service
management
Investments
• $162.7 million capex & acquisitions
6
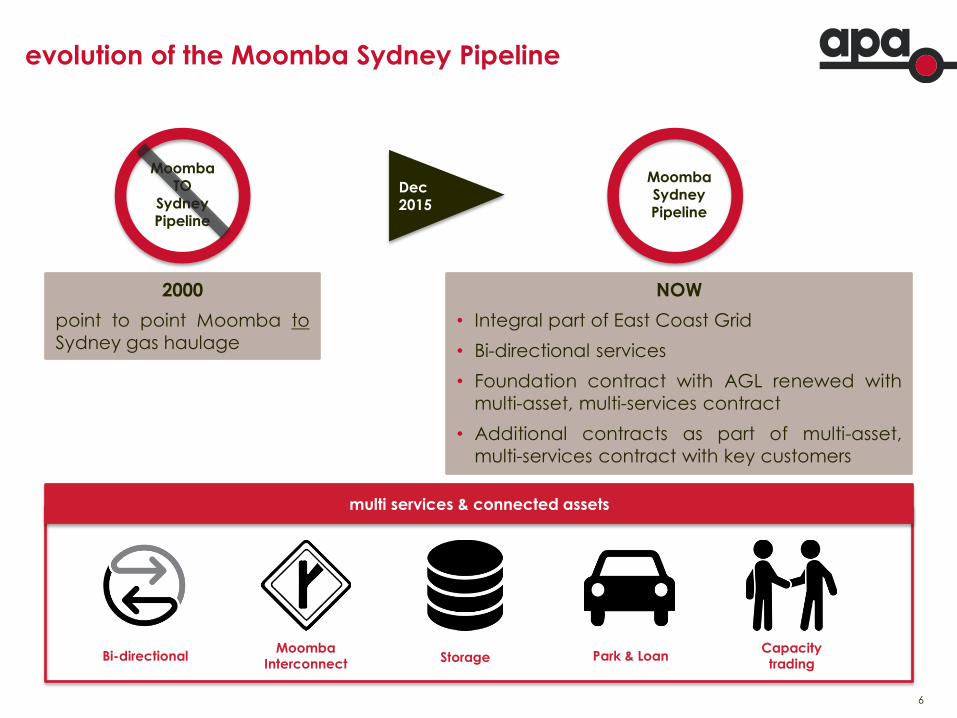
evolution of the Moomba Sydney Pipeline
NOW
• Integral part of East Coast Grid
• Bi-directional services
• Foundation contract with AGL renewed with
multi-asset, multi-services contract
• Additional contracts as part of multi-asset,
multi-services contract with key customers
Moomba Interconnect
Bi-directional Storage Park & Loan Capacity trading
Moomba Sydney Pipeline
Moomba TO
Sydney Pipeline
Dec 2015
2000
point to point Moomba to
Sydney gas haulage
multi services & connected assets
7
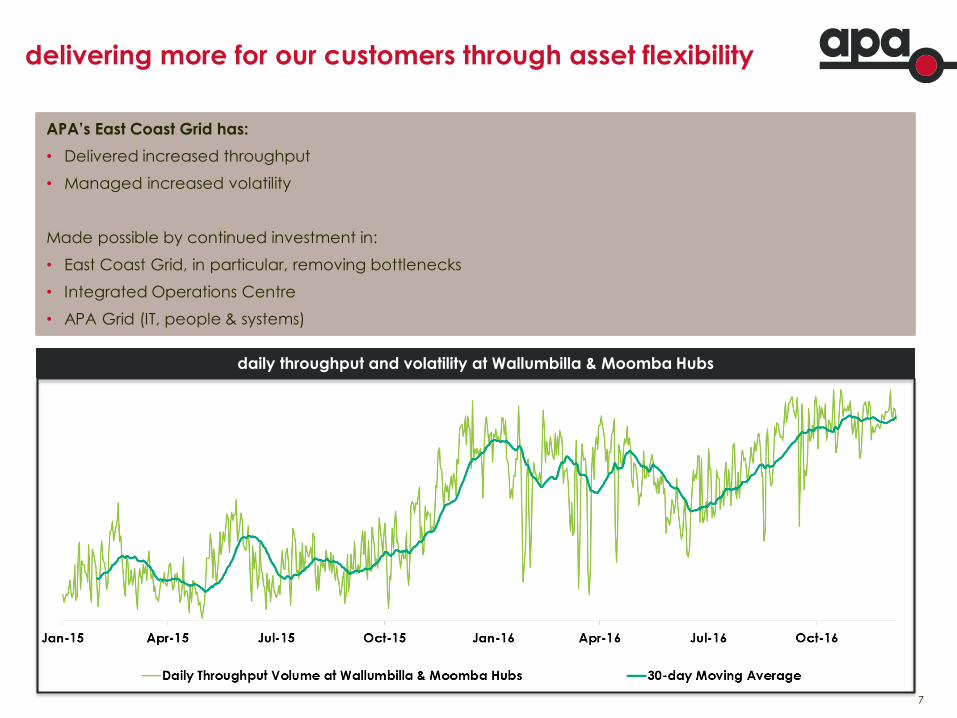
delivering more for our customers through asset flexibility
daily throughput and volatility at Wallumbilla & Moomba Hubs
APA’s East Coast Grid has:
• Delivered increased throughput
• Managed increased volatility
Made possible by continued investment in:
• East Coast Grid, in particular, removing bottlenecks
• Integrated Operations Centre
• APA Grid (IT, people & systems)
8
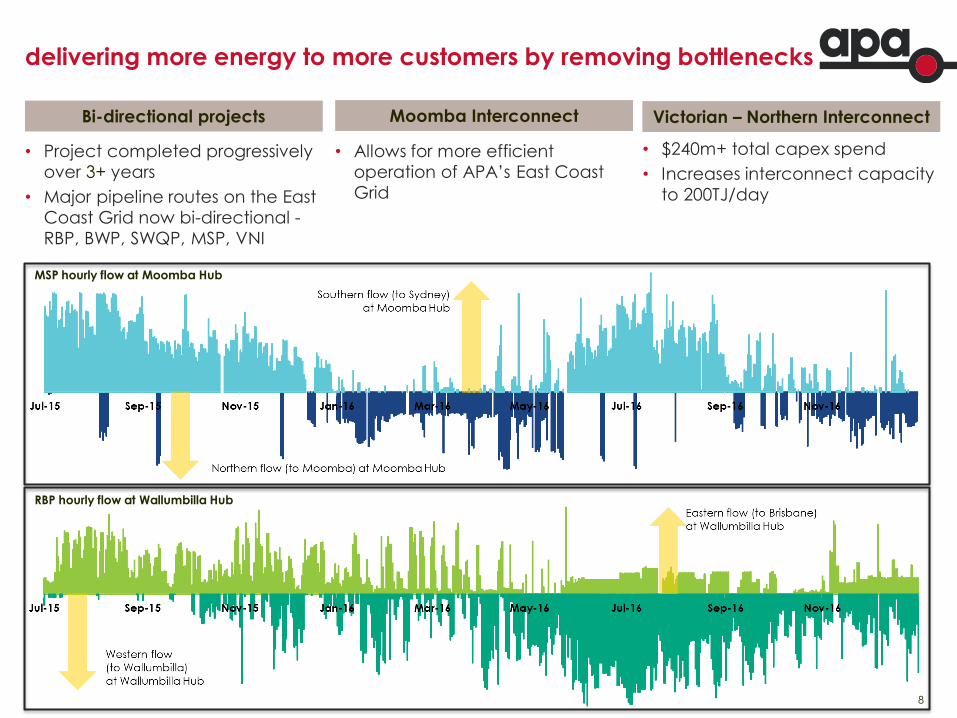
delivering more energy to more customers by removing bottlenecks
• Project completed progressively
over 3+ years
• Major pipeline routes on the East
Coast Grid now bi-directional -
RBP, BWP, SWQP, MSP, VNI
• $240m+ total capex spend
• Increases interconnect capacity
to 200TJ/day
Moomba Interconnect Victorian – Northern Interconnect Bi-directional projects
• Allows for more efficient
operation of APA’s East Coast
Grid
MSP hourly flow at Moomba Hub
RBP hourly flow at Wallumbilla Hub
9
financial performance Peter Fredricson Chief Financial Officer
10
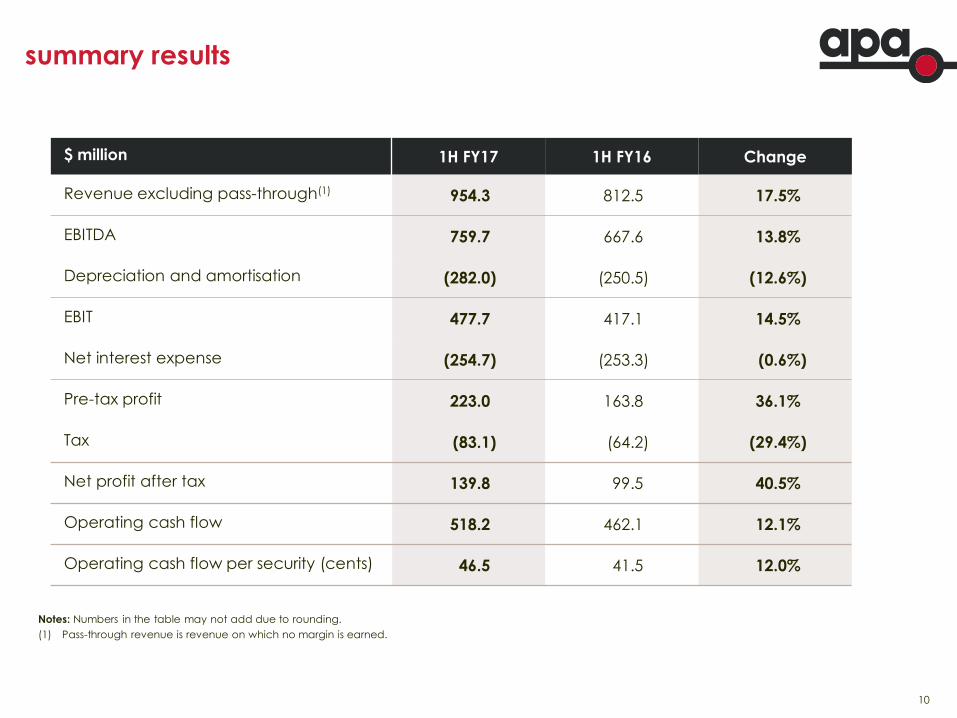
summary results
$ million 1H FY17 1H FY16 Change
Revenue excluding pass-through(1) 954.3 812.5 17.5%
EBITDA 759.7 667.6 13.8%
Depreciation and amortisation (282.0) (250.5) (12.6%)
EBIT 477.7 417.1 14.5%
Net interest expense (254.7) (253.3) (0.6%)
Pre-tax profit 223.0 163.8 36.1%
Tax (83.1) (64.2) (29.4%)
Net profit after tax 139.8 99.5 40.5%
Operating cash flow 518.2 462.1 12.1%
Operating cash flow per security (cents) 46.5 41.5 12.0%
Notes: Numbers in the table may not add due to rounding.
(1) Pass-through revenue is revenue on which no margin is earned.
11
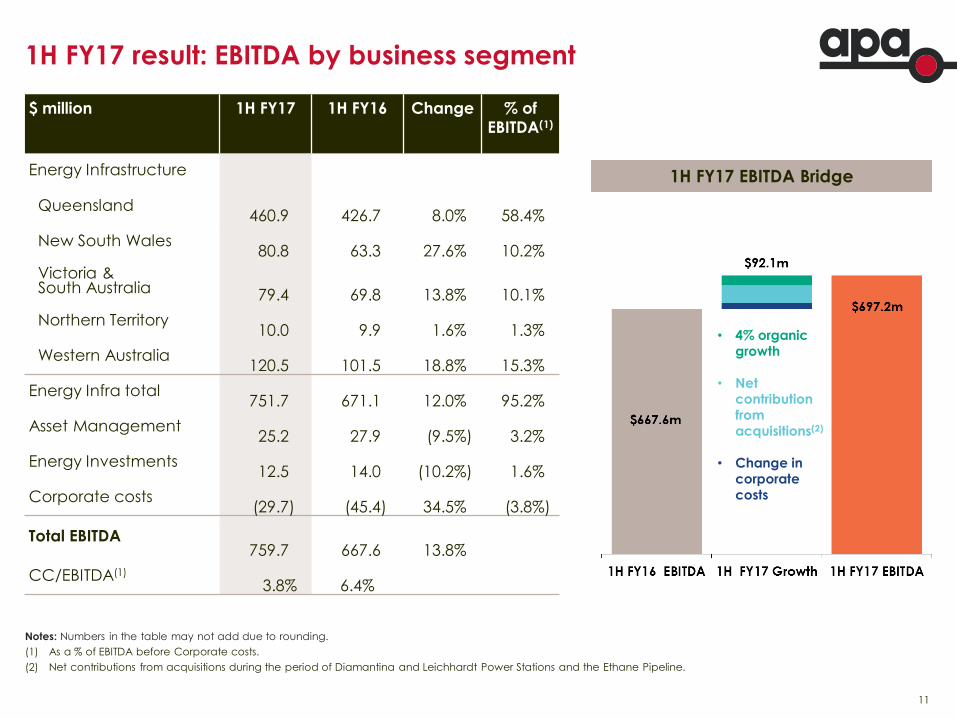
1H FY17 result: EBITDA by business segment
$ million 1H FY17 1H FY16 Change % of
EBITDA(1)
Energy Infrastructure
Queensland 460.9 426.7 8.0% 58.4%
New South Wales 80.8 63.3 27.6% 10.2%
Victoria & South Australia 79.4 69.8 13.8% 10.1%
Northern Territory 10.0 9.9 1.6% 1.3%
Western Australia 120.5 101.5 18.8% 15.3%
Energy Infra total 751.7 671.1 12.0% 95.2%
Asset Management 25.2 27.9 (9.5%) 3.2%
Energy Investments 12.5 14.0 (10.2%) 1.6%
Corporate costs (29.7) (45.4) 34.5% (3.8%)
Total EBITDA
759.7 667.6 13.8%
CC/EBITDA(1)
3.8% 6.4%
Notes: Numbers in the table may not add due to rounding.
(1) As a % of EBITDA before Corporate costs.
(2) Net contributions from acquisitions during the period of Diamantina and Leichhardt Power Stations and the Ethane Pipeline.
1H FY17 EBITDA Bridge
• 4% organic growth
• Net contribution from acquisitions(2)
• Change in corporate costs
12
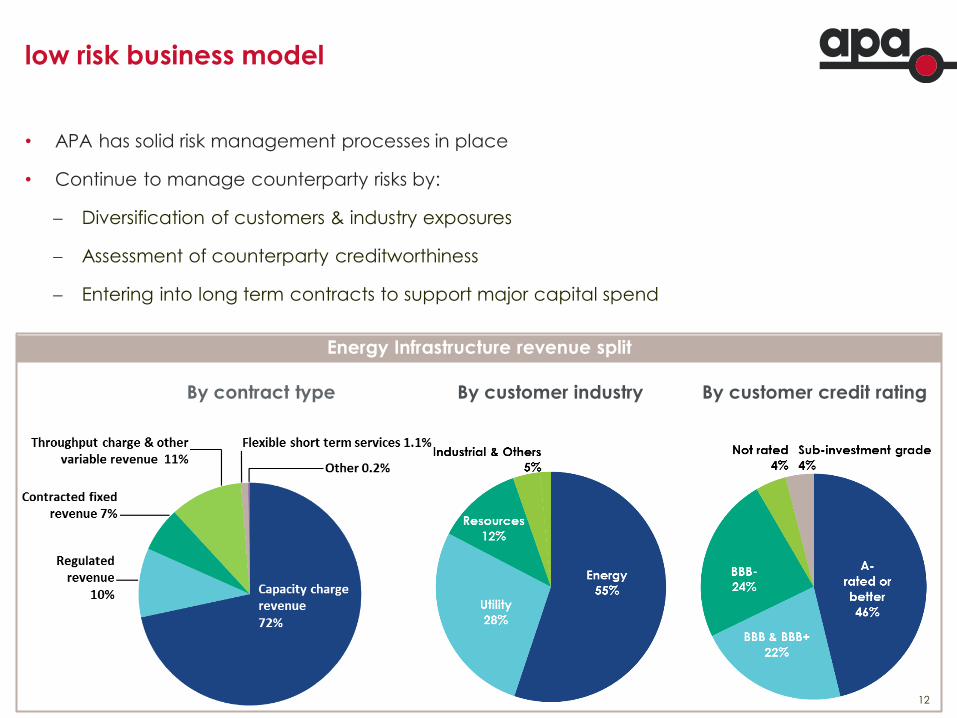
low risk business model
• APA has solid risk management processes in place
• Continue to manage counterparty risks by:
Diversification of customers & industry exposures
Assessment of counterparty creditworthiness
Entering into long term contracts to support major capital spend
By contract type
By customer credit rating
By customer industry
Energy Infrastructure revenue split
13
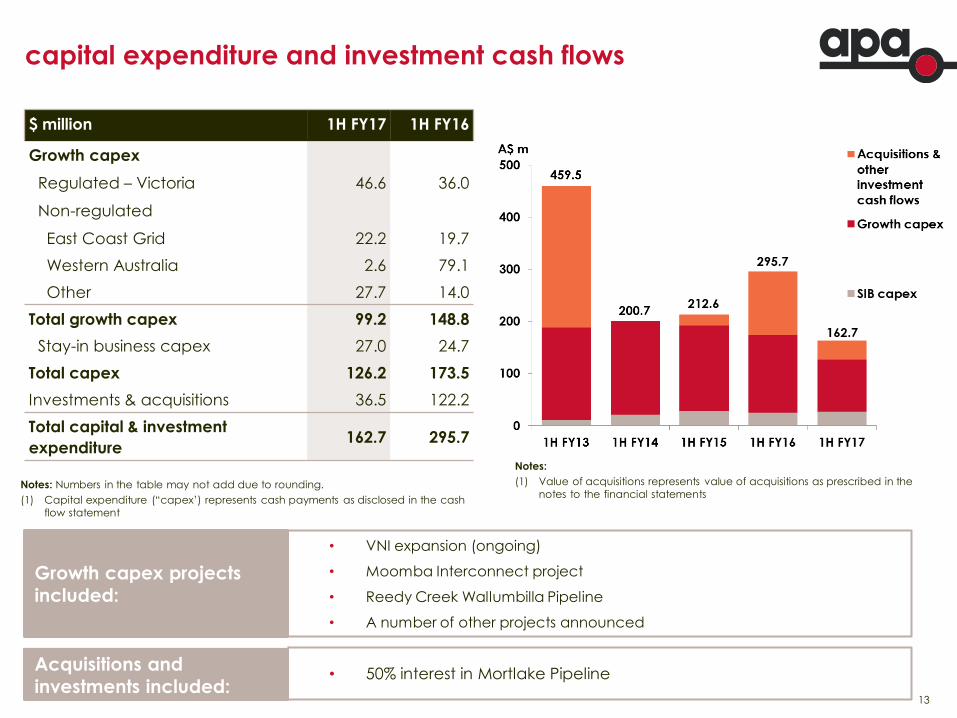
capital expenditure and investment cash flows
$ million 1H FY17 1H FY16
Growth capex
Regulated – Victoria 46.6 36.0
Non-regulated
East Coast Grid 22.2 19.7
Western Australia 2.6 79.1
Other 27.7 14.0
Total growth capex 99.2 148.8
Stay-in business capex 27.0 24.7
Total capex 126.2 173.5
Investments & acquisitions 36.5 122.2
Total capital & investment
expenditure 162.7 295.7
Notes: Numbers in the table may not add due to rounding.
(1) Capital expenditure (“capex’) represents cash payments as disclosed in the cash
flow statement
Notes:
(1) Value of acquisitions represents value of acquisitions as prescribed in the
notes to the financial statements
• VNI expansion (ongoing)
• Moomba Interconnect project
• Reedy Creek Wallumbilla Pipeline
• A number of other projects announced
Growth capex projects
included:
• 50% interest in Mortlake Pipeline Acquisitions and
investments included:
14
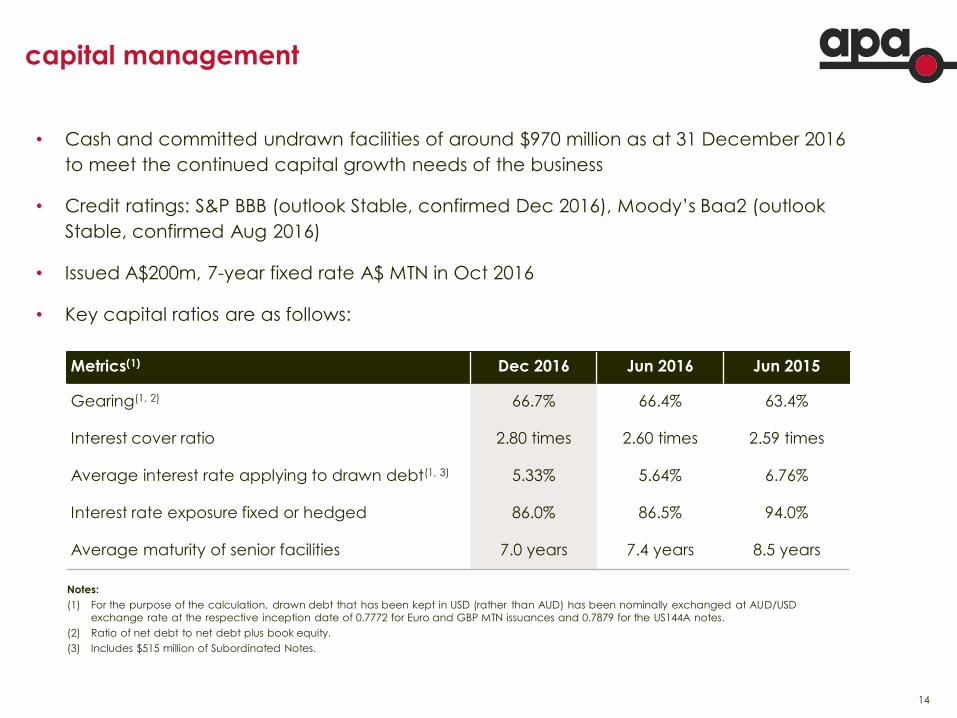
capital management
• Cash and committed undrawn facilities of around $970 million as at 31 December 2016
to meet the continued capital growth needs of the business
• Credit ratings: S&P BBB (outlook Stable, confirmed Dec 2016), Moody’s Baa2 (outlook
Stable, confirmed Aug 2016)
• Issued A$200m, 7-year fixed rate A$ MTN in Oct 2016
• Key capital ratios are as follows:
Metrics(1) Dec 2016 Jun 2016 Jun 2015
Gearing(1, 2) 66.7% 66.4% 63.4%
Interest cover ratio 2.80 times 2.60 times 2.59 times
Average interest rate applying to drawn debt(1, 3) 5.33% 5.64% 6.76%
Interest rate exposure fixed or hedged 86.0% 86.5% 94.0%
Average maturity of senior facilities 7.0 years 7.4 years 8.5 years
Notes:
(1) For the purpose of the calculation, drawn debt that has been kept in USD (rather than AUD) has been nominally exchanged at AUD/USD
exchange rate at the respective inception date of 0.7772 for Euro and GBP MTN issuances and 0.7879 for the US144A notes.
(2) Ratio of net debt to net debt plus book equity.
(3) Includes $515 million of Subordinated Notes.
15
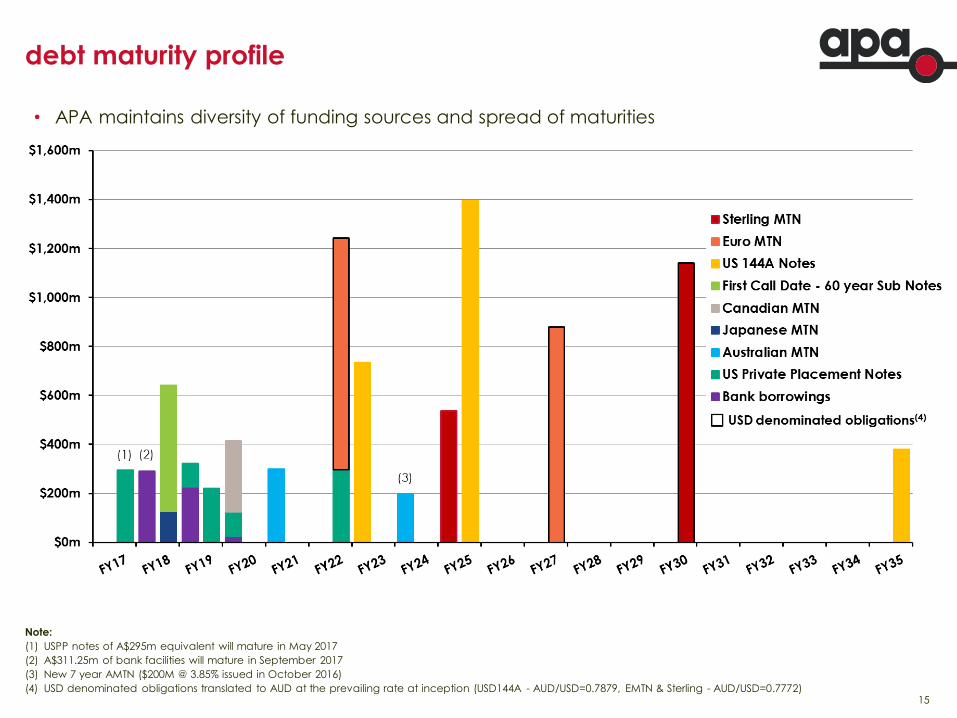
debt maturity profile
• APA maintains diversity of funding sources and spread of maturities
Note:
(1) USPP notes of A$295m equivalent will mature in May 2017
(2) A$311.25m of bank facilities will mature in September 2017
(3) New 7 year AMTN ($200M @ 3.85% issued in October 2016)
(4) USD denominated obligations translated to AUD at the prevailing rate at inception (USD144A - AUD/USD=0.7879, EMTN & Sterling - AUD/USD=0.7772)

16
fully covered distributions
• Distribution components:
4.67 cents APT franked profit distribution
4.92 cents APT unfranked profit distribution
5.47 cents APT capital distribution
3.48 cents APTIT profit distribution
1.96 cents APTIT capital distribution
20.5 cents
Franking Credits
• APA cash tax payer - calendar 2017
• Franking credits of 2.0 cents per
security allocated to the interim APT
profit distribution
• Expect future profits from APT to be
distributed with some level of franking
credits
17
FY17 guidance
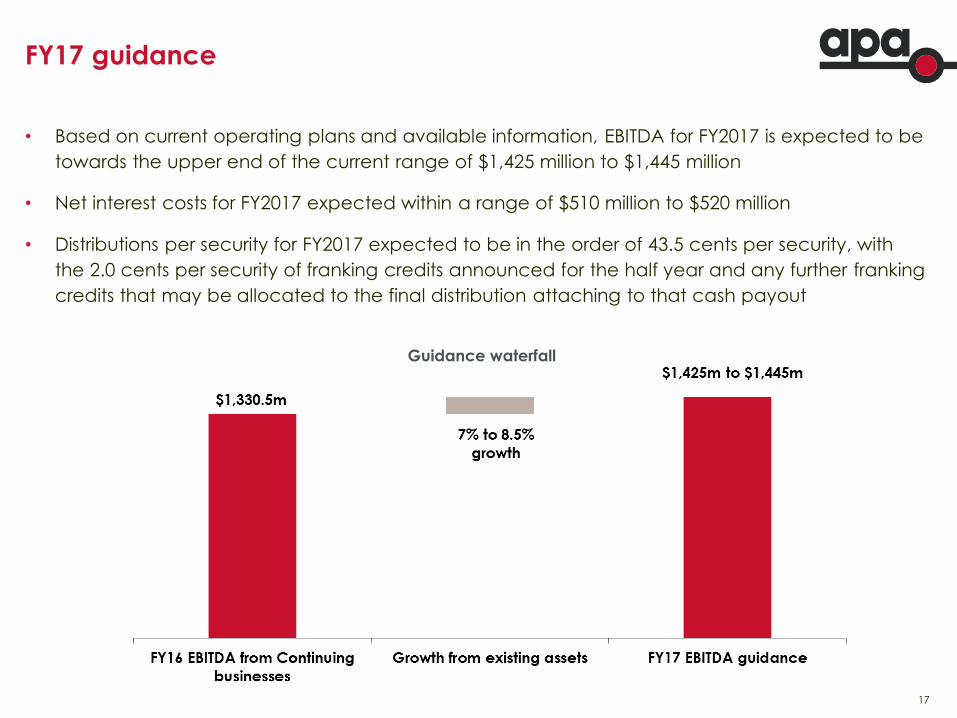
• Based on current operating plans and available information, EBITDA for FY2017 is expected to be
towards the upper end of the current range of $1,425 million to $1,445 million
• Net interest costs for FY2017 expected within a range of $510 million to $520 million
• Distributions per security for FY2017 expected to be in the order of 43.5 cents per security, with
the 2.0 cents per security of franking credits announced for the half year and any further franking
credits that may be allocated to the final distribution attaching to that cash payout
Guidance waterfall
18
outlook Mick McCormack Managing Director and CEO.
19
industry overview
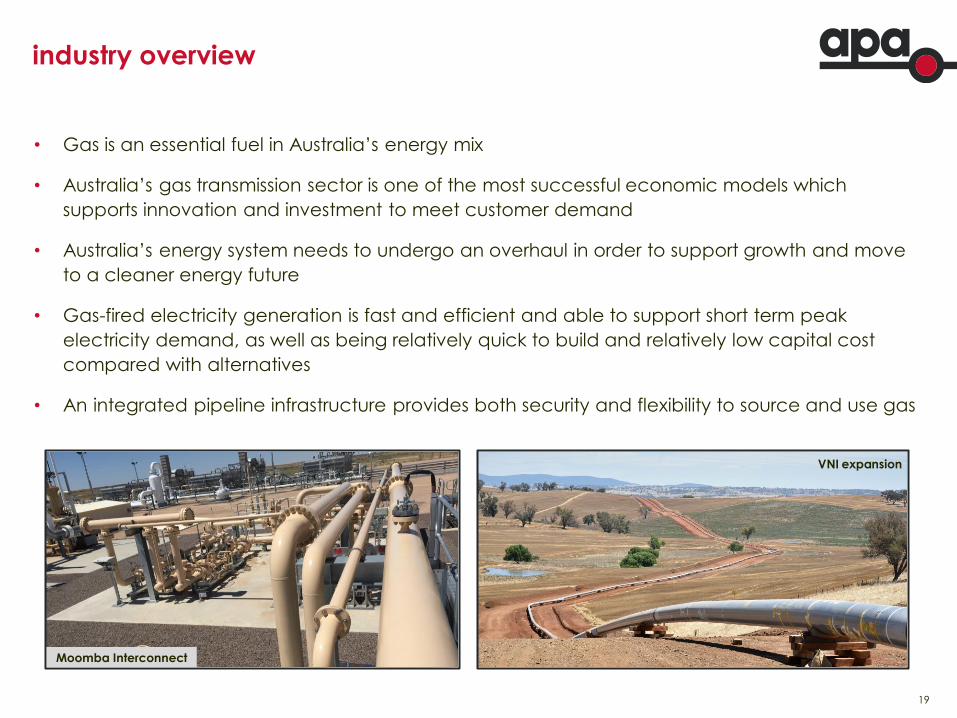
• Gas is an essential fuel in Australia’s energy mix
• Australia’s gas transmission sector is one of the most successful economic models which
supports innovation and investment to meet customer demand
• Australia’s energy system needs to undergo an overhaul in order to support growth and move
to a cleaner energy future
• Gas-fired electricity generation is fast and efficient and able to support short term peak
electricity demand, as well as being relatively quick to build and relatively low capital cost
compared with alternatives
• An integrated pipeline infrastructure provides both security and flexibility to source and use gas
Moomba Interconnect
VNI expansion
20
APA’s portfolio and strategy aligned with future energy needs
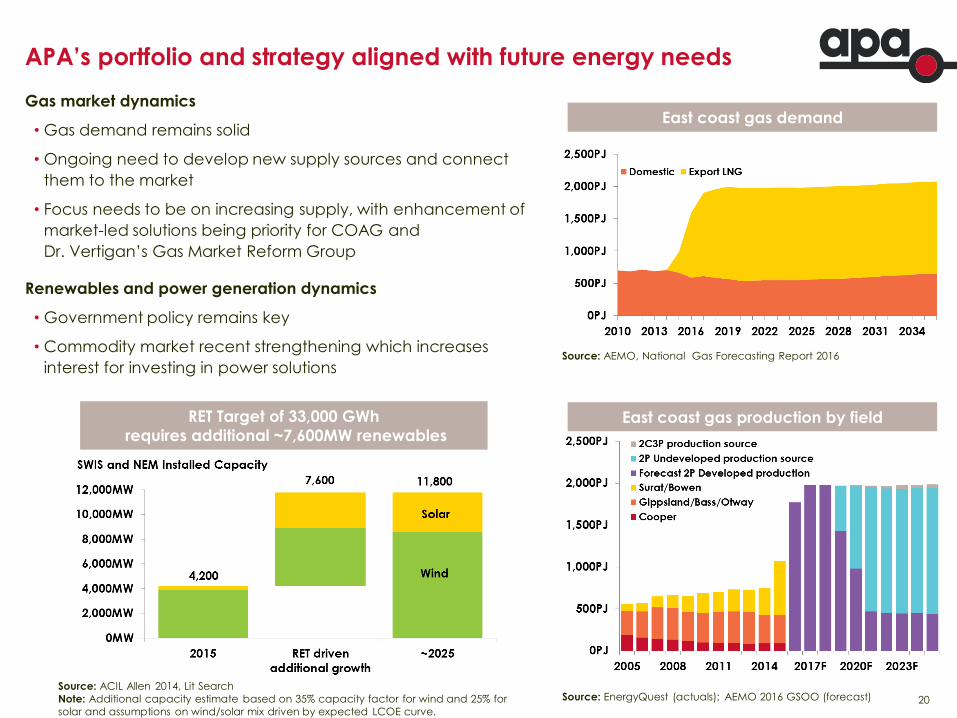
Gas market dynamics
• Gas demand remains solid
• Ongoing need to develop new supply sources and connect
them to the market
• Focus needs to be on increasing supply, with enhancement of
market-led solutions being priority for COAG and
Dr. Vertigan’s Gas Market Reform Group
Renewables and power generation dynamics
• Government policy remains key
• Commodity market recent strengthening which increases
interest for investing in power solutions
East coast gas demand
Source: AEMO, National Gas Forecasting Report 2016
Source: EnergyQuest (actuals); AEMO 2016 GSOO (forecast)
East coast gas production by field RET Target of 33,000 GWh
requires additional ~7,600MW renewables
Source: ACIL Allen 2014, Lit Search
Note: Additional capacity estimate based on 35% capacity factor for wind and 25% for
solar and assumptions on wind/solar mix driven by expected LCOE curve.

21
executing on our growth strategy and opportunities
APA’s investment
criteria
Reedy Creek
Wallumbilla Pipeline
Emu Downs
Solar Farm
Western Slopes
Pipeline
Badgingarra
Wind Farm
Project details • 50km, 300 TJ/day
bi-directional
capacity
• $80m construction
cost
• Commissioning
expected mid 2018
• 20MW solar farm
• $50m construction
cost
• Commissioning
expected Jan 2018
• Preliminary
Environmental
Assessment process
commenced
• 450km pipeline to
potential new gas
source
• ~$500m
construction cost
• 130MW wind farm
• $315m construction
cost
• Commissioning
expected Jan 2019
Appropriate funding
and capital structure
Corporate funding $5.5m ARENA
funding
Corporate funding
Subject to
regulatory
approvals and
project FID
Subject to
connections
agreement
Corporate funding
Contracts with strong
counterparties
20 year contract
with Australia
Pacific LNG
13 year contract
with Synergy
Subject to project
FID by Santos
12 year contract
with Alinta Energy
Appropriate allocation
of risk between parties
Leverage operational
expertise
Connection to
APA’s East Coast
Grid
Adjacent to Emu
Downs Wind Farm
Shared
infrastructure
Connection to
APA’s East Coast
Grid
Adjacent to Emu
Downs Wind Farm
and Emu Downs
Solar Farm
22
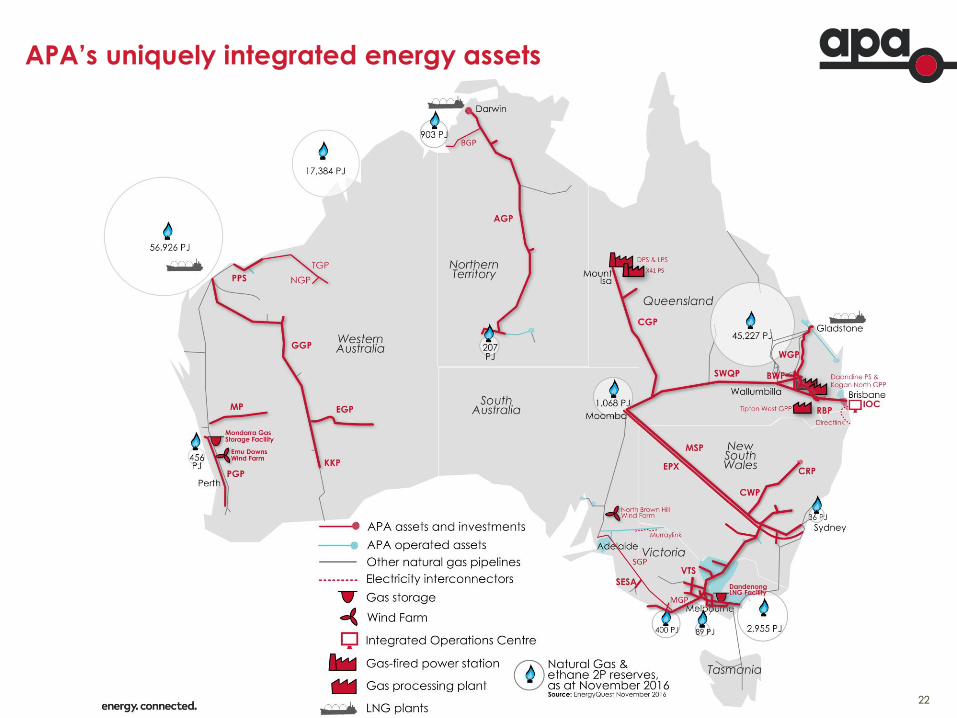
APA’s uniquely integrated energy assets
23
supplementary information
24
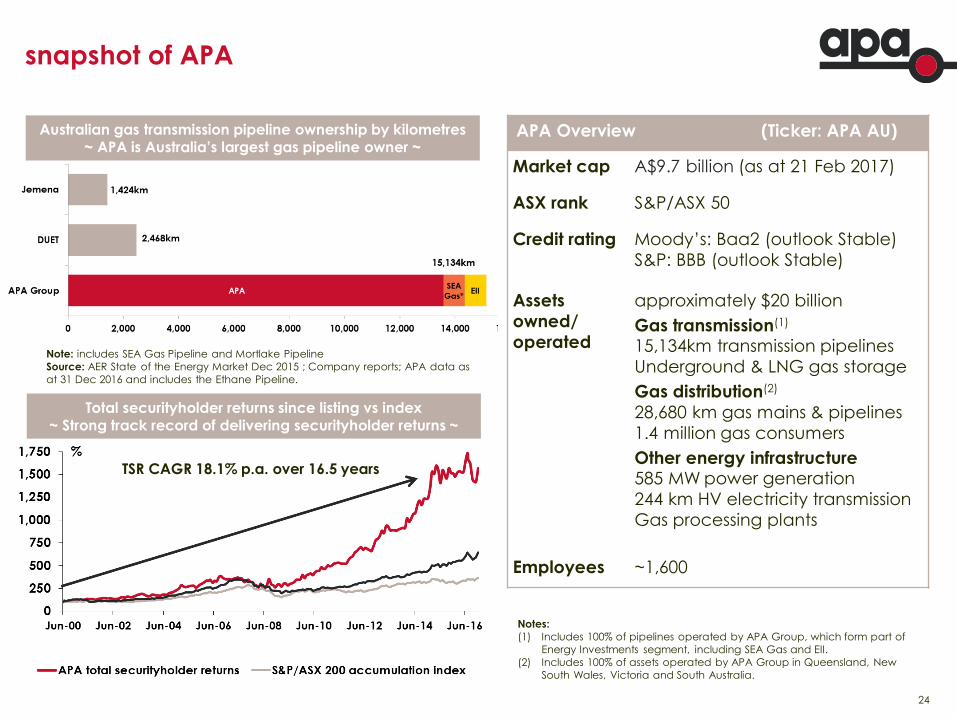
snapshot of APA
Note: includes SEA Gas Pipeline and Mortlake Pipeline
Source: AER State of the Energy Market Dec 2015 ; Company reports; APA data as
at 31 Dec 2016 and includes the Ethane Pipeline.
APA Overview (Ticker: APA AU)
Market cap A$9.7 billion (as at 21 Feb 2017)
ASX rank S&P/ASX 50
Credit rating Moody’s: Baa2 (outlook Stable)
S&P: BBB (outlook Stable)
Assets
owned/
operated
approximately $20 billion
Gas transmission(1) 15,134km transmission pipelines
Underground & LNG gas storage
Gas distribution(2)
28,680 km gas mains & pipelines
1.4 million gas consumers
Other energy infrastructure 585 MW power generation
244 km HV electricity transmission
Gas processing plants
Employees ~1,600
Australian gas transmission pipeline ownership by kilometres ~ APA is Australia’s largest gas pipeline owner ~
Total securityholder returns since listing vs index ~ Strong track record of delivering securityholder returns ~
Source: IRESS
Notes:
(1) Includes 100% of pipelines operated by APA Group, which form part of
Energy Investments segment, including SEA Gas and EII.
(2) Includes 100% of assets operated by APA Group in Queensland, New
South Wales, Victoria and South Australia.
TSR CAGR 18.1% p.a. over 16.5 years
25
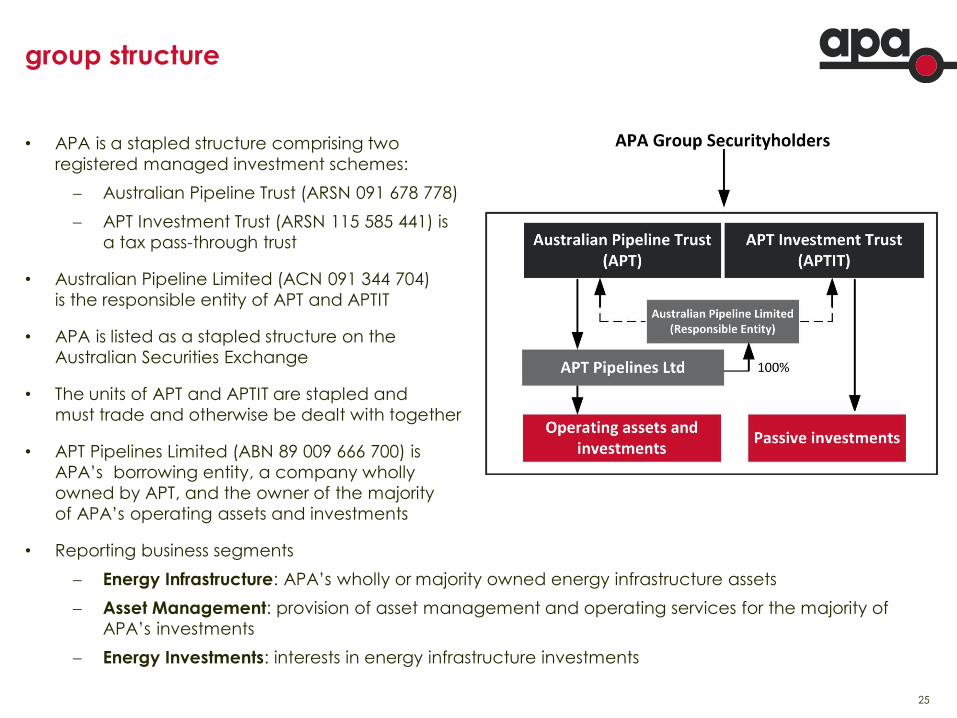
group structure
• APA is a stapled structure comprising two
registered managed investment schemes:
Australian Pipeline Trust (ARSN 091 678 778)
APT Investment Trust (ARSN 115 585 441) is
a tax pass-through trust
• Australian Pipeline Limited (ACN 091 344 704)
is the responsible entity of APT and APTIT
• APA is listed as a stapled structure on the
Australian Securities Exchange
• The units of APT and APTIT are stapled and
must trade and otherwise be dealt with together
• APT Pipelines Limited (ABN 89 009 666 700) is
APA’s borrowing entity, a company wholly
owned by APT, and the owner of the majority
of APA’s operating assets and investments
• Reporting business segments
Energy Infrastructure: APA’s wholly or majority owned energy infrastructure assets
Asset Management: provision of asset management and operating services for the majority of
APA’s investments
Energy Investments: interests in energy infrastructure investments
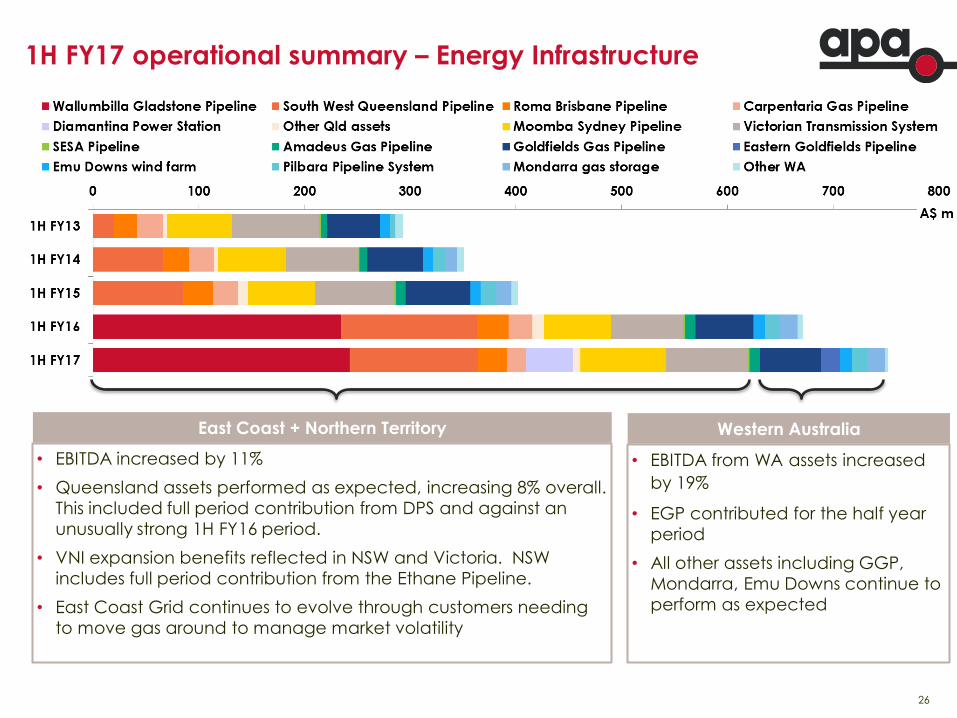
26
• EBITDA increased by 11%
• Queensland assets performed as expected, increasing 8% overall.
This included full period contribution from DPS and against an
unusually strong 1H FY16 period.
• VNI expansion benefits reflected in NSW and Victoria. NSW
includes full period contribution from the Ethane Pipeline.
• East Coast Grid continues to evolve through customers needing
to move gas around to manage market volatility
1H FY17 operational summary – Energy Infrastructure
• EBITDA from WA assets increased
by 19%
• EGP contributed for the half year
period
• All other assets including GGP,
Mondarra, Emu Downs continue to
perform as expected
East Coast + Northern Territory Western Australia
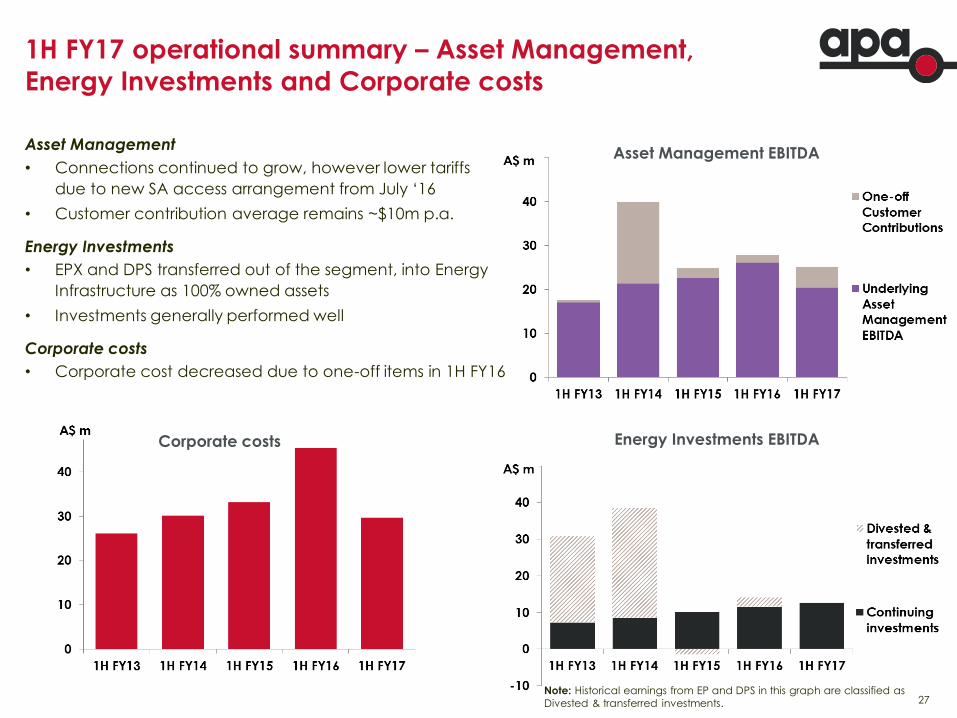
27
Asset Management
• Connections continued to grow, however lower tariffs
due to new SA access arrangement from July ‘16
• Customer contribution average remains ~$10m p.a.
Energy Investments
• EPX and DPS transferred out of the segment, into Energy
Infrastructure as 100% owned assets
• Investments generally performed well
Corporate costs
• Corporate cost decreased due to one-off items in 1H FY16
1H FY17 operational summary – Asset Management,
Energy Investments and Corporate costs
Energy Investments EBITDA Corporate costs
Note: Historical earnings from EP and DPS in this graph are classified as
Divested & transferred investments.
Asset Management EBITDA
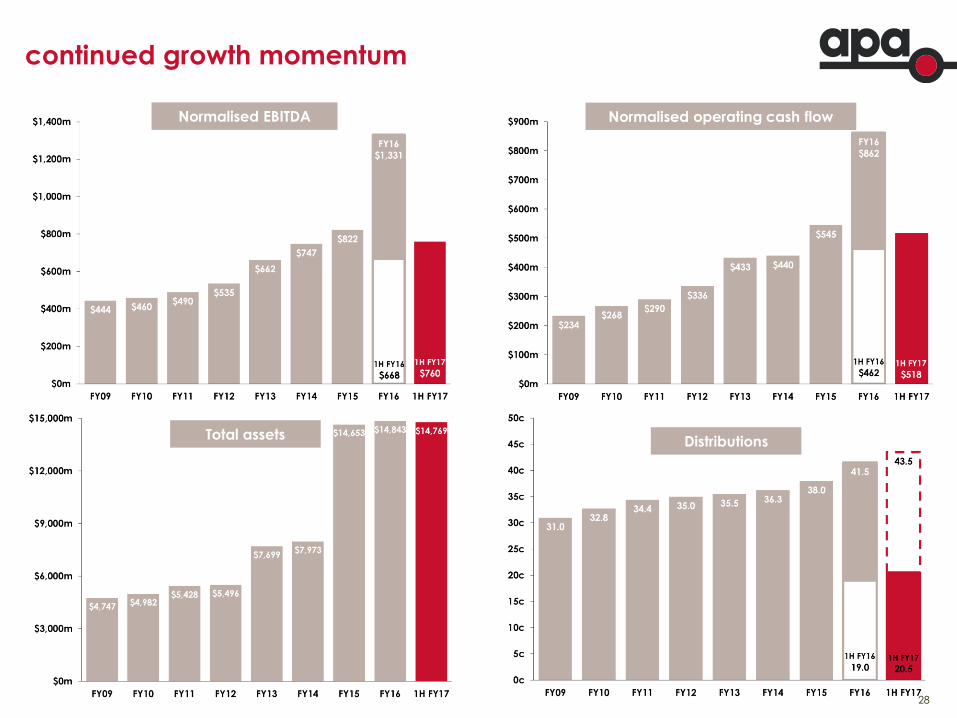
28
continued growth momentum
Normalised EBITDA Normalised operating cash flow
Total assets Distributions
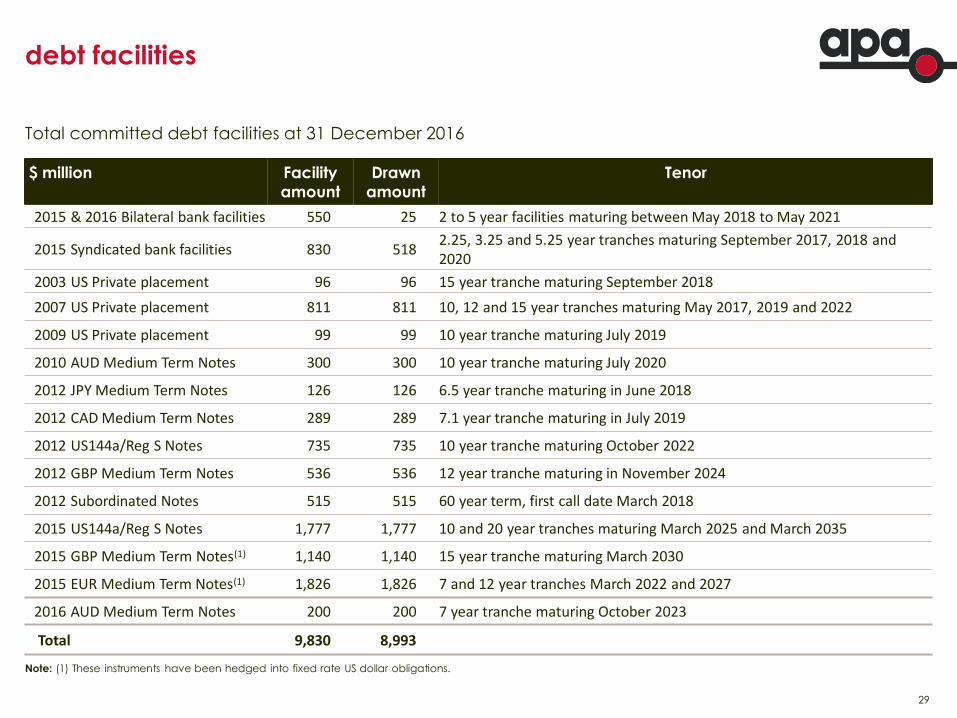
29
debt facilities
$ million Facility
amount
Drawn
amount
Tenor
2015 & 2016 Bilateral bank facilities 550 25 2 to 5 year facilities maturing between May 2018 to May 2021
2015 Syndicated bank facilities 830 518 2.25, 3.25 and 5.25 year tranches maturing September 2017, 2018 and 2020
2003 US Private placement 96 96 15 year tranche maturing September 2018
2007 US Private placement 811 811 10, 12 and 15 year tranches maturing May 2017, 2019 and 2022
2009 US Private placement 99 99 10 year tranche maturing July 2019
2010 AUD Medium Term Notes 300 300 10 year tranche maturing July 2020
2012 JPY Medium Term Notes 126 126 6.5 year tranche maturing in June 2018
2012 CAD Medium Term Notes 289 289 7.1 year tranche maturing in July 2019
2012 US144a/Reg S Notes 735 735 10 year tranche maturing October 2022
2012 GBP Medium Term Notes 536 536 12 year tranche maturing in November 2024
2012 Subordinated Notes 515 515 60 year term, first call date March 2018
2015 US144a/Reg S Notes 1,777 1,777 10 and 20 year tranches maturing March 2025 and March 2035
2015 GBP Medium Term Notes(1) 1,140 1,140 15 year tranche maturing March 2030
2015 EUR Medium Term Notes(1) 1,826 1,826 7 and 12 year tranches March 2022 and 2027
2016 AUD Medium Term Notes 200 200 7 year tranche maturing October 2023
Total 9,830 8,993
Total committed debt facilities at 31 December 2016
Note: (1) These instruments have been hedged into fixed rate US dollar obligations.

30
regulatory update
• Approximately 10% of APA’s Energy Infrastructure revenues in 1H FY17 was regulated revenue
• APA’s major regulatory resets over the next few years are as follows:
• Roma Brisbane Pipeline access arrangement review
APA lodged a proposed access arrangement for the July 2017 to June 2022 period in September
2016
APA’s proposal reflects that this pipeline is now bi-directional
A draft decision by the Australian Energy Regulator (“AER”) is expected in April 2017, with a final
decision to follow in the second half of 2017
• Victorian Transmission System access arrangement review
APA lodged a proposed access arrangement for the January 2018 to December 2022 period in
January 2017
APA’s proposal reflects the expansion of system capacity that APA is undertaking, enabling gas to
flow from Victoria to New South Wales
A draft decision by the AER is expected at the end of June 2017
31
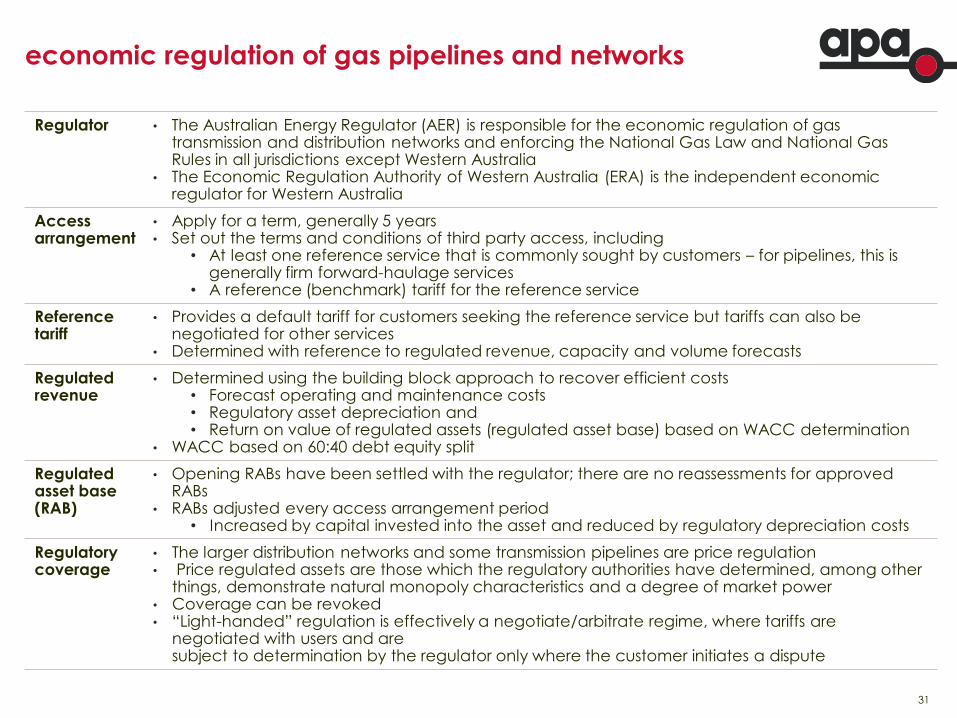
economic regulation of gas pipelines and networks
Regulator • The Australian Energy Regulator (AER) is responsible for the economic regulation of gas transmission and distribution networks and enforcing the National Gas Law and National Gas Rules in all jurisdictions except Western Australia
• The Economic Regulation Authority of Western Australia (ERA) is the independent economic regulator for Western Australia
Access arrangement
• Apply for a term, generally 5 years • Set out the terms and conditions of third party access, including
• At least one reference service that is commonly sought by customers – for pipelines, this is generally firm forward-haulage services
• A reference (benchmark) tariff for the reference service
Reference tariff
• Provides a default tariff for customers seeking the reference service but tariffs can also be negotiated for other services
• Determined with reference to regulated revenue, capacity and volume forecasts
Regulated revenue
• Determined using the building block approach to recover efficient costs • Forecast operating and maintenance costs • Regulatory asset depreciation and • Return on value of regulated assets (regulated asset base) based on WACC determination
• WACC based on 60:40 debt equity split
Regulated asset base (RAB)
• Opening RABs have been settled with the regulator; there are no reassessments for approved RABs
• RABs adjusted every access arrangement period • Increased by capital invested into the asset and reduced by regulatory depreciation costs
Regulatory coverage
• The larger distribution networks and some transmission pipelines are price regulation • Price regulated assets are those which the regulatory authorities have determined, among other
things, demonstrate natural monopoly characteristics and a degree of market power • Coverage can be revoked • “Light-handed” regulation is effectively a negotiate/arbitrate regime, where tariffs are
negotiated with users and are subject to determination by the regulator only where the customer initiates a dispute

32
For further information contact:
Yoko Kosugi
Head of Investor Relations
Tel: +61 2 9693 0049
E-mail: [email protected]
Or visit the APA website at:
www.apa.com.au