2q 2009 results presentation - listed companylmir.listedcompany.com/misc/slides_2q09.pdf · 2q 2009...
TRANSCRIPT
August 2009
Singapore’s First Indonesia Retail REIT
2Q 2009 Results Presentation

Disclaimer
2
Certain statements in this presentation concerning our future growth prospects are forward‐lookingstatements, which involve a number of risks and uncertainties that could cause actual results to differmaterially from those in such forward‐looking statements. These forward‐looking statements include,without limitation, statements relating to our profit forecast for our financial year ending 31 December2009, and reflect our current views with respect to future events and financial performance and are subjectto certain risks and uncertainties, which could cause actual results to differ materially from historical resultsor those anticipated. The risks and uncertainties relating to these statements include, but are not limited to,risks and uncertainties regarding fluctuations in earnings, our ability to manage growth, intense competitionin the Indonesian retail industry including those factors which may affect our ability to attract and retainsuitable tenants, our ability to manage our operations, reduced demand for retail spaces, our ability tosuccessfully complete and integrate potential acquisitions, liability for damages on our property portfolios,the success of the retail malls and retail spaces we currently own, withdrawal of tax incentives, politicalinstability, and legal restrictions on raising capital or acquiring real property in Indonesia. In addition to theforegoing factors, a description of certain other risks and uncertainties which could cause actual results todiffer materially can be found in the section captioned "Risk Factors" in our preliminary prospectus lodgedwith the Monetary Authority of Singapore on 19 October 2007. Although we believe the expectationsreflected in such forward‐looking statements are based upon reasonable assumptions, we can give noassurance that our expectations will be attained. You are cautioned not to place undue reliance on theseforward‐looking statements, which are based on the current view of management on future events. Weundertake no obligation to publicly update or revise any forward looking statements, whether as a result ofnew information, future events or otherwise.
3
Contents
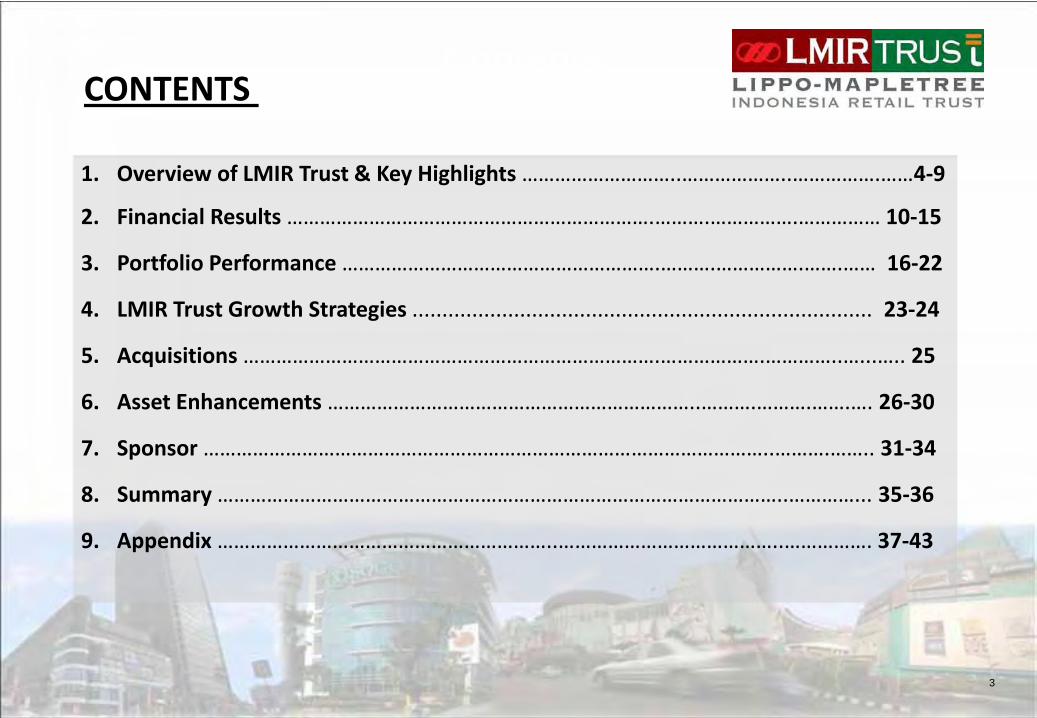
1. Overview of LMIR Trust & Key Highlights ………………………..………………..…………….……4‐9
2. Financial Results ………………………………………………………….……….…………….…………… 10‐15
3. Portfolio Performance ………………………………………………….……….…………….…….…… 16‐22
4. LMIR Trust Growth Strategies ............................................................................. 23‐24
5. Acquisitions ………………………………………………………………….……………….…………..…...….. 25
6. Asset Enhancements …………………………………………………………..……….……….…….…. 26‐30
7. Sponsor …………………………………………………………………………………………..……….…….. 31‐34
8. Summary …………………………………………………………………………………………..…………... 35‐36
9. Appendix ……………………………………………………..…………………………………..……………. 37‐43
CONTENTS
Overview of LMIR Trust
4
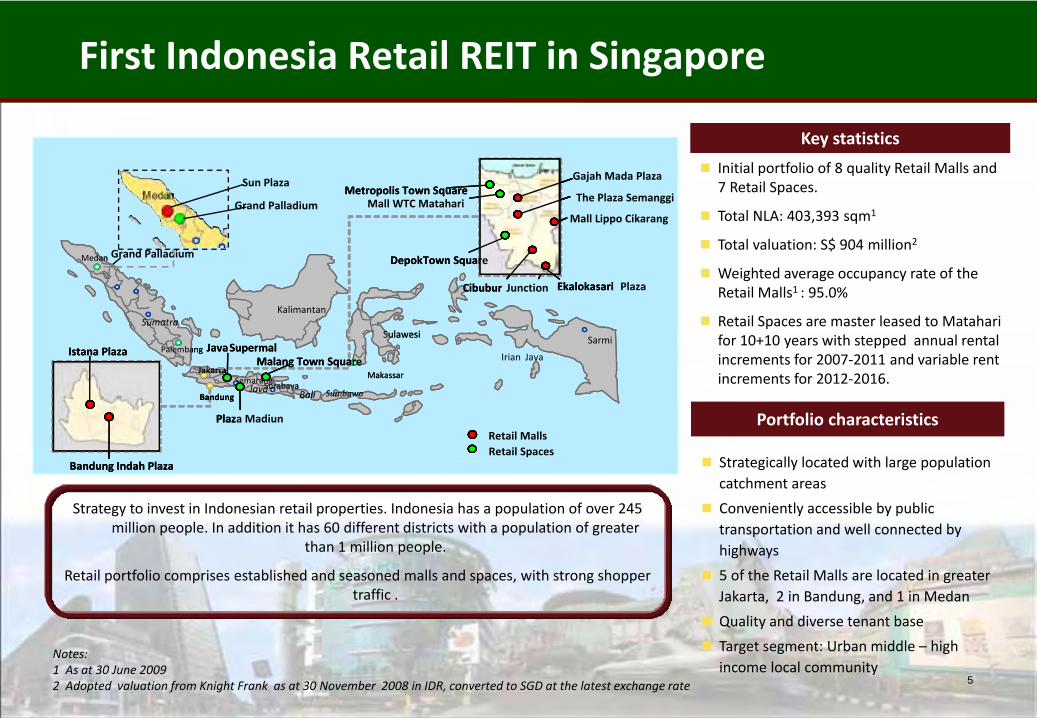
First Indonesia Retail REIT in Singapore
5
Key statistics
Initial portfolio of 8 quality Retail Malls and 7 Retail Spaces.
Total NLA: 403,393 sqm1
Total valuation: S$ 904 million2
Weighted average occupancy rate of the Retail Malls1 : 95.0%
Retail Spaces are master leased to Matahari for 10+10 years with stepped annual rental increments for 2007‐2011 and variable rent increments for 2012‐2016.
Strategically located with large population catchment areas
Conveniently accessible by public transportation and well connected by highways
5 of the Retail Malls are located in greater Jakarta, 2 in Bandung, and 1 in Medan
Quality and diverse tenant base
Target segment: Urban middle – high income local community
Portfolio characteristics
Strategy to invest in Indonesian retail properties. Indonesia has a population of over 245 million people. In addition it has 60 different districts with a population of greater
than 1 million people.
Retail portfolio comprises established and seasoned malls and spaces, with strong shopper traffic .
Notes:1 As at 30 June 20092 Adopted valuation from Knight Frank as at 30 November 2008 in IDR, converted to SGD at the latest exchange rate
Medan
Palembang
SemarangSurabaya
BaliJava
Sumatra
Sumbawa
Makassar
Sarmi
Jakarta
Bandung
Istana Plaza
Bandung Indah Plaza
Cibubur Junction Ekalokasari Plaza
Mall Lippo Cikarang
The Plaza Semanggi
Gajah Mada Plaza Metropolis Town Square
DepokTown Square
Plaza Madiun
Grand Palladium
Malang Town SquareJava Supermal
Retail MallsRetail Spaces
Sulawesi
Kalimantan
Irian Jaya
Medan
Palembang
SemarangSurabaya
BaliJava
Sumatra
Sumbawa
Makassar
Sarmi
Jakarta
Bandung
Istana Plaza
Bandung Indah Plaza
Cibubur Ekalokasari
Metropolis Town SquareMall WTC Matahari
DepokTown Square
Plaz
Malang Town SquareJava Supermal
Retail MallsRetail Spaces
Sulawesi
Kalimantan
Sun Plaza
Grand Palladium
6
Key Highlights
6
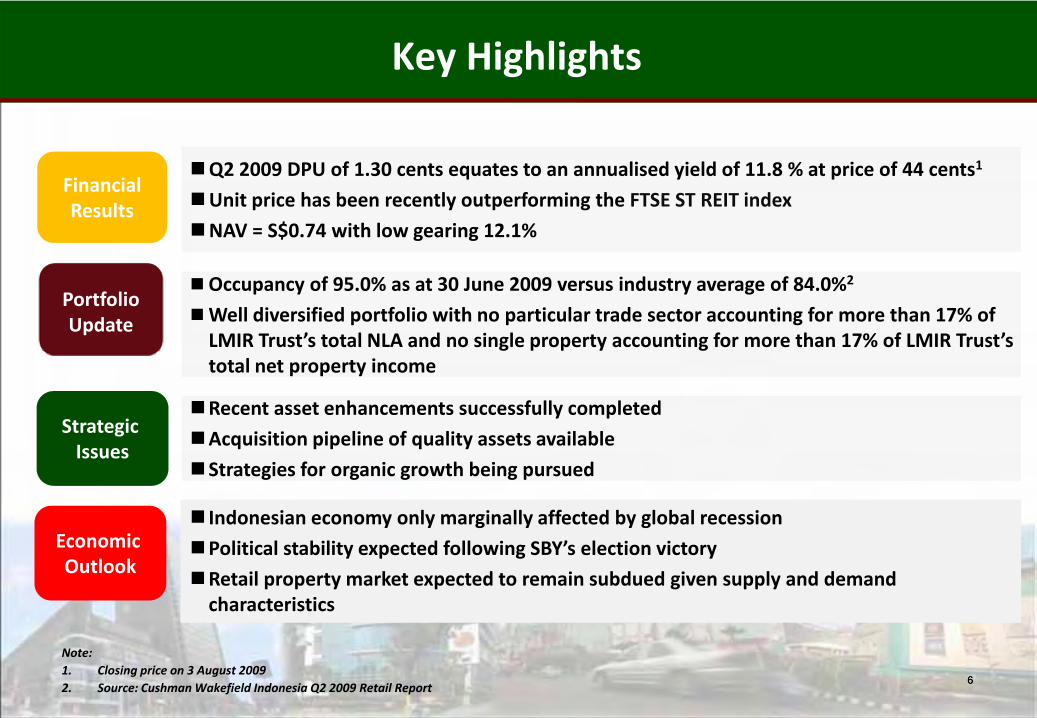
Recent asset enhancements successfully completed
Acquisition pipeline of quality assets available
Strategies for organic growth being pursued
Occupancy of 95.0% as at 30 June 2009 versus industry average of 84.0%2
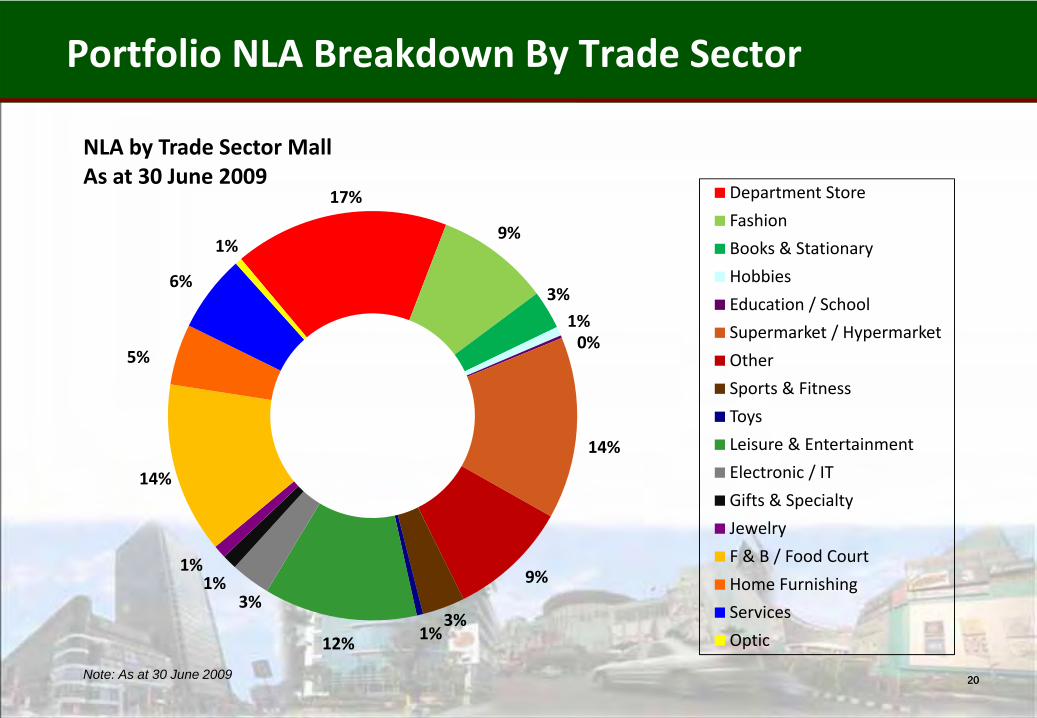
Well diversified portfolio with no particular trade sector accounting for more than 17% of LMIR Trust’s total NLA and no single property accounting for more than 17% of LMIR Trust’s total net property income
Financial Results
Portfolio Update
Strategic Issues
Q2 2009 DPU of 1.30 cents equates to an annualised yield of 11.8 % at price of 44 cents1
Unit price has been recently outperforming the FTSE ST REIT index
NAV = S$0.74 with low gearing 12.1%
Note:1. Closing price on 3 August 20092. Source: Cushman Wakefield Indonesia Q2 2009 Retail Report
Economic Outlook
Indonesian economy only marginally affected by global recession
Political stability expected following SBY’s election victory
Retail property market expected to remain subdued given supply and demand characteristics
Indonesia GDP compared to others
‐15
‐10
‐5
0
5
10
Q109 Q209 Q309 Q409 Q110 Q210 2008 2009 2010
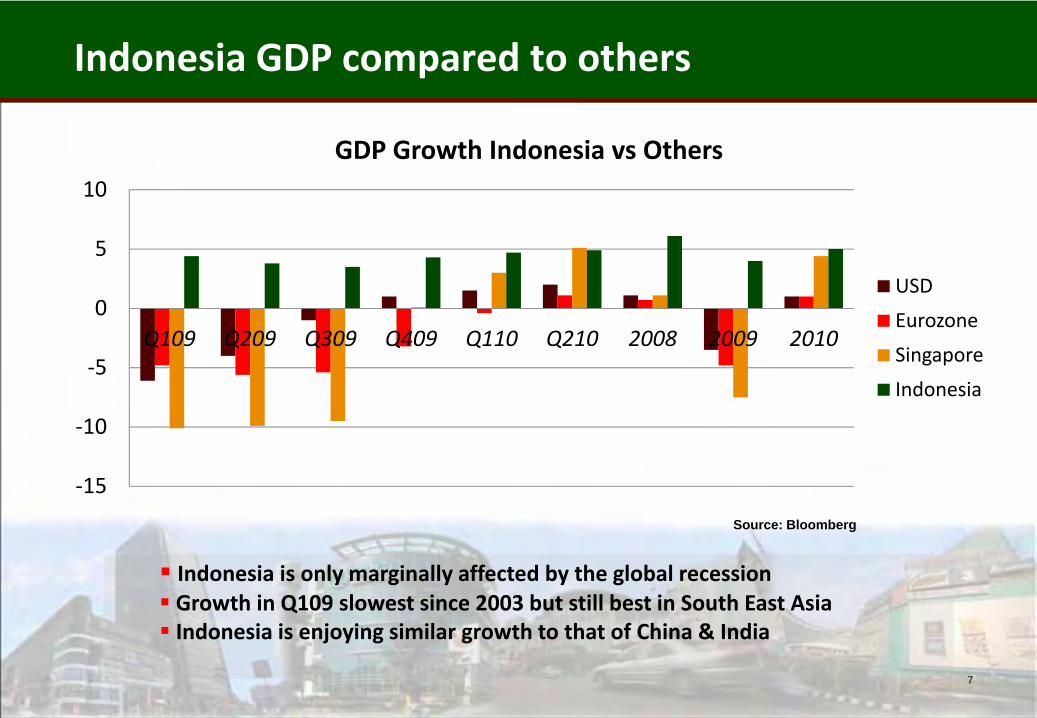
GDP Growth Indonesia vs Others
USD
Eurozone
Singapore
Indonesia
7
Indonesia is only marginally affected by the global recessionGrowth in Q109 slowest since 2003 but still best in South East AsiaIndonesia is enjoying similar growth to that of China & India
Source: Bloomberg
8
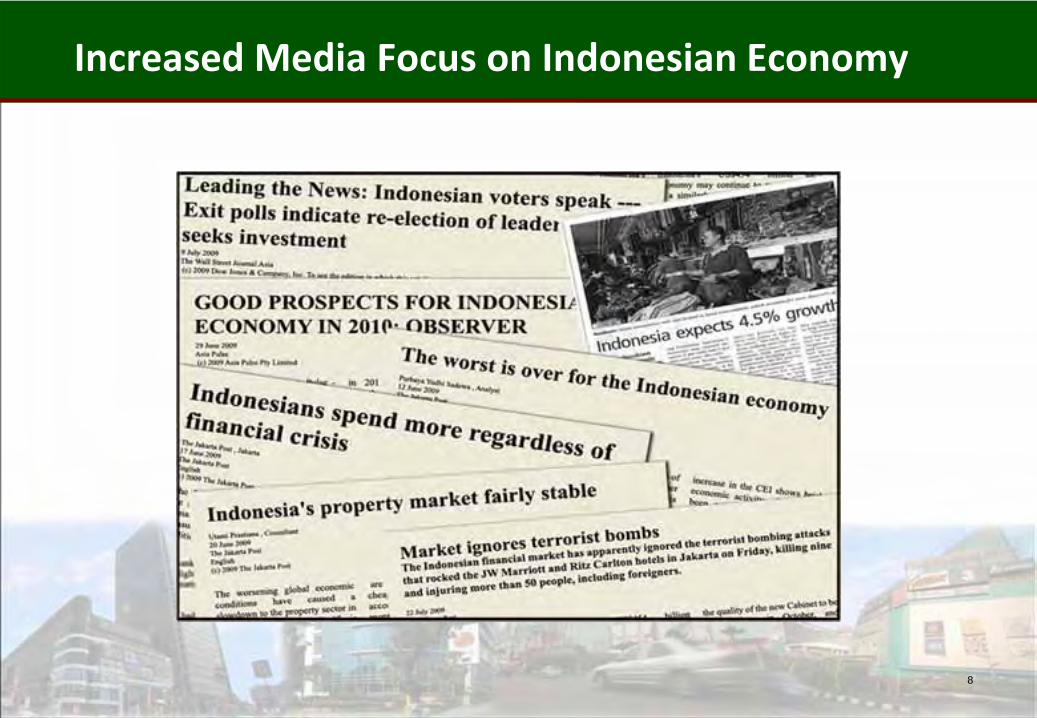
Increased Media Focus on Indonesian Economy
Other Positive Signs in the Indonesian Economy
9
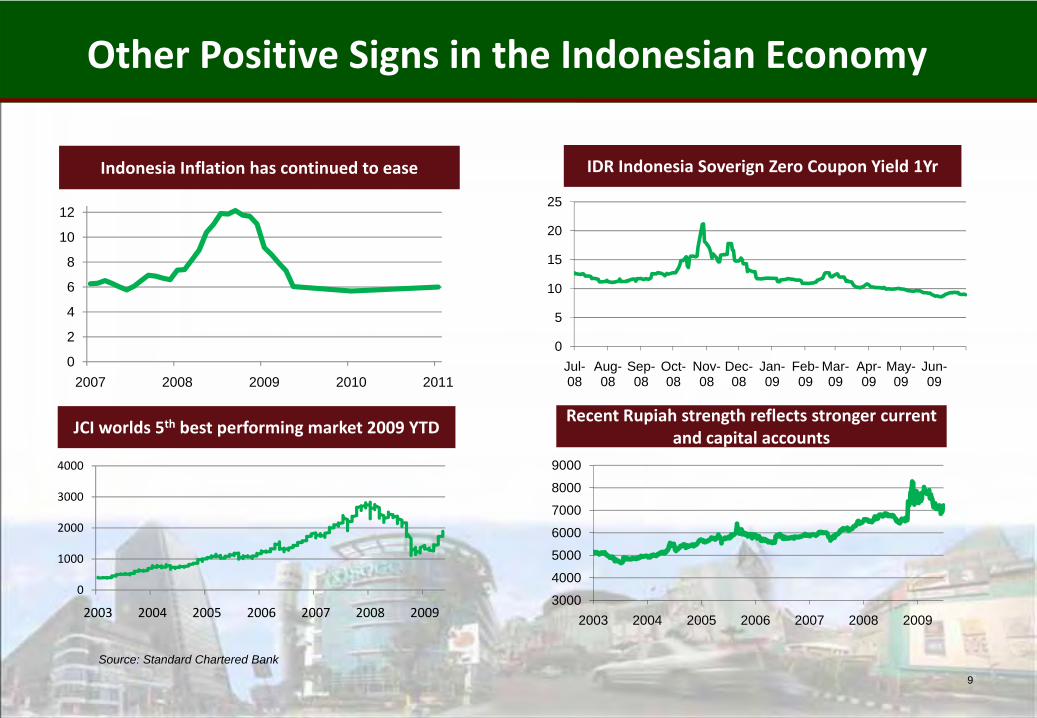
Indonesia Inflation has continued to ease
Source: Standard Chartered Bank
Recent Rupiah strength reflects stronger current and capital accounts JCI worlds 5th best performing market 2009 YTD
0
2
4
6
8
10
12
2007 2008 2009 2010 2011
0
1000
2000
3000
4000
2003 2004 2005 2006 2007 2008 20093000
4000
5000
6000
7000
8000
9000
2003 2004 2005 2006 2007 2008 2009
0
5
10
15
20
25
Jul-08
Aug-08
Sep-08
Oct-08
Nov-08
Dec-08
Jan-09
Feb-09
Mar-09
Apr-09
May-09
Jun-09
IDR Indonesia Soverign Zero Coupon Yield 1Yr

Financial Results
10
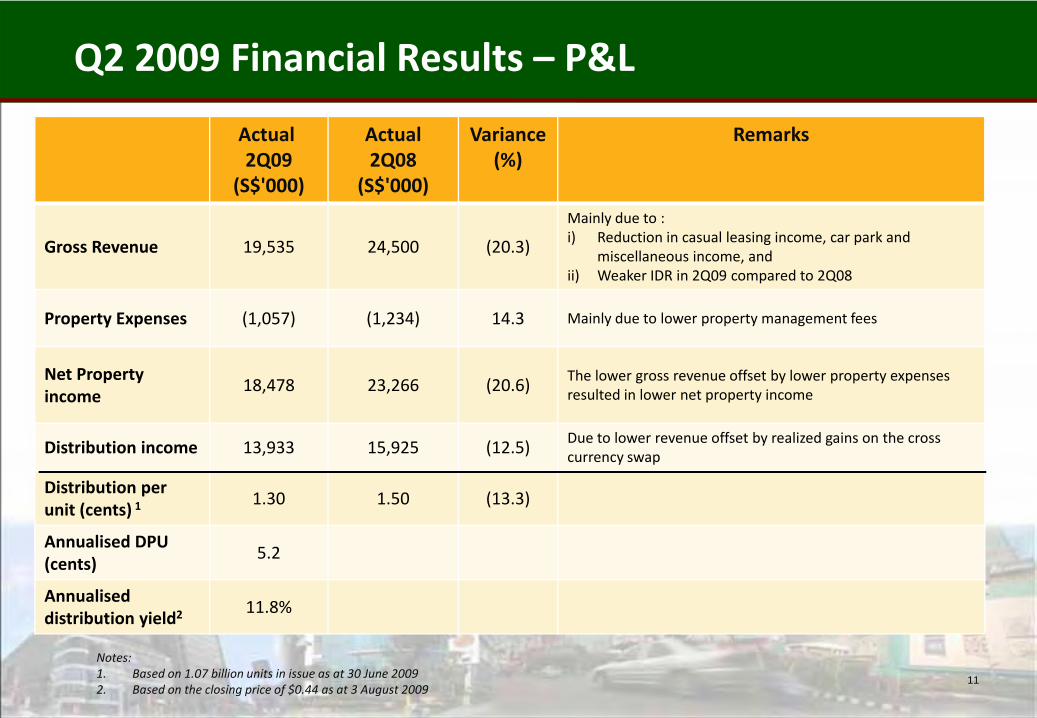
Q2 2009 Financial Results – P&L
11
Actual2Q09
(S$'000)
Actual2Q08
(S$'000)
Variance(%)
Remarks
Gross Revenue 19,535 24,500 (20.3)
Mainly due to :i) Reduction in casual leasing income, car park and
miscellaneous income, and ii) Weaker IDR in 2Q09 compared to 2Q08
Property Expenses (1,057) (1,234) 14.3 Mainly due to lower property management fees
Net Property income
18,478 23,266 (20.6) The lower gross revenue offset by lower property expenses resulted in lower net property income
Distribution income 13,933 15,925 (12.5) Due to lower revenue offset by realized gains on the cross currency swap
Distribution per unit (cents) 1
1.30 1.50 (13.3)
Annualised DPU(cents)
5.2
Annualiseddistribution yield2
11.8%
Notes:1. Based on 1.07 billion units in issue as at 30 June 2009 2. Based on the closing price of $0.44 as at 3 August 2009
12
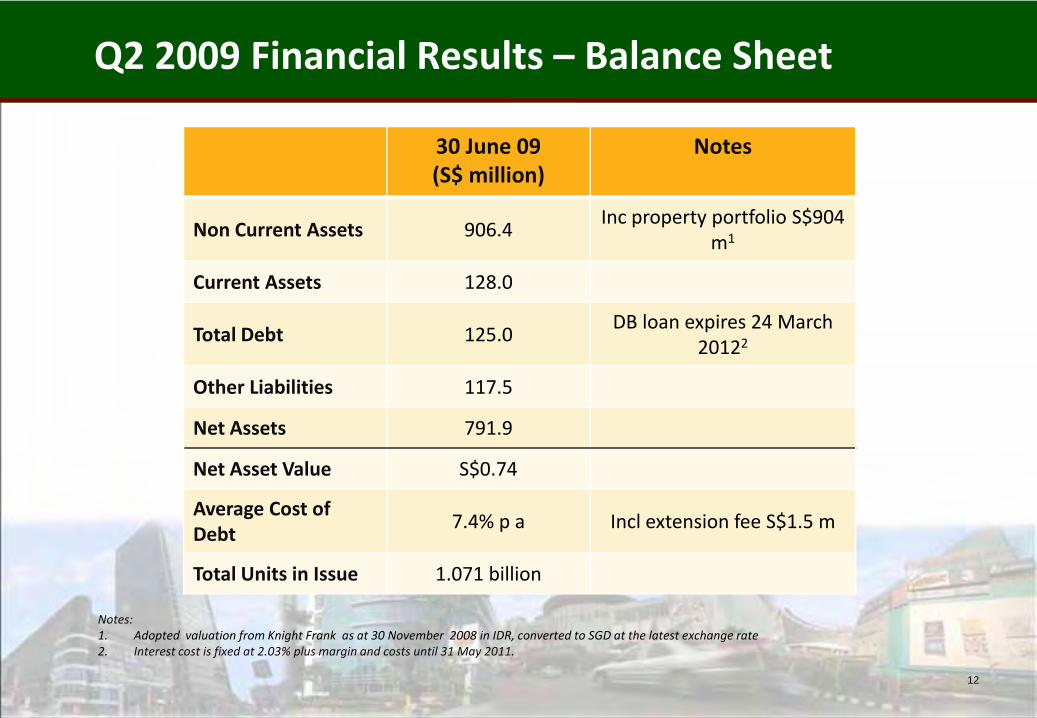
30 June 09(S$ million)
Notes
Non Current Assets 906.4Inc property portfolio S$904
m1
Current Assets 128.0
Total Debt 125.0DB loan expires 24 March
20122
Other Liabilities 117.5
Net Assets 791.9
Net Asset Value S$0.74
Average Cost of Debt
7.4% p a Incl extension fee S$1.5 m
Total Units in Issue 1.071 billion
Q2 2009 Financial Results – Balance Sheet
Notes:1. Adopted valuation from Knight Frank as at 30 November 2008 in IDR, converted to SGD at the latest exchange rate 2. Interest cost is fixed at 2.03% plus margin and costs until 31 May 2011.
13
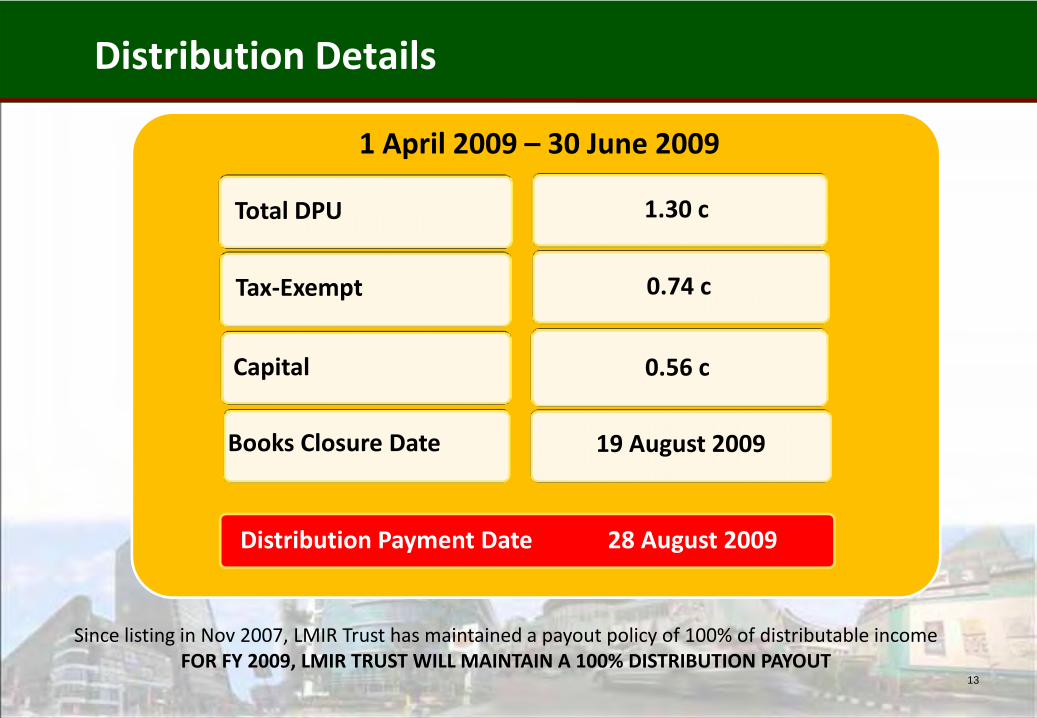
Distribution Details
Total DPU
Tax‐Exempt
Capital
Books Closure Date
1.30 c
0.74 c
0.56 c
19 August 2009
Since listing in Nov 2007, LMIR Trust has maintained a payout policy of 100% of distributable incomeFOR FY 2009, LMIR TRUST WILL MAINTAIN A 100% DISTRIBUTION PAYOUT
Distribution Payment Date 28 August 2009
1 April 2009 – 30 June 2009
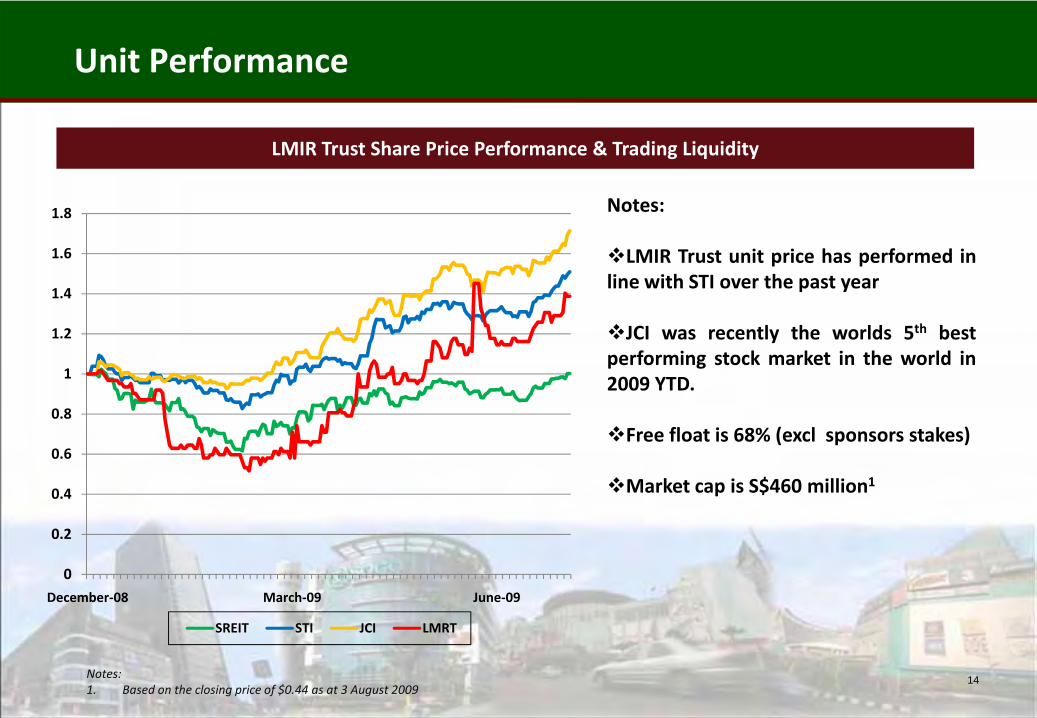
Unit Performance
14
LMIR Trust Share Price Performance & Trading Liquidity
Notes:
LMIR Trust unit price has performed inline with STI over the past year
JCI was recently the worlds 5th bestperforming stock market in the world in2009 YTD.
Free float is 68% (excl sponsors stakes)
Market cap is S$460 million1
0
0.2
0.4
0.6
0.8
1
1.2
1.4
1.6
1.8
December‐08 March‐09 June‐09
SREIT STI JCI LMRT
Notes:1. Based on the closing price of $0.44 as at 3 August 2009
0.%
2.%
4.%
6.%
8.%
10.%
12.%
14.%
LMIR Trust annualised yield (2Q09)
FTSE ST REIT Index Yield
10 Year S'pore Govt Bond
CPF Ordinary Account
5 Year S'pore Govt Bond
Average SGD 12‐mth Fixed Deposit Rate
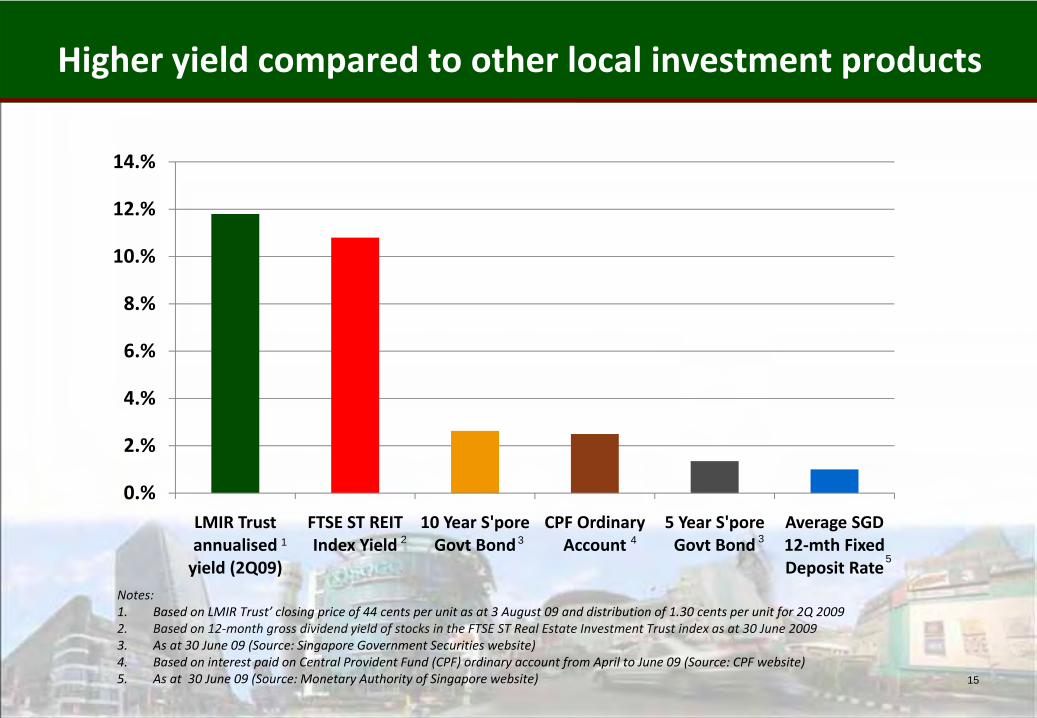
Higher yield compared to other local investment products
15
Notes:1. Based on LMIR Trust’ closing price of 44 cents per unit as at 3 August 09 and distribution of 1.30 cents per unit for 2Q 20092. Based on 12‐month gross dividend yield of stocks in the FTSE ST Real Estate Investment Trust index as at 30 June 20093. As at 30 June 09 (Source: Singapore Government Securities website)4. Based on interest paid on Central Provident Fund (CPF) ordinary account from April to June 09 (Source: CPF website)5. As at 30 June 09 (Source: Monetary Authority of Singapore website)
1 2 3 4 3
5
Portfolio Performance
16
17
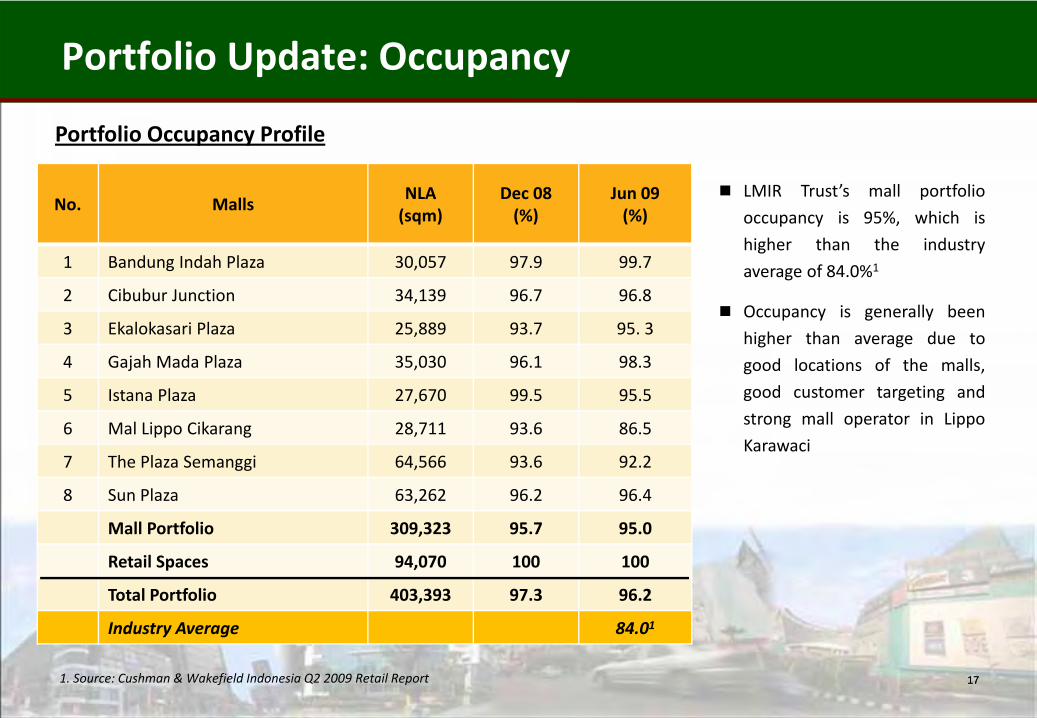
Portfolio Update: Occupancy
17
Portfolio Occupancy Profile
LMIR Trust’s mall portfolio
occupancy is 95%, which is
higher than the industry
average of 84.0%1
Occupancy is generally been
higher than average due to
good locations of the malls,
good customer targeting and
strong mall operator in Lippo
Karawaci
1. Source: Cushman & Wakefield Indonesia Q2 2009 Retail Report
No. MallsNLA (sqm)
Dec 08 (%)
Jun 09 (%)
1 Bandung Indah Plaza 30,057 97.9 99.7
2 Cibubur Junction 34,139 96.7 96.8
3 Ekalokasari Plaza 25,889 93.7 95. 3
4 Gajah Mada Plaza 35,030 96.1 98.3
5 Istana Plaza 27,670 99.5 95.5
6 Mal Lippo Cikarang 28,711 93.6 86.5
7 The Plaza Semanggi 64,566 93.6 92.2
8 Sun Plaza 63,262 96.2 96.4
Mall Portfolio 309,323 95.7 95.0
Retail Spaces 94,070 100 100
Total Portfolio 403,393 97.3 96.2
Industry Average 84.01
18
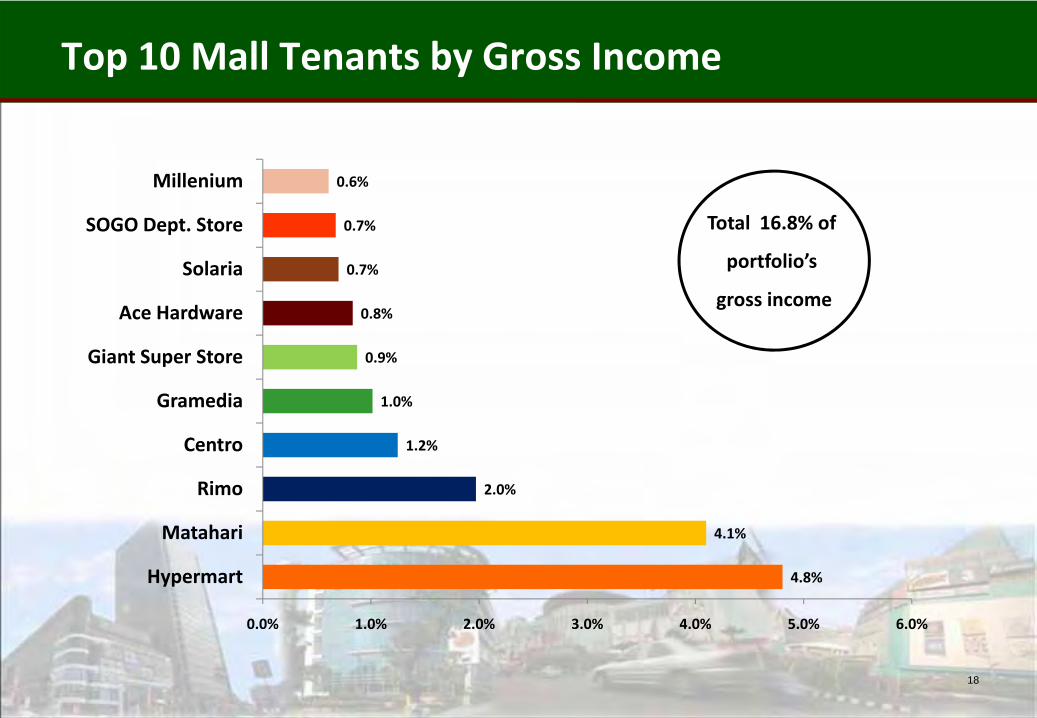
Top 10 Mall Tenants by Gross Income
4.8%
4.1%
2.0%
1.2%
1.0%
0.9%
0.8%
0.7%
0.7%
0.6%
0.0% 1.0% 2.0% 3.0% 4.0% 5.0% 6.0%
Hypermart
Matahari
Rimo
Centro
Gramedia
Giant Super Store
Ace Hardware
Solaria
SOGO Dept. Store
Millenium
Total 16.8% of
portfolio’s
gross income
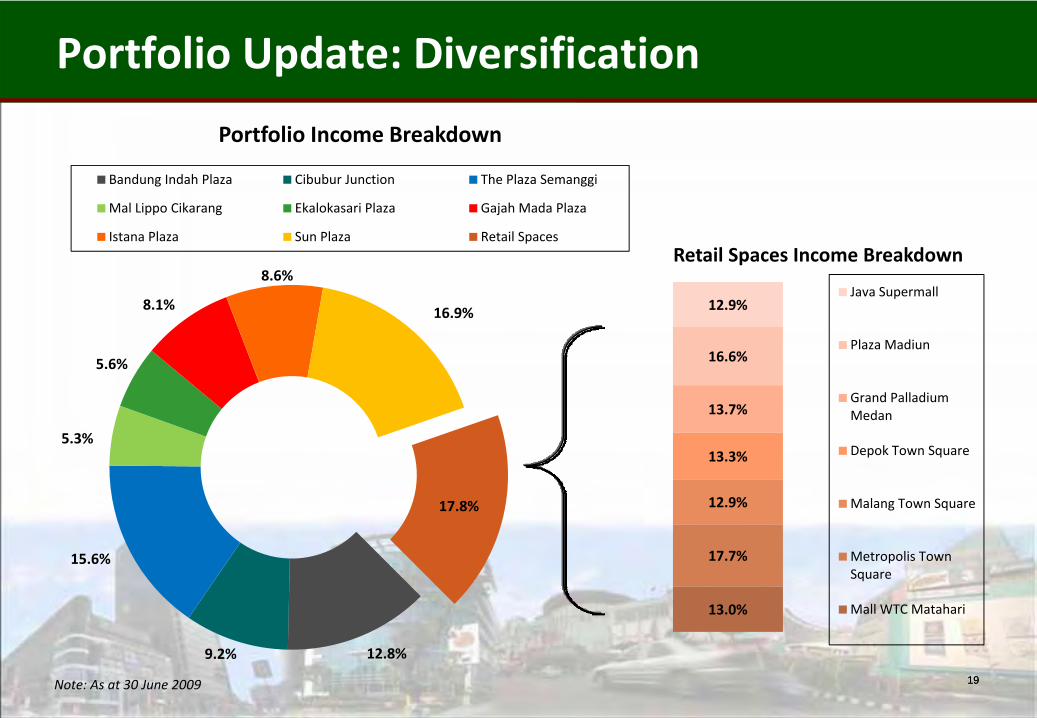
12.8%9.2%
15.6%
5.3%
5.6%
8.1%
8.6%
16.9%
17.8%
Bandung Indah Plaza Cibubur Junction The Plaza Semanggi
Mal Lippo Cikarang Ekalokasari Plaza Gajah Mada Plaza
Istana Plaza Sun Plaza Retail Spaces
Portfolio Income Breakdown
13.0%
17.7%
12.9%
13.3%
13.7%
16.6%
12.9%
Retail Spaces Income Breakdown
Java Supermall
Plaza Madiun
Grand Palladium Medan
Depok Town Square
Malang Town Square
Metropolis Town Square
Mall WTC Matahari
19
Portfolio Update: Diversification
19Note: As at 30 June 2009
20
Portfolio NLA Breakdown By Trade Sector
20Note: As at 30 June 2009
17%
9%
3%
1%0%
14%
9%
3%1%12%
3%1%
1%
14%
5%
6%
1%
NLA by Trade Sector MallAs at 30 June 2009
Department Store
Fashion
Books & Stationary
Hobbies
Education / School
Supermarket / Hypermarket
Other
Sports & Fitness
Toys
Leisure & Entertainment
Electronic / IT
Gifts & Specialty
Jewelry
F & B / Food Court
Home Furnishing
Services
Optic
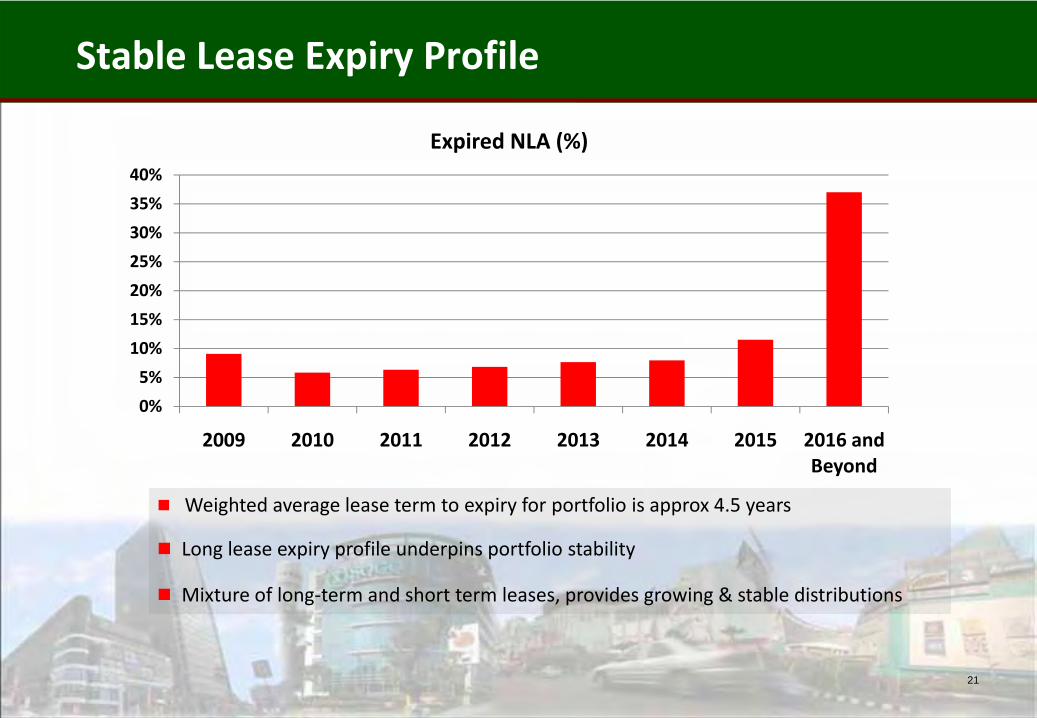
Stable Lease Expiry Profile
21
Weighted average lease term to expiry for portfolio is approx 4.5 years
Long lease expiry profile underpins portfolio stability
Mixture of long‐term and short term leases, provides growing & stable distributions
0%
5%
10%
15%
20%
25%
30%
35%
40%
2009 2010 2011 2012 2013 2014 2015 2016 and Beyond
Expired NLA (%)
22
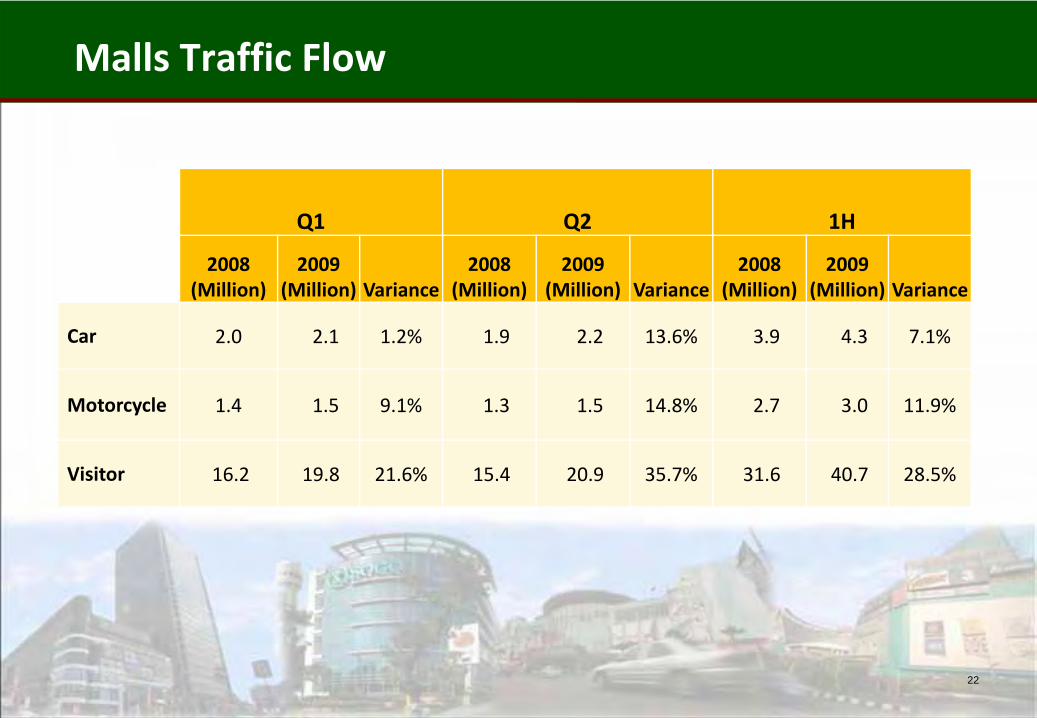
Q1 Q2 1H
2008(Million)
2009(Million) Variance
2008(Million)
2009(Million) Variance
2008(Million)
2009(Million) Variance
Car 2.0 2.1 1.2% 1.9 2.2 13.6% 3.9 4.3 7.1%
Motorcycle 1.4 1.5 9.1% 1.3 1.5 14.8% 2.7 3.0 11.9%
Visitor 16.2 19.8 21.6% 15.4 20.9 35.7% 31.6 40.7 28.5%
Malls Traffic Flow

LMIR Trust Growth Strategies
23
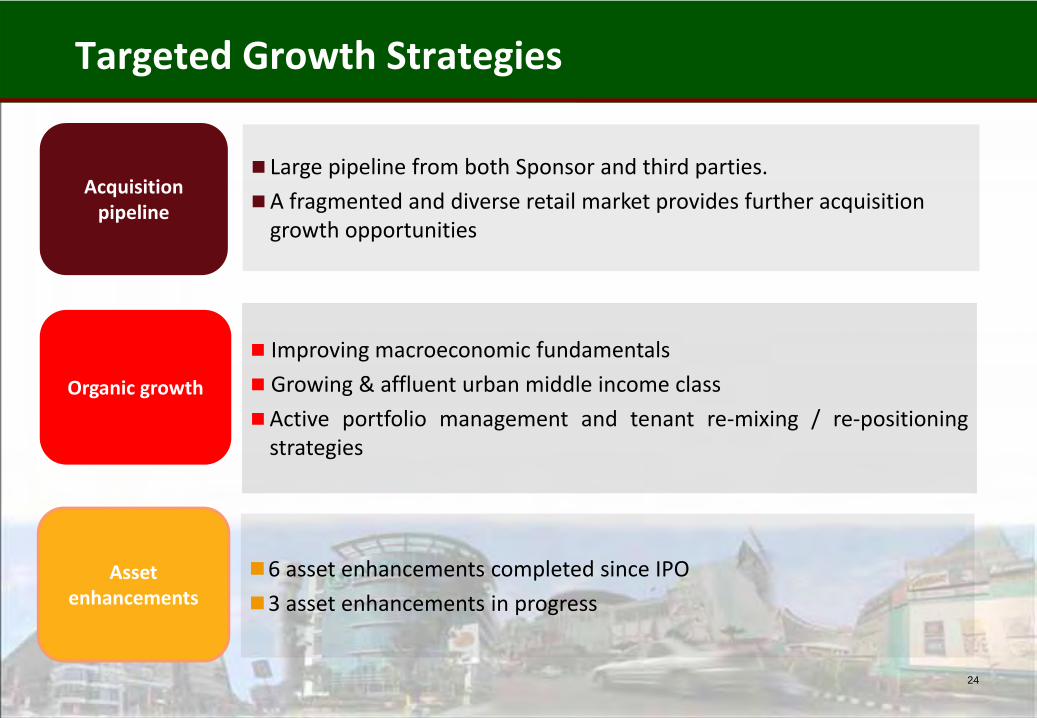
Improving macroeconomic fundamentals
Growing & affluent urban middle income class
Active portfolio management and tenant re‐mixing / re‐positioningstrategies
Organic growth
Targeted Growth Strategies
24
6 asset enhancements completed since IPO
3 asset enhancements in progress
Acquisition pipeline
Assetenhancements
Large pipeline from both Sponsor and third parties.
A fragmented and diverse retail market provides further acquisition growth opportunities
KALIMANTAN
JAVA
SULAWESI
IRIAN JAYA
MALUKU
MALLS IN GREATER JAKARTA
N
PACIFIC OCEAN
INDIAN OCEAN
BANTENPROVINCE
WEST JAKARTA
SOUTH JAKARTA
WEST JAVAPROVINCE
EAST JAKARTA
CENTER OFJAKARTA
JAVA SEA
NORTH JAKARTA
Grand Palladium Medan
GTC Makassar
Malang Town Square City of Tomorrow Mall
Metropolis Town Square
WTC Matahari
Lippo Cikarang Mall
Gajah Mada Plaza
Pejaten Village
Depok Town Square Bellanova Country Mall
Tamini SquareBekasi Trade Mall
The Plaza Semanggi
Pluit Village
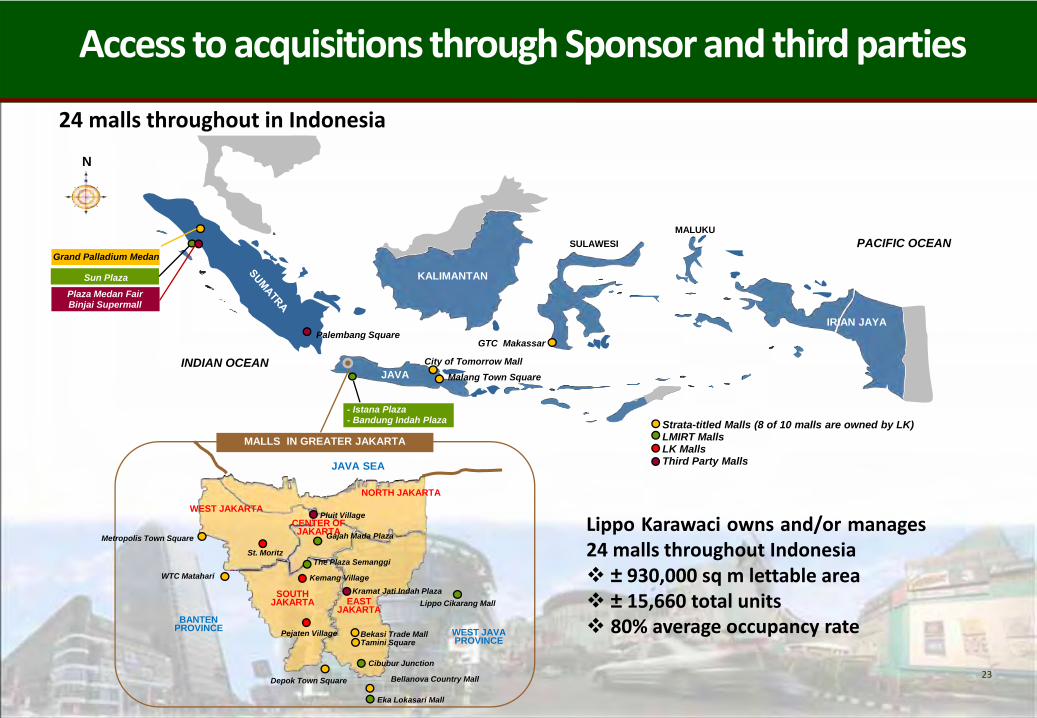
24 malls throughout in Indonesia
Eka Lokasari Mall
Palembang Square
Kramat Jati Indah Plaza
- Istana Plaza- Bandung Indah Plaza
Cibubur Junction
Lippo Karawaci owns and/or manages24 malls throughout Indonesia
± 930,000 sq m lettable area± 15,660 total units80% average occupancy rate
Plaza Medan FairBinjai Supermall
Sun Plaza
Strata-titled Malls (8 of 10 malls are owned by LK)LMIRT Malls LK MallsThird Party Malls
23
St. Moritz
Kemang Village
Access toacquisitions throughSponsorand thirdparties
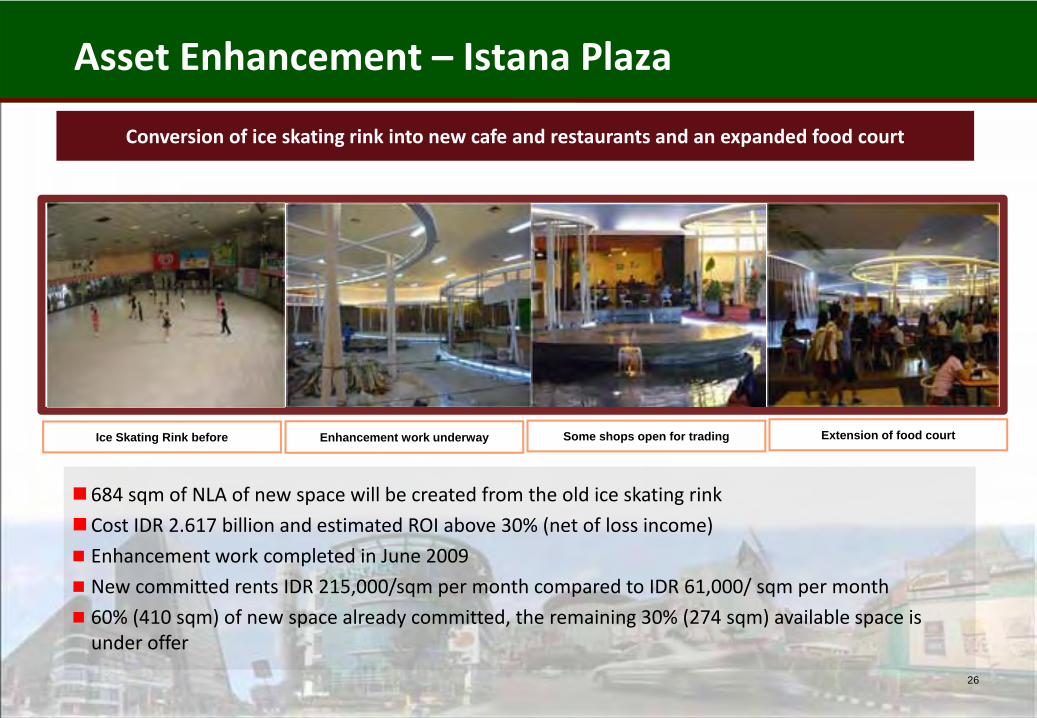
Asset Enhancement – Istana Plaza
26
684 sqm of NLA of new space will be created from the old ice skating rink
Cost IDR 2.617 billion and estimated ROI above 30% (net of loss income)
Enhancement work completed in June 2009
New committed rents IDR 215,000/sqm per month compared to IDR 61,000/ sqm per month
60% (410 sqm) of new space already committed, the remaining 30% (274 sqm) available space is under offer
Conversion of ice skating rink into new cafe and restaurants and an expanded food court
Ice Skating Rink before Enhancement work underway Some shops open for trading Extension of food court
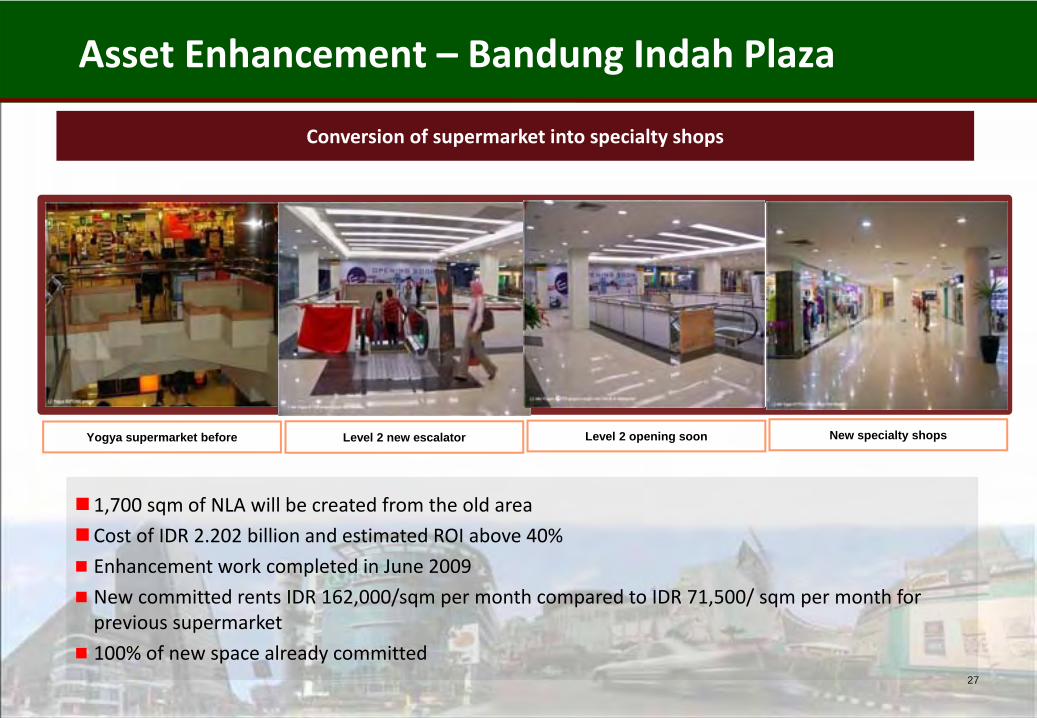
Asset Enhancement – Bandung Indah Plaza
27
1,700 sqm of NLA will be created from the old area
Cost of IDR 2.202 billion and estimated ROI above 40%
Enhancement work completed in June 2009
New committed rents IDR 162,000/sqm per month compared to IDR 71,500/ sqm per month for previous supermarket
100% of new space already committed
Conversion of supermarket into specialty shops
Yogya supermarket before Level 2 new escalator Level 2 opening soon New specialty shops
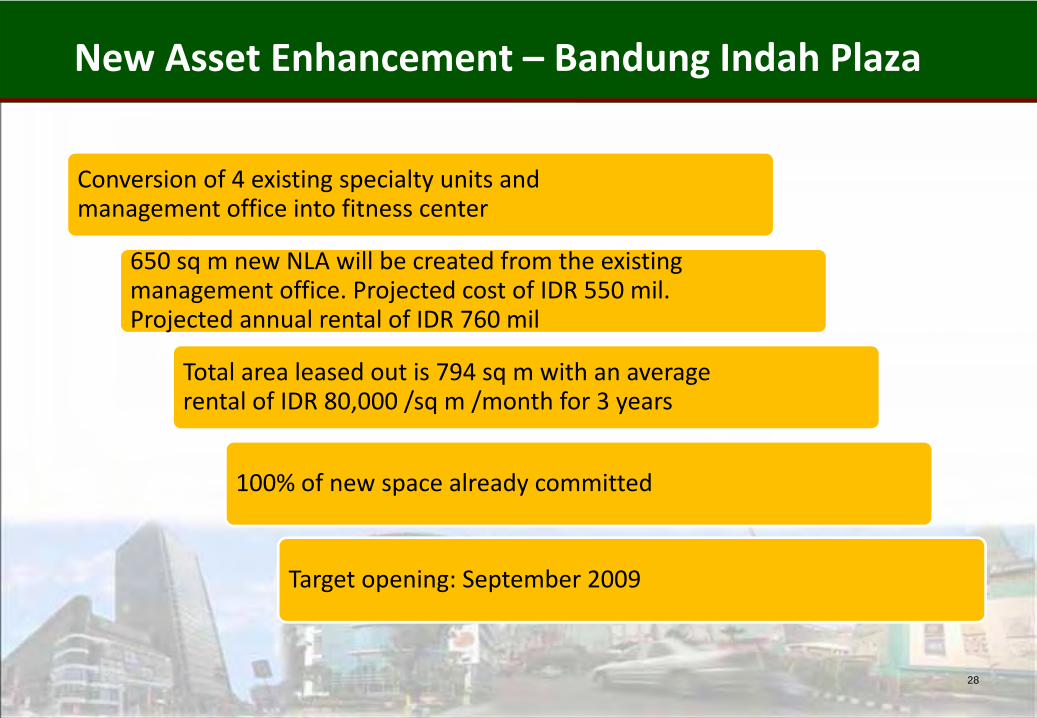
Conversion of 4 existing specialty units and management office into fitness center
650 sq m new NLA will be created from the existing management office. Projected cost of IDR 550 mil. Projected annual rental of IDR 760 mil
Total area leased out is 794 sq m with an average rental of IDR 80,000 /sq m /month for 3 years
100% of new space already committed
Target opening: September 2009
28
New Asset Enhancement – Bandung Indah Plaza
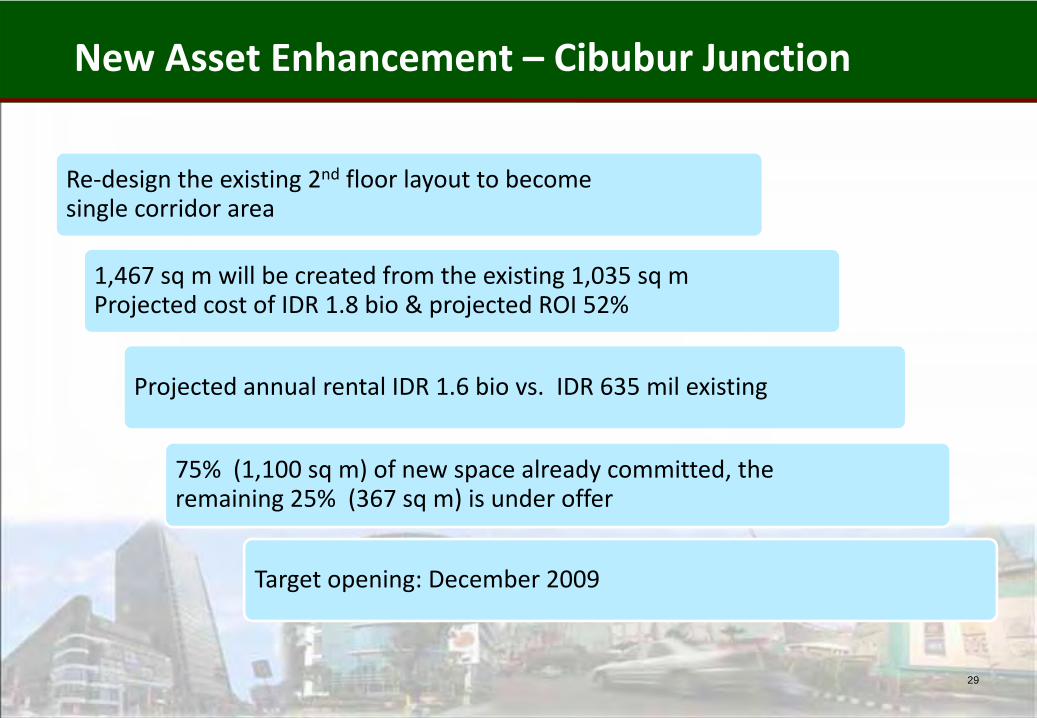
Re‐design the existing 2nd floor layout to become single corridor area
1,467 sq m will be created from the existing 1,035 sq m Projected cost of IDR 1.8 bio & projected ROI 52%
Projected annual rental IDR 1.6 bio vs. IDR 635 mil existing
75% (1,100 sq m) of new space already committed, the remaining 25% (367 sq m) is under offer
Target opening: December 2009
29
New Asset Enhancement – Cibubur Junction
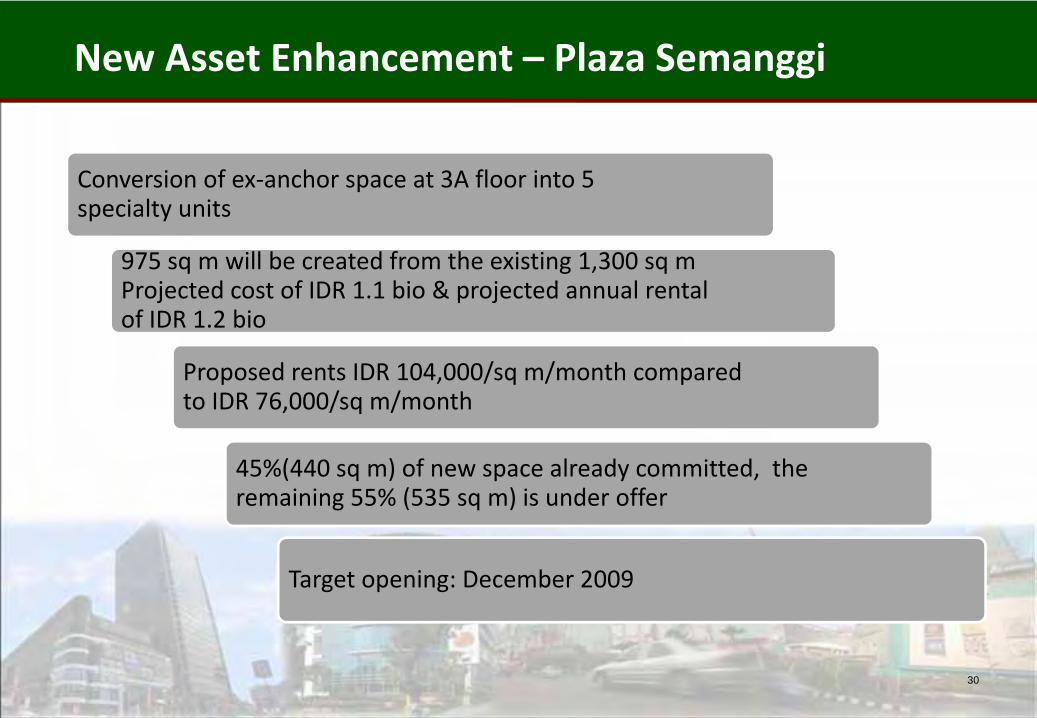
Conversion of ex‐anchor space at 3A floor into 5 specialty units
975 sq m will be created from the existing 1,300 sq m Projected cost of IDR 1.1 bio & projected annual rental of IDR 1.2 bio
Proposed rents IDR 104,000/sq m/month compared to IDR 76,000/sq m/month
45%(440 sq m) of new space already committed, the remaining 55% (535 sq m) is under offer
Target opening: December 2009
30
New Asset Enhancement – Plaza Semanggi

Sponsor
31
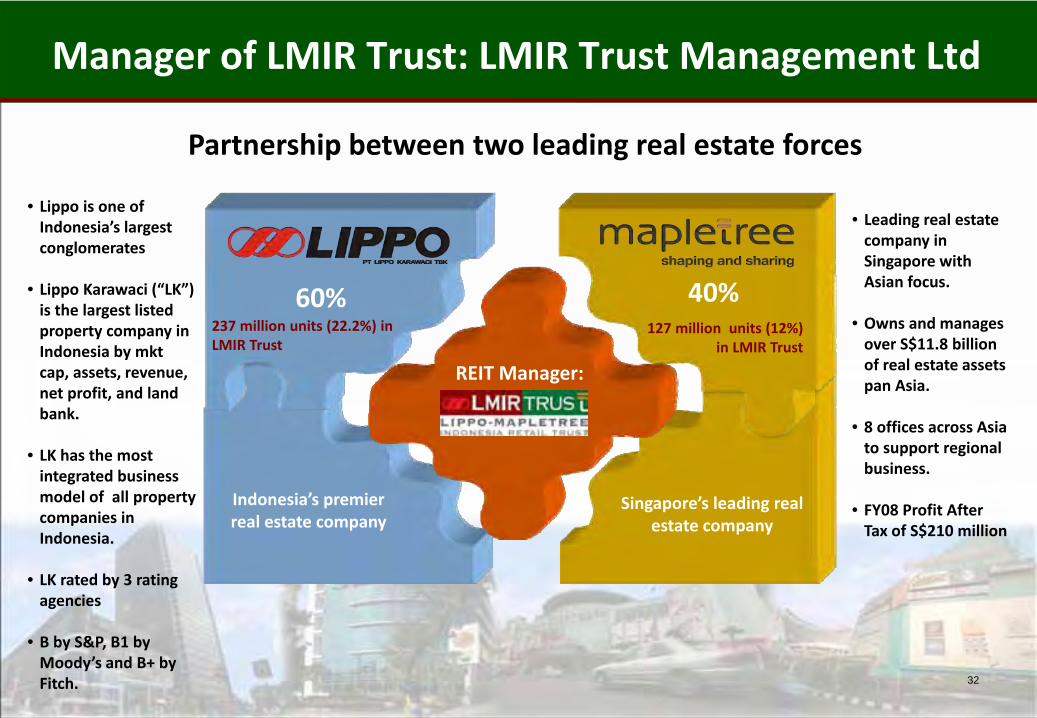
Manager of LMIR Trust: LMIR Trust Management Ltd
32
60% 40%
REIT Manager:
Singapore’s leading real estate company
Indonesia’s premier real estate company
Partnership between two leading real estate forces
237 million units (22.2%) in LMIR Trust
127 million units (12%) in LMIR Trust
• Leading real estate company in Singapore with Asian focus.
• Owns and manages over S$11.8 billion of real estate assets pan Asia.
• 8 offices across Asia to support regional business.
• FY08 Profit After Tax of S$210 million
• Lippo is one of Indonesia’s largest conglomerates
• Lippo Karawaci (“LK”) is the largest listed property company in Indonesia by mkt cap, assets, revenue, net profit, and land bank.
• LK has the most integrated business model of all property companies in Indonesia.
• LK rated by 3 rating agencies
• B by S&P, B1 by Moody’s and B+ by Fitch.
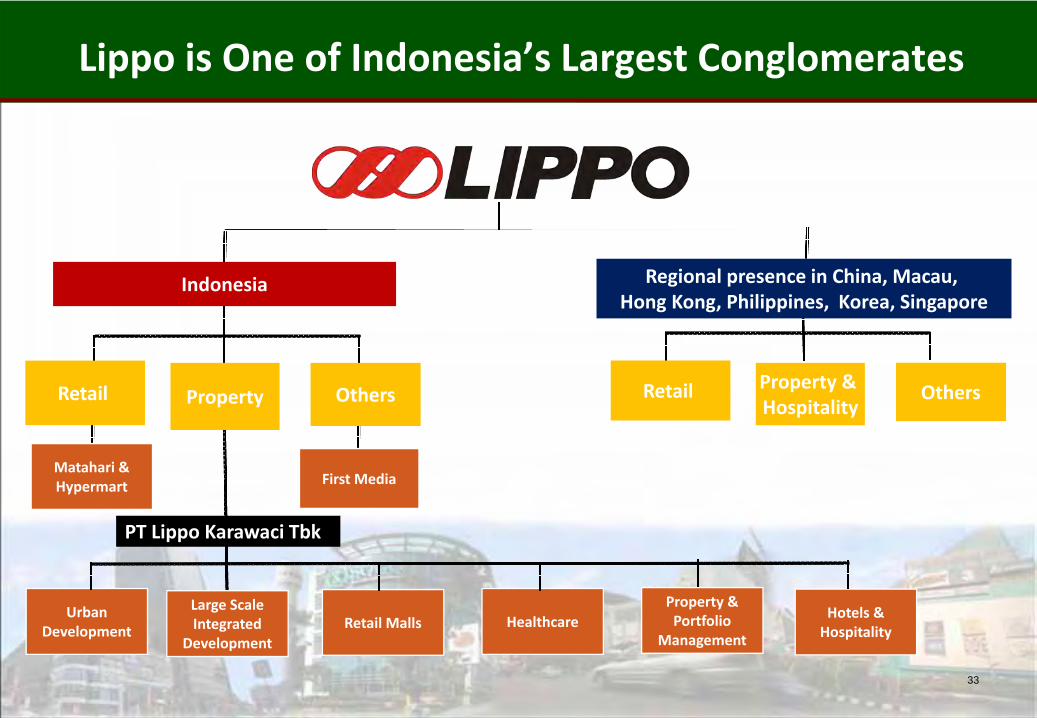
Lippo is One of Indonesia’s Largest Conglomerates
33
Matahari & Hypermart First Media
Urban Development
Large Scale Integrated
DevelopmentRetail Malls Healthcare
Hotels & Hospitality
Property & Portfolio
Management
Indonesia
OthersPropertyRetail OthersProperty & Hospitality
Retail
Regional presence in China, Macau, Hong Kong, Philippines, Korea, Singapore
PT Lippo Karawaci Tbk
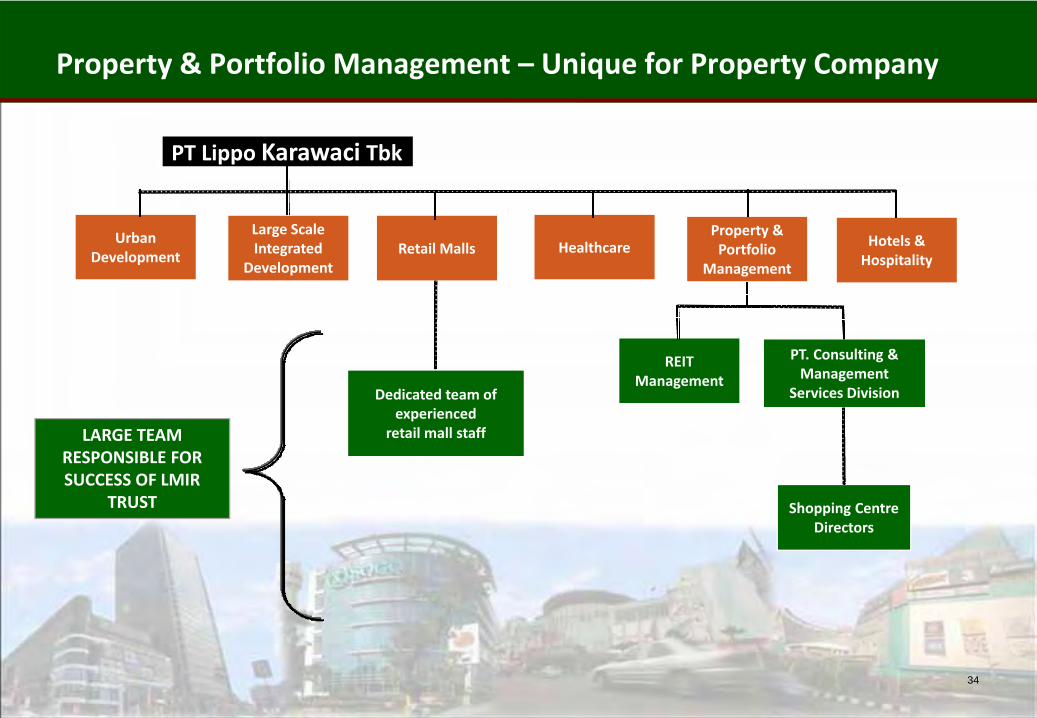
Property & Portfolio Management – Unique for Property Company
34
Urban Development
Large Scale Integrated
DevelopmentRetail Malls Healthcare Hotels &
Hospitality
Property & Portfolio
Management
PT. Consulting & Management
Services Division
REIT Management
Shopping Centre Directors
PT Lippo Karawaci Tbk
REIT REIT
Shopping Centre Directors
Dedicated team of experienced
retail mall staff LARGE TEAM RESPONSIBLE FOR SUCCESS OF LMIR
TRUST

Summary
35
36
Conclusion
Based on announced annualised DPU, attractive yield of 11.8%
Share price trading at a substantial discount to NAV
Well‐balanced property diversification with no single property accounting for more than 17% of Net Property Income
Portfolio occupancy rate remains higher than industry average, and projected to remain so for the rest of the year
Conservative gearing provides capacity for further yield accretive acquisitions
Access to future acquisitions in a fragmented and diverse retail market.
Indonesian economy is one of Asia’s best performing in 2009
Indonesia retail demand likely to be subdued in 2009.
LMIRT is committed to deliver stable results to our unit holders.
36

Appendix
37
38
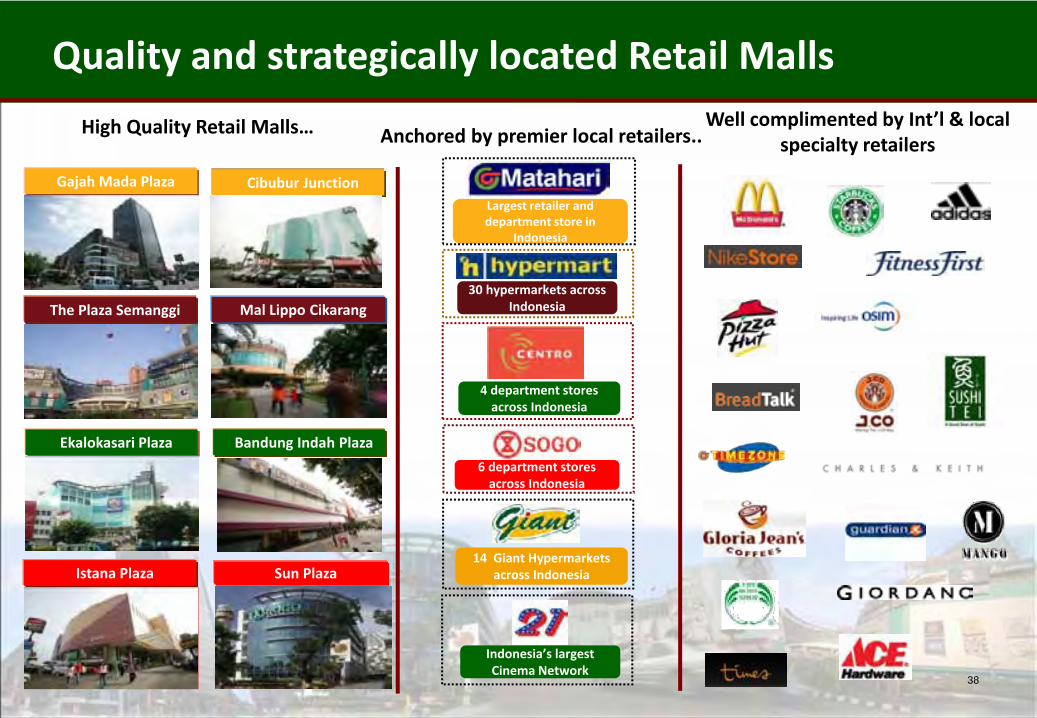
Quality and strategically located Retail Malls
The Plaza Semanggi
Cibubur JunctionGajah Mada Plaza
Mal Lippo Cikarang
Ekalokasari Plaza Bandung Indah Plaza
Istana Plaza
High Quality Retail Malls…
Largest retailer and department store in
Indonesia
30 hypermarkets across Indonesia
4 department stores across Indonesia
14 Giant Hypermarkets across Indonesia
Anchored by premier local retailers..Well complimented by Int’l & local
specialty retailers
Sun Plaza
6 department stores across Indonesia
Indonesia’s largest Cinema Network
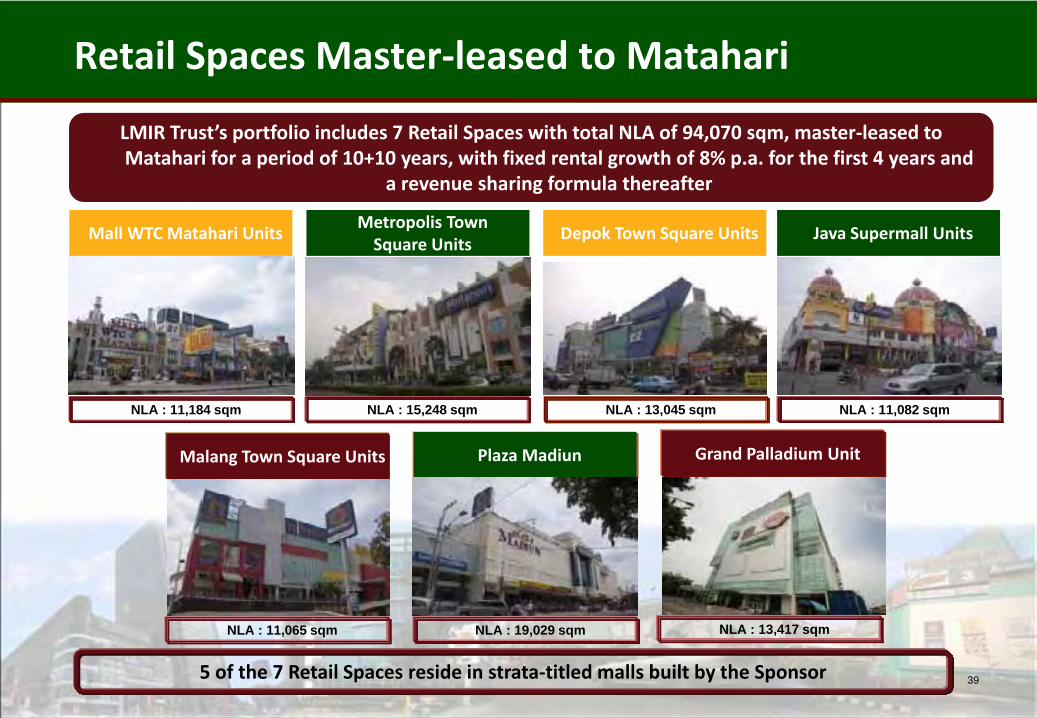
Retail Spaces Master‐leased to Matahari
39
Mall WTC Matahari UnitsMetropolis Town Square Units
Depok Town Square Units Java Supermall Units
Malang Town Square Units Plaza Madiun Grand Palladium Unit
LMIR Trust’s portfolio includes 7 Retail Spaces with total NLA of 94,070 sqm, master‐leased to Matahari for a period of 10+10 years, with fixed rental growth of 8% p.a. for the first 4 years and
a revenue sharing formula thereafter
NLA : 11,184 sqm NLA : 15,248 sqm NLA : 13,045 sqm NLA : 11,082 sqm
NLA : 11,065 sqm NLA : 13,417 sqmNLA : 19,029 sqm
5 of the 7 Retail Spaces reside in strata‐titled malls built by the Sponsor

Organic growth examples – Annual Sale Cibubur Junction
40
SALE NOW ONThe beginning of the great programin Cibubur Junction
Cibubur Junction
SALE NOW ONMid‐Year SALE to
boost tenants’ sales
& drive more
traffic to the mall

Organic growth examples – Annual Sale Gajah Mada
41
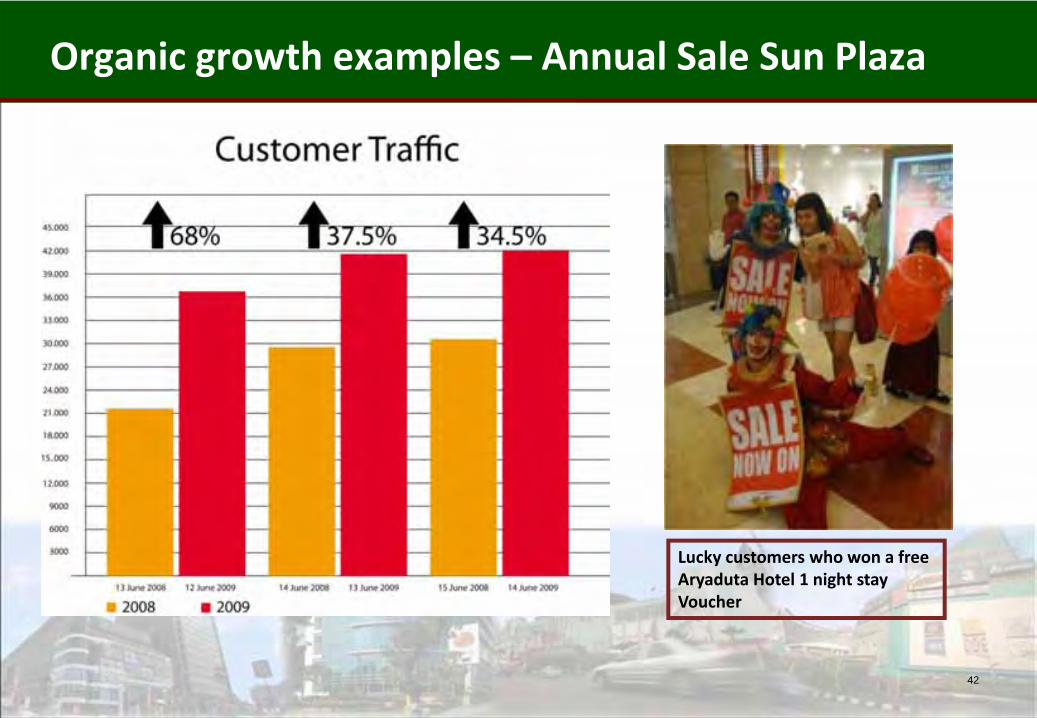
Organic growth examples – Annual Sale Sun Plaza
42
Lucky customers who won a free Aryaduta Hotel 1 night stay Voucher
43
Lippo‐Mapletree Indonesia Retail Trust Management Ltd78 Shenton Way
#05‐01,Singapore 079120Tel: 6410 9138Fax: 6220 6557
www.lmir‐trust.com
For enquiries, please contact:Mr. Shane Hagan
Chief Financial OfficerDirect: (65) 6410 9139
Email: shane.hagan@lmir‐trust.com