3 201 quarter - hansa group ag · cashflows from financing activities -1.3 -0.6 financial positions...
TRANSCRIPT
INTE
RIM
RE
PO
RT
1 Q
UA
RTE
R 2
013
ST
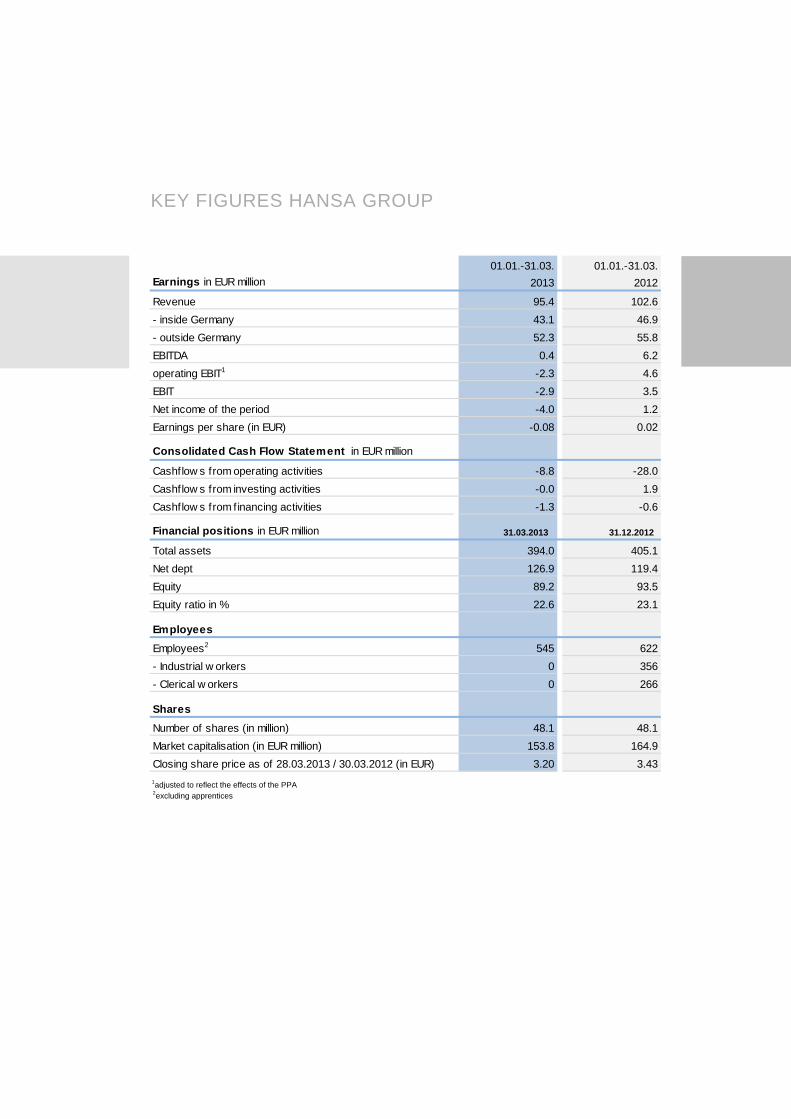
KEY FIGURES HANSA GROUP
01.01.-31.03. 01.01.-31.03.Earnings in EUR million 2013 2012
Revenue 95.4 102.6- inside Germany 43.1 46.9- outside Germany 52.3 55.8EBITDA 0.4 6.2operating EBIT1 -2.3 4.6EBIT -2.9 3.5Net income of the period -4.0 1.2Earnings per share (in EUR) -0.08 0.02
Consolidated Cash Flow Statement in EUR million
Cashflow s from operating activities -8.8 -28.0Cashflow s from investing activities -0.0 1.9Cashflow s from financing activities -1.3 -0.6
Financial positions in EUR million 31.03.2013 31.12.2012
Total assets 394.0 405.1Net dept 126.9 119.4Equity 89.2 93.5Equity ratio in % 22.6 23.1
EmployeesEmployees2 545 622- Industrial w orkers 0 356- Clerical w orkers 0 266
SharesNumber of shares (in million) 48.1 48.1Market capitalisation (in EUR million) 153.8 164.9Closing share price as of 28.03.2013 / 30.03.2012 (in EUR) 3.20 3.431adjusted to reflect the effects of the PPA2excluding apprentices
HIGHLIGHTS 1ST QUARTER 2013 4
MANAGEMENT REPORT FOR THE 1ST QUARTER OF 2013 6
CONSOLIDATED BALANCE SHEET 10
CONSOLIDATED INCOME STATEMENT 11
CONSOLIDATED STATEMENT OF COMPR. INCOME 11
CONSOLIDATED CASH FLOW STATEMENT 12
CONSOLIDATED STATEMENT OF CHANGES 13
NOTES 14
STATEMENT BY LEGAL REPRESENTATIVES 21
CONTACT / PUBLISHING DETAILS 22
CONTENT
4 H I GHLI GHTS 1ST QUARTER 2013
HIGHLIGHTS 1ST QUARTER 2013
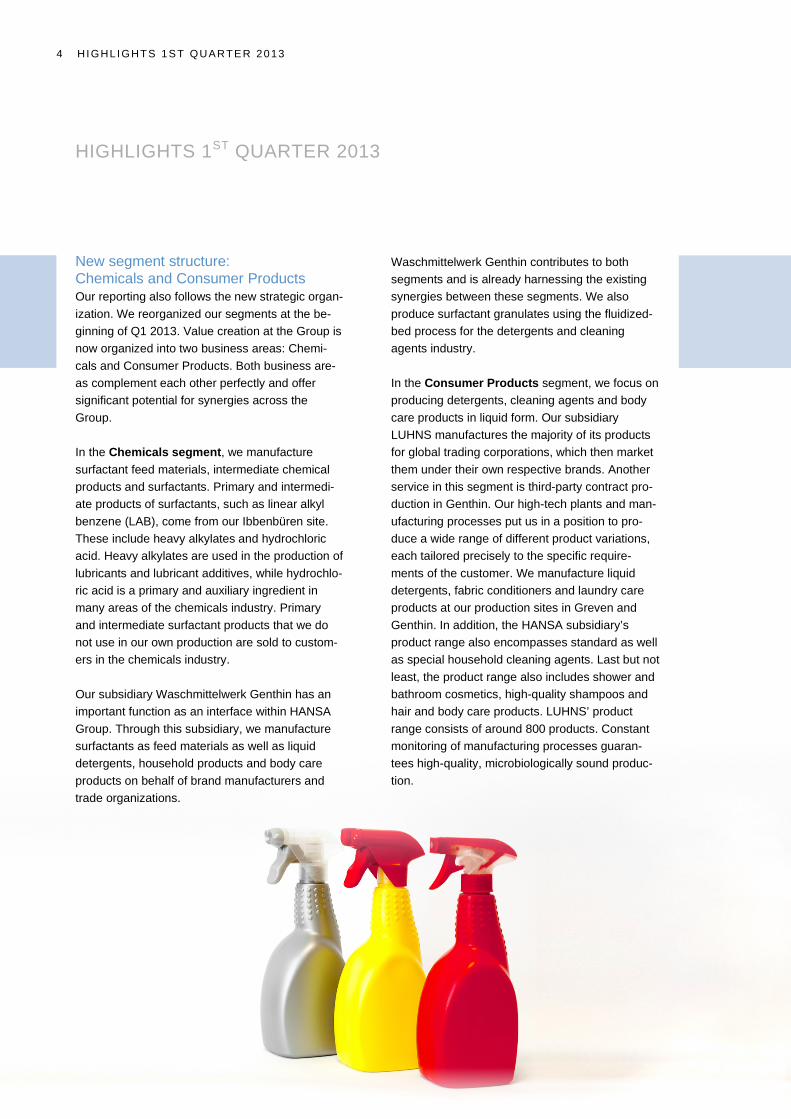
New segment structure: Chemicals and Consumer Products Our reporting also follows the new strategic organ-ization. We reorganized our segments at the be-ginning of Q1 2013. Value creation at the Group is now organized into two business areas: Chemi-cals and Consumer Products. Both business are-as complement each other perfectly and offer significant potential for synergies across the Group. In the Chemicals segment, we manufacture surfactant feed materials, intermediate chemical products and surfactants. Primary and intermedi-ate products of surfactants, such as linear alkyl benzene (LAB), come from our Ibbenbüren site. These include heavy alkylates and hydrochloric acid. Heavy alkylates are used in the production of lubricants and lubricant additives, while hydrochlo-ric acid is a primary and auxiliary ingredient in many areas of the chemicals industry. Primary and intermediate surfactant products that we do not use in our own production are sold to custom-ers in the chemicals industry. Our subsidiary Waschmittelwerk Genthin has an important function as an interface within HANSA Group. Through this subsidiary, we manufacture surfactants as feed materials as well as liquid detergents, household products and body care products on behalf of brand manufacturers and trade organizations.
Waschmittelwerk Genthin contributes to both segments and is already harnessing the existing synergies between these segments. We also produce surfactant granulates using the fluidized-bed process for the detergents and cleaning agents industry. In the Consumer Products segment, we focus on producing detergents, cleaning agents and body care products in liquid form. Our subsidiary LUHNS manufactures the majority of its products for global trading corporations, which then market them under their own respective brands. Another service in this segment is third-party contract pro-duction in Genthin. Our high-tech plants and man-ufacturing processes put us in a position to pro-duce a wide range of different product variations, each tailored precisely to the specific require-ments of the customer. We manufacture liquid detergents, fabric conditioners and laundry care products at our production sites in Greven and Genthin. In addition, the HANSA subsidiary’s product range also encompasses standard as well as special household cleaning agents. Last but not least, the product range also includes shower and bathroom cosmetics, high-quality shampoos and hair and body care products. LUHNS’ product range consists of around 800 products. Constant monitoring of manufacturing processes guaran-tees high-quality, microbiologically sound produc-tion.
HI GHLI GHTS 1S T QUA RTER 2013 5
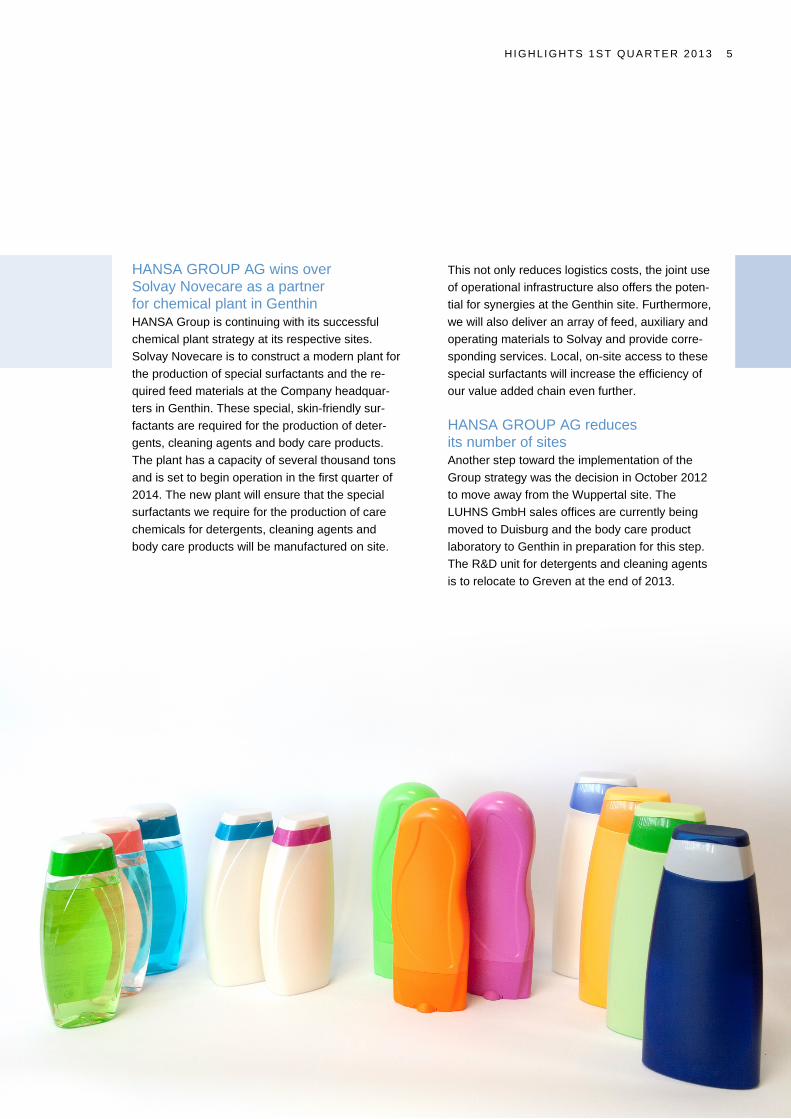
HANSA GROUP AG wins over Solvay Novecare as a partner for chemical plant in Genthin HANSA Group is continuing with its successful chemical plant strategy at its respective sites. Solvay Novecare is to construct a modern plant for the production of special surfactants and the re-quired feed materials at the Company headquar-ters in Genthin. These special, skin-friendly sur-factants are required for the production of deter-gents, cleaning agents and body care products. The plant has a capacity of several thousand tons and is set to begin operation in the first quarter of 2014. The new plant will ensure that the special surfactants we require for the production of care chemicals for detergents, cleaning agents and body care products will be manufactured on site.
This not only reduces logistics costs, the joint use of operational infrastructure also offers the poten-tial for synergies at the Genthin site. Furthermore, we will also deliver an array of feed, auxiliary and operating materials to Solvay and provide corre-sponding services. Local, on-site access to these special surfactants will increase the efficiency of our value added chain even further. HANSA GROUP AG reduces its number of sites Another step toward the implementation of the Group strategy was the decision in October 2012 to move away from the Wuppertal site. The LUHNS GmbH sales offices are currently being moved to Duisburg and the body care product laboratory to Genthin in preparation for this step. The R&D unit for detergents and cleaning agents is to relocate to Greven at the end of 2013.

6 MANAGEMENT REPORT FOR THE 1ST QUA RTER OF 2013
MANAGEMENT REPORT FOR THE 1ST QUARTER OF 2013
Business development and macroeconomic conditions In the first quarter, the European economy continued to suffer under the strain of the sovereign debt crisis, which even worsened in some eurozone countries. The German economy saw slow growth in the first three months of fiscal year 2013 as a result of this trend. According to the Federal Statistical Office, gross domestic product (GDP) rose by 0.1 percent. Private households increased their spending moder-ately, providing positive momentum. In terms of in-vestments, however, the previous year’s negative trend continued. On commodities markets, the price for crude oil ini-tially increased significantly, reaching more than 120 US dollars per barrel by mid-February before falling somewhat. However, crude oil prices remained high in general against the backdrop of political uncertain-ties in the Middle East. According to information from the Organization of Petroleum Exporting Countries (OPEC), the average price of Brent crude oil fell in the first quarter by around 5 percent year on year to 113 US dollars per barrel. In the third quarter of 2012, the demand recorded by HANSA Group resulted in a satisfactory order situa-tion and therefore an average utilization of 70 per-cent for all plants. Demand for LAS ether sulphates and olefin sulfonates remains stable. A slight de-crease was recorded due to the development of raw material costs and falling demand for exports, espe-cially in southern Europe.
Sales development within the Group HANSA Group’s sales totaled 95,364 thousand euro in the first quarter, down 7,243 euro year on year. The main factors contributing to this performance were the loss of part of trading activities and a slight decrease in sales volumes due to lower demand. Since 2013, HANSA GROUP AG has separated its business activities into the segments Chemicals and Consumer Products. In the Chemicals segment, we produce surfactant feed materials, intermediate products and surfactants, which we then use to make the detergent substances employed in the production of detergents and body care products in the Con-sumer Products segment. In the first quarter of 2013, sales in Chemicals came to 58,431 thousand euro and dropped by 7,253 thousand euro year on year. These figures are not comparable to those from the same period in the previous year due to the disposal of parts of the trading activities. Furthermore, tougher competition and declining sales volumes on account of lower demand, especially in southern Europe, were also main reasons for this development. The Consumer Products segment reported sales of 36,963 thousand euro. The low-level increase de-spite increased capacities was mainly due to lower production volumes on account of the somewhat weaker order situation. In addition, it was not always possible to pass price adjustments related to raw material price developments on to the market in a timely fashion, which had a significant influence on the Group’s negative business development. Viewed by region, about 43.132 thousand euro (pre-vious year: 46,860 thousand euro) was generated in Germany, whereas 52.262 thousand euro (previous year: 55,778 thousand euro) was attributable to Eu-rope and other foreign markets in the first three months of the year.

MANAGEME NT RE PORT FOR THE 1ST QUA RTE R OF 2013 7
Intra-Group sales totaled 61,284 thousand euro in the first quarter of 2013 compared to 44,260 thou-sand euro in the first quarter of 2012. Earnings development In the first three months of the current fiscal year, HANSA Group generated EBIT of -2,925 thousand euro (previous year: 3,489 thousand euro). Effects such as the sale of parts of the chemicals trading business, the optimization of the Group structure and the resulting reduction of Group locations, and rising production costs due to lower capacity utilization had a negative impact on Group earnings. EBITDA fell by 5,771 thousand euro to 389 thousand euro. Other operating income amounted to 1,466 thousand euro compared to 1,280 thousand euro in the first three months of 2012. This item mainly pertained to claims for damages as to allowances. In the first quarter of 2013, material expenses came to 75,077 thousand euro compared to 80,408 thou-sand euro in the prior-year period. The main reasons for this development are the sale of parts of the chemicals trading business as well as a slight decline in production volumes. Personnel expenses declined slightly by 642 thou-sand euro year on year and totaled 8,058 thousand euro. As of March 31, 2013, a total of 545 people (previous year: 653 people) were employed at the sites in Düren, Duisburg, Genthin, Greven, Ib-benbüren and Wuppertal. Other operating expenses went down by 12.0 per-cent to 13,917 thousand euro compared to 15,806 thousand euro in the prior-year period. The reduction was due to the sale of parts of the chemicals trading business. The financial result amounted to -1,276 thousand euro, declining marginally year on year (Q I 2012: -1,404 thousand euro).
Earnings per share fell to -0.08 euro from 0.02 euro in the same period in the previous year. Net assets and financial position The consolidated balance sheet total of HANSA Group came to 394,047 thousand euro as of March 31, 2013, compared to 405,058 thousand euro as of the balance sheet date on December 31, 2012. On the asset side, non-current assets fell by 31,112 thousand euro to 240,552 thousand euro compared to the end of the previous year. In contrast, current assets increased to 153,535 thousand euro. While trade receivables remained nearly constant at 43,822 thousand euro, inventories went up by 2,180 thou-sand euro. Cash and cash equivalents, however, fell by 9,902 thousand euro to 12,224 thousand euro. Other receivables and assets increased by 28,083 thousand euro due to purchase price receivables of 27,762 thousand euro from the agreement to sell parts of the trading activities. On the liabilities side, equity changed by -4,284 thousand euro compared to December 31, 2012. The decline in the balance sheet total caused the equity ratio to fall correspondingly by almost 23.1 percent to 22.5 percent. The capital stock is divided into 48,077,900 no-par value bearer shares. These no-par shares are voting shares of the same class of shares. Each no-par share entitles the holder to one vote at the Annual General Meeting. At present, the Company does not hold any treasury shares. The table “Statement of changes in shareholders’ equity” on page 13 con-tains a detailed breakdown of influences on equity.

8 MANAGEMENT REPORT FOR THE 1ST QUA RTER OF 2013
Non-current provisions and liabilities declined by 794 thousand euro to 106,282 thousand euro. On the liabilities side, trade payables also decreased by 5,493 thousand euro to 101,151 thousand euro. Current financial liabilities rose only slightly by 396 thousand euro. Other liabilities decreased by 1,518 thousand euro to 21,491 thousand euro as of March 31, 2013, mainly on account of a decline in remain-ing other liabilities in connection with the sale of parts of the trading activities. Cash outflow from operating activities came to -8,798 thousand euro as of March 31, 2013, the main rea-sons being the increase in receivables and the de-crease in trade payables. The consolidated state-ment of cash flow on page 12 contains a detailed development of financial assets. Investments Investments in tangible assets totaled 28 thousand euro in the reporting period. These mainly pertained to investments at the Genthin site. There have been no other reportable activities of any significance except those stated above that would lead us to expect any major impact on the net as-sets, financial position and results of operations of HANSA Group. Opportunities and risks The main success factors for HANSA GROUP AG’s future development arise from the consistent imple-mentation of our strategy. We will continue to focus mainly on integrating the Group subsidiaries and the implemented optimization and efficiency-enhancing programs. We are aiming to significantly improve cost and energy efficiency, reduce our need for capi-tal and other synergy effects with direct and indirect positive influences on our business.
Being an international production and trade compa-ny, HANSA Group faces not only various opportuni-ties but also corresponding risks. Another escalation of the European debt crisis may slow down economic growth. Furthermore, the ef-fects of the recession in southern Europe and the global political unrest on the economy and supply chain are hard to estimate. However, our main focus lies on market risks such as competition, procure-ment and sales risks. Rising feed material costs may also have a negative impact on consumer spending and demand. The risk factors detailed in the Financial Report 2012 have not significantly changed up to now. Outlook The International Monetary Fund (IMF) expects eco-nomic growth in Europe to vary greatly from country to country. Whereas the IMF forecasts GDP in Spain and Italy to fall by 1.6 and 1.5 percent respectively, the organization predicts that the German economy will grow by 0.6 percent. The IMF anticipates a de-cline of 0.3 percent for the entire eurozone. The trend in the high-volume chemical industry and the detergents, cleaning agents and body care mar-kets is of key importance to HANSA GROUP AG’s business. Although the desired turn-around in the chemical industry has yet to materialize, sales nevertheless increased slightly in the first quarter of 2013. Accord-ing to information from the German Chemical Indus-try Association (Verband der Chemischen Industrie – VCI), this growth totaled 1.0 percent, bringing the sum up to 45.8 billion euro. Foreign demand proved to be the mainstay of the chemicals business. Indus-try sales are set to increase by 2.0 percent to 190 billion euro by the end of 2013.
MANAGEME NT RE PORT FOR THE 1S T QUA RTE R OF 2013 9
Following growth rates of 1.4 percent in beauty care products and 0.9 percent in household care products in 2012, the Industrial Association for Body Care and Cleaning Products (Industrieverband Körperpflege- und Waschmittel e.V. – IKW) expects growth to weaken slightly in the current fiscal year to 0.5 per-cent in each area. Our expectations with regard to the underlying eco-nomic conditions worldwide for 2013 therefore re-main mainly unchanged as against the report for 2012. We expect demand in our market segment to remain stable. Further growth in surfactants and Consumer Products will allow us to improve produc-tion capacity utilization in 2013 and reduce fixed costs further. We intend to expand our product port-folio and increase capacity utilization through further organic growth, such as by assuming further contract manufacturing tasks for third parties. The establish-ment of further production plants at the Genthin site will allow us to make more efficient use of our own production capacities and save costs. With our focus on the increasing demand for private labels and liquid products in the detergents, cleaning agents and body care products market, we anticipate an increase in sales in fiscal year 2013. Although we see certain risks in terms of equity, we nevertheless anticipate the earnings trend to remain similar in 2013.
We anticipate strong growth in the Chemical seg-ment, primarily due to the increase in capacity utiliza-tion of the surfactants plant. In Consumer Products, we have recognized further potential for growth through corresponding growth in private labels at the expense of manufacturer brands on account of the more beneficial price/performance ratio for the customer. Furthermore, the trend away from powder detergents and toward liquid detergents supports our growth course. Measures are currently being planned to strengthen our stock market presence in order to guarantee the Company’s further success over the next few years. This will also be supported by a short-term capital measure. To make this possible, the Annual General Meeting has approved a number of provisions for increasing the Company’s capital stock. On this basis, an appropriate measure is currently being examined, which can be used for refinancing the investments made in recent years, improving bal-ance sheet ratios by strengthening the equity base and, where possible, for the repayment of borrowed capital.
10 CONSOLI DATED BALANCE SHEET
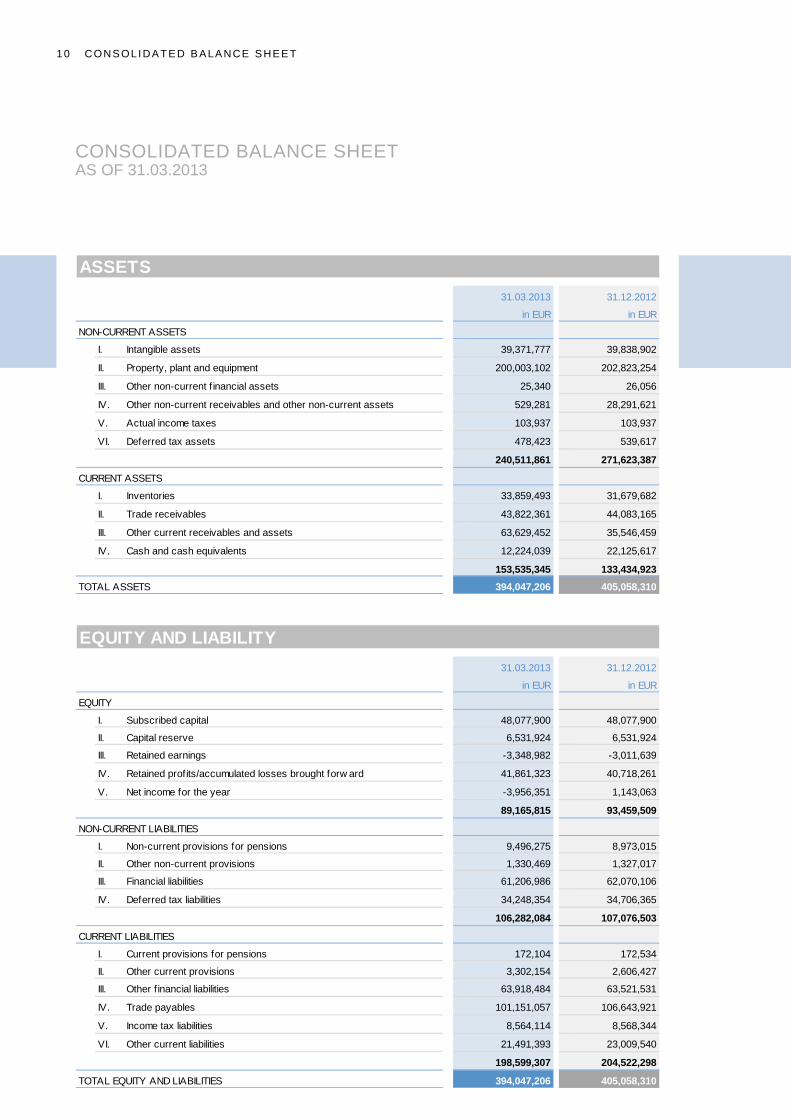
CONSOLIDATED BALANCE SHEET AS OF 31.03.2013 ASSETS
31.03.2013 31.12.2012
in EUR in EUR
NON-CURRENT ASSETS
I. Intangible assets 39,371,777 39,838,902
II. Property, plant and equipment 200,003,102 202,823,254
III. Other non-current f inancial assets 25,340 26,056
IV. Other non-current receivables and other non-current assets 529,281 28,291,621
V. Actual income taxes 103,937 103,937
VI. Deferred tax assets 478,423 539,617
240,511,861 271,623,387
CURRENT ASSETS
I. Inventories 33,859,493 31,679,682
II. Trade receivables 43,822,361 44,083,165
III. Other current receivables and assets 63,629,452 35,546,459
IV. Cash and cash equivalents 12,224,039 22,125,617
153,535,345 133,434,923TOTAL ASSETS 394,047,206 405,058,310
EQUITY AND LIABILITY31.03.2013 31.12.2012
in EUR in EUR
EQUITY
I. Subscribed capital 48,077,900 48,077,900
II. Capital reserve 6,531,924 6,531,924
III. Retained earnings -3,348,982 -3,011,639
IV. Retained profits/accumulated losses brought forw ard 41,861,323 40,718,261
V. Net income for the year -3,956,351 1,143,063
89,165,815 93,459,509
NON-CURRENT LIABILITIES
I. Non-current provisions for pensions 9,496,275 8,973,015
II. Other non-current provisions 1,330,469 1,327,017
III. Financial liabilities 61,206,986 62,070,106
IV. Deferred tax liabilities 34,248,354 34,706,365
106,282,084 107,076,503
CURRENT LIABILITIES
I. Current provisions for pensions 172,104 172,534
II. Other current provisions 3,302,154 2,606,427
III. Other f inancial liabilities 63,918,484 63,521,531
IV. Trade payables 101,151,057 106,643,921
V. Income tax liabilities 8,564,114 8,568,344
VI. Other current liabilities 21,491,393 23,009,540
198,599,307 204,522,298
TOTAL EQUITY AND LIABILITIES 394,047,206 405,058,310
CONS OLI DA TE D I NCOME STA TEMENT 11
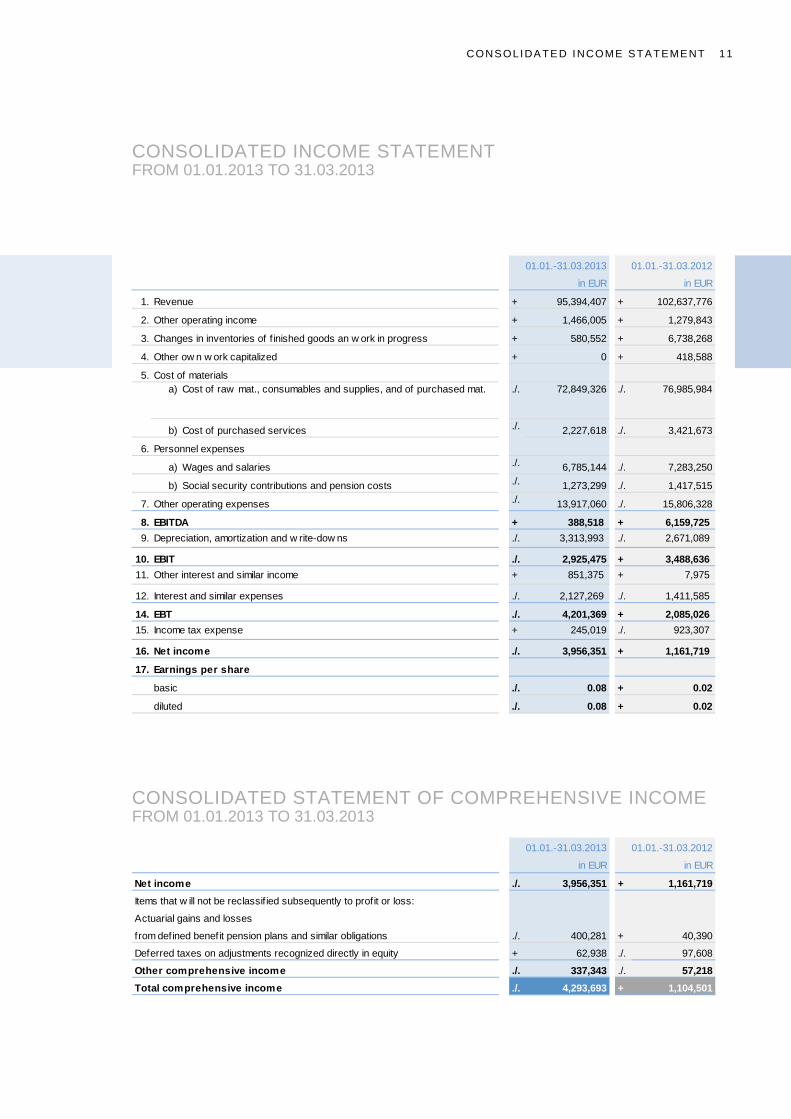
CONSOLIDATED INCOME STATEMENT FROM 01.01.2013 TO 31.03.2013
CONSOLIDATED STATEMENT OF COMPREHENSIVE INCOME FROM 01.01.2013 TO 31.03.2013
01.01.-31.03.2013 01.01.-31.03.2012
in EUR in EUR
1. Revenue + 95,394,407 + 102,637,776
2. Other operating income + 1,466,005 + 1,279,843
3. Changes in inventories of f inished goods an w ork in progress + 580,552 + 6,738,268
4. Other ow n w ork capitalized + 0 + 418,588
5. Cost of materials
b) Cost of purchased services ./. 2,227,618 ./. 3,421,673
6. Personnel expenses
a) Wages and salaries ./. 6,785,144 ./. 7,283,250
b) Social security contributions and pension costs ./. 1,273,299 ./. 1,417,515
7. Other operating expenses ./. 13,917,060 ./. 15,806,328
8. EBITDA + 388,518 + 6,159,7259. Depreciation, amortization and w rite-dow ns ./. 3,313,993 ./. 2,671,089
10. EBIT ./. 2,925,475 + 3,488,63611. Other interest and similar income + 851,375 + 7,975
12. Interest and similar expenses ./. 2,127,269 ./. 1,411,585
14. EBT ./. 4,201,369 + 2,085,02615. Income tax expense + 245,019 ./. 923,307
16. Net income ./. 3,956,351 + 1,161,719
17. Earnings per share
basic ./. 0.08 + 0.02
diluted ./. 0.08 + 0.02
72,849,326./. ./. 76,985,984Cost of raw mat., consumables and supplies, and of purchased mat.a)
01.01.-31.03.2013 01.01.-31.03.2012
in EUR in EUR
Net income ./. 3,956,351 + 1,161,719Items that w ill not be reclassif ied subsequently to profit or loss:
Actuarial gains and losses
from defined benefit pension plans and similar obligations ./. 400,281 + 40,390
Deferred taxes on adjustments recognized directly in equity + 62,938 ./. 97,608
Other comprehensive income ./. 337,343 ./. 57,218Total comprehensive income ./. 4,293,693 + 1,104,501
12 CONSOLI DATED CASH FLOW STATEMENT
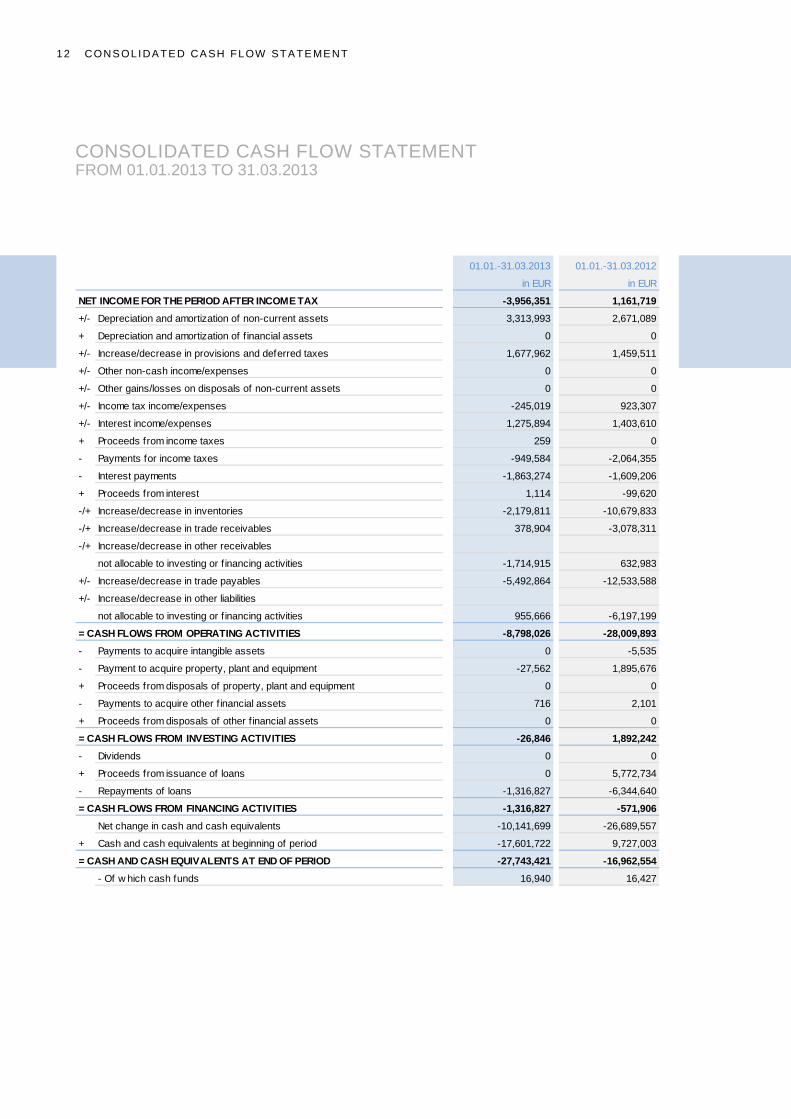
CONSOLIDATED CASH FLOW STATEMENT FROM 01.01.2013 TO 31.03.2013
01.01.-31.03.2013 01.01.-31.03.2012
in EUR in EUR
NET INCOME FOR THE PERIOD AFTER INCOME TAX -3,956,351 1,161,719+/- Depreciation and amortization of non-current assets 3,313,993 2,671,089
+ Depreciation and amortization of f inancial assets 0 0
+/- Increase/decrease in provisions and deferred taxes 1,677,962 1,459,511
+/- Other non-cash income/expenses 0 0
+/- Other gains/losses on disposals of non-current assets 0 0
+/- Income tax income/expenses -245,019 923,307
+/- Interest income/expenses 1,275,894 1,403,610
+ Proceeds from income taxes 259 0
- Payments for income taxes -949,584 -2,064,355
- Interest payments -1,863,274 -1,609,206
+ Proceeds from interest 1,114 -99,620
-/+ Increase/decrease in inventories -2,179,811 -10,679,833
-/+ Increase/decrease in trade receivables 378,904 -3,078,311
-/+ Increase/decrease in other receivables
not allocable to investing or f inancing activities -1,714,915 632,983
+/- Increase/decrease in trade payables -5,492,864 -12,533,588
+/- Increase/decrease in other liabilities
not allocable to investing or f inancing activities 955,666 -6,197,199
= CASH FLOWS FROM OPERATING ACTIVITIES -8,798,026 -28,009,893- Payments to acquire intangible assets 0 -5,535
- Payment to acquire property, plant and equipment -27,562 1,895,676
+ Proceeds from disposals of property, plant and equipment 0 0
- Payments to acquire other f inancial assets 716 2,101
+ Proceeds from disposals of other f inancial assets 0 0
= CASH FLOWS FROM INVESTING ACTIVITIES -26,846 1,892,242- Dividends 0 0
+ Proceeds from issuance of loans 0 5,772,734
- Repayments of loans -1,316,827 -6,344,640
= CASH FLOWS FROM FINANCING ACTIVITIES -1,316,827 -571,906Net change in cash and cash equivalents -10,141,699 -26,689,557
+ Cash and cash equivalents at beginning of period -17,601,722 9,727,003
= CASH AND CASH EQUIVALENTS AT END OF PERIOD -27,743,421 -16,962,554- Of w hich cash funds 16,940 16,427
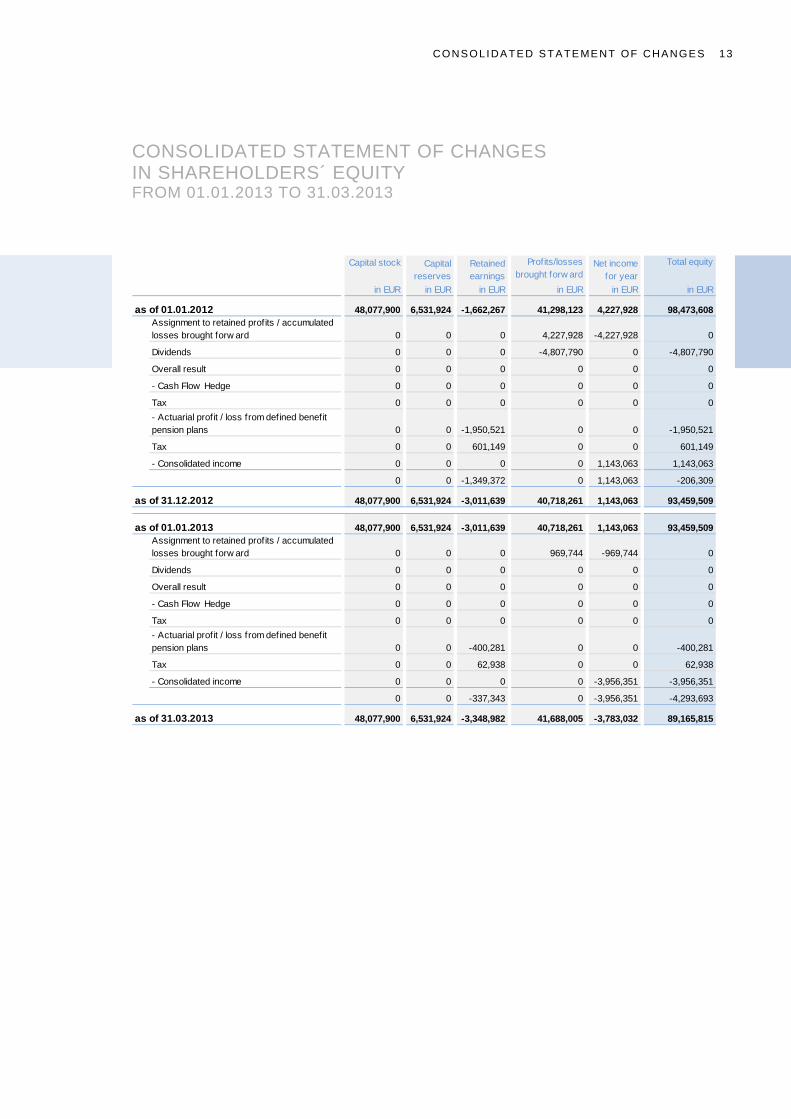
CONSOLI DA TE D STA TE ME NT OF CHA NGES 13
CONSOLIDATED STATEMENT OF CHANGES IN SHAREHOLDERS´ EQUITY FROM 01.01.2013 TO 31.03.2013
Capital stock
in EUR in EUR in EUR in EUR in EUR in EUR
as of 01.01.2012 48,077,900 6,531,924 -1,662,267 41,298,123 4,227,928 98,473,608Assignment to retained profits / accumulated losses brought forw ard 0 0 0 4,227,928 -4,227,928 0
Dividends 0 0 0 -4,807,790 0 -4,807,790
Overall result 0 0 0 0 0 0
- Cash Flow Hedge 0 0 0 0 0 0
Tax 0 0 0 0 0 0- Actuarial profit / loss from defined benefit pension plans 0 0 -1,950,521 0 0 -1,950,521
Tax 0 0 601,149 0 0 601,149
- Consolidated income 0 0 0 0 1,143,063 1,143,063
0 0 -1,349,372 0 1,143,063 -206,309
as of 31.12.2012 48,077,900 6,531,924 -3,011,639 40,718,261 1,143,063 93,459,509
as of 01.01.2013 48,077,900 6,531,924 -3,011,639 40,718,261 1,143,063 93,459,509Assignment to retained profits / accumulated losses brought forw ard 0 0 0 969,744 -969,744 0
Dividends 0 0 0 0 0 0
Overall result 0 0 0 0 0 0
- Cash Flow Hedge 0 0 0 0 0 0
Tax 0 0 0 0 0 0- Actuarial profit / loss from defined benefit pension plans 0 0 -400,281 0 0 -400,281
Tax 0 0 62,938 0 0 62,938
- Consolidated income 0 0 0 0 -3,956,351 -3,956,351
0 0 -337,343 0 -3,956,351 -4,293,693
as of 31.03.2013 48,077,900 6,531,924 -3,348,982 41,688,005 -3,783,032 89,165,815
Profits/losses brought forw ard
Total equityCapitalreserves
Retainedearnings
Net incomefor year
14 NOTES
NOTES SELECTED NOTES TO THE CONSOLIDATED FINANCIAL STATEMENTS AS OF MARCH 31, 2013 Accounting policies The consolidated financial statements of the HANSA GROUP AG as reporting group parent dated March 31, 2013 have been compiled in abbreviated form pursuant to IAS 34, the same accounting principles as in prior financial reports were applied. Section 315a HGB [German Commercial Code] was applied in accordance with the principles of the International Financial Reporting Standards (IFRS) issued by the International Accounting Standards Board (IASB), which are applicable at the balance sheet date, as they were adopted by the EU, and the special provisions of the German Stock Corporation Act (AktG). Prior- year figures have been calculated on the same principles. Of the standards to be applied for the first time from January 1, 2013, the following are particularly relevant within the scope of interim reporting: In May 2011 the IASB issued the new standard IFRS 13 “Fair Value Measurement”. IFRS 13 con-tains a definition of fair value and rules on how to determine if other IFRS standards require fair value measurement. The standard itself does not prescribe in which cases fair value is to be used. With the exception of the standards explicitly ex-cluded in IFRS 13, IFRS 13 defines standard disclosure requirements for all assets and liabili-ties that are measured at fair value, as well as for all assets and liabilities for which disclosure of fair value in the notes to the consolidated financial statements is required. In particular, it widens the disclosure requirements for non-financial assets. The amended standard must be applied to fiscal years starting on or after January 1, 2013, while earlier application is permitted. Comparative in-formation is not required in the first year of appli-cation.
The first-time application of the standard within the scope of interim reporting did not lead to additional disclosures. The carrying amounts for financial assets and liabilities each correspond to the fair value of the reported assets and liabilities. In June 2011 the IASB issued amendments to IAS 1 “Presentation of Financial Statements” under the title “Presentation of Items of Other Comprehen-sive Income”. The amendments require a classifi-cation of items presented in other comprehensive income into items that might subsequently be reclassified to the income statement and items that will not. At HANSA GROUP AG, only items that will not subsequently be reclassified to the income state-ment are recognized in other comprehensive in-come; this situation is clarified by a disclosure in the presentation of other comprehensive income.. In June 2011 the IASB issued amendments to IAS 19 “Employee Benefits”. The amendments mainly concern the elimination of deferred recognition of actuarial gains and losses (corridor method) in favor of immediate recognition in other compre-hensive income in equity, the presentation of changes to net liabilities/assets under defined benefit pension plans, and the recognition of a net interest expense or income resulting from net liabilities or assets of a pension plan. Furthermore, additional disclosures regarding the characteristics of pension plans and the associated risks for the entity are required. The amendment may also impact the accounting of contributions to partial retirement obligations. The amendments to IAS 19 must be applied to fiscal years starting on or after January 1, 2013.

NOTES 15
The first-time application of the standard within the scope of interim reporting did not lead to additional disclosures. The IASB published amendments to IAS 7 “Finan-cial Instruments” in December 2011. The amend-ment creates new financial instruments disclosure requirements to improve comparability with US-GAAP financial statements. The amended stand-ard must be applied to fiscal years starting on or after January 1, 2013. As of March 31, 2013, with regard to the interim financial statement, this applies to positions of derivative financial instruments. Those were val-ued, unchanged to the year end accounts, based on external information from financial institutions. Measurement is performed on the basis of meas-urement methods, of which the influencing factors used, are derived directly or indirectly from ob-served market data. Compared to December 31, 2012, only minor changes did occur. The interim financial statements and management report were not audited or reviewed. Various items of the Group balance sheet and Group income statement have been merged, in order to enhance clarity. The Group income statement has been prepared using the total cost (nature of expense) method. HANSA GROUP AG and its fully consolidated subsidiaries use the calendar year as their fiscal years. The Group Annual Financial Statement has been prepared in euro. All amounts, including figures for prior years, are stated in thousand euro unless otherwise indicated.
Scope of consolidation As of March 31, 2013, the scope of consolidation is unchanged from the end of 2012 and includes the following companies:
Nr. Company held by
Share of capital
earnings in %
01 HANSA GROUP AG, Genthin
02 Chemische Fabrik WIBARCO GmbH, Ibbenbüren 01 100.0
03 WASCHMITTELWERK GENTHIN GmbH, Genthin 01 100.0
04 LUHNS GmbH, Wuppertal 01 100.0
05 LUHNS France SARL, Sarreguemines, Frankreich 04 100.0
Net assets HANSA GROUP AG's net assets on March 31, 2013 decreased by 3,288 thousand euro, from 242,688 thousand euro on December 31, 2011 to 239,400 thousand euro. The changes mainly per-tain to regular depreciation and amortization. In consideration of the sum of current and non-current values, HANSA GROUP AG's other re-ceivables and assets increased by 321 thousand euro from 63,838 thousand euro on December 31, 2012 to 64,159 thousand euro.
16 NOTES
HANSA GROUP AG's trade receivables on March 31, 2013 increased by 261 thousand euro, from 44,083 thousand euro on December 31, 2012 to 43,822 thousand euro. Cash and cash equivalents of HANSA GROUP AG on March 31, 2013 declined by 9,902 thou-sand euro from 22,126 thousand euro on Decem-ber 31, 2012 to 12,224 thousand euro. Equity and liabilities The fully subscribed capital stock of HANSA GROUP AG remained unchanged at 48,078 thou-sand euro as of March 31, 2013 and is divided into 48,077,900 no-par value bearer shares. All shares are ordinary shares, each conferring one voting right. Developments in the Group’s equity can be seen in the separately presented consolidated state-ment of changes in shareholders’ equity, which is included in the consolidated financial statements. Financial liabilities decreased by 1,077 thousand euro from 118,469 thousand euro on December 31, 2012 to 117,392 thousand euro mainly through scheduled repayments.Some financial liabilities are at a fixed rate of interest, while others have a variable interest rate. Interest is charged at market rates. The increase in other current provisions of 696 thousand euro on March 31, 2013 from 2,606 thousand euro to 3,302 thousand euro was chiefly the result of the allocation of provisions of out-standing invoices and interest. Other liabilities declined by 908 thousand euro as of the reporting date, from 30,133 thousand euro to 29,225 thousand euro.
Operational result HANSA Group generated 95,394 thousand euro in sales in the first three months of 2013, corre-sponding to a year-on-year drop of 7.1 percent (prior year: 102,638 thousand euro). Intra-Group sales totaled 61,284 thousand euro compared to 44,260 thousand euro in the prior-year period. Earnings before interests and taxes as of March 31, 2013 amount to – 2,925 thousand euro mean-ing - 6,414 thousand euro compared to last year´s 3,489 thousand euro. At 1,466 thousand euro, other operating income in the first quarter of 2013 came in at the same level as the previous year (1,280 thousand euro). Material expenses in the period to March 31, 2013 amounted to 75,077 thousand euro, down 5,331 thousand euro on the prior-year period (80,408 thousand euro). Personnel expenses decreased by 642 thousand euro year on year in the first quarter of 2013 from 8,701 thousand euro to 8,058 thousand euro. This is due to the sale of parts of the chemicals trading business in the fourth quarter of 2012 and the associated reduction in the HANSA GROUP AG headcount. As of March 31, 2013, the Group employed 515 people (March 31, 2012: 600) (of whom 314 in-dustrial workers and 201 clerical workers; previous year: 343 industrial workers and 257 clerical workers) as well as two Management Board members (previous year: 3) and 28 apprentic-es/trainees (previous year: 30). Other operating expenses went down by 12 per-cent to 13,917 thousand euro compared to 15,806 thousand euro in the prior-year period.

NOTES 17
In absolute figures, this amounts to a decrease of 1,889 thousand euro. Depreciation and amortization amounted to 3,314 thousand euro and decreased by 643 thousand euro year on year (2,671 thousand euro). Notes to the cash flow statement The cash flow statement has been drafted in con-formity to the provisions of IAS 7 and structured on the basis of the cash flows from operating, investment and financing activities. The effects of consolidation changes and exchange rate fluctua-tions on cash and cash equivalents are shown separately. The cash flow for ongoing business is firstly de-rived in the cash flow statement, in order to pre-sent operational business activity congruently with the balance sheet and the income statement. Occurrences of note after the balance sheet key date After the balance sheet date no significant events occurred which had a significant impact on the Group’s results of operations, financial position and net assets. Segment reporting The internal organizational and management structure, in combination with internal reporting to the Management Board and the Supervisory Board, provide the basis for definition of segmen-tation criteria at HANSA GROUP AG. Segmentation is performed, in line with internal reporting, by product line. At the beginning of Q1 2013, we reorganized our segments according to the new orientation of HANSA Group with the focus on chemicals pro-duction and the manufacture of care chemicals.
Value creation at the Group is now organized into two business areas: Chemicals and Consumer Product, which can be defined as follows: In the Chemicals segment, we manufacture sur-factant feed materials, intermediate chemical products and surfactants. We produce primary and intermediate surfactant products, such as linear alkyl benzene (LAB) at our Ibbenbüren site through our subsidiary WIBARCO. Any primary or intermediate surfactant products that we do not use for our own production needs are sold to cus-tomers in the chemicals industry. Our subsidiary WASCHMITTELWERK GENTHIN has an important function as an interface within HANSA Group. Through this subsidiary, we manu-facture surfactants as feed materials as well as liquid detergents, household products and body care products on behalf of brand manufacturers and trade organizations. WASCHMITTELWERK GENTHIN serves both segments and seizes the synergies that already exist between these busi-ness areas. In the Consumer Products segment, we focus on producing detergents, cleaning agents and body care products in liquid form. Our subsidiary LUHNS manufactures the majority of its products for global trading corporations, which then market them under their own respective brands. Further-more, in Genthin we also offer contract production on behalf of third parties.
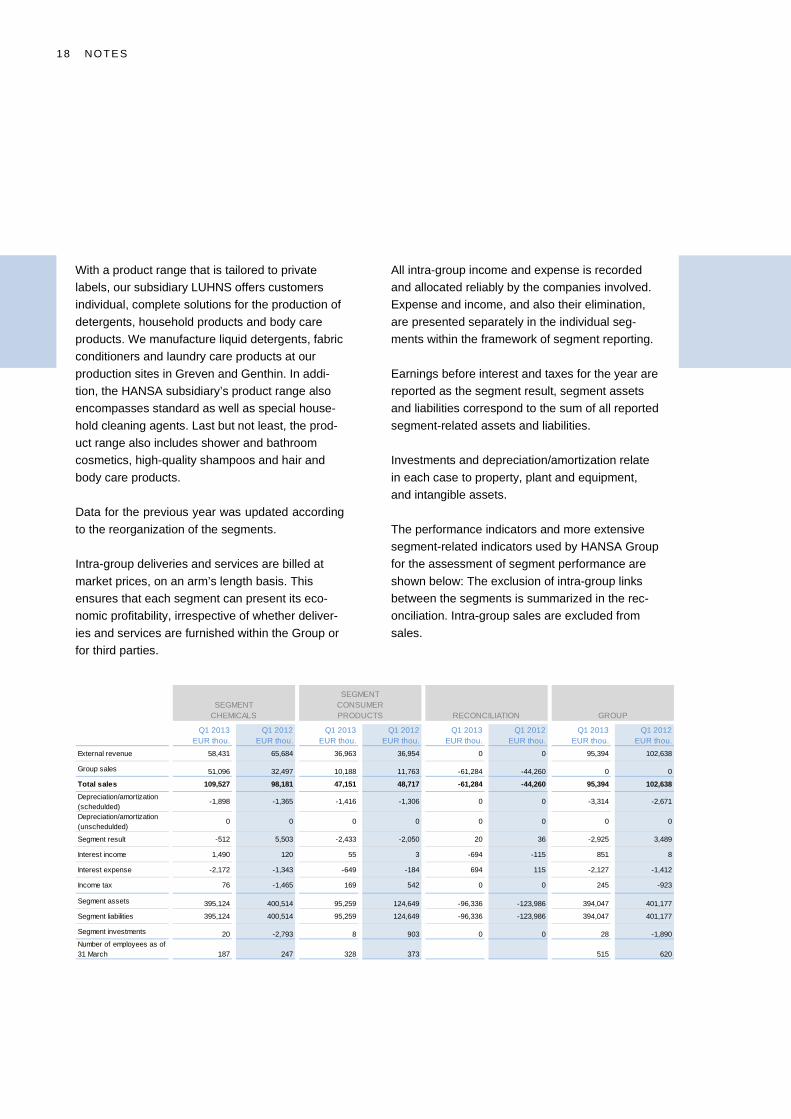
18 NOTES
With a product range that is tailored to private labels, our subsidiary LUHNS offers customers individual, complete solutions for the production of detergents, household products and body care products. We manufacture liquid detergents, fabric conditioners and laundry care products at our production sites in Greven and Genthin. In addi-tion, the HANSA subsidiary’s product range also encompasses standard as well as special house-hold cleaning agents. Last but not least, the prod-uct range also includes shower and bathroom cosmetics, high-quality shampoos and hair and body care products. Data for the previous year was updated according to the reorganization of the segments. Intra-group deliveries and services are billed at market prices, on an arm’s length basis. This ensures that each segment can present its eco-nomic profitability, irrespective of whether deliver-ies and services are furnished within the Group or for third parties.
All intra-group income and expense is recorded and allocated reliably by the companies involved. Expense and income, and also their elimination, are presented separately in the individual seg-ments within the framework of segment reporting. Earnings before interest and taxes for the year are reported as the segment result, segment assets and liabilities correspond to the sum of all reported segment-related assets and liabilities. Investments and depreciation/amortization relate in each case to property, plant and equipment, and intangible assets. The performance indicators and more extensive segment-related indicators used by HANSA Group for the assessment of segment performance are shown below: The exclusion of intra-group links between the segments is summarized in the rec-onciliation. Intra-group sales are excluded from sales.
Q1 2013 Q1 2012 Q1 2013 Q1 2012 Q1 2013 Q1 2012 Q1 2013 Q1 2012EUR thou. EUR thou. EUR thou. EUR thou. EUR thou. EUR thou. EUR thou. EUR thou.
External revenue 58,431 65,684 36,963 36,954 0 0 95,394 102,638
Group sales 51,096 32,497 10,188 11,763 -61,284 -44,260 0 0
Total sales 109,527 98,181 47,151 48,717 -61,284 -44,260 95,394 102,638Depreciation/amortization (schedulded)
-1,898 -1,365 -1,416 -1,306 0 0 -3,314 -2,671
Depreciation/amortization (unschedulded)
0 0 0 0 0 0 0 0
Segment result -512 5,503 -2,433 -2,050 20 36 -2,925 3,489
Interest income 1,490 120 55 3 -694 -115 851 8
Interest expense -2,172 -1,343 -649 -184 694 115 -2,127 -1,412
Income tax 76 -1,465 169 542 0 0 245 -923
Segment assets 395,124 400,514 95,259 124,649 -96,336 -123,986 394,047 401,177
Segment liabilities 395,124 400,514 95,259 124,649 -96,336 -123,986 394,047 401,177
Segment investments 20 -2,793 8 903 0 0 28 -1,890Number of employees as of 31 March 187 247 328 373 515 620
GROUPSEGMENT
CHEMICALS
SEGMENTCONSUMER PRODUCTS RECONCILIATION
NOTES 19
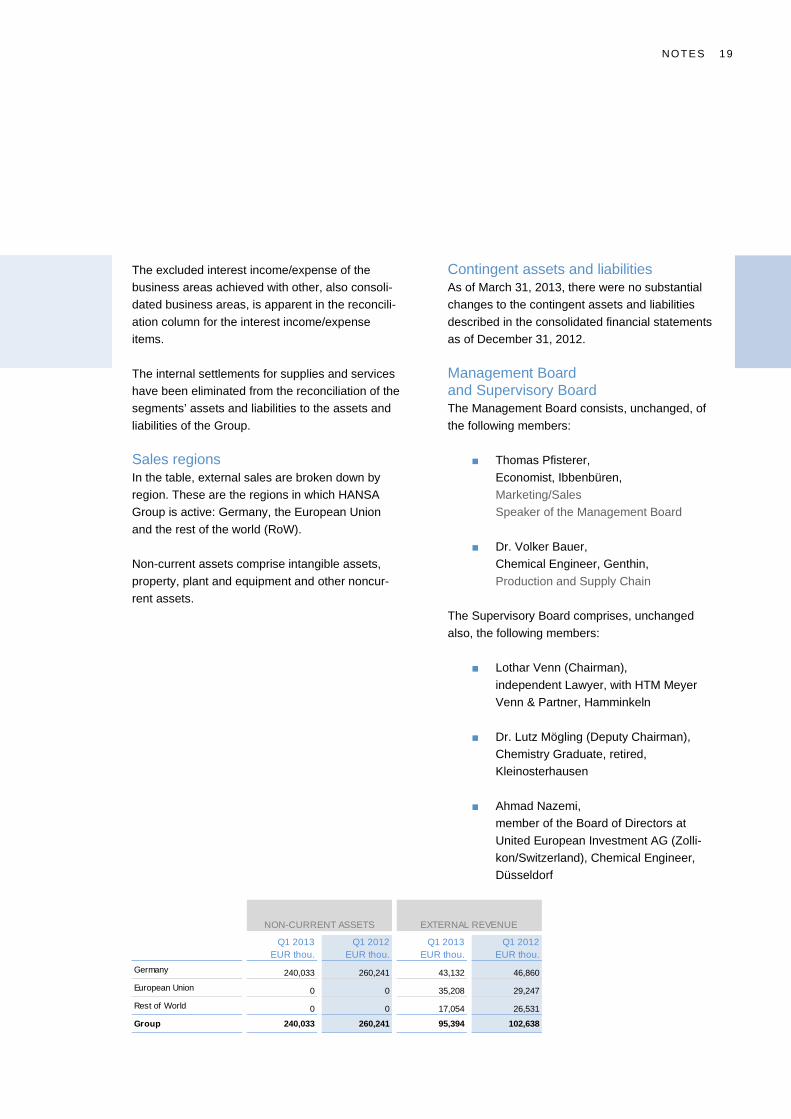
The excluded interest income/expense of the business areas achieved with other, also consoli-dated business areas, is apparent in the reconcili-ation column for the interest income/expense items. The internal settlements for supplies and services have been eliminated from the reconciliation of the segments’ assets and liabilities to the assets and liabilities of the Group. Sales regions In the table, external sales are broken down by region. These are the regions in which HANSA Group is active: Germany, the European Union and the rest of the world (RoW). Non-current assets comprise intangible assets, property, plant and equipment and other noncur-rent assets.
Contingent assets and liabilities As of March 31, 2013, there were no substantial changes to the contingent assets and liabilities described in the consolidated financial statements as of December 31, 2012. Management Board and Supervisory Board The Management Board consists, unchanged, of the following members:
■ Thomas Pfisterer, Economist, Ibbenbüren, Marketing/Sales Speaker of the Management Board
■ Dr. Volker Bauer,
Chemical Engineer, Genthin, Production and Supply Chain
The Supervisory Board comprises, unchanged also, the following members:
■ Lothar Venn (Chairman), independent Lawyer, with HTM Meyer Venn & Partner, Hamminkeln
■ Dr. Lutz Mögling (Deputy Chairman),
Chemistry Graduate, retired, Kleinosterhausen
■ Ahmad Nazemi, member of the Board of Directors at United European Investment AG (Zolli-kon/Switzerland), Chemical Engineer, Düsseldorf
Q1 2013 Q1 2012 Q1 2013 Q1 2012EUR thou. EUR thou. EUR thou. EUR thou.
Germany 240,033 260,241 43,132 46,860
European Union 0 0 35,208 29,247
Rest of World 0 0 17,054 26,531
Group 240,033 260,241 95,394 102,638
NON-CURRENT ASSETS EXTERNAL REVENUE

20 NOTES
Related party disclosures In addition to the subsidiaries included in the con-solidated financial statements, Chemische Fabrik WIBARCO GmbH, Ibbenbüren, Waschmittelwerk Genthin GmbH, Genthin, LUHNS GmbH, Wupper-tal and LUHNS France SARL, Sarreguemines, HANSA GROUP AG, in carrying out its ordinary business activities, maintained indirect or direct relationships with related parties. Added to this, related parties in accordance with IAS 24 are Hansa Trust International AG, its sub-sidiaries and related parties as well as the Super-visory and Management Boards of HANSA GROUP AG. As before, all transactions with relat-ed parties were carried out at arm's length on the basis of international comparable controlled price methods in accordance with IAS 24. Hansa Trust International AG’s direct shareholding in HANSA GROUP AG remained at 17.8 percent as of March 31, 2013. United European Investment AG held 25.02 percent. Hansa Trust International AG therefore unchanged held a total of 42.82 percent of voting rights (indirectly and directly) in HANSA GROUP AG as of March 31, 2013, making it the ultimate parent company in accordance with IAS 24. As the contract landscape and the conditions for supplies and services as of March 31, 2013 re-main unchanged to those reported as of Decem-ber 31, 2012, we only specify the balances of accounts receivables and liabilities between the companies on the balance sheet date. Prepayments by Savanna AG, Zurich, a Hansa Trust International AG subsidiary, for deliveries in an amount of 16,948 thousand euro and liabilities of 2,226 thousand euro existed as of the balance sheet date March 31, 2013. LUHNS GmbH’s re-ceivables of 6,258 thousand euro existed vis-à-vis Savanna AG as of March 31, 2013.
Receivables of LUHNS GmbH to United European Investment AG as of March 31, 2013 amounted to 4,467 thousand euro, liabilities to 67 thousand euro. As of March 31, 2013, LUHNS GmbH’s liabilities to Florin Immobilienverwaltungs AG & Co KG I, an associated company of Savanna AG, amounted to 52 thousand euro. Receivables as of the reporting date amounted to 0 thousand euro. As of March 31, 2013, LUHNS GmbH’s receiva-bles from Florin Immobilienverwaltungs AG & Co KG II, an associated company of Savanna AG, amounted to 118 thousand euro. Liabilities as of the reporting date amounted to 0 thousand euro. As at March 31, 2013, HANSA GROUP AG had outstanding liabilities to the HTM Meyer Venn & Partner, partnership of attorneys, tax consultants and auditors in the amount of 0 thousand euro. There are no other reportable relations with relat-ed parties in the sense of IAS 24 Genthin, May 31, 2013 HANSA GROUP AG The Management Dr. Volker Bauer Thomas Pfisterer
STA TEME NT BY LEGAL REPRESENTA TI VES 21
STATEMENT BY LEGAL REPRESENTATIVES We assure to the best of our knowledge that, in accordance with all applicable accounting principles for interim reporting, the Interim Consolidated Financial Report conveys a picture that corresponds to the actual state of the assets, finances, and earnings of the Group. Furthermore, the Interim Consolidated Financial Report rep-resents the business development including the business result and the state of the Group in such a fashion that it conveys a picture that corresponds to the actual situation. In addition, the report describes the major opportunities and risks of the probable development of the Group for the remainder of the business year. Genthin, May 31, 2013 HANSA GROUP AG The Management Dr. Volker Bauer Thomas Pfisterer

22 CONTACT / PUBLI SHI NG DETA I LS
CONTACT / PUBLISHING DETAILS Contact HANSA GROUP AG Fritz-Henkel-Str. 8 D-39307 Genthin Germany Tel.: +49 (0)203 73804-0 Fax: +49 (0)203 73804-999 Publishing Details Editorial Office HANSA GROUP AG Layout/Typesetting *elftraud* Edi Berentzen, Hamburg Photography / Picture Copyrights HANSA GROUP AG *elftraud* Edi Berentzen, Hamburg
HANSA GROUP AG Fritz-Henkel-Str. 8 D-39307 Genthin Tel.: +49 (0)203 73804-0 Fax: +49 (0)203 73804-999 Email: [email protected] Internet: www.hansagroup.de