3. promoting agricultural growth - world...
TRANSCRIPT

38
3. PROMOTING AGRICULTURAL GROWTH Pakistan’s agricultural sector accounts for about 70 percent of rural household income and nearly one-quarter of national GDP. Raising agricultural productivity is thus crucial for rapid rural growth. This chapter begins with analyses of: total factor productivity in the sector; production constraints; potential for growth in output of major crops and livestock products; and pertinent agricultural technology issues. The next section examines the availability of water and the efficiency of its use for irrigation, which is the biggest constraint to production for much of Pakistan’s agriculture. The third section covers existing agricultural markets and trade policies, which are crucial if productivity gains are to be translated into real income gains. The prospects for raising real incomes of the rural poor through agricultural growth are analyzed in section four. The chapter concludes with a brief summary of the main implications for policy.
AGRICULTURAL PRODUCTION AND TECHNOLOGY
Annual agricultural growth in Pakistan averaged 3.7 percent over the roughly four decades from 1959-60 to 2001-2002, although there were wide year-to-year variations. Apart from a period of slow growth in the first half of the 1970s, average agricultural growth exceeded 3.2 percent annually in each quinquennium from 1960 to 2000, due in large part to high growth in the crop sector in the 1970s and 1980s as a result of Green Revolution technology (improved seeds, increased fertilizer use, and irrigation). However, the performance of agriculture (particularly the crop sub-sector), has suffered in recent years because of severe droughts in the country, as well as environmental factors (increased soil salinity and deteriorating groundwater quality). Pakistan’s agricultural sector grew at a modest rate of 2.6 percent per year from 1999-2000 to 2005-06, (0.3 percent per year on a per capita basis, Table 3.1). Real value added of major crops (wheat, basmati and other rice, cotton, sugar cane and maize), which accounted for about two-thirds of agricultural crop GDP, grew by 2.6 percent per year over the period. There have been substantial fluctuations in real crop GDP in recent years due largely to variations in water availability. For example, real crop income fell by 3.6 percent in 2005-06, after it rose by 17.8 percent the previous year due to a record cotton crop (production increased by 42 percent). Total crop GDP grew by 2.3 percent annually, almost entirely due to a 2.1 percent yearly increase in crop GDP/hectare, while the cropped area increased by only 0.2 percent per year. Livestock (which accounts for half of agricultural GDP) grew by an average of 3.5 percent per year (Figure 3.1). The rapid growth in output during the Green Revolution of the 1970s and 1980s was due both to a large expansion in inputs (seed, fertilizer, irrigation), as well as productivity. Major investments in land, and most importantly in the Pakistan context, in water supply, particularly in the form of tube wells facilitated increases in the net area sown.30 Non-factor input 30 Increases in cropping intensity, (net gross cultivated area divided by net area sown), through multiple-cropping were also made possible, in part, by increases in water availability. In Ali (2005), land use is defined in terms of net area sown, so increases in cropping intensity are captured mainly through increases in land and total factor productivity. In Ali and Byerlee 2002a, land use is measured as a flow variable, (the rental value of the land for a period). By this measure, land use rose rapidly over the past three decades, whereas the measured increase in land and total productivity is smaller.
39
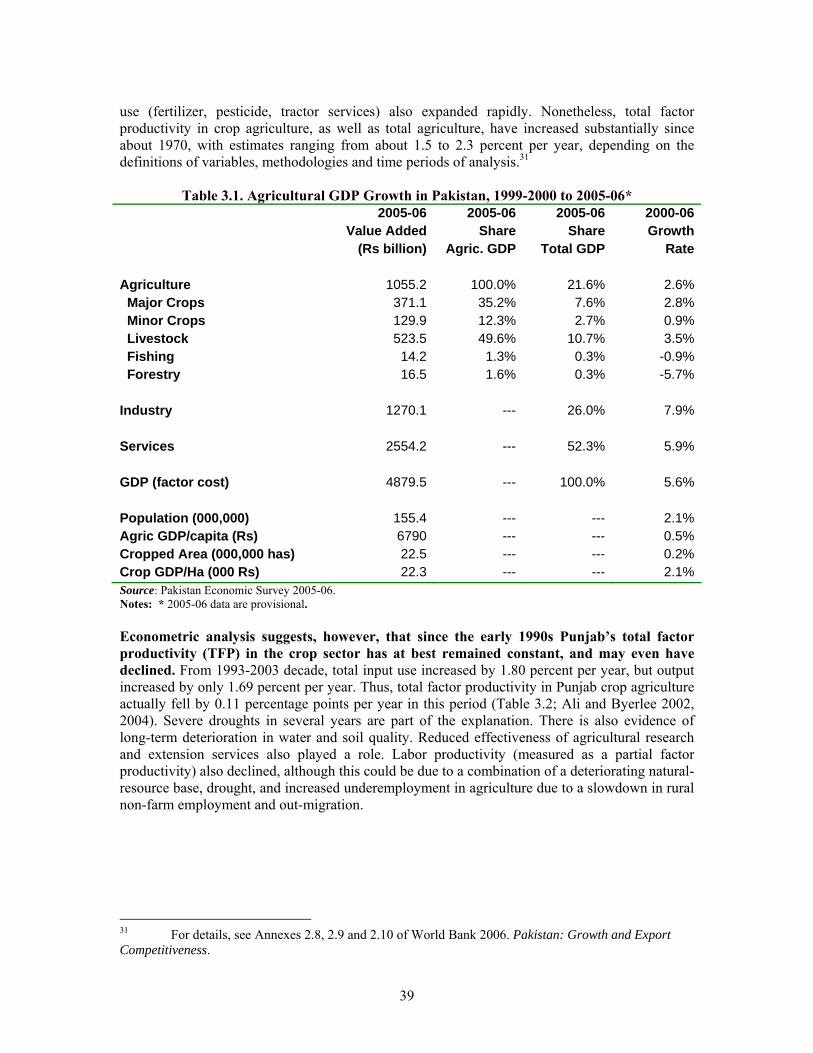
use (fertilizer, pesticide, tractor services) also expanded rapidly. Nonetheless, total factor productivity in crop agriculture, as well as total agriculture, have increased substantially since about 1970, with estimates ranging from about 1.5 to 2.3 percent per year, depending on the definitions of variables, methodologies and time periods of analysis.31
Table 3.1. Agricultural GDP Growth in Pakistan, 1999-2000 to 2005-06* 2005-06 2005-06 2005-06 2000-06 Value Added Share Share Growth (Rs billion) Agric. GDP Total GDP Rate Agriculture 1055.2 100.0% 21.6% 2.6% Major Crops 371.1 35.2% 7.6% 2.8% Minor Crops 129.9 12.3% 2.7% 0.9% Livestock 523.5 49.6% 10.7% 3.5% Fishing 14.2 1.3% 0.3% -0.9% Forestry 16.5 1.6% 0.3% -5.7% Industry 1270.1 --- 26.0% 7.9% Services 2554.2 --- 52.3% 5.9% GDP (factor cost) 4879.5 --- 100.0% 5.6% Population (000,000) 155.4 --- --- 2.1%Agric GDP/capita (Rs) 6790 --- --- 0.5%Cropped Area (000,000 has) 22.5 --- --- 0.2%Crop GDP/Ha (000 Rs) 22.3 --- --- 2.1%Source: Pakistan Economic Survey 2005-06. Notes: * 2005-06 data are provisional. Econometric analysis suggests, however, that since the early 1990s Punjab’s total factor productivity (TFP) in the crop sector has at best remained constant, and may even have declined. From 1993-2003 decade, total input use increased by 1.80 percent per year, but output increased by only 1.69 percent per year. Thus, total factor productivity in Punjab crop agriculture actually fell by 0.11 percentage points per year in this period (Table 3.2; Ali and Byerlee 2002, 2004). Severe droughts in several years are part of the explanation. There is also evidence of long-term deterioration in water and soil quality. Reduced effectiveness of agricultural research and extension services also played a role. Labor productivity (measured as a partial factor productivity) also declined, although this could be due to a combination of a deteriorating natural- resource base, drought, and increased underemployment in agriculture due to a slowdown in rural non-farm employment and out-migration.
31 For details, see Annexes 2.8, 2.9 and 2.10 of World Bank 2006. Pakistan: Growth and Export Competitiveness.

40
Figure 3.1. Real Agricultural GDP in Pakistan, 1989-90 to 2004-05
0
200
400
600
800
1000
1200
1989
-90
1990
-91
1991
-92
1992
-93
1993
-94
1994
-95
1995
-96
1996
-97
1997
-98
1998
-99
1999
-00
2000
-01
2001
-02
2002
-03
2003
-04
2004
-05P
(bn
1999
-00
rupe
es)
Agriculture Major Crops Minor Crops Livestock
Source: Pakistan Economic Survey 2005-06. Notes: P denotes provisional data
Table 3.2. Estimates of Total Factor Productivity Growth of Agriculture in Punjab, Pakistan
Crops Livestock Agriculture Output TFP TFP/Output TFP TFP Green Revolution, 1966-74 3.23 -1.38 -42.7% -0.38ns -1.04Input-Intensification, 1975-84 2.84 1.40 49.3% 0.71 1.37Post-Green Revolution, 1985-94 3.27 2.86 87.5% 3.29 3.51 Total Period, 1966-94 3.23 1.26 39.0% 1.25 1.51 1971-81 2.71 0.79 29.2% ---- ---- 1982-92 3.91 2.86 73.1% ---- ---- 1993-2003 1.69 -0.11 -6.5% ---- ---- 1971-2003 3.01 1.54 51.2% ---- ---- Source: Ali and Byerlee 2002, 2004. Notes: ns denotes not significantly different from zero. Data on output, input and TFP changes across agro-ecological zones in Punjab suggests that fluctuation in cotton yields is a major cause of the stagnation in overall TFP productivity in the crop sector. Output and TFP growth were highest in the 1982-92 period, (3.91 and 1.54 percent, respectively), a period in which output and TFP growth in the wheat-cotton cropping system were 5.10 and 3.96 percent, respectively. Yield growth of cotton in Punjab, overall, in this period was 9.29 percent per year (1981-90). By contrast, in the 1991-2002 period, cotton yields fell by 2.59 percent per year due to virus problems and poor weather. Improving cotton yields through better pest control and improved seeds would likely substantially add to overall TFP growth in Punjab (as well as in northern Sindh).

41
There are no detailed analyses of productivity growth in other provinces but available data suggest that water availability is the main constraint in Sindh. Wheat output in Sindh has fluctuated in tandem with water availability, particularly during the 1999-2000 to 2001-02 drought years. From 1972 to 1996, canal water releases in Sindh were negatively correlated with rainfall, thus stabilizing total water availability in the province. From 1995 to 2001, however, releases were positively correlated with rainfall, and remained essentially constant at about 50 MAF/year from 1995-98, which were years of normal rainfall, but fell to about 35 MAF in 1999-2001, years of protracted drought that reduced availability of canal water as well. Analysis of average water productivity in Sindh indicates that cereal yields are higher in areas of above average rainfall; however cereal yields are negatively correlated with the availability of canal water. In contrast, data for area under cultivation are positively correlated with both rainfall and availability of canal water.32 As a result, total production of cereals is not highly correlated with rainfall or canal water availability, except during the drought years of 1999-2000 to 2001-02 when wheat production fell by 23 percent relative to the 1996-97 to 1998-99 average. Nonetheless, there is evidence in Sindh of substantial inefficiency in water use. Net returns to irrigation water use vary widely across crops, which suggests that substantial savings in water would be possible by shifting away from water-intensive ordinary (non-aromatic) rice, which has a net income of 66 Rs/acre-inch and water use of 64 acre-inches, to cotton (with a net income of 361 Rs/acre-inch and water use of only 20 acre-inches), in areas with adequate drainage.
The Crop Sub-Sector
Cropping patterns vary across Pakistan depending on soil type and water availability. In the northern irrigated areas of Punjab, basmati rice is cultivated in the monsoon season (kharif), followed by wheat in the winter season (rabi). In southern Punjab and northern Sindh, cotton is the major kharif crop, typically followed by wheat. Further south, in southern Sindh, where drainage problems inhibit cotton cultivation and warm nighttime temperatures constrain wheat yields, ordinary (non-aromatic) rice is the major crop. Sugar cane, a long-duration, water-intensive crop, is grown almost exclusively on irrigated land. Non-irrigated areas, including hilly and mountainous regions of NWFP and Baluchistan, typically have more diverse cropping patterns that include wheat, maize and pulses. From 1990-91 to 2005-06, average grain yields continued to increase in Pakistan, albeit at rates below those of the 1980s. The fastest yield gains were those for maize, 4.7 percent per year and basmati rice, 3.6 percent annually (Table 3.3). Yields of wheat (the major crop in Pakistan in terms of both area cultivated—37 percent of total area cultivated in 2003-04 to 2005-06—and in terms of share of agricultural GDP, 14 percent in 2004-05) also increased, by an average of 2.2 percent per year. Yield growth for other crops was generally much slower. Yields of other food grains (mainly millet and sorghum) increased by only 0.6 percent per year; cotton yields increased by only 0.8 percent per year, and yields of sugar cane increased by only 0.9 percent per year.
32 See Damania, R., “Water and Agricultural Productivity in Sindh,” DRAFT, April 2005.
42
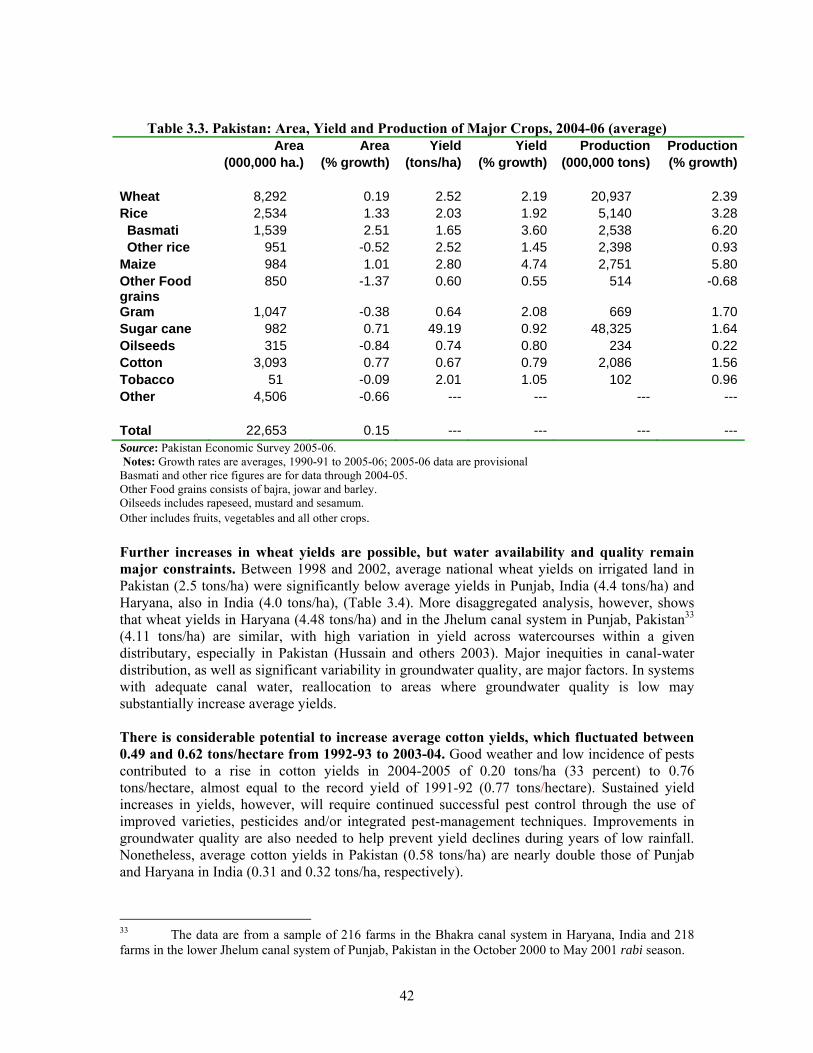
Table 3.3. Pakistan: Area, Yield and Production of Major Crops, 2004-06 (average)
Area Area Yield Yield Production Production (000,000 ha.) (% growth) (tons/ha) (% growth) (000,000 tons) (% growth) Wheat 8,292 0.19 2.52 2.19 20,937 2.39Rice 2,534 1.33 2.03 1.92 5,140 3.28 Basmati 1,539 2.51 1.65 3.60 2,538 6.20 Other rice 951 -0.52 2.52 1.45 2,398 0.93Maize 984 1.01 2.80 4.74 2,751 5.80Other Food grains
850 -1.37 0.60 0.55 514 -0.68
Gram 1,047 -0.38 0.64 2.08 669 1.70Sugar cane 982 0.71 49.19 0.92 48,325 1.64Oilseeds 315 -0.84 0.74 0.80 234 0.22Cotton 3,093 0.77 0.67 0.79 2,086 1.56Tobacco 51 -0.09 2.01 1.05 102 0.96Other 4,506 -0.66 --- --- --- --- Total 22,653 0.15 --- --- --- --- Source: Pakistan Economic Survey 2005-06. Notes: Growth rates are averages, 1990-91 to 2005-06; 2005-06 data are provisional Basmati and other rice figures are for data through 2004-05. Other Food grains consists of bajra, jowar and barley. Oilseeds includes rapeseed, mustard and sesamum. Other includes fruits, vegetables and all other crops. Further increases in wheat yields are possible, but water availability and quality remain major constraints. Between 1998 and 2002, average national wheat yields on irrigated land in Pakistan (2.5 tons/ha) were significantly below average yields in Punjab, India (4.4 tons/ha) and Haryana, also in India (4.0 tons/ha), (Table 3.4). More disaggregated analysis, however, shows that wheat yields in Haryana (4.48 tons/ha) and in the Jhelum canal system in Punjab, Pakistan33 (4.11 tons/ha) are similar, with high variation in yield across watercourses within a given distributary, especially in Pakistan (Hussain and others 2003). Major inequities in canal-water distribution, as well as significant variability in groundwater quality, are major factors. In systems with adequate canal water, reallocation to areas where groundwater quality is low may substantially increase average yields. There is considerable potential to increase average cotton yields, which fluctuated between 0.49 and 0.62 tons/hectare from 1992-93 to 2003-04. Good weather and low incidence of pests contributed to a rise in cotton yields in 2004-2005 of 0.20 tons/ha (33 percent) to 0.76 tons/hectare, almost equal to the record yield of 1991-92 (0.77 tons/hectare). Sustained yield increases in yields, however, will require continued successful pest control through the use of improved varieties, pesticides and/or integrated pest-management techniques. Improvements in groundwater quality are also needed to help prevent yield declines during years of low rainfall. Nonetheless, average cotton yields in Pakistan (0.58 tons/ha) are nearly double those of Punjab and Haryana in India (0.31 and 0.32 tons/ha, respectively).
33 The data are from a sample of 216 farms in the Bhakra canal system in Haryana, India and 218 farms in the lower Jhelum canal system of Punjab, Pakistan in the October 2000 to May 2001 rabi season.

43
Table 3.4. Average Crop Yields in Pakistan and other Countries, 1997-98 to 2001-02
Wheat Rice Cotton Sugarcane Maize Haryana, India 3.99 2.53 0.32 55.74 2.23Punjab, India 4.39 3.40 0.31 60.96 2.49Gujarat, India 2.32 1.41 0.26 70.63 1.48Rajasthan, India 2.54 1.17 0.22 45.36 1.18Maharashtra, India 1.24 1.60 0.13 84.71 1.47 India (average, 5 states) 2.90 2.02 0.25 63.48 1.77India (natl. average) 2.67 1.96 0.21 69.95 2.23 Bangladesh 2.19 2.11 --- 40.51 2.98 Punjab, Pakistan 2.42 1.50 0.56 44.36 1.91 High yielda 2.57 1.86 --- Low yieldb 1.14 1.39 --- Sindh, Pakistan 2.51 2.82 0.67 56.8 0.55 High yielda 2.56 2.82 --- Low yieldb 1.26 --- --- All Pakistan 2.30 1.94 0.58 47.47 1.72 High yielda 2.52 2.50 --- Low yieldb 1.00 1.42 --- Pakistan/India 86.1% 98.9% 278.0% 67.9% 77.0%Punjab Pak/Punjab Ind 55.0% 44.1% 180.6% 72.8% 76.7%Source: India data from CMIE data files; Bangladesh (BBS); Pakistan MINFAL; authors’ calculations. Notes: a High yield wheat figures are for irrigated wheat; high yield rice figures are for ordinary rice. b Low yield wheat figures are for non-irrigated wheat; low yield rice figures are for basmati rice. The most promising strategy for raising agricultural crop incomes in the future, however, is diversification into higher value crops that can maximize returns to scarce factors of production (land and water). Domestic demand for these products will continue to rise rapidly as incomes increase and diets become more diversified, provided marketing channels function efficiently. Capturing these opportunities will require greater investment in agricultural research for higher value crops such as oilseeds,34 vegetables, fruits and livestock; better coordination between research, extension and the private sector through public-private partnerships; and improvements in seed certification and quality control (Box 3.1). Pakistan is also well-positioned to compete in expanding export markets for citrus, dates and other fruits, particularly in the Middle East. Although production has stagnated in recent years, exports of higher-quality kinnos (a type of orange) have increased sharply. This export development has been private sector-led: all marketing of kinnos for export is done through sales to brokers or directly to factories, rather than through the domestic wholesale market. To ensure
34 As mentioned below, oilseeds production already benefits from trade protection of processed vegetable oil. Increases in productivity and improved marketing could potentially make vegetable oil from domestic oilseeds competitive with imported vegetable oil even without trade protection, however.

44
Box 3.1: India’s National Agricultural Innovation Project
The National Agricultural Innovation Project (NAIP) is a US $250 million Government of India project (with $50 million in financing from the World Bank) designed to help transform India’s agricultural research and development efforts from their traditional focus on food self-sufficiency to a more market-oriented approach aimed at poverty alleviation and income generation. In the last ten years the Indian agricultural sector has undergone considerable change. National food self-sufficiency has been achieved and market demand for fruits, vegetables, meat, eggs, fish, milk, sugar, and edible oils has increased and is encouraging diversification of production. Given that there is limited scope for expansion of area cultivated, enhanced productivity, profitability, and competitiveness will be the main sources of future agricultural growth. While agricultural development has long been supply oriented, its future will be more market driven. The challenge for Indian agriculture is to increase profitability, competitiveness and income earning capacity in a market-driven system for the 200 million poor people dependant on agriculture for their livelihoods. Activities. NAIP will support the development and implementation of agricultural innovations through collaboration among farmers, the private sector, civil society, and public-sector organizations. The project will be implemented from 2006 through 2012 and is designed around the four components.
• Indian Council for Agricultural Research (ICAR) as the catalyzing agent for management of change in the Indian National Agricultural Research System (NARS): ICAR has to provide leadership and empower the NARS and the expanding group of research providers to adapt to emerging challenges. Through this component the ICAR system will also increase its capacity for dialogue and interaction.
• Research on production to consumption systems: The specific objective of this
component is to establish market-oriented collaborative research for sustainable improvement of selected agricultural production to consumption systems, in recognition of the growing importance of the market.
• Research on sustainable rural livelihood security: The core objective of this
component is the sustained improvement of incomes and well-being of farm families that have been left behind in development.
• Basic and strategic research in the frontier areas of agricultural science: This component is intended to strengthen the capacity of Indian NARS to participate at the forefront of science, in recognition of the need to develop capacity for solving the problems of tomorrow and the need to be a global leader in the field of agricultural research.
NAIP is open to all Indian scientific organizations and will actively engage the private sector, farmer organizations and NGOs in a series of large consortia (defined as “a formal group of likeminded partners that will carry on a given task by sharing a research agenda and research resources as per an agreed work plan”) principally selected through competitive processes. NAIP has put in place a series of support mechanisms to ensure that every organization interested to participate will be able to compete. Source: World Bank 2005e. India National Agricultural Innovation Project. Project Information Document (PID).

45
quality control, harvesting of kinnos for export is done by teams hired directly by brokers or factories. Currently, almost all kinnos grown for export are produced on large farms. Increasing the participation of small farmers in kinno production for export will likely require creation of some form of farmer organization to help achieve economies of scale in quality control and processing. Public support for research on varietal improvement, which would benefit all kinno farmers, may also be warranted. Faster growth in non-traditional agricultural exports (fruits and vegetables, meat, fish) will require improved capacity to meet Sanitary and Phytosanitary (SPS) standards imposed by importing countries. Pakistan has already faced restrictions on exports of its shrimp because of an inability to meet European Union SPS standards (Box 3.2). Quality and SPS standards issues are likely to be a major constraint on expansion of Pakistan’s high-value agricultural exports unless Pakistan develops and implements a coherent strategy (or set of strategies) for quality and SPS management. Organizationally, there is a need to remedy the fragmented, isolated, and non-coordinated capacity of SPS management institutions and regulations by better defining the roles and responsibilities of various agencies involved in SPS management, strengthening technical capacity for risk assessment, and re-institutionalizing early warning and surveillance systems for pests, diseases and contaminants.
Livestock and Poultry
The livestock sub-sector (cattle, dairy, sheep, goats, and poultry), which is dominated by small holders, accounts for half of agricultural GDP, (11 percent of total GDP), and is the fastest growing component of the agricultural sector. From 1989-90 to 2005-06, the average growth rate of the livestock sub-sector was 3.5 percent, outpacing official population growth of 2.0 percent. Because livestock ownership is more evenly spread across rural households than is land ownership or even access to land, productivity gains in livestock are generally more pro-poor than productivity gains of major crops.35 According to the 1996 Livestock Census, the majority of livestock holders are small farmers: 83 percent of households that owned cattle and/or buffaloes owned six or fewer animals. Moreover, there is an important gender dimension to the livestock sector, as rural women play a major role in the care of livestock.36 Production technology and constraints vary according to location and herd size. Households with only two or three animals typically use very few inputs and produce mainly to satisfy family needs. Households with four to six animals typically stall-feed their animals, and often add concentrates to the basic feed of green fodder and straw. This group accounts for the bulk of marketed milk supply. Rural commercial farms, including specialized dairy farms and mixed crop-livestock farms, typically have more than 40 animals, mostly buffaloes. Economies of scale and availability of adequate financial resources make it feasible to maintain breeding bulls on such farms. Peri-urban commercial dairy farms (gawala colonies) typically have herds of 15-50 animals, mostly buffaloes. These farms face relatively high fodder costs, but benefit from lower marketing costs and in some cases market directly to final consumers.
35 Simulation results suggest that, if multiplier effects on non-farm incomes are included, gains from a 10- percent increase in large livestock production (mainly cattle, goats and dairy products) raise total incomes of small farmers and landless agricultural households by about 10 percent (Dorosh, Niazi and Nazli, 2003). 36 See Ahmad, Asghar and Khan 1993.

46
Box 3.2: Food Quality and Safety Standards in Pakistan
Pakistan presently lacks a coherent strategy for quality SPS (sanitary and phytosanitary) management in relation to its trade. In the absence of a coherent national strategy, Pakistani firms currently pursue their own strategies, in many cases reacting to events and adopting defensive actions designed to limit potential damage that might ensue from non-compliance with standards. For example, Pakistan banned seafood exports to the EU in March 2005, a step intended to pre- empt a possible EU ban, and this resulted in losses estimated at between $10 and $40 million during the first months of the ban. Improving food quality and safety in fisheries, horticulture, and meat/livestock is a high priority for Pakistan’s export competitiveness. In place of the existing fragmented, isolated, and non-coordinated state of SPS management, a regulatory framework is needed to support Pakistan’s international trade objectives and obligations. This framework should:
4. Clearly define and delineate the roles and responsibilities of the different federal and provincial ministries and agencies with respect to SPS management;
5. Strengthen existing technical capacity to administer science-based SPS measures including risk assessment; and
6. (Re-)institutionalize early warning and/or surveillance systems for pests, diseases and contaminants.
In addition, the Consultative Group (CG) on WTO matters and its SPS Committee should be fully activated and a Task Force formed comprising a balanced cross-section of stakeholders.
Institutional changes and capacity-building activities are also needed. Recommended high priority actions for the short-term include:
7. Strategy and priority setting. Highlight SPS management constraints and issues, prioritize them and develop an action plan (short term, very high priority);
8. Raising awareness. Engage the private sector in dialogue on SPS management capacity issues and develop an SPS information system in the public domain (short-term);
9. Training on food-safety controls. Awareness-raising and training on Hazard Analysis and Critical Control Point (HACCP), Good Agricultural Practice (GAP), and Good Manufacturing Practice (GMP) in fish products, horticulture, meat and livestock sectors (short-term);
10. Implementation of food-safety controls. Implement and enhance food safety controls in slaughterhouses, fish processing plants, and pack-houses via awareness-raising, certification, surveillance, and auditing (short to medium-term);
11. Investment in hygiene facilities. Invest and upgrade hygiene facilities at Karachi Harbor (short to medium-term);
12. Support for implementation of standards. Provide support for implementation of HACCP, GAP, GMP and other standards throughout the supply chain through loans and matching grants (medium-term); and
13. Phytosanitary control measures. Raise awareness and provide training in practices for animal and plant health control including GAP, Integrated Crop Management (ICM) and Integrated Pest Management (IPM) (medium-term).
Source: World Bank Growth and Competitiveness Report 2006

47
Milk production is expanding especially rapidly, although most milk continues to be marketed through traditional channels. The supply of fresh milk increased at an average annual growth rate of 11.4 percent between 1971-72 and 2004-05, and by 6.6 percent between the two livestock censuses of 1986 and 1996. Increased tractor use for land preparation is one major factor that has driven increased milk production since the 1970s.37 Because fewer male buffaloes and bullocks are needed for draught purposes, herd composition has changed over time and available feed and fodder are increasingly used for female animals. The milk marketing system in Pakistan continues to be dominated by traditional channels that market unprocessed milk, which constitutes about 90 percent of total milk production. Non-traditional channels, which specialize primarily in marketing processed milk from commercial milk processing firms account for the remaining 10 percent of supply. Of total processed milk, approximately half, or five percent of total supply, is UHT (Ultra Heat Treatment) milk. The remainder is mainly open pasteurized milk sold at milk shops (SDI 2005). Significant productivity gains for small-holders are feasible through use of improved feeds, better veterinary services, and more efficient marketing channels to help ensure remunerative prices of milk for farmers. Multi-national firms have enjoyed some success in improving the efficiency of marketing channels, but this accounts for only about 10 percent of total milk consumption in Pakistan. One promising alternative mechanism for delivering the requisite technology as well as veterinary and marketing services to small farmers is through cooperatives such as the Idara-e-Kissan (IK), also known as Hala Dairy, a vertically integrated dairy cooperative (Box 3.3). The cooperative’s output is small relative to the total milk market, however, accounting for only about 0.2 percent of total milk production in Pakistan ( or about 2 percent of total pasteurized and UHT milk). The poultry sector, which accounts for about three percent of the livestock sector, value-added) is expanding rapidly and medium-term prospects are good, due to increased urbanization and rising per capita incomes. Total number of birds and egg production both more than doubled between 1990-01 and 2002-03, increasing by 135 and 145 percent, respectively. Production of maize, used mainly for poultry feed, grew by an annual average of 4.69 percent from 1990-91 to 2004-05; yields grew by an annual average 3.95 percent due to adoption of improved seeds.38 However, Pakistan needs to be prepared to contain outbreaks of poultry disease (including the Asian avian flu), as well as to provide improved general veterinary services. The timely flow of information regarding outbreaks of disease is crucial to facilitate government response, which may include mandatory culling of flocks in some areas to reduce spread of the disease. To encourage cooperation by farmers and to prevent poultry- owning households and firms from suffering major loss of income, some form of monetary compensation or credit may be necessary. However, as poultry and eggs supply a small share of total animal protein consumed in Pakistan—only 3.6 percent and 2.7 percent, respectively—the nutritional consequences of any outbreak would be limited.
37 A comparison of results from the 1986 and 1996 Livestock Censuses reveals that in the inter census period the number of bullocks reportedly used ‘for work’ declined 33.5%. Government of Pakistan, (1998). Livestock Census 1996. Punjab. Agriculture Census Organization Statistics Division. Gulberg, Lahore. 38 Production of maize is still only about one-tenth that of wheat, or 2.1 million tons as compared to 19.9 million tons (2003-05 averages).

48
Box 3.3: Idara-e-Kissan (Hala Dairy)
Idara-e-Kissan is a vertically integrated dairy cooperative with 20,164 members in 519 villages in Punjab (2004 figures). The cooperative is open to any livestock farmer in a target village that owns one buffalo or cow and is able to supply 300 liters of milk during a 6-month period. Unlike traditional cooperatives that own dairy farms, IK collects milk from thousands of geographically dispersed members. Milk is processed in one of the cooperative’s milk processing plants and marketed to urban consumers through retail outlets. The cooperative uses profits from its commercial operations to subsidize a package of veterinary and livestock extension services delivered to members through private contractors. In 2004, IK farms produced about 47 million liters of milk, about 0.2 percent of total milk production in Pakistan and about 2 percent of total pasteurized and UHT milk. According to a 2005 survey of 36 small dairy farmers (3-5 animals per farm) in the Kasur (IK farmers) and Okara (non-IK farmers) districts of Punjab, milk production by IK farmers was 25 percent higher than for non-IK member farms (Table 3.16). Two major factors account for the difference in productivity: higher-quality feed and better veterinary services. IK members fed their animals three times as much cotton seed cake per milk buffalo as did non-IK members. They also benefited from access to veterinary services provided through private contractors; IK farmers also utilized veterinary services at about twice the rate of non-IK farmers. Moreover, cooperative members’ satisfaction with these services was higher than non-members’ satisfaction with services provided to them by government agencies and the private sector. However, member farmers have not widely adopted other useful innovations promoted by the cooperative, such as balanced feed rations, improved fodder seed, non-traditional fodders, artificial insemination services, and hygienic practices to control disease. Improved market access is also key to the success of cooperative members. IK farmers received 13 percent higher prices for milk (which was priced according to fat content) than did non-IK members, who sold to local milk collectors (dhodis). Total revenue per milk buffalo for IK members was 38 percent higher than for non-members. Thus, despite their costs being 44 percent higher, IK cooperative members enjoyed 34 percent higher net returns per milk buffalo than did non-members (Rs 18,158 versus Rs 13,582), implying a marginal return on cash costs invested of about 112 percent. Sensitivity analysis of these results suggests that increasing market access for non-cooperative members, thereby raising both their milk prices and fodder costs by 20 percent would reduce the difference in net returns between the two groups to only 21 percent and reduce the marginal return on cash costs invested to about 93 percent. However, it must be noted the cooperative does not provide credit; members bear the higher feed costs themselves. However, for farmers without access to credit, higher input costs may hinder adoption of improved feeding practices. Source: Riaz 2006.

49
Table 3.5. Costs and Returns for Cooperative Dairy Production, Punjab 2005 IK vs. Non-IK IK farms Non-IK farms % differenceNumber of animal units 6.83 6.84 -0.1%Milk-buffaloes/farm 1.70 1.56 9.0% Per milk buffalo: Milk production (liters/year) 2,003 1,599 25.3%Price milk (Rs/liter) 14.58 12.85 13.5%Value of milk production (Rs) 29,209 20,548 42.2%Value of calves (Rs) 2,383 2,383 0.0%Total value of production (Rs) 31,592 22,931 37.8% Costs Fodder 8,116 6,669 21.7% Other feed 5,233 2,604 100.9% Health treatments 85 75 13.9% Total costs 13,434 9,348 43.7% Net returns/milk buffalo 18,158 13,582 33.7%Source: 2005 field survey of 36 farmers in Kasur (IK farmers) and Okara (non-IK farmers) districts, Punjab, as reported in Riaz 2006. Notes: IK denotes Idara-e-Kissan, a dairy cooperative that markets products under the product name “Hala Dairy.”
FACTORS OF PRODUCTION AND AGRICULTURAL INPUTS
Land Distribution and Productivity
Unequal land distribution is a major cause of income inequality in rural Pakistan. Returns to land are estimated to be about half of incomes (value added) from crop agriculture. However, according to the 2000 Agricultural Census, only 37 percent of rural households owned land, and 61 percent of these owned fewer than 5 acres (15 percent of total land). Two percent of households owned 50 acres or more, accounting for 30 percent of total land. The overall Gini coefficient of land ownership in 2000 in Pakistan was 0.66; if rural landless households are included, the Gini coefficient was 0.86. By comparison, Gini coefficients for land ownership are 0.71 in India, 0.42 in Bangladesh, and 0.85 in Brazil. As Pakistan’s rural population is rising, the number of small farms is increasing over time despite the total area under cultivation being essentially fixed, constrained by access to water). According to Agricultural Census data for 1990, 54.4 percent of farm households owned less than 5 acres (accounting for only 11.4 percent of total area), while 2.8 percent of households owned 50 acres or more (accounting for 34.0 percent of total land). By 2000, 61.2 percent of farm households owned less than 5 acres of land, (accounting for 14.8 percent of total farm area), and 2.0 percent farmers owned 50 or more acres, but these farms accounted for 29.7 percent of total area. In spite of the increase in the number of small farms, the overall Gini coefficient for land ownership in Pakistan remained approximately constant from 1972 to 2000 (Table 3.17).

50
Table 3.6. Distribution of Land Ownership in Pakistan 1972 1980 1990 2000 Gini Coefficient 0.66 0.65 0.66 0.66
% of landless households 62.0 63.3 % Share of Holdings <5 acres a. Households 47.3 n.a. 54.4 61.2 b. Land 5.4 n.a. 11.4 14.8 % Share of Holdings 50+ acres a. Households 3.3 n.a. 2.8 2.0 b. Land 22.4 n.a. 34.0 29.7 Source: Agriculture Census (various issues).
Most empirical evidence indicates that land productivity on large farms in Pakistan is lower than that of small farms, holding other factors constant. For example, plot-level regressions of productivity, correcting for plot characteristics and some household characteristics (such as tractor ownership and number of household workers) suggests a doubling of operated area leads to 10 percent lower wheat yields and 13 percent lower rice yields (World Bank 2002). Farm household income data also show that small farmers have higher net returns per hectare than do large farms. These findings suggest that increases in the share of land cultivated by small-holders would tend to increase overall farm productivity in Pakistan.39 Although, land sales markets are thin in Pakistan,40 land rentals in various forms are more common. According to 2001-02 HIES data, 33 percent of land cultivated in 2000 was under some form of tenancy arrangement; 18 percent was under share-cropping. Econometric evidence also suggests that tenure arrangements have a significant impact on productivity. Sharecropper productivity is about 20 percent lower than landowner productivity, holding other factors constant, because there is less incentive for sharecroppers’ own-labor inputs (Box 3.6). Though share-cropping is declining as a form of tenancy, the benefits it offers to share-croppers (shared financial risks of crop failure and credit for purchase of inputs) and landowners (greater owner input into management decisions) alike explain its persistence as a tenancy arrangement.
39 Econometric analysis of district-level data in Punjab indicates that districts with higher average farm size tend to have higher productivity than districts with smaller average farm size, however. See Ahmad (2002). 40 Land is rarely bought and sold, because high transactions costs, potential disputes about accuracy of land records, land prices in excess of the discounted value of potential agricultural earnings from the land, and lack of access to credit by those without land. The low frequency of land transactions helps perpetuate the highly unequal distribution of land, hampers labor mobility, and reduces returns to family labor.

51
Box 3.4. Land Tenancy and Productivity
Three major attempts at redistributive land reform in Pakistan have failed (the most recent was in 1977), and land reform has neither political support nor the backing of Islamic religious authorities. Because of these institutional constraints to traditional redistributive land reform, any attempt to increase access to land by poor households must involve a win-win approach. Land purchase schemes that include grant components for the poorest landless households are one option, though fiscal costs could limit the scale of such programs. Policy measures to increase access to land must also include: increased access to credit to enable poor households to purchase land, land taxation to minimize the holding of land for speculative purposes, and measures to improve the efficiency of land sales and rental markets. Administrative reform of enforcement of existing norms and regulations, including contracts and the rights of tenants, and the lifting of restrictions on rentals would also help improve the functioning of land markets. Simplification of complicated legal procedures that result in long processing delays and a backlog of cases would reduce land transactions costs. Poor households are at a particular disadvantage in cases brought before civil courts, as they often
Econometric analysis of the effects of tenancy suggest that the productivity of share-croppers that are relatively unsuperviseda is 18 percent less than productivity of supervised share-croppers and farmers who cultivate their own land.b Since only 19 percent of land in Pakistan is share-cropped, and an estimated 35 percent of tenants are relatively unsupervised, “unsupervised” tenants account for only about 7 percent of total area cultivated and the effect on total production of major crops is small, only 1.4 percent (Jacoby and Mansuri 2007). The lack of secure tenancy arrangements also has negative implications for productivity because it disincentivizes tenants to make long-term investments to improve land quality. Econometric analysis of PRHS 2001-02 data, (Jacoby and Mansuri 2006), shows that farmers used less manure on leased plots than on their own plots, reducing yields by about one percent in the first year and a cumulative total of 2-2.5 percent in subsequent years.c These effects on yields are relatively small, but they may be larger if there is a need for investment in such larger inputs as canal lining and tube wells. Productivity increases arising out of a shift from share-cropping to fixed rents could lead to substantial benefits for share-croppers; however this is of relatively small benefit for most of the rural poor. An 18 percent increase in productivity of small farm share-croppers resulting from a shift to fixed-rent tenancy would only increase average incomes of small-farm renters (11 percent of the rural population) by 3 percent. Since the size of this productivity shock is small relative to the rural economy, there are only minimal effects on the average incomes of other household groups, even accounting for linkage effects to the rural non-farm economy. Source: World Bank 2004b. Jacoby and Mansuri (2006, 2007). a In this study, tenants were considered to be unsupervised, if during the cropping season there were fewer than ten meetings between the tenant and landlord to discuss management of the plot. b Share-cropping arrangements benefit share-croppers by enabling them to share the risk of output fluctuations with the landlord, and also to share the costs of purchased inputs. However, they provide fewer incentives for labor input by the tenant, as output is shared, as well. c Application of manure increases yields, by providing additional soil nutrients and by improving soil structure, aeration, water retention, and ability to retain nutrients.

52
cannot afford to pursue these cases. Possible steps include: imposing limits on the number of appeals; introducing procedural reforms and alternative conflict resolution mechanisms; and removal of land revenue matters from the jurisdiction of civil courts. Improved information dissemination on land prices and transactions would also enhance efficiency of land markets. Improvements in land records41 could also enhance the efficiency of land markets and increase security of tenure. Without secure rights to their land, farmers not only have few incentives to invest, but also will devote fewer resources to defending their rights. Lack of secure title means landowners are less willing to risk renting out land, which in turn reduces access by landless households to land. In addition, banks are reluctant to lend money if land is used as collateral because they do not trust the current recording system. Uncertainty over the validity and enforceability of titles also makes it harder to buy and sell land. Computerization of land records, as tested in a recent pilot project in Punjab, is one option for establishing clearer land records and reducing fraudulent dealings by land administration officials.
Water Availability and Efficiency of Use
Irrigation water is critical for agriculture in most of Pakistan. Massive public investment in dams and canals in the Indus river basin, as well as mainly private investment in wells for groundwater irrigation have been essential for agricultural production. Nearly 80 percent of the cropped area is irrigated, and agriculture is by far the largest user of available water in the country, consuming on average about 95% of available water resources. Increases in water resource availability for irrigation and the expansion of irrigated areas have played a central role in agricultural growth since the 1960s. The total irrigated area increased by 80 percent between 1960 and 2005, from 10.4 to 18.8 million hectares, mainly due to an expansion in tube well irrigation. In 2004-05, 37 percent of irrigated land was irrigated solely with canal water, 41 percent was irrigated with canal and tube well water, and 18 percent solely with tube well water. Other forms of irrigation, such as wells, canals with wells and tanks accounted for the remaining four percent. About 60 percent of irrigated water available at farm head is provided by canal water; the remaining 40 percent is supplied by groundwater.42
Nearly 97% of irrigated areas are in the Indus basin, the largest contiguous irrigation system in the world. On average, approximately two-thirds of total net water in the Indus basin (102.0 in 147.5 million acre feet) is diverted to canals. Of this total, about 45 percent goes for consumptive use; the remainder is comprised of surplus flows to the estuary (29.4 MAF); system losses, including groundwater recharge (9.9 MAF) and Indus Treaty Allocations to India (8.4 MAF), (Table 3.7). In some recent years (2001-02 through 2003-04), however, total water flows in the Indus basin have been sharply curtailed by drought, reducing availability of water at the tail end of the system and limiting crop production, as well as necessary drainage (Figure 3.10). Kharif season water canal diversions were 3.8 MAF (6 percent) lower than the long-term average. Rabi season shortfalls fell much more sharply, by 11.8 MAF (33 percent). Surplus flows were
41 In Punjab, land disputes are primarily due to fraudulent dealing because the records are not clear and patwars (land administration officials) often accept informal payments. 42 Government of Pakistan Water Vision 2025 Country Report, cited in World Bank 2003a; Pakistan Public Expenditure Management, Accelerated Development of Water Resources and Irrigated Agriculture, Vol. II.

53
greatly affected in both seasons, falling by 95 percent in the kharif season and by 99 percent in rabi season.
Table 3.7. Seasonal Water Flows in the Indus River Basin, 1975-76 to 2003-04
Drought Years Drought Years Drought Years 1975-76 2000-01 Less - Average Flows to 2003-04 to 2002-03 Average Flows (as % of Average)INFLOW Western Rivers 140.65 106.02 -34.62 -25%Eastern Rivers* 6.85 1.11 -5.73 -84%Total Inflow** 147.49 107.14 -40.36 -27% OUTFLOW Indus Treaty Allocation 8.40 8.40 0.00 0%Canal Diversions 102.93 87.40 -15.53 -15% Kharif 66.81 63.05 -3.76 -6% Rabi 36.12 24.35 -11.77 -33%System Losses*** 1.24 9.65 8.41 678%Surplus flow 34.93 1.69 -33.23 -95% Kharif 32.77 1.67 -31.10 -95% Rabi 2.15 0.02 -2.13 -99%Total Outflow 147.49 107.14 -40.36 -27%Source: Pakistan Statistical Yearbook 2004-2005; Pakistan Water Sector Strategy October 2002; Ministry of Water and Power; WAPDA. Notes: Water flows are expressed in million acre feet (MAF). *Eastern Rivers Flows data available for 1991-2004, means calculated 1991-2001 and 1991-2004. **Total Inflow calculated as sum of Mean Western Rivers Inflow and Mean Eastern Rivers Inflow. ***System Losses calculated as Total Mean Outflow - Mean Indus Treaty Allocation - Mean Canal Diversions - Mean Surplus Flow. Current patterns of water use in Pakistan are causing significant environmental degradation: costs associated with loss of soil fertility due to agricultural soil degradation (soil salinity and erosion) are estimated at Rs 70 billion per year (1.5 percent of total GDP and 6.8 percent of agricultural GDP, based on 2004-05 GDP estimates). In addition to environmental losses, inefficient water use also leads to lower agricultural productivity and incomes. Problems related to seasonal water shortages are particularly acute at the tail end of distributaries throughout the system and at the tail end of the system as a whole (in southern parts of Sindh).43 Options to increase availability of irrigation water: There is little storage capacity downstream of the Mangla and Tarbela dams in northern Punjab or water control in Pakistan’s run of the river irrigation system. Adding storage capacity in the form of dams will in principle help increase availability of water in the dry season by spreading the flow of water throughout the year.44 Nonetheless, even if investments are made immediately to increase storage, capacity will not increase in the next ten years, and is likely to actually decrease somewhat in this period due to silting of existing facilities.45
43 See World Bank 2005a Sindh Economic Report. 44 In recent years of low rainfall and snow melt, however, Pakistan’s existing dams have not been filled to capacity and little Indus water has reached the coast. Additional dams can alleviate but probably not eliminate, the problems of reduced water supply in future drought years. 45 However, the major economic benefits of increased storage capacity do not accrue from increased agricultural productivity, but from power generation. About 90 percent of the anticipated benefits from the

54
Figure.3.2. Annual Indus Flow, Diversion and Escapage by Season, 1975-76 to 2003-04
0
20
40
60
80
100
120
140
160
180
200
1975-76 1979-80 1983-84 1987-88 1991-92 1995-96 1999-2000 2003-04
Flow
in M
AF
Canal Diversion: Kharif Canal Diversion: RabiSurplus flow to Lower River and Estuary: Kharif Surplus flow to Lower River and Estuary: Rabi
Source: Pakistan Statistical Yearbook, various years . Improved Water Delivery: Improvements in water delivery (including investments in drainage, control structures and conveyance mechanisms), better water management (through strengthening of water-course organizations, farmer organizations, area water boards or professional canal management agencies) and more efficient water use at the farm level (crop choice and adoption of water-saving technology) are the most promising short to medium-term strategies (Box 3.7). Inefficiencies in the allocation of water within canal systems cause lower crop productivity at both the head end (due to over-use of water and water-logging) and the tail end (due to water shortages) of canals. Administrative reforms in Sindh that give greater oversight to farmer organizations have enjoyed some success in reducing water theft and improving maintenance of water courses and collection of fees. Punjab has opted for private professional canal management, an alternative mechanism for improving delivery of surface irrigation water services to farmers. Rationalization of water use: At irrigation water’s full economic cost, cultivation of highly water-intensive crops such as sugar cane is not profitable on much of the land where they are now grown. However, farmers do not pay the full economic costs of water. Instead they receive canal water at rates below the economic opportunity cost of the water and face no charges for groundwater above the financial cost of fuel or electricity for pumping. Given that water is increasingly scarce in Pakistan, a shift from water-intensive crops like sugar cane to less water-intensive crops like oilseeds (sunflower and canola), maize, and vegetables irrigated with drip irrigation techniques, could result in large water savings, increasing water availability
proposed new Basha dam derive from electricity generation. Environmental and social effects at the dam site as well as downstream are important considerations in investment decisions, as well.

55
downstream and reducing environmental degradation. For example, shifting 60 percent of land under sugar cane cultivation to a maize-wheat rotation or about one-quarter of ordinary rice land to maize would save enough water to supply Karachi’s current needs. One way to encourage the transition to less-intensive water use is to increase water charges (abiana) for cultivation of water-intensive crops so that they more closely reflect the economic cost of water. Currently, Sindh levies canal water charges according to crop grown; in Punjab by contrast abiana does not vary by crop cultivated.) To minimize problems of non-payment, however, any water-charge increases would need to be accompanied by improvements in service delivery. Nonetheless, raising water charges to levels approximating the opportunity cost of water is likely to be politically infeasible. An alternative would be the development of markets for tradable water rights such as exist in Chile and Mexico. This would require laws establishing tradable water rates and the strengthening of local institutions to enable them to serve as brokers in water markets. Trade of water rights above the water course level would be limited because of the minimal degree of water control above the water course level (the tail end of the water distribution system), though some transactions conceivably could be brokered by water course associations or water users associations at the irrigation minor level (i.e. higher in the water distribution system). Projects and programs involving agricultural extension, technical assistance, market development and credit may be needed to ease the transition of farmers and processors to alternative crops and products. For example, if increased water costs reduced the profitability of sugar cane, programs could be developed to reduce the burden of converting processing facilities such as sugar mills for other uses (such as oilseed processing facilities).

56
Box 3.5. Improving Efficiency of Water Use in Pakistan
Major improvements in the efficiency and sustainability of water use in Pakistan can be achieved by addressing problems related to asset management, water allocation and service delivery. • Irrigation Departments need to establish and implement asset management plans that set
out measures to be taken to ensure: - Divesture of assets for activities that can be taken over by the private sector or
farmer organizations - Operation and maintenance plans including medium-term expenditure
frameworks, assignment of financial responsibility to the different actors, measures to reduce establishment costs, pricing policies and cost recovery mechanisms;
• Service delivery and allocation of water can be improved by devolving water
management and canal command operation to Area Water Boards (AWBs) and Farmers Organizations (FOs). FOs should also exercise oversight of:
- Collection and retention of abiana - Operation and maintenance at the distributary and branch canal level - Improving existing infrastructure
• To improve transparency, Irrigation Departments should publicize information on water flows, expected discharge and allocation of water for each canal, as stipulated in the 1991 Water Accord between the provinces and the federal government.
• Increase availability of irrigation water through
- Investment in improved drainage, control structures and measures to reduce conveyance and distribution losses, particularly in areas where groundwater quality is poor.
- Investment in large-scale storage only after careful evaluation of environment, social and economic consequences
• Rationalize water usage and review water charges so that these better reflect opportunity
costs of water usage and can be used as an incentive to improve water productivity - To minimize problems of non-payment, increases in water charges should be
accompanied by improvements in service delivery
• Develop effective markets for entitlements to canal water to make the system more equitable, particularly for farmers whose land is located at the tail end of water courses
- Enforce the present system of water allocation to facilitate legal tradable water rights at the watercourse, FO and AWB levels
- Strengthen local institutions (such as Water Course Associations, FOs, AWBs and professional canal management agencies) to increase water productivity and enable them to serve as brokers in water markets
- Any system of tradable water rights must account for the minimal degree of water control above the water course level in the current Indus basin system caused by the absence of sufficient storage capacity and control structures (gates) to regulate water flows.

57
Agricultural Credit Total formal sector rural credit has expanded rapidly since the Zarai Taraqiati Bank Ltd. (ZTBL), (then called the Agriculture Development Bank of Pakistan) reformed its policies in the late 1990s to simplify lending procedures and make credit more accessible to small landowners. Territorial restrictions on commercial bank lending operations were also removed. As a result, total rural credit grew by an average annual rate of 12.0 percent in real terms between 1999-2000 and 2005-06 ( Figure 3.3). Commercial credit more than quadrupled in real terms over the same period, increasing its share of total formal credit from an average of only 23 percent in the 1990s to over half of all credit in 2005-06.46 Figure 3.3. Growth of Institutional Agricultural Credit in Pakistan ( Rs 2004-05 bn)
0
20
40
60
80
100
120
1975
/76
1977
/78
1979
/80
1981
/82
1983
/84
1985
/86
1987
/88
1989
/90
1991
/92
1993
/94
1995
/96
1997
/98
1999
/00
2001
/02
2003
/04
2005
/06
bn 2
004-
05 R
s
ADBP/ZTBL Cooperatives/FBC Commercial Banks Total
Source: Malik 1999; Pakistan Economic Survey (various issues). According to PRHS 2001-02 data, nearly 80 percent of cultivator households participate in the credit market, with two-thirds of total rural credit coming from the informal sector (Table 3.8). Access to institutional credit is highly restricted. Few farmers in the sample fully cover their financial needs through formal credit, and those without land have almost no access to formal-sector credit. Overall, only 11 percent of farmers had obtained formal sector loans, often using these loans to purchase tractors. Informal sector credit is much more widespread. 75 percent of farmers had obtained informal sector loans, including 72 percent of land owners and 84 percent of non-landowners. Total average borrowing by land-owners (including both borrowers and non-borrowers) was Rs 29,500, 65 percent higher than total average borrowing by landless farmers (Rs 17,900). Agricultural credit (particularly production loans through commercial banks) was highly subsidized from the late 1970s through the mid-1980s. Subsidies on these commercial loans were
46 Nonetheless, deposits made to rural and small town banks far outpace advances to the rural sector, indicating a net financial outflow from rural areas. Commercial bank interest rates on deposits that are less than overall rates of inflation represent a tax on savings of rural (and urban) households and firms.

58
discontinued in the late 1980s, however. Nonetheless, low repayment rates on loans through ADBP/ZTBL continue to constitute an implicit credit subsidy. As discussed above, because uncertainties about land titles in the current system make banks reluctant to lend money on the basis of these titles, improvements in land administration and land titling could improve access to credit, as well as facilitate more efficient use of land, as well as increase security of tenure.
Table 3.8. Sources of Credit in Pakistan, 2005-06 Amount (bn Rs) Share formal Share rural
Urban (formal) 2005.4 95.7% n.a.Rural (formal) 91.2 4.3% 28.0% ZTBL 29.0 1.4% 8.9% Domestic Private Banks 11.0 0.5% 3.4% Cooperatives 4.2 0.2% 1.3% Commercial Banks 47.0 2.2% 14.4%Rural (informal)* 185.1 n.a. 67.0% Total (formal) 2096.6 100.0% n.a. Total (rural) 276.2 n.a. 100.0%Source: Economic Survey of Pakistan 2005-06; PRHS 2001-02. Notes: *Calculated using the share of informal credit in total rural credit (67%) from PRHS 2001-02. n.a. denotes not applicable.
Other Agricultural Inputs
There have been no direct subsidies on pesticides, seeds and most fertilizers since 1996, but subsidies on surface irrigation water and electricity (in Baluchistan only) remain. The pesticide and seed subsidies were eliminated in 1981-82 and 1982-83, respectively. The subsidy on locally produced fertilizer was eliminated in 1993; a small subsidy on imported fertilizer was eliminated in 1996.47 Likewise, a subsidy on tube wells of Rs 16,000 to Rs 20,000 per unit was abolished in 1994-95. Subsidies on canal irrigation (calculated as the difference between revenues collected from farmers as water charges and the cost incurred by the government for operation and maintenance, excluding capital costs) averaged Rs 4.6 billion from 1996-97 to 1999-00, equivalent to 0.8 percent of agricultural GDP. The price of nitrogenous fertilizer remains substantially below border prices, however, due to subsidies on domestic production.48 Domestic prices of both urea and Di-ammonium phosphate (DAP) were on average 25 to 40 percent below import parity in the late 1970s and the 1980s. Since the early 1990s, there has been little or no subsidy on DAP and other major fertilizers. The exception has been urea, for which the domestic price was on average 38 percent below border prices from 1990-91 to 2005-06. Given that the cost of urea is about eight percent of the value of 47 All fertilizers now face a 15 percent sales duty, and imported fertilizers also face a 5 percent customs duty. 48 Surface irrigation water is also implicitly subsidized as water charges (abiana) are insufficient to cover the cost of maintenance of dam, canals and other water channels. Measurement of the economic value of these subsidies involves assessment of overall investment and maintenance costs, as well as problems attributing these costs to various crops, and is not attempted in this paper.

59
wheat production during this period according to APCOM cost-of-production estimates, the implicit subsidy on fertilizer was equivalent to only about three percent (0.08 * 0.38) of the value of wheat production from 1990-91 through 2005-06. The value of the urea fertilizer subsidy as a share of output values for paddy, cotton and sugar cane respectively is similarly small.
MARKETS AND TRADE POLICIES
Until the mid-1980s, most major agricultural commodities were implicitly taxed through negative indirect effects of overall trade and exchange rate policy that exacerbated the effects of agricultural domestic price interventions. In the 1983-87 period, the direct effects of domestic price and trade policies reduced wheat prices to an average of 25 percent below border prices. The indirect effects of trade and exchange rate policies that led to an appreciation of the real exchange rate further reduced these prices to an average of 42 percent below border prices.49 These price disincentives reduced wheat production by an estimated 24 percent (relative to what it would have been during this period). Taking into account price distortions on all crops, total farm incomes were reduced by an estimated 29 percent.50 Real exchange rate distortions caused by trade policies have decreased sharply, however, due to major trade liberalization in the 1980s and 1990s. Import tariffs and other restrictions on imports reduce demand and increase supply of importables, and thus lead to an appreciation of the real exchange rate. In the 1980s, the net effect of implicit import (and export) taxes was to cause the real exchange rate to appreciate by an estimated 17 percent compared to its value in the absence of these trade distortions. As a consequence of overall trade policy reforms, however, estimated implicit tariffs (adjusted for export taxes) were reduced to 30 percent in the 1990s and to only 15 percent from 2000 to 2005. Thus, the appreciation in the real exchange rate due to these trade distortions was also reduced, from 17 to 11 to 6 percent over the same period, and the implicit indirect taxation of agricultural tradables was reduced, as well (Dorosh and Salam, 2007).51 Other factors, however, led to a sharp appreciation of the Pakistan rupee in 2005, resulting in lower incomes for producers of tradable goods. The real exchange rate appreciated by 14 percent between December 2004 and November 2005, due largely to substantial public and private capital inflows accommodated by increases in domestic money supply. This appreciation reduced domestic prices of major tradable agricultural products (such as wheat, cotton, rice, sugar cane, vegetable oils, and citrus fruit for export) and reduced farmers’ real incomes. Moreover, an appreciating real exchange rate reduces the competitiveness of Pakistan’s high-value fruits, vegetables and livestock products in international markets, thus diminishing growth in a sub-sector crucial for raising agricultural incomes. In addition to the effects of overall trade and exchange rate policy, commodity-specific trade and pricing policy reforms undertaken for the most part from the late 1980s until the mid-1990s greatly reduced price distortions as measured by divergences between domestic output prices and import or export parity border prices. Significant trade taxes and restrictions on major agricultural products remain only for vegetable oil and powdered milk
49 For cotton, this real exchange rate appreciation reduced the protection afforded to domestic cotton production from 177 percent down to 27 percent. 50 Dorosh and Valdes 1990; and Hamid, Nabi and Nasim 1990 give similar figures for nominal rates of protection, as well as a detailed account of the policy interventions from 1960 through the mid-1980s. 51 These calculations use an econometric estimate of the elasticity of the real exchange rate with respect to a change in (one plus) the implicit tariff rate of -0.41 (Dorosh and Valdes 1990).

60
imports and basmati rice exports. Thus, direct trade and pricing policy distortions, as measured by nominal rates of protection using official exchange rates, have generally declined in absolute magnitude since the early 1980s. Including the effects of exchange-rate distortions, the pattern is clearer: there is a sharp reduction in policy distortions over the past two decades (Table 3.9 and Figure 3.4).
Table 3.9. Nominal Rates of Assistance for Selected Agricultural Products in Pakistan Direct Effects Total Effects 1981-1990 1991-2000 2001-2005 1981-1990 1991-2000 2001-2005Wheata -0.12 -0.05 -0.09 -0.28 -0.19 -0.15Wheata,b -0.03 -0.17 0.03 -0.03 -0.13 0.04Cotton 0.00 -0.06 0.09 -0.14 -0.09 0.06Cottonc n.a. -0.14 -0.12 n.a. -0.15 -0.17Basmati Paddy -0.56 -0.30 -0.35 -0.65 -0.39 -0.39IRRI Paddy -0.29 -0.29 -0.29 -0.38 -0.29 -0.08Sugar 1.06 0.70 0.83 0.83 0.65 0.88Sugar Cane 0.66 0.06 0.37 0.33 0.02 0.44Vegetable Oil 0.00 0.28 0.27 -0.08 0.25 0.24 Implicit Tariff --- --- --- 0.48 0.32 0.16RER Effect --- --- --- 0.17 0.12 0.06Source: Dorosh and Salam (2007). Notes: Paddy, sugar and vegetable oil nominal rates of protection calculated at the wholesale market level. Sugar cane is calculated at mill gate. All other rates are calculated at farm gate. a Wheat import parity price calculations assume that Karachi is the central market for imported wheat. b Calculated using estimated autarky prices for years in which estimated trade is zero under free trade. c Import parity.
Figure. 3.4. Nominal Rates of Assistance for Major Crops in Pakistan, 1961-62 to 2004-05
-0.80
-0.60
-0.40
-0.20
0.00
0.20
0.40
0.60
Wheat* Cotton Sugar Cane IRRI Paddy
1962-70 1971-80 1981-90 1991-2000 2001-05
Source: Dorosh and Salam 2007. Notes: * Calculated using estimated autarky prices for years in which estimated trade is zero under free trade.

61
Domestic price and trade policies, especially large-scale government imports, have kept farm gate prices of wheat at an average of 15 percent below import parity since the early 1980s. Net government injections in wheat markets (domestic sales less domestic procurement), in most years supplied through government imports, averaged 2.10 and 0.93 million tons in the periods from 1990-91 to 1999-2000 and 2002-03 to 2004-05, respectively. This is equal, respectively, to 12.4 and 5.2 percent of net availability. Only following the record harvest in March/April 2000 and in 2005-06 has the net effect of government interventions been to reduce total net availability and thus raise domestic prices.52 Under a free-trade regime, domestic wheat markets would likely have cleared at a price below the import parity level and imports would have been zero. Using estimated autarky (no trade) prices in these years, actual domestic wheat prices were on average 10 percent below no-intervention prices in the 1990-91 to 1999-2000 period, and 3 percent above no-intervention prices in the 2000-01 to 2005-06 period. Between 2004-05 and during the last six months of 2006, however, an increase in world prices combined with stagnant domestic prices (heavily influenced by government trade and stock as well as stock management policies) to bring down domestic prices from near import parity to near export parity. Average wholesale wheat prices in Lahore were unchanged between these two periods, while the world price of wheat (including estimated cost and freight to Karachi) rose by 25 percent. Combined with an exchange-rate depreciation of 3 percent, import parity in Karachi rose by 28 percent. With this shift in world prices, private sector exports of wheat may be profitable, helping to stabilize domestic prices at export parity levels (Figure 3.5). Figure.3.5. Pakistan and International Wheat Prices, 2000-2006
0
2
4
6
8
10
12
14
16
18
Jul-9
9
Oct
-99
Jan-
00
Apr
-00
Jul-0
0
Oct
-00
Jan-
01
Apr
-01
Jul-0
1
Oct
-01
Jan-
02
Apr
-02
Jul-0
2
Oct
-02
Jan-
03
Apr
-03
Jul-0
3
Oct
-03
Jan-
04
Apr
-04
Jul-0
4
Oct
-04
Jan-
05
Apr
-05
Jul-0
5
Oct
-05
Jan-
06
Apr
-06
Jul-0
6
Oct
-06
Pric
e (R
s/kg
)
Pakistan (Lahore) Import Parity Lahore (ex:US) Export Parity Lahore
Source: Authors’ calculations. 52 Without these interventions, domestic prices would have been an estimated 30 percent lower in 2000/01 and 8 percent lower in 2001/02 (Dorosh and Salam, 2007).
62
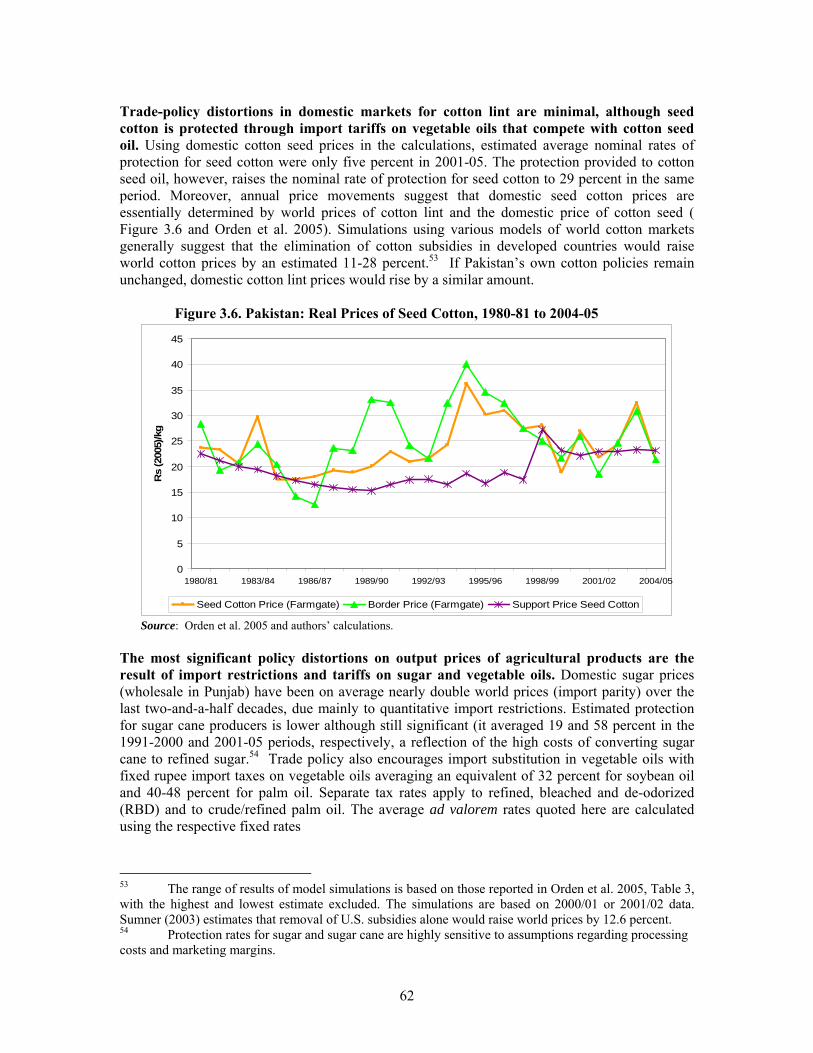
Trade-policy distortions in domestic markets for cotton lint are minimal, although seed cotton is protected through import tariffs on vegetable oils that compete with cotton seed oil. Using domestic cotton seed prices in the calculations, estimated average nominal rates of protection for seed cotton were only five percent in 2001-05. The protection provided to cotton seed oil, however, raises the nominal rate of protection for seed cotton to 29 percent in the same period. Moreover, annual price movements suggest that domestic seed cotton prices are essentially determined by world prices of cotton lint and the domestic price of cotton seed ( Figure 3.6 and Orden et al. 2005). Simulations using various models of world cotton markets generally suggest that the elimination of cotton subsidies in developed countries would raise world cotton prices by an estimated 11-28 percent.53 If Pakistan’s own cotton policies remain unchanged, domestic cotton lint prices would rise by a similar amount. Figure 3.6. Pakistan: Real Prices of Seed Cotton, 1980-81 to 2004-05
0
5
10
15
20
25
30
35
40
45
1980/81 1983/84 1986/87 1989/90 1992/93 1995/96 1998/99 2001/02 2004/05
Rs
(200
5)/k
g
Seed Cotton Price (Farmgate) Border Price (Farmgate) Support Price Seed Cotton
Source: Orden et al. 2005 and authors’ calculations. The most significant policy distortions on output prices of agricultural products are the result of import restrictions and tariffs on sugar and vegetable oils. Domestic sugar prices (wholesale in Punjab) have been on average nearly double world prices (import parity) over the last two-and-a-half decades, due mainly to quantitative import restrictions. Estimated protection for sugar cane producers is lower although still significant (it averaged 19 and 58 percent in the 1991-2000 and 2001-05 periods, respectively, a reflection of the high costs of converting sugar cane to refined sugar.54 Trade policy also encourages import substitution in vegetable oils with fixed rupee import taxes on vegetable oils averaging an equivalent of 32 percent for soybean oil and 40-48 percent for palm oil. Separate tax rates apply to refined, bleached and de-odorized (RBD) and to crude/refined palm oil. The average ad valorem rates quoted here are calculated using the respective fixed rates
53 The range of results of model simulations is based on those reported in Orden et al. 2005, Table 3, with the highest and lowest estimate excluded. The simulations are based on 2000/01 or 2001/02 data. Sumner (2003) estimates that removal of U.S. subsidies alone would raise world prices by 12.6 percent. 54 Protection rates for sugar and sugar cane are highly sensitive to assumptions regarding processing costs and marketing margins.
63
divide by the average price of palm oil imports of all kinds. Ad valorem tariffs on whole milk in 2005-06 were 25 percent; the rate on milk powder in 2001-02 was 20 percent. Moreover, direct government intervention (public sector procurement and sales) in domestic markets has been sharply curtailed for most agricultural products since the mid-1990s. Procurement and sales of rice (both basmati and IRRI) and sugar cane have essentially stopped. Direct intervention in the cotton market has been minimal since 1994 following removal of the export duty on cotton as Pakistan became a net importer; in 2004-05 however, the Trading Corporation of Pakistan bought 270 thousand tons of cotton (11 percent of domestic production) in an effort to boost domestic prices after a bumper crop.55 Wheat Policy
The government continues to be substantially involved in wheat markets, however. Provincial governments (mainly Punjab and to a lesser extent Sindh) and PASSCO (Pakistan Agriculture Storage and Supplies Corporation) procure about 20 percent of total wheat production each year. Total procurement of wheat as a share of production (20 percent) in Pakistan is similar to that in India for wheat (25 percent) and rice (23 percent), and significantly higher than that of Bangladesh (10 percent for wheat and 3 percent for rice). The latter, a country with higher levels of poverty appears to have stabilized domestic grain prices and to maintain food security stocks with considerably less recourse to government procurement (Table 3.10). Large scale government wheat procurement offers little direct benefit to consumers of wheat flour, however, because almost all procured wheat is bought and then sold again to flour millers (at a financial loss to the government) in the same wheat marketing year. Most recently, millers have enjoyed quotas for purchase of government subsidized wheat at below-market prices and have thus been able subsequently to sell wheat flour at market-clearing prices. This has contributed to a large expansion in wheat mills, over-capacity in the milling industry and a large number of mills that operate only when subsidized wheat is available for purchase. Reducing the volume of domestic procurement (and subsequent intra-annual sales) would directly reduce the wheat subsidy that arises from the disparity between the sale price of government wheat (whether procured locally or domestically) to wheat mills and the full cost of wheat procurement and handling.56 Reducing the volume of procured wheat and subsequent intra-annual sales would have little adverse effect on consumers, though, as wheat flour produced from government wheat is typically sold at open market prices. The potential savings from eliminating the wheat subsidy through lower intra-annual domestic procurement and increases in release (sales) prices to flour mills would have increased funds for targeted programs in Punjab in 2002-03 by two-thirds.57
55 The Trading Corporation of Pakistan (TCP) also bought 35 thousand tons (2 percent of production) in 2001-02 to support prices. 56 Raising the sales price relative to the procurement price would also lower total subsidies, but setting the sales (release) price too high relative to open-market prices would induce flour mills to purchase less, as was the case in 2005-06. 57 Officially, wheat subsidies in Punjab fell between 2002/03 and 2003/04. Although the procurement price was unchanged, the per kilogram subsidy fell by Rs 1.43 as the cost of incidentals fell by Rs 1.06/kg (from Rs 1.92 /kg to Rs 0.86/kg). Details of how these subsidies are calculated are not published.

64
Table 3.10. Food Grain Policy in Pakistan, India and Bangladesh, 2001-05
Note: Data are 2001-05 averages; Pakistan stock data is 2002-05 average. Other wheat-policy reforms should accompany changes in procurement to ensure consistency across policies and flexibility to tailor policy to changes in the market (Box 3.6). Consistent and transparent trade policy with low tariffs to encourage international trade, level playing fields and avoiding marketing restrictions aimed at promoting competitive domestic markets,58 and enhanced analytical capacity and information flow are key complements to a policy of reduced government intervention in markets. Because Pakistan’s wheat markets are generally well-integrated, using cash instead of food for safety nets would allow welfare objectives to be met while eliminating the need for government procurement. Current average year-end stocks are not excessively large relative to the size of the domestic market, and could play a useful role in emergency preparedness.
58 Pakistan took significant steps towards market liberalization and improved efficiency of wheat markets in 2004 and 2005, including liberalization of private sector wheat imports and the removal of restrictions on grain movement in Punjab. This policy represents a dramatic improvement over the policies of 2004, when transport of wheat across districts in Punjab was banned as part of an initiative by the Punjab provincial government to meet its procurement targets.
Pakistan India India Bangladesh Bangladesh Wheat Wheat Rice Wheat Rice Production (mn tons) 19.49 70.54 85.72 1.40 25.22Procurement (mn tons) 3.78 17.73 19.40 0.15 0.82Share of production 19.5% 25.2% 22.6% 9.6% 3.2% Stocks (mn tons) 1.30 21.56 18.04 0.26 0.56Stocks (kg/capita) 3.0 20.6 17.2 1.9 4.0 Distribution channels Subsidized Subsidized Subsidized Targeted Targeted sales to sales sales Distrib Distrib; flour mills PDS PDS (FFW, etc.) Sales

65
Box 3.6. Wheat Policy Reforms: Towards a More Efficient Wheat Market in Pakistan
Pakistan’s current wheat system involves implicit procurement quantity targets, purchases at a fixed procurement price, and large scale same-year subsidized sales to wheat millers. In years when internal procurement quantity targets, (equivalent to about 20 percent of domestic production), are not met, the government has resorted to raising procurement prices or imposing restrictions on transport of grain. Shifting to a system of minimal market intervention designed to stabilize prices in years of extreme supply shocks, would achieve similar price stabilization results, at the same time significantly reducing costs. A market-oriented system of this sort should include the following components: 1. Lower levels of government procurement. The government should set a floor price at which procurement in years of normal or below-normal harvest is equal to minimal levels required to rotate and maintain stocks. (Current average levels of procurement are about four million tons or 20 percent of production.) 2. Modest government carry-over of stocks as a security measure. The government should maintain annual carryover stocks equal to current levels (0.5 to 1.0 million tons). Average year end per capita carryover stocks or “strategic reserves” in Pakistan are already relatively small in comparison with other South Asian countries, and do not involve large financial costs. 3. Liberalization of private sector international trade. The government should provide clear signals to the private sector regarding tariffs and import restrictions, as well as promoting a level playing field with no special advantages for government agencies (PASSCO, State Trading Corporation of Pakistan, etc.). Experience of other Asian countries, including Afghanistan and Bangladesh, has shown that private sector import trade can supplement domestic supplies and prevent price spikes in years of crop shortfalls.
4. Cash-based safety nets. The government should use cash instead of transfers-in-kind or subsidized sales of commodities, to save on administrative and distribution costs. 5. Promotion of a competitive domestic market. The government should provide fair access to credit, avoid limits on private storage, and maintain clear and consistent policy signals. Competition among traders and a level playing field can maximize the potential efficiency and social welfare gains from competitive markets, even as individual traders seek to maximize their own profits. 6. Enhanced analytical capacity and information sharing. The government should strengthen its capacity to monitor and analyze market developments, and establish systems to more effectively share market and policy change information.
66
AGRICULTURAL GROWTH LINKAGES AND RURAL POVERTY REDUCTION
Historically, demand linkages ensuing from increased agricultural output and incomes have been the most important mechanism for spurring growth in the rural non-agricultural economy of Pakistan and other developing countries. Increases in agricultural production generally involve increased demand for agricultural inputs, processing and marketing services. Also, as household incomes rise, consumer demand for both urban and rural products and services increases. To the extent that the supply of goods and services is elastic, increases in demand can spur increases in production which in turn further boosts demand. (See Box.3.7.)
Box.3.7. Agricultural Growth and Rural Poverty Tamil Nadu, India Despite concerns that Green Revolution technology for rice (improved seeds, increased fertilizer use and irrigation) would lead to increased income inequality, most rural household groups benefited from increased rice production in the 1970s and early 1980s (Hazell and Ramasamy, eds., 1991). Household surveys of farmers indicated that, although the first adopters of the rice technology tended to be larger farmers, by the early 1980s small farmers in villages with access to irrigation had adopted the new technologies at the same rate as large farmers. Land distribution remained essentially unchanged, and agricultural wage earnings for agricultural laborers increased although real agricultural wage rates did not increase.
Moreover, increased rice production led to substantial rural growth linkages, adding an additional 0.87 rupees of value added for every 1 rupee of value added from additional rice production. Half of these multiplier effects were due to increased demand for agricultural inputs, marketing and processing services; the remainder derived from increased consumer demands as household incomes rose.
Survey results showed that real incomes of small paddy farmers and landless laborers rose by 90 and 125 percent, respectively, between 1973-74 and 1983-84. Incomes of non-agricultural households also rose by 55 percent, due in part to the growth linkage effects ensuing from agricultural growth. Large paddy farmers’ real incomes rose only 18 percent, due to increased fertilizer and labor costs. Notably, non-paddy farmers with no access to irrigated land experienced real income gains of only 17 percent.
Similarly, analysis of state-level data on growth and poverty in India (Datt and Ravallion 1998) shows that agricultural productivity growth from 1958-1994 played a major role in reducing poverty. During this period, agricultural output per acre of net sown area grew by 2.91 percent per year, contributing to higher real wages for agricultural laborers (which grew by 2.84 percent annually) and a decline in the real price of food. The price of food relative to agricultural laborers’ consumer price index fell by 0.15 percent per year from 1976-94, after having increased by 0.62 percent per year from 1958-75. Higher farm yields for small producers also contributed directly to their incomes, through increased value of output and indirectly through increased employment.
In Pakistan because much of the value added in agriculture accrues to land (in the form of implicit or explicit rents) and because land distribution is highly skewed, much of the rural population has relatively little agricultural income. Medium and large land owners (those with 12.5 acres or more) account for 10 percent of agricultural households and receive an estimated 32 percent of agricultural incomes. However, agricultural incomes (including livestock) generally account for only 56 percent of total income for agricultural households, which constitute 41 percent of Pakistan’s total population. Including rural non-agricultural households (31 percent of the national population), the share of agricultural incomes in total rural incomes is only 37 percent (Table 3.11).

67
Table 3.11. Rural Agricultural Incomes in Pakistan PRHS PRHS SAM* SAM* Agric Inc Agric Inc Agric Inc Agric Inc Per Capita Share Per Capita Share ('000 Rs) (percent) ('000 Rs) (percent) Medium and Large Farms 15.7 83.5 29.9 57.2Small Farms 6.1 67.9 8.6 54.8Landless Farmers 7.2 87.7 5.3 59.7Rural Agric Workers 2.2 53.1 5.5 53.1Rural Non-Farm Non-Poor 0.3 1.9 0.1 0.4Rural Non-Farm Poor 0.2 6.3 0.2 4.5 Total Rural 6.1 69.7 5.6 37.2 Rural Agric Households 7.1 74.8 9.6 55.9Source: Pakistan SAM 2001-02; Pakistan Rural Household Survey 2001-02. Notes: * denotes Social Accounting Matrix The extent to which non-agricultural households gain from agricultural growth is determined by the magnitude of growth linkage effects. These linkage effects can be estimated using a semi-input-output model, based on a social accounting matrix (SAM) for Pakistan that includes disaggregated information on production activities, returns to factors of production (e.g. land, labor and capital), supply and demand of goods and services, and incomes and expenditures of households and other institutions. The model assumes that output of tradable goods (major crops, cattle products, most industrial products) is inelastic, and does not expand due to increases in demand. For these products, increased demand results in increased net imports. For elastically supplied products, (minor crops, poultry, and services), increased demand is assumed to induce increases in output.59 Simulation results of a 10 percent increase in the output of all major crops (wheat, basmati and IRRI rice, cotton and sugar cane) suggest that the largest gains of increased agricultural crop production accrue to large and medium land owners, whose incomes rise by 7.2 percent. Incomes of small farm owners and pure tenants also rise by about 4.6 percent. Due to multiplier effects, incomes of non-farm rural household groups also rise by 3.4 percent on average. The poorest rural household groups (agricultural laborers and rural non-farm poor (29 percent of the rural population) reap only 6.7 percent of the total income gains, and their incomes rise by only 2.6-4.1 percent. Much of the income gains accrue to the owners of capital in both rural and urban areas (Figure.3.7).60
59 Correct classification of a sector as elastic in supply is crucial to the model results. Note also that the model uses average input-output, value added and factor payment coefficients derived directly from the SAM, though consumption parameters are based on econometrically estimated income elasticities of demand. Thus, the simulation analysis assumes there is no change in the structure of Pakistan’s land distribution and factor payments. For details, see Dorosh, Niazi and Nazli (2003). 1. 60 The simulations show the average income gains for the various household groups. If non-agricultural labor incomes are concentrated among only a segment of rural non-farm poor households, the income gains of this segment of households will be larger, (and the gains to other rural non-farm poor households correspondingly smaller).

68
Figure.3.7. Simulation Results of a 10-percent Output Shock to Wheat, All Major Crops
and Livestock in Pakistan
0.0
2.0
4.0
6.0
8.0
10.0
12.0
Lrg/MedFarm
SmOw ners
SmRenters
AgrWorkers
Non-farmNon-poor
Non-farmPoor
(% c
hang
e) WheatMajor CropsLivestock
Source: Dorosh, Niazi and Nazli 2003.
Simulations using a disaggregated SAM that separates activities and households in Punjab produce similar results. A 10 percent increase in the output of all major crops raises overall incomes by 2.5 percent and large and medium land owners’ incomes by 6.2 and 4.3 percent, respectively. Incomes of small farm owners and pure tenants in Punjab rise by 3.3 and 3.7 percent, respectively. Multiplier effects raise incomes of non-farm rural non-poor household groups in Punjab by 2.7 percent, on average, and the rural non-farm poor households by only 2.3 percent (Figure.3.8). Gains from a 10 percent increase in large livestock production (mainly cattle, goats and dairy products) are more evenly spread out given the distribution of livestock ownership. A 10 percent increase in national livestock production results in an overall income gain of 4.5 percent; incomes of small farmers and landless agricultural households (both of which also have significant livestock income) rise by 9.7 and 10.9 percent, respectively. A 10 percent increase in livestock production in Punjab only raises overall incomes in the province by 3.4 percent. Incomes of Punjab small farm owners, small farm renters, and landless agricultural households (the latter of which also have significant livestock income) rise by 6.4, 10.0 and 7.1 percent, respectively. Thus, the simulations show that agricultural growth has substantial benefits for low income farmers and tenants (approximately 37 percent of the rural poor), but another source of demand (besides agricultural growth linkages) is needed to rapidly raise the earnings of the rural non-farm sector. The limited impact of agricultural growth on incomes of the rural non-farm poor is the result of two major factors: segmentation of Pakistan’s agricultural labor market; and agriculture’s declining contribution to both total GDP and rural household incomes. Because much crop farm labor (about 80 percent) is own-family labor, most of the direct gains in labor earnings from increased agricultural output accrue to farm households, not to hired agricultural workers. As a result, incomes of landless agricultural workers (10 percent of the rural poor) rise only moderately in these scenarios.

69
Figure.3.8. Simulation Results of a 10-percent Output Shock to Wheat, All Major Crops
and Livestock in Punjab, Pakistan
0.0
2.0
4.0
6.0
8.0
10.0
12.0
Large
Farm
Med Fa
rm
Sm Owne
rs
Sm Ren
ters
Agr W
orkers
Non-fa
rm N
on-po
or
Non-fa
rm Poo
r
(% c
hang
e) WheatMajor CropsLivestock
Source: Dorosh, Niazi and Nazli, (2003). Moreover, because over time, agriculture’s share in both the rural and national economies has shrunk, multiplier effects originating from the agricultural sector have a smaller impact on the non-agricultural economy.61 Closer integration with the urban economy also reduces consumption linkages within the rural economy, as rural households spend more of their incomes outside of rural areas or on goods produced outside rural areas. Both these changes are typical patterns in economic development. The implication is that growth linkage effects have a smaller impact on GDP growth and rural poverty reduction today than they did in the past, and that an additional source of demand is needed for rapid growth of the rural non-farm sector. Agricultural growth still has a positive impact on rural poor incomes, but this is smaller, relative to the size of the economy, than it was three decades ago. Even with agricultural growth of 3.9 percent per year (the historical average from 1975 to 1990, a period of rapid real agricultural GDP growth) and the higher growth multiplier of 2.5, non-agricultural income growth induced through multiplier effects would be only about 2.9 percent, implying a per capita growth rate of less than 1.0 percent per year.
61 The share of major crops in total GDP in Pakistan has fallen dramatically, from 0.234 in 1970 to 0.091 in 2000. Therefore, the direct effect of a 10 percent gain in major crop production is smaller: it was equivalent to 2.3% of GDP in 1970, but only 0.9% of GDP in 2000. Moreover, assuming a constant value-added multiplier of 1.5, the total effects (including multiplier effects) on the rest of the economy are also smaller (4.6% of GDP in 1970 compared with 1.5% of GDP in 2000), (Dorosh, Niazi and Nazli 2003).

70
POLICY IMPLICATIONS
Agricultural growth in Pakistan throughout most of the last three decades has depended to a large extent on the major crops (wheat, rice, cotton and sugarcane). Although there is still scope for production increases of these crops, future increases in agricultural productivity and rural incomes are likely to be driven by diversification into high-value crops and livestock. Research and extension services need to be restructured to meet the needs of a more diverse agriculture sector, including provision of region-specific information packages. Facilitating new contracting arrangements and investment by supermarkets will also facilitate marketing of high value fruits, vegetables and animal products. Investment in irrigation and drainage, in tandem with reform of irrigation management are also crucial to arrest environmental degradation, especially in some major irrigated areas of Punjab and Sindh. Expanded use of water-conservation technologies such as drip irrigation, can increase the efficiency of use of scarce available water. Finally, more resources are needed for the provision of research, extension and veterinary services for livestock, particularly for larger animals. The poultry sector is already expanding rapidly, spurring substantial growth in maize production (a major feed) and in poultry and egg production. Productivity gains in the livestock sector are especially important for pro-poor rural income growth, as livestock ownership in rural Pakistan is distributed far more equitably than is land ownership.