30.10.2012 key challenges and opportunities for continued growth and investment into mongolia,...
TRANSCRIPT

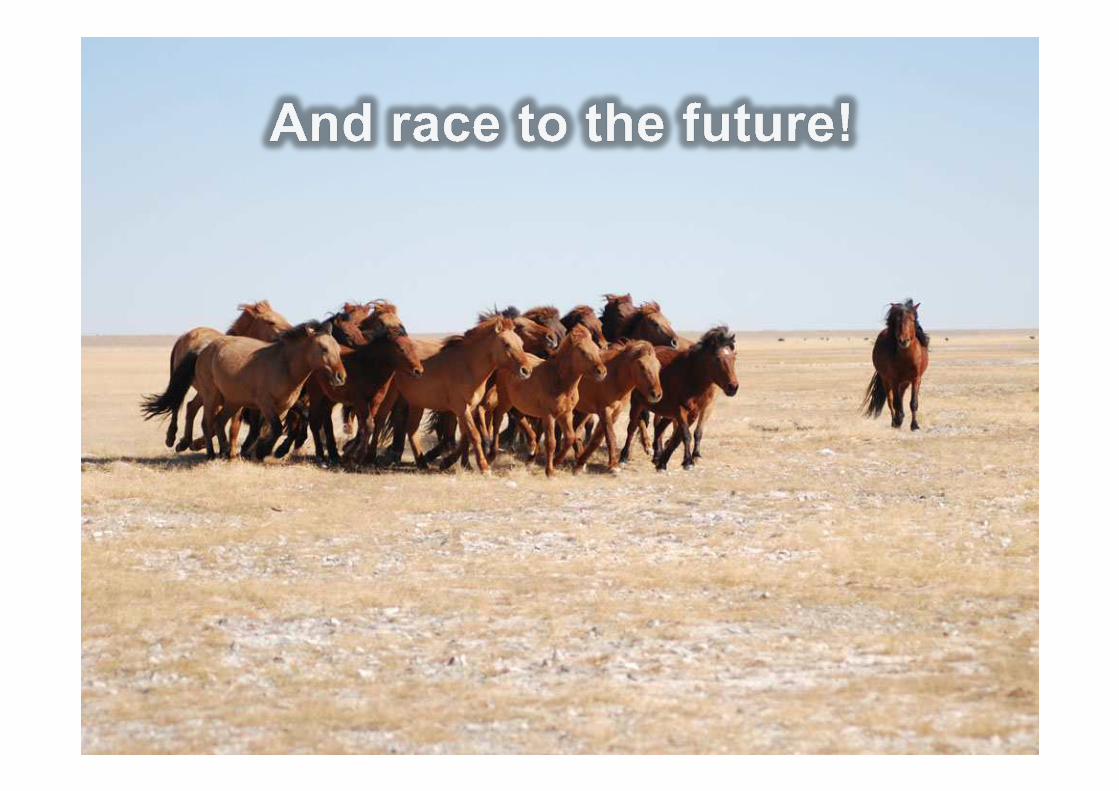
RACE TO THE FUTURE
Key Challenges and Opportunities for Continued Growth and Investment in Mongolia
Mongolia 2012 Investment Summit October 30, 2012
Randolph S. KoppaPresident,
Trade and Development Bank of Mongolia

SIGNIFICANT HISTORICAL EVENTS
Khunnu Empire
Chinggis Khan forms
modern Mongolian
state
Mongolian sovereign
state
Mongolian democratic
republic
Exports coking coal
to China
OT investment agreement with
Ivanhoe Mines and Rio Tinto
HKSE IPOsMMC- $749 SGE- $395
WINSWAY- $512
189 B.C. 1921 2005
1206 1990
2009
2010
MSE volume up 277% to $251 mln
$1.2 bln Debt Issuance
so far
TDB issues first
Mongolian bond $75 mln
2007
TDB’s second bond issue$ 150 mln
October 2010
April2012
2011
TDB’s third bond issue $ 300 mln
September 2012

• Coal and iron exports ramp up during 2009
• OT Agreement signed October 2009
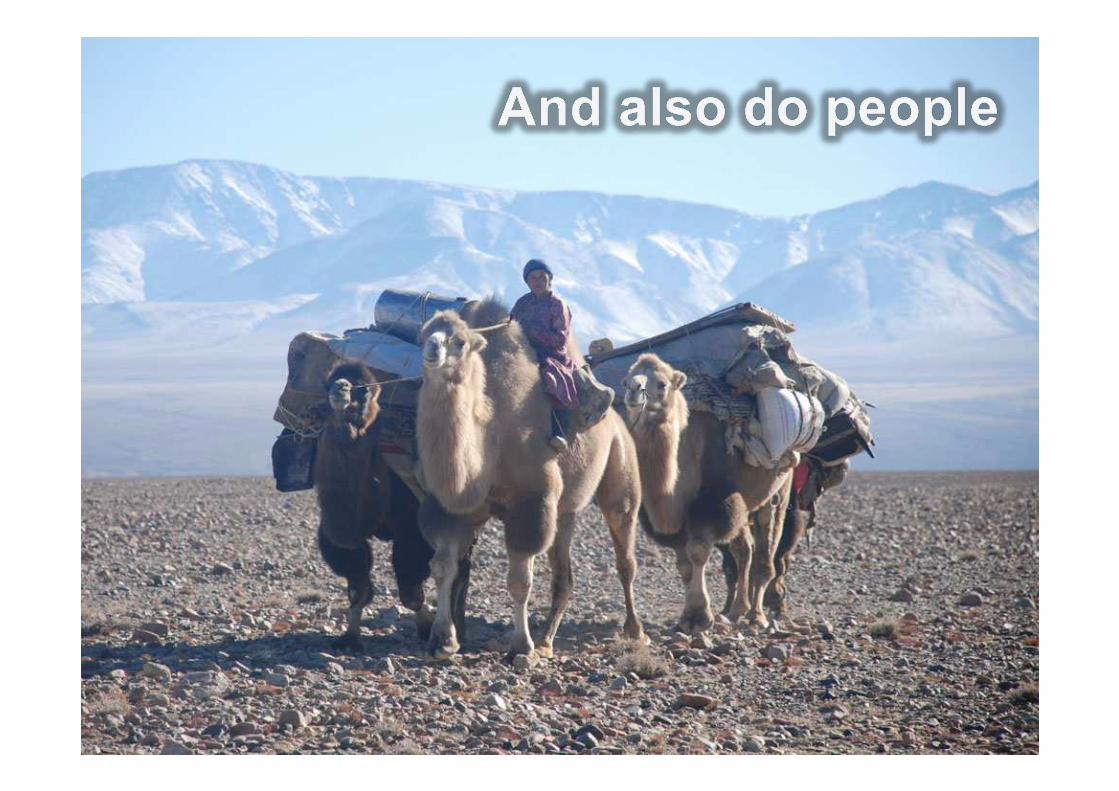
At the first Mongolian Investment Summit here two years ago, these were represented in the pictures…
OF HUGE HISTORICAL SIGNIFICANCE

MONGOLIA


• What is the progress the country has made in
addressing the aspiration and needs of the
people and the development of the
infrastructure to handle the needs of a growing
economy?
• What needs attention?
• What are the opportunities?
WHAT HAS HAPPENED SINCE?

• Socio-economic landscape
• Obstacles to growth
• Economic Performance
• Priorities
• Key drivers for foreign investment
• Opportunities for investors
• Summary of progress
TOPICS

• Population growing
• Life expectancy increasing
• Urbanisation increasing
• GDP per capita increasing
• Education supported
• Medical services lagging
HUMAN DEVELOPMENT

THE MONGOLIANS
Source: UNDP

IMPROVING HUMAN DEVELOPMENT INDEX
Source: UNDP

OUTPACING OTHER ASIAN NEIGHBORS
Source: UNDP
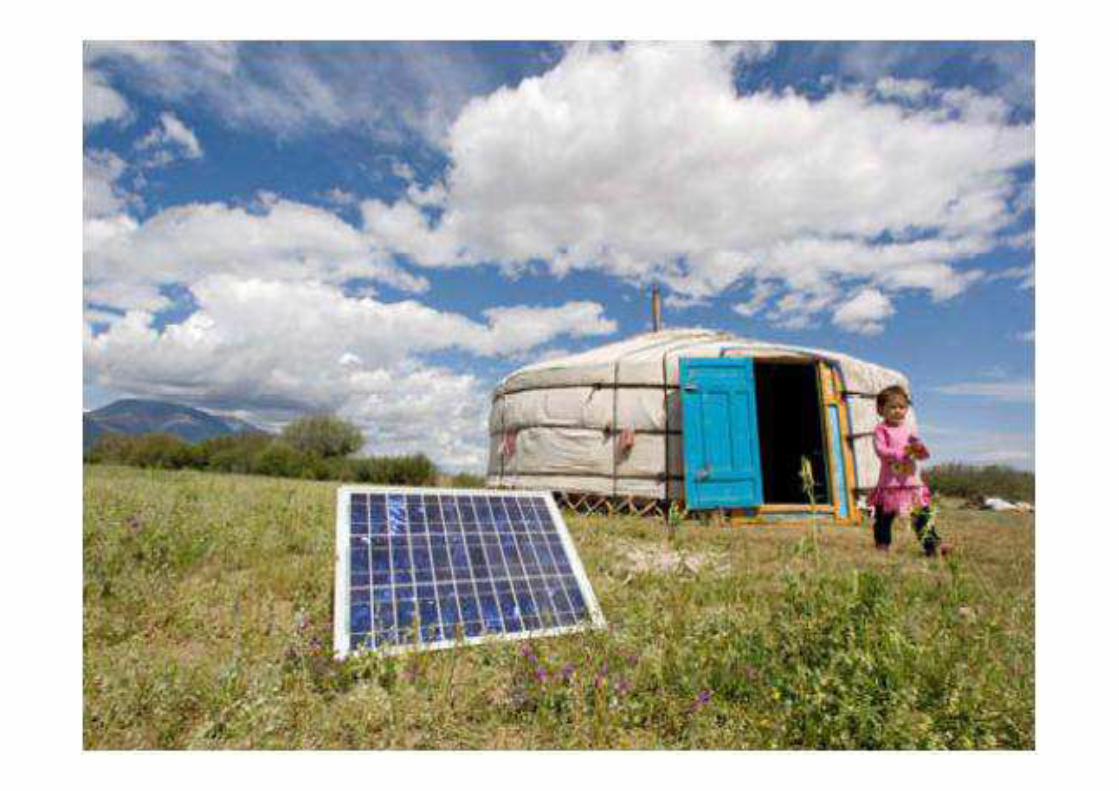

THE SUN POWERS THE COUNTRYSIDE
• Over 100,000 herder gers use solar power
• 500,000 people affected
• 65% of nomadic residents
• 18% of total population
• Subsidy funding of less than USD 10 million
• World Bank, Netherlands Government, GoM

Source: Ministry of Mineral resources and Energy, Mongolia

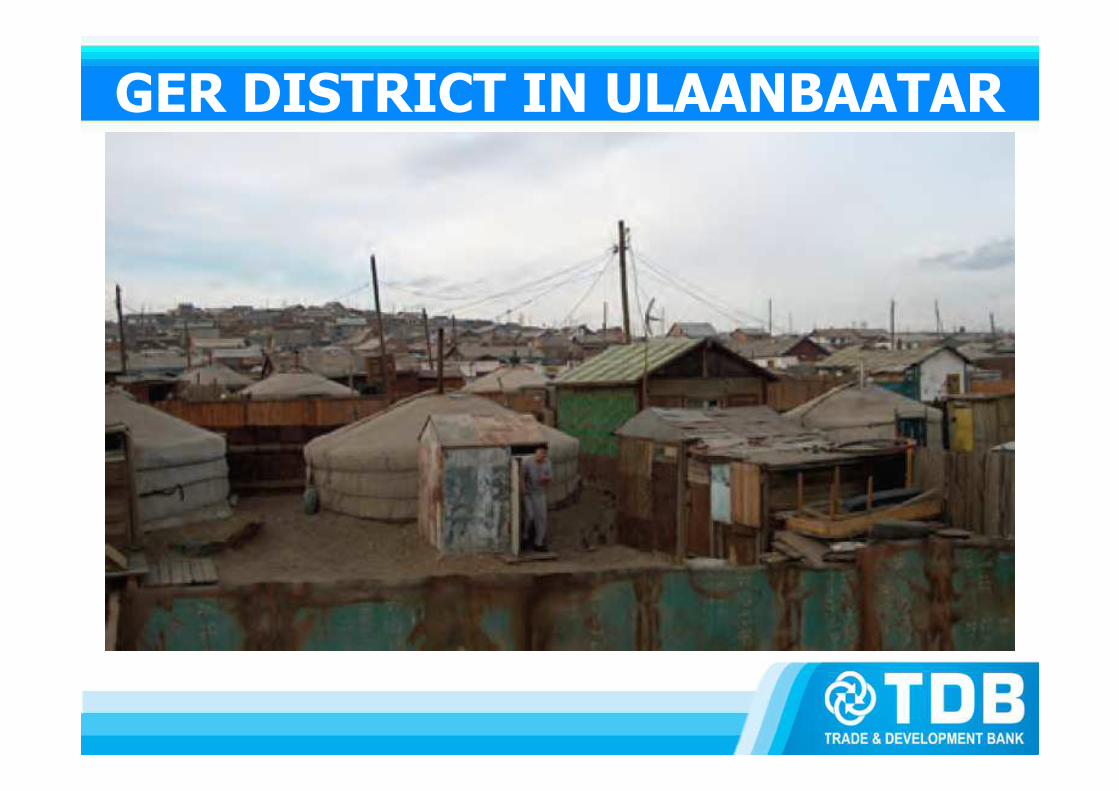
GER DISTRICT IN ULAANBAATAR

CLEANER BURNING MEANS CLEANER AIR
• 170,000 ger households in UB
• 65% of total urban households in UB
• 100,000 now have clean burn stoves which reduce emissions of particulate matter 90%
• “The air is cleaner going out than coming in.”
• Others can use clean burn briquettes
• Funding from Millenium Challenge Fund and others plus micro finance loans

TRANSFER PAYMENTS
• MNT 21,000 a month per person for 18 months or USD750 million
• Partly to fulfill old campaign promises
• Partly to share in advance the awaited financial benefits of new mining projects such as OT and TT
• Transfer payments now curtailed and limited to students, elderly and needy
• Risk of Dutch Disease

STILL SCEPTICAL

PUBLIC OPINION
• Recent surveys of population show:
• 76% of respondents believe the government should have majority control of large scale mining projects
• Main reasons, 84%, are to protect Mongolian interests, assure Mongolia control, to be run efficiently and for national security. Only 8% chose the reason to create revenue
Source: Sant Marat Foundation

HOW TO FINANCE GOVERNMENT INVESTMENT IN MINES
• 12% : it should come for free
• 20% : from government savings
• 16 % : from foregoing dividends
• 19% : from the international capital market borrowing by the government for its equity participation
CLEARLY, there are some challenging views
Source: Sant Marat Foundation
QUALITIES OF FOREIGN INVESTORS
• Respect of local culture and law
• Transparency
• International reputation
• Scale of operations
Source: Sant Marat Foundation
WHY?
• The scars from mining activity, the strain on the ecosystem and way of life as roads and soon rail, interrupt nomadic patterns for people, livestock and wild animals, are seen as harmful and somehow have been equated with foreign influence.
• Political seasons tend to heighten these issues
• Very high expectations have been created
• Old patterns take time to change
• More knowledge and better information needed.

A METAPHOR
• To understand some of the these issues
Consider this metaphor:
The recent mining boom is as if Mongolia has been awarded by the world an A380 placed on the Gobi Desert

THE PLANE IS LOADED WITH USD 100 BILLS
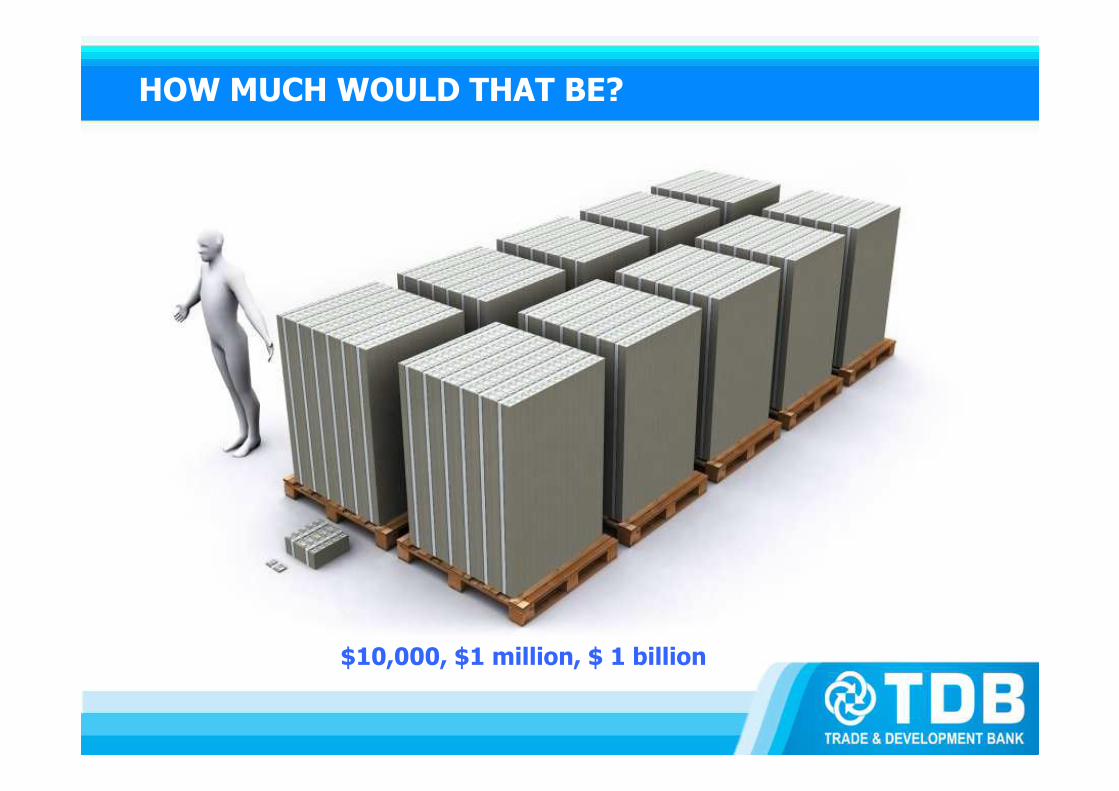
HOW MUCH WOULD THAT BE?
$10,000, $1 million, $ 1 billion

ONE BILLION DOLLARS LOOKS LIKE THIS

HOW MUCH CAN AN A380 HOLD?
• In the passenger luggage hold, USD 2 billion
• As a cargo plane, USD 15 billion, which weighs almost 150 tons which represents the plane’s maximum payload.
THERE IS ONE CONDITION
You have to get the plane to fly!
Then the money can be showered down
for the Mongolian people to collect.

LEARN TO FLY AND BUILD THE RUNAWAY
• At present, the plane is taxiing and has turned onto the runaway for take off
• The run away is still being built
• 2.8 million Mongolians are watching
• Will the runaway be completed in time?

WHAT HAPPENS NEXT?
WILL IT BE THIS?

OR WILL THIS FOIL THE TAKE OFF?

MEANING OF THE METAPHOR
• Mining investment and developmenthave been advancing at a faster pacethan the underlying infrastructuresnecessary to handle the growth


Mln Mt/brl 2010 2011 2012 3Q
COAL 16.7 21.1 14.3 +3.4% YoY
COPPER .56 .57 .43 +12.5% YoY
IRON ORE 3.6 5.8 4.6 +12% YoY
CRUDE OIL 2.1 2.5 2.4 +38.6% YoY
EXPORTS VOLUMES BOOM DESPITE LAGGING INFRASTRUCTURE
Source: NSO

EXPORTS REVENUES EASE AS MARKET SOFTENS
VALUE 2010 2011 2012 3Q
EXPORTS+ 54%
USD 2.9 bln + 66%
USD 4.8 bln -4.7%*
USD 3.2 bln
COKING COAL Up 188% Up 155% Down 6.8%
IRON ORE Up 186% Up 72% Up 27.2%
COPPER CONCENTRATE
Up 54% Up 25% Down 15.9%
CRUDE OIL Up 34% Up 63% Up 33.3%
Source: NSO* On top 4 minerals only

MONGOLIAN COAL EXPORTS
Source: NSO & TDBC
• Average price in 2011 $110 per ton• Average price in 2012 $100 per ton
2.5 3.3 4.27.1
16.7 21.1
14.3
22*
52
6570
0
10
20
30
40
50
60
70
80
2006 2007 2008 2009 2010 2011 Sep,2012 2013 2014 2015
Mt
ACTUAL FORECAST
* Revised forecast by TDB
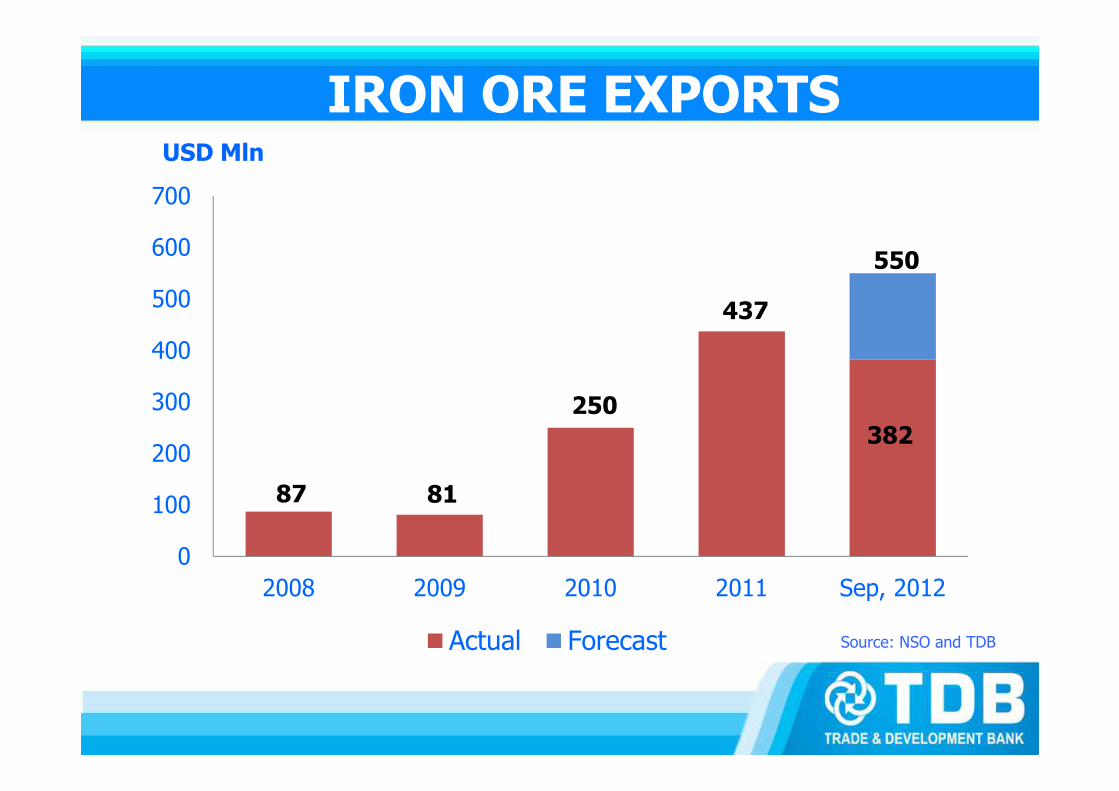
IRON ORE EXPORTS
87 81
250
437
382
550
0
100
200
300
400
500
600
700
2008 2009 2010 2011 Sep, 2012
Actual Forecast
USD Mln
Source: NSO and TDB
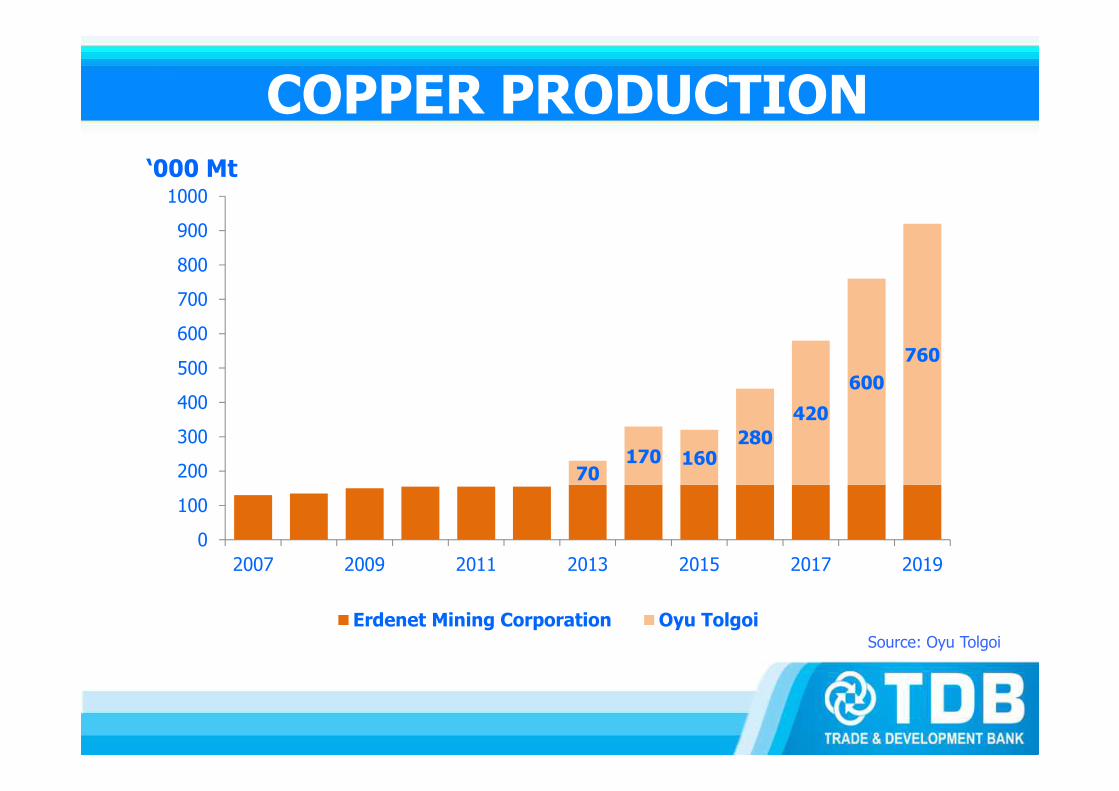
COPPER PRODUCTION
70170 160
280
420
600
760
0
100
200
300
400
500
600
700
800
900
1000
2007 2009 2011 2013 2015 2017 2019
Erdenet Mining Corporation Oyu TolgoiSource: Oyu Tolgoi
‘000 Mt

10.9
14.6
18.0
20.9
25.5
29.6
-5.0
0.0
5.0
10.0
15.0
20.0
-
5.00
10.00
15.00
20.00
25.00
30.00
35.00
2007 2008 2009 2010 2011 2012 2013 2014 2015 2016 2017
Actual Forecast Real GDP growth rate Source: IMF & NSO
USD bln %
NOMINAL ANNUAL GDP AND REAL GDP GROWTH

INFLATION PREDICTION
Source: IMF and NSO
8.2
26.8
6.3
10.2
9.5
13.6
12.5
9.78.2 7.6 7.0
0
5
10
15
20
25
30
2007 2008 2009 2010 2011 2012E 2013E 2014E 2015E 2016E 2017E
CPI (%) Y-O-Y
September 2012 YoY 14.8%; Ulaanbaatar city 13.4%

60 123 102
-296 -329
2
-391 -486 -300-1000
0
1000
2000
3000
4000
5000
6000
7000
8000
2005 2006 2007 2008 2009 2010 2011 2012E* 2013
Preliminary
Revenue Expenditure Budget Balance
BUDGET INDICATORS

PRIORITY ISSUES
• Fiscal control
• Inflation reduction
• Infrastructure
• Management of expectations
• Foreign investment law clarity
• Enforcement of laws
• Consistency and transparency

INFRASTRUCTURE
• Power: Mongolia facing a 4oo MW shortage
• Rail: Needed to maintain price advantages and to reduce negative environmental impact of trucking
• Road: For mine supplying and to borders
• Water: Need to resolve supply and use questions in the South Gobi and elsewhere

TRANSPORTATION NETWORK
Source: MRTCUD

RECENT PROGRESS
• MMC commencing 250 km rail to border
• DBM funding for east line to Sainshand
• 50MW Salkhit wind farm turbines up
• CHP 5 450 MW USD 1.4 bn power plant in UB negotiating concession agreement with Mongolia/International consortium
• Other power initiatives in process as tariffs have been raised to underpin financing

BREAKTHROUGH
• Mongolia sovereign bond to be launched
• USD 1.5 bn
• Aimed to finance needed infrastructure to support exports
• Leverage funds through PPP
• Not for budget shortfalls
• Key: resource nationalism rhetoric to be toned down

OTHER DEVELOPMENTS
• Construction
• Cement
• Steel
• Animal and agri value added processing
• Import substitution
• Consumer goods
• Financial services

DUTCH DISEASE
• Not a great threat to traditional exports of cashmere hair and bulk meat
• Movements towards higher value potentially brand-able exports has begun
• Import substitution, services and further processing could face labor shortages but can provide buffer to imports
• Inflation always threatens
• Green movement helps

TOTAL FINANCING AND INVESTMENT NEEDS ANDOPPORTUNITIES 2010 TO 2015
• Mine Development $ 12 bn. to $ 20 bn.
• Infrastructure $ 8 bn. to $ 12 bn.
• Urban development $ 6 bn. to $ 8 bn.
• Agriculture $ 1 bn. to $ 2 bn.
• Industry and Commerce $ 15 bn. to $ 20 bn.
• Environment $ 1 bn. to $ 2 bn.
• Social $ 1 bn. to $ 2 bn.
• Financial Sector $ 1 bn. to $ 2 bn.
Totals: $ 45 bn. to $ 68 bn.
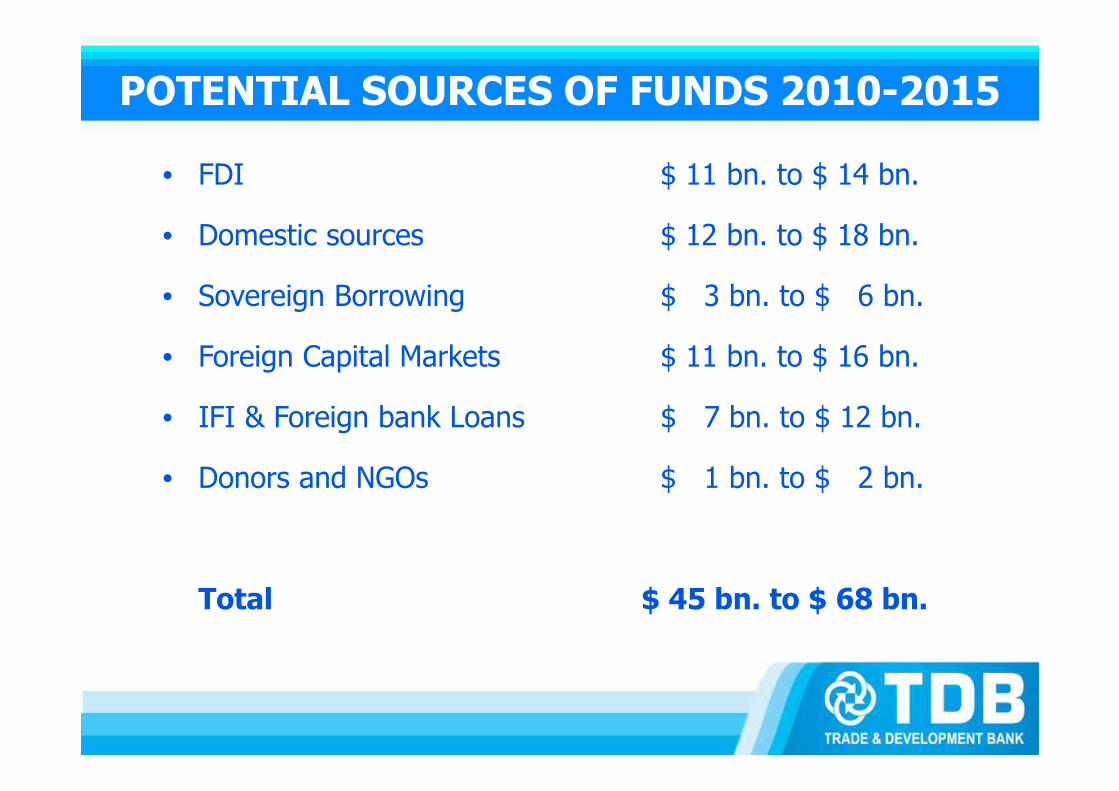
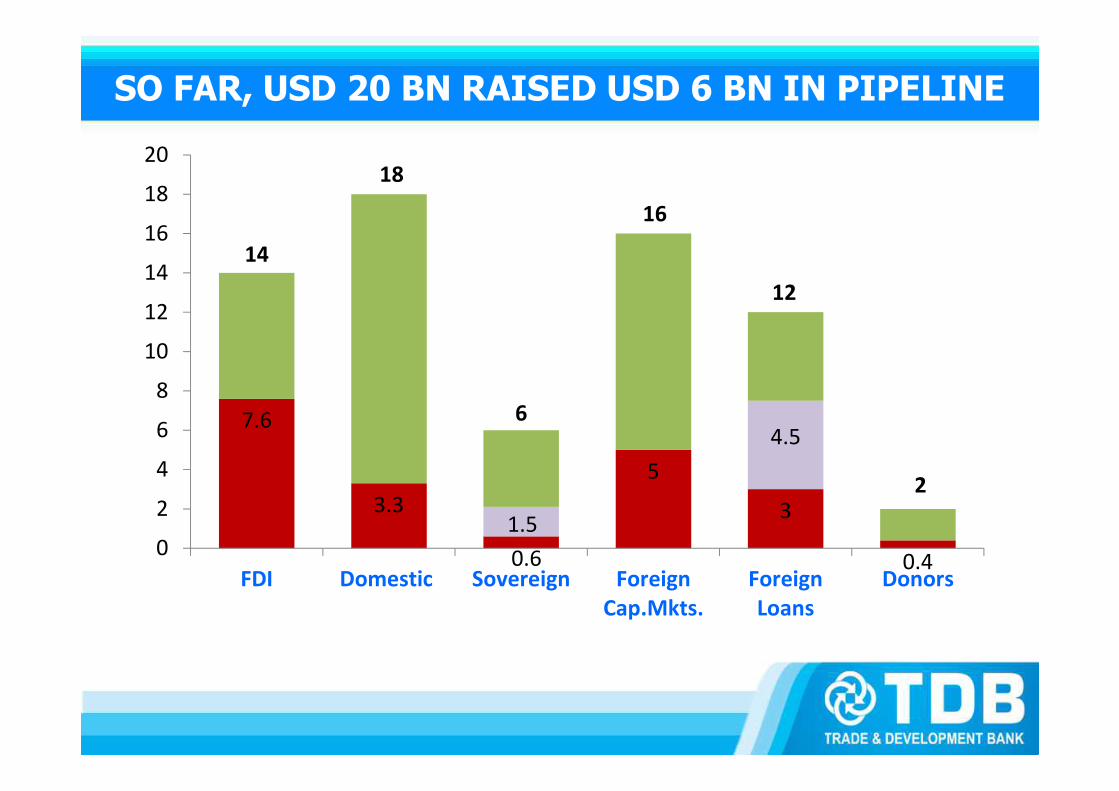
POTENTIAL SOURCES OF FUNDS 2010-2015
• FDI $ 11 bn. to $ 14 bn.
• Domestic sources $ 12 bn. to $ 18 bn.
• Sovereign Borrowing $ 3 bn. to $ 6 bn.
• Foreign Capital Markets $ 11 bn. to $ 16 bn.
• IFI & Foreign bank Loans $ 7 bn. to $ 12 bn.
• Donors and NGOs $ 1 bn. to $ 2 bn.
Total $ 45 bn. to $ 68 bn.
7.6
3.3
0.6
5
3
0.4
1.5
4.5
14
18
6
16
12
2
0
2
4
6
8
10
12
14
16
18
20
FDI Domestic Sovereign Foreign
Cap.Mkts.
Foreign
Loans
Donors
SO FAR, USD 20 BN RAISED USD 6 BN IN PIPELINE

FOREIGN INVESTMENT
0.5 0.7 0.8
1.3
4.8
1.6
2,2
2.8
3.65
4.6
0
1
2
3
4
5
6
2007 2008 2009 2010 2011 2012 2013 2014 2015
USD bln
Actual Projected based on 30% annual CGR 2004 to 2010
Source: World bank and FIFTA

FOREIGN INVESTMENT KEYS
• Clear and consistent legal and regulatory environment
• Fiscal discipline
• Focused infrastructure investment
• Information and education
– Public – importance of foreign investment
– Government – FDI requirements and interest in welcoming foreign investment
– Investors – Mongolia’s enduring strategic advantage in serving China’s needs

CONCLUSIONS
• Mongolia still adjusting to market economy
• Pace and staging of developments has impacted foreign opinion
• Democracy prompts speaking out
• New foreign investment law needs clarifying or changing
• Infrastructure is in focus
• Move to sovereign bond soon signals understanding of conditions necessary for a successful issue

RECOMMENDATIONS
• Engage
- Here
- In Mongolia
- Communicate with all constituents
Come and see us!
Remember, There are more than USD 40 billion of opportunities in the next few years

JUST THREE FULLY LOADED

OR, SKIP THE PLANE CHARTER
Simply wire the funds through TDB
Thank you for your attention!
Juulchin Street - 7
Baga Toiruu - 12
Ulaanbaatar, Mongolia
Tel: 976-11-31 99 43
Fax: 976-11-31 24 18
Email: [email protected]
http://www.tdbm.mn
http://www.bankcard.mn
http://www.mongolianbusinessguide.com

TDB Presentation

Company Overview
Corporate Banking International Banking Treasury Retail and SME Banking
ATMInternet
Bank
Unrivalled Relationships with International FIs
•Maintains 38 nostro accounts in 14 currencies at 27 top rated foreign banks in 16 different countries
•Direct correspondent relationships with >150 foreign financial institutions
•Clean trade finance lines from 32 large foreign institutions
Wide Scope of Products and Services Provided
•44 branches, 107 ATMs, 1170 merchants, 1773 point of sale terminals
•Most advanced virtual banking services, such as Internet Banking service, Mobile Banking Service, E-Billing
•Ability to process payments under Visa, MasterCard, JCB/Discover and Diners
TDB30.8%
Other69.2%
3Q2012, Corporate Loans market share
36.6%
21.3%
29.3%
0%
10%
20%
30%
40%
Goldmarket
Moneymarket
FXmarket
3Q2012, Treasury market share

Company Highlights
■ Profitable and efficient corporate bank uniquely positioned to benefit from Mongolia’s growth potential
■ The “International Face of Mongolia”
■ Increasingly sizeable retail banking platform driven by selectively targeting high income customers
■ Efficient asset and liability management to ensure high liquidity
■ Leadership in profitability and efficiency throughout business cycles
■Market leader in risk management and strong corporate governance
■ Experienced management team with proven track record
2009 2010 2011 2012.09
Total Asset 578.8 1,065.0 1,498.8 1935.4
Total Loans (net) 290.2 369.5 805.5 1110.3
Total Deposits 479.0 912.2 941.1 1540.6
Total Equity 48.0 70.2 100.0 197.4
Net Profit 10.7 16.5 30.2 35.8
Capital Adequacy 13.0% 15.9% 12.7% 14.1%
ROAA 2.1% 2.3% 2.6% 3.1%
ROAE 22.6% 26.9% 39.8% 35.7%
MNT/USD = 1394.47 * Including bonds
Financial Results (mln.USD)*Financial Results (mln.USD)*
Bank Ratings by Moody’sBank Ratings by Moody’s
• Senior Unsecured EMTN (foreign currency) B1• LT/ST Bank Deposits (foreign currency) B2/NP• LT/ST Bank Deposits (domestic currency) B1/NP• LT/ST Issuer Rating B1• Subordinated foreign currency issue B2• Local currency bank deposit B1• Outlook Stable
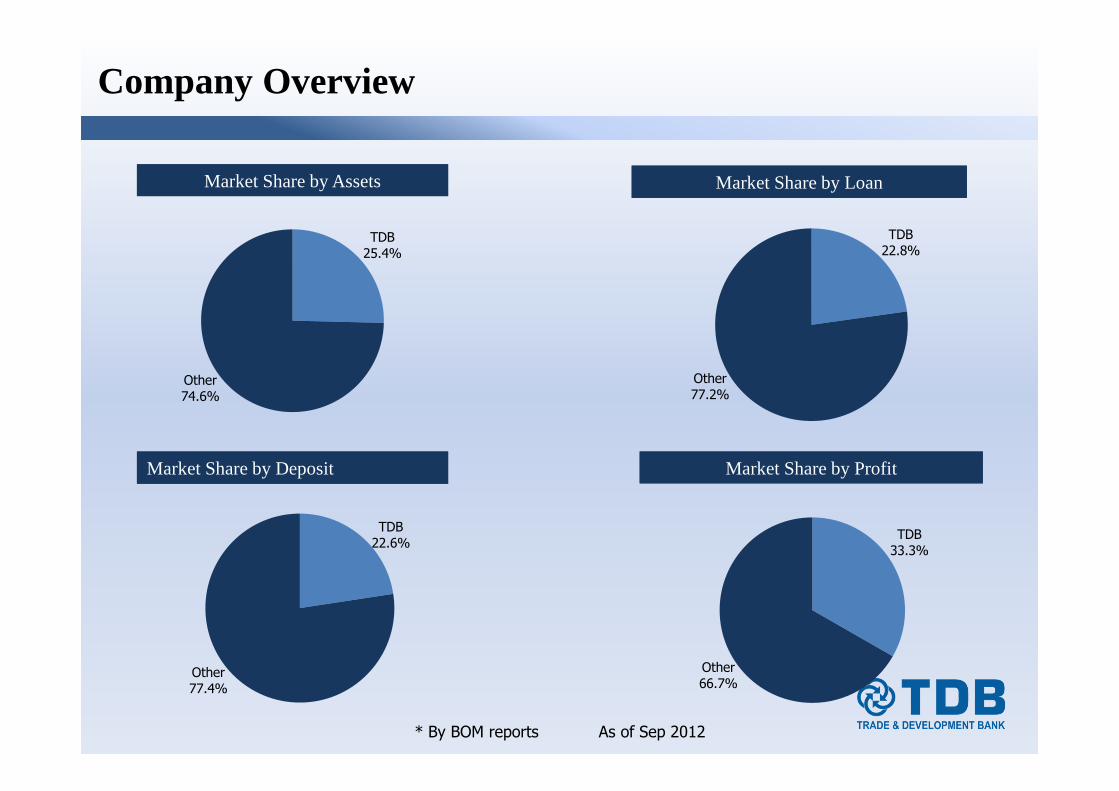
Company Overview
Market Share by AssetsMarket Share by Assets
Market Share by DepositMarket Share by Deposit
Market Share by LoanMarket Share by Loan
Market Share by ProfitMarket Share by Profit
* By BOM reports As of Sep 2012
TDB25.4%
Other74.6%
TDB22.8%
Other77.2%
TDB22.6%
Other77.4%
TDB33.3%
Other66.7%

US Global Investment LLC
Globull Investment & Development SCA
Individual Shareholders
Goldman Sachs Mongolia Investments Limited
Mr. Erdenebileg Doljin
Central Asia Mining LLC The Goldman Sachs Group, Inc
Treasury Stock
50%
100%
50% 100%
100%
65.8%
7.3% 3.8% 4.8% 18.3%
Strive to internationalize and diversify shareholder base demonstrated by Goldman Sachs Group’s recent equity investment
Ownership Structure

Organizational Structure

AccomplishmentsContinuously at the Forefront of Innovation
1990 19921993 1996
2001 20042006 2007
2008 20102011 2012
First state-owned commercial bank
in Mongolia
First Mongolian Bank to adopt International Financial Reporting
Standard
First to Introduce modern banking
technology to Mongolia
First deliver cash services of AMEX, VISA,
MasterCard, JCB and Traveler’s cheque
First to become a member of SWIFT
network
First Mongolian Bank to offer ATM services
First Mongolian Bank to commence gold exports into foreign
markets
First Mongolian Bank to participate
in international syndicated loan
transaction
ADB and IFC injected US$11 mm capital into
TDB - First bilateral investment made into
the Mongolian banking sector
First Mongolian Commercial Bank to be rated by Moody’s and
with credit ratings above the country
ceiling
First Mongolian company to issue in
the international capital markets –US$75 mm senior unsecured bond off
a US$150 mm EMTN Programme
First Mongolian bank to launch international
Martercard and issue Euro MasterCard
First Mongolian company to be a
repeat issuer in the international bond market (US$150 mm senior notes)
Introduced EMV chip card in credit
cards
First Mongolian bank to establish an investment
banking subsidiary which obtained underwriting and brokerage licenses from Mongolia FRC
“Best Trade Finance Bank
in Mongolia” in both 2011 and 2012 by GTR
journal
GS Mongolia Investments Ltd., a subsidiary of The
Goldman Schs Group invested 4.78% in
TDB
First bank to launch
Mongolian T brand card
“Best Bank of Mongolia” by FinanceAsia
FMO provided US$20 mm loan
to TDB
Introduced “Most Money”, an advanced, up to date and high-tech electronic bankingservice

StrategyClear Strategy to Maintain Leadership in Corporate Banking and Selectively Expand into Retail and SME Banking

Company HighlightsProfitable & Efficient Corporate Bank Uniquely Positioned to Benefit from Mongolia’s Growth Potential
… with Steady Rise of Number of Corporate Customers… with Steady Rise of Number of Corporate Customers Diversified Loan ExposureDiversified Loan Exposure
Consistent Growth in Lowest Cost Corporate DepositConsistent Growth in Lowest Cost Corporate Deposit
Agriculture 1.8%
Mining 19.6%
Manufacture 13.3%
Petroleum import 5.9%
Retail and wholesale trading
18.3%
Construction 10.7%
Travel 2.1%
Transportation 2.4%
Mortgage 12.2%
Consumer 12.2%
Other 1.5%
3Q2012 Total Loans Mix by Industry
15,51517,421
19,99122,071
0
5,000
10,000
15,000
20,000
25,000
2009 2010 2011 3Q2012
No. of Corporate Customers
252 267 562 718
Total Corporate
Loans(US$ mm)
207.4341.9 406.2
607.1
0
200
400
600
800
2009 2010 2011 3Q2012
Corporate Deposits

Company HighlightsThe “International Face of Mongolia”
Top Trade Finance Bank in MongoliaTop Trade Finance Bank in Mongolia
TDB49%
Other52%
FY2011 Market Share of Mongolian Trade Finance Transaction
■Maintains 40 nostro accounts in 14 currencies at 29 top rated foreign banks in 16 different countries.
■ Direct correspondent relationship with >150 foreign financial institutions.
■Only Mongolian Bank which has arranged syndicated club deals with foreign banks for MNT58 bln and > USD170 mm since 2005.
■ Clean trade finance lines from 32 large foreign institutions with amount of US$267.57 mm as of Sep 2012.
■ US$35 mm trade finance line
■ US$30 mm trade finance line
■ EUR 21 mm trade finance line
■ US$15 mm trade finance line
■ EUR11 mm trade finance line
29.4
70.3
94.6
2010 2011 1H2012
Leading Bank by Borrowings from Foreign Institutions
(US$ mm)

Company HighlightsThe “International Face of Mongolia”
Only Mongolian Repeat Issuer with Proven Track Record of Debt Repayment in the International Market
Only Mongolian Repeat Issuer with Proven Track Record of Debt Repayment in the International Market
2007
US$75 mm
3-yr Senior Notes
Fully Repaid in 2010
2010
US$150 mm
3-yr Senior Notes
2010
US$25 mm
5-yr Subordinated
Notes
First Mongolian issuer in the international capital market
2012
�US$ 300million 8.5% Unsecured Senior Notes�Under US$ 700 million EMNT Program
Banks
and
Others
15%
Asset
Manag
ers,
60%
Private
Banks,
25%
Investor profile
Asia ,
60%
Europe
, 35%
Offshor
e US,
5%
Geographic demand
Joint Arrangers / Joint Book Runners /Joint Lead Managers
Listing Stock Exchange Rated by

Company HighlightsEfficient Asset and Liability Management to Ensure High Liquidity
Diversified and Strong Funding BaseDiversified and Strong Funding Base
519
881
1368
1935
0
500
1000
1500
2000
2500
2009 2010 2011 3Q2012
Sources of Funding
Consistently High Contribution of Low Cost Deposit
Consistently High Contribution of Low Cost Deposit
Diversified funding base as a result of strong lending relationships with international banks and price leadership in deposit funding
Deposits from customers 54.9%
Interbank deposits and
borrowings FIS 9.8%
Debt securities issued 22.8%
Equity, included subordinated debt 10.2%
Other liabilities 2.3%
41.4% 37.3% 41.2% 43.2%
12.9%12.2%
16.1% 14.9%
44.8% 49.1%41.7% 40.8%
0.8% 1.3% 1.0% 1.1%
0%
10%
20%
30%
40%
50%
60%
70%
80%
90%
100%
2009 2010 2011 2012.09.30
Other Time Savings Current account

Company HighlightsEfficient Asset and Liability Management to Ensure High Liquidity
Well Balanced Asset Composition Well Balanced Asset Composition Asset/ Loan growth exceeds sector’s medianAsset/ Loan growth exceeds sector’s median
Comparison of Assets and Loans to Banking SectorComparison of Assets and Loans to Banking Sector
� TDB Asset Growth 22.9% 65.2% 56.1% 29.1%
� Mongolian Banking Sector Asset Growth 21.1% 41.2% 50.1% 17.0%
2009 2010 2011 2012.09
� TDB Loan Growth (7.7%) 14.3% 141.9% 37.8%
� Mongolian Banking Sector Loan Growth 0.4% 21.5% 72.3% 22.2%
Cash 2.1%Interbank
Deposits 3.9%
Investment Securities 7.5%
Net loan 57.4%
Others 29.1%
66.8%
50.1%
34.7%
53.7%57.4%
0%
10%
20%
30%
40%
50%
60%
70%
80%
0
500
1000
1500
2000
2500
2008 2009 2010 2011 2012.09
USD
mill
ions
Gross Loans Total Assets Loan/Assets

14.20%13.00%
15.90%
12.40%
14.50%
0.00%
2.00%
4.00%
6.00%
8.00%
10.00%
12.00%
14.00%
16.00%
18.00%
2008 2009 2010 2011 3Q2012
Company HighlightsEfficient Asset and Liability Management to Ensure High Liquidity
Decreasing NPLDecreasing NPL
5.30%4.10%
2.50%1.30%
17.10%
11.30%
6%4.80%
2009 2010 2011 3Q2012
TDB NPL Ratio Industry NPL Ratio
Substantial Improvement in Capital BaseSubstantial Improvement in Capital Base
BoMminimum required
level 12.0%
… while Maintaining High Proportion of Liquid Assets Mitigating Liquidity Risk
… while Maintaining High Proportion of Liquid Assets Mitigating Liquidity Risk
47%
67%
43%37%
0%
10%
20%
30%
40%
50%
60%
70%
80%
2009 2010 2011 3Q2012
Minimum Liquidity Ratio set by BOM
>25%
Highest Credit Quality Across Peers (As of Sep 2012)Highest Credit Quality Across Peers (As of Sep 2012)
1.3% 1.3% 1.3%2.3%
0.7%
2.0% 2.3%
1.7%
0.0%
0.5%
1.0%
1.5%
2.0%
2.5%
3.0%
3.5%
4.0%
4.5%
TDB Khan Xac bank Golomt
Loan in arrears NPL ratio
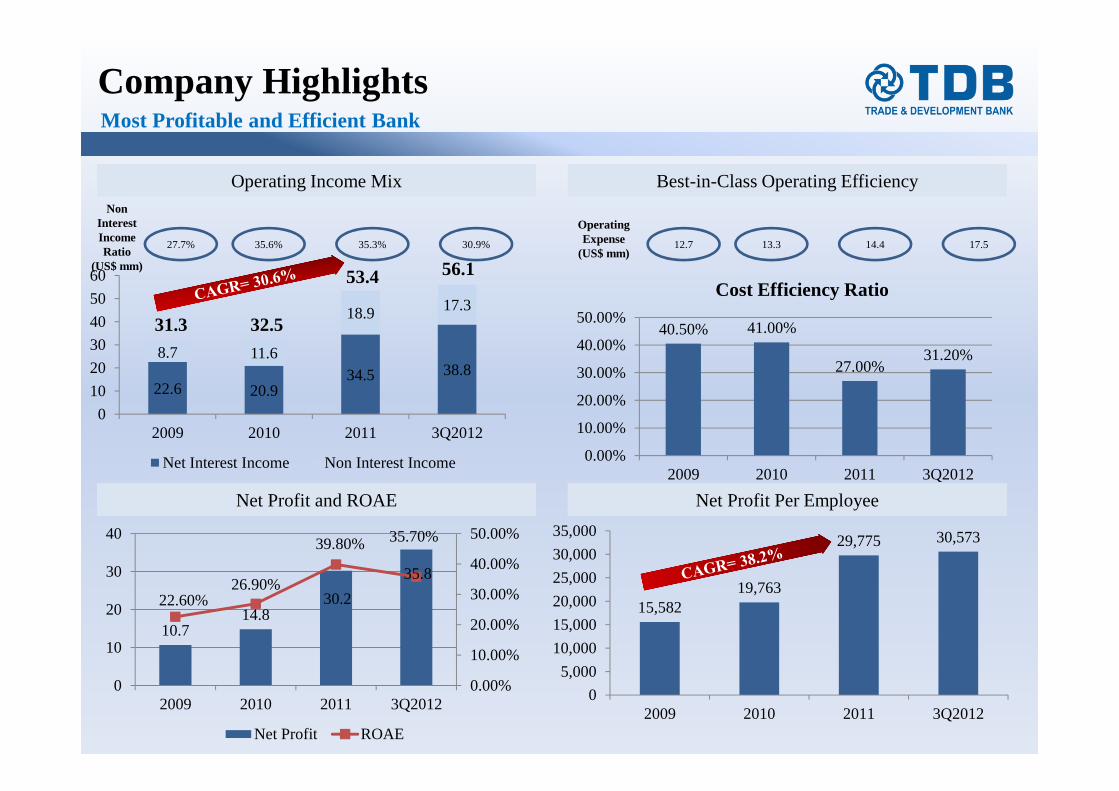
Company HighlightsMost Profitable and Efficient Bank
Operating Income MixOperating Income Mix
22.6 20.934.5 38.8
8.7 11.6
18.9 17.3
0
10
20
30
40
50
60
2009 2010 2011 3Q2012
Net Interest Income Non Interest Income
Non Interest Income Ratio
(US$ mm)
27.7% 35.6% 35.3% 30.9%
31.3 32.5
53.4 56.1
Best-in-Class Operating Efficiency Best-in-Class Operating Efficiency
40.50% 41.00%
27.00%31.20%
0.00%
10.00%
20.00%
30.00%
40.00%
50.00%
2009 2010 2011 3Q2012
Cost Efficiency Ratio
Operating Expense
(US$ mm)12.7 13.3 14.4 17.5
Net Profit and ROAE Net Profit and ROAE Net Profit Per EmployeeNet Profit Per Employee
10.714.8
30.2
35.8
22.60%26.90%
39.80% 35.70%
0.00%
10.00%
20.00%
30.00%
40.00%
50.00%
0
10
20
30
40
2009 2010 2011 3Q2012
Net Profit ROAE
15,58219,763
29,775 30,573
0
5,000
10,000
15,000
20,000
25,000
30,000
35,000
2009 2010 2011 3Q2012
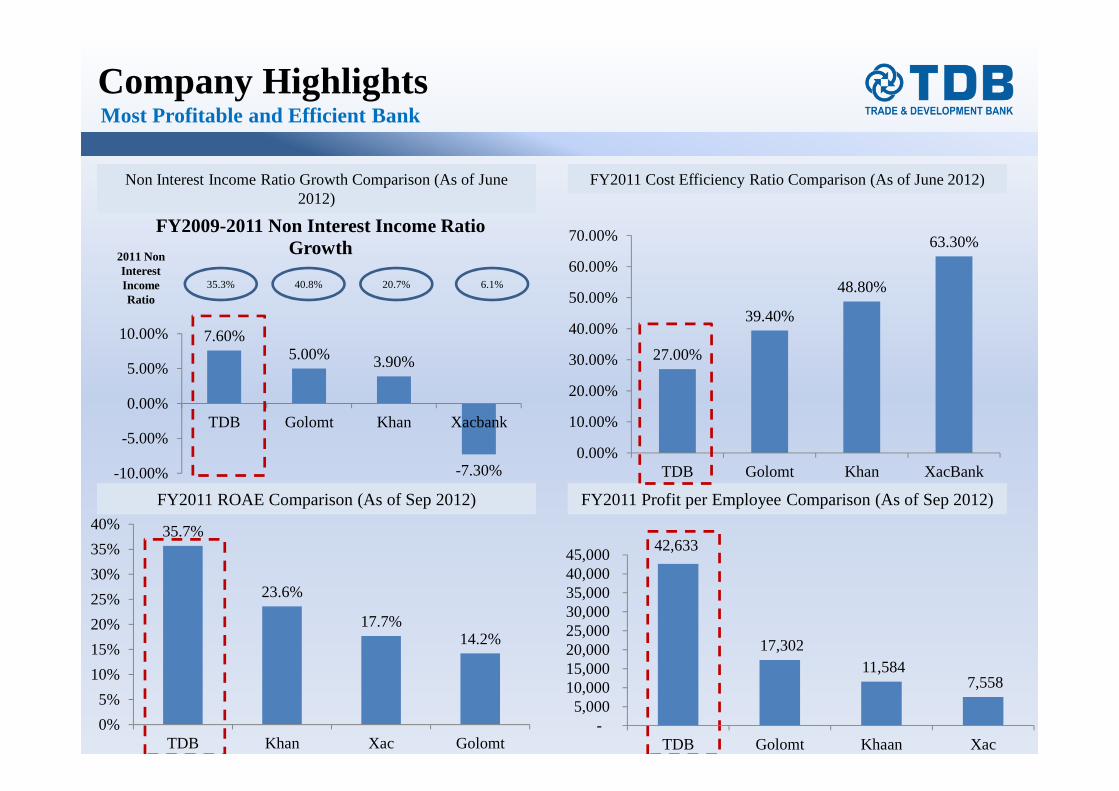
Company HighlightsMost Profitable and Efficient Bank
Non Interest Income Ratio Growth Comparison (As of June 2012)
Non Interest Income Ratio Growth Comparison (As of June 2012)
FY2011 Cost Efficiency Ratio Comparison (As of June 2012)FY2011 Cost Efficiency Ratio Comparison (As of June 2012)
FY2011 ROAE Comparison (As of Sep 2012)FY2011 ROAE Comparison (As of Sep 2012) FY2011 Profit per Employee Comparison (As of Sep 2012)FY2011 Profit per Employee Comparison (As of Sep 2012)
7.60%5.00% 3.90%
-7.30%-10.00%
-5.00%
0.00%
5.00%
10.00%
TDB Golomt Khan Xacbank
FY2009-2011 Non Interest Income Ratio Growth2011 Non
Interest Income Ratio
35.3% 40.8% 20.7% 6.1%
27.00%
39.40%
48.80%
63.30%
0.00%
10.00%
20.00%
30.00%
40.00%
50.00%
60.00%
70.00%
TDB Golomt Khan XacBank
35.7%
23.6%
17.7%14.2%
0%
5%
10%
15%
20%
25%
30%
35%
40%
TDB Khan Xac Golomt
42,633
17,302 11,584
7,558
- 5,000
10,000 15,000 20,000 25,000 30,000 35,000 40,000 45,000
TDB Golomt Khaan Xac

Company HighlightsEfficient Asset and Liability Management to Ensure High Liquidity
Risk Governance FrameworkRisk Governance Framework
Industry leading risk management framework and strong corporate governance to fully control key risks
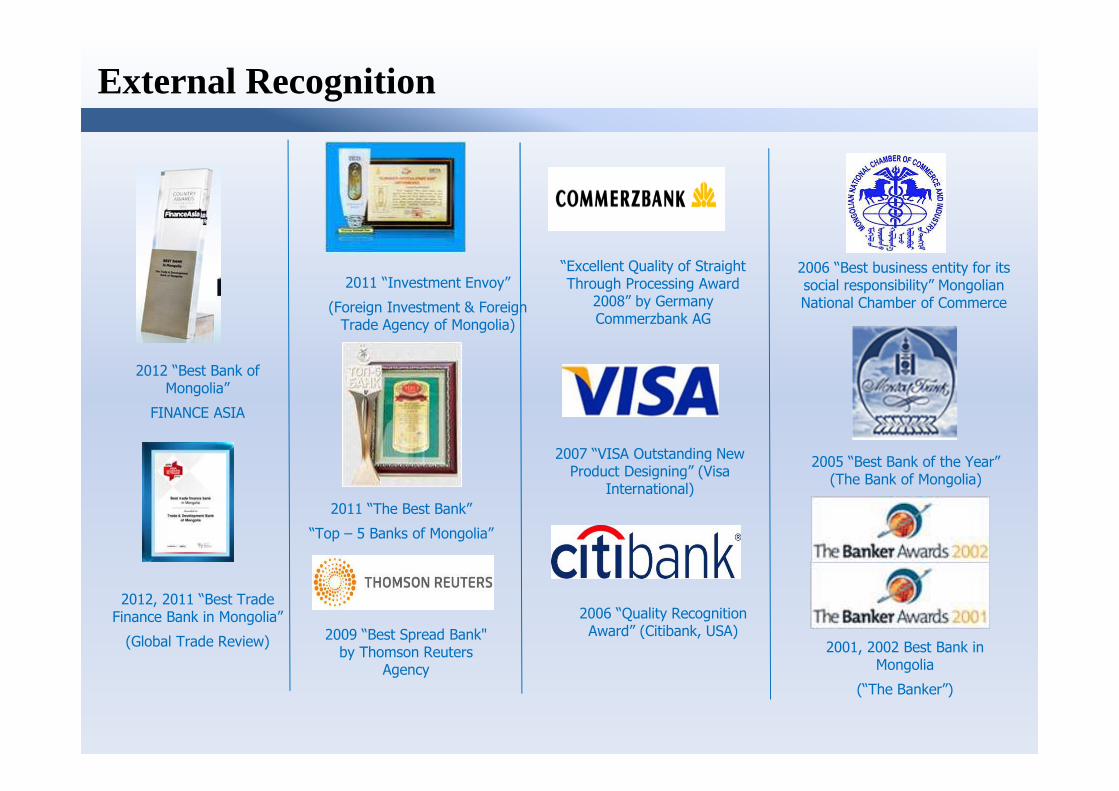
“Excellent Quality of Straight Through Processing Award
2008” by Germany Commerzbank AG
2009 “Best Spread Bank" by Thomson Reuters
Agency
2007 “VISA Outstanding New Product Designing” (Visa
International)
2006 “Best business entity for its social responsibility” Mongolian National Chamber of Commerce
2006 “Quality Recognition Award” (Citibank, USA)
2005 “Best Bank of the Year” (The Bank of Mongolia)
2001, 2002 Best Bank in Mongolia
(“The Banker”)
2011 “The Best Bank”
“Top – 5 Banks of Mongolia”
2012, 2011 “Best Trade Finance Bank in Mongolia”
(Global Trade Review)
2011 “Investment Envoy”
(Foreign Investment & Foreign Trade Agency of Mongolia)
2012 “Best Bank of Mongolia”
FINANCE ASIA
External Recognition

Contact us
Director of International Banking Department
Ms. Erkhembayar BaltsukhTel: +976 11 319943 ext. 1408 Fax: +976 11 312418 Email: [email protected]
TDBJuulchin Street - 7, Baga Toiruu - 12Ulaanbaatar, MongoliaSwift: TDBMMNUBWebsite: www.tdbm.mn