3.3 the textile industry
TRANSCRIPT

1 3 2 Membranesfor Industrial Wastewater Recovery and Re-use
3.3 The textile industry
3.3.1 Categories of textile processing operations
Textile industry processes comprise those which convert natural (e.g. cotton, wool, silk, etc.) and synthetic (e.g. viscose, polyester, acrylic) fibres into fabrics and other products. Four key activities can be identified within this industrial sector (Mattioli et al., 2002):
0
0
0
0
the treatment of raw materials (preparation/production of textile fibres/ yarns), the production of knitted/woven fabrics, the finishing of fabrics (i.e. changing some physical property of the fabric to meet the end use requirement), and production ofproducts (e.g. garments, carpets, etc) from the fabric.
In 1998 world trade in textiles was worth approximately $370 billion, or about 6.3% of global merchandise trade (WTO, 1998). USA textile exports account for $19 billion and imports, principally from Mexico and China, around $77b. Around 60% of textile production takes place in Europe (29%) and the Americas, with most of the remaining production taking place in Asia (Stengg, 2001). Within the European Union, which is characterised by a large number of small-to-medium enterprises, Italy accounts for 3 1 % of all textile and clothing manufacturing activities - more than double that of the UK (1 5%), Germany (14%) or France (13%). Most of this activity is accounted for by clothing manufacture.
A number of textile manufacturing processes are chemical wet processing operations necessary to properly prepare, purify, colour or finish the product. This results in the production of wastewater whose pollution load arises not only from the removal of impurities from the raw materials but also from the residual chemical reagents used for processing. The freshwater demand is specific to the type of textile processing operation, the type of material or final product and the specific machine or technique used. However, the water demand for wet processing operations is invariably high (Table 3.19), more than 5000 m3 day-l for a large mill. The industry is thus perceived as generating large volumes of effluent which are extremely variable in composition and pollution load, the variability arising from the diversity in the types of transformation processes used and the wide range of chemicals involved.
Identifying suitable pollution abatement or water recycling technologies is made difficult by the combining of effluent streams from individual operations, resulting in large variations in effluent chemical composition. Clearly, candidate waste treatment techniques need to be dedicated to individual process effluents, rather than the combined discharge, in order to be reliable and effective. However, this is made extremely difficult in real plants by the sheer number of individual processes contributing to the pollutant load on the combined effluent

lndiistrial waters 1 3 3
Table 3.19 (EPA, 1997)
Subcategory Minimum Median Maximum
Simple processing 12.5 78 .4 275.2 Complex processing 10.8 86.7 276.9 Complex processing plus desizing 5.0 1 1 3 . 4 507.9
Typical water usage, 1 kg' of product, in textile wet processing of woven fabrics
stream. Effluent reclamation and reuse thus only becomes viable for individual wastewater streams, where the compositional variability is reduced, and/or in cases where either the discharge consents are stringent (or else the discharge costs high) or the treated effluent has some added value. Both these criteria are pertinent to dyeing wastewater streams, where the possibility exists both to recover chemicals and recycle the treated wastewater (Diaper eta]., 1996).
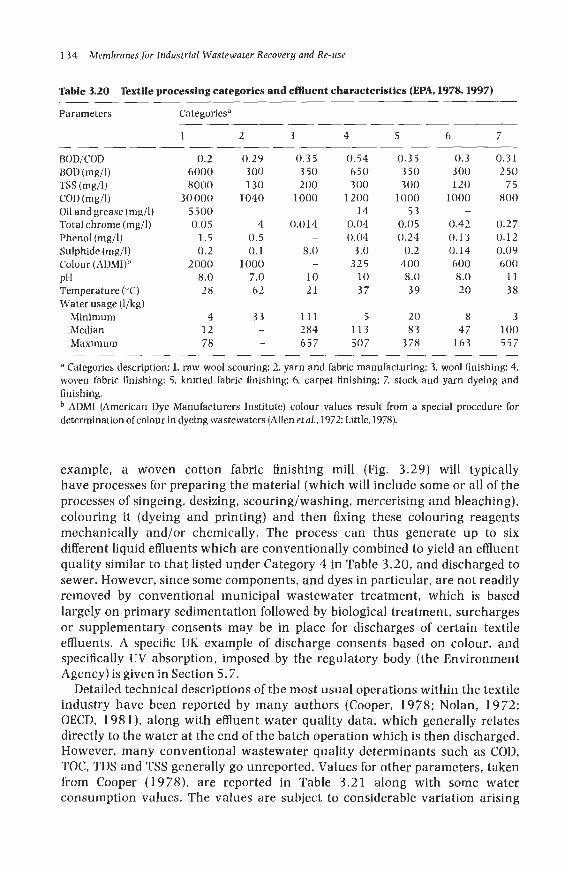
As a rudimentary simplification the USEPA grouped the industry into nine categories in promulgating its guidelines (EPA, 1982). Table 3.20 gives effluent characteristics for the seven most important of categories, these being:
raw wool scouring, yarn and fabric manufacturing, wool finishing,
o woven fabric finishing, knitted fabric finishing, carpet finishing, and stock and yarn dyeing and finishing.
It should be stressed that the figures quoted in Table 3.20 are average figures for complete processes which may entail a number of individual unit operations. Since many textile processing operations are batch, there are broad temporal variations in effluent quality. Variations also arise even within specific individual operations due to the different designs of the actual technology being used. The selection of suitable strategies for pollution abatement and/or water recycling even for specific unit operations is therefore not straightforward, and has to be considered on a case-by-case basis. On the other hand, and in common with most industrial effluent recycling problems:
recycling is simplified by segregation of the various waste streams, and membrane technologies offer the most promise of all candidate treatment processes on the basis of the treated water quality being largely independent of the feedwater quality.
3.3.2 Effluents from textile processing unit operations
The complete textile manufacturing process involves a number of individual unit operations, each generating effluents of substantially different qualities. For
I 34 Membranes for Industrial Wastewater Recovery and Re-use
Table 3.20 Textile processing categories and effluent characteristics (EPA, 1978,1997)
Parameters Categoriesa
1 2 3 4 5 6 7
BOD/COD BOD (mg/l) TSS (mgil) COD (mg/l) Oil and grease (mg/l) Total chrome (mg/l) Phenol (mg/l) Sulphide (mg/l) Colour AD MI)^ PH Temperature ("C) Water usage (l/kg)
Minimum Median Maximum
0.2 6000 8000
30 000 5500 0.05
1.5 0.2
2000 8.0 28
4 12 78
0.29 300 130
1040
4 0.5 0.1
1000 7.0 62
33 -
0.3 5 350 200
1000
0.014
8.0
10 21
-
111 284 657
0.54 650 300
1200 14
0.04 0.04
3.0 325
10 37
5 113 507
0.35 3 50 300
1000 53
0.05 0.24
0.2 400 8.0 39
20 83
3 78
0.3 0.31 300 250 120 75
1000 800
0.42 0.27 0.13 0.12 0.14 0.09 600 600 8.0 11 20 38
- ~
8 3 47 100
163 557
a Categories description: 1. raw wool scouring: 2. yarn and fabric manufacturing: 3, wool finishing: 4. woven fabric finishing: 5, knitted fabric finishing: 6, carpet finishing: 7, stock and yarn dyeing and finishing.
ADMI (American Dye Manufacturers Institute) colour values result from a special procedure for determination of colour in dyeing wastewaters (Allen et al.. 1972; Little, 1978).
example, a woven cotton fabric finishing mill (Fig. 3.29) will typically have processes for preparing the material (which will include some or all of the processes of singeing, desizing, scouring/washing, mercerising and bleaching), colouring it (dyeing and printing) and then fixing these colouring reagents mechanically and/or chemically. The process can thus generate up to six different liquid effluents which are conventionally combined to yield an effluent quality similar to that listed under Category 4 in Table 3.20, and discharged to sewer. However, since some components, and dyes in particular, are not readily removed by conventional municipal wastewater treatment, which is based largely on primary sedimentation followed by biological treatment, surcharges or supplementary consents may be in place for discharges of certain textile effluents. A specific UK example of discharge consents based on colour, and specifically UV absorption, imposed by the regulatory body (the Environment Agency) is given in Section 5.7.
Detailed technical descriptions of the most usual operations within the textile industry have been reported by many authors (Cooper, 1978; Nolan, 1972; OECD, 1981), along with effluent water quality data, which generally relates directly to the water at the end of the batch operation which is then discharged. However, many conventional wastewater quality determinants such as COD, TOC, TDS and TSS generally go unreported. Values for other parameters, taken from Cooper (1978), are reported in Table 3.21 along with some water consumption valucs. The values are subject to considerable variation arising

lndwtrial waters 1 3 5
Woven Fabnc
Figure 3.29 Manufacturingprocesseuofwovencottonfabricfinishing mills (from Correiaet al.. 199 5 )
from differences in design of the specific process technology. For example, beck dying with reactive dyes, at around 38 1 water per kg fabric, can demand almost 10 times as much water as continuous dying with vat dyes (ETBPP, 1997). The data in Table 3 .21 thus relate to expected or most probable pollution loads resulting from each wet chemical unit operation in the textile manufacturing process, and do not incorporate the whole range of water qualities that may be encountered in practice. A more comprehensive listing of individual chemical components arising in specific effluent streams is given in Table 3.2 3.
Specific wet processes used in textile manufacturing are briefly described below. Non-wet processing techniques, such as singeing, printing, mechanical finishing, weaving and fabrication do not give rise to significant quantities of liquid effluent.
Sizing In the transformation of raw materials to textile products sizing is usually the first process in which wet processing is involved. Substances such as starch, modified starch, polyvinyl alcohol, polyvinyl acetate, carboxymethyl cellulose and gums are applied to the warp in order to increase its tensile strength and smoothness. During this operation wastewater results from the cleaning of sizing boxes, rolls, size mixer and sizing area. Their volume is low but, depending on the recipe used, can contain high levels of BOD, COD and TSS (Cooper, 19 78). In the case of 100% synthetic warps sizing, if used, is usually carried out with synthetic polymers. Yarns for use as knitted fabrics are treated with lubricants (mineral, vegetable or ester-type oils) or waxes rather than sizes.

136 Membranesfor Industrial Wastewater Recoveru and Re-use
Table 3.21 Pollution loads of textile wet operations (from Cooper, 1978)
Desizing Scouring or kiering
Mercerising Dyeing Scouring Dyeing
Wool Washing Neutralisation Bleaching
Nylon Scouring Dyeing Scouring
Acrylic Dyeing Final scour Scouring
Polyester Dyeing Final scour
Viscose Scouring and Dyeing Salt bath
Acetate Scouring and Dyeing
Cotton Bleaching
-
10-13 8.5-9.6 5.5-9.5
5-10 9-14
4.8-8 7.3-10.3 1.9-9
6 10.4
8.4 9.7
1.5-3.7 7.1 -
- -
8.5 6.8 9.3
1700-5200 50-2900 90-1 700 4 5-6 5 11-1 800
3 80-2200 4000-11 455
30 000-40 000
28 3 90
1360 368
2190 175-2000 668 500-800 480-2 7 000 650
2832 58
2000
16 000-32 000 7600-17 400 2300-14 400
600-1 900 500-14 100
1129-64448 3855-8315 4830-19267 1 2 4 1-48 30 908
1882 641
1874
1191 833-1968
- -
-
3334 4890 1778
3-9 26-43
3-124 2 3 2-3 08
8-300 46-100 16-22
334-835 104-131
3-2 2 SO-67 17-33 50-67 17-33 67-83 2 5-42 17-3 3 17-33 17-33 4-1 3
3 3-SO
Desrzrng Desizing removes the substance applied to the yarn in the sizing operation by hydrolysing the size into a soluble form. The methods of desizing, and therefore the wastewater characteristics, vary according to the size used (Table 3.22). Desizing can be as simple as hot washing with detergents for synthetic sizes or more complicated, for example enzyme-augmented degradation, for starch and modified starch (PRG, 1983: Nolan, 1972; OECD, 1981). The pollution load of desizing effluents results from surfactants, enzymes, acids or alkalis used in the size recipes, as well as the sizes themselves (Smith, 1989). The generated wastewater can be the largest contributor to the BOD and TS in a mill eMuent (Nolan, 19 72). as indicated in Table 3.2 1. However, if sizing is carried out using synthetic materials BOD and TSS reductions of up to 90% can be achieved on desizing (Smith, 1989).
Scouring Scouring can be performed on both natural and synthetic materials to remove residual reagents. The intensity of the scouring process is dependent on the type of material. Cotton is scoured to remove natural waxes, pectins, spinning oils and other non-cellulosic components using hot alkaline solutions (caustic soda and soda ash) containing detergents or soaps. Herbicides, insecticides, defoliants and desiccants used in the growing of cotton, along with fungicides, such as pentachlorephenols used to prevent mildew during storage and transportation, can also arise in scouring effluents. Cotton scouring waste liquors are thus chemically aggressive and may be toxic. Their solids content,

Industrial waters 13 7
Table 3.22 Pollution load from desizing of 50:50 polyesterkotton (PRG, 1983)
U e s iz i n g
~ ~ ~ ~
Enzyme starch 6-8 3078 6155 1583 288 Polyvinyl alcohol 6-8 200 400 4029 192 Carboxymethyl 6-8 3 14 400 4349 751 cellulose
resulting from the alkali and from impurities in the raw cotton material, is generally high (Table 3.22). Along with desizing, cotton scouring generates very high BOD concentrations. These two processes thus make by far the greatest contribution to effluent BOD in the wet phase processing of cotton goods (Nolan, 1972; Smith, 1989). When synthetic sizes are used desizing and scouring are usually carried out in a single operation. Since synthetic fibres are free from chemical impurities, 100% synthetic fabrics (woven or knitted) require only light scouring in order to remove sizes and lubricants. The process is not normally a significant source of organic or suspended solids pollution. In cases where desizing, scouring and dyeing are performed simultaneously, effluent with an increased pollution load results (Table 3.21).
Raw wool scouring is the highest-polluting operation within the textile industry (Table 3.20). The large volumes of effluent and high levels of contaminants generated by this operation have made it an area of the industry of key concern, and much work has been carried out in this area towards abatement of pollution from this process (BTTG, 1992; Nolan, 1972; OECD, 1981). The pollution load results from impurities present in the raw wool, (wax, urine, faeces, vegetable and mineral dirt, and parasite-control chemicals) together with soap, detergent and alkali used during the scouring and washing processes. The use of some of the more onerous organochlorine chemicals in sheep dipping has been restricted by legislation in recent years, but there remain chemicals such as organophosphates that are still used and so arise in raw wool scouring effluents (Shaw, 1994a,b). Due to their non-biodegradability or toxicity, many impurities in scouring effluents (Table 3.23), such as antistatic agents (synthetic fibres), pesticides, cotton waxes and wool grease or wax, can pose problems in the operation of biological treatment systems. Scouring of woollen goods is generally duplicated downstream to remove added substances. These include oils and weaving sizes or lubricants, which are removed using detergents.
Bleaching Bleaching removes the natural yellow hue of cotton, increasing its whiteness. This operation is generally required if the finished fabric is to be white or dyed a light colour. It is usually carried out by chemical oxidation with sodium hypochlorite or hydrogen peroxide. Auxiliary chemicals such as sulphuric acid, hydrochloric acid, caustic soda, sodium bisulphite, surfactants and

138 Membranes for lndustrial Wastewater Recovery and Re-use
Table 3.23 OECD, 1981)
Pollutants from textile wet processing operations (Corrieaet al., 1995; data from
Process/fibres
Desizing Cotton Linen Viscose Silk Acetates Synthetics Scouring Cotton
Viscose Acetates
Synthetics
Wool (yarn and fabric) Wool (loose fibre)
Bleaching Cotton Linen Viscose Jute
Acetates
Wool Mercerising Cotton Linen Carbonising Wool
Fulling Wool
Substances Organic (biodegradability)a
Inorganic
Na+ Ca2+
Na+ NH4+
NH4+
Na+
Na+
Na+
Na+
Na+ NH4+ K+ Ca2+
NH4+
Na+ NH4+
Na+
Carboxymethyl cellulose (SB): Enzymes (A): Fats (SB): Hemicelluloses (A); Modified starches (B): Non-ionic surfactants (A): Oils (SB): Starch (B): Waxes (SR) Carboxymethyl cellulose (SB): Enzymes (A); Fats (SB): Gelatine (A); Oils (SB): Polymeric sizes (NB); Polyvinyl alcohol (A): Starch (B); Waxes (SB)
Anionic surfactants (A): Cotton waxes (NB): Fats (SB): Glycerol (B); Hemicelluloses (A): Non-ionic surfactants (A): Peptic matter (A): Sizes (A): Soaps (A): Starch (A) Anionic detergents (B): Fats (SB): Non-ionic detergents (B): Oils (SB): Sizes (B): Soaps (B): Waxes (SB) Anionic surfactants (A): Anti static agents (NB); Fats (SB): Non-ionic surfactants (A): Oils (SB): Petroleum spirit (A): Sizes (B): Soaps (A): Waxes (SB) Anionic detergents (A): Glycol (SB): Mineral oils (SB): Non-ionic detergents (A): Soaps (A) Acetate (B); Anionic surfactants (A): Formate (B): Nitrogenous matter (U): Soaps (A): Suint (A): Wool grease (SB): Wool wax (SB)
Formate (B)
Oxalate (B)
Na+NH4+ Co32-so42- Alcohol sulphates (A): Anionic surfactants (A): Cresols (A): Cyclohexanol (A)
Suint (A): Surfactants (A): Wool grease (SB) A 1 3 +
Mn2+ S042-
Naf C032- Acetate (B); Formate (B): Soaps (A): Suint (A): Wool so42- grease ( S B )

lndustrial waters 139
Table 3.23 (continued)
Process/fibres Substances Organic (biodegradability)”
Inorganic
Dyeing Cotton Na+Cr3+ C042-F- Viscose Cu2+ N02-022- Linen Sb3+ S2- Sz032-
K+ so32- NH4+ S042-
Wool Na+ S042- K+ NH++ S032- Cr3+ co32-
CU2+ CI- ~ 1 3 +
Sb3+ Polyamide Na+ C03’-
Acrylic Na+ S042- c1-
cu2+ NH4+
Polyester Na+ S406’- NH4+ c10-
NO3- c1- SO,*-
e-Naphthol (A); Acetate (B); Amides ofnaphtholic acid (B): Anionic dispersing agents (A): Anionic surfactants (A); Cationic fixing agents (NB): Chlor- amines (SB): Formaldehyde (A); Formate (B): Nitro amines (SB); Non-ionic surfactants: Residual dyes (NB): Soaps (A); Soluble oils (SB): Sulphated oils (A): Tannic acid (A); Tartrate (B); Urea (B) Acetate (B): Dispersing agents (U); Formate (B): Lactate (B); Residual dyes (NB); Sulphonated oils (A): Tartrate (B)
Acetate (B): Formate (B): Polyamide oligeines (U); Residual dyes (NB); Sulphonated oils (A) Acetate (B); Aromatic amines (A): Formate (B); Levelling agents (U); Phenolic compounds (A): Residual dyes (NB); Retardants (U); Surfactants (A): Thioreia dioxide (A) Acetate (B); Anionic surfactants (A): Anti static agents (NB); Dispersing agents (A): Dye carriers (SB); EDTA (NB); Ethylene oxide condensates (U); Formate (B): Mineral oils (SB); Non-ionic surfactants (A): Residual dyes (NB): Soaps (A): Solvents (A)
Fireproofing Cotton NH4+ P043- Chlorinated rubber (NB): Melamine resin (NB); Wool Na+ B- Synthetic resin binders (U): Tetrabishydroxymethyl-
Sb3+ CI- : Br- phosphonium chloride (U); Thiorea resin (NB) Ti2+ N03-:F-
Mothproofing Wool Na+ F- Chlorinated compounds (NB); Formate (B):
Waterproofing Cotton Na+ CI- Acetate (B): Dispersing agents (U); Fluoroacrylic Linen K+ esters Wool ~ 1 3 + (U): Formate (B): Gelatine (B): Melamine resins (NB):
K+: ~ 1 3 + Pentachlorphenol laurate (NB)
Paraffin wax (NB); Silicone resins (NB): Stearamidemethyl pyridinium chloride (NB): Stearate (B): Titanates (NB)
a B, biodegradable: A, biodegradable after acclimatisation: U, unknown; NB, non-biodegradable: SB, slowly degradable.
chelating agents are generally used during bleaching or in the final rinses, contributing to the pollution load (Cooper, 1978: Nolan, 1972). Bleaching wastewater usually has a high solids content with low to moderate BOD levels (Table 3.21). The dissolved oxygen content of these effluents may be raised by the decomposition of hydrogen peroxide (Porter, 1990), but residual hydrogen

140 Membranes for Industrial Wastewater Recovery and Re-use
peroxide can cause toxicity problems in biological treatment processes (Cooper, 1 9 78). Only light bleaching, if any, is required when processing 100% synthetic or woollen goods, and the generated wastewater is not a significant source of pollution in such cases (Nolan, 1972).
Mercerising Mercerisation is performed almost exclusively on pure cotton fabrics, which are treated by a concentrated caustic bath and a final acid wash to neutralise them. Its purpose is to give lustre and also to increase dye affinity and tensile strength. Mercerisation wastewaters have low BOD and total solids levels but are highly alkaline prior to neutralisation (Cooper, 1978; Nolan, 1972). The low BOD content arises from surfactants and penetrating agents used as auxiliary chemicals (Table 3.21).
Carbonising Carbonisation is performed on woollen items to remove traces of vegetable matter. The process can be carried out either in conjunction with raw scouring or at the fabric processing stage, depending on the level of impurities and the end use of the wool (Cooper, 1 9 78; OECD, 198 1). Carbonising consists of soaking the material in dilute sulphuric acid followed by neutralisation with sodium carbonate. The material is then dried and the brittle cellulosic matter mechanically removed. The generally low levels of organic materials in carbonisation effluents are due to vegetable matter, whilst the acid treatment yields high levels of dissolved solids. Performing carbonisation in conjunction with raw wool scouring leads to a reduction in the total pollution load of the scouring waste stream (OECD, 1981).
Fulling Pulling stabilises woollen fabrics and gives them a thicker and more compact appearance. It is carried out with soda ash or sulphuric acid in the presence of detergents, sequestering agents, metallic catalysts and hydrogen peroxide in conjunction with mechanical agitation (Nolan, 19 72: OECD, 1981). The fulling solution is then drained and the treated product extensively washed to remove the remaining chemicals. Fulling wastes in combination with effluents generated by subsequent washing operations present, after raw wool scouring, the largest source of BOD in wool processing wastewaters (Cooper, 1978: Nolan, 1972). Most of the BOD arises from soap, detergents and lubricants and oils added to the wool during the production process.
Dyeing Dyeing is carried out to add colour to fabrics or yarn. Identification of generic types of dyeing wastewaters is complicated by the diversity of both the dye chemistry and the operational modes of the dyeing process itself. Although rarely toxic, these wastewaters demand special consideration since they are arguably the most problematic of all textile wastewaters, for a number of reasons:

lndustrial waters 141
0
0
they are produced in large volumes (around 100-150 1 kg-l textile product for the average dyeing and rinsing operation), they are not readily biodegradable, such that conventional municipal wastewater treatment plant will generally remove only around 20-30% of colour associated with synthetic dyes, and they require removal to very low levels prior to discharge if consents based on colour are in place.
0
Dyes are generally small molecules comprising two key components: the chromophores, responsible for the colour, and the auxochromes, which can not only supplement the chromophore but also render the molecule soluble in water and give enhanced affinity toward the fibres (Trotman, 1984). A large number of dyes are reported in specialised literature (Colour Index, 1987). These can be classified both by their chemical structure or their application to the fibre type (Table 3.24). Dyes may also be classified on the basis of their solubility: soluble dyes include acid, mordant, metal complex, direct, basic and reactive dyes; and insoluble dyes include azoic, sulphur, vat and disperse dyes. An alternative dye classification that refers to colour removal technologies (Treffry-Goatley and Buckley, 1991) places the various classes of dyes (with respect to their application) into three groups depending on their state in solution and on the type of charge the dye acquires. Each group can be associated with potential colour-removal methods (Table 3 . 2 5).
Complex chemical and/or physical mechanisms govern the adsorption and retention of dyes by fibres. The adsorptive strength, levelling and retention are controlled by several factors such as time, temperature, pH, and auxiliary chemicals (Nunn, 1979; Trotman, 1984; Preston, 1986; Shore, 1990). A large range of substances other than dyes, auxiliary chemicals used in the dyeing process, can be found in a dye effluent at any one time. The effluent composition and colour is further complicated by the fact that both dye fixation rates (Table 3.2 6) and liquor ratios (the volume of dye solution per weight of goods) vary, and different dye classes may be used for a single dyeing operation (Shore, 1990; Horning, 19 78). Moreover, continuous operation yields smaller volumes of more concentrated dyewaste than batch operation, equating to typically a four-fold factorial difference with respect to dye concentration and a 2.5-fold difference in volume (Glover and Hill, 1993), some typical batch process effluent data being given in Table 3.2 7.
Chemical finishing Chemical finishing processes include processes designed to change the optical, tactile, mechanical strength or dirt-releasing properties of the textile. Optical finishes can either brighten or deluster the textile (NCDNER, 1995; OECD, 198 1). Softeners and abrasion-resistant finishes are added to improve the feel or increase the ability of the textile to resist abrasion and tearing. Absorbent and soil release finishes alter the surface tension and other properties to increase water absorbency or improve soil release. Physical stabilisation and crease- resistant finishes, which may include formaldehyde-based resin finishes,

w @ f3
Table 3.24 Classification of dyes by use and chemical nature (Colour Index, 1987) s 3,
Chemical class" Colour index Fibre type/dye class 2 5 Cellulosic Protein Cellulose Polyamide Polyester Polyacrylic $
2
number
2 f 9
Nitroso 10000-10299 x x X x x X x x Nitro 10300-10999 x x X x x X x x ?+
Azo 11000-36999 X X x x X x x x x x x x X E f:
Azoic 3 7000-3 9 99 9 X 5(
Stilbene 40000-40799 X X B
Carotenoid 40800-40999 X X B Xanthene 45000-45999 x x X X x x X Ls
Acridine 46000-46999 X X X X Quinoline 47000-47999 X X X x x x x X ?
Thiazole 49000-49399 X X X X X X Azine 50000-50999 X X X X x x X Oxazine 51000-51999 X X X X X X Thiazine 52000-52999 X X X X X Sulphur 53000-54999 X X Anthraquinone 58000-72999 X x x x x X x x x x x x x X Indigoid 73000-73999 X X X X Phthalocyamne 74000-74999 X X x x x X X X x x X
a ester
Direct Sulphur Azoic Vat Reactive Acid Mordant Disperse Acid Disperse Basic Disperse Basic Acid Disperse Basic
ri
Triarylmethane 42000-44999 x x X X x x X d
Methine 48000-48999 X X X X f
a B x x x
a Does not include all chemical classes.

Jndustriul wuters 143
Table 3.25 Dye classification with respect to colour removal (Treffry-Goatley and Buckley, 1991)
ClassiEcation Dye class Charge/solution state Technology
Group I
Group A
Group C
Disperse Azoic Vat Sulphur Acid Reactive Direct Mordant Metal complex Basic
Negatively charged Colloidal
Anionic Soluble
Cationic Soluble
Coagulation Membrane Oxidation
Adsorption Ion exchange Membrane Oxidation
Adsorption Ion exchange Membrane Oxidation
Table 3.26 Percentage unfixed dye for different dye types and applications (ETBP, 1997)
Fibre ~~
Unfixed dye, %
Wool and nylon
Cotton and viscose
Polyester A c r y 1 i c
Acid/reactive dyes for wool Pre-metallised Chromic Azoic Reactive Direct Pigment Vat Sulphur Disperse Modified
7-20 2-7 1-2 5-10
20-50 5-20 1 5-20
30-40 8-20 2-3
stabilise cellulosic fibres to laundering and shrinkage, imparting permanent press properties to fabrics. Finishing processes generally involve impregnation of the fabric using a padding and mangle technique followed by a fixation step by heat. Subsequent washing may be carried out to remove residual chemicals. Whilst low in volume, the effluents from these finishing operations are extremely variable in composition and can contain toxic organic substances such as pentachlorophenols and ethylchlorophosphates (Table 3.2 3 ) .
3.3.3 Process water quality requirements
It is generally the case that, in common with many industrial activities, textile processing makes use of mains water whose quality is therefore stipulated by statutory regulations for drinking water. However, water is also provided by abstraction from ground, lake and river water - options made more attractive by

144 Membranes for Industrial Wastewater Recovery and Re-use
Table 3.27 Characteristics of dyeing effluents (Horning, 1978)
Dye Fibre Colour BOD TOC TSS TDS PH (ADW (mg/l) (mg/l) (mg/U (mg/l)
Acid Mordant 1:2 Metal complex Basic Basic Direct Direct (cooper treated) Reactive (batch) Reactive (continuous) Azoic Sulphur (continuous) Vat Disperse (high temp.) Disperse (Atmosf. dyeing) Disperse Disperse Disperse/acid/basic (continuous)
Polyamide Wool Polyamide Acrylic Polyester Viscose Cotton Cotton Cotton Cotton Cotton Cotton Polyester Polyester Polyester (carpet) Polyamide (carpet) Polyamide (carpet)
4000 3200
3 70 5600 1300
12 500 525
3890 1390 2415
450 1910 1245 315 215 100 130
240 135 5 70 210
1470 15 87
0 102 200 990 294 198 234 159
78 160
315 14 210 9 400 5 255 13
1120 4 140 26 135 41 150 32 230 9 170 387 400 34 265 41 360 76 300 39 240 101 130 14 49 258
Disperse/acid/basic Polyamide(carpet) 210 42 130 8 (batch) Disperse/vat Cotton/polyester 365 360 350 9 (continuous)
2028 5.1 1086 4.0 3945 6.8 1469 4.5 1360 5.0 2669 6.6 2763 5.0
12500 11.2 691 9.1
10900 9.3 2000 3.7 3945 11.8 1700 10.2 914 7.8 771 7.1 396 8.3
6.5
450 6.7
691 9.1
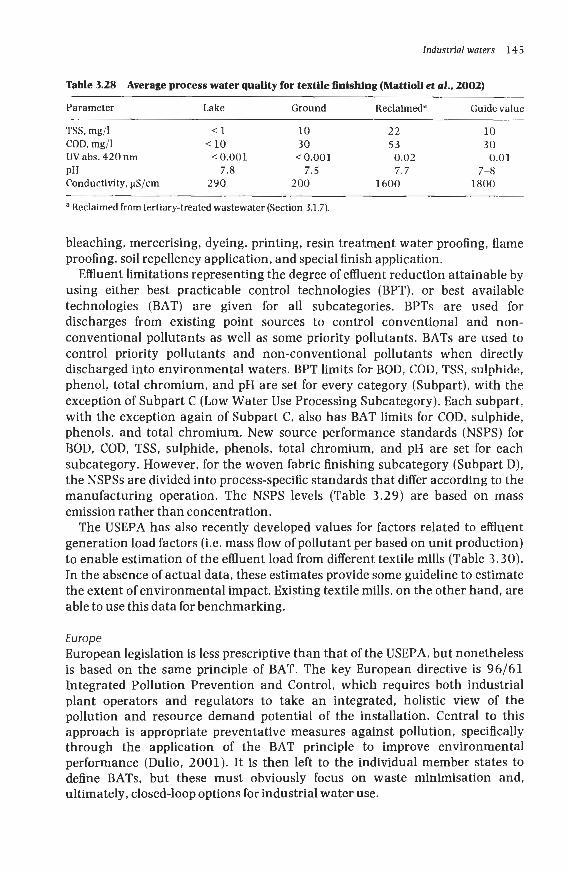
the spiralling costs of mains water. Guide values for key water quality determinants are included in Table 3.28 (Mattioli et al., 2002), which includes process water quality data for three operational textile finishing plants in the Como and Prato textile production areas of Italy. It is evident from these guide values that the water quality requirement is less rigorous than that demanded for drinking water by European Union legislation, which additionally has to be bacteriologically safe, such that tertiary-treated wastewater is apparently suitable for reuse (Section 3.1.7).
3.3.4 Legislation
USA The most important environmental regulation affecting the textile industry in the USA is the Clean Water Act. In 1982 the US Environmental Protection Agency (EPA) promulgated effluent guidelines for the textile manufacturing point source category. The Textile Mills Point Source Category effluent guidelines are listed under 40 CFR (Code of Federal Regulations) Part 410. Part 410 is divided into nine subparts, each applying to a different textile manufacturing subcategory as outlined below. Each subpart contains effluent limitations, new source performance standards (NSPS), and pre-treatment standards. The definition of Subpart D for the woven fabric includes desizing,
Industrial waters 145
Table 3.28 Average process water quality for textile finishing (Mattioli et d., 2002)
Parameter Lake Ground Reclaimed" Guide value
TSS, mg/l < 1 10 22 10 COD, mg/l < 10 30 53 30 W abs. 420 nm < 0.001 < 0.001 0.02 0.01 PH 7.8 7.5 7.7 7-8 Conductivity, pS/cm 290 200 1600 1800
a Reclaimed from tertiary-treated wastewater (Section 3.1.7).
bleaching, mercerising, dyeing, printing, resin treatment water proofing, flame proofing, soil repellency application, and special finish application.
Effluent limitations representing the degree of effluent reduction attainable by using either best practicable control technologies (BPT), or best available technologies (BAT) are given for all subcategories. BPTs are used for discharges from existing point sources to control conventional and non- conventional pollutants as well as some priority pollutants. BATs are used to control priority pollutants and non-conventional pollutants when directly discharged into environmental waters. BPT limits for BOD, COD, TSS, sulphide, phenol, total chromium, and pH are set for every category (Subpart), with the exception of Subpart C (Low Water Use Processing Subcategory). Each subpart, with the exception again of Subpart C, also has BAT limits for COD, sulphide, phenols, and total chromium. New source performance standards (NSPS) for BOD, COD, TSS, sulphide, phenols, total chromium, and pH are set for each subcategory. However, for the woven fabric finishing subcategory (Subpart D), the NSPSs are divided into process-specific standards that differ according to the manufacturing operation. The NSPS levels (Table 3.29) are based on mass emission rather than concentration.
The USEPA has also recently developed values for factors related to effluent generation load factors (i.e. mass flow of pollutant per based on unit production) to enable estimation of the effluent load from different textile mills (Table 3.30). In the absence of actual data, these estimates provide some guideline to estimate the extent of environmental impact. Existing textile mills, on the other hand, are able to use this data for benchmarking.
Europe European legislation is less prescriptive than that of the USEPA, but nonetheless is based on the same principle of BAT. The key European directive is 96/61 Integrated Pollution Prevention and Control, which requires both industrial plant operators and regulators to take an integrated, holistic view of the pollution and resource demand potential of the installation. Central to this approach is appropriate preventative measures against pollution, specifically through the application of the BAT principle to improve environmental performance (Dulio, 2001). It is then left to the individual member states to define BATs, but these must obviously focus on waste minimisation and, ultimately, closed-loop options for industrial water use.

146 Membranes for Industrial Wastewater Recovery and Re-use
Table 3.29 (1 day maximum) in kg/MTof product (EPA, 1997)
NSPSs for liquid effluents from cotton woven fabric finishing: 30 day average
Process BOD COD TSS Sulphide Phenol Chromium pH
Simple 1.7 (3.3) 26.9 (41.7) 3.9 (8.8) 0.1 (0.2) 0.05 (0.1) 0.05 (0.1) (6-9) Complex 1.9 (3.7) 44.2 (68.7) 6.4(14.4) 0.1 (0.2) 0.05 (0.1) 0.05 (0.1) (6-9) Desizing 2.8 (5.5) 38.3 (59.5) 6.9 (15.6) 0.1 (0.2) 0.05 (0.1) 0.05 (0.1) (6-9)
Table 3.30 Pollutant load in kg m-3, median values, from woven fabric finishing (UNEP,
- 1992)
Sub-category BOD COD TSS Oiland Phenol Cr grease
Simple processing 22.6 92.4 8.0 9.1 8.2 4.3 Complexprocessing 32.7 110.6 9.6 3.8 7.7 2.6 Complexprocessing 45.1 122.6 14.8 4.1 13.1 20.9 plus desizing
a N, sufficient data not available to report.
There exist examples of regulatory bodies imposing discharge relating to textile processing activities. One of these concerns the
Sulphide
7.6 12 .5 Na
consents Wigston
sewagetreatment works in the Severn Trent region of the UK, to which a number of dyehouses were discharging coloured effluents. This resulted in the sewage treatment works, which was of conventional design, discharging coloured effluent into the River Sence. The Environment Agency imposed colour consent limits on the works, which Severn Trent Water, the sewerage operator, passed on to the five dyehouses discharging to the sewage treatment works. This dramatically influenced the economics of effluent recycling, as is explained in the case study in Section 5.7.
3.3.5 Conventional treatment
Conventional technologies for textile wastewater treatment mainly comprise biological treatment, precipitation, coagulation/flocculation, flotation, oxidation and adsorption (Table 3.31) , and have recently been reviewed (Vandevivereetal., 1998; SlokarandLeMarechal, 1998; Rott andMinke, 1999; Delee et al., 2002). Since the bulk of the COD for many textile wastewaters is biodegradable most textile effluents are discharged to sewer, sometimes following rudimentary aerobic biological treatment. For high COD loads, such as those arising from desizing of starch or wool washing and scouring, anaerobic pretreatment can be employed (Sacks and Buckley, 1999; Shaw et al., 2002; Delee et al., ZOOZ), although this appears not to have reached commercial scale. Coagulation, often followed by sand filtration, is also extensively used.
The problems imposed by dyewaste, however, are particularly vexing. Biodegradability studies have indicated the feasibility of reducing the BOD and
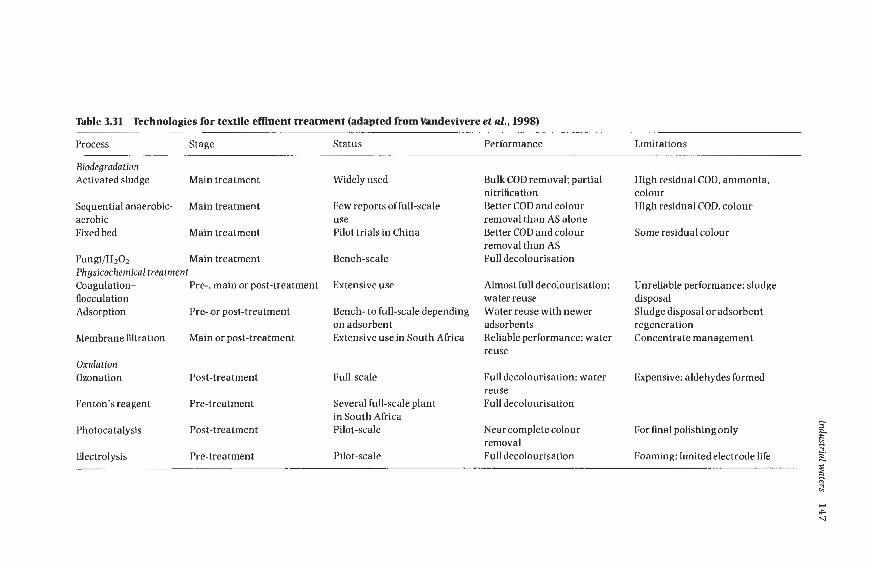
Table 3.31 Technologies for textile effluent treatment (adapted from Wndevivere et al., 1998) -
Process Stage Status Performance
Biodegradation Activated sludge Main treatment
Sequential anaerobic- Main treatment aerobic Fixed bed Main treatment
Fungi/H202 Main treatment Physicochemical treatment Coagulation- Pre-, main or post-treatment flocculation Adsorption Pre- or post-treatment
Membrane filtration Main or post-treatment
Oxidation Ozonation Post-treatment
Fenton’s reagent Pre-treatment
Photocatalysis Post-treatment
Electrolysis Pre-treatment
Widely used
Few reports of full-scale use Pilot trials in China
Bench-scale
Extensive use
Bench- to full-scale depending on adsorbent Extensive use in South Africa
Full-scale
Several full-scale plant in South Africa Pilot-scale
Pilot-scale
Bulk COD removal: partial nitrification Better COD and colour removal than AS alone Better COD and colour removal than AS Full decolourisation
Almost full decolourisation; water reuse Water reuse with newer adsorbents Reliable performance; water reuse
Full decolourisation: water reuse Full decolourisation
Near complete colour removal Full decolourisation
Limitations
High residual COD. ammonia, colour High residual COD, colour
Some residual colour
Unreliable performance: sludge disposal Sludge disposal or adsorbent regeneration Concentrate management
Expensive: aldehydes formed
J For final polishing only a
Foaming: limited electrode life El H 2.

148 Membranes for Industrial Wastewater Recovery and Re-use
COD or TOC of dyeing wastewaters by biological treatment (Horning, 1978; Pagga and Brown, 1986; Willmot et al., 1998; Lorenqo e t al., 2001). Biological colour removal is low, however, unless extended retention times (2-3 days) are employed, since most dye molecules are not biodegradable. The partial treatment of dyes by conventional biological processes is attributed to precipitation (in the case of sparingly soluble dyes) or adsorption on the sludge (Porter and Snider, 1976; Weeter and Hodgson, 1975). Reactive and acid dyes, on the other hand, are not adsorbed on biological sludge to any great degree (Hitz et al., 1978; Slokar and Le Marechal, 1998). The problem of colour from reactive dyes in dyeing effluents is further aggravated by their high commercial popularity and generally low fixation rates (as low as 50% for cotton and viscose fibres) relative to other dye classes. Thus, even though they form only around 2% of the COD in dyewaste, they present the most intractable of problems.
Several physicochemical colour removal methods have been employed at full- scale over the years (Table 3.31). Many studies have focused on ozonation (Lin and Lin, 1993; Perkowski et al., 1996; Matsui, 1996) and advanced oxidation (Solozhenkho et al., 1995; Lin and Peng, 1996) which reliably decolourise a wide range of dyewastes, although there has also been some notable success using the proprietary zeolite-based adsorbent Macrosorb. Having said this, all treatments present particular disadvantages. Advanced oxidation is high in capital and/or operating costs and may create mutagenic products. Coagulation creates significant quantities of sludge, as does powdered activated carbon. Adsorption and ion exchange are generally low in capacity, necessitating large quantities of materials. Also, and in common with membrane processes, they produce a concentrated regenerant product or else, in the case of granular activated carbon, demand an expensive regeneration process. Finally, no single process is universally effective against all dye chemicals - although reverse osmosis is certainly the most effective decolouring and desalting process against the most diverse range of dyewastes, and has been successfully employed for recycling (Buckley, 1992). Crucially, only dense membrane processes offer the opportunity to remove dissolved solids (Section 3.1,7), which would otherwise accumulate for any chemical treatment process).
3.3.6 Demand management
Given the exigencies of textile wastewater treatment, and of dyewaste in particular, it is unsurprising that much effort in cost and environmental impact reduction within the industry has been directed at reducing water and chemicals consumption. There are a large number of documented examples of cost savings in textile fabrication facilities through basic low-cost process modification and effective, less profligate water use. Simple reuse of process water from dyeing, rinsing and bleaching operations without further treatment, as proscribed through water auditing techniques such as pinch analysis (Section 4.2), can provide substantial cost benefits (Table 3.32). There are many other examples of cost savings made through substitution of process chemicals for ones less environmentally onerous (such as starch with PVA/acylates and soaps with

Industrial waters 149
Table 3.32 Process modification cost benefit examples (EPA, 1997; ETPB, 1997)
Company Action Cost benefit
Lancashire medical textile company America1 Corporation
Adams-Millis Co.
Bigelow Carpets
A yarn finishing company
North Carolina facility Lancashire medical textile company Wigan dyehouse
Elimination of two wash cycles from bleaching process Extension of length of dyeing time by 1 5 minutes to improve exhaustion
Reuse of dyebath for nylon hosiery in rotary drum dyeing machines Cycling of dyebath water between pairs of dyeing machines to allow reuse over 20 cycles Reuse of rinsewater three times following mercerising. with evaporation to recover caustic Na2C03
Bleach bath reuse Recycling of last rinse from beam-and- winch bleaching operation Reuse of effluent from bleaching for scouring wash
€1 700 reduction in effluent costs
60% decrease in BOD and COD: 20% drop in FOG: 98% drop in NH,-N. $35 000 decreasep.a. 3 5% decrease in water use ($O.O4/kg product) $60 000 p.a.. plus reduction in effluent BOD and colour
Reduction of 80% TSS, 55% COD and 70% in Na2C03 in effluent (and so HC1 for neutralisation). $189 OOOp.a. (1 yearpayback) 50% reduction in effluent COD €2 700 p.a.
€10 700 p.a. in effluent disposal and water consumption reduction
synthetic detergents, in both cases to reduce effluent BOD levels), and reuse of other process waters, such as coolant (ETPB, 1997). None of these measures, however, can substantially reduce wastewater discharge to the extent possible through effluent recycling.
3.3.7 Reuse practice and opportunities
Reclamation and reuse Given the capital intensive nature of ozonation, which represents arguably the most reliable and established decolourisation process, it is perhaps unsurprising that there exist examples of centralised wastewater treatment facilities based on ozonation (Churchley, 1994; Mattioli et al., 2002). For one region, the Como province of northern Italy, there exist two sewage treatment works (Bulgarograsso STW and Fino Mornasco STW) designed to treat wastewater of which around 50% originates from industrial activity and, of this, over 90% from textile processing operations. Both plants, which have a combined capacity of 100000 m3 per day, are based on conventional primary and secondary treatment with ozonation tertiary treatment following pretreatment either by sand filtration or coagulation/flocculation with lamella settling. Further polishing of the effluent from these works using fixed-film granular activated carbon, i.e. biologically activated carbon or BAC, produced water of a quality found to be suitable for silk degumming and dyeing (Mattioli et al., 2002). Although not extensive, the trial appears to demonstrate the feasibility of recycling of dyewaste that has undergone ozonation tertiary treatment.

150 Membranes for lndiistrial Wastewater Recovery and Re-use
Recycling The textile processes providing the most propitious conditions for application of membranes are fabric coating, desizing, scouring and dyeing. They have been successfully employed at full scale in all these areas for the last 20 years in South Africa, and more recently in other countries.
For two of these operations both the water and the concentrate are reusable. Fabric coating makes use of latex, a relatively expensive chemical, which arises in low concentrations in the effluent as an emulsion, with droplet sizes down to 0.05 pm. The use of ultrafiltration for latex and water recovery allows substantial recovery of the emulsified latex (Groves et al., 1978). The main limitation appears to be from the stability of the latex. Coagulation of the latex on the membrane produces a deposit that can only be removed using appropriate organic solvents and is then no longer recoverable. On the other hand, latex stability can be improved through dosing with appropriate surfactants (Cheryan, 1998). Recovery of synthetic size (polyvinyl alcohol and polyacrylate) is also possible using UF (Porter, 1998), with original reports of successful pilot- scale trials dating back to 1980 (Groves and Buckley, 1980). In this instance the elevated effluent temperature (75°C) both increases the permeate flux and also increases the cost benefit through recovering energy as heat.
Wool scouring produces a high-BOD effluent (Table 3.20) containing detergents, suspended solids, fats, oils and grease (FOG) which can be treated biologically and/or by dissolved air flotation. The use of ultrafiltration, operating at 8-10 bar, permits substantial concentration of the major pollutants in the retentate stream. The concentration factor is typically -7, producing a retentate very high in organics (10-35 wt% COD). The longest established wool scouring UF plant in Europe is in Norway (Bilstad et al.. 1994). This UF plant has been operational since 1989 and achieves > 80% COD removal, nonetheless leaving a filtrate still too high in COD for recycling. An interesting recent development is the emergence of membrane bioreactors for this duty. A zenon hollow fibre submerged MRR has been installed for treating a 13 m3 h-l flow of 3 500-5000 mg I-’ COD wool scouring wastewater in the UK (Bennett, 2000). Polishing of the effluent by a two-stage reverse osmosis concentrator process, which includes interstage pumping, which is designed to attain an overall recovery of 85% (75% from the first stage and 50% from the second). No performance data has been reported for this system, however.
Reviews of the use of membranes for dyewaste treatment have been presented by a number of authors (Buckley, 1992: Cooper, 1993; Diaper et al., 1996). Although not all membrane applications relate specifically to recycling, it is apparent from the performance attainable in terms of rejection and product water quality (Tables 3.33 and 3.34) that recycling of the permeate is possible in many cases. At least two of the more recent studies (Marcucci et al. , 2001; Sojka- Ledakowicza et al., 1998) listed in Table 3.34 have incorporated testing of the recovered water for dyeing. In both cases, it was concluded that the more selective reverse osmosis process was required for a reusable water product.
Dyewaste is characteristically high in dissolved solids and low in suspended solids, with colour arising from exhausted dye (Table 3.20). It is of interest to
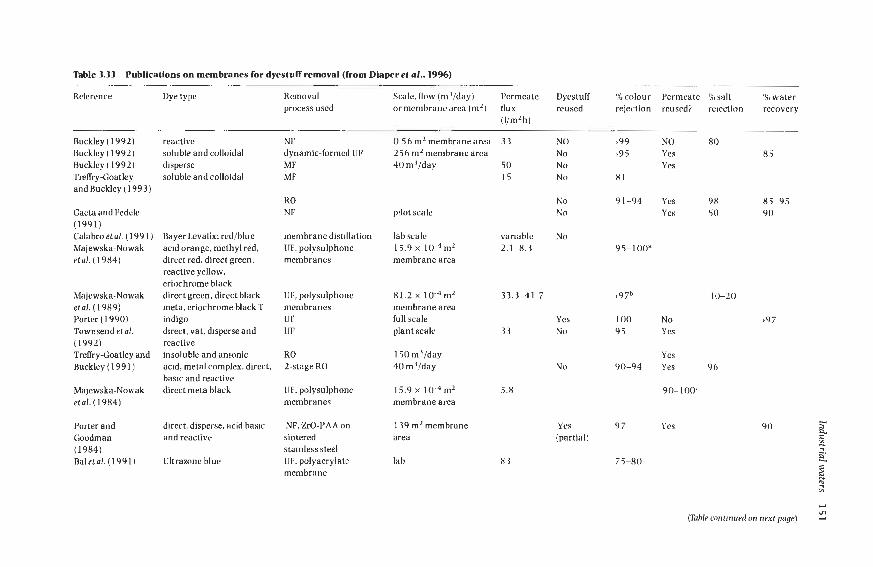
Table 3.33 Publications on membranes for dyestuff removal (from Diaper et al.. 1996)
Reference Removal process used
Buckley ( 19 9 2) Buckley (1992) Buckley (1992) Treffry-Goatley and Buckley (1 993)
Gaeta and Fedele (1991) Calabro et al. (1991) Majewska-Nowak etal. (1984)
Majewska-Nowak etal. (1989) Porter (1990) Townsend et al. (1992) Treffry-Goatley and Buckley ( 199 1)
Majewska-Nowak r t a l . (1984)
Porter and Goodman (1984) Bal et al. (1991 i
reactive soluble and colloidal disperse soluble and colloidal
Bayer Levafix: rediblue acid orange, methyl red. direct red, direct green. reactive yellow. eriochrome black direct green, direct black meta. eriochrome black T
direct, vat, hsperse and reactive insoluble and anionic acid. metal complex. direct, basic and reactive direct meta black
indigo
direct. disperse, acid basic and reactive
Ultrazone blue
NF dynamic-formed UF MF MF
RO NF
membrane distillation UF. polysulphone membranes
UF, polysulphone membranes UF UF
RO 2-stage RO
UF. polysulphone membranes
NF. Zro-PAA on sintered stainless steel IJF. polyacrylate membrane
Scale, flow (m3/day) Permeate Dyestuff or membrane area (m2) flux reused
( W h )
0.56 mz membrane area 256 m2 membrane area 40 m3/day
pilot scale
lab scale 15.9 x 10⁴m2 membrane area
81.2 x 1 0 4 4 2 membrane area full scale plant scale
150 m3/day 40 m3/day
15.9 x 1o4m2 membrane area
139 m2 membrane area
lab
33 NO N o
50 No 1 5 No
No No
variable No 2.1-8.3
33.3-41 7
Yes 33 No
No
5.8
Yes (partial)
8 3
'L colour Permeate 'YO salt '6 water rejection reused? rejection recovery
>99 >9 5
8 1
91-94
95-100"
> 9 7 b
100 95
90-94
97
75-80
NO 80 Yes 85 Yes
Yes 98 85-95 YeS 50 90
No Yes
10-20
>97
Yes Yes 96
90-100'
Yes
P L A
(Table continued on next page) F

Table 3.33 (continued)
Reference Dye tspe Rem o v a I Scale, flow (m3/day) Permeate Dyestuff % colour Permeate %salt %water process used or membrane area (m’) flux reused rejection reused? reject~on recovery
(l/m2h) _ _ _ _ __ ~ ~
Calabro et al. (1990) Bayer Lev* red, blue RO 5 m2 membrane area 22-27 No 1 0 0 8 5-9 5 and red violet
stream area Watters et al. (1991) totaldyehouse waste UF 0.1 1 m2 membrane 27.5-370 34-93
Majewska-Nowak Analogues: direct green, UF: polysulphone 33.2 x lo4 m2, 8 1 . 2 x 3.75-5.0. 9 7 . 8 0 12.9-15.4. (1989) methyl orange, eriochrome polysulphone/poly- 10-4m2membrane 14.6-39.6 8.2-15.3
black. Actualeffluent: methyl methacrylate area direct navy blue, direct membranes violet, direct brown, helion black
a Fordyes with molecular weight > 800. For dyes with molecular weight > 780. For dyes with molecular weight > 739.

Table 3.34 Recent publications on membranes for dyestuff removal
Reference Dye or matrix Removal process Membrane Permeate Colour Permeate %salt area (m2) flux (l/m2h) rejection reused? rejection
(or COD)
Akbarietal. (2002)
Bes-Piaet al. (2002)
Yenetal. (2002)
Voigtetd. (2001)
Marlucci et al. (2001); Ciardellietal. (2001)
Sojka-Ledakowicza etal. (1998)
Acid, direct, disperse reactive Real effluent
Real effluent
Real effluent
Real effluent
Analogue and real effluent
NF (bespoke) 0.00132
Pre-coag. UF. NF (NF70, 0.009 Film-Tec) RO: Film-Tec 0.001 7 TW30-1812-50
Ti02 NF, MWCO 450 Da 5.1
PVDF UF, MWCO 70k Da; Osmonics NF, DL4040F SW, element 130-300 Da. Film-Tec RO Desalination Systems NF 0.0081 (180 M W C O ) and RO
Single
6-18 at 1-4 bar
60a t 1.5 bar, UF; 22, NF 40-60 at 15-45"C, 14bar; 12-60at 3.4-14 bar, 45°C 39-215 at 6-25 bar: 12-60 at CFV 2.5-5 m/s, 15 bar -
8 7-100%
> 9 7% (COD)
72-98% at 3.4-1 4 bar, 45-15°C
70-100%
90% by RO. 0% by UF
9 8 . 7 ~ . 99.7, NF vs. RO
No -10
No 85%
NO 85-98%at 3.4-14 bar and45-15°C
No
Yes (for RO- 40% (NF) NF insufficient for reuse) Yes 2 0 vs. 80%,
NF vs. RO
154 Membranes for Industrial Wastewater Recovery and Re-use
retain the dissolved chemicals whilst removing colour down to very low levels. Ultrafiltration membrane processes allow selective recovery of sparingly soluble dyes, such as indigo, but downstream reverse osmosis is then usually required to remove soluble dyes (Cheryan, 1998; Woerner et al., 1996; Marcucci et a]., 2001; Sojka-Ledakowicza et al., 1998). Having said this, some interesting results have been reported by Porter and his various co-workers whereby low molecular weight anionic dyes were found to be substantially rejected by a titanium dioxide microfiltration membrane (Zhang, 1996; Porter and Gomes, 2000). This was attributed to charge rejection, and charged UF membranes have been successfully employed in South Africa for selectively recovering water and dissolved salts (Erswell et al., 1988).
Most operating membrane-based dyewaste recovery and reuse systems ultimately make use of reverse osmosis or nanofiltration to decolourise. Payback periods are invariably long even where freshwater costs are high, although two bench-scale studies have reported calculated operating costs of between $0.5 and $1 per m3 product (Voigt et a]. , 2001; Ciardelli et al., 2001). For two South Africa installations the payback ranges from just less than three years for an NF process (Buckley, 1992), to over seven years for a system combining ceramic UF with RO (Short, 1993). A payback period of 1.37 years was quoted for a UF/NF plant in North Carolina (NCDENR, 1995), although no further detail was given. Given the continuing downward pressure on membrane costs, the increasing stringency of environmental regulations worldwide and the history of the employment of membranes for textile wastewater treatment and recycling in certain regions of the world, and South Africa in particular, it seems inevitable that the use of membranes for this duty will become more widespread in years to come.
References
Allen, W., Prescott, W.B., Derby Jr, R.E., Garland, C.E., Peret, J.M. and Saltzman, M. (1 9 72). Determination of color of water and wastewater by means of ADMI color values. Proc. 28th Ind. Waste Conf., Purdue University, Lafayette, IN, pp.
Akbari. A,, Desclaux, S., Remigy, J.C. and Aptel, P. (2002). Treatment of textile dye effluents using a new photografted nanofiltration membrane. Desalination, 149,101-10 7.
Bal, AS., Malewar. C.G. and Vaidya, A.N. (1991). Development of non- cellulosic membranes for wastewater treatment. Desalination, 83,32 5-3 30.
Bennett, A.R. (2000). Recovery of wool scouring effluent utilising membrane bioreactor (MBR) technology as part of the activated sludge system followed by two-stage reverse osmosis (RO) membrane concentration. In Hillis, P. (ed.) Membrane technology in water and wastewater treatment, Specialist publication 249, RSC, pp. 219-225.
Bes-Pia, A., Mendoza-Roca, J.A., Alcaina-Miranda, M.I., Iborra-Clar, A. and Iborra-Clar, M.I. (2002). Reuse of wastewater of the textile industry after its
661-6 75.

lndustrial waters 1 5 5
treatment with a combination of physicochemical treatment and membrane technologies. Desalination, 149,169-1 74.
Bilstad, T., Espedal, E. and Madland, M. (1994). Membrane separation of wool scour effluent. Water Sci. Technol., 29,251-256.
BTTG (1992). Water management and effluent treatment in wool scouring industry. British Textile Technology Group, UK.
Buckley, C.A. (1992). Membrane technology for the treatment of dyehouse effluents. Wat. Sci. Technol., 25,203-209.
Calabro, V., Pantano, G., Kang, G., Molinari, R. and Drioli, E. (1990). Experimental study on integrated membrane processes in the treatment of solutions simulating textile effluents. Energy and exergy analysis. Desalination,
Calabro, V., Drioli, E. and Matera, F. (1991). Membrane distillation in the textile wastewater treatment. Desalination, 83,209-224.
Cheryan, M. (1998). Ultrafiltration and microfiltration handbook. Technomic, Basel, pp. 388-393.
Churchley, J.H. (1994). Removal of dyewaste colour from sewage effluent - the use of a full-scale ozone plant. 3 0 , 2 75-284.
Ciardelli, G., Corsi, L. and Marcucci, M. (2001). Membrane separation for wastewater reuse in the textile industry. Resources, Conservation and Recycling, 31,189-197.
Colour Index, 3rd Revision (1987). Society of Dyers and Colourists (UK) and the American Association of Textile Chemists and Colourists (USA).
Cooper, S.G. (1978). The textile industry, environmental control and energy conservation. Noyes Data Co., Park Ridge, NJ.
Cooper, P. (1993). Removing colour from dyehouse wastewaters - a critical review of technology available. J. SOC. Dyers and Colourists, 109,97-100.
Delee, W., O’Neill, C., Hawkes, F.R. and Pinheiro, H.M. (2002). Anaerobic treatment of textile effluents: a review. J. Chem. Technol. Biotechnol., 73, 3 2 3 - 355.
Diaper, C., Correia, V.M. and Judd, S.J. (1996). The use of membranes for the recycling of water and chemicals from dyehouse effluents: an economic assessment. J. Soc. Dyers and Colourists, 1 1 2 , 2 73-282.
Dulio, V. (2001). Integrated pollution prevention and control (IPPC) - reference document on best available techniques for the textile industry. Draft document.
EPA (1978). Textile processing industry, EPA-625/778-002. US Environmental Protection Agency, Washington.
EPA (1982). The Textile Mills Point Source Category effluent guidelines, 40 CFR Part 410.
EPA (199 7). Profile of the textile industry, EPA-3 10-R-9 7-009. US Environmental Protection Agency, Washington.
Erswell, A., Brouckaert, C.J. and Buckley, C.A. (1988). The reuse of reactive dye liquors using charged ultrafiltration membrane technology. Desalination,
78,257-277.
70,157-167.

156 Membranes for lndustrial Wastewater Recovery and Re-use
ETBPP (1997). Water and chemical use in the textile dyeing and finishing industry. Guidance note GG62.
Gaeta, S.N. and Fedele, U. (1991). Recovery of water and auxiliary chemicals from effluents of textile dyehouses. Desalination, 8 3 , 1 8 3-1 93.
Glover, B. and Hill, L. (1993). Waste minimization in the dyehouse. Textile Chemist andcolorist, 25 , 15.
Groves, G.R. and Buckley, C.A. (1980). Treatment of textile effluents by membrane separation processes. In Proc. 7th Int. Symp. on Fresh Water from the Sea. Eur. Fed. Chem. Eng., 2,249-257.
Groves, G.R. and Buckley, C.A., and Dalton, G.L. (1978). Textile size and water recovery by means of ultrafiltration. Prog. Wat. Tech., 10,269-2 77.
Hitz, H.R., Huber, W. and Reed, R.H. (1978). The adsorption of dyes on activated sludge. J. SOC. Dyers and Colourists, 92, 71.
Horning, R.H. (19 78). Textile dyeing wastewaters: characterization and treatment. US Department of Commerce, National Technical Information Service (PB-2 8 5 1 15).
Lin, S.H. and Lin, C.M. (1993). Treatment of textile waste effluents by ozonation and chemical coagulation. Water Res., 27,1743-1 748.
Lin, S.H. and Peng, C.F. (1996). A continuous treatment of textile wastewater by combined coagulation, electrochemical oxidation and activated sludge. Water Res., 30,587-592.
Little, L.W. (1978). Measurement of color in textile dyeing wastewater. Proc. Symp. Textile Ind. Technol., Williamsburg, VA, pp. 307-310.
LorenCo, N.D, Noucis, J.M. and Pinheiro, H.M. (2001). Effect of some operational parameters on textile dye biodegradation in a sequential batch reactor. J. Biotechnol., 89,163-1 74.
Majewska-Nowak, K. (1 989). Synthesis and properties of polysulphone membranes. Desalination, 71,83-95.
Majewska-Nowak, K. and Winnicki, T. (1984). The usability of polysulphone membranes for removal of organic dyes from aqueous solutions. Studies in Environmental Science, 23 .38 7.
Majewska-Nowak, K., Winnicki, T. and Wisniewski, J. (1989) Synthesis and properties of polysulphone membranes. Desalination, 7 1 , 1 2 7.
Marcucci, M., Nosenzo, G., Capannelli, G., Ciabatti, I., Corrieri, D. and Ciardelli, G. (2001). Treatment and reuse of textile effluents based on new ultrafiltration and other membrane technologies. Desalination, 13 8, 75-82.
Matsui, M. (1996). Ozonation. In Riefe, A. and Freeman, H. (eds.) Environmental chemistries of dyes and pigments. Wiley, London.
Mattioli, D., Malpei, F. , Bortone, G. and Rozzi, A. (2002). Water minimisation and reuse in the textile industry. In Lens, P., Hulshoff Pol, L., Wilderer, P. and Asano, T. (eds.) Water recycling and resource recovery in industry. IWA Publishing, London, pp. 545-584.
NCDNER (1995). Case study: Sara Lee Knit Products, North Carolina Department of Environment and Natural Resources.
Nolan, W.F. (1972). Analysis of water pollution abatement in the textile industry. MSc thesis, Clemson University, Clemson, USA.

Industrial waters 15 7
Nunn, D.M. (19 79). The dyeing of synthetic polymers and acetate fibres. Dyers Comp. Pub. Trust.
OECD (1981). Emission control in the textile industry. Organisation for Economic Cooperation and Development, Paris.
Pagga, N. and Brown, D. (1986). The degradation of dyestuff Part 11. Behaviour of dyestuffs in aerobic biodegradation tests. Chemosphere, 15 ,479 .
Perkowski, J., Kos, L. and Ledakowicz, S. (1996). Application of ozone in textile wastewater treatment. Ozone Sci. Eng., 18, 73-85.
Porter, J.J. (1990). Membrane filtration techniques used for recovery of dyes, chemicals and energy. Am. Dyestuff Rep., 22 ,21 .
Porter, J.J. (1998). Recovery of polyvinyl alcohol and hot water from the textile wastewater using thermally stable membranes. J. Membrane Sci., 1 5 1, 45-53.
Porter, J.J. and Goodman, G.A. (1984). Recovery of hot water, dyes and auxiliary chemicals from textile waste streams. Desalination, 49,185-192.
Porter, J.J. and Gomes, A.C. (2000). The rejection of anionic dyes and salt from water solutions using a polypropylene microfilter. Desalination, 128,s 1-90.
Porter, J.J. and Snider, E.H. (1976). Long-term biodegradability of textile chemicals. J. Water Poll. Control Fed., 4 8 , 2 198.
Preston, C. (1986). The dyeing ofcellulosic fibres. Dyers Comp. Pub. Trust. PRG (1983). A guide for the planning, design and implementation of
wastewater treatment plants in the textile industry: Part 1. Closed loop treatment/recycle system for textile sizing/desizing effluents. Pollution Research Group, Pretoria, South Africa.
Rott, U. and Minke, R. (1999). Overview of wastewater treatment and recycling in the textile processing industry. Wat. Sci. Technol., 40( l), 1 3 7-144.
Sacks, J. and Buckley, C.A. (1999). Anaerobic treatment of textile size effluent.
Shaw, T. (1994a). Agricultural chemicals in raw wool and the wool textile industry. J. Inst. Water Env. Management, 8 , 2 8 7.
Shaw, T. (1994b). Mothproofing agents in UK wool textile effluents. J. Inst. Water Env. Management, 8 ,393 .
Shaw, C.B., Carliell, C.M. and Wheatley, A.D. (2002). Anaerobic/aerobic treatment of coloured textile effluents using sequencing batch reactors. Water Research, 36,1993-2001.
Shore, J. (1990). Colorants and auxiliaries. Organic chemistry and application properties: Vol. 2. Auxiliaries. Society of Dyers and Colourists, UK.
Short, C.L. (1993). Decoloring dyewaste. Membrane Industry News, Westford, MA, November.
Slokar, Y.M. and Le Marechal, A.M. (1998). Methods of decoloration of textile wastewaters. Dyes and Pigments, 37, 335-356.
Smith, B. (1989). Pollutant source reduction: Part I. An overview. American Dyestuff Reporter, 78(3), 28.
S6jka-Ledakowicza, J., Koprowskia, T., Machnowskia, W. and Knudsen H.H. (1 998). Membrane filtration of textile dyehouse wastewater for technological water reuse. Desalination, 119, 1-9.
40(1), 177-182.

158 Membranes for Zndustrial Wastewater Recovery and Re-use
Solozhenkho, E.G., Soboleva, N.M. and Goncharuk, V.V. (1995). Decolourisation of azodye solutions by Fenton's oxidation. Water Res., 29,
Stengg, W. (2001). The textile and clothing industry in the EU. Enterprise papers no. 2.
Townsend, R.B., Neytzell-de Wilde, F.G., Buckley, C.A., Turpie, D.W.F. and Steenkamp (1992). Use of dynamic membranes for the treatment of effluents arising from wool scouring and textile dying effluents. Water SA, 18,81-86.
Treffry-Goatley, K. and Buckley, C.A. (1991). Survey of methods available for removing textile colour from waste water treatment works discharge. Proceedings of the 2nd Biennial Conference/Exhibition, Water Institute of Southern Africa, World Trade Center, Kempton Park, South Africa, May.
Treffry-Goatley, K. and Buckley, C.A. (1993). The application of nanofiltration membranes to the treatment of industrial effluent and process streams. Filtration and Separation, 30,63-66.
Trotman, E.R. (1 984). Dyeing and chemical technology of textile fibres. Wiley Intercience, USA, 6th edition.
UNEP (1992). Textile industry and the environment. Technical Report No. 16, United Nations Environment Programme.
Vandevivere P.C., Bianchi, R. and Verstraete (1998). Treatment of reuse of wastewater from the textile wet-processing industry: review of emerging technologies. J. Chem. Technol. Biotechnol.. 72,289-302.
Voigt, I., Stahn,A.M., Wohner, S., Junghans, A., Rost, J. andVoigt, W. (2001). Integrated cleaning of coloured waste water by ceramic NF membranes. Sep. Purification Technol., 25 , 509-5 12.
Watters, J.C., Biagtan, E. and Senler, 0. (1991). Ultrafiltration of a textile plant effluent. Separation Sci. Technol., 26,1295-1313.
Weeter, D. and Hodgson, A. (1975). Alternatives for biological waste treatment of dye wastewaters. American Dyestuff Reporter, 66 ,32 .
Willmott, N., Guthrie, J. and Nelson, G. (1998). The biotechnology approach to colour removal. J. SOC. Dyers and Colourists, 114, 38-41.
Woerner, D.L., Farias, L. and Hunter, W. (1996). Utilization of membrane filtration for dyebath reuse and pollution prevention. In Proc. Workshop on Membranes and Filtration Systems, Hilton Head, SC, February, pp. 140-1 5 1.
2206-2210.
WTO (1998). World Trade Organisation report. Yen, H.Y., Kang, S.-F. and Yang, M-H. (2002). Separation of textile effluents
by polyamide membrane for reuse. Polymer Testing, 21,539-543. Zhang, S. (1996). Filtration studies of sodium nitrate and Direct Red 2 dye
using asymmetric titanium dioxide membranes on porous ceramic tubes. NAMS '96, Ottawa, 18-22 May, p. 49.

Industrial waters 159
3.4 The beverage industry
The food and beverage industries are major consumers of water, with the beverage industry in particular consuming as much as 10-12 tonnes of water per tonne of product - or even more for brewing. The majority of water consumed in this industry is used in washing and cleaning operations, and as such represents significant opportunities for reclaim and recycling. Global water usage within the two sectors is difficult to define, but some available data for beverage production (Table 3.35) suggest global usage of around two billion (i.e. thousand million) tonnes of water per annum. The food industry in the USA alone consumes 4 billion tonnes of water per annum - 50% more than the second largest user, the pulp and paper industry (Levine and Asano, 2002).
The food and beverage industries do not generally reuse or recycle water which is either used in or comes into contact with the product. This is primarily a marketing and public perception issue in the same way as recycling of sewage effluent for potable water has significant consumer acceptance problems (Section 1.1). Since a significant amount of water in the industry does not go into the product, opportunities still exist for water reuse and the quality of water required for use in the product is not normally of concern for recycling. However, the water quality demanded for washing the product or product containers purposes is usually of potable standard, and there is still a reluctance to use recycled water even for these duties. Recycled water must be either recycled at the point of use to avoid additional contamination or recycled to non-product uses, such as utilities (usually power generation and heat transfer) and washing. Fortunately, because food, dairy and, in particular, brewing processes are energy intensive, the utility water consumption in boilers and coolers is quite high and can demand up to twice as much water as the primary production process.
3.4.1 Point of use recycling opportunities
Bottle washers In the dairy and beverage industries the bottle washer is a significant user of water, and most washers have a make-up water flow rate to the final rinse of about 10-20 m3 h-l (which equates to 250 ml per bottle). A proportion of this water is used to pre-rinse the bottles but a significant part of this final rinse water is discharged to drain. The water is generally low in turbidity with a pH of about 10.5 and a conductivity of about 2 500 pS cm-l.
Table 3.35 Global water use, beverage industry
Volume. m3 p.a Global water use. m3 p.a. Average weight ratio
Soft 380 000 000 1140000000 3 drinks Breweries 136 000 000 952 000 000 7
160 Membranes for Industrial Wastewater Recovery and Re-use
Several systems have been used to recycle this water, with various degrees of water product purity. Filtration, pH adjustment and chlorination does not address the high TDS and demands a constant bleed: the treated water quality does not meet potable guidelines and consequently this system has only been used in the event of severe water shortages. Carbon dioxide addition, dealkalisation by ion exchange and UV sterilisation represents an improvement over filtration-based methods and has been implemented in some German facilities. Filtration followed by pH correction and reverse osmosis has been used only in very few installations because of the high capital and operating cost, and can only be justified where both the water and effluent costs are high.
In the majority of cases the water from the final rinse can be used virtually untreated in applications such as crate washers and as pasteuriser make-up after cooling. In addition the water can be collected and used for floor washing. Because the cost of treatment in these cases is negligible, most of the reclaim applications adopt these procedures.
A recent example of water recycling and reuse is at the Coca Cola Amatil plant in New South Wales (Environment Australia, 2001). Two simple recycling initiatives have been undertaken at this plant, the first involving reuse of the backwash water and the second the reuse of container rinse water. Interestingly, the first of these, which recovers around 200 m3 day-' of backwash water from the sand and carbon filters, appears to be blended with the mains water and reused in the manufacturing process. The blend is maintained at less than 1:5 recovered:mains water. The payback time for the recycling system, which comprises pipework and a backwash water recovery tank, is estimated to be around two years. The recovered container rinse water, on the other hand, is used in the evaporative cooling towers following filtration. About 16 m3 day-l is recovered for this duty.
Caustic recovery In the majority of food and beverage applications a large amount of caustic soda is used for bottle washing and CIP (clean in place) applications. The disposal of the spent caustic solution is problematic and expensive. In most cases the effectiveness of the caustic solution is assessed by assaying for carbonate contamination or dirt content: when these levels reach a certain limit the solution is disposed of. The caustic content may still be quite high, however, and nanofiltration membranes have been developed (Koch and PCI Memtech) to clean and concentrate the spent caustic solution. The process plant for this duty is quite expensive, and the economics are such that the plant is only justified if the caustic volume used and cost of its disposal are both very high.
Bottle or can pasteurisers An improperly balanced pasteuriser can use a large amounts of water which is often discharged direct to drain. In most cases this water can be recycled back to the pasteuriser directly after cooling and filtration. Checks must be made on product contamination in the case of bottle pasteurisers.

Industrial waters 161
Malting steep water A significant amount of water is used as steep water in maltings, where the water is used to soak the barley. The effluent contains a high concentration of organics, making it expensive to dispose of. Trials at several maltings have shown that nanofiltration membranes or some types of reverse osmosis membranes can produce water suitable for reuse (PCI Memtech). The cost of the effluent disposal is not reduced, however, as the organic loading rate from the retentate stream to drain remains the same.
Milk processinglcondensate Membranes have been used for many years in the dairy industry for process separation applications (Cheryan, 1 9 9 8). Across the whole food industrial sector dairy applications probably account for the largest proportion of installed membrane capacity. Indeed, it is the selectivity of the membrane filtration processes, in terms of retentate molecular size, which allows fractionation of milk to produce cream and skimmed milk by microfiltration and protein from lactose by ultrafiltration. Since a key membrane property is its thermal stability, generally to around 50-55°C to permit operation at lower fluid viscosities, and chemical stability, to permit more aggressive chemical cleaning and sanitation, polysulphone, polyethersulphone or PVDF membranes (Table 2.3) are generally used.
The use of membranes for other applications such as condensate recovery is now an established technology. In powdered milk production facilities a large amount of steam is used for evaporation purposes, and the condensate recovered from the evaporators is both hot and relatively pure. This makes it ideal for make- up water for the boilers. To remove the organic contaminants special high- temperature reverse osmosis membranes (Duratherm Excel by Desal) are used and the reverse osmosis plants are equipped with sophisticated CIP systems to clean the units on a daily basis.
Other applications Other membrane applications have been used in various industries for effluent reduction and product recovery. These include cross-flow microfitration for beer recovery from tank bottoms (Vivendi Memcor) and vibrating membranes for beer recovery from spent yeast processing (Pall VMFm, Section 2.1.4). These applications can normally be economically justified from savings based not on water but on product recovery and reuse.
3.4.2 End of pipe recovery opportunities
As mentioned in previous sections, once the effluent has been mixed and the risk of contamination has increased, the potential uses of the water are reduced. Effluent from most UK food and beverage industries is discharged direct to sewer and the associated costs paid. To recycle effluent would first involve an effluent treatment plant, generally employing primary biotreatment for high organic loadings with downstream polishing using depth and/or membrane filters,
162 Membranes for lndustrial Wastewater Recoverg and Re-use
possibly preceded by coagulation. In many cases such an option is only marginally economically viable given the current level of effluent charges, cost of plant maintenance and the incentives provided by water companies to keep discharging to drain. However, having treated the effluent to a reasonable level, the costs of treating to a standard suitable for recycling and thereby avoiding water costs often shifts the economics in favour of the plant recycling option.
The economic case is further enhanced if (as in the case of the food and drinks industry) the water is reused in high-quality applications such as boiler feed. This is because the quality of water produced by an RO plant is generally of a higher quality, with reference to key parameters such as hardness, silica and total dissolved solids, than mains water. It is almost certain that the company will already have to treat the mains water separately for boiler use. Often the quality of the RO recycled water will be better than the current feedwater and so that savings in boiler chemicals and heat can be made. When all of these factors are evaluated, the economic case for effluent treatment and recycling may be justified. Several effluent recovery and reuse plant have already been installed in the UK, and it is likely that once the treatment and pretreatment regimes have been established and proved many more will follow.
General aspects of plant design and operation Many plants have used biological treatment plants with filtration and chlorination prior to cellulose acetate-based reverse osmosis. This can work successfully providing the level of filtration (sometimes dual media filtration) is sufficient. The cellulose acetate (CA) membranes are less prone to fouling and can tolerate a chlorine residual (Table 2.3), so biological fouling is reduced. Unfortunately CA membranes are not as widely used within the industry because of higher power costs, and lower rejections and pH tolerance. Composite polyamide membranes are more commonly used and can be used successfully, but pretreatment becomes more critical since they are more prone to fouling than CA membranes. In a few plants employing tertiary media filtration severe problems have been encountered in maintaining the flux within the RO plant. In most cases either a membrane biological treatment process (i.e. a membrane bioreactor, MBR) is required or alternatively ultrafiltration must be used as the basic pretreatment step. The UF configuration and cleaning regime will depend on the upstream process, as determined by pilot trials.
With an effective UF plant or an MBR as pretreatment, the use of polyamide RO membranes should not cause a problem. It is advisable however to use much higher fouling allowances (such as 30-SO%), such that the pump pressures are significantly higher than design projections based on osmotic pressure alone. It has been found in some plants that following initial organic fouling the membrane flux drops to a sustainable level. This must be allowed for in the plant design, and can normally be determined by pilot trials.
Biological fouling can normally be controlled by biocide addition. This can be carried out periodically on line using a non-oxidising biocide, but can only be employed if, as in most cases, the water is not being used for potable applications. In some cases chloramine formation has been used successfully to protect the

Industrial waters 163
membranes. In this case pH control is critical, since at higher pH levels chloramine dissociation takes place resulting in damage to the membrane.
References
Cheryan, M. (1 998). Ultrafiltration and microfiltration handbook. Technomic, Basel, pp. 349-369.
Environment Australia (2001). Cleaner production - recovery and reuse of filter backwash water - Coca-cola Amatil (NSW) Pty Ltd. Environment Australia web site, www.ea.gov.au/industry/eecp/case-studies/cca.html (Accessed February 2003).
Levine, A.D. and Asano, T. (2002). Water reclamation, recycling and reuse in industry. In Lens, P., Hulshoff Pol, L., Wilderer, P. and Asano, T. (eds.) Water recycling and resource recovery in industry. IWA Publishing, London, pp. 29-52.
3.5 Pure waters in the pharmaceutical industry
3.5.7 Background
The pharmaceutical industry is a global one with multinational companies carrying out research and development activities, clinical trials and production on different continents and supplying the products to virtually every country of the world. The industry is relatively unaffected by the “bear” and “bull” markets that typically exert a dramatic effect on other high-technology industries, such as electronics. The market for pharmaceutical products continues to grow as new drugs are developed to treat more and more previously untreatable conditions. This development is being sustained or even accelerated by the new biotechnology-based products passing through clinical trials and coming onto the market.
A pharmaceutical company uses water for many different purposes, many of these being unrelated to the pharmaceutical activities of the company. For such general applications for water, such as for boiler feed, heat transfer, toilet flushing, showering, laundering, fire control, etc., recycle and reuse considerations are no different to those withinother industrial sectors: they are applications that require a water feed and generate an effluent stream, and may or may not be suitable applications for utilising recovered water based on water quality, quantity and processing costs. However, there is nothing about these applications that is changed by their being carried out within a pharmaceutical organisation.
Water is used extensively in the pharmaceutical industry and it is the most frequently used ingredient of pharmaceutical preparations. There are a wide range of products and intermediate products that require a reliable supply of water during their manufacture, including:

164 Membranesfor Industrial Wastewater Recovery and Re-use
0
0
0
0
0 “cosmaceuticals” (antiseptic ointments, concealers), 0 aerosols/inhalers, and 0 injectable drugs.
bulk pharmaceutical compounds/active pharmaceutical intermediates (APIs), over-the-counter (OTC) products -cough medicines, paracetamol, contact lens cleaners, etc., prescription medicines (tablets, ointments, creams, liquids), “health” foods (vitamin tables, energy drinks),
The importance of water and water quality was increased enormously by the introduction of parenteral (injection and intravenous infusion) therapy. Water may be a raw material, a process intermediate, a product ingredient, or even the product itself. Its wide use in many areas related to the production and control of medicines demands that manufacturers pay very close attention to process water quality. Further, apart from “mechanical” errors such as mistakes in labelling of products, final product recalls for problems which can be related back to the water used in production of the drug accounts for the next largest group of product recalls.
In planning and operating a pharmaceutical water system the following are a few of the areas that must be considered:
0 overall requirements for water, 0
0
0
0 capital and operating costs.
specifications and purification methods to be adopted, installation and validation of water systems, routine quality monitoring requirements, and
3.5.2 Water quality standards
The quality of materials used in the manufacture of pharmaceutical products are all defined in pharmacopoeias. The main pharmacopoeias referred to today are the European Pharmacopoeia (EP), the United States Pharmacopoeia (USP 2 5) and the Japanese Pharmacopoeia (JP). The standards defined in these pharmacopoeias are all enforceable in law and all manufacturers of pharmaceutical products are regularly subjected to inspection by medicines inspectors from countries where they have a licence to sell their products. These inspections are carried out to ensure that the manufacturers are meeting the quality and production requirements defined in their product licences, as defined in the pharmacopoeias and as required for compliance with current good manufacturingpractice (cGMP). A company failing to meet these standards may be given a warning letter from the inspection authorities and a defined length of time to rectify the problems. If this does not take place within the stipulated time limit the company may have their licence(s) withdrawn until such time that the problem is resolved.
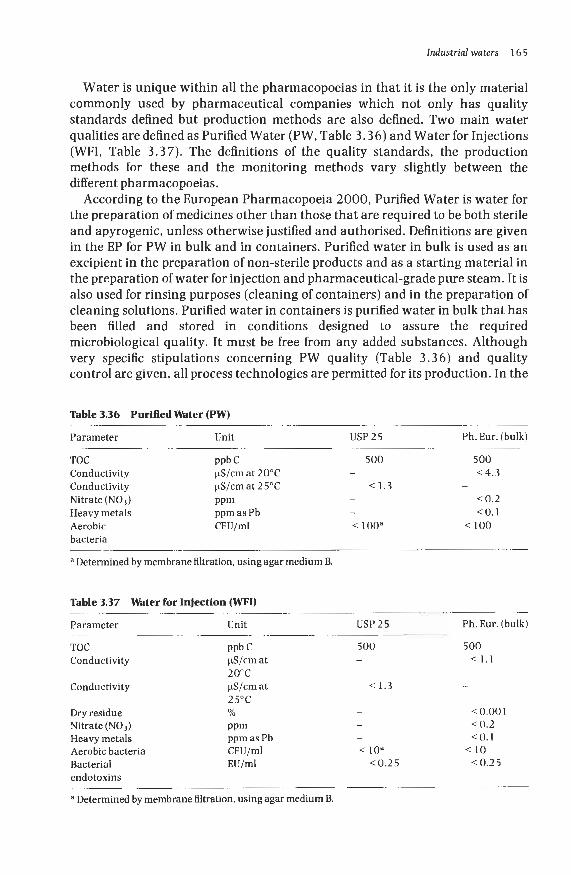
Industrial waters 165
Water is unique within all the pharmacopoeias in that it is the only material commonly used by pharmaceutical companies which not only has quality standards defined but production methods are also defined. Two main water qualities are defined as Purified Water (PW, Table 3 . 3 6 ) and Water for Injections (WFI, Table 3 . 3 7 ) . The definitions of the quality standards, the production methods for these and the monitoring methods vary slightly between the different pharmacopoeias.
According to the European Pharmacopoeia 2000, Purified Water is water for the preparation of medicines other than those that are required to be both sterile and apyrogenic, unless otherwise justified and authorised. Definitions are given in the EP for PW in bulk and in containers. Purified water in bulk is used as an excipient in the preparation of non-sterile products and as a starting material in the preparation of water for injection and pharmaceutical-grade pure steam. It is also used for rinsing purposes (cleaning of containers) and in the preparation of cleaning solutions. Purified water in containers is purified water in bulk that has been filled and stored in conditions designed to assure the required microbiological quality. It must be free from any added substances. Although very specific stipulations concerning PW quality (Table 3 . 3 6 ) and quality control are given, all process technologies are permitted for its production. In the
Table 3.36 PurifiedWater (PW)
Parameter Unit USP25 Ph. Eur. (bulk)
TOC ppb C 500 500 Conductivity pS/cm at 20°C - < 4.3
Nitrate (N03) PPm - < 0.2 Heavy metals ppm as Pb - <0.1 Aerobic CFU/ml < 100a < 100
Conductivity FS/cm at 2 5°C < 1.3 -
bacteria
a Determined by membrane filtration, using agar medium B.
Table 3.37
Parameter Unit USP25 Ph. Eur. (bulk)
Water for Injection (WFI)
TOC PPb c 500 500 Conductivity pS/cm at - < 1.1
20°C
25°C - Conductivity pS/cm at < 1 . 3
Dry residue Yo - < 0.001
Nitrate (NO3) PPm Heavy metals ppm as Pb - <0 .1 Aerobic bacteria CFU/ml < l o a < I 0
- < 0.2
Bacterial EU/ml <0.25 1 0 . 2 5 endotoxins
a Determined by membrane filtration, using agar medium B.

1 66 Membranes for Industrial Wastewater Recovery and Re-use
USP 2 5, there is similarly no stipulation of process for PW production. Organic carbon measurement can be by TOC, a combustion-based instrumental method, or by permanganate value (PV).
Sterilised water for injection is used for dissolving or diluting substances or preparations for parenteral administration. Water for injection in bulk is used in the manufacture of parenteral and ophthalmic products. It is also used for final rinsing of containers (e.g. primary packaging materials) and manufacture of these products. In addition to stipulations concerning quality (Table 3.3 7) and quality control, the EP 2000 stipulates that the water must be produced by distillation. The USP 25, on the other hand, permits both distillation and reverse osmosis.
Potable water, or water intended for human consumption, is also used as feedwater for the production of purified water. Potable water may be used to rinse product-contacting surfaces of equipment. Treated potable water has the same uses as potable water and water intended for human consumption but has been treated to reduce its microbial content. Finally, highly purified water (non- compendia1 water) is used in the preparation of medicinal products where bacterial endotoxins need to be controlled, except where water for injection is required. Current methods for the preparation include double-pass reverse osmosis, reverse osmosis combined with ultrafiltration and distillation.
While the punty levels specified for PW and WFI are not as high as those required in industries such as electronics and power station water systems (Table 1, l), the control of the quality and the documentation related to the system are of paramount importance. In an extreme case, if the quality of water is not achieved a patient may ultimately die when being treated with medication manufactured using that water. Consequently, the pharmaceutical industry invests enormous sums of money to “validate” water systems, a process that continues throughout the life of each water system.
Give that control of product water quality is crucial in this industry, control of feedwater quality is similarly important. The USP includes a section that gives general information on water for pharmaceutical purposes. This section describes different types of water used, i.e. Drinking Water, Purified Water, Sterile Purified Water, Water for Injection, Sterile Water for Injection, Bacteriostatic Water for Injection, Sterile Water for Irrigation and Sterile Water for Inhalation. It begins with the statement that the feedwater used for pharmaceutical preparations needs to be of potable water quality, meeting the requirements of the National Primary Drinking Water Regulations (NPDWR) (40 CFR 141) issued by the Environmental Protection Agency (EPA), since this “ensures the absence of coliforms”. It is also pointed out, however, that meeting the National Drinking Water Regulations does not rule out the presence of other microorganisms, which, while not considered a major public health concern could, if present, constitute a hazard or be considered undesirable in a drug substance or formulated product.
The stipulation of compliance with the national potable water standards is critical, and effectively severely constrains recycling opportunities. This ensures that the level of impurities, inorganic, organic and bacterial, that can be present

Industrial wafers 167
in the water are defined and controlled. In most pharmaceutical facilities municipally supplied drinking water is used as the raw material. In a few facilities local borehole water, or sometimes river water, is used as the starting material but this must be monitored and tested to show it meets the standards required for drinking water.
3.5.3 Volumes and quality of aqueous process and waste streams
Within a pharmaceutical facility there are a wide range of process-related aqueous effluent streams. Firstly there are effluent streams from the water purification process itself. Since these mostly contain the concentrated impurities present in the drinking water supply it is unlikely that such streams would be suitable for recycling within the water treatment system since this would led to accumulation of impurities, but they may be employed in other site applications. The typical waste streams are back-washings from regeneration cycles on multimedia filters, organic scavengers and water softeners. In a pharmaceutical water system it is common practice to remove hardness from the water by passing the feed water through a cation resin exchanger in the sodium form to exchange hardness ions (calcium and magnesium) with sodium. Consequently, the RO reject water will normally be softened filtered water with a conductivity up to four times that of the potable mains feed. Depending on the feedwater conductivity this water may be suitable for use for similar applications as those of recovered grey water, although it cannot be reclaimed within the water treatment system.
Water that may be suitable for recycling within the water treatment system is that which is sent to drain from a final polishing unit, for example the drain stream from an electrodeionisation (EDI) unit (Section 2.1.4), where the level of concentrated impurities is still less than that present in the mains feed supply. The other source may be from water that is sent to drain when the system is in internal recycle. Unlike many applications, a pharmaceutical system is typically designed to have all water in continuous motion with internal recycle loops on the pre-treatment and the purification sections of the plant as well as the final distribution loop. This is because the biofilm growth varies inversely with water velocity: continuous motion of the water suppresses the creation of bacterial colonies or biofilms on the pipe making it easier to maintain control of the microbiological levels. This high-purity water is recirculated and becomes the feed stream to the RO system, such that the reject water is still of a high quality and would be suitable for reclaim back to the start of the water system. The only potential problem with reclaiming this water is that the heat input from the RO pump would also be recovered, such that the temperature of water in the system would gradually increase. This may ultimately result in either a cooling unit or dumping of water to reduce the temperature.
Clean in place (CIP) cycle effluent, depending on the type and stage of the CIP process, may contain significant quantities of product residues and detergents from the first rinse cycle or else could contain virtually pure water from final rinse. Most CIP systems employ a series of cleaning procedures operated at

168 Membranes for Industrial Wastewater Recovery and Re-use
different temperatures and/or using different cleaning chemicals depending on the residues that need to be removed from the equipment. All cleaning cycles normal finish with one or more rinses using drinking water then a final rinse using PW or WFI.
Finally, water may be “dumped” from the system periodically as part of a standard procedure. Until quite recently it was standard practice for all WFI to be “dumped” after 2 4 hours if it was not used in production so that all water could be classed as “freshly produced”. This procedure is not commonly followed now but where it is carried out the water being dumped is of a much higher quality than the drinking water used to produce more WFI. Water is also dumped to regulate the load on the sanitiser where sanitisation by heating to 80°C is conducted. Such water is also of a much higher quality than the mains water used as the feed for the purification system.
In the UK and Ireland the majority of the PW and WFI water systems produce water at between 500 and 5000 1 h-l, although there are some notable exceptions where generation rates are significantly higher. There is often a PW and sometimes a WFI water system installed in each building on a large site: one UK pharmaceutical site has approximately 3 0 PW and WFI water systems on a single site. On smaller sites one generation plant can supply a number of buildings or manufacturing areas via distribution pipework systems.
Since every production process is different, requiring different volumes of water, producing different quantities of effluent with different levels and types of contaminant, it is not possible to estimate typical water usage figures. However, to illustrate the water volumes that might typically be involved a hypothetical system can be considered.
PW and WFI systems in Europe are typically based on generation flow rates of 0.5-5 m3 h-l. There are some notable exceptions utilising higher flow rates and typical system sizes in America also tend to be higher. This hypothetical system is based on a PW production rate of 3 0 0 0 1 h-l and 1000 1 h-l WFI, with a daily process usage of 2 4 000 1 of PW and 8 0 0 0 1 of WFI. The PW system will operate continuous in recirculating mode when no water is being made up to the storage vessel while the WFI still will operate in a stop/start mode. The approximate quantities and qualities of effluent will be in the ranges shown in Table 3.38.
Based on these approximate estimated volumes the maximum volume of effluent water that could be reclaimed is around 3 1 m3 day-l. If the water were passed to a purpose-built reclaim system this volume would rise to around 70 m3 day-’. In practice the water that arises from some of the more contaminated CIP rinses would probably not be reclaimed.
If the main technology used in the reclaim system is reverse osmosis then the likely maximum quantity of reclaimed water which could be returned to the purification system as “raw” water would be around 2 3 m3, based on a recovery of 75% from the RO treatment plant. Based on current costs of around €1.6 per m’ ($2.57 per m3) for purchase of potable water and disposal of effluent water, reclaiming this quantity of water would save only around E37 [$59.5] per day. The operating costs associated with the reclaim system, including maintaining the validation documentation necessary, is estimated to be over E50 [$80.4] per

Industrial waters 169
Table 3.38 Representative data for effluent water generation
Source Flow Comments/assumptions (m3 day-')
Effluent water quality
PW generation
Total CIP. PW
CIP. process water Total WFI CIP. WFI Total
11
13 3 4
3 2 12
24
36 0.8 2 2 8
RO reject while water is made up to PW storage vessel RO reject while system is on recycle ED1 waste stream Pretreatment regeneration/backwash
Assume half of PW is used for final clean rinse stage Initial cleaning cycles - main contain residual product, cleaning chemicals, etc.
10% blowdown over 8 hours From the final rinse stages using WFI water
75 ps cm-' 2 0 0 ~ s cm-l a
High salt and contaminant content
5 ps cm-' *
300-1500 pS cm-'
Feed water conductivityassumed to be 300 pS cm-'. a Candidate water for reclaim within water treatment plant: 30.8 m3 day-lin total, 54 pS cm-'.
day based on electrical usage, maintenance labour, microbiological testing, chemical testing and validation activities. The operating cost of the reclaim system would thus almost certainly exceed the potential saving, even without considering recovery of capital cost, for a small system such as this. Consequently, even without the barrier imposed by the pharmacopoeia specifications and the views of government inspectors prohibiting the use of any starting material other than drinking water, there is unlikely to be an economic justification for reusing effluent water from the process. Any such water would need to be combined with other effluent water from non-process applications on site to make a dedicated reclaim system economically attractive. On the other hand, reuse of some of the more dilute streams, specifically some of the CIP streams and any other high-purity effluent streams within the existing purification scheme would be much more likely to be cost effective.
3.5.4 Reuse opportunities
There appear to be no examples of any facility using recycled plant/process effluent water treated to bring it up to the quality of drinking water and then being used as the feed stream to produce PW or WFI and, under the current regulations, there are no obvious reuse opportunities in the pharmaceutical sector. One UK facility, based in a very remote rural location, submitted a proposal to the Medicines Control Agency (MCA) in the UK for a facility that included effluent recycling plant and they were told that this was not acceptable to the inspection authorities. Since no local effluent facilities existed all their plant effluent had to be collected and removed from site by tanker because of this decision. This situation, which is global, may change if regulations are relaxed

170 Membranes for Industrial Wastewater Recovery and Re-use
Table 3.39
Parameter Units USP 25 Ph. Eur. (bulk)
Highly puriRed water (non-cornpendial water)
TOC Conductivity
Aerobic bacteria Bacterial endotoxins
ppb C pS/cm at 20°C CFU/ml EU/ml
500 < 1.1
< 10 <0.25
and costs of water and effluent disposal increase, the latter being almost inevitable.
It is nonetheless technically possible to reuse effluent at present to generate a usable feed stream, especially given that around 45% of the wastewater is likely to have an aggregate conductivity of well below 100 pS cm-l, based on the data given in Table 3.39, and would thus actually dilute the mains water supply. Much of the effluent produced from pharmaceutical processes has a limited range of contaminants, namely only trace levels of the products being manufactured and very low levels of salts and organics. Also, this effluent is much better characterised and controlled than typical municipal-supplied drinking water, since PW and WFI waters are very low in dissolved matter and the exact nature of the impurities added are known. Consequently, it should be possible to specifically monitor and, if necessary, selectively remove individual impurities introduced from the production environment into the effluent to ensure that the reclaimed water consistently meets the drinking water standard.
For example, PW typically has a conductivity < 1 pS cm-l, i.e. a total dissolved solids concentration of around 0.5 mg 1-l. This content is largely made up of sodium and chloride ions with traces of potassium, fluoride and other small molecular weight ions. If this water is used in the final rinse of a process vessel the only contaminants added will be residual quantities of the products being manufactured, generally a t levels < 1 mg 1-l. The actual quantities of these products will be accurately measured and recorded as part of the validation of the CIP process but will obviously vary between applications. The impurities from other waste streams will generally be the same as those present in the feed water but a t much lower levels, and can be measured using the same analytical methods as are used for potable water.
Water continues to be the most commonly used chemical in most pharmaceutical operations and also continues to be one of the most problematic. One of the largest causes for product recalls are water-related issues, and such an environment imposes a considerable barrier to water recycling. If there is also no strong economic driving force, regardless of the technical feasibility of water recycling, it is unlikely to happen in this industry in the near future.
Chapter 4
System design aids
4.1 Computer-aided design for reverse osmosis plant
Etienne Brauns VlTO
4.2 Water pinch analysis
Danielle Baetens VlTO
4.3 Design examples
Simon Judd School of Water Sciences, Cranfield University

172 Membranes for lndustrial Wastewater Recovery and Re-use
4.1 Computer-aided design for reverse osmosis plant
4.1.1 Introduction
It has already been pointed out (Section 2 . 3 . 2 ) that modelling of filtration processes is not feasible on a universal basis, and that only reverse osmosis can be modelled on the basis of solution-diffusion. In such a case, modelling is possible using simple analytical expressions provided the water can be treated as a continuum essentially free of the more complex interactions introduced by the presence of dispersed particles, solute precipitation effects (gel layer formation) and/or biological activity at the membrane-solution interface. As a result of these complicating factors, which relate largely to porous membrane processes, computer-aided design (CAD) software is currently available only for reverse osmosis membranes and modules. The software packages are based on a series of calculations that enable the estimation of the RO array design and operation. It is instructive to review these CAD packages, which are produced by RO membrane manufacturers and suppliers based on their own products, with a view to ascertaining their general usefulness and limitations (Brauns, 200 1).
4.1.2 Key elements of the reverse osmosis process
Modelling of the reverse osmosis process relies on accurate mathematical representation of
0 the osmotic pressure, 0 concentration polarisation, and 0 the hydraulic resistance offered by the membrane and the membrane
channels.
As already discussed (Section 2.3.1) , the pressure required to drive a reverse osmosis process relates both to the permeability of the membrane and the osmotic pressure. The osmotic pressure is solute concentration related, and can be very high for highly saline solutions: the osmotic pressure for seawater ( 3 5 g lF1 NaCl) is around 2 7 bar. No flow of water takes place unless this pressure is exceeded. At moderate concentration values, osmotic pressure varies almost linearly with concentration for many univalent salts, including sodium chloride, according to the van't Hoff equation (Chapter 2 , Equation (2.9)). In this equation y depends on the degree of dissociation of the salt. Non-linear correlations of ll with C have been fitted to Taylor series and power relationships:
" = RT(YlC1 + y2c2 + . . .) n = yRTC"
Any one of the above relationships may be employed in existing RO design sortware.

System design aids 173
Concentration polarisation (CP) can be quantified from film theory (Section 2.3.2, Equations (2.14)-(2.18)), and its effect on osmotic pressure and scale formation respectively determined from the van’t Hoff equation (or the above modifications thereof) and equilibrium thermodynamics expressions for precipitation (Section 2.4.3). Whilst the effect on osmotic pressure can be calculated with reasonable accuracy, the actual scale deposition rate cannot. This is because the simple expressions outlined in Section 2.4.3 are derived from equilibrium thermodynamics and cannot account for the very wide variations in the scaling kinetics that exist. Indeed, it is quite common for some scalants to remain dissolved at concentrations well beyond the theoretical saturation limit determined from the solubility constant K , (Table 2.14), in a supersaturated state, even without the addition of threshold inhibitors (Table 2.15) to suppress nucleation.
In principle, film theory also permits the optimisation of both the retentate flow rate and the design of the spacer material in the spiral-wound RO element. However, in practice the choice of RO spacer material is dictated to a large extent by cost and, in any case, is not one that can be made by the RO process designer but by the membrane supplier. Similarly, although turbulence, and hence mass transfer, is promoted by a high cross-flow velocity, a practical limit is placed on the retentate flow rate by the construction of the spiral-wound element, which can only withstand a certain maximum hydraulic loading without risk of failure. Failure can be manifested through a phenomenon known as “telescoping”, where the centre of the element is pushed axially outwards by the force of the flow. Since the specific resistance (i.e. the hydraulic resistance per unit length) offered by the membrane channel is constant along the length of the membrane element, the limit on retentate flow rate implies a limit on both the inlet pressure and the pressure drop across the element. For large elements, 1 m long, the maximum pressure drop is normally much less than 1 bar.
Most RO filtration systems are based on the spiral-wound configuration, a noteworthy exception being the Monsanto Prisma hollow fibre membrane. The largest of the spiral-wound elements are 8 inch (about 0.2 m) in outer diameter and 40 inch (about 1 m) in length, with newer membrane elements being 1 . 5 m long, Membrane elements are mounted inside pressure vessels in which they are connected sequentially to give a module length of up to 8 m or more for an 8- element module. These modules can then be arranged in parallel and/or in series to produce a matrix, or array (Section 2.4.1), of membranes with a sufficient total membrane surface area to obtain a specified total permeate flow and permeate quality at an acceptable cost.
Both the appropriate number of elements in the module and the arrangement of modules in the array to obtain volumetric flow information can be arrived at through a simple mass balance (Section 4.3.2) provided the conversion 0 per membrane element can be assumed constant. However, since (a) 0 must necessarily be a function of both the transmembrane pressure (TMP) and the osmotic pressure n, and so of the solute concentration, and (b) the solute flux through the membrane and the fouling propensity are both critically important, a simple water balance is normally insufficient. To obtain water quality

174 Membranes for lndustrial Wastewater Recovery and Re-use
information a mass balance of the solutes is necessary. This is considerably more complex than the water balance solution, which is obtained analytically using Equation (2.22). because of the interrelationship between TMP, 0 and n, and the complicating influence of concentration polarisation (Section 2.2.3). This means that the impacts of the individual design parameters on operation (Table 4.1) are largely interdependent, and that the array design solution is then only obtainable iteratively.
To enable these array design calculations to be carried out, RO design software packages are available for specific RO membrane products. Such software enables the designer to simulate operation of any RO array under any set of operating conditions. These packages (Table 4.2) are intended to allow the user to produce an RO array design from base information, such as the required product flow rate, overall process conversion and feedwater characteristics. The membrane suppliers offer their own RO software to the (prospective) customer gratis. Specific software from universities is also available, or else is under development, at institutions such as RWTH Aachen and Saarland University in Germany, University of Wales Swansea in the UK and the European Institute of Membranes at the University of Montpellier in France. Some of these groups are developing software for nanofiltration.
The starting point for all design packages is the feedwater composition. Whilst data for the principal ions may be available, this is not always the case for some scalant components, such as barium or silicate. These ions form extremely insoluble precipitates, such that they may be close to saturation even at very low concentrations. Most feedwaters, and industrial effluents in particular, are subject to temporal fluctuations in composition, and this has to be accounted for
Table 4.1 RO design parameters
Parameter Impactd
Feedwater composition Feedwater pH Scaling. membrane stability Feedwater temperature Flux. membrane stability Permeate flux
Cross-flow velocity Membrane material
a Primary or most important in bold type.
Osmotic pressure, scaling, membrane stability, permeate quality
Transmembrane pressure, concentration polarisation, fouling, pressure loss Concentration polarisation. fouling. pressure loss Membrane stability, permeate quality, fouling
Table 4.2
Company
Dow Filmtec Rosa Hydranautics Hydranautics Rodesign, Rodata Koch Koch (Fluid Systems) Ropro, Costpro Osmonics Osmonics, Desal WinFlows Toray. Ropur. Trisep
Relevant RO design software
Membrane name RO software
Toray. Ropur. Trisep WinCarol, 2p flows

S,ystetn design aids 1 7 5
when entering data into the design package. It is also invariably the case that experimentally-determined ionic composition data do not yield an electrically balanced specification. RO design software packages tolerate, to a certain extent, an ion imbalance in the feed composition. Exceeding some predetermined limit of this imbalance normally prompts a request to artificially adapt the total ion balance by compensation (anion or cation). The total ion balance is then usually corrected through the addition of sodium cations or chloride anions, since these ions do not have a substantial impact upon the RO process design and operation. Aggregate aspecific determinants, such as total organic carbon and total dissolved solids, cannot normally be usefully entered into the design package. Most design packages allow entry of data for the most common scalants, such as the sulphates or carbonates of calcium, magnesium, barium, strontium and iron, but not the more unusual compounds, such as sulphides of many divalent metals, that can arise in some industrial effluents (Table 2.14).
The composition of the feed determines both osmotic pressure and scaling propensity. These are increased both by the conversion, the ratio of permeate to feed flow, and the degree of concentration polarisation (CP). In most software packages a limit is placed on the CP coefficient (normally denoted as p- coefficient). For example, for the RoPro package produced by Koch-Fluid Systems the maximum p-coefficient value is 1.1 3 . This limit is based on experience, rather than anything derived from first principles. A warning is normally given when the retentate scalant concentration exceeds its equilibrium solubility limit, demanding remedial measures in the form of appropriate pretreatment (Section 2.4.3) or else reduced flux.
Other specific feedwater quality determinants of importance are the pH and temperature. The feed pH is of particular significance since it has an impact upon both scaling propensity and membrane integrity (see below). Precipitation of hydrolysable scalants is suppressed at low pH levels and most RO CAD packages allow for pretreatment with acid or base. The feedwater temperature has a direct impact upon the permeate flux through the viscosity (Section 2.3.1 ), as well as on scalant solubility and biological growth. Calcium carbonate solubility and biological growth both decrease with increasing temperature, whereas the viscosity (and hence the overall permeability) increases. Since the latter is normally the most important temperature effect, it is crucial, when designing the plant, to base the design on the lowest temperatures likely to be encountered.
Membrane stability has already been discussed (Section 2.1.3). Reverse osmosis membrane materials are all polymeric and have varying levels of chemical stability. The two membranes materials most frequently employed are cellulose acetate (low cost, chlorine resistant but limited rejection and subject to alkaline hydrolysis a t pH levels above 6) and aromatic polyamide (high rejection, resistant to hydrolysis but more expensive and susceptible to oxidation by chlorination), The choice of both the membrane material and module will obviously depend upon the application, since parameters such as requirement for sanitisation. feedwater temperature and pH fluctuations and fouling propensity can be critical.

176 Membranes for lndustrial Wastewater Recovery and Re-use
The system hydraulic resistance has a significant impact on the specific energy demand (i.e. the energy consumption per unit, permeate product volume). High retentate flow rates reduce concentration polarisation, and hence may be expected to increase the flux, but also increase the pressure drop along the length of the membrane element. A high retentate flow rate is associated with a large transmembrane pressure (TMP), and hence a higher flux and recovery. However, this results in an increase in CP. Clearly, there is a balance to be struck between the pressure and the membrane area requirement, such that the flux is not unreasonably high at the module inlet and the cross-flow velocity not reasonably low at the outlet.
It is normal practice to provide a high membrane area by linking several membrane elements in a single module, and by staging (Section 2.4.1) when the retentate flow decreases by 3 3 or, more usually, 50%. Many RO plant comprise so-called “2-1” arrays, where the flow entering the second stage of the array is half that of the first stage. Staging reduces the membrane area requirement but can also lead to substantial retentate pressure losses. An intermediate pump may then be required to increase the feed pressure to the second stage: this process is sometimes referred to as a “two stage concentrator” where, in this instance, the stage may include sub-stages.
Another way of increasing the overall recovery is to recycle a fraction of the retentate to the feed inlet port of the bank, producing what is normally referred to as a “single pass with recycle” process configuration. This increases the retentate flow rate as a result of combining the recycle stream with the feed stream, such that it is possible to increase the recovery while still maintaining the same degree of concentration polarisation. However, the increase in the retentate concentration has a negative impact on both the scaling propensity and the permeate water quality. It is also possible to treat the permeate from the first stage, producing a “twin pass” system (Fig. 2.21).
4.1.3 RO design software
The design of an RO plant involves the adequate specification of parameter values and an appropriate choice of process design. As a result of the multitude of parameters, complex interactions and different design variants, it is not possible to produce RO software able to automatically produce the ideal RO design for a specific application. The design process essentially proceeds by trial-and-error through selection of different types of membranes, design variants and operating parameter values, with the software package indicating when the selected design is unreasonable and (usually) identifying the cause. The packages therefore all demand a rudimentary understanding of the RO process and the effect of the design parameters. Provided this is the case, the packages are normally quite user-friendly and perhaps even didactic in construction. Most have an input “wizard” that guides the user through each of the design elements in sequence. The individual inputs are listed below.

System design aids 1 7 7
Feedwater quality The quality of the feedwater(s), comprises composition, pH and temperature, i typical window (from Rodesign by Hydranautics) being shown in Fig. 4.1. Mos design packages allow entry of concentrations as either mg/l (i.e. ppm) or meq/l with some also incorporating “ppm as CaC03”. Only the most common ions arc included, however. Hence, any other ions that need to be added to the feedwate: specification must have their permselectivity properties entered. If no sucl rejection data is available, and they can only realistically to be obtained througk experimental measurement, then there is nothing to be gained by adding them tc the specification. All major suppliers’ packages will prompt if correction of thc analysis with sodium or chloride is required to attain electroneutrality. P number of different feedwater streams can be specified for most of the desigr packages.
Flows and conversion Flow rates and/or the overall conversion is also a required input (Fig. 4.2, fron RoPro by Koch-Fluid Systems). Flow rates can be entered in both imperial an( metric units, and it is usual to specify one of the flow rates (feed or product and the recovery. Some packages allow for bypassing of the membrane array b! part of the feedwater. Most of them have a simple percentage fouling allowancc that the user can enter to correct for a lower, more conservative estimate o permeate flux when calculating the design.
Figure 4.7 Feedwater quality dialogue box (Rodesign, Hydranautics)

178 Membranes for Industrial Wastewater Recovery and Re-use
Figure 4.2 Flow specification dialogue box (ROPRO, Koch-Fluid Systems)
Process design variant The process design variant (single pass, twin pass, etc.) normally has to be specified at the start of the design process, and can be selected from a drop-down menu or a dialogue window. The default selected is always the simple single-pass plant. Obviously, the more complex the process design, the more information required to be entered. Fig. 4.3 shows a two-stage concentrator RO plant dialogue window.
Array design The core of the RO process is the design of the array, in which the number of stages and trains (i.e. rows of modules) must be defined. The definition of a single stage, or bank, includes the number of pressure vessels (i.e. modules), the number of membranes in each vessel and the membrane type. The latter can range from low-selectivity, low-cost softening membranes to the more permselective membranes used for seawater desalination. It is not possible, and not sensible, to specify more than one membrane type in a single pressure vessel or bank, although different membranes may be selected for different stages. Membrane type is selected from drop-down menus that, of course, offer membrane materials specific to the membrane supplier. In some cases, such as ROPRO by Koch, the user can enter an approximate design flux, such that the array can be calculated from this figure, the overall recovery and the properties of the membrane selected. Otherwise, a preliminary value for the number of elements per module can be calculated from the overall required permeate flow
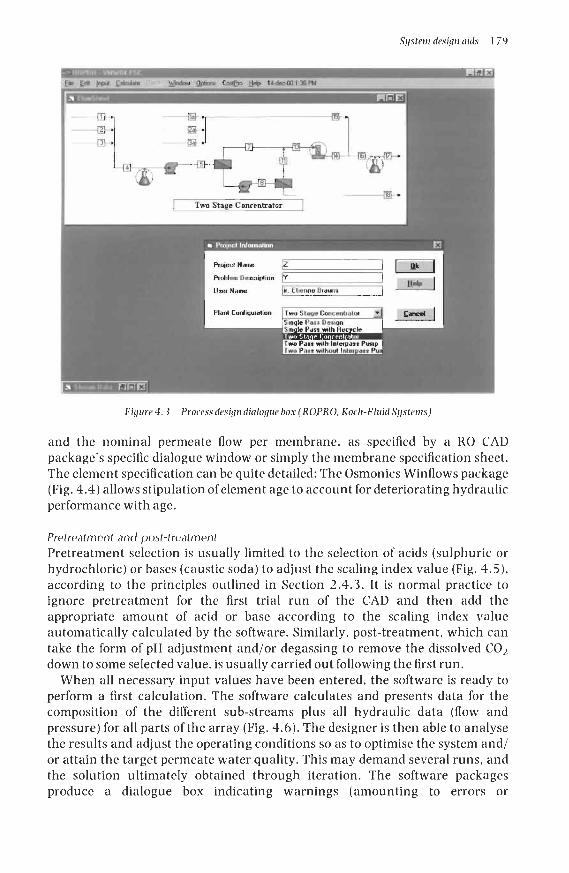
Systern design aids 179
[ TWO Stage Concentrator I
, T w o Parr with lnterparf Pump , 1 wn Pars without lnlerpatr I'u - '-
VQL3'XJl
Figure 4.3 Process design dialogue box (ROPRO, Koch-Fluid Systems)
and the nominal permeate flow per membrane, as specified by a RO CAD package's specific dialogue window or simply the membrane specification sheet. The element specification can be quite detailed: The Osmonics Winflows package (Fig. 4.4) allows stipulation of element age to account for deteriorating hydraulic performance with age.
Pretreatment and post-treatment Pretreatment selection is usually limited to the selection of acids (sulphuric or hydrochloric) or bases (caustic soda) to adjust the scaling index value (Fig. 4.5), according to the principles outlined in Section 2.4.3. It is normal practice to ignore pretreatment for the first trial run of the CAD and then add the appropriate amount of acid or base according to the scaling index value automatically calculated by the software. Similarly, post-treatment, which can take the form of pH adjustment and/or degassing to remove the dissolved C 0 2 down to some selected value, is usually carried out following the first run.
When all necessary input values have been entered, the software is ready to perform a first calculation. The software calculates and presents data for the composition of the different sub-streams plus all hydraulic data (flow and pressure) for all parts of the array (Fig. 4.6). The designer is then able to analyse the results and adjust the operating conditions so as to optimise the system and/ or attain the target permeate water quality. This may demand several runs, and the solution ultimately obtained through iteration. The software packages produce a dialogue box indicating warnings (amounting to errors or

180 Membranes for Industrial Wastewater Recovery and Re-use
Figure 4.4 Array design dialogue box (Winflows, Osmonics)
incompatibilities in the design), and these can be attended to directly. For example, if the solubility limit of calcium carbonate has been exceeded, acid may be added as pretreatment. If the membrane module is hydraulically overloaded more membranes can be added. If the design selected is entirely inappropriate, calculation of the parameters (which relies on convergence) may not be possible and the software will then produce a warning and halt.
An optimised RO system design is generally considered to be one for which the lowest specific energy demand is incurred and/or the lowest membrane area is demanded at the highest recovery, although these parameters obviously imply a trade-off between operating and capital costs. Although there is no one method of performing the iterative procedure to obtain the optimised system, a few general points can be made:
(i) A high CP level, always greatest at the module exit, should be avoided a warning is given when the p-coefficient value in the last membrane of a pressure vessel exceeds the pre-set maximum value. CP can be reduced by increasing the cross-flow velocity and/or reducing the flux. A number of options exist in this regard
a reduction of overall recovery a addition of a stage a increase of feed flow

System design aids 18 1
Chemical r , G Nme
i r Sulfutic Acid
1 r Hydrochloric Acid ' f S d i m carbate
r Lme r Sodm Hydroxide
Figure 4.5 Pretreatment dialogue box (ROPRO, Koch-Fluid Systems)
0
0
0 decreasing the element size.
reduction of the number of pressure vessels per bank whilst increasing the number of membranes per pressure vessel recycling of part of the concentrate
(ii) Permeate quality changes with recovery. In principle, solute diffusion increases with higher recoveries but permeate flux also increases. These synergistic phenomena mean that permeate quality can increase until some specific recovery value, beyond which it may decrease again. It is rarely the case that the highest permeate water quality, as may be demanded by, for example, microprocessor applications, coincides with the highest recovery.
(iii) The specific energy demand increases with increasing recovery. (iv) Calcium carbonate scaling can be very substantially reduced through
pretreatment by acid dosing or hardness removal, allowing much greater recoveries and thus demanding smaller membrane areas. Hardness reduction can be achieved by classical chemical softening, by ion exchange or lime dosing, or by blending the feedwater with some of the permeate product.
(v) Scaling by non-hydrolysable scalants (Table 2.14) can be suppressed through the use of appropriate scale inhibitors. Dedicated software from anti-scalant chemical suppliers is available (Fig. 4.7) and can be used in parallel with the RO software to calculate scaling propensity of the chemically treated water. Scaling from these contaminants is otherwise reduced only by their removal or by reducing CP.