3d urban gis from laser altimeter and 2d … urban gis from laser altimeter and 2d map data norbert...
TRANSCRIPT

3D URBAN GIS FROM LASER ALTIMETER AND 2D MAP DATA
Norbert Haala, Claus Brenner and Karl-Heinrich AndersInstitute for Photogrammetry (ifp)
University of StuttgartGeschwister-Scholl-Straße 24, 70174 Stuttgart, Germany
Ph.: +49-711-121-3383, Fax: +49-711-121-3297e-mail: [email protected]
Commission III, Working Group 4
KEY WORDS: Fusion, GIS, Height Data, Virtual Reality
ABSTRACT
Virtual reality applications in the context of urban planning presume the acquisition of 3D urban models. Photo realism can only beachieved, if the geometry of buildings is represented by a detailed and accurate CAD model and if artificial texture or real world imageryis additionally mapped to the faces and roofs of the buildings. In the approach presented in this paper height data provided by airbornelaser scanning and existing ground plans of buildings are combined in order to enable an automatic data capture by the integration ofthese different types of information. Afterwards virtual reality city models are generated by texture processing, i.e. by mapping of terrestrialimages. Thus the rapid acquisition of 3D urban GIS is feasible.
1 INTRODUCTION
Airborne laser scanners allow direct measurement of the terrainsurface, including objects like trees or buildings which rise fromthe ground. Three-dimensional points on the sensed surface canbe determined dense and well-distributed. Even though for a num-ber of applications a so-called Digital Surface Model (DSM) whichrepresents this surface by an object independent distribution of 3Dpoints is sufficient, further interpretation and qualification of theoriginal height data is necessary in many cases. One example isthe acquisition of city models for virtual reality applications, whereeven small geometrical errors like the non-planar triangulation ofa planar facade may easily disturb the impression of looking at a’real’ scene. Another example are visibility computations for mobilecommunications. In this case, a scene representation with as fewas possible faces is advantageous, since this reduces the simula-tion complexity. In order to obtain a 3D urban model which is moresuitable for these applications an abstraction of the surface modelis required, i.e. buildings have to be separated from the terrain sur-face and represented by true 3D CAD models.
The automatic interpretation of DSMs is a very pretentious prob-lem. Especially for urban areas, great efforts at producing DSMswith sufficient spatial resolution and quality have been made. Manyresearchers nowadays agree that as many as possible supplemen-tary sources of information have to be used to achieve optimal in-terpretation results. Within the approach presented in this paperthe 3D reconstruction of the buildings is supported by given groundplans. This type of information is frequently available from a 2DGeo Information System (GIS). By integrating the ground plans intothe processing also the consistency between the already existing2D GIS or map data and the generated 3D data can be guaran-teed.
Often, ground plans of buildings have already been acquired andare represented either in analog form by maps and plans or dig-itally in 2D Geo Information Systems (GIS). These ground plansare another very important source of information for 3D building re-construction. Compared to results of automatic procedures theseground plans are very reliable since they contain aggregated infor-mation which has been made explicit by human interpretation. Forthis reason constraints, which are derived from ground plans canconsiderably reduce the search space when looking for a properreconstruction and thereby reduce costs to attain a solution. Anexample for existing ground truth data relevant for building recon-struction is the digital cadastral map, which provides information
on the distribution of property, including the borders of all agricul-tural areas and the ground plans of existing buildings. Additionallyinformation on the names of streets and the usage of buildings(e.g. garage, residential building, office block, industrial building,church) is provided in form of text symbols. At the moment thedigital cadastral map is build up as an area covering data base,mainly by digitizing existing maps or plans. At present it is avail-able for 40% of the area of Germany. Since for our test area thistype of data was not available the ground plans were digitized man-ually from a map of scale 1:5000. Alternatively maps and plans canbe digitized automatically (Frischknecht and Carosio, 1997) whichalso results in information similar to the digital cadastral map.
After discussing the potential of airborne laser scanning for thegeneration and visualization of urban models (section 2), the 3Dbuilding reconstruction from existing ground plans and DSM willbe described (section 3). In the last part of the paper (section 4)the processing of terrestrial images for the generation virtual realitycity models will be presented.
2 URBAN MODELS FROM LASER SCANNER DSM
2.1 Airborne laser scanning
Figure 1 shows a DSM of our test area provided by the TopoSyslaser scanner system (Lohr, 1997). Terrain points were measuredat approximately one point each 1�1 m2 with an accuracy of 0:3 min planimetry and 0:1 m in height. Similar to a tachymetric data ac-quisition, the three-dimensional coordinates of terrain points aredetermined by polar measurement. The central component of thesystem is a laser sensor which allows the direct distance mea-surement from the aircraft to the topographical terrain surface byrun-time measurement of an emitted and reflected laser pulse. Foran area covering data collection, the laser beam is deflected per-pendicular to the direction of flight, resulting in a strip-wise acqui-sition of the terrain surface. The position and orientation of thesensor system during range measurement has to be provided byadditional sensors. These components are a NAVSTAR GlobalPositioning System (GPS) for the positioning task and an InertialSystem (INS) for the orientation task.
The data generated by such a laser scanner consists of densepoint measurements along strips, which is usually processed andresampled to obtain a regular raster. Figure 1 shows the result of
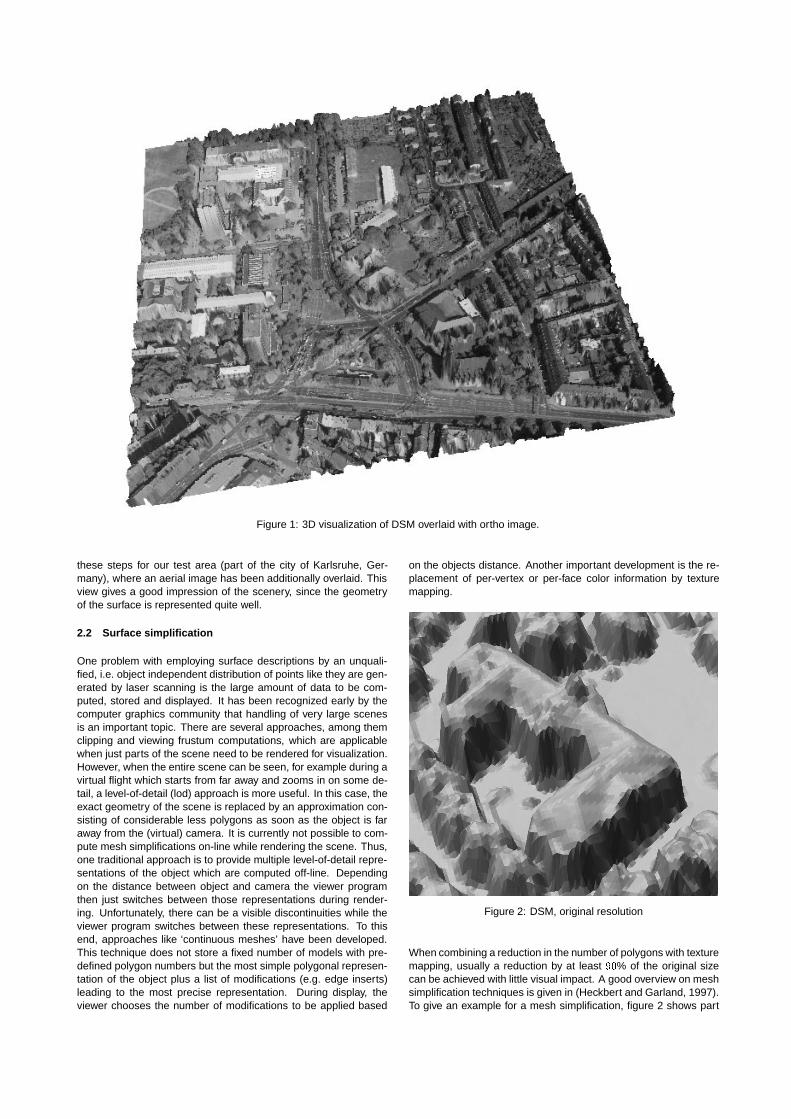
Figure 1: 3D visualization of DSM overlaid with ortho image.
these steps for our test area (part of the city of Karlsruhe, Ger-many), where an aerial image has been additionally overlaid. Thisview gives a good impression of the scenery, since the geometryof the surface is represented quite well.
2.2 Surface simplification
One problem with employing surface descriptions by an unquali-fied, i.e. object independent distribution of points like they are gen-erated by laser scanning is the large amount of data to be com-puted, stored and displayed. It has been recognized early by thecomputer graphics community that handling of very large scenesis an important topic. There are several approaches, among themclipping and viewing frustum computations, which are applicablewhen just parts of the scene need to be rendered for visualization.However, when the entire scene can be seen, for example during avirtual flight which starts from far away and zooms in on some de-tail, a level-of-detail (lod) approach is more useful. In this case, theexact geometry of the scene is replaced by an approximation con-sisting of considerable less polygons as soon as the object is faraway from the (virtual) camera. It is currently not possible to com-pute mesh simplifications on-line while rendering the scene. Thus,one traditional approach is to provide multiple level-of-detail repre-sentations of the object which are computed off-line. Dependingon the distance between object and camera the viewer programthen just switches between those representations during render-ing. Unfortunately, there can be a visible discontinuities while theviewer program switches between these representations. To thisend, approaches like ‘continuous meshes’ have been developed.This technique does not store a fixed number of models with pre-defined polygon numbers but the most simple polygonal represen-tation of the object plus a list of modifications (e.g. edge inserts)leading to the most precise representation. During display, theviewer chooses the number of modifications to be applied based
on the objects distance. Another important development is the re-placement of per-vertex or per-face color information by texturemapping.
Figure 2: DSM, original resolution
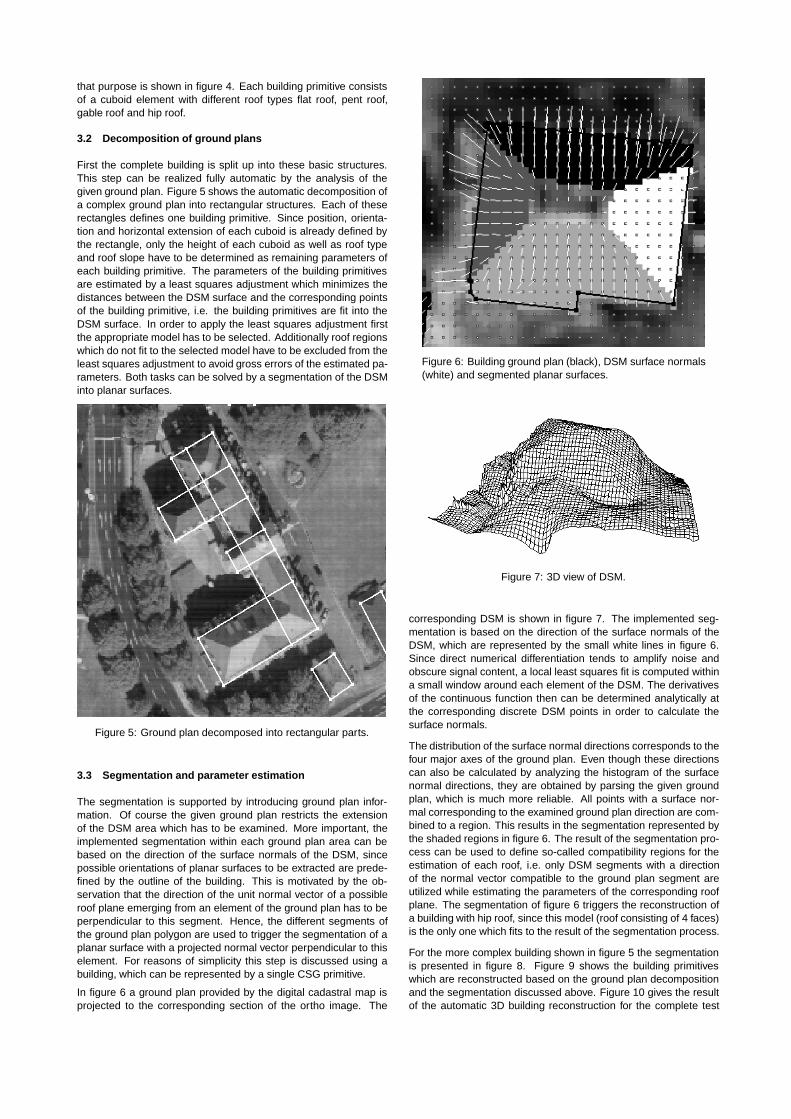
When combining a reduction in the number of polygons with texturemapping, usually a reduction by at least 90% of the original sizecan be achieved with little visual impact. A good overview on meshsimplification techniques is given in (Heckbert and Garland, 1997).To give an example for a mesh simplification, figure 2 shows part
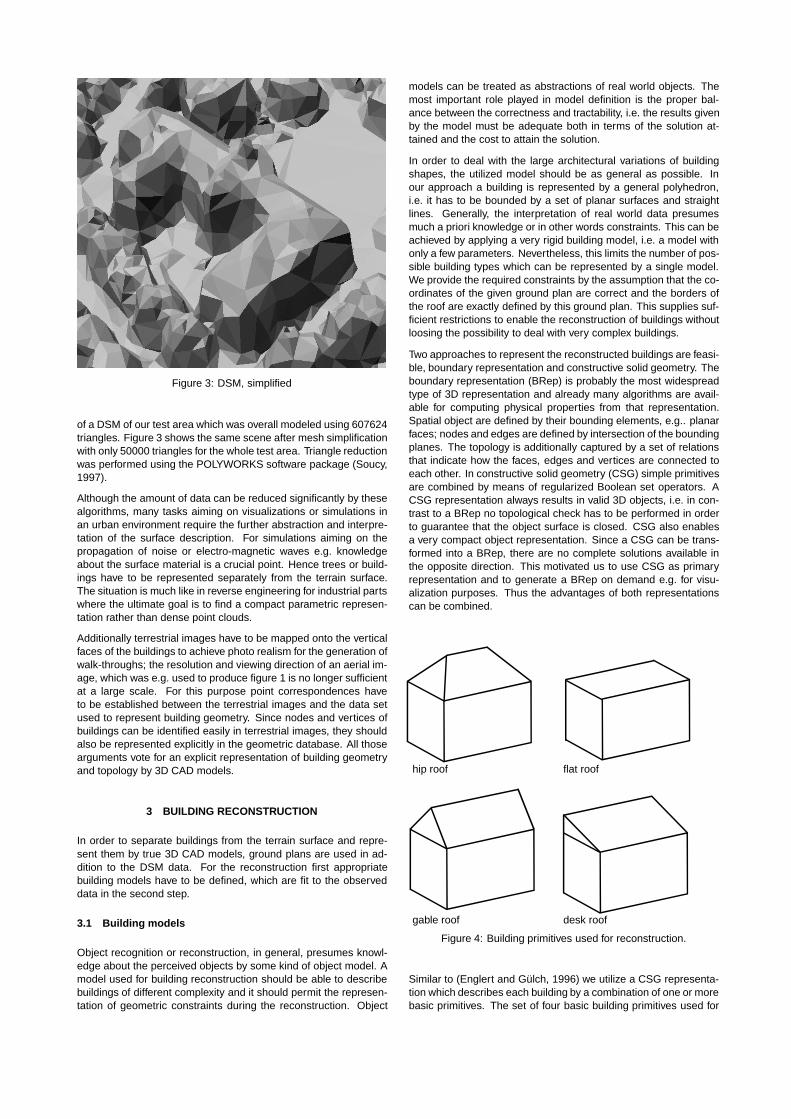
Figure 3: DSM, simplified
of a DSM of our test area which was overall modeled using 607624triangles. Figure 3 shows the same scene after mesh simplificationwith only 50000 triangles for the whole test area. Triangle reductionwas performed using the POLYWORKS software package (Soucy,1997).
Although the amount of data can be reduced significantly by thesealgorithms, many tasks aiming on visualizations or simulations inan urban environment require the further abstraction and interpre-tation of the surface description. For simulations aiming on thepropagation of noise or electro-magnetic waves e.g. knowledgeabout the surface material is a crucial point. Hence trees or build-ings have to be represented separately from the terrain surface.The situation is much like in reverse engineering for industrial partswhere the ultimate goal is to find a compact parametric represen-tation rather than dense point clouds.
Additionally terrestrial images have to be mapped onto the verticalfaces of the buildings to achieve photo realism for the generation ofwalk-throughs; the resolution and viewing direction of an aerial im-age, which was e.g. used to produce figure 1 is no longer sufficientat a large scale. For this purpose point correspondences haveto be established between the terrestrial images and the data setused to represent building geometry. Since nodes and vertices ofbuildings can be identified easily in terrestrial images, they shouldalso be represented explicitly in the geometric database. All thosearguments vote for an explicit representation of building geometryand topology by 3D CAD models.
3 BUILDING RECONSTRUCTION
In order to separate buildings from the terrain surface and repre-sent them by true 3D CAD models, ground plans are used in ad-dition to the DSM data. For the reconstruction first appropriatebuilding models have to be defined, which are fit to the observeddata in the second step.
3.1 Building models
Object recognition or reconstruction, in general, presumes knowl-edge about the perceived objects by some kind of object model. Amodel used for building reconstruction should be able to describebuildings of different complexity and it should permit the represen-tation of geometric constraints during the reconstruction. Object
models can be treated as abstractions of real world objects. Themost important role played in model definition is the proper bal-ance between the correctness and tractability, i.e. the results givenby the model must be adequate both in terms of the solution at-tained and the cost to attain the solution.
In order to deal with the large architectural variations of buildingshapes, the utilized model should be as general as possible. Inour approach a building is represented by a general polyhedron,i.e. it has to be bounded by a set of planar surfaces and straightlines. Generally, the interpretation of real world data presumesmuch a priori knowledge or in other words constraints. This can beachieved by applying a very rigid building model, i.e. a model withonly a few parameters. Nevertheless, this limits the number of pos-sible building types which can be represented by a single model.We provide the required constraints by the assumption that the co-ordinates of the given ground plan are correct and the borders ofthe roof are exactly defined by this ground plan. This supplies suf-ficient restrictions to enable the reconstruction of buildings withoutloosing the possibility to deal with very complex buildings.
Two approaches to represent the reconstructed buildings are feasi-ble, boundary representation and constructive solid geometry. Theboundary representation (BRep) is probably the most widespreadtype of 3D representation and already many algorithms are avail-able for computing physical properties from that representation.Spatial object are defined by their bounding elements, e.g.. planarfaces; nodes and edges are defined by intersection of the boundingplanes. The topology is additionally captured by a set of relationsthat indicate how the faces, edges and vertices are connected toeach other. In constructive solid geometry (CSG) simple primitivesare combined by means of regularized Boolean set operators. ACSG representation always results in valid 3D objects, i.e. in con-trast to a BRep no topological check has to be performed in orderto guarantee that the object surface is closed. CSG also enablesa very compact object representation. Since a CSG can be trans-formed into a BRep, there are no complete solutions available inthe opposite direction. This motivated us to use CSG as primaryrepresentation and to generate a BRep on demand e.g. for visu-alization purposes. Thus the advantages of both representationscan be combined.
gable roof desk roof
hip roof flat roof
Figure 4: Building primitives used for reconstruction.
Similar to (Englert and Gulch, 1996) we utilize a CSG representa-tion which describes each building by a combination of one or morebasic primitives. The set of four basic building primitives used for
that purpose is shown in figure 4. Each building primitive consistsof a cuboid element with different roof types flat roof, pent roof,gable roof and hip roof.
3.2 Decomposition of ground plans
First the complete building is split up into these basic structures.This step can be realized fully automatic by the analysis of thegiven ground plan. Figure 5 shows the automatic decomposition ofa complex ground plan into rectangular structures. Each of theserectangles defines one building primitive. Since position, orienta-tion and horizontal extension of each cuboid is already defined bythe rectangle, only the height of each cuboid as well as roof typeand roof slope have to be determined as remaining parameters ofeach building primitive. The parameters of the building primitivesare estimated by a least squares adjustment which minimizes thedistances between the DSM surface and the corresponding pointsof the building primitive, i.e. the building primitives are fit into theDSM surface. In order to apply the least squares adjustment firstthe appropriate model has to be selected. Additionally roof regionswhich do not fit to the selected model have to be excluded from theleast squares adjustment to avoid gross errors of the estimated pa-rameters. Both tasks can be solved by a segmentation of the DSMinto planar surfaces.
Figure 5: Ground plan decomposed into rectangular parts.
3.3 Segmentation and parameter estimation
The segmentation is supported by introducing ground plan infor-mation. Of course the given ground plan restricts the extensionof the DSM area which has to be examined. More important, theimplemented segmentation within each ground plan area can bebased on the direction of the surface normals of the DSM, sincepossible orientations of planar surfaces to be extracted are prede-fined by the outline of the building. This is motivated by the ob-servation that the direction of the unit normal vector of a possibleroof plane emerging from an element of the ground plan has to beperpendicular to this segment. Hence, the different segments ofthe ground plan polygon are used to trigger the segmentation of aplanar surface with a projected normal vector perpendicular to thiselement. For reasons of simplicity this step is discussed using abuilding, which can be represented by a single CSG primitive.
In figure 6 a ground plan provided by the digital cadastral map isprojected to the corresponding section of the ortho image. The
Figure 6: Building ground plan (black), DSM surface normals(white) and segmented planar surfaces.
Figure 7: 3D view of DSM.
corresponding DSM is shown in figure 7. The implemented seg-mentation is based on the direction of the surface normals of theDSM, which are represented by the small white lines in figure 6.Since direct numerical differentiation tends to amplify noise andobscure signal content, a local least squares fit is computed withina small window around each element of the DSM. The derivativesof the continuous function then can be determined analytically atthe corresponding discrete DSM points in order to calculate thesurface normals.
The distribution of the surface normal directions corresponds to thefour major axes of the ground plan. Even though these directionscan also be calculated by analyzing the histogram of the surfacenormal directions, they are obtained by parsing the given groundplan, which is much more reliable. All points with a surface nor-mal corresponding to the examined ground plan direction are com-bined to a region. This results in the segmentation represented bythe shaded regions in figure 6. The result of the segmentation pro-cess can be used to define so-called compatibility regions for theestimation of each roof, i.e. only DSM segments with a directionof the normal vector compatible to the ground plan segment areutilized while estimating the parameters of the corresponding roofplane. The segmentation of figure 6 triggers the reconstruction ofa building with hip roof, since this model (roof consisting of 4 faces)is the only one which fits to the result of the segmentation process.
For the more complex building shown in figure 5 the segmentationis presented in figure 8. Figure 9 shows the building primitiveswhich are reconstructed based on the ground plan decompositionand the segmentation discussed above. Figure 10 gives the resultof the automatic 3D building reconstruction for the complete test

Figure 8: Segmented roof regions, original ground plan (white) andinteractively added ground plan segment (black).
Figure 9: Reconstructed primitives.
area. For visualization the reconstructed buildings were put on themap of scale 1:5000, which was used to digitize the ground plans.
3.4 Interactive refinement of initial reconstructions
In our approach the reconstruction is constrained by the assump-tion that
� all walls defined by the ground polygon lead to a planar roofface of variable slope and
� all eaves lines have the same height.
These assumptions are fairly general. However, one must keep inmind that any roof construction based on this approach provides in-correct results if the roof structure inside the ground polygon doesnot follow the cues that can be obtained from the ground polygon.This can e.g. happen if more than one plane emerges from a single
Figure 11: Reconstructed building and DSM surface.
polygon element or if parts of the building which are contained in aroof surface like a bay are not represented by the ground plan.
Figure 11 shows the reconstructed building with the original DSMsurface overlaid. The difference between the DSM surface and thecorresponding points at the roof planes provide a reliable test onthe quality of a reconstruction. For this reason RMS values arecalculated for each building and its sub-parts. Remaining regions,which are incompatible with the final reconstruction give an addi-tional hint, if manual interaction is required for further refinement.Since these regions are determined by the previous segmentation,they can be visualized together with the calculated RMS values ina final operator based evaluation step.
Figure 12: Boundary representation of the refined reconstruction.
Up to now all buildings were reconstructed fully automatically. Theground plans used so far were digitized merely from the map. No

Figure 10: Reconstructed buildings projected on map 1:5000 used for ground plan acquisition.
care has been taken to digitize the ground plans with respect to thereconstruction algorithm. Even though the reconstruction is suffi-cient for many levels of detail, due to the problems of the algorithmmentioned above a further improvement of the reconstruction canbe necessary for very complex buildings. This can be obtained ifthe initial reconstruction is analyzed in order to refine the captureof ground plans. Figure 8 shows the original ground plan and thesegmentation of the DSM into planar regions. For this examplethe two segmented regions contained in the black rectangle areincompatible to their surrounding roof plane and therefore are notused to reconstruct the parameters of the corresponding buildingprimitive. Based on this information the black polygon was gener-ated interactively by an operator. This rectangle then automaticallytriggers the reconstruction of an additional building primitive, whichrepresents the bay of the roof. The result of the final reconstructionis shown in figure 12. For this visualization the CSG representationwas transformed to a boundary representation of the building. Thisstep is required for all buildings if wire frames have to be presentedadequately. Therefore the union of the set of CSG primitives hasto be computed. Within this process the primitives are intersected,coplanar and touching faces are merged and inner faces or partsare removed.
The size of object parts which can be reconstructed is of courselimited by the available density of DSM points, i.e. details smallerthan approximately 1 m can not be captured. For virtual realityapplications this problem can be avoided by texture mapping ofreal imagery as a substitute for geometric modeling, since the useof photo realistic texture enhances the perceived detail even in theabsence of a detailed geometric model.
4 GENERATION OF VIRTUAL REALITY MODELS
The creation of a 3D city model for virtual reality applications usu-ally consists of a geometric building reconstruction followed by tex-ture mapping to obtain a photo realistic model representation. Inprinciple, terrestrial imagery is sufficient to provide the requiredinformation for both tasks. Nevertheless, especially the terrestrialacquisition of the building geometry by architectural photogramme-try proves to be a time-consuming process that has to be carriedout interactively for each building. The basic idea of our approachis to speed up the time consuming process of virtual city modelcreation by using DSM and ground plans for geometric processingand terrestrial images only for texture mapping. Since the verticesof the 3D building models which are generated from ground plansand laser data provide sufficient control point information, the tex-ture mapping from the terrestrial images is simplified considerably.Therefore the generation of virtual reality models is more efficientcompared to standard architectural photogrammetry, where a num-ber of tie points has to be measured in multiple images.
The goal of texture processing is to provide a rectified image foreach visible building face. Hence for each image the correspond-ing facade polygon has to be selected from the 3D city model gen-erated in the previous processing step. For this purpose the wireframe of the reconstructed buildings as well as the indices of thefaces are projected to the aerial image (see figure 13). If the view-points were sketched into a map or an ortho image during the ter-restrial image acquisition, this representation allows a simple inter-active definition of the corresponding face index for each terrestrialimage.
For texture mapping the image has to be correctly positioned, ori-ented and scaled to represent its associated surface. In our ap-proach an image section representing a planar surface is rectifiedby applying a projective transformation. The 7 parameters of the
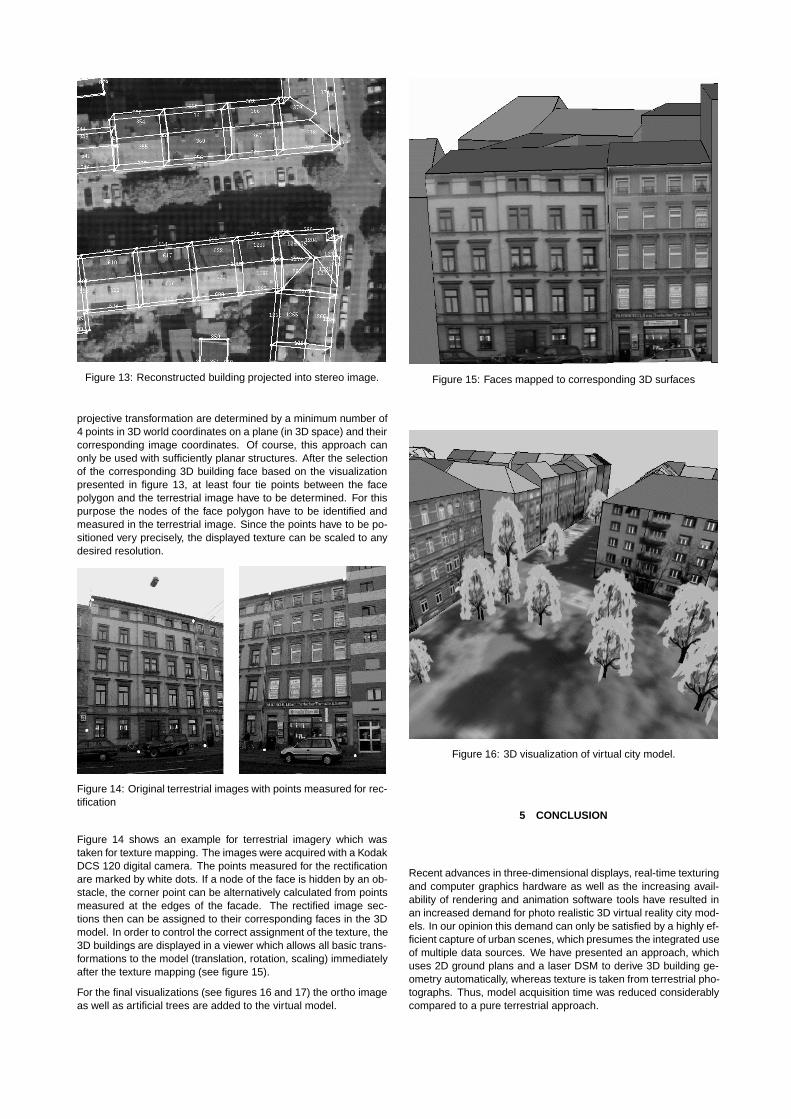
Figure 13: Reconstructed building projected into stereo image.
projective transformation are determined by a minimum number of4 points in 3D world coordinates on a plane (in 3D space) and theircorresponding image coordinates. Of course, this approach canonly be used with sufficiently planar structures. After the selectionof the corresponding 3D building face based on the visualizationpresented in figure 13, at least four tie points between the facepolygon and the terrestrial image have to be determined. For thispurpose the nodes of the face polygon have to be identified andmeasured in the terrestrial image. Since the points have to be po-sitioned very precisely, the displayed texture can be scaled to anydesired resolution.
Figure 14: Original terrestrial images with points measured for rec-tification
Figure 14 shows an example for terrestrial imagery which wastaken for texture mapping. The images were acquired with a KodakDCS 120 digital camera. The points measured for the rectificationare marked by white dots. If a node of the face is hidden by an ob-stacle, the corner point can be alternatively calculated from pointsmeasured at the edges of the facade. The rectified image sec-tions then can be assigned to their corresponding faces in the 3Dmodel. In order to control the correct assignment of the texture, the3D buildings are displayed in a viewer which allows all basic trans-formations to the model (translation, rotation, scaling) immediatelyafter the texture mapping (see figure 15).
For the final visualizations (see figures 16 and 17) the ortho imageas well as artificial trees are added to the virtual model.
Figure 15: Faces mapped to corresponding 3D surfaces
Figure 16: 3D visualization of virtual city model.
5 CONCLUSION
Recent advances in three-dimensional displays, real-time texturingand computer graphics hardware as well as the increasing avail-ability of rendering and animation software tools have resulted inan increased demand for photo realistic 3D virtual reality city mod-els. In our opinion this demand can only be satisfied by a highly ef-ficient capture of urban scenes, which presumes the integrated useof multiple data sources. We have presented an approach, whichuses 2D ground plans and a laser DSM to derive 3D building ge-ometry automatically, whereas texture is taken from terrestrial pho-tographs. Thus, model acquisition time was reduced considerablycompared to a pure terrestrial approach.
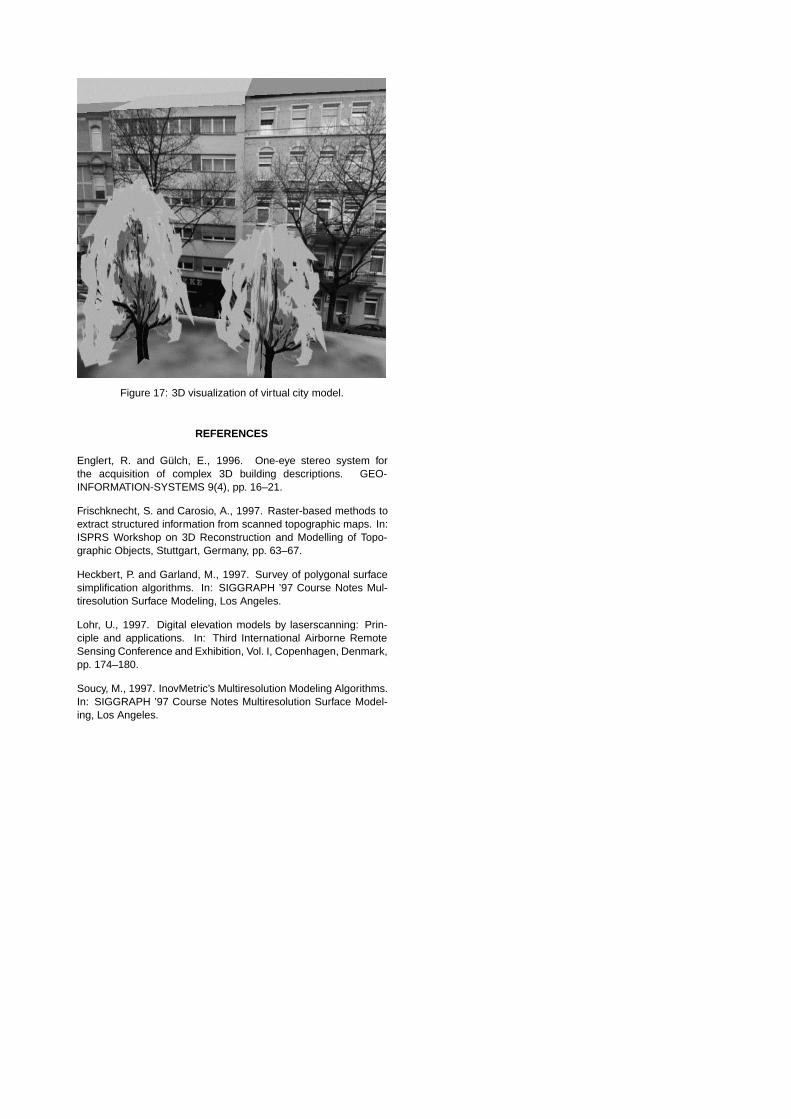
Figure 17: 3D visualization of virtual city model.
REFERENCES
Englert, R. and Gulch, E., 1996. One-eye stereo system forthe acquisition of complex 3D building descriptions. GEO-INFORMATION-SYSTEMS 9(4), pp. 16–21.
Frischknecht, S. and Carosio, A., 1997. Raster-based methods toextract structured information from scanned topographic maps. In:ISPRS Workshop on 3D Reconstruction and Modelling of Topo-graphic Objects, Stuttgart, Germany, pp. 63–67.
Heckbert, P. and Garland, M., 1997. Survey of polygonal surfacesimplification algorithms. In: SIGGRAPH ’97 Course Notes Mul-tiresolution Surface Modeling, Los Angeles.
Lohr, U., 1997. Digital elevation models by laserscanning: Prin-ciple and applications. In: Third International Airborne RemoteSensing Conference and Exhibition, Vol. I, Copenhagen, Denmark,pp. 174–180.
Soucy, M., 1997. InovMetric’s Multiresolution Modeling Algorithms.In: SIGGRAPH ’97 Course Notes Multiresolution Surface Model-ing, Los Angeles.