4 1 2,3 4 6 5 7 author manuscript
TRANSCRIPT
This is the author manuscript accepted for publication and has undergone full peer review but has
not been through the copyediting, typesetting, pagination and proofreading process, which may
lead to differences between this version and the Version of Record. Please cite this article as doi:
10.1002/MP.14130
This article is protected by copyright. All rights reserved
1 Inter- and Intra-software Reproducibility of Computed Tomography Lung Density
2 Measurements
3
4 Miranda Kirby PhD1, Charles Hatt PhD2,3, Nancy Obuchowski PhD4, Stephen M. Humphries
5 PhD5, Jered Sieren BSc6, David A. Lynch MB5, Sean B. Fain PhD7 on behalf of the QIBA Lung
6 Density Committee
7
8 1Department of Physics, Ryerson University, Toronto, Ontario, Canada;
9 2IMBIO, Minneapolis, Minnesota, USA;
10 3Deparment of Radiology, University of Michigan, Ann Arbor, Michigan, USA.
11 4Department of Quantitative Health Sciences, Cleveland Clinic, Cleveland, Ohio, USA;
12 5Department of Radiology, National Jewish Health, Denver, Colorado, USA;
13 6VIDA Diagnostics Inc., Coralville, Iowa, USA;
14 7Deparment of Medical Physics, University of Wisconsin, Madison, Wisconsin, USA.
15
16
17 QIBA Lung Density Committee Co-chairs
18 Sean B. Fain PhD
19 David A. Lynch MB
20 Charles Hatt PhD
21
22 Corresponding Author:
23 Miranda Kirby PhD
24 Department of Physics, Ryerson University
25 Kerr Hall South Bldg. Room – KHS-344
26 350 Victoria St. Toronto, Ontario, M5B 2K3
27 Email: [email protected]
28 Phone: 416-979-5000 ext. 544418
29
Auth
or
Manuscript

This article is protected by copyright. All rights reserved
30 Running Title: Reproducibility of CT Lung Density
31
32 Manuscript Type: Original Research
33
34 Word Count: 2999 words
35
36
37
38 ABSTRACT (376/500 words)
39 Purpose: Multiple commercial, open-source, and academic software tools exist for objective
40 quantification of lung density in computed tomography (CT) images. The purpose of this study
41 was evaluate the inter-software reproducibility of CT lung density measurements.
42 Methods: CT images from 50 participants from the COPDGeneTM cohort study were randomly
43 selected for analysis; n=10 participants across each Global Initiative for Chronic Obstructive
44 Lung Disease (GOLD) grade (GOLD 0-IV). Academic-based groups (n=4) and commercial
45 vendors (n=4) participated anonymously to generate CT lung density measurements using their
46 software tools. CT total lung volume (TLV), percentage of the low attenuation areas in the lung
47 with Hounsfield unit (HU) values below -950HU (LAA950), and the HU value corresponding to
48 the 15th percentile on the parenchymal density histogram (Perc15) were included in the analysis.
49 The inter-software bias and reproducibility coefficient (RDC) was generated with and without
50 quality assurance (QA) for manual correction of the lung segmentation; intra-software bias and
51 RDC was also generated by repeated measurements on the same images.
52 Results: Inter-software mean bias was within 0.22mL, 0.46%, and 0.97HU for TLV, LAA950
53 and Perc15, respectively. The reproducibility coefficient (RDC) was 0.35L, 1.2% and 1.8HU for
54 TLV, LAA950 and Perc15, respectively. Inter-software RDC remained unchanged following QA:
55 0.35L, 1.2% and 1.8HU for TLV, LAA950 and Perc15, respectively. All software investigated had
56 an intra-software RDC of 0. The RDC was comparable for TLV, LAA950 and Perc15
57 measurements, respectively, for academic-based groups/commercial vendor-based software
58 tools: 0.39L/0.32L, 1.2%/1.2%, and 1.7HU/1.6 HU. Multivariable regression analysis showed
59 that academic-based software tools had greater within-subject standard deviation of TLV than
Auth
or
Manuscript

This article is protected by copyright. All rights reserved
60 commercial vendors, but no significant differences between academic and commercial groups
61 were found for LAA950 or Perc15 measurements.
62 Conclusions: CT total lung volume and lung density measurement bias and reproducibility was
63 reported across eight different software tools. Bias was negligible across vendors, reproducibility
64 was comparable for software tools generated by academic-based groups and commercial
65 vendors, and segmentation QA had negligible impact on measurement variability between
66 software tools. In summary, results from this study report the amount of additional measurement
67 variability that should be accounted for when using different software tools to measure lung
68 density longitudinally with well-standardized image acquisition protocols. However, intra-
69 software reproducibility was deterministic for all cases so use of the same software tool to reduce
70 variability for serial studies is highly recommended.
71
72 Keywords (up to 5): computed tomography, imaging biomarker, emphysema, COPD, lung
73 density
74
75 INTRODUCTION
76 Computed tomography (CT) lung density is an imaging biomarker used to objectively and non-
77 invasively quantify the extent of emphysema in the lung. Over the last three decades, numerous
78 studies in patients with chronic obstructive pulmonary disease (COPD) have demonstrated that
79 CT lung density measurements are correlated with emphysema measured in excised lungs by
80 histology (2,3), are associated with mortality (5) and exacerbations (6), and can identify
81 subgroups of patients with better responses following lung-volume-reduction surgery (7) and
82 endobronchial valve implantation (8). Further, in patients with alpha 1-antitrysin deficiency, a
83 significant response to augmentation therapy was shown using CT lung density as a surrogate of
84 emphysema, but not with conventional spirometry measurements (9). These findings all
85 highlight the potential role of quantitative CT for COPD patient management, such as
86 longitudinal monitoring of disease progression and assessing treatment response.
87 Maintaining standardized image acquisition parameters, however, is critically important for
88 serial assessments that aim to quantify CT lung density. It is well-established that there are
89 technical challenges for generating reproducible CT measurements. Submaximal inspiration
90 breath-hold volume (10), dose (11,12) as well as image reconstruction parameters, including
Auth
or
Manuscript

This article is protected by copyright. All rights reserved
91 slice thickness (13,14) and reconstruction kernel (15–17), have all been shown to impact CT
92 measurements. However, several large, multicenter, longitudinal cohort studies, such as
93 COPDGeneTM (18), have utilized breath-hold coaching and dedicated lung phantoms to
94 standardize image acquisition and reconstruction parameters across all sites to minimize
95 variability introduced by image acquisition related parameters.
96 Another factor that has the potential to impact the reproducibility of CT measurements is the
97 specific software used to generate the measurements. Lung density measurements are derived
98 from the parenchymal density histogram of CT Hounsfield unit (HU) values and thus are
99 deterministic computations and are directly computed given an accurate lung segmentation mask
100 (1–4). However, measurement variability may be introduced by differences in the thoracic
101 cavity segmentation, as well as segmentation of the large airways and pulmonary vessels, even
102 when consistent image acquisition and reconstruction settings are utilized. Previous studies
103 investigating the influence of different software tools have shown conflicting results, and in
104 some studies high inter-software variation for CT lung density measurements have been reported
105 (19–21).
106 In an effort to standardize methodology, the Lung Density Committee of the Quantitative
107 Imaging Biomarker Alliance (QIBA) has released for public comment a profile regarding the CT
108 lung density measurement (22). Given the multitude of software tools used by different
109 commercial, open-source, and academic research laboratories, an evaluation of the inter-software
110 variability of CT lung density measurements is warranted to support this profile, particularly in
111 the context of serial investigations. Further, quantifying inter-software CT measurement
112 reproducibility requires a cohort with minimal variability introduced by image acquisition
113 parameters. Therefore, here our objective was to investigate and report CT lung volume and
114 lung density measurement inter-software bias and reproducibility using CT images from the
115 COPDGeneTM cohort study, with various academic groups and commercial vendors participating
116 in the reproducibility study.
117
118 METHODS
119 Details of the Software Comparison
Auth
or
Manuscript
This article is protected by copyright. All rights reserved
120 CT images from 50 participants from the COPDGeneTM cohort study (18) were selected for
121 analysis; n=10 participants across each COPD GOLD grade (GOLD 0-IV) were randomly
122 selected. Participation was solicited from academic groups and commercial vendors, and the
123 solicitation letter indicated that the results would be anonymized (i.e. the software packages were
124 provided on the condition they would not be individually identified). The anonymization was
125 performed by The Radiological Society of North America (RSNA) that acted as a neutral broker
126 between all participating groups and the QIBA Lung Density committee, to ensure the committee
127 was blinded to the participants’ identity. The CT datasets used in this study are accessible in the
128 Quantitative Imaging Data Warehouse (QIDW): https://qidw.rsna.org/.
129 All vendors indicated if their software tool was for academic use only or commercial. Vendors
130 were instructed to generate measurements: 1) without segmentation quality assurance (QA) or
131 manual correction to evaluate inter-software reproducibility; 2) a repeated set of measurements
132 on the same images, to evaluate intra-software reproducibility; and, 3) a third set of
133 measurements repeated on the same images following segmentation QA and manual correction.
134 CT Image Acquisition
135 CT images were acquired using CT systems of various makes and models, including GE,
136 Siemens and Philips models, with the participant supine at suspended full-inspiration from apex
137 to base of the lung as previously described (18). In general, CT images were reconstructed with
138 smooth convolution kernels (Siemens B31f, GE STANDARD, or Philips B) and slice
139 thicknesses and intervals between 0.625 and 0.75 mm. The full-dose protocol used an effective
140 dose of 200 mAs without dose modulation. A more detailed description of the CT image
141 acquisition protocol is described elsewhere (18).
142 CT Image Analysis
143 CT images were processed using academic and commercial CT lung density software. All groups
144 were instructed to generate CT measurements for each image dataset using none or a minimal
145 amount of manual software interaction. We also requested no image auto-calibration or pre-
146 processing (e.g. noise reduction filtering). All vendors were asked to perform the following
147 steps for lung segmentation:
148 1. Segmentation of the lung parenchyma from the rest of the thoracic cavity;
149 2. Removal of airways from the segmentation (no strict definition of which airways were
150 required to be removed was provided, but the software was required to at least remove
Auth
or
Manuscript
This article is protected by copyright. All rights reserved
151 the trachea and major bronchi from the air-space prior to computing the CT lung density
152 metrics);
153 3. Blood vessel removal (no instruction was provided on the amount of acceptable blood
154 vessel exclusion from the lung volume).
155 Next, groups were instructed to repeat each of these steps on the same image dataset in order to
156 assess the intra-software repeatability. Finally, the vendors were asked to perform quality
157 assurance (QA) by reviewing and manually correcting any lung segmentation errors to generate a
158 third set of CT measurements using the corrected segmented lung volume.
159 The measurements generated include: the total lung volume (TLV), percentage of the low
160 attenuation areas in the lung with HU values below -950 (LAA950) (1–3), and the HU unit value
161 corresponding to the 15th percentile on the parenchymal density histogram (Perc15) (4).
162 Statistical Analysis
163 All statistical analysis was performed using SAS 9.4 software (Cary, NC, USA) and MATLAB
164 R2018a (Natick, MA, USA). A one-way analysis of variance (ANOVA) with a Tukey test for
165 multiple comparison correction was performed for statistical comparison between GOLD groups
166 for age; for sex and race, a Fisher’s Exact test was used. MATLAB was used for Bland-Altman
167 analysis to compare measurements generated by each possible pair of software tools;
168 measurements included TLV, LAA950 and Perc15 without QA. The reproducibility coefficient
169 (RDC) (23) was calculated for each software tool, as described below, to compare between the
170 different software tools for each lung measurement with and without QA, and by group type
171 (academic-based, commercial). The RDC is the value under which the difference between
172 repeated measurements on the same participant acquired under different conditions (ie. different
173 software tools) should fall within 95% probability. To estimate the RDC for any given software
174 tool, we must estimate the variance relative to the other K-1 software tools in the comparison
175 (K=8 in our study). Therefore, for a specific software tool, , we calculated the mean variance,
176 , for the measurements, subscript , across the 50 image sets, where represents
177 measurement of software and represents the variance between software and software
178 for measurement :
179
Auth
or
Manuscript

This article is protected by copyright. All rights reserved
180 Next, represents the variance between software and software averaged over all
181 measurements :
182
183 Then, the average variance over the other software tools is calculated to generate the
184 average variance for software :
185
186 The average RDC for software is then given by:
187
188 Low RDC values indicate high reproducibility between software tools. The 95% confidence
189 intervals for the RDC were constructed using bootstrapping with 5000 resamples.
190 Multivariable linear regression models were built to assess whether group type (academic-based,
191 commercial) was a predictor of the within-subject standard deviation of TLV, LAA950 and
192 Perc15 measurements. If group type was found to be a significant predictor, it would indicate
193 that the standard deviation between software tool measurements is different for commercial vendors
194 and academic groups; in other words, it would indicate that CT measurements are more similar
195 between commercial vendors or academic groups. Generalized estimating equations (GEEs)
196 were used to account for the clustered nature of the data.
197
198 RESULTS
199 A total of 50 participants were investigated: n=10 in each GOLD grade. As shown in Table 1,
200 there were no differences between the groups for age, sex or race. A total of 9 software tools
201 participated in the study; software tools 1-4 were from academic-based groups and software tools
202 5-9 were from commercial vendors. A single commercial vendor withdrew from the study and
203 therefore a total of 8 software tools, n=4 research-based and n=4 commercial, were included in
204 the analysis. All eight software tools were able to generate measurements for all images
205 provided. A total of 3 of 8 software tools reported some manual editing of the segmentation
206 masks for some of the CT images as part of the QA step.
Auth
or
Manuscript

This article is protected by copyright. All rights reserved
207 Figure 1 shows an example of the CT lung volume (in blue) and LAA950 segmentation masks (in
208 red) for two different software tools. The differences observed for exclusion of airways and
209 vessels from the lung volume segmentation mask between the two software tools are subtle and
210 representative of the type of differences that would be expected given acceptable segmentation
211 quality for both images (i.e. no major segmentation errors).
212 Bland-Altman Analysis
213 Bland-Altman analysis was performed for TLV, LAA950, and Perc15 measurements for each
214 software tool compared with all other software tools. Table 2 provides the summary of the
215 Bland-Altman analysis for measurements generated by each software tool with the average of all
216 the other software tools for TLV, LAA950, and Perc15 measurements. There was negligible bias
217 for all software tools to within 0.22L, 0.46%, and 0.97HU, for TLV, LAA950, and Perc15
218 respectively.
219 Reproducibility Coefficients
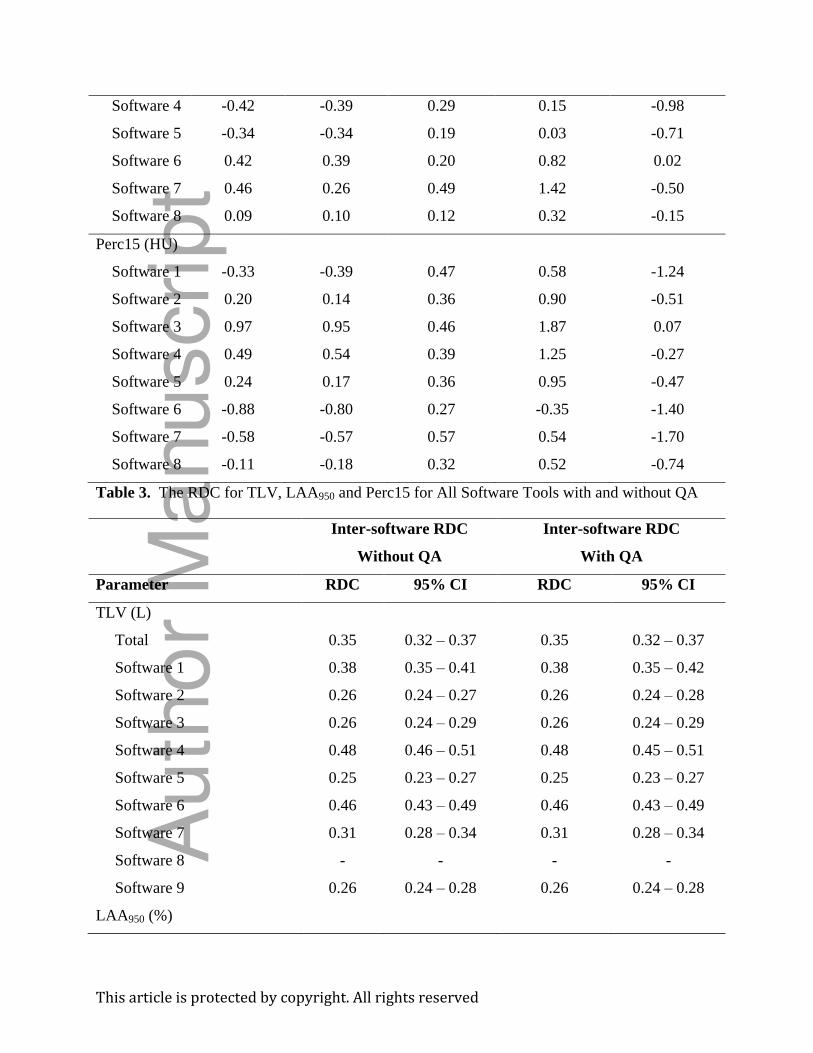
220 Table 3 shows the RDC for TLV, LAA950 and Perc15 measurements for eight different software
221 tools with and without quality assurance (QA) using manual correction of the lung volume
222 segmentation. Overall, inter-software RDC was 0.35L, 1.2% and 1.8HU for TLV, LAA950 and
223 Perc15, respectively. Inter-software RDC remained unchanged following QA: 0.35L, 1.2% and
224 1.8HU for TLV, LAA950 and Perc15, respectively. Intra-software RDC was generated by
225 performing repeated measurements using the same software tool without QA; all software had an
226 intra-software RDC of 0, indicating that image processing workflows were deterministic for all
227 software tools.
228 Table 4 shows the RDC for TLV, LAA950 and Perc15 measurements for software tools by group
229 type (academic or commercial) with and without QA. Academic groups and commercial
230 vendor’s software tools generated comparable RDC measurements for TLV, LAA950 and Perc15:
231 0.39L / 0.32L, 1.2% / 1.2%, and 1.7HU / 1.6 HU, respectively. As shown in Table 4, QA had
232 negligible impact on measurement reproducibility between software.
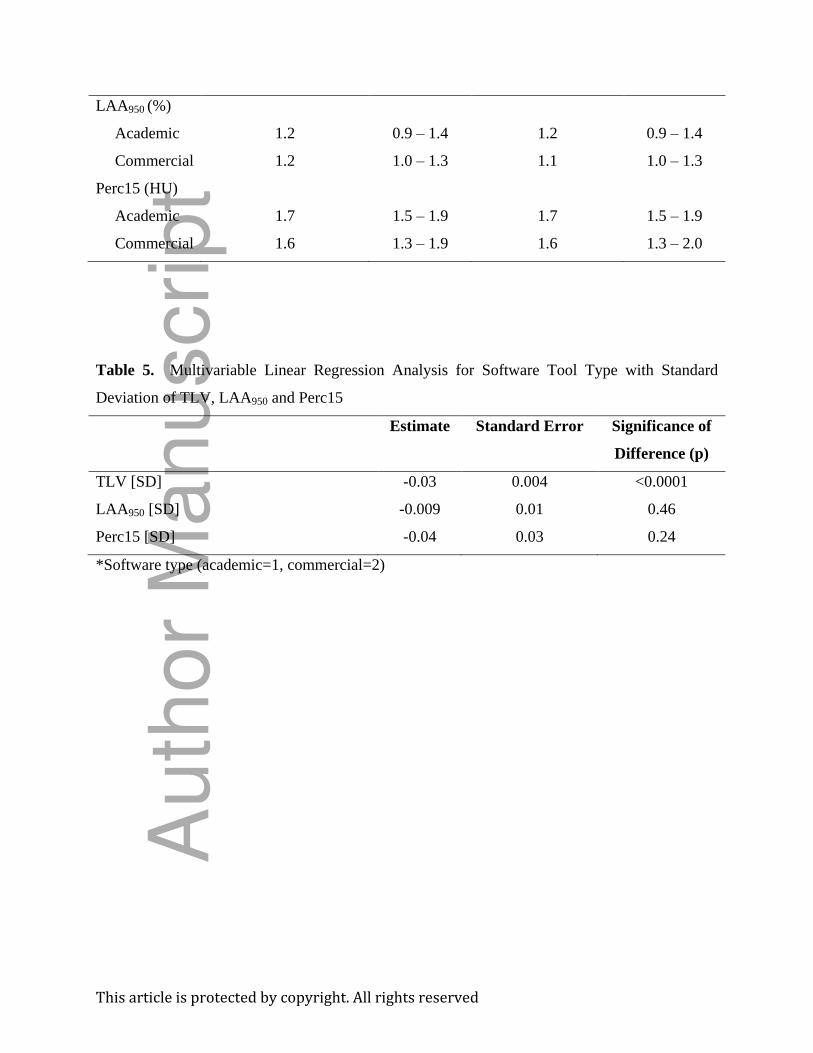
233 Multivariable Linear Regression Models
234 Table 5 shows multivariable linear regression models for within-subject standard deviation of
235 TLV, LAA950 and Perc15 measurements generated by the different software tools with group
236 type (academic, commercial) as a predictor. In the multivariable linear regression model for
237 within-subject standard deviation of TLV, group type (academic=1, commercial=2) was a
Auth
or
Manuscript

This article is protected by copyright. All rights reserved
238 significant predictor (p<0.0001); this indicates that academic vendors had greater within-subject
239 standard deviation of TLV measurements than commercial vendors. However, group type was
240 not a significant predictor for within-subject standard deviation in the multivariable linear
241 regression model for LAA950 (p=0.46) or Perc15 measurements (p=0.24).
242
243 DISCUSSION
244 There have been numerous clinical and research studies demonstrating that quantitative CT lung
245 density measurements are related to important outcomes in COPD patients (5–8) and in patients
246 with alpha 1-antitrysin deficiency (9). Potential clinical applications include patient selection for
247 treatment (e.g. by lung volume reduction surgery or endobronchial valves), or for evaluating
248 treatment response over time. However, in order for CT lung density measurements to be used as
249 a surrogate of emphysema in clinical applications, the variability of the CT measurements must
250 be carefully controlled. Several large, multicenter, longitudinal cohort studies, including
251 COPDGene (18), SPIROMICS (24), ECLIPSE (25), MESA (26) and CanCOLD (27), have
252 implemented standardized image acquisition protocols to carefully control for known factors that
253 impact CT measurements. However, the number of software tools developed by academic groups
254 and commercial vendors to generate CT lung density measurements is increasing, with several
255 well-established commercial and prototype software packages now available, and each has their
256 own proprietary segmentation algorithms. For serial assessments or longitudinal evaluations
257 where there is potential to change software tools at different time-points the reproducibility of
258 CT measurements generated for various software tools must be evaluated.
259 In this study we evaluated reproducibility for eight different software tools, including well-
260 established software from both academic groups and commercial vendors. We investigated
261 never-smokers and participants with a range of COPD severities. Our results indicate relatively
262 high reproducibility across the different software tools for TLV, LAA950 and Perc15
263 measurements. Although the Bland-Altman analysis and Figure 1 indicate there are clear
264 differences for total lung volume segmentation between some of the vendors, which may result
265 in the slight deviations observed in the Bland-Altman analysis for LAA950, the bias overall was
266 quite low and for LAA950 the bias was less than 1% between all vendors. This bias is much less
267 than reported previously by Wielputz and colleagues (20) who investigated five software tools
268 (two academic and three commercial) for lung density measurements in COPD. The more
Auth
or
Manuscript

This article is protected by copyright. All rights reserved
269 reproducible findings reported here may be related to several factors: the wider range of severity
270 of the patients investigated (the patients evaluated by Wielputz and colleagues (20) were mainly
271 end-stage COPD); the fact that a more standardized image acquisition protocol was used for
272 COPDGene; or potentially improvements in image processing techniques over the last several
273 years leading to more reproducible measurements between software tools.
274 In addition to assessing inter-software agreement for CT measurements, we also generated
275 reproducibility coefficients (RDC) to determine how much variability may be introduced by
276 using different software tools when repeated measurements are made on the same patient.
277 Again, although the measurements generated by some software tools agreed slightly better than
278 others, the RDC values were low, and overall the RDC between all software tools was only 1.2%
279 for LAA950. For example, this indicates that if the software tool was changed during a
280 longitudinal study, whereby there were repeated measurements on the same patient but
281 measurements were made using different software, the variability attributed to the software
282 would be 1.2% for LAA950. In other words, to detect real emphysema progression, the
283 variability due to inter-software reproducibility measured in this study is 1.2% for LAA950.
284 However, to determine the true overall RDC, the inter-software reproducibility would need to be
285 combined with expected test/re-test measurement repeatability arising from differences in patient
286 positioning, scanner model, scanner calibration, breath hold volumes, etc., and a detection of
287 progression would need to be greater than the combined variability to be considered significant.
288 Obuchowski et. al. (28) has described the RDC calculations required to compute measurement
289 reproducibility and repeatability. In general, however, we recommend that the same software be
290 used for sequential measures during a longitudinal study, especially given that all methods
291 showed deterministic intra-software reproducibility.
292 Intra-software reproducibility was evaluated by having all groups run their software tool on the
293 same CT images a second time. The RDC for the intra-software comparison was zero. We also
294 requested each vendor run their software a third time and perform more rigorous QA. Although
295 3 of 8 vendors reported that manual edits were required in some of the participants evaluated (eg.
296 lung volume edits or airway and vessel removal), the RDC did not change between the first run
297 when there was no QA and the third run when QA was performed. This finding suggests that the
298 results generated between the software tools were similar regardless of whether QA was
Auth
or
Manuscript

This article is protected by copyright. All rights reserved
299 performed. This may indicate that lung segmentation and airway and vessel removal algorithms
300 generate similar results between vendors, before manual editing.
301 Finally, we investigated the RDC for CT measurements stratified by whether the software was
302 developed by academic-based groups or commercial vendors. Although based on the RDC we
303 found that the lung volume segmentation results tended to agree slightly better within
304 commercial vendors than academic groups, the difference was very small and the RDC for
305 LAA950 was 1.2% for both commercial and research vendors. This observation was consistent
306 with the results of the multivariable linear regression analysis in which we investigated group
307 type as a predictor of the standard deviation between the CT measurements generated by the
308 different software tools. We found commercial vendors had lower within-subject standard
309 deviation of TLV than academic groups, but no difference was found for LAA950 or Perc15
310 measurements. These findings indicate that for CT lung density measurements, the
311 reproducibility within academic-based and commercial vendors is similar.
312 Although efforts must be made to standardize CT measurements, including image acquisition
313 protocols and image analysis software, there are other sources of variability that may impact CT
314 measurements that were not considered in our study that must be acknowledged. For studies that
315 acquire multiple CT image series over a short period of time, there is the potential for variability
316 to be introduced due to physiological or patient-related factors, but not disease related factors,
317 such as the patient orientation in the bore, slightly different lung inflation volumes at breath-
318 hold, etc. Previous studies have investigated the short-term repeatability of CT lung density
319 measurements within the same-day (29), over two-weeks (30) and over a 1-year period (31) in
320 healthy volunteers and COPD patients. Although all studies report high short-term repeatability
321 for CT measurements, these patient related factors may also impact how the software performs,
322 and may add additional variability between groups. Therefore, an important limitation in our
323 study is that we did not investigate both the reproducibility and short-term repeatability of the
324 CT measurements between software tools. Our study is also limited by the fact that assessment
325 of CT lung segmentation accuracy is ultimately subjective, and therefore we were only able to
326 compare measurement reproducibility between the various software tools rather than accuracy,
327 as ground truth segmentation is not available. Another factor that should be considered is the
328 potential for individual commercial or academic groups to upgrade their software over time. For
329 serial and longitudinal studies, even when the same software tool is used for CT analysis, CT
Auth
or
Manuscript
This article is protected by copyright. All rights reserved
330 measurement reproducibility may need to be reassessed. Further, we note that we did not acquire
331 CT measurements by lung lobe from software tools and therefore we did not investigate CT
332 measurement reproducibility at the lobar level. Lobar segmentation algorithms between software
333 tools may be more variable than whole lung segmentation. Reporting CT lung volume and
334 density measurements by lobe is relevant for lung volume reduction applications, and therefore
335 should be investigated in future studies. We also acknowledge that instruction was provided to
336 the academic-based groups and commercial vendors using their software tools for performing the
337 analysis, including how much manual intervention was permitted and that there should be no
338 pre-processing of the images. This may or may not mimic how these vendors generate CT
339 measurements routinely. However, the goal of our study was to assess the reproducibility of
340 their software for generating CT lung density measurements under standardized conditions.
341 Finally, as a result of the well-standardized CT image acquisition parameters used in this study,
342 these findings may only be applicable to other well-standardized studies, or to clinical trials.
343 Further investigation is required to determine CT measurement reproducibility between software
344 tools for studies involving a wider range of CT acquisition parameters, such as those used in
345 clinical practice.
346 In conclusion, we evaluated CT lung volume and lung density measurement reproducibility
347 between eight different software tools using CT images acquired with standardized image
348 acquisition protocols. The bias was negligible and measurement reproducibility was high
349 between software tools, and was comparable for software developed by academic-based groups
350 and commercial vendors. While using the same software tool for serial studies is highly
351 recommended, these findings report how much added measurement variability will be introduced
352 should it be necessary to include different software tools in serial studies with standardized
353 image acquisition parameters, and provides guidance on how to incorporate such information
354 into longitudinal studies.
355 FIGURE LEGENDS
356
357 Figure 1. CT Lung and Emphysema Segmentation Generated by Two Different Software Tools.
358 Shown above are two examples of CT lung segmentation images from two different software
359 tools. Areas of the lung greater than or equal to -950 HU are colored in blue, areas less than -950
360 HU are colored in red. Differences in the inclusion of blood vessels (yellow arrows) and airways
Auth
or
Manuscript
This article is protected by copyright. All rights reserved
361 (white arrows) can impact lung volume and low-attenuation area calculations. Note that the CT
362 slice in this figure was the slice with the largest disagreement in segmentation volume over the
363 entire image series.
364 ACKNOWLEDGEMENTS
365 MK acknowledges support from the Parker B. Francis Fellowship Program and the Canada
366 Research Chair Program (Tier 2). SF acknowledges research funding from GE Healthcare to
367 develop MRI techniques. We would like to thank Julie Lisiecki and QIBA for their
368 organizational support, and all the academic groups and commercial vendors that participated in
369 this study.
370
371 FUNDING
372
373 The COPDGene project described is supported by Award Number U01 HL089897 and Award
374 Number U01 HL089856 from the National Heart, Lung, and Blood Institute. The content is
375 solely the responsibility of the authors and does not necessarily represent the official views of the
376 National Heart, Lung, and Blood Institute or the National Institutes of Health. The
377 COPDGene® project is also supported by the COPD Foundation through contributions made to
378 an Industry Advisory Board comprised of AstraZeneca, Boehringer-Ingelheim, Genentech,
379 GlaxoSmithKline, Novartis, and Sunovion.
380
381 DISCLOSURE OF CONFILICTS OF INTEREST
382
383 JS was an employee and shareholder of VIDA Diagnostics Inc.; MK is a consultant at VIDA
384 Diagnostics Inc.; CH is an employee of Imbio.
385
386
387
388 References
389 1. Muller NL, Staples CA, Miller RR, Abboud RT. “Density mask”. An objective method to
390 quantitate emphysema using computed tomography. Chest [Internet]. 1988/10/01.
391 1988;94(4):782–7. Available from: http://www.ncbi.nlm.nih.gov/pubmed/3168574
Auth
or
Manuscript

This article is protected by copyright. All rights reserved
392 2. Gevenois PA, De Vuyst P, de Maertelaer V, Zanen J, Jacobovitz D, Cosio MG, et al.
393 Comparison of computed density and microscopic morphometry in pulmonary
394 emphysema. Am J Respir Crit Care Med [Internet]. 1996/07/01. 1996;154(1):187–92.
395 Available from: http://www.ncbi.nlm.nih.gov/pubmed/8680679
396 3. Gevenois PA, Zanen J, de Maertelaer V, De Vuyst P, Dumortier P, Yernault JC.
397 Macroscopic assessment of pulmonary emphysema by image analysis. J Clin Pathol
398 [Internet]. 1995/04/01. 1995;48(4):318–22. Available from:
399 http://www.ncbi.nlm.nih.gov/pubmed/7615849
400 4. Dirksen A, Dijkman JH, Madsen F, Stoel B, Hutchison DC, Ulrik CS, et al. A randomized
401 clinical trial of alpha(1)-antitrypsin augmentation therapy. Am J Respir Crit Care Med
402 [Internet]. 1999/11/11. 1999;160(5 Pt 1):1468–72. Available from:
403 http://www.ncbi.nlm.nih.gov/pubmed/10556107
404 5. Johannessen A, Skorge TD, Bottai M, Grydeland TB, Nilsen RM, Coxson H, et al.
405 Mortality by level of emphysema and airway wall thickness. Am J Respir Crit Care Med
406 [Internet]. 2013/01/19. 2013;187(6):602–8. Available from:
407 http://www.ncbi.nlm.nih.gov/pubmed/23328525
408 6. Han MK, Kazerooni EA, Lynch DA, Liu LX, Murray S, Curtis JL, et al. Chronic
409 obstructive pulmonary disease exacerbations in the COPDGene study: associated
410 radiologic phenotypes. Radiology [Internet]. 2011/07/27. 2011;261(1):274–82. Available
411 from: http://www.ncbi.nlm.nih.gov/pubmed/21788524
412 7. Fishman A, Martinez F, Naunheim K, Piantadosi S, Wise R, Ries A, et al. A randomized
413 trial comparing lung-volume-reduction surgery with medical therapy for severe
414 emphysema. N Engl J Med [Internet]. 2003;348(21):2059–73. Available from:
415 http://www.ncbi.nlm.nih.gov/pubmed/12759479
416 8. Sciurba FC, Ernst A, Herth FJ, Strange C, Criner GJ, Marquette CH, et al. A randomized
417 study of endobronchial valves for advanced emphysema. N Engl J Med [Internet].
418 2010;363(13):1233–44. Available from: http://www.ncbi.nlm.nih.gov/pubmed/20860505
419 9. Chapman KR, Burdon JGW, Piitulainen E, Sandhaus RA, Seersholm N, Stocks JM, et al.
420 Intravenous augmentation treatment and lung density in severe α1 antitrypsin
421 deficiency (RAPID): a randomised, double-blind, placebo-controlled trial. Lancet
422 [Internet]. 386(9991):360–8. Available from: http://dx.doi.org/10.1016/S0140-
Auth
or
Manuscript
This article is protected by copyright. All rights reserved
423 6736(15)60860-1
424 10. Madani A, Van Muylem A, Gevenois PA. Pulmonary emphysema: effect of lung volume
425 on objective quantification at thin-section CT. Radiology [Internet]. 2010;257(1):260–8.
426 Available from: http://www.ncbi.nlm.nih.gov/pubmed/20663967
427 11. Yuan R, Mayo JR, Hogg JC, Pare PD, McWilliams AM, Lam S, et al. The effects of
428 radiation dose and CT manufacturer on measurements of lung densitometry. Chest
429 [Internet]. 2007/06/19. 2007;132(2):617–23. Available from:
430 http://www.ncbi.nlm.nih.gov/pubmed/17573501
431 12. Zaporozhan J, Ley S, Weinheimer O, Eberhardt R, Tsakiris I, Noshi Y, et al. Multi-
432 detector CT of the chest: influence of dose onto quantitative evaluation of severe
433 emphysema: a simulation study. J Comput Assist Tomogr [Internet]. [cited 2019 Jul
434 4];30(3):460–8. Available from: http://www.ncbi.nlm.nih.gov/pubmed/16778622
435 13. Madani A, De Maertelaer V, Zanen J, Gevenois PA. Pulmonary emphysema: radiation
436 dose and section thickness at multidetector CT quantification--comparison with
437 macroscopic and microscopic morphometry. Radiology [Internet]. 2007/03/30.
438 2007;243(1):250–7. Available from: http://www.ncbi.nlm.nih.gov/pubmed/17392257
439 14. Gierada DS, Bierhals AJ, Choong CK, Bartel ST, Ritter JH, Das NA, et al. Effects of CT
440 section thickness and reconstruction kernel on emphysema quantification relationship to
441 the magnitude of the CT emphysema index. Acad Radiol [Internet]. 2010 Feb [cited 2018
442 Dec 31];17(2):146–56. Available from: http://www.ncbi.nlm.nih.gov/pubmed/19931472
443 15. Boedeker KL, McNitt-Gray MF, Rogers SR, Truong DA, Brown MS, Gjertson DW, et al.
444 Emphysema: Effect of Reconstruction Algorithm on CT Imaging Measures. Radiology
445 [Internet]. 2004 Jul [cited 2018 Dec 31];232(1):295–301. Available from:
446 http://www.ncbi.nlm.nih.gov/pubmed/15220511
447 16. Kim V, Davey A, Comellas AP, Han MK, Washko G, Martinez CH, et al. Clinical and
448 computed tomographic predictors of chronic bronchitis in COPD: a cross sectional
449 analysis of the COPDGene study. Respir Res [Internet]. 2014/04/29. 2014;15:52.
450 Available from: http://www.ncbi.nlm.nih.gov/pubmed/24766722
451 17. Ley-Zaporozhan J, Ley S, Weinheimer O, Iliyushenko S, Erdugan S, Eberhardt R, et al.
452 Quantitative analysis of emphysema in 3D using MDCT: influence of different
453 reconstruction algorithms. Eur J Radiol [Internet]. 2008 Feb 1 [cited 2018 Dec
Auth
or
Manuscript
This article is protected by copyright. All rights reserved
454 31];65(2):228–34. Available from: http://www.ncbi.nlm.nih.gov/pubmed/17499951
455 18. Regan EA, Hokanson JE, Murphy JR, Make B, Lynch DA, Beaty TH, et al. Genetic
456 epidemiology of COPD (COPDGene) study design. COPD [Internet]. 2010;7(1):32–43.
457 Available from: http://www.ncbi.nlm.nih.gov/pubmed/20214461
458 19. Lim H, Weinheimer O, Wielpütz MO, Dinkel J, Hielscher T, Gompelmann D, et al. Fully
459 Automated Pulmonary Lobar Segmentation: Influence of Different Prototype Software
460 Programs onto Quantitative Evaluation of Chronic Obstructive Lung Disease. PLoS One
461 [Internet]. 2016 [cited 2019 Jul 3];11(3):e0151498. Available from:
462 http://www.ncbi.nlm.nih.gov/pubmed/27029047
463 20. Wielpü Tz MO, Bardarova D, Weinheimer O, Kauczor H-U, Eichinger M. Variation of
464 Densitometry on Computed Tomography in COPD-Influence of Different Software Tools.
465 PLoS One [Internet]. 2014 [cited 2019 Jul 3];9(11):112898. Available from:
466 www.plosone.org
467 21. Shen M, Tenda ED, McNulty W, Garner J, Robbie H, Luzzi V, et al. Quantitative
468 Evaluation of Lobar Pulmonary Function of Emphysema Patients with Endobronchial
469 Coils. Respiration [Internet]. 2019 Jun 25 [cited 2019 Jul 3];1–12. Available from:
470 http://www.ncbi.nlm.nih.gov/pubmed/31238320
471 22. Lung Density Committee. QIBA Profile: Computed Tomography: Lung Densitometry
472 [Internet]. Available from:
473 qibawiki.rsna.org/images/c/c9/QIBA_CT_Lung_Density_Profile_062619-appendix-
474 resolved.pdf
475 23. Raunig DL, McShane LM, Pennello G, Gatsonis C, Carson PL, Voyvodic JT, et al.
476 Quantitative imaging biomarkers: a review of statistical methods for technical
477 performance assessment. Stat Methods Med Res [Internet]. 2015;24(1):27–67. Available
478 from: http://www.ncbi.nlm.nih.gov/pubmed/24919831
479 24. Sieren JP, Newell Jr. JD, Barr RG, Bleecker ER, Burnette N, Carretta EE, et al.
480 SPIROMICS Protocol for Multicenter Quantitative Computed Tomography to Phenotype
481 the Lungs. Am J Respir Crit Care Med [Internet]. 2016;194(7):794–806. Available from:
482 http://www.ncbi.nlm.nih.gov/pubmed/27482984
483 25. Vestbo J, Anderson W, Coxson HO, Crim C, Dawber F, Edwards L, et al. Evaluation of
484 COPD Longitudinally to Identify Predictive Surrogate End-points (ECLIPSE). Eur Respir
Auth
or
Manuscript

This article is protected by copyright. All rights reserved
485 J [Internet]. 2008/01/25. 2008;31(4):869–73. Available from:
486 http://www.ncbi.nlm.nih.gov/pubmed/18216052
487 26. Multi-Ethnic Study of Atherosclerosis (MESA) Lung Study [Internet]. Available from:
488 http://www.cumc.columbia.edu/dept/medicine/generalmed/epi_copd.htm
489 27. Bourbeau J, Tan WC, Benedetti A, Aaron SD, Chapman KR, Coxson HO, et al. Canadian
490 Cohort Obstructive Lung Disease (CanCOLD): Fulfilling the need for longitudinal
491 observational studies in COPD. COPD [Internet]. 2012/03/22. 2014;11(2):125–32.
492 Available from: http://www.ncbi.nlm.nih.gov/pubmed/22433011
493 28. Obuchowski NA, Reeves AP, Huang EP, Wang X-F, Buckler AJ, Kim HJ (Grace), et al.
494 Quantitative imaging biomarkers: A review of statistical methods for computer algorithm
495 comparisons. Stat Methods Med Res [Internet]. 2015 Feb 11 [cited 2019 Jul 23];24(1):68–
496 106. Available from: http://www.ncbi.nlm.nih.gov/pubmed/24919829
497 29. Iyer KS, Grout RW, Zamba GK, Hoffman EA. Repeatability and Sample Size Assessment
498 Associated with Computed Tomography-Based Lung Density Metrics Introduction.
499 MDCT Repeatability journal.copdfoundation.org I JCOPDF © [Internet]. 2014 [cited
500 2019 Jul 3];1(1):97–104. Available from:
501 http://dx.doi.org/10.15326/jcopdf.1.1.2014.0111.
502 30. Shaker SB, Dirksen A, Laursen LC, Maltbaek N, Christensen L, Sander U, et al. Short-
503 term reproducibility of computed tomography-based lung density measurements in alpha-
504 1 antitrypsin deficiency and smokers with emphysema. Acta Radiol [Internet]. 2004 Jul
505 [cited 2019 Jul 3];45(4):424–30. Available from:
506 http://www.ncbi.nlm.nih.gov/pubmed/15323395
507 31. Shin JM, Kim TH, Haam S, Han K, Byun MK, Chang YS, et al. The repeatability of
508 computed tomography lung volume measurements: Comparisons in healthy subjects,
509 patients with obstructive lung disease, and patients with restrictive lung disease. Nolan A,
510 editor. PLoS One [Internet]. 2017 Aug 10 [cited 2019 Jul 3];12(8):e0182849. Available
511 from: https://dx.plos.org/10.1371/journal.pone.0182849
512 Auth
or
Manuscript

This article is protected by copyright. All rights reserved
Table 1. Subject Demographics
Parameter* GOLD 0
(n=10)
GOLD I
(n=10)
GOLD II
(n=10)
GOLD III
(n=10)
GOLD IV
(n=10)
Age, yrs 68 (8) 69 (9) 63 (10) 68 (9) 62 (6)
Female Sex, n (%) 4 (40) 4 (40) 4 (40) 3 (30) 5 (50)
Race, n (%)
Non-Hispanic White 10 (100) 9 (90) 8 (80) 8 (80) 6 (60)
African American 0 (0) 1 (10) 2 (20) 2 (20) 4 (40)
* All parameter values are mean (+/- SD) unless otherwise noted.
Table 2. Bland-Altman Analysis for Each Software Compared to the Average of All Other
Software Tools
Mean Bias Median Bias SD of Bias Upper 95%
CI
Lower 95%
CI
TLV (L)
Software 1 -0.15 -0.14 0.05 -0.06 -0.25
Software 2 0.04 0.02 0.04 0.12 -0.04
Software 3 0.22 0.23 0.05 0.32 0.13
Software 4 0.05 0.04 0.02 0.09 0.01
Software 5 -0.04 -0.04 0.03 0.01 -0.09
Software 6 -0.01 -0.01 0.02 0.03 -0.06
Software 7 -0.21 -0.19 0.05 -0.10 -0.31
Software 8 0.10 0.09 0.04 0.18 0.02
LAA950 (%)
Software 1 0.33 0.22 0.37 1.05 -0.40
Software 2 -0.24 -0.18 0.28 0.31 -0.80
Software 3 -0.29 -0.14 0.34 0.37 -0.95
Auth
or
Manuscript
This article is protected by copyright. All rights reserved
Software 4 -0.42 -0.39 0.29 0.15 -0.98
Software 5 -0.34 -0.34 0.19 0.03 -0.71
Software 6 0.42 0.39 0.20 0.82 0.02
Software 7 0.46 0.26 0.49 1.42 -0.50
Software 8 0.09 0.10 0.12 0.32 -0.15
Perc15 (HU)
Software 1 -0.33 -0.39 0.47 0.58 -1.24
Software 2 0.20 0.14 0.36 0.90 -0.51
Software 3 0.97 0.95 0.46 1.87 0.07
Software 4 0.49 0.54 0.39 1.25 -0.27
Software 5 0.24 0.17 0.36 0.95 -0.47
Software 6 -0.88 -0.80 0.27 -0.35 -1.40
Software 7 -0.58 -0.57 0.57 0.54 -1.70
Software 8 -0.11 -0.18 0.32 0.52 -0.74
Table 3. The RDC for TLV, LAA950 and Perc15 for All Software Tools with and without QA
Inter-software RDC
Without QA
Inter-software RDC
With QA
Parameter RDC 95% CI RDC 95% CI
TLV (L)
Total 0.35 0.32 – 0.37 0.35 0.32 – 0.37
Software 1 0.38 0.35 – 0.41 0.38 0.35 – 0.42
Software 2 0.26 0.24 – 0.27 0.26 0.24 – 0.28
Software 3 0.26 0.24 – 0.29 0.26 0.24 – 0.29
Software 4 0.48 0.46 – 0.51 0.48 0.45 – 0.51
Software 5 0.25 0.23 – 0.27 0.25 0.23 – 0.27
Software 6 0.46 0.43 – 0.49 0.46 0.43 – 0.49
Software 7 0.31 0.28 – 0.34 0.31 0.28 – 0.34
Software 8 - - - -
Software 9 0.26 0.24 – 0.28 0.26 0.24 – 0.28
LAA950 (%)
Auth
or
Manuscript

This article is protected by copyright. All rights reserved
Total 1.2 1.0 – 1.4 1.2 1.0 – 1.4
Software 1 1.2 1.0 – 1.5 1.2 1.0 – 1.5
Software 2 1.1 0.9 – 1.2 1.1 0.9 – 1.2
Software 3 1.1 0.9 – 1.2 1.1 0.9 – 1.2
Software 4 1.2 0.9 – 1.4 1.2 0.9 – 1.4
Software 5 1.2 1.0 – 1.3 1.2 1.0 – 1.3
Software 6 1.5 1.2 – 1.8 1.5 1.2 – 1.8
Software 7 0.9 0.7 – 1.0 0.9 0.7 – 1.0
Software 8 - - - -
Software 9 1.2 1.0 – 1.4 1.2 1.0 – 1.4
Perc15 (HU)
Total 1.8 1.6 – 2.0 1.8 1.6 – 2.1
Software 1 1.6 1.4 – 1.9 1.7 1.4 – 1.9
Software 2 1.5 1.3 – 1.7 1.6 1.3 – 1.8
Software 3 1.5 1.3 – 1.6 1.5 1.3 – 1.6
Software 4 2.3 2.1 – 2.6 2.3 2.1 – 2.6
Software 5 2.1 1.9 – 2.3 2.1 1.9 – 2.3
Software 6 2.0 1.6 – 2.3 2.0 1.6 – 2.4
Software 7 1.4 1.2 – 1.7 1.4 1.2 – 1.6
Software 8 - - - -
Software 9 1.7 1.5 – 1.9 1.7 1.5 – 1.9
Table 4. The RDC for TLV, LAA950 and Perc15 for Academic-based and Commercial Software
Tools
Parameter Inter-software RDC
without QA
95% CI Inter-software RDC
with QA
95% CI
TLV (L)
Academic 0.39 0.36 – 0.41 0.39 0.36 – 0.41
Commercial 0.32 0.29 – 0.34 0.32 0.29 – 0.35
Auth
or
Manuscript
This article is protected by copyright. All rights reserved
LAA950 (%)
Academic 1.2 0.9 – 1.4 1.2 0.9 – 1.4
Commercial 1.2 1.0 – 1.3 1.1 1.0 – 1.3
Perc15 (HU)
Academic 1.7 1.5 – 1.9 1.7 1.5 – 1.9
Commercial 1.6 1.3 – 1.9 1.6 1.3 – 2.0
Table 5. Multivariable Linear Regression Analysis for Software Tool Type with Standard
Deviation of TLV, LAA950 and Perc15
Estimate Standard Error Significance of
Difference (p)
TLV [SD] -0.03 0.004 <0.0001
LAA950 [SD] -0.009 0.01 0.46
Perc15 [SD] -0.04 0.03 0.24
*Software type (academic=1, commercial=2)
Auth
or
Manuscript

mp_14130_f1.jpg
Thisarticleisprotectedbycopyright.Allrightsreserved
Auth
or
Manuscript