4.8 mark hurwitz
DESCRIPTION
TRANSCRIPT

Mark HurwitzProject Renewal
Preventing recidivism and homelessness:housing strategies forex off enders
National Conference on Ending HomelessnessJuly 14, 2011
1925
1928
1931
1934
1937
1940
1943
1946
1949
1952
1955
1958
1961
1964
1967
1970
1973
1976
1978
1981
1984
1987
1990
1993
1996
1999
2002
2005
2008
0
100
200
300
400
500
600
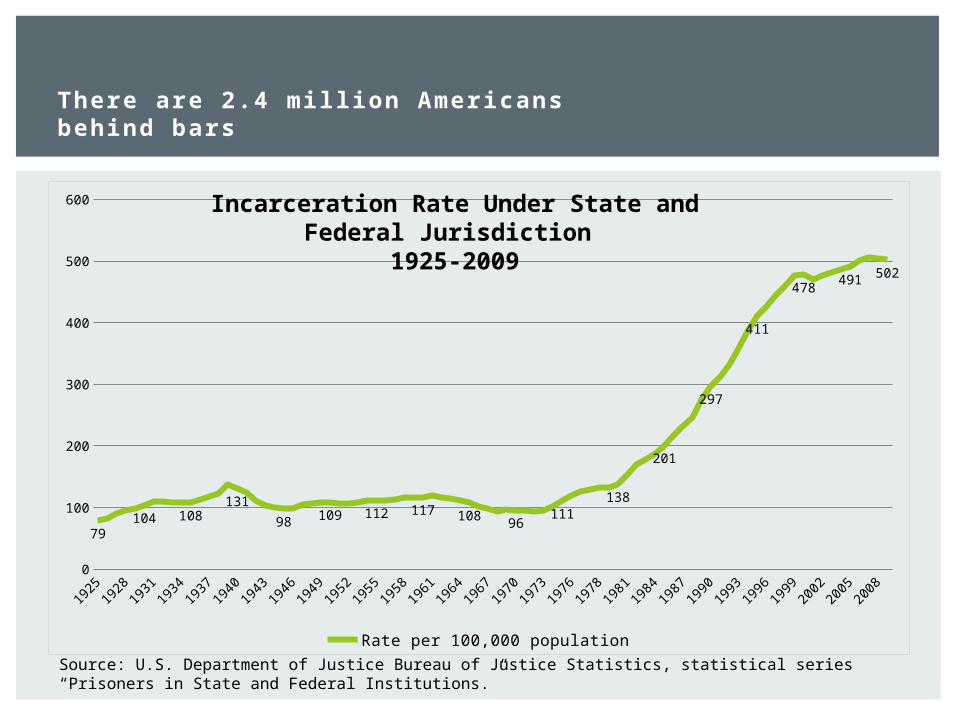
79104 108
131
98 109 112 117 108 96111
138
201
297
411
478491 502
Rate per 100,000 population
There are 2.4 mill ion Americans behind bars
Source: U.S. Department of Justice Bureau of Justice Statistics, statistical series “Prisoners in State and Federal Institutions.”
Incarceration Rate Under State and Federal Jurisdiction
1925-2009
United States
Mexico
New Zealand
Turkey
England and Wales
Australia
Greece
Netherlands
South Korea
Belgium
Germany
Switzerland
Norway
Denmark
Iceland
0 100 200 300 400 500 600 700 800
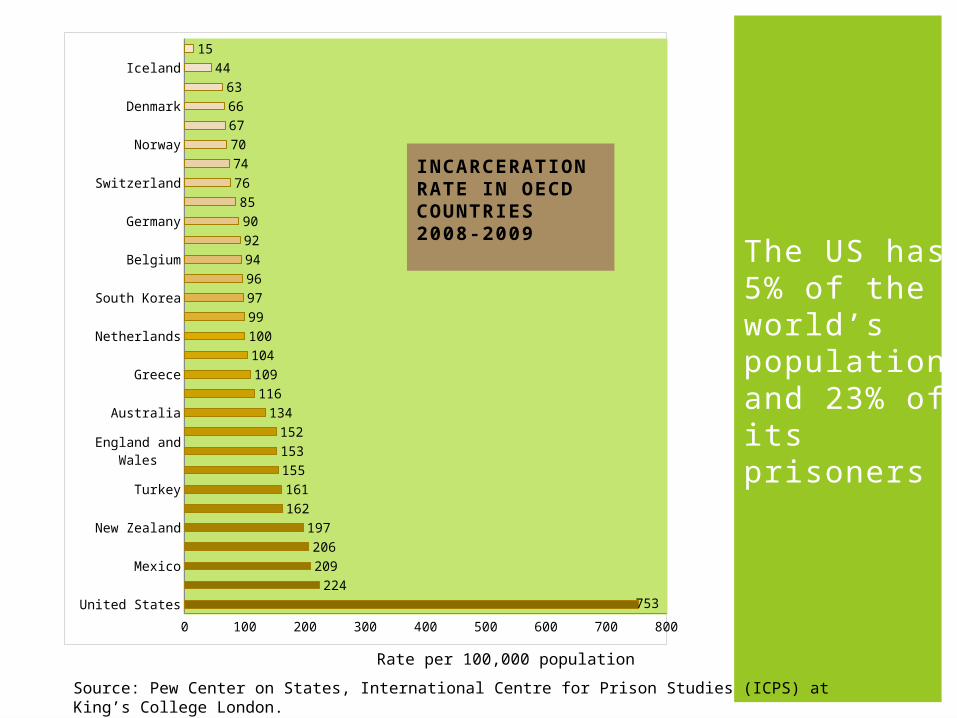
753224
209206
197162161155153152
134116
10910410099979694929085
767470676663
4415
The US has 5% of the world’s population and 23% of its prisoners
INCARCERATION RATE IN OECD COUNTRIES2008-2009
Rate per 100,000 population
Source: Pew Center on States, International Centre for Prison Studies (ICPS) at King’s College London.

Rates of Institutionalization, including Jails, in the United States 1934-2001
Growth in prisons followed the shrinkage of mental hospitals
Rate per 100,000 adults
Source: An Institutionalization Effect: The Impact of Mental Hospitalization and Imprisonment on Homicide in the United States, 1934 – 2001 by B. E. Harcourt, The Law School The University of Chicago, 2009

Black male high school dropouts have a 68% chance of imprisonment before the age of 35
men born 1945-1949
men born1975-1979
Source: Becky Pettit, Bryan Sykes, and Bruce Western, “Technical Report on Revised Population Estimates and Analysis Tables for the Pew Public Safety and Mobility Project” (Harvard University, 2009).
Cumulative risk of imprisonment by age 30-34
White Black Latino0
10
20
30
40
50
60
70
1.4
10.4
2.83.8
14.7
4.11.5
11
2.90.4
5.3
1.1
All High School Dropouts HS/GED College
White Black Latino 0
10
20
30
40
50
60
70
5.4
26.8
12.2
28
68
19.6
6.2
21.4
9.2
1.2
6.63.4
All High School Dropouts HS/GED College
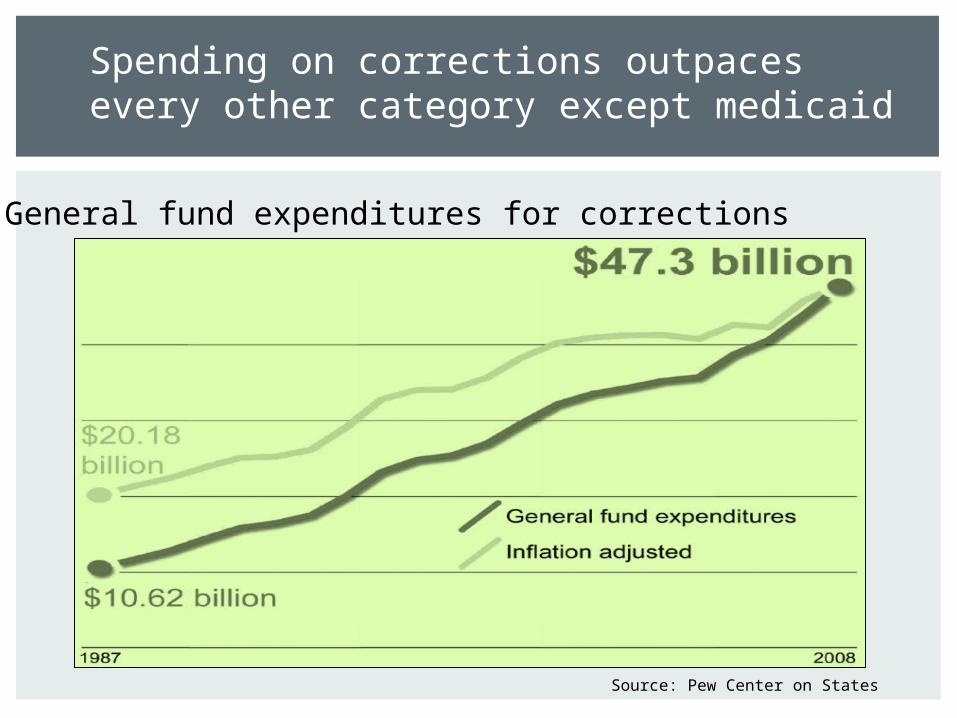
Spending on corrections outpaces every other category except medicaid
General fund expenditures for corrections
Source: Pew Center on States
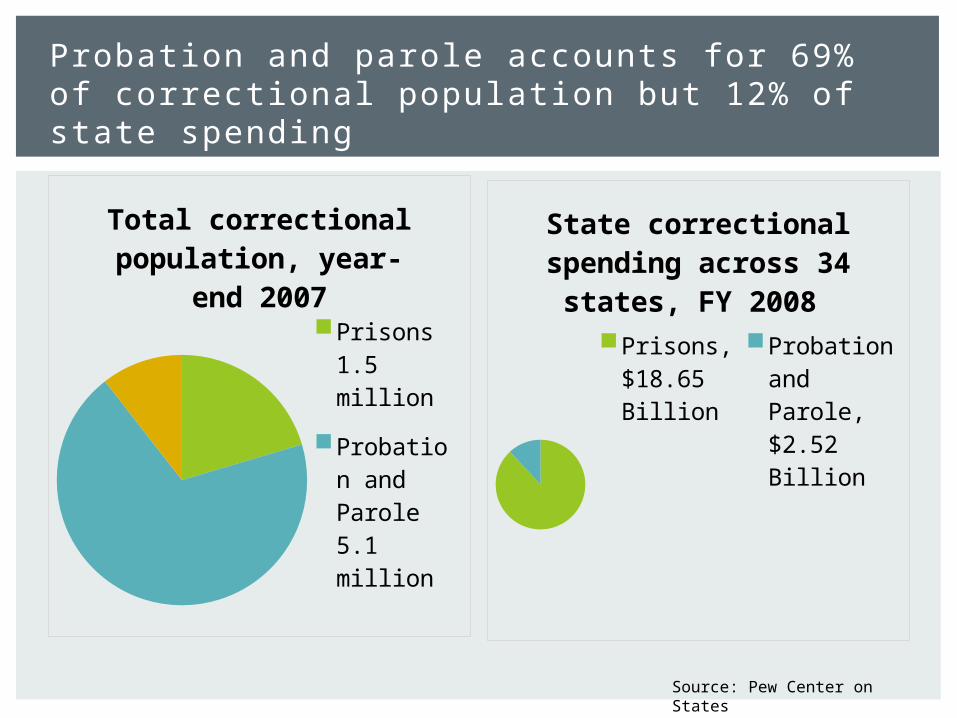
Total correctional population, year-
end 2007
Prisons 1.5 mil-lion
Probation and Pa-role 5.1 million
Jail 0.8 million
State correctional spending across 34
states, FY 2008 Prisons, $18.65 BillionProbation and Pa-role, $2.52 Bil-lion
Probation and parole accounts for 69% of correctional population but 12% of state spending
Source: Pew Center on States
Prison
Sys
tem
s
Prob
atio
n Ag
encies
Paro
le A
genc
ies
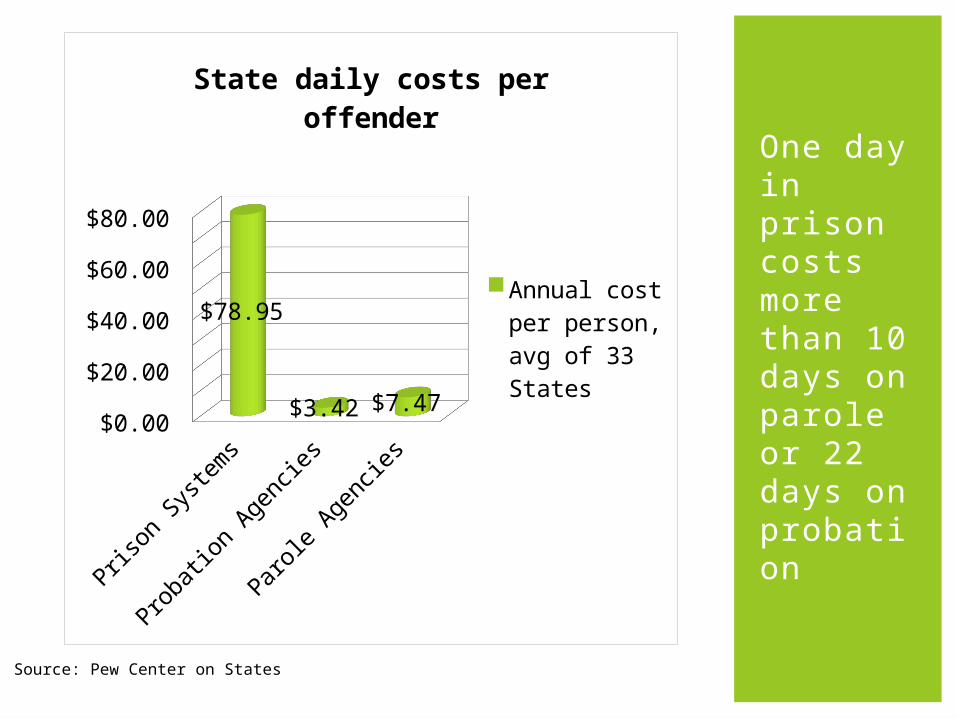
$0.00 $10.00 $20.00 $30.00 $40.00 $50.00 $60.00 $70.00 $80.00
$78.95
$3.42 $7.47
State daily costs per of-fender
Annual cost per person, avg of 33 States
One day in prison costs more than 10 days on parole or 22 days on probation
Source: Pew Center on States
j
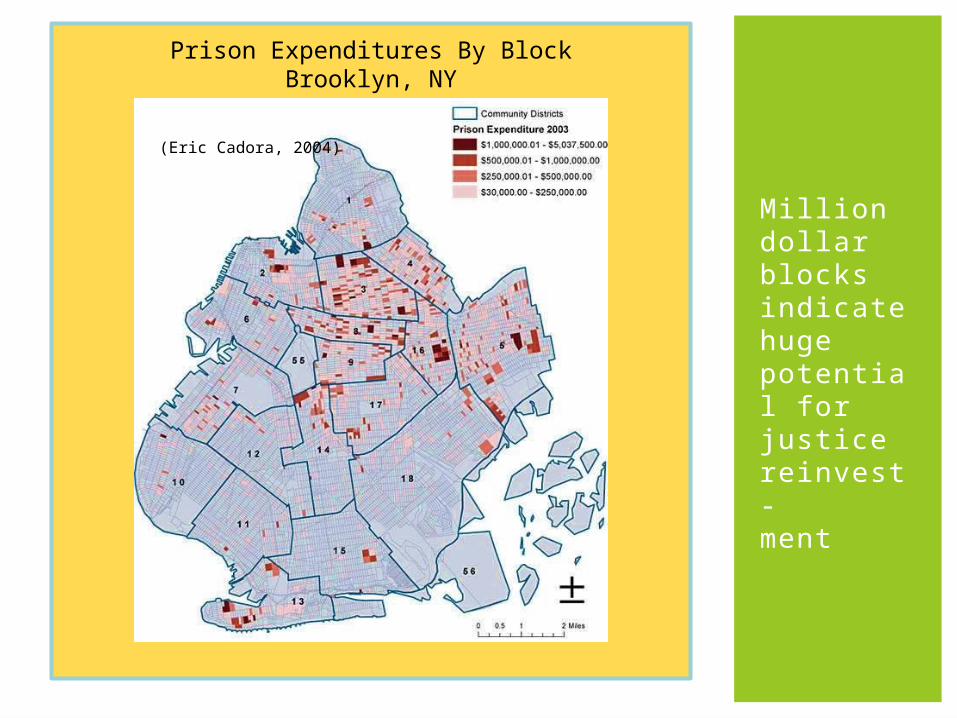
Million dollar blocks indicate huge potential for justice reinvest-ment
(Eric Cadora, 2004)
Prison Expenditures By BlockBrooklyn, NY
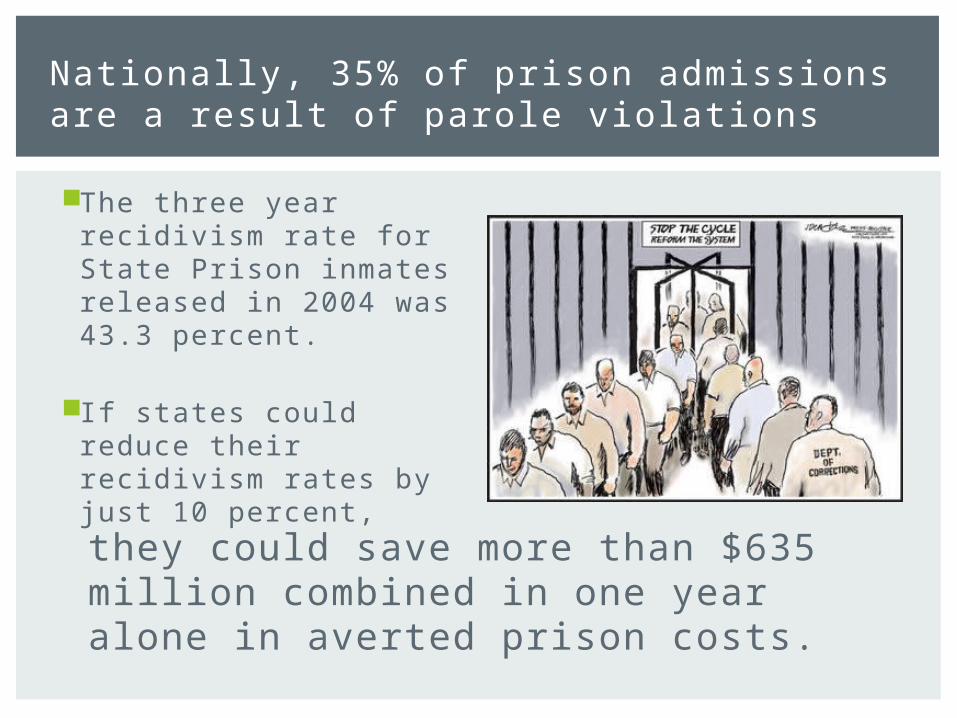
The three year recidivism rate for State Prison inmates released in 2004 was 43.3 percent.
If states could reduce their recidivism rates by just 10 percent, they could save more than $635 million combined in one year alone in averted prison costs.
Nationally, 35% of prison admissions are a result of parole violations
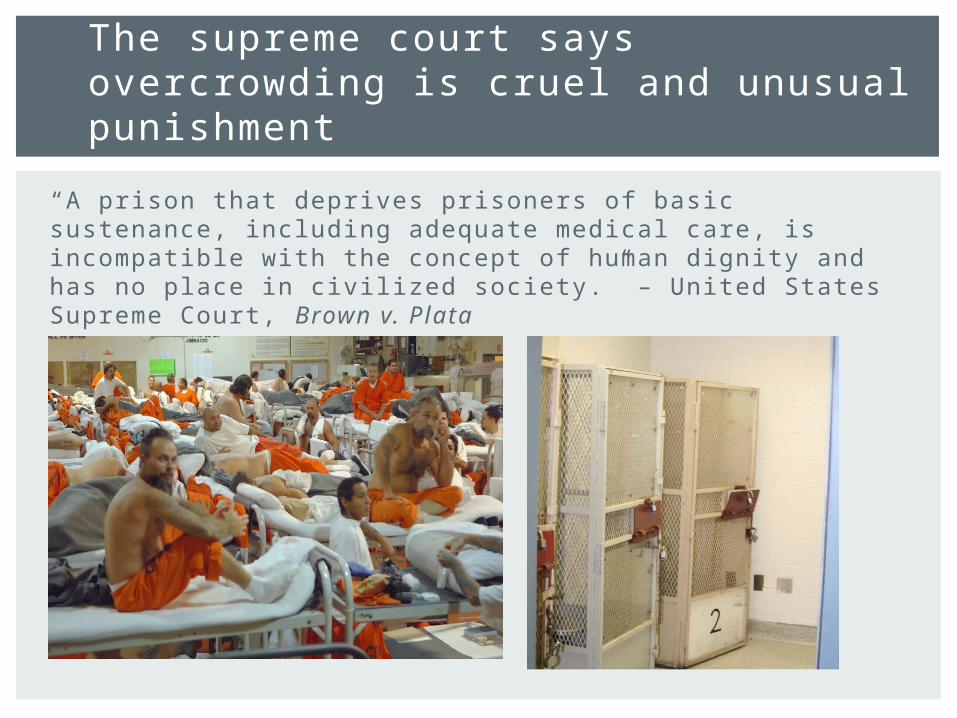
“A prison that deprives prisoners of basic sustenance, including adequate medical care, is incompatible with the concept of human dignity and has no place in civilized society.” – United States Supreme Court, Brown v. Plata
The supreme court says overcrowding is cruel and unusual punishment
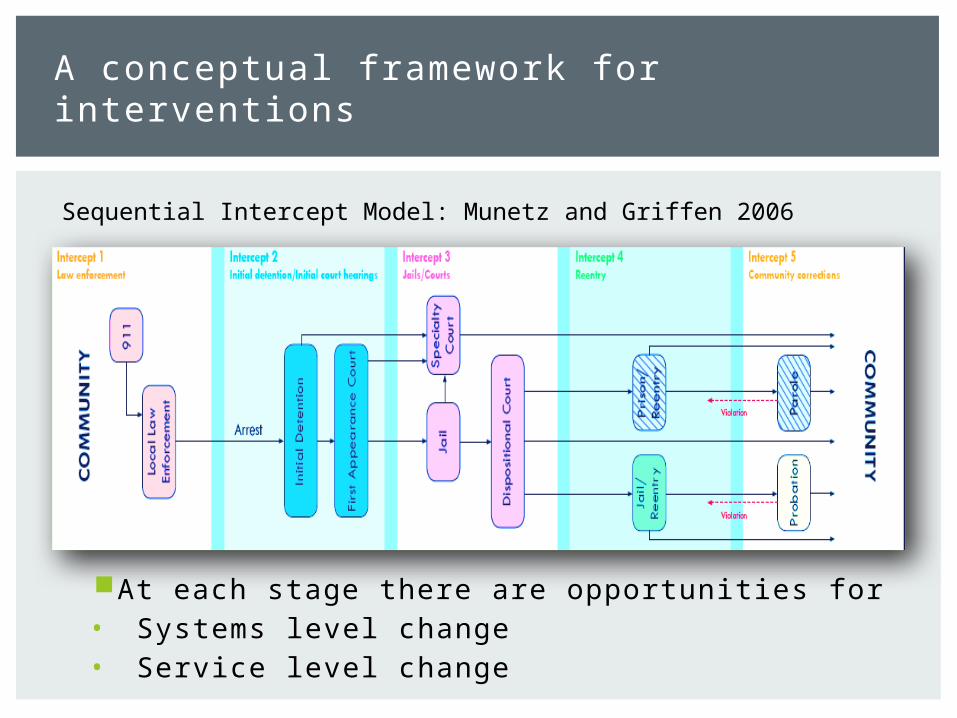
A conceptual framework for interventions
At each stage there are opportunities for• Systems level change• Service level change
Sequential Intercept Model: Munetz and Griffen 2006
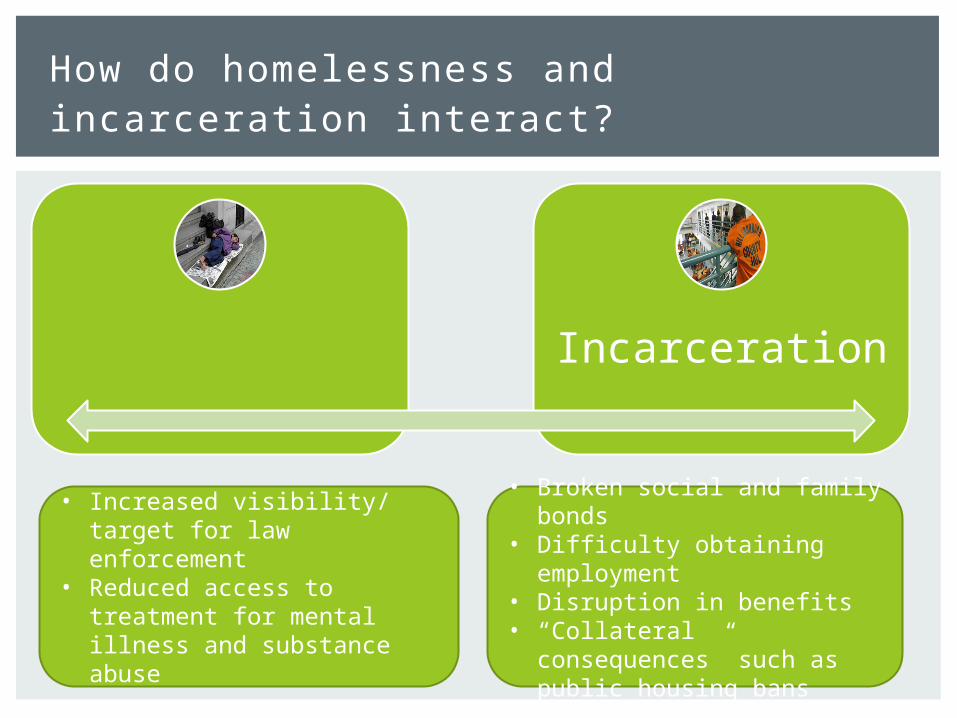
Incarceration
How do homelessness and incarceration interact?
• Increased visibility/ target for law enforcement
• Reduced access to treatment for mental illness and substance abuse
• Broken social and family bonds
• Difficulty obtaining employment
• Disruption in benefits• “Collateral consequences”
such as public housing bans
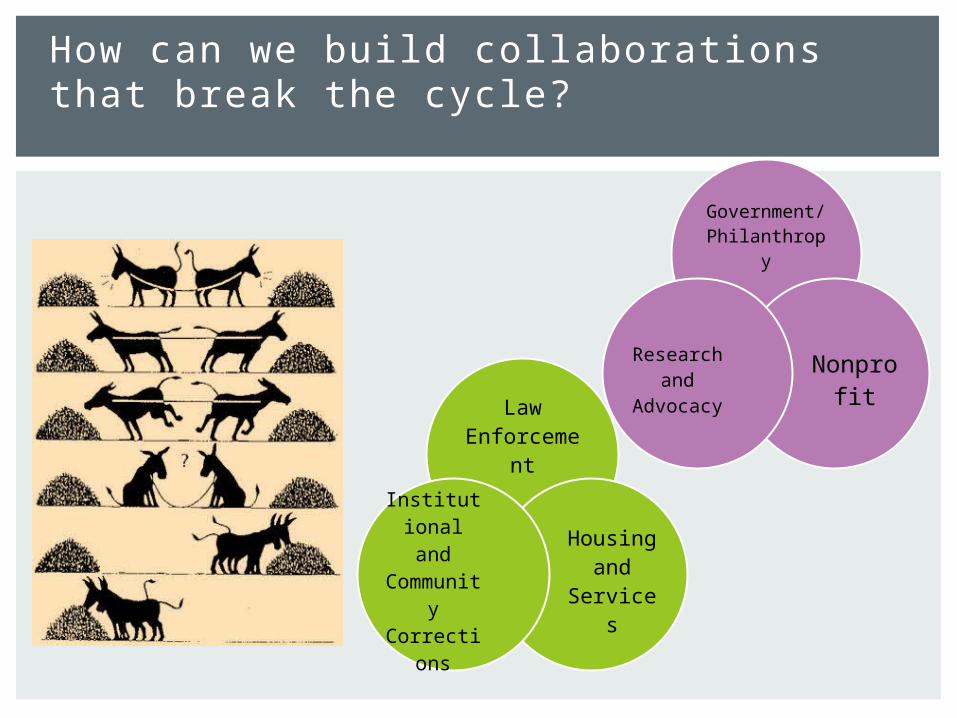
How can we build collaborations that break the cycle?
Law Enforceme
nt
Housing and
Services
Institutional and
Community
Corrections
Government/ Philanthropy
Nonprofit
Research and
Advocacy
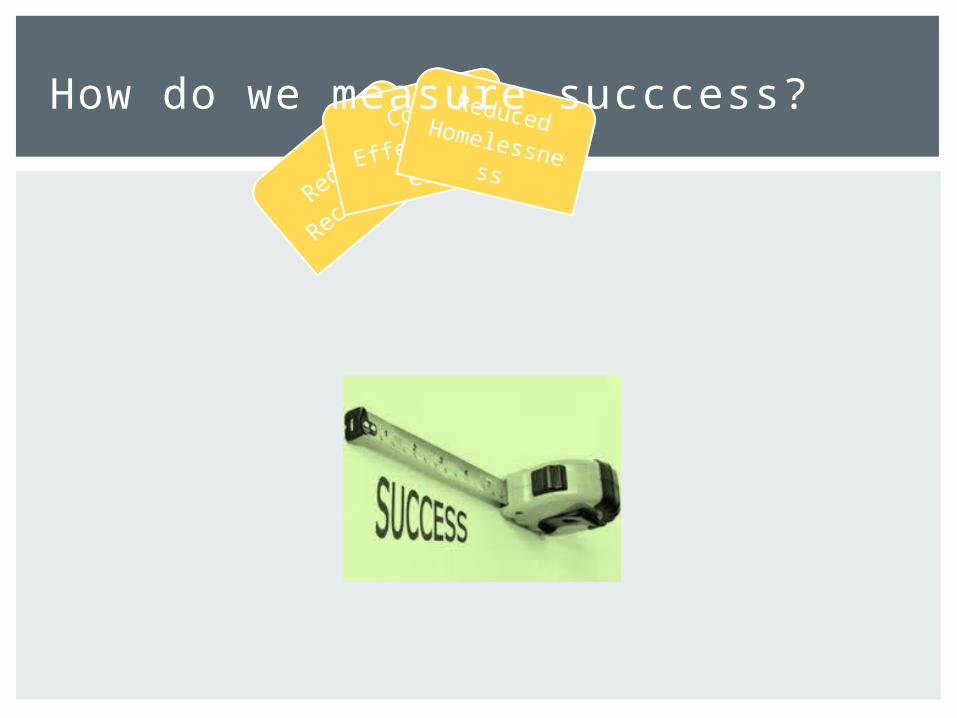
Reduce
d
Recid
ivism
Cost
Effectivenes
s
Reduced Homelessness
How do we measure succcess?
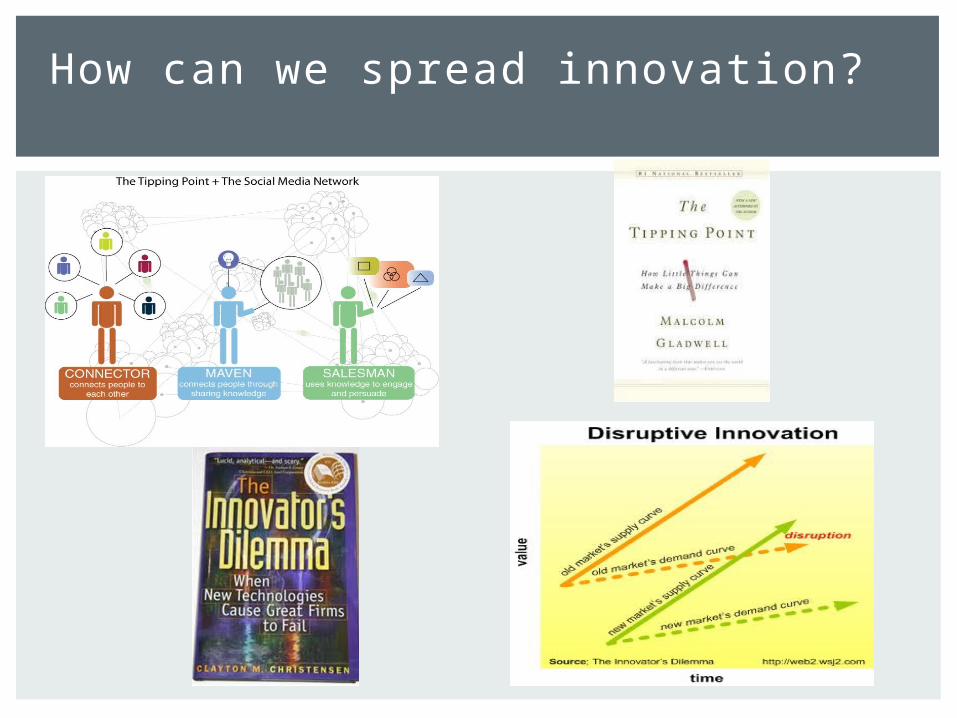
How can we spread innovation?
http://www.nationalreentryresourcecenter.org/http://reentrypolicy.org/http://gainscenter.samhsa.gov/html/http://
www.pewcenteronthestates.org/initiatives_detail.aspx?initiativeID=31336
http://www.csh.org/index.cfm?fuseaction=Page.viewPage&pageId=4480&nodeID=81
http://www.urban.org/justice/index.cfmhttp://www.vera.org/http://www.courtinnovation.org/
RESOURCES