50 waterloo road macquarie park nsw 2113 australia po box ... · 6/24/2013 · 2 “it is a...
TRANSCRIPT

24 June 2013 ASX Limited Company Announcements Office Level 4, Exchange Centre 20 Bridge Street SYDNEY NSW 2000 Dear Sir/ Madam METCASH LIMITED – 2013 FINANCIAL REPORT Please find attached the following:
(a) Announcement – FY13 Results
(b) Appendix 4E and Financial Report (including the Directors’ Report and Independent Audit Report of Metcash Limited for the financial year ended 30 April 2013.
Yours faithfully Greg Watson Company Secretary
Metcash Limited ABN 32 112 073 480
50 Waterloo Road Macquarie Park
NSW 2113 Australia
PO Box 6226 Silverwater Business Centre
NSW 1811 Australia Ph: 61 2 9751 8200
Fax: 61 2 9741 3027
For
per
sona
l use
onl
y

1
24 June 2013 ASX ANNOUNCEMENT
METCASH LIMITED RECORDS SOLID REVENUE AND PROFIT GROWTH FOR 14TH YEAR
• Reported Revenue rose 3.8% to $13.1 billion; • Wholesale Sales rose 3.8% to $13.0 billion; • Reported Profit After Tax grew 129% to $206 million; • Underlying Profit After Tax rose 6.9% to $281 million; • Operating Cash Flow grew 5.5% to $300 million; and • Final Dividend at 16.5 cents per share fully franked for the half - full year 28 cents.
Metcash Limited today released its full year results for the 12 months to April 30, 2013. The company announced an increase in Group Wholesale Sales of 3.8% to $13.0 billion. Reported Profit After Tax rose 129% to $206 million – the rise reflects the cycling of restructuring charges booked in the prior year, a strong result from the liquor division and increased investment in new business.
Underlying PAT rose 6.9% to $281 million whilst Underlying Earnings Per Share declined 4.4% reflecting the fact that most of the investments funded by the equity raising occurred part way through the year and did not deliver a full years’ earnings. The company recorded a strong Operating Cash Flow rising 5.5% to $300 million reflecting the underlying earnings and improved working capital performance.
Metcash delivered a strong dividend payout ratio paying 86% of underlying Earnings Per Share. The final dividend of 16.5 cents per share takes the full year dividend to 28 cents per share, fully franked. The record date is Thursday 4 July 2013 at 5pm (AEST) with the dividend to be paid on Friday 12 July 2013. The maintenance of a strong dividend reflects the Board’s confidence in the underlying position of the Group, its future prospects and strong cash flow generation.
Andrew Reitzer, CEO of Metcash said the business remained in a strong position and was capable of weathering difficult economic conditions.
Metcash Limited ABN 32 112 073 480
50 Waterloo Road Macquarie Park NSW 2113
NSW 2113 Australia
For
per
sona
l use
onl
y
2
“It is a challenging time for the independent retail sector with consumer confidence low and the self service supermarket chains locked in a marketing war. Most particularly, as a wholesaler, we have also had to weather the impacts of continuing price deflation.
“The core grocery business has performed reasonably in light of the difficult market conditions, ALM is performing extremely well, Hardware & Automotive is performing in line with expectations, and the strategic acquisitions are progressing soundly.
“We are pleased to announce a full year result that meets our guidance amid tough trading conditions, and being able to maintain a strong payout ratio to return earnings to our shareholders,” Mr Reitzer said.
BUSINESS PILLAR PERFORMANCE
Metcash Food & Grocery
Metcash Food & Grocery sales fell by 2.3% from $9.3 billion to $9.1 billion due largely to the closure of Campbells branches, closure of a number of Cornetts and Walters stores in Far North Queensland and store closures in WA. EBITA declined 5% from $398 million to $378 million reflecting the deleveraging effect of deflation as well as significant additional investment in marketing and increased utility and transport costs.
The Supabarn wholesale supply contract was re-established and a contract to supply Spotless operations in WA and Qld was also won. The Franklins conversions are working well and despite more store closures than anticipated, the strategic footprint achieved for IGA in NSW is significant.
Metcash Food & Grocery responded to the market conditions with a focus on marketing and merchandising strategies. The relaunch of the Supa IGA supermarkets in NSW and the new advertising campaigns featuring comedian Anh Do have proven successful in raising the brand presence of IGA as well as showcasing our consumer proposition: Ranging, Fresh, ‘Locked Down Low Price’, and the contribution IGA makes to their local communities through the Community Chest Program.
Fifty-one new IGA stores were opened during the year. When combined with conversions, extensions and refurbishments, a total of 62,693 square metres have been added to the IGA store footprint across Australia. In addition 50 stores were subject of buyback and were put into hands of focussed retailers resulting in an uplift in sales.
In Convenience, the single pick KNAPP system is now fully operational at the Huntingwood DC providing the division with an advanced single pick system for Convenience customers. This technology picks an average of 25,000 single items per day, with the capacity to increase to 35,000 single items per day in peak periods. Also in Convenience, new concept store Value Depot, opened in Brisbane and has exceeded its forecast sales and EBIT targets.
For
per
sona
l use
onl
y

3
Australian Liquor Marketers (ALM)
Liquor performed strongly again this year with sales growth of 24.9% and EBITA of $47 million, an increase of 35%. The strong performance was driven by the contract with Liquor Marketing Group Limited and Hotel & Tourism Management Pty Limited (LMG) as well as improved execution and a better retail offer at store level which also drove organic growth in the underlying business. The increased volume has been successfully integrated across the network enabling improved operating leverage to reduce the average cost of doing business.
Not only did the liquor pillar maintain its position as having the second largest retail footprint, it continued to grow volume while the overall market declined.
ALM rolled out larger format retail stores in several locations which have performed very well with suppliers responding positively. Three hotel acquisitions were made during the year and this strategy will continue to be pursued as opportunities present themselves. This will assist in supporting parts of the existing retail network while introducing new wholesale revenue streams.
Hardware & Automotive
The Hardware & Automotive pillar performed strongly with sales growing 12.6% and EBITA growing 70.8% to $36 million, as a result of solid business performance, acquisitions in Mitre 10 and the addition of the Automotive Brands Group (ABG).
Mitre 10 continued to strengthen its distribution network with the creation of seven new joint ventures. In addition 20 new Mitre 10 stores have joined the network in the last 12 months. This is a total of 52 new stores converted to Mitre 10 over the past two and a half years, 33 of which have come from its major competitor. The Natbuild trade alliance was finalised this year and has further strengthened the company’s position in the trade sector.
The automotive side of the business is performing well and in line with expectations. The focus now is on future growth and the automotive aftermarket sector provides Metcash with significant opportunities. The sector is worth $5.6bn.
The acquisition of ATAP in May 2013 is the next stage in this consolidation. Their extensive network includes distribution centres in all major cities, provides a national footprint including a presence in NSW where ABG did not previously have a distribution centre, and provides access to a fragmented market which includes approximately 2,500 independent retailers.
Entering this sector will allow Metcash to leverage its core competencies in supply chain, merchandising, marketing and operational support to another group of independent retailers.
Project Mustang
The previously announced project to fully automate the Huntingwood DC has commenced. Construction is on schedule and the new automated system is expected to ‘go live’ in September 2014. This new system will provide a more efficient replenishment system, producing denser pallet assembly and reducing packing and transport costs.
For
per
sona
l use
onl
y
4
Future Plans
Mr Reitzer said the results were encouraging in the context of challenging market conditions. “The impact of deflation has continued and we have been affected by the deregulation of trading hours in WA. This together with some store closures has resulted in a small decline in our market share in Metcash Food & Grocery. We have met this challenge by focussing on a comprehensive national marketing strategy.
“The restructured supermarket joint ventures and the contribution from the converted Franklins stores have provided an important boost to the IGA network. The relaunch of the Supa IGA channel in NSW has seen our brand presence grow markedly in that state.
“Again the strong performance of ALM is a highlight as the LMG contract has been rolled out. Mitre 10 has enjoyed solid network growth and ABG is performing very well. The ATAP acquisition will position this pillar strongly as the sector continues to consolidate,” Mr Reitzer said.
Incoming CEO Ian Morrice said he thought the results were creditable in such difficult economic conditions.
“My transition period has enabled me to deepen my understanding of the Metcash business. I now have a fuller appreciation of the great strengths of our business as well as the challenges and opportunities in front of us.
“I have been impressed by the talent across the Metcash team, the passion of the independent retailers we support and the strong relationships we have with our suppliers.
“I have initiated a strategic planning process which will be complete by the end of 2013. This process will develop our strategic priorities, growth opportunities and build on the great platform that Andrew and the team have created.
“A key priority will be to review the Food & Grocery operations to respond to the ongoing deflationary and competitive market conditions.
“There is an ongoing focus for the group as we continue to invest in our core logistics capabilities, and optimise the value of recent acquisitions and supply contracts,” Mr Morrice said.
For further information:
Stephen Woodhill General Manager Corporate Affairs Metcash Limited Ph: +61 2 9741 3415 Mob: +61 (0)413 318 455
For
per
sona
l use
onl
y

Appendix 4E
Preliminary final report
Rules 4.3A
Appendix 4E
Name of entity:
METCASH LIMITED
ABN 32 112 073 480
and its Controlled Entities
For the year ended 30 April 2013
For
per
sona
l use
onl
y

2
For announcement to the market MTS for the year ended 30 April 2013
Extracts from this report for announcement to the market
$Amillion
Revenues from ordinary activities up 3.8% to 13,095.0
Profit from ordinary activities after tax attributable to members up 128.9% to 206.0
Please refer to page 2 for detailed explanation of the results Dividends (distributions)
Amount per
security
Franked amount per
security
Final dividend (Preliminary final report only - item 6.4)
16.5c
16.5c
Previous corresponding period (Preliminary final report - item 6.5)
16.5c
16.5c
Record date for determining entitlements to the dividend,
4 July 2013 (in the case of a trust, distribution)
For
per
sona
l use
onl
y

3
Explanatory Note on Results
Underlying earnings before interest, tax and amortisation for the year is up 2.0% on the prior year to $460.4m and underlying profit after tax increased by 6.9% to $280.7m. Underlying earnings per share was down 4.4% reflecting the dilutive effect of the $368.2m equity raising (11.6% increase in weighted average shares on issue). Net profit for the period was up 128.9% to $206.0m with earnings per share calculated on the same basis up 105.1%.
Year ended 30 April 2013
Results EPS Equivalent Note 2013 2012 Change 2013 2012 Change
$’m $’m % cps cps %
Sale of goods 12,976.6 12,501.1 3.8%
Rental income 110.7 98.5 12.4%
Interest income 7.7 12.7 (39.4%)
Total Revenue 13,095.0 12,612.3 3.8%
Earnings before interest, tax and amortisation (EBITA) 460.4 451.2 2.0%
Net finance costs (61.6) (67.6) (8.9%)
Profit before tax and amortisation 398.8 383.6 4.0%
Income tax expense (115.0) (112.9) 1.9%
Non controlling interest (3.1) (8.2) (62.2%)
Underlying profit after tax 1 280.7 262.5 6.9% 32.6 34.1 (4.4%)
Amortisation of customer relationships (12.6) (9.7) 29.9%
Significant items:
ACCC cost recovery 2 3.5 -
ABG/ATAP acquisition costs 2 (4.6) -
Prior year significant items 2 - (176.7)
Income tax effect on significant items (1.1) 41.1
Reported profit after tax from continuing operations 265.9 117.2 126.9% 30.9 15.2 103.3%
Loss after tax from discontinued operations 3 (59.9) (27.2)
Net profit for the period 206.0 90.0 128.9% 24.0 11.7 105.1%
Weighted average shares outstanding (millions) 4 859.7 770.4 11.6%
1. Underlying earnings represents reported profit after tax from continuing operations, excluding intangible amortisation and significant items after tax. Underlying earnings per share (EPS) is calculated by dividing underlying earnings by the weighted average shares outstanding during the period. The Directors‟ assessment of the appropriateness of underlying earnings information is provided in the „Operating and Financial Review‟ section of the Directors‟ Report. Underlying earnings and underlying EPS are used for the purposes of providing guidance to shareholders and the market and are calculated on a consistent basis each year.
2. Refer Note 4(vi) of the financial report for more details.
3. Loss after tax for discontinued operations relates to the Franklins retail business. Refer to Note 31 of the financial report for more details
4. In July 2012, the Group raised $368.2 million after transaction costs through a fully underwritten institutional placement of 92.9 million shares and a placement of 16.5 million shares to existing shareholders. Refer item 9.4 for more details.
For
per
sona
l use
onl
y

4
Earnings per security (EPS) 1. Details of basic and diluted EPS reported separately in accordance with AASB 133 Earnings Per Share are as follows.
MTS
Basic Earnings per share
23.96 Cents
Diluted Earnings per share
23.87 Cents
Earnings used in Basic and Diluted earnings per share =
205,968,431
· Weighted average number of ordinary shares (used in Basic EPS)
859,742,607
· There have been no changes to ordinary shares since the reporting date
· Weighted average number of ordinary shares (used in diluted EPS) =
(859,742,607 weighted average ordinary shares + 3,001,697 potential ordinary shares).
862,744,304
· Weighted average number of converted, lapsed or cancelled potential ordinary shares included in the calculation of diluted EPS = 103,018
· 13,395,496 employee options with an exercise price of $4.2672 are considered non-dilutive and excluded from potential ordinary shares. There have been no issues of potential ordinary shares after the reporting date.
Previous
NTA backing
Current period
corresponding period
2. Net tangible asset backing per ordinary security (cents)
(9.52) (28.11)
Discontinuing Operations
(Entities must report a description of any significant activities or events relating to discontinuing operations or, the details of discontinuing operations they have disclosed in their accounts).
3. Discontinuing Operations On 30 September 2011, being the date of acquisition of the Franklins Group, Metcash announced its intention to dispose of
Franklins corporate retail stores to independent retailers. These retail operations, along with a surplus property development joint venture, were classified as discontinued operations. Accordingly, the inventory, property, plant and equipment, software intangibles and goodwill associated with the 80 corporate retail stores and the loans and equity accounted investment in the property joint venture were classified as disposal group assets. Metcash has, either through sale or closure, disposed of 70 of the 80 stores and believes that it is highly probable that the remaining 10 stores will be disposed of within 12 months of the reporting date. Otherwise, the wholesale operations of the Franklins Group have been classified as continuing operations within the Food and Grocery segment.
Control gained over entities having material effect
4.1 Name of entity (or group of entities) Refer to Note 29
4.2 Date of the gain or loss of control Refer to Note 29
4.3 Consolidated profit (loss) from ordinary activities and extraordinary items after tax of the controlled entity (or group of entities) since the date in the current period on which control was acquired (if material)
Refer to Note 29
For
per
sona
l use
onl
y
5
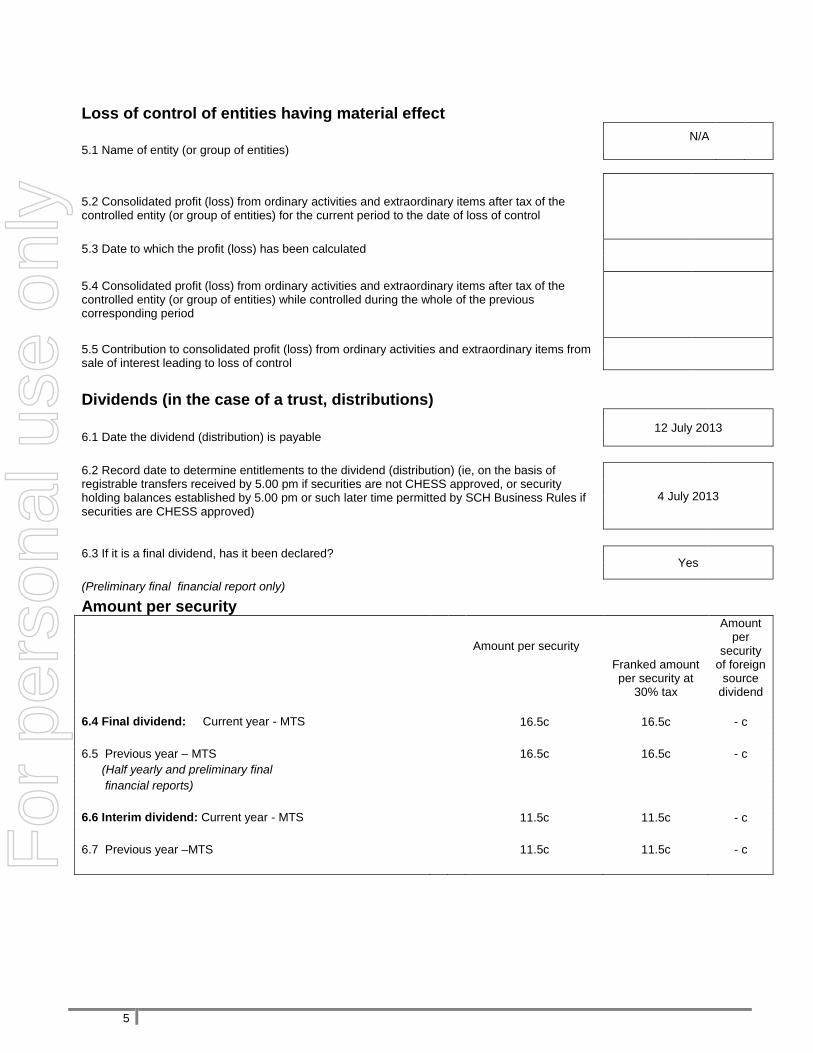
Loss of control of entities having material effect
N/A
5.1 Name of entity (or group of entities)
5.2 Consolidated profit (loss) from ordinary activities and extraordinary items after tax of the controlled entity (or group of entities) for the current period to the date of loss of control
5.3 Date to which the profit (loss) has been calculated
5.4 Consolidated profit (loss) from ordinary activities and extraordinary items after tax of the controlled entity (or group of entities) while controlled during the whole of the previous corresponding period
5.5 Contribution to consolidated profit (loss) from ordinary activities and extraordinary items from sale of interest leading to loss of control
Dividends (in the case of a trust, distributions)
12 July 2013
6.1 Date the dividend (distribution) is payable
6.2 Record date to determine entitlements to the dividend (distribution) (ie, on the basis of registrable transfers received by 5.00 pm if securities are not CHESS approved, or security holding balances established by 5.00 pm or such later time permitted by SCH Business Rules if securities are CHESS approved)
4 July 2013
6.3 If it is a final dividend, has it been declared?
Yes
(Preliminary final financial report only)
Amount per security
Amount per
security of foreign
source dividend
Amount per security
Franked amount per security at
30% tax
6.4 Final dividend: Current year - MTS
16.5c 16.5c - c
6.5 Previous year – MTS
16.5c 16.5c - c
(Half yearly and preliminary final
financial reports)
6.6 Interim dividend: Current year - MTS
11.5c 11.5c - c
6.7 Previous year –MTS
11.5c 11.5c - c
For
per
sona
l use
onl
y

6
Total dividend (distribution) per security (interim plus final) (Preliminary final report only)
Current Year
Previous Year
6.8 Ordinary securities
28.0c 28.0c
6.9 Preference securities
- -
The dividend or distribution plans shown below are in operation.
DRP suspended 8 February 2007 per shareholder mail out.
The last date(s) for receipt of election notices for the dividend or
distribution plans
Any other disclosures in relation to dividends (distributions). (For half yearly reports, provide details in accordance with AASB 134 Interim Financial Reporting)
None.
For
per
sona
l use
onl
y

7
Details of aggregate share of profits (losses) of associates and joint venture entities
Previous
Current period
corresponding period
Group's share of associates' and joint venture entities': $Amillion $Amillion
7.1 Profit (loss) from ordinary activities before tax 4.9 0.6
7.2 Income tax on ordinary activities (1.5) (0.3)
7.3 Profit (loss) from ordinary activities after tax 3.4 0.3
7.4 Extraordinary items net of tax - -
7.5 Net profit (loss) 3.4 0.3
- -
7.6 Adjustments
7.7 Share of net profit (loss) of associates and joint venture entities 3.4 0.3
For
per
sona
l use
onl
y
8
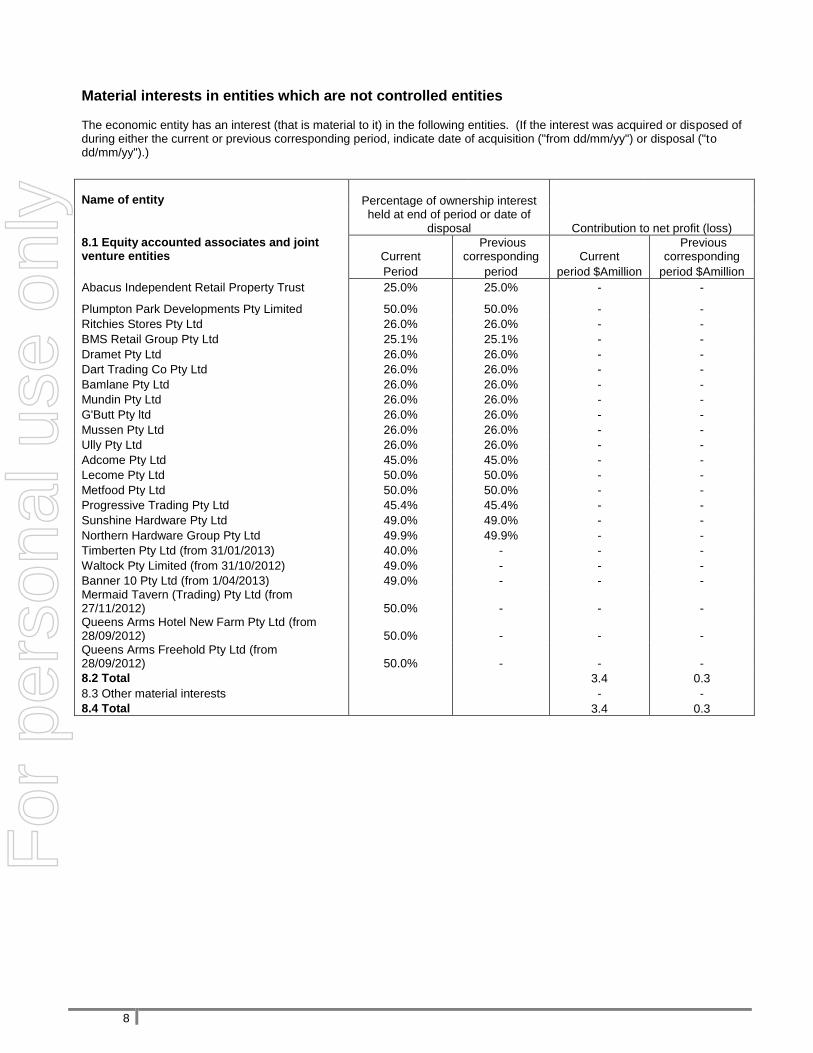
Material interests in entities which are not controlled entities
The economic entity has an interest (that is material to it) in the following entities. (If the interest was acquired or disposed of during either the current or previous corresponding period, indicate date of acquisition ("from dd/mm/yy") or disposal ("to dd/mm/yy").)
Name of entity Percentage of ownership interest
held at end of period or date of disposal
Contribution to net profit (loss)
8.1 Equity accounted associates and joint venture entities Current
Previous corresponding Current
Previous corresponding
Period period period $Amillion period $Amillion
Abacus Independent Retail Property Trust 25.0% 25.0% - -
Plumpton Park Developments Pty Limited 50.0% 50.0% - -
Ritchies Stores Pty Ltd 26.0% 26.0% - -
BMS Retail Group Pty Ltd 25.1% 25.1% - -
Dramet Pty Ltd 26.0% 26.0% - -
Dart Trading Co Pty Ltd 26.0% 26.0% - -
Bamlane Pty Ltd 26.0% 26.0% - -
Mundin Pty Ltd 26.0% 26.0% - -
G'Butt Pty ltd 26.0% 26.0% - -
Mussen Pty Ltd 26.0% 26.0% - -
Ully Pty Ltd 26.0% 26.0% - -
Adcome Pty Ltd 45.0% 45.0% - -
Lecome Pty Ltd 50.0% 50.0% - -
Metfood Pty Ltd 50.0% 50.0% - -
Progressive Trading Pty Ltd 45.4% 45.4% - -
Sunshine Hardware Pty Ltd 49.0% 49.0% - -
Northern Hardware Group Pty Ltd 49.9% 49.9% - -
Timberten Pty Ltd (from 31/01/2013) 40.0% - - -
Waltock Pty Limited (from 31/10/2012) 49.0% - - -
Banner 10 Pty Ltd (from 1/04/2013) 49.0% - - - Mermaid Tavern (Trading) Pty Ltd (from 27/11/2012) 50.0% - - - Queens Arms Hotel New Farm Pty Ltd (from 28/09/2012) 50.0% - - - Queens Arms Freehold Pty Ltd (from 28/09/2012) 50.0% - - -
8.2 Total
3.4 0.3
8.3 Other material interests
- -
8.4 Total
3.4 0.3
For
per
sona
l use
onl
y

9
Issued and quoted securities at end of current period – Metcash Limited (MTS)
(Description includes rate of interest and any redemption or conversion rights together with prices and dates.) Category of securities
Issue price per
security (cents)
Amount paid up per security
(cents)
Total number Number quoted
9.1 Preference securities (description) - - - -
9.2 Changes during current period (a) Increases through issues - - - -
(b) Decreases through returns of capital, - - - -
buybacks, redemptions 9.3 Ordinary securities 880,704,786 880,704,786 - -
9.4 Changes during current period
(a) Increases through issue of shares (i) Institutional placement (ii) Share placement
92,857,143 92,857,143 350.0 350.0 16,501,779 16,501,779 303.0 303.0
(b) Increases through conversion of employee options
- - - -
(c) Decreases through returns of capital, buybacks
- - - -
9.5 Convertible debt securities) (description and conversion factor) - - - -
For
per
sona
l use
onl
y

10
9.6 Changes during current period
(a) Increase through issues
9.7 Options (description and conversion factor)
Expiry date
Total number Exercise price (cents)
(if any)
13,395,496 426.7 7/02/2014
1,285,000 0.0 30/06/2013
1,397,301 0.0 30/06/2014
1,806,964 0.0 7/09/2015
9.8 Issued during current period 1,806,964 0.0 7/09/2015
Reinstated 500,000 426.7 7/02/2014
- - -
9.9 Exercised during current period - - -
- - -
9.10 Expired/cancelled during current period 42,749 0.0 30/06/2013
60,269 0.0 30/06/2014
2,466,489 426.7 7/02/2014
9.12 Debentures (description) (description) -
9.13 Changes during current period
(a) Increases through issues - - (b) Decreases through securities matured, converted
- -
9.14 Unsecured notes (description) (description) -
9.15 Changes during current period
(a) Increases through issues - -
(b) Decreases through securities matured, converted. - -
For
per
sona
l use
onl
y

11
Compliance statement
1. This report has been prepared in accordance with AASB Standards, other AASB authoritative pronouncements and Urgent Issues Group Consensus Views or other standards acceptable to ASX.
Identify other standards used
2. This report, and the accounts upon which the report is based (if separate), use the same accounting policies.
3. This report does give a true and fair view of the matters disclosed.
4. This report is based on accounts to which one of the following applies. (Tick one)
√
The accounts have been audited.
The accounts have been subject to review.
The accounts are in the process of being audited or subject to review.
The accounts have not yet been audited or reviewed.
5. If the audit report or review by the auditor is not attached, details of any qualifications are attached. (Preliminary Final only - the audit report or review by the auditor must be attached to this report if this report is to satisfy the requirements of the Corporations Act.)
6. The entity has a formally constituted audit committee.
Sign here: .................................................................................. Date: 24 June 2013
(Secretary)
Print name: G Watson
(Secretary)
For
per
sona
l use
onl
y

This page is intentionally left blank.
For
per
sona
l use
onl
y
Financial Report
METCASH LIMITED
ABN 32 112 073 480
and its Controlled Entities
For the year ended 30 April 2013
For
per
sona
l use
onl
y

METCASH FINANCIAL REPORT 2013
CONTENTS
Year ended 30 April 2013
Directors‟ Report 1 Statement of Comprehensive Income 37 Statement of Financial Position 38 Statement of Changes in Equity 39 Statement of Cash Flows 40 Notes to the Financial Statements 41 Directors‟ Declaration 102 Auditor‟s Independence Declaration 103 Independent Auditor‟s Report 104
For
per
sona
l use
onl
y
METCASH FINANCIAL REPORT 2013
DIRECTORS’ REPORT
Year ended 30 April 2013
1
Your Directors submit their report of Metcash Limited (the Company) and its controlled entities (the Group) for the year ended 30 April 2013.
DIRECTORS The names and details of the Company‟s Directors in office during the financial year and up to the date of this report are as follows: Peter L Barnes (Chairman) Andrew Reitzer (CEO)* Ian R Morrice (appointed 12 June 2012)* Patrick N J Allaway (appointed 7 November 2012) Fiona E Balfour Michael R Butler Neil D Hamilton Edwin M Jankelowitz Richard A Longes (retired 30 August 2012) V Dudley Rubin * Mr Reitzer will retire as CEO on 30 June 2013 and cease employment with Metcash on 30 September 2013. Mr Morrice was appointed as CEO to replace Mr Reitzer with effect from 30 June 2013.
Directors were in office for this entire period unless otherwise stated.
OPERATING AND FINANCIAL REVIEW The Board presents the 2013 Operating and Financial Review, which has been designed to provide shareholders with a clear and concise overview of Metcash‟s operations, financial position, business strategies and prospects. The review also provides contextual information, including the impact of key events that have occurred during 2013 and material business risks faced by the business so that shareholders can make an informed assessment of the results and prospects of the Group. The review complements the financial report and has been prepared in accordance with the recently released guidance set out in RG247. 1. METCASH’S OPERATIONS
Our Business Model (Incorporating Corporate Information)
Metcash‟s core business strategy is to be the „champion of the independent retailer‟. As a dedicated wholesale distribution, merchandising and marketing company, Metcash provides independent retailers with the means to compete effectively and ultimately present a compelling proposition for the end consumer. In this way, Metcash‟s success is inextricably linked to the success of our independent retailers. Our key strengths include our people, purchasing power, world class logistics systems and extensive merchandising, marketing, retail development and retail operational support capabilities. Metcash deploys these key competencies across our three business „pillars‟, which span the food & grocery, liquor, hardware & automotive sectors across Australia and a smaller liquor business in New Zealand. These divisions supply $13 billion worth of goods annually to a number of leading retail brands, including IGA, Cellarbrations, Bottle-O, Mitre 10 and Autobarn/Autopro. Metcash competes against the vertically integrated retail chains and typically operates as the „third-force‟ within these sectors. The food & grocery pillar is our largest division, representing 70% of total sales, 82% of segment EBITA, and services more than 2,500 grocery stores of which approximately 1,450 are branded IGA. In addition, this pillar services approximately 57,000 convenience customers whilst the liquor division services over 15,000 pubs, clubs and bottle shops, the Mitre 10 network supplies around 825 outlets and ABG services over 240 automotive stores. Metcash operates major distribution centres in all of the mainland states of Australia that predominantly service the food & grocery and liquor divisions, including our new „mega DC‟ in Huntingwood, NSW. These are complemented by a number of smaller warehouses and our Campbells branch network. Metcash employs just over 6,000 staff across the Group. Wholesale sales volumes are the key driver of profitability. Metcash targets organic growth in its sales by assisting retailers to organically grow their sales to consumers. It also aims to increase its „teamwork score‟, being the proportion of total products purchased by an independent retailer that are sourced from Metcash, by working with retailer‟s to ensure the best range of products are carried in Metcash warehouses. In addition, Metcash works closely with retailers to find and develop store growth opportunities whether through expansion of existing footprints or building new stores. Across the Group, growth has also been delivered through acquisition and expansion into new sectors, including the hardware and automotive sectors.
For
per
sona
l use
onl
y

METCASH FINANCIAL REPORT 2013
DIRECTORS’ REPORT
Year ended 30 April 2013
2
Wholesale margins are driven by consumer product appeal, price inflation/deflation, promotional activities and the level of supplier support through volumetric and other rebates. Profitability is also highly dependent on minimising our „cost of doing business‟ (CODB), which comprises the variable and fixed costs of operating the distribution centres and the administrative support functions. Because some of these costs are fixed, Metcash can „leverage‟ its profitability through volume growth. Profitability is also driven by minimising the working capital deployed in the business to reduce funding costs and by ensuring that growth is achieved through solid returns from capital investments. Whilst Metcash operates in a highly competitive environment and wholesale profit margins are thin, the Group generates significant operating cashflows, which are reinvested back into the business to fuel future growth and returned to shareholders through fully franked dividends. 2013 Operating Result Summary
Earnings per share (EPS)
equivalent
Summary Results & Underlying Earnings Reconciliation (Unaudited)
2013 $’m
2012 $'m
2013 cps
2012 cps
Revenue 13,095.0 12,612.3
Segment result (Note 3) 461.2 453.8
Share based payments and other unallocated amounts (Note 3) (0.8) (2.6)
Underlying EBITA 460.4 451.2
Net finance costs (Note 4) (61.6) (67.6)
Underlying profit before tax 398.8 383.6
Tax expense on underlying profit (115.0) (112.9)
Non controlling interests (3.1) (8.2)
Underlying earnings (i) 280.7 262.5 32.6 34.1
Amortisation of customer relationships (Note 4(v)) (12.6) (9.7)
Significant items expense (Note 4(vi)) (1.1) (176.7)
Tax (expense)/benefit on significant items (1.1) 41.1
Net profit for the period from continuing operations attributable to equity holders of the parent 265.9 117.2 30.9
15.2
Net loss after tax from discontinued operations attributable to equity holders of the parent (59.9) (27.2)
Net profit for the period 206.0 90.0 24.0 11.7 (i) Underlying earnings represents reported profit after tax from continuing operations attributable to equity holders of the parent, excluding
amortisation of customer relationships and significant items after tax, as reconciled in the table above. Underlying earnings per share (EPS) is calculated by dividing underlying earnings by the weighted average shares outstanding during the period. The Directors have provided underlying earnings information after careful consideration of the requirements and guidelines contained in ASIC Regulatory Guide 230 (Disclosing non-IFRS financial information). Underlying earnings information, including this reconciliation to net profit, has been provided in order to meet the demands from users of the financial reports for information to better understand aspects of the Group‟s performance. The Directors believe that underlying earnings is the most appropriate measure of the maintainable earnings of the Group and thereby best reflects the core drivers and ongoing influences upon those earnings. For this reason, the impact of significant items is excluded from the measurement of underlying earnings and specific information on these items is provided under Note 4 of these financial statements. Underlying earnings and underlying EPS are used for the purposes of providing guidance to shareholders and the market and are calculated on a consistent basis each year. Underlying earnings and underlying EPS are also used as the basis for short and long term incentive scheme rewards as detailed in the remuneration report.
The Group generated $13.1 billion of revenue which was up 3.8% against the prior year. Underlying profit for the 2013 financial year was $280.7m, up 6.9% on the 2012 result. The trading environment during 2013 was difficult and impacted participants across the Australian retail sector. In particular, the effects of on-going deflation, rising utility costs, a highly value driven consumer and a persistent marketing war between the two large grocery chains impacted profit levels. Profit growth in the liquor division and from acquisitions was partly offset by a weaker result from the food & grocery division. Whilst underlying earnings increased, the equivalent underlying EPS result decreased 4.4% on the prior year largely as a result of the dilutive effect of the 110m new shares issued under the $375m equity raising in June/July 2012. Most of the investments funded by the equity raising occurred later in the year and accordingly did not deliver a full years‟ worth of earnings during 2013. The equity funds have now been either fully deployed or committed and, aside from the $75m Project Mustang investment (detailed below), these investments are expected to be EPS accretive in fiscal 2014.
For
per
sona
l use
onl
y
METCASH FINANCIAL REPORT 2013
DIRECTORS’ REPORT
Year ended 30 April 2013
3
During 2013 the Group incurred $1.1m of significant items expense, which was all acquisition related. The Franklins corporate stores recorded a retail loss of $59.9m (2012: $27.2m) after tax for the year and this result has been recorded within discontinued operations. During the fiscal year Metcash disposed of, either by way of sale or closure, 70 of the 80 Franklins corporate stores. Plans are in place to dispose or close the remaining 10 stores, which are expected to significantly reduce the discontinued operations result in 2014. The reported net profit for the year was up by 129% to $206.0m reflecting the absence of restructure activities undertaken in fiscal 2012. Importantly, cash generated from operating activities was $299.8m, up 5.5% on prior year. These cash flows were applied towards funding business activities and providing a fully franked dividend return to our shareholders. The Board is pleased to announce a final fully franked dividend of 16.5 cents per share (total 2013 dividends 28.0 cents), which is consistent with the prior year. Further details in respect of these results are provided below. Key Developments (Incorporating Significant Changes in the State of Affairs)
During June/July 2012, Metcash raised net proceeds of $368.2m in share capital through a fully underwritten institutional placement and a retail share placement to existing shareholders to fund growth opportunities. The majority of this funding was subsequently deployed during 2013 through the following acquisitions and investments totalling $216.3m:
On 31 July 2012 Metcash acquired the remaining 49.9% equity interest in the Mitre 10 Group for $47.9m, taking our ownership interest to 100%
During fiscal 2013, the Mitre 10 group acquired four hardware retail subsidiaries and invested in three associates at a combined cost of $55.2m. Mitre 10 now has strategic „joint venture‟ investments in each state, which have strengthened the network and positioned it for further growth
Metcash acquired a 75.1% controlling interest in the Automotive Brands group (ABG) for $54.7m on 1 July 2012, which firmly positions Metcash in the automotive parts aftermarket sector. ABG is the 3
rd largest in the sector and
manages the Autobarn franchise and Autopro dealership groups
The liquor division invested $41.6m in new joint venture interests in three hotels in Queensland, with associated detached bottle shops. It also assisted new retailers into new bottle stores with a retail development program similar to that operated in food & grocery and signed a 15-year supply contract with the Liquor Marketing Group (LMG) in October 2012, which is expected to generate approximately $600m in additional sales per annum
Metcash announced Project Mustang, which is a $75m warehouse automation project centred on the new Huntingwood distribution facility. The capital expenditure represents the latest European robotic technology that will significantly automate the goods receipt, order selection, pallet assembly and distribution process for both the food & grocery and liquor divisions in NSW. Initial capital expenditure of $16.9m was outlaid during 2013, with the project ultimately expected to „go live‟ during fiscal 2015
Immediately subsequent to fiscal 2013, ABG acquired 100% of the Australian Truck and Auto Parts group for approximately $84m including acquisition costs and Mitre 10 invested in two more trade hardware groups. These investments, together with the balance of $58.1m in Project Mustang capex, represent the full deployment of the abovementioned equity raising. Segment Results
Food & grocery division sales decreased by 2.3% to $9.1 billion, largely due to the closure of 11 Campbells branches, the impact of WA deregulation as well as the exit of some stores in WA and from the closure of Cornetts and Walters retail stores as foreshadowed last year. National market share was down marginally reflecting these impacts. The trading conditions remain tough, with continued deflation, elevated promotional intensity and aggressive marketing campaigns being run by the major self supply chains. A full years worth of sales to the Franklins stores (seven months in prior period) assisted the result. The division invested an additional $8.3m in marketing programs including the National Locked Down Low Price campaign and a major relaunch of Supa IGA in NSW to support the Franklins store conversions. Food & grocery EBITA results were down 5.0% to $377.9m, with the group experiencing negative leverage from the effects of continued deflation with the elevated promotional volumes also causing supply chain peak inefficiencies. These effects, along with the additional $8.3m in marketing spend, were partly offset by structural cost savings from the Campbells branch closures and warehouse efficiency improvements like the KNAPP mini loader at Huntingwood that both improved the cost of doing business.
For
per
sona
l use
onl
y
METCASH FINANCIAL REPORT 2013
DIRECTORS’ REPORT
Year ended 30 April 2013
4
Liquor division sales grew strongly by 24.9% to $2.9 billion, partly due to a seven month contribution from the new LMG supply contract, but also from strong organic volume growth, particularly across its IBA retail brands. Competitive pricing and improved store execution are delivering strong sales resulting in the division increasing its market share. Further growth was achieved in Queensland through the establishment of three hotel „joint ventures‟ (Envy, Queens Arms & Mermaid Tavern). Liquor division EBITA results increased by 35% to $47.1m reflecting the increased sales volumes as well as leveraging a reduction in CODB% through warehouse efficiency improvements. Hardware & Automotive sales increased by 12.6% to $938.4m, largely due to the acquisition of ABG which delivered $83.5m of sales. Divisional EBITA grew by 70.8% to $36.2m including the ABG contribution and solid growth in Mitre 10 earnings. Mitre 10 trade sales were relatively flat year on year, reflecting the depressed construction market. Sales were supported by a number of retail stores converting to Mitre 10 from competitor brands and network strengthening through the establishment of seven new retail joint ventures. Mitre 10 continued to raise brand awareness by presenting a consistent brand (retail store „blue & white‟ „paint ups‟) and continued association with Channel 9‟s „The Block‟ series. The Natbuild alliance commenced, which going forward will improve network trade buying power. The new ABG business is performing in line with expectations and delivered a solid EBITA contribution in line with acquisition expectations. The Autobarn and Autopro brands are considered leaders in customer service and product knowledge. The business has begun to leverage Metcash‟s competencies in supply chain, merchandising and marketing and is positioned for further growth. Group Results – Other Key Expenses
Metcash reduced its net finance costs by 8.9% to $61.6m. The improved result was achieved notwithstanding an additional $7.0m in non-cash expense arising from the unwinding of net present value discounts of long-lived rental subsidy and other provisions. The savings were mainly achieved due to lower debt levels, in part from equity raising funds but also from a significant reduction in working capital. The reduction in interest rates also contributed to the solid result. Tax expense on underlying profit of $115.0m represented an effective tax rate of 28.8%, down 0.6% mostly due to prior period refunds arising from the application of capital tax losses and research & development claims. Tax expense of $90.1m on fiscal 2013 reported profit reflected an effective tax rate of 30.4%, which is broadly consistent with the 30% Australian corporate tax rate. As noted above in the summary, the 2013 Franklins retail store discontinued loss was $59.9m after tax. The store sale program accelerated during the second half of fiscal 2013. By year end, 46 stores had been sold to independent retailers and 24 stores had been closed (total 70). By the end of June 2013, 74 stores are expected to have been sold or closed and the remaining 6 stores are expected to be sold or closed by October 2013 (including 4 stores previously closed now expected to re-open). By the completion of the process, including the 10 franchise stores, a total of 67 stores will have been sold or are expected to be sold or converted to IGA stores and 23 stores will have closed or are expected to close. The loss also included redundancy and other costs associated with the store closures and sale process, along with an additional $10.6m in non-cash expense arising from the unwinding of net present value discounts on rental subsidy provisions. Whilst more stores were closed than originally anticipated, the overall Franklins acquisition has delivered a strong strategic footprint in NSW, introduced new retailers to the business and increased operational leverage through the Huntingwood distribution centre.
For
per
sona
l use
onl
y

METCASH FINANCIAL REPORT 2013
DIRECTORS’ REPORT
Year ended 30 April 2013
5
2. Financial Position and Cashflows
Summary Financial Position (Unaudited) Note 2013 $’m
2012 $'m
Net working capital 1 236.6 339.3
Property, plant & equipment, associate investments and intangible assets 2 2,078.1 1,841.1
Total funds employed 2,314.7 2,180.4
Net debt 3 (758.6) (940.3)
Net tax balances 4 68.1 95.0
Net assets/equity 1,624.2 1,335.1
1. Net working capital broadly comprises the „trading‟ components of the balance sheet. Working capital includes trade and other
receivables, inventories, disposal groups and assets held for sale, prepayments, derivative financial instruments (assets and liabilities), trade and other payables, provisions and other financial liabilities, including the current & non-current components of these items
2. These non-current assets broadly represent the income earning components of the balance sheet. They include property, plant & equipment, investments in associates, other financial assets, intangible assets and goodwill
3. Net debt reflects the net borrowings position and includes cash and interest bearing loans and borrowings (current & non-current) 4. Net tax balances include income tax receivable or payable and net deferred tax assets
Net working capital
The net working capital position was managed effectively during the year resulting in a 30% reduction on the prior period to $236.6m, which is the lowest level achieved for a number of years. The improved result was delivered despite the expansion of the group through acquisition and featured a $79.8m reduction in inventory through tighter stock control. Additionally, the disposal of Franklins retail stores released a further $68.9m in assets held for sale. Total funds employed
As noted in the key developments section, Metcash invested for growth during 2013 as evidenced by the 6.1% increase in total funds employed. This included a $133.3m increase in intangibles driven by the ABG, Mitre 10 subsidiary and Franklins acquisitions. Metcash invested $20.2m in associates, including the three Mitre 10 joint ventures. Metcash also deployed $86.8m in capital expenditure, including $33.9m in relation to the Huntingwood DC. Net debt
The strong operating cashflow and residual unspent funds from the equity raising were deployed to invest for growth and also reduce debt levels by $181.7m. This facilitated a reduction in net gearing levels to 31.8%, compared to 41.3% in the prior period. Metcash had $733m in available debt facilities at balance date with an appropriate tenure and diversification of funding sources. Part of this headroom was deployed subsequent to year end to fund the $84m ATAP acquisition and two Mitre 10 joint ventures noted below. Net Assets/Equity
Metcash‟s net asset position increased primarily due to the $368.2m equity raising. This was partly offset by the payment of dividends of $245.7m (Final FY12 and Interim FY13), being in excess of FY13 reported profit of $206.0m, as the Board had the confidence to declare dividends based on the strong underlying profit result and cash generated by the group. The equity position also decreased by $47.9m due to the acquisition of the remaining 49.9% non-controlling interest in Mitre 10, taking Metcash‟s ownership interest to 100%. Other Financial Exposures
Contingent liability details are presented in Note 32 of the financial statements. Metcash is currently in dispute with the Australian Tax Office („ATO‟) in relation to the „Action Stores‟ matter and the „Foreign Tax Credit‟ matter. The ATO have issued amended assessments or determinations totalling $72.2m in respect of these matters, against which Metcash has paid $24.4m (recorded as income tax receivable). Metcash is firmly of the view that it has adopted the appropriate treatment and, if necessary, intends to challenge these matters through to the Administrative Appeals Tribunal or Federal Court.
For
per
sona
l use
onl
y

METCASH FINANCIAL REPORT 2013
DIRECTORS’ REPORT
Year ended 30 April 2013
6
Metcash‟s operating lease commitments, which predominantly relate to warehouse and retail stores, are detailed in Note 23 of the financial statements. Part of the 4.9% increase in commitments has been the extension of the Huntingwood DC lease, as well as an increase through acquisitions. In certain situations, Metcash will take the head lease on a retail property and sublet the store to the independent retailer. The acquisition of the Franklins retail stores and the subsequent sale and sublease of these stores has also increased the amount committed. If the head lease rental expense exceeds the sublease rental income and the position is considered onerous, a provision is raised for the difference as set out in Note 19(b). Metcash has a relatively low exposure to interest rate risk and minimal foreign exchange risk. Variable interest rate exposures on core debt are hedged in accordance with the Treasury Policy between a minimum and maximum range (28% hedged at year end). The fixed interest and foreign exchange exposure on the US$225m USPP debt facility is effectively converted via hedges into $210.1m of variable rate funding. Further details are set out in Note 22. Cashflows
Metcash recorded its strongest ever operating cashflow of $299.8m. This result was achieved due to the solid underlying earnings result supplemented by lower tax payments and the improvement in working capital. The investing cashflow of $178.9m correlated to the investment activity described above, whilst the financing cash outflow notably included a reduction in borrowings. 3. Business Strategies and Prospects (Incorporating Likely Developments and Expected Results)
Metcash‟s core strategy will continue to be the „champion of the independent retailer‟ and to support our independent retailers to drive mutually profitable growth. Metcash will also continue to focus on growth through targeted acquisition and investment. The incoming CEO, Ian Morrice has commenced a formal strategic planning process from which a number of initiatives will be developed and communicated at 1H 14. While the plan will continue to focus on strategies to champion sustainable independent businesses, it will also look to identify and pursue new growth opportunities in existing and complementary sectors for each Metcash division. Initial priorities for Mr Morrice will include reviewing the Food & Grocery operations to respond to the ongoing deflationary market conditions; developing strategies to better address the online and digital marketing requirements of each division; driving continued supply chain evolution through the new automated solutions being built for the Huntingwood DC, and optimising recent acquisitions and supply contracts. Sales Volumes
Deflation and its deleveraging impact together with the intensely competitive trading environment remain the most challenging and significant business risks. Metcash‟s wholesale sales volumes and therefore its profitability are directly related to the level of retail sales achieved by our independent retailer customers. Metcash may also face financial exposure to these retailers through trade receivables, loans and lease commitments in the event of customer default. In the food & grocery business, the strategy is to support the independent IGA retailers to be competitive and to help them differentiate themselves from the chains in four key areas: fresh offer („200% guarantee‟), range („favourite brands‟), value („locked down low prices‟) and community (e.g. Community Chest) in order to present a unique consumer proposition. Food & grocery plans to drive organic growth principally through new store development, conversions, extensions and refurbishment activities. Further sales volume growth is expected through the „buyback‟ program, whereby poorer performing IGA stores are placed into the hands of more experienced retailers. Food & grocery also plans to grow sales by securing new customer contracts, with recent examples including the contract to supply Supabarn in NSW/ACT and also to supply Spotless in WA/Queensland. Food & grocery is also trialling new store formats, including Value Depot (convenience) and Harvest Market (fresh). Brand presence will be strengthened through targeted marketing and merchandising strategies, including integrated campaigns featuring comedian Ahn Do to promote the IGA brand. The liquor division plans to step up on its recent organic growth by continuing to refine execution levels and the retail offer at store level, supplemented by supplier support. The strategy to lift wine sales through the network will continue. The division is also trialling new larger format stores under the Cellarbrations and Bottle-O banners. The liquor division will continue to review opportunities to grow in key markets through its hotel strategy.
For
per
sona
l use
onl
y

METCASH FINANCIAL REPORT 2013
DIRECTORS’ REPORT
Year ended 30 April 2013
7
The hardware & automotive division plans to further strengthen the network through its joint venture activities in Mitre 10 and to entice retailers to convert to the Mitre 10 brand. The Mitre 10 trade business has been strengthened through the Natbuild alliance, benefitting Mitre 10 store owners through lower costs. Mitre 10 will continue to build brand presence through its association with Channel 9‟s „The Block‟ television series. The automotive business will target organic growth in the significant $5.6 billion automotive aftermarket retail parts sector through increased ranging and customer service by leveraging existing support structures within the Metcash group. Margins & the ‘Cost Of Doing Business’ (CODB)
The level of sales price deflation and cost inflation evident in the grocery market, together with the increased propensity of the consumer to purchase goods when on promotion continue to be material business risks. Sales deflation negatively impacts profit margins, largely because margins are earned as a percentage of a „deflated‟ wholesale sales revenue. Sales deflation and promotional activity will be reviewed in the upcoming strategic review. Cost inflation, including rising transport, utility and other costs, has a direct impact on the CODB. In the near term, Metcash plans to deliver cost synergies by integrating the recently acquired businesses with Metcash. CODB improvements are also expected through IT systems (completion of the national rollout of „Power Enterprise‟ transaction system and e-commerce solutions), along with „business-as-usual‟ initiatives to drive warehouse and support costs down. In the longer term, Project Mustang (warehouse automation - noted above) is expected to deliver further benefits. Discontinued Operations – Franklins Retail Stores
Metcash‟s strategy has been to sell the 80 Franklins stores to independent retailers and this program of sales has recently accelerated. By the end of June 2013, 74 stores are expected to have been sold or closed and the remaining 6 stores are expected to be sold or closed by October 2013, at which point the retail trading losses will cease. The Franklins Rockdale head office has already been wound down and will be closed in the first quarter. Expansion
Subsequent to year end, Metcash acquired 100% of the ATAP group through ABG for $84.0m as detailed in Note 33. The acquisition represents the next stage in Metcash‟s growth strategy in the automotive aftermarket sector. The acquisition provides greater access to 2,500 independents and further opportunity for increased ranging and service levels across the ABG and ATAP businesses. Metcash will continue to identify further acquisition or investment-led growth opportunities for its various divisions as part of the Group‟s long-term aspirations to grow shareholder value. End of the Operating and Financial Review.
SHAREHOLDER RETURNS YEAR ENDED 30 APRIL
2013 2012 2011 2010 2009
Basic earnings per share (cents) 24.0 11.7 31.5 29.7 26.5
Earnings per share from continuing operations before significant items (cents) 32.6 34.1 33.4 32.0 29.5
Dividend declared per share (cents) 28.0 28.0 27.0 26.0 24.0
Dividend payout ratio on earnings per share (%) (i) 85.9 82.1 80.8 83.3 83.6
Return on equity (%) (ii) 16.6 18.9 17.2 17.3 17.2
Share price at balance date ($) 4.10 3.98 4.08 4.15 4.12
Dividend yield (%) (i) 6.8 7.0 6.6 5.8 5.0
(i) Calculated using underlying earnings per share as detailed in the operating and financial review (ii) Calculated using underlying earnings as detailed in the operating and financial review.
EARNINGS PER SHARE
2013
CENTS
Basic earnings per share 23.96
Diluted earnings per share 23.87
For
per
sona
l use
onl
y

METCASH FINANCIAL REPORT 2013
DIRECTORS’ REPORT
Year ended 30 April 2013
8
DIVIDENDS ON ORDINARY SHARES
CENTS $’m
Final dividend for the 2013 year - payable in July 2013 16.5 145.3
Dividends paid during the year:
Interim dividend for the 2013 year - paid in January 2013
11.5 101.3
Final dividend for the 2012 year - paid in July 2012
16.5 142.6
Total dividends paid during the 2013 financial year 28.0 243.9
Total dividends declared in respect of the 2013 financial year 28.0 246.6
SUBSEQUENT EVENTS
Australian Truck & Auto Parts Group On 16 May 2013 Metcash announced the acquisition, through Automotive Brands Group (ABG), of 100% of the Australian Truck & Auto Parts Group (ATAP) for approximately $84.0 million including acquisition costs. The Group assumed control of ATAP on 20 May 2013 being the date of completion. ATAP is a national wholesaler of brake, clutch and under-car products and also includes: ABS, the franchisor of a national chain of 53 retail service and brake/clutch repair centres, with 4 corporate stores and 5 joint venture stores; IBS Auto Solutions, Garmax, Melbourne Clutch & Brake; and Brake Friction Technology. The acquisition will result in a dilution of the non-controlling interests in ABG to reflect the additional equity contribution by Metcash. Refer Note 29(f) of the financial statements for further details. Mitre 10 joint ventures On 6 May 2013, Metcash announced that Mitre 10 had entered into joint ventures with two hardware trade groups – Dahlsens and Capeview Building Supplies. Metcash acquired a 36% interest in the Dahlsens joint venture, which includes 11 stores in the Northern Territory, Western Australia and in Northern Queensland. Metcash acquired an 80% interest in Capeview Building Supplies, which includes 5 stores throughout Victoria, particularly in the Gippsland region. Except as noted above, there are no events that have occurred after the end of the financial year that would materially affect the reported results or would require disclosure in this report.
For
per
sona
l use
onl
y

METCASH FINANCIAL REPORT 2013
DIRECTORS’ REPORT
Year ended 30 April 2013
9
DIRECTORS QUALIFICATIONS AND EXPERIENCE The qualifications and experience of Directors is set out below. Peter L Barnes
B COMMERCE (HONS), MBA Non executive Chairman Member of the Remuneration Committee Date of Appointment to Metcash Limited: 18 April 2005 Peter Barnes is a Director of News Corporation and Chairman of Samuel Smith & Sons Pty Ltd. He also serves as Chairman of the Melbourne Business School. Peter was formerly the Chairman of Ansell Limited and an executive with Phillip Morris International Inc. and held several senior management positions both here in Australia and overseas. Peter was appointed Chairman of Metcash Limited on 2 September 2010 and has been involved with the Metcash business as a director since November 1999. Andrew Reitzer
B COMM, MBL CEO Metcash Group of Companies until 30 June 2013 Date of Appointment to Metcash Limited: 18 April 2005 Andrew Reitzer has 35 years‟ experience in the retail/wholesale industry. Previous positions at Metro Cash and Carry Limited include Group Operations Director, heading operations in Russia and Israel, Marketing Director, IT Director and managing various operating divisions. Ian R Morrice
MBA CEO Metcash Group of Companies with effect from 30 June 2013 Date of Appointment to Metcash Limited: 12 June 2012 Ian Morrice has over three decades of retail experience as Managing Director, Trading Director and Retail Director for some of the UK‟s leading retailers, including Dixons and The Kingfisher Group. Ian was Group CEO and Managing Director of New Zealand‟s Warehouse Group from 2004 to 2011. Ian‟s key areas of expertise include strategy, brand and category development, multi-channel and new store format roll-out, product sourcing and supply chain innovation. Patrick N J Allaway
BA/LLB Non executive Director Member of the Audit Risk and Compliance Committee Date of Appointment to Metcash Limited: 7 November 2012 Patrick Allaway is a broad based business person with extensive experience in financial services. His career in investment banking has seen him hold positions with Swiss Bank Corporation initially in Zurich and then London; and also with Citibank in New York, Sydney and London. Over the past eight years Patrick has been the Chairman and co-founder of a privately owned boutique corporate advisory and funds management business, Saltbush Capital Markets. Patrick was also a Non executive Director of Macquarie Goodman Ltd until 2006 and the Interim Chairman of its Audit Committee. Patrick‟s key areas of expertise include strategy, development, mergers & acquisitions and capital management. Patrick has a Bachelor of Arts/Law from Sydney University and is a Director of the Sydney University Football Club Foundation Ltd.
For
per
sona
l use
onl
y

METCASH FINANCIAL REPORT 2013
DIRECTORS’ REPORT
Year ended 30 April 2013
10
Fiona E Balfour
BA (Hons), MBA, GRAD DIP INFORMATION MANAGEMENT, FAICD Non executive Director Member of the Remuneration Committee Date of Appointment to Metcash Limited: 16 November 2010 Fiona Balfour is an independent non-executive director of Salmat Limited, TAL Australia Limited and Airservices Australia, a Councillor of Knox Grammar School and Chief Executive Women; a Fellow of the AICD and Monash University (2010) and was awarded the National Pearcey Medal in 2006. Fiona has over thirty years executive experience across Aviation, Telecommunications, Financial Services, Education and not-for-profits. Her professional expertise is in information and communications technology. She has extensive experience in global „customer–facing‟ business solutions across a variety of technologies – including digital channel management. She is a former Director of SITA SC (Geneva) 2001-06 and a former Trustee of the National Breast Cancer Foundation 2007-11. Michael R Butler
B SC, MBA, FAICD Non executive Director Chairman of the Audit Risk and Compliance Committee Date of Appointment to Metcash Limited: 8 February 2007 Michael Butler has extensive experience in investment banking gained as an Executive Director of Bankers Trust‟s Corporate Finance Group and as Executive Vice President of its Private Equity group. He is currently Chairman of AMP Superannuation Limited and N.M. Superannuation Pty Ltd. He was previously a Non executive Director and Chairman of various public and private companies. Neil D Hamilton
LLB Non executive Director Chairman of the Remuneration Committee Date of Appointment to Metcash Limited: 7 February 2008 Neil Hamilton is based in Perth and has over 30 years‟ experience in the legal profession and in business with substantial experience in a number of industries including investment/funds management, insurance, banking and resources. Neil is Chairman of OZ Minerals Ltd and Miclyn Express Offshore Limited. He was appointed Chairman of the Remuneration Committee on 1 September 2010. Edwin M Jankelowitz
B COMM, CA (SA) Non executive Director Date of Appointment to Metcash Limited: 18 April 2005 Edwin Jankelowitz was previously CFO of Metcash and was appointed a Non-executive Director in 2011. After qualifying as a Chartered Accountant he spent 12 years with Adcock Ingram Ltd eventually being promoted to Group Company Secretary and Finance Director. He then consulted in business management and tax before taking a position with Caxton Ltd where he progressed to Finance Director, Managing Director and Chairman. Edwin has spent over 39 years in corporate offices of listed companies and was a member of the Income Tax Special Court in South Africa for 20 years.
For
per
sona
l use
onl
y
METCASH FINANCIAL REPORT 2013
DIRECTORS’ REPORT
Year ended 30 April 2013
11
Richard A Longes
BA, LLB, MBA Non executive Director Date of Appointment to Metcash Limited: 18 April 2005 Date of Retirement from Metcash Limited: 30 August 2012 Richard Longes has been a director of a number of public companies and a member of various government bodies and inquiries for more than 20 years. He is currently Chairman of Austbrokers Holdings Ltd and a Director of Boral Limited and Investec Bank (Australia) Ltd. Richard was formerly a co-founder and principal of the corporate advisory and private equity firm, Wentworth Associates, and prior to that a partner of Freehill Hollingdale & Page, solicitors. V Dudley Rubin
CA (SA), H DIP BDP, MBA Non executive Director Member of the Audit Risk and Compliance Committee Date of Appointment to Metcash Limited: 18 April 2005 Dudley Rubin is a chartered accountant and is a director of various companies trading in Africa. He has 30 years‟ industry experience and has been involved with the Metcash business as a director since May 1998.
COMPANY SECRETARY
Greg Watson
LLM, Dip Law General Counsel and Company Secretary Greg Watson joined Metcash in 2005 as Legal Counsel and was promoted to General Counsel in 2008. He was appointed Company Secretary in 2010. Greg has over 23 years professional and industry experience initially in private legal practice, followed by corporate legal counsel roles with multinational FMCG organisations. Greg is a graduate of the Metcash Executive Leadership Program.
DIRECTORS’ MEETINGS
The number of meetings of Directors (including meetings of committees of Directors) held during the year and the number of meetings attended is as follows:
Directors meetings: Eligible to
attend
Directors meetings: Attended
Remuneration: Eligible to
attend Remuneration:
Attended
Audit Risk and
Compliance: Eligible to
attend
Audit Risk and
Compliance: Attended
Peter L Barnes 12 12 6 6 - -
Andrew Reitzer 12 10 - - - -
Ian R Morrice(i) 11 10 - - 3 3
Patrick N J Allaway(ii) 6 6 - - 3 3
Fiona E Balfour 12 12 6 6 - -
Michael R Butler 12 11 - - 6 6
Neil D Hamilton 12 12 6 6 - -
Edwin M Jankelowitz 12 11 - - - -
Richard A Longes(iii) 4 3 - - 3 3
V Dudley Rubin 12 11 - - 6 6 (i) Mr Morrice was appointed as a Non-executive Director on 12 June 2012 and as an Executive Director on 1 March 2013. (ii) Mr Allaway was appointed as a Non-executive Director on 7 November 2012. (iii) Mr Longes retired as a Non-executive Director on 30 August 2012.
For
per
sona
l use
onl
y

METCASH FINANCIAL REPORT 2013
DIRECTORS’ REPORT
Year ended 30 April 2013
12
COMMITTEE MEMBERSHIP At the date of this report, the Company had an Audit Risk & Compliance Committee and a Remuneration Committee. Members acting on these Board committees for the full year unless otherwise stated were:
AUDIT RISK & COMPLIANCE REMUNERATION
Richard A Longes (Chairman)(i) Neil D Hamilton (Chairman)
Michael R Butler (Chairman) (ii) Fiona E Balfour
Patrick N J Allaway(iii) Peter L Barnes
Ian R Morrice(iv)
V Dudley Rubin (i) Mr Longes retired as chairman of the committee on 26 June 2012 and as a member of the committee on 30 August 2012. (ii) Mr Butler was appointed as chairman of the committee on 26 June 2012. (iii) Mr Allaway was appointed to the committee on 7 November 2012. (iv) Mr Morrice was appointed to the committee on 12 June 2012 and ceased being a member with effect from 1 March 2013.
INTERESTS IN SHARES AND OPTIONS OF THE COMPANY AND RELATED BODIES CORPORATE
As at the date of this report, the Directors held the following shares and options in Metcash Limited:
NUMBER OF
ORDINARY SHARES
NUMBER OF OPTIONS OVER ORDINARY
SHARES
Peter L Barnes 182,034 -
Andrew Reitzer 829,951 -
Ian R Morrice(i) 21,000 -
Patrick N J Allaway(ii) 54,000 -
Fiona E Balfour 29,673 -
Michael R Butler 54,951 -
Neil D Hamilton 20,000 -
Edwin M Jankelowitz 320,000 -
V Dudley Rubin 17,500 - (i) Mr Morrice was appointed as a Non-executive Director on 12 June 2012. (ii) Mr Allaway was appointed as a Non-executive Director on 7 November 2012.
SHARE OPTIONS & PERFORMANCE RIGHTS
Unissued shares As at the date of this report, there were 13,361,853 unissued ordinary shares under option (13,395,496 at the reporting date). As at the date of this report, there were 4,471,452 unissued ordinary shares under performance rights (4,489,265 at the reporting date). Refer to Note 25 of the financial statements for further details of the performance rights and options outstanding.
Shares issued as a result of options and performance rights During or since the end of the financial year, no shares in the Company were issued to employees and executives in respect of the exercise of options or performance rights.
For
per
sona
l use
onl
y

METCASH FINANCIAL REPORT 2013
DIRECTORS’ REPORT
Year ended 30 April 2013
13
INDEMNIFICATION AND INSURANCE OF DIRECTORS AND OFFICERS
(i) The Constitution of the Company permits the grant of an indemnity (to the maximum extent permitted by law) in favour of each Director, the Company Secretary, past Directors and Secretaries, and all past and present Executive Officers. The Company has entered into Deeds of Indemnity and Access with R A Longes, F J Conroy, C P Curran, T A Haggai, R A Allan, J J David, Sir Leo Hielscher, B A Hogan, M Wesslink, J L Jardim (Lou Jardin), C dos Santos and M Jablonski together with all of the current Directors and certain other officers of the Company. This indemnity is against any liability to third parties (other than related Metcash companies), by such officers unless the liability arises out of conduct involving a lack of good faith. The indemnity also includes costs or expenses incurred by an officer in unsuccessfully defending proceedings relating to that person‟s position.
(ii) During the financial year, the Company has paid, or agreed to pay, a premium in respect of a contract of insurance insuring officers (and any persons who are officers in the future) against certain liabilities incurred in that capacity. Disclosure of the total amount of the premiums and the nature of the liabilities in respect of such insurance is prohibited by the contract of insurance.
ROUNDING The amounts contained in this report and in the financial statements have been rounded to the nearest $100,000 (where rounding is applicable) under the option available to the Company under Australian Securities and Investments Commission (ASIC) Class Order 98/0100. The Company is an entity to which the Class Order applies.
For
per
sona
l use
onl
y

METCASH FINANCIAL REPORT 2013
DIRECTORS’ REPORT
Year ended 30 April 2013
14
REMUNERATION REPORT
1. MESSAGE FROM THE CHAIRMAN OF THE REMUNERATION COMMITTEE (UNAUDITED)
The Metcash Limited Remuneration Committee presents the Remuneration Report for the year ended 30 April 2013. The remuneration report outlines the remuneration arrangements for key management personnel („KMP‟) comprising the Group Executives and the Non-Executive directors. Metcash is a marketing and distribution specialist operating in the competitive grocery, liquor, hardware and automotive industries. As “Champion of the Independent Retailer”, Metcash provides the scale necessary to create competitive buying power, together with marketing, distribution, financial expertise and support. Metcash‟s collective relationships with the independent retailers and suppliers compete as the „Third Force‟ in Australia‟s consumer staples market against the vertically integrated chains. Metcash generates wholesale revenue through its distribution and marketing activities, leaving the independent retailer to earn the retail revenue from sales to the end consumer. The nature of these operations therefore requires expertise across distribution and retail and competition for high calibre staff in these areas is intense. Metcash‟s Board is committed to a remuneration framework which ensures that Metcash attracts and retains a high quality Executive team who are appropriately rewarded for achieving financial outcomes for the Company which provide shareholders with reasonable returns. To achieve this, a significant portion of executive remuneration is „at risk‟ and subject to Company performance. The Company‟s remuneration policy and structure for its Group Executives comprises a combination of the following two main components:
a fixed component which is the total base salary and includes compulsory employer superannuation contributions; and
a variable „at risk‟ component which is performance based and comprises a part cash, part share-based short term incentive („STI‟) plan that is linked to both the performance of the Company and individual performance, and a long term incentive („LTI‟) program under which executives, at the discretion of the Board, are offered performance rights which vest if the Company achieves certain hurdles over a three year period.
The combination of fixed and variable „at risk‟ remuneration ensures that Metcash‟s remuneration policies are consistent with generally accepted best practice. Events and Board Decisions Affecting Remuneration
KMP fixed annual remuneration was increased effective 1 May 2012, based on business and individual performance and aligned to market remuneration levels. The „at target‟ pay levels for KMP are set with reference to other S&P/ASX 51-100 companies and peers within the Consumer Staples group. The weighted average KMP fixed remuneration increase was 7.5%. As set out in the 2012 Remuneration Report, having considered current market practice and shareholder views, the Board approved the following changes to the Metcash STI and LTI schemes: Short term incentive:
maximum target performance by members of the Executive Team will result in the payment of an STI equal to 12 months fixed remuneration;
25% of any STI awarded to a member of the Executive Team will be deferred for a 15 month period;
should the Executive no longer be employed by the Company on the scheduled vesting date, the deferred component will be forfeited; and
releasing the deferred 25% component of the STI by way of issuing Metcash equity. Long term incentive:
commencing with the 2013 financial year, the performance hurdles are indexed by reference to a calculation based on the inflation/deflation on the Company‟s goods sold in the current year as compared to the prior year, thereby providing targets that reward management performance which exclude the effects of inflation/deflation.
For
per
sona
l use
onl
y

METCASH FINANCIAL REPORT 2013
DIRECTORS’ REPORT
Year ended 30 April 2013
15
Mr Reitzer was eligible for a three year cash based LTI with a potential maximum reward of $5 million. The performance period for this grant commenced on 1 May 2010 and concluded on 30 April 2013. This grant was subject to a growth in underlying earnings per share performance hurdle. The performance hurdles were not met and no amount was payable to Mr Reitzer in relation to this grant (refer section 8 for full details of the grant). On 27 September 2012 the Company confirmed the previously announced intention of Mr Reitzer to retire as CEO in 2013. Mr Reitzer will step down as CEO effective 30 June 2013 and will cease employment with Metcash on 30 September 2013. The Board and Mr Reitzer have agreed that Mr Reitzer‟s services will be retained as a consultant to the Board for strategic advice and assistance in relation to key customer, supplier and joint venture relationships, for 3 years following Mr Reitzer‟s expected termination date of 30 September 2013. During the consultancy period, Mr Reitzer will be subject to appropriate non-compete restrictions. The consultancy fees are set at $350,000 in year one reflecting greater involvement in the handover process and then $300,000 per annum (to be paid quarterly) in years two and three based on certain service levels, above which additional fees would be payable. In recognition of the Company‟s significant growth under his leadership, and in accordance with his employment contract, Mr Reitzer will receive a cash payment of $2,029,801 equivalent to 12 months average base salary upon termination of employment on 30 September 2013 (refer to section 10). On 27 February 2013 the Company announced the appointment of Mr Ian Morrice as Chief Executive Officer, effective 30 June 2013, to replace Mr Reitzer. Mr Morrice has more than 30 years of retail experience, including Managing Director and senior executive for some of the United Kingdom‟s leading retailers. He was Group CEO and Managing Director of New Zealand‟s Warehouse Group from 2004 to 2011. Mr Morrice was appointed as an Executive Director effective 1 March 2013, with a fixed salary of $1,500,000 per annum including superannuation. Mr Morrice is not eligible to participate in the FY2013 STI or LTI programs. From 1 May 2013 and in keeping with the Board‟s vision of aligning executive remuneration with Company performance approximately 64% of Mr Morrice‟s maximum remuneration will be linked to Company results. Mr Morrice will participate in the FY2014 STI program with a maximum reward equivalent to 12 months fixed remuneration of $1,500,000 and in the FY2014 LTI program with a maximum reward equivalent to $1,200,000. Accordingly, Mr Morrice‟s total maximum remuneration package comprises approximately 36% fixed remuneration, approximately 36% maximum „at risk‟ STI and approximately 28% maximum „at risk‟ LTI, totalling $4,200,000. Refer section 5 for further details of the Company STI and LTI schemes. Mr Morrice‟s remuneration package was determined by the Board, taking into consideration advice from PricewaterhouseCoopers, which included reference against current ASX 51-100 peer group CEO remuneration levels and structures. The Committee has commissioned a full review of the Company‟s total rewards framework including the fixed and at risk infrastructure to ensure the Company‟s full remuneration offering is benchmarked to market standards and expectations. On behalf of the Committee, I commend the guide and this year‟s remuneration report to you. Neil Hamilton Chairman, Remuneration Committee
For
per
sona
l use
onl
y
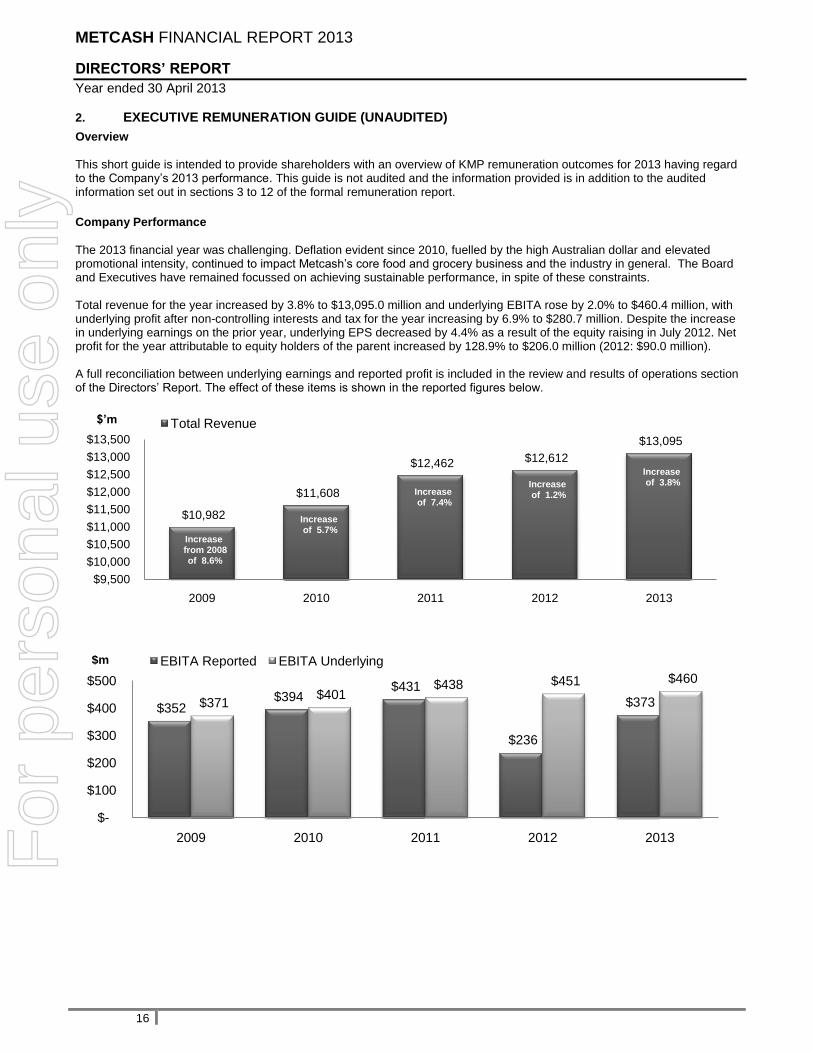
METCASH FINANCIAL REPORT 2013
DIRECTORS’ REPORT
Year ended 30 April 2013
16
2. EXECUTIVE REMUNERATION GUIDE (UNAUDITED)
Overview
This short guide is intended to provide shareholders with an overview of KMP remuneration outcomes for 2013 having regard to the Company‟s 2013 performance. This guide is not audited and the information provided is in addition to the audited information set out in sections 3 to 12 of the formal remuneration report.
Company Performance
The 2013 financial year was challenging. Deflation evident since 2010, fuelled by the high Australian dollar and elevated promotional intensity, continued to impact Metcash‟s core food and grocery business and the industry in general. The Board and Executives have remained focussed on achieving sustainable performance, in spite of these constraints. Total revenue for the year increased by 3.8% to $13,095.0 million and underlying EBITA rose by 2.0% to $460.4 million, with underlying profit after non-controlling interests and tax for the year increasing by 6.9% to $280.7 million. Despite the increase in underlying earnings on the prior year, underlying EPS decreased by 4.4% as a result of the equity raising in July 2012. Net profit for the year attributable to equity holders of the parent increased by 128.9% to $206.0 million (2012: $90.0 million). A full reconciliation between underlying earnings and reported profit is included in the review and results of operations section of the Directors‟ Report. The effect of these items is shown in the reported figures below.
$10,982
$11,608
$12,462 $12,612
$13,095
$9,500
$10,000
$10,500
$11,000
$11,500
$12,000
$12,500
$13,000
$13,500
2009 2010 2011 2012 2013
Total Revenue
Increasefrom 2008of 8.6%
Increaseof 5.7%
Increaseof 7.4%
Increaseof 1.2%
Increaseof 3.8%
$352 $394
$431
$236
$373 $371 $401
$438 $451 $460
$-
$100
$200
$300
$400
$500
2009 2010 2011 2012 2013
EBITA Reported EBITA Underlying$m
$’m
For
per
sona
l use
onl
y
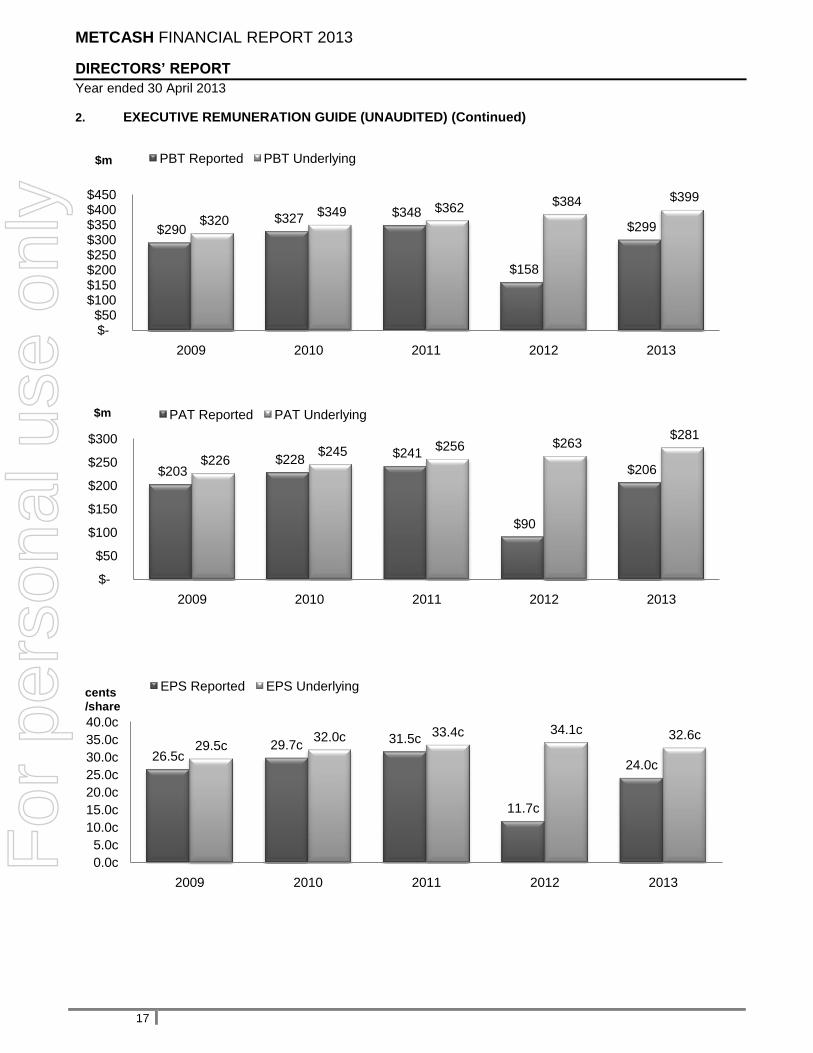
METCASH FINANCIAL REPORT 2013
DIRECTORS’ REPORT
Year ended 30 April 2013
17
2. EXECUTIVE REMUNERATION GUIDE (UNAUDITED) (Continued)
$290 $327 $348
$158
$299 $320
$349 $362 $384 $399
$-$50
$100 $150 $200 $250 $300 $350 $400 $450
2009 2010 2011 2012 2013
PBT Reported PBT Underlying$m
$203 $228
$241
$90
$206 $226
$245 $256 $263 $281
$-
$50
$100
$150
$200
$250
$300
2009 2010 2011 2012 2013
PAT Reported PAT Underlying$m
26.5c29.7c
31.5c
11.7c
24.0c
29.5c32.0c 33.4c 34.1c 32.6c
0.0c
5.0c
10.0c
15.0c
20.0c
25.0c
30.0c
35.0c
40.0c
2009 2010 2011 2012 2013
EPS Reported EPS Underlyingcents/share
For
per
sona
l use
onl
y
METCASH FINANCIAL REPORT 2013
DIRECTORS’ REPORT
Year ended 30 April 2013
18
2. EXECUTIVE REMUNERATION GUIDE (UNAUDITED) (Continued) 2013 Remuneration Outcomes
Short term incentive
As outlined below, Company performance was reflected in executive remuneration outcomes for 2013. The key metrics used in determining the quantum of STI payable are total revenue which was $13,095.0 million (2012: $12,612.3 million), underlying earnings before interest, tax and amortisation of $460.4 million (2012: $451.2 million) and underlying profit before tax which was $398.8 million (2012: $383.6 million). Within the Group each Business Pillar and the Corporate Head Office have separate STI schemes, designed to align each executive's incentives to the financial objectives of the pillar or team concerned and which aggregate to overall Group objectives. Two key KPIs are utilised, being – total revenue and underlying profit before tax. The Board considers and forms a matrix to measure performance starting at a base level that the Board considers to be the minimum level of acceptable performance (including the cost of the STI payments as the scheme is self funding) to qualify for an STI payment, moving to a target at which approximately 73% of the STI is achieved with provision to earn up to 100% of the STI at a stretch performance level. The targets vary from business to business depending on the circumstances and objectives of each pillar. However, they are all constructed so as to provide a stretch to exceed revenue and profit targets. STI payments for KMP for the year were paid at an average of approximately 76% of the maximum entitlement, with the remainder being forfeited. This reflected an 80% achievement against Group revenue and profit targets, whilst business pillar achievement levels ranged from 40% to 100% of maximum. In accordance with the STI Scheme rules for KMP, 75% of the STI reward will be paid in July 2013. The remaining 25% of the STI reward will be deferred and released through the issue of Metcash ordinary shares conditional upon the Executive remaining employed by the Company on 15 April 2014. The number of shares to be issued will be calculated by dividing the 25% STI reward dollar value by the Metcash (MTS) VWAP for the five days ending on 31 July 2013. The shares will be issued by 30 April 2014, but will be restricted from trading until 31 July 2014.The actual results by KMP are presented in Tables 6.1 and 6.2. Long term incentive
The Metcash LTI scheme is designed to incentivise and reward the Company‟s executives for implementing strategies to achieve specific underlying EPS growth targets which are aligned to the Company‟s overall strategy of increasing returns to shareholders.
The Performance Rights granted under the Rights Plan in December 2010 did not achieve the minimum performance hurdle and will be forfeited on 30 June 2013;
The Performance Rights granted under the Rights Plan in December 2011 and December 2012 will be subject to performance tests in FY2014 and FY2015, respectively. Present forecasts indicate that they are unlikely to meet the minimum performance hurdles (full details of the scheme are contained in section 7 of this report);
The final 20% tranche of the 2008 options issued to Mr Gratwicke, Mr Morabito and Mr Laidlaw vested in the current year. The options have an exercise price of $4.27 per option and expire on 7 February 2014 (full details of the scheme are contained in section 8 of this report);
Mr Reitzer was eligible for a three year cash based LTI with a potential maximum reward of $5 million. The performance period for this grant commenced on 1 May 2010 and concluded on 30 April 2013. This grant was subject to a growth in underlying earnings per share performance hurdle. The performance hurdles were not met and no amount was payable to Mr Reitzer in relation to this grant (refer section 8 for full details of the grant).
These Performance Rights LTI plans are measured against underlying EPS growth targets over a three year period. The current year underlying EPS decreased by 4.4% to 32.6 cents per share, impacted by the dilutionary effect of the $375 million equity raising. As a result, present forecasts indicate that the KMP are unlikely to receive any reward under any of the three Performance Rights LTI plan periods ending FY2013, FY2014 or FY2015.F
or p
erso
nal u
se o
nly

METCASH FINANCIAL REPORT 2013
DIRECTORS’ REPORT
Year ended 30 April 2013
19
2. EXECUTIVE REMUNERATION GUIDE (UNAUDITED) (Continued) Remuneration actually received
The accounting standards require the calculation of remuneration on an accrual basis including the use of sophisticated valuation models for long term share based incentives. The accounting standards require the recognition of long term incentives over the associated vesting period based on assumptions that may or may not eventuate and without regard to the actual economic benefit ultimately derived by the executive from the incentive. Because of potential confusion in interpreting remuneration table values the Board has provided details of actual remuneration received by executives during the reporting period in the unaudited table below. These figures represent the fixed remuneration actually paid over 2013, as well as the value of STI benefits that will be received as a result of performance in 2013, the value of LTI‟s for 2013 and the value of discretionary bonus payments. The audited accounting value of remuneration received during the 2013 financial year, reported in accordance with statutory obligations and the accounting standards, has been presented in table 10.1 of the remuneration report. Table 2.1 Remuneration actually received (unaudited)
Name Fixed
(1)
$ STI
(2)
$ LTI
(3)
$ Other
(4)
$ Total
$
A Reitzer 1,787,731 1,648,000 - (358,610) 3,077,121
I Morrice(5) 251,897 - - 30,807 282,704
A Gratwicke 795,959 484,104 - 25,005 1,305,068
S Morabito 1,096,030 486,675 - 146,111 1,728,816
F Collins 684,868 472,500 - 143,728 1,301,096
M Laidlaw 632,145 325,000 - 30,488 987,633
Total 5,248,630 3,416,279 - 17,529 8,682,438
(1) Fixed remuneration includes superannuation and accrued annual leave. (2)
The STI amount represents the 75% cash component payable to the executive in July 2013, which is based on the achievement of the relevant performance conditions in respect of the 2013 financial year as set out in Table 6.2 of the Remuneration Report. The 25% deferred equity component is not included in the table because the reward is conditional upon employment of the executive until 15 April 2014.
(3) The value of share based long term incentives calculated in accordance with the accounting standards is reported in Table 10.1 of the Remuneration Report. The above LTI column is unaudited and records the actual economic value realised by the executive as a result of exercising options or performance rights vesting. The economic value of performance rights reflects the market value of shares issued to the executive when the performance rights vest and are converted into shares. The economic value of options represents the difference between the exercise price of the options and the value of the relevant shares on exercise date.
(4)
Other amounts include the value of other benefits that have been determined in accordance with the accounting standards, and are consistent with the amounts disclosed in the „other benefits‟ in Table 10.1 of the Remuneration Report, plus accrued long service leave and reductions in such leave entitlements and discretionary bonus payments.
(5)
Mr Morrice was appointed as an Executive Director on 1 March 2013 and will become the CEO effective 30 June 2013.
For
per
sona
l use
onl
y

METCASH FINANCIAL REPORT 2013
DIRECTORS’ REPORT
Year ended 30 April 2013
20
3. WHO DOES THIS REPORT COVER? (AUDITED) This Remuneration Report, which comprises sections 3 to 12 inclusive, is prepared in accordance with the statutory requirements (section 300A) of the Corporations Act 2001. The information set out in sections 3 to 12 of this remuneration report has been audited in accordance with section 308(3C) of the Corporations Act 2001 and accounting standards. The report sets out the remuneration details for the Non-Executive Directors, the CEO and the group executives of Metcash, who together have the authority and responsibility for planning, directing and controlling the activities of the Group. For the purposes of this report, the CEO and the group executives are referred to as the KMP. Non-Executive Directors(1)
Name Position Peter Barnes Chairman
Patrick Allaway Director – appointed 7 November 2012
Fiona Balfour Director
Michael Butler Director
Neil Hamilton Director
Edwin Jankelowitz Director
Richard Longes Director – retired 30 August 2012
Ian Morrice Director – 12 June 2012 to 28 February 2013
Dudley Rubin Director
(1)
All non-executive directors held their current positions for the entire 2013 financial year unless otherwise stated.
KMP
Name Position Period KMP Andrew Reitzer Chief Executive Officer & Director The whole year
Ian Morrice Executive Director 1 March 2013 to 30 April 2013
Adrian Gratwicke Chief Financial Officer The whole year
Silvestro Morabito Chief Operating Officer, Food & Grocery The whole year
Fergus Collins Chief Executive Officer, ALM The whole year
Mark Laidlaw Chief Executive Officer, Hardware The whole year
For
per
sona
l use
onl
y

METCASH FINANCIAL REPORT 2013
DIRECTORS’ REPORT
Year ended 30 April 2013
21
4. HOW REMUNERATION DECISIONS ARE MADE (AUDITED)
The diagram below illustrates how decisions are made with respect to remuneration of KMP and non-executive directors.
BOARD
Maintains overall responsibility and accountability for oversight of Metcash‟s remuneration policy and practices. Approves, having regard to recommendations of the Remuneration Committee:
the CEO‟s remuneration package;
the remuneration and terms of any incentives for any Executive Directors, the Company Secretary and all other direct reports of the CEO, at least annually; and
the remuneration of Non Executive Directors.
REMUNERATION AND OTHER EXTERNAL CONSULTANTS
REMUNERATION COMMITTEE
Supports the Remuneration Committee by providing independent:
advice on remuneration quantum and structure;
benchmarking data and market practice information about other listed companies; and
advice regarding legal and regulatory issues that impact on remuneration arrangements.
Primarily responsible:
reviewing and advising the Board annually on the remuneration and components of remuneration for the CEO and his direct reports;
reviewing and making recommendations to the Board regarding the design of all executive incentive plans and the total proposed payments from each executive incentive plan; and
reviewing and recommending to the Board the level of remuneration for Non Executive Directors
In performing its role, the Board and Remuneration Committee directly commission and receive information, advice and recommendations from independent external advisers. In 2012 the Board reviewed the process for engaging and seeking advice from external advisers and adopted a protocol setting out the process for receiving remuneration recommendations in relation to KMP which, among other things, is designed to ensure that the recommendations made are free from undue influence by management. One of the key outcomes of this review was that the Chairman of the Remuneration Committee appoints and engages directly with remuneration consultants in relation to KMP remuneration matters. During the 2013 financial year, the Remuneration Committee employed the services of PricewaterhouseCoopers („PwC‟) under the Board approved protocol to review and provide recommendations on the appropriateness of the incoming Group CEO (Mr Morrice) remuneration structure and levels. Amounts paid to PricewaterhouseCoopers during FY2013 are detailed below:
Remuneration consultant
Appointed by Nature of work Fees paid
Pricewaterhouse Coopers
Remuneration Committee
Review of incoming Group CEO (Mr Morrice) remuneration structure and levels.
$8,000
The Board is satisfied that the remuneration recommendations made by PwC were made free from any undue influence. In addition to the internal protocols referred to above PwC provided a formal declaration confirming that the recommendation was made free from „undue influence‟ by the members of the KMP to whom the recommendation related. The Remuneration Committee engaged Herbert Smith Freehills to provide independent governance and legal advice in relation to senior executive remuneration matters.
For
per
sona
l use
onl
y

METCASH FINANCIAL REPORT 2013
DIRECTORS’ REPORT
Year ended 30 April 2013
22
5. KMP REMUNERATION (AUDITED)
Policy and Approach
The Board is committed to developing and maintaining a remuneration framework that attracts and retains quality executives and aligns the interests of the members of the KMP with shareholder interests by rewarding high performance that results in increased shareholder value. The particular principles that guide the Remuneration Committee when they set KMP remuneration are listed below.
Attract and retain talent - Metcash operates in the highly competitive food, liquor, hardware and automotive industries.
Remuneration packages are structured to ensure that they remain market competitive and take into account the individual‟s role and performance. Fixed salaries are determined, in part, by reference to benchmarking data relating to companies in the ASX Top 51-100. In addition, business specific criteria are considered. The „at risk‟ components of remuneration (featuring short and long term elements) are designed to motivate individual and group performance. The fixed and variable „at risk‟ remuneration in aggregate is designed to be competitive in the market place and align with shareholder outcomes.
Link remuneration to performance - A proportion of KMP remuneration is „at risk‟, which means that it is only delivered if
certain performance conditions are met. KMP are prohibited by law from hedging their „at risk‟ remuneration. „At risk‟ includes both short and long term outcomes to meet market best practice.
Align remuneration to creation of shareholder value - KMP receive fixed remuneration and short and long term „at risk‟
incentives designed to motivate and help achieve superior business and financial performance, benefitting shareholders. Both short and long term KPI‟s are designed to provide appropriate alignment between management and shareholders.
Metcash’s current Key Performance Indicators (KPI’s)
Short term incentive
Metcash‟s short term incentive plan is designed to reward executives for delivering on pre-determined revenue and underlying profit before tax targets. The performance conditions are set at the beginning of each financial year and are designed to drive successful and sustainable financial and business outcomes which are set with reference to Board approved objectives, plans and budgets. The CEO and CFO short term incentives are determined with reference to Group revenue and underlying profit before tax and business pillar CEO‟s with reference to Group and pillar revenue and underlying profit before tax. If the targets are met, 75% of the reward is payable immediately in cash and the remaining 25% is deferred and released as equity, conditional upon subsequent employment. Performance criteria are disclosed in section 6 of the remuneration report. If the minimum growth targets are not met, no STI is payable. The CEO may award discretionary bonus payments to Executives outside the STI scheme where circumstances warrant such a payment. Long term incentive
The Company‟s LTI plan is the Metcash Performance Rights Plan („Rights Plan‟). All Performance Rights granted by the Company are subject to performance hurdles. These hurdles have attached objectives that must be satisfied on a prolonged basis (usually 3 years) and which directly improve Company value. The Board considers underlying earnings per share (EPS) to be the most appropriate reflection of the underlying ongoing profitability of the Company. There is genuine scope for individual executive performance to impact EPS outcomes and so the Board considers EPS to be a more effective hurdle for its LTI program than largely market-based hurdles such as relative TSR, which can vary due to external factors such as market sentiment (which do not necessarily reflect Company or executive performance). In 2012 the Board conducted a review of remuneration and obtained independent advice in relation to the correlation between shareholder return and remuneration and concluded that underlying earnings per share remains the best measure of alignment between LTI and shareholder returns. Therefore, the Board has chosen the measures it believes best meet shareholder alignment. The Board sets and reviews the Rights Plan EPS hurdle rates annually. The underlying earnings per share targets for each new grant are based on factors including the Company‟s strategic objectives and business plans, financial performance, state of the industry/market and other operational measures.
For
per
sona
l use
onl
y

METCASH FINANCIAL REPORT 2013
DIRECTORS’ REPORT
Year ended 30 April 2013
23
5. KMP REMUNERATION (AUDITED) (Continued)
The FY2013 plan hurdles were set at between 4% („lower bound hurdle rate‟) and 7% („upper bound hurdle rate‟) compound underlying EPS growth, both adjusted up or down for the effects of actual year-on-year inflation/deflation, over a three year vesting period as follows:
Achieving an underlying EPS growth rate equivalent to the lower bound hurdle rate results in 0% vesting.
Achieving an underlying EPS growth rate equivalent to the upper bound hurdle rate results in 100% vesting.
Pro-rata vesting occurs for EPS growth between the lower and upper bound hurdle rates. Any LTIs that do not vest are forfeited. The FY2012 and FY2011 plan hurdles, which are not adjusted for the effects of inflation/deflation, were set at between 5% and 10% compound underlying EPS growth over a three year vesting period as follows:
Achieving 5% underlying EPS growth results in 50% vesting.
Achieving 10% underlying EPS growth results in 100% vesting. Pro-rata vesting occurs for EPS growth over 5% and under 10%. Any LTIs that do not vest are forfeited.
Determination of underlying earnings
Company value improvement is expressed as an increase in revenue, underlying profit before tax and underlying earnings per share. To provide an accurate and consistent basis of measuring this growth in value, a calculation is used to determine underlying earnings per share. This reflects reported earnings per share from continuing operations excluding amortisation of customer relationships and significant items (whether positive or negative). In determining underlying earnings, the Board takes into account material impacts on earnings arising from significant items. Having regard to STI, the impacts from these items are taken into account when determining the STI grids. Having regard to LTI, adjustments, as considered appropriate, are made to the calculation to account for these impacts. A reconciliation of underlying earnings to net profit is presented in the review and results of operations in the Directors‟ Report.
In addition to these core principles, the Board is committed to promoting transparency around its remuneration arrangements and to providing shareholders and other stakeholders with clear, complete and concise information about Metcash‟s remuneration structures.
Remuneration Framework - key aspects of KMP Remuneration
Fixed Remuneration
What is included in fixed remuneration?
Fixed remuneration comprises fixed salary, statutory superannuation benefits and any additional benefits that form part of the arrangement including motor vehicle lease and salary sacrifice superannuation contributions.
How is fixed remuneration set?
Fixed remuneration is determined based on the scope and nature of an individual‟s role, qualifications, performance and experience. Market data, including in relation to the ASX 51-100 and the Company‟s peers, is used to benchmark salary levels. Metcash‟s policy is to position fixed remuneration at the 65th percentile of the ASX 100. Remuneration levels need to be competitive with those of Metcash‟s competitors (including much larger businesses such as Woolworths and Wesfarmers) so that the Company can attract and retain quality people.
How and when is fixed remuneration reviewed?
The Remuneration Committee reviews KMP remuneration each year, based on market trends and individual performance, and recommends any adjustments to the Board. All adjustments must be approved by the Board.
For
per
sona
l use
onl
y

METCASH FINANCIAL REPORT 2013
DIRECTORS’ REPORT
Year ended 30 April 2013
24
5. KMP REMUNERATION (AUDITED) (Continued)
Short Term Incentive (STI)
What is the STI program?
STI is an „at risk‟ component of KMP remuneration which gives KMP the opportunity to receive a reward, dependent on performance against set key performance indicators (KPIs). If these KPIs are met, 75% of the STI reward amount is payable immediately in cash and the remaining 25% is deferred for 15 months and released through the issue of Metcash shares, conditional upon the Executive being employed by the Company on 15 April of the year subsequent to the performance year.
The STI program and the KPIs set under it are intended to motivate and reward high performance and link performance and reward.
All STIs are structured to encourage the relevant individual to exceed annual revenue and profit targets.
What are the KPIs
KPIs are tailored for individual members of the KMP depending on their role and sphere of influence, but are all financial in nature and based on a combination of group and/or divisional measures (primarily revenue and underlying profit measures).
The Board believes that financial targets are appropriate because they align with key drivers of the business and are objectively measurable.
What is the maximum potential STI level?
KMPs are eligible to receive an STI reward of up to a maximum of 100% of total fixed remuneration, depending on their performance against KPIs.
Long Term Incentive (LTI)
What is the LTI program?
LTI is an equity-based „at risk‟ component of KMP remuneration tied to the Company‟s longer term performance.
Metcash operates a Performance Rights Plan introduced in June 2010. Participation in the Performance Rights Plan gives members of the KMP an opportunity to acquire shares in the Company if they achieve outcomes linked to the creation of long term sustainable growth for shareholders over a performance period of at least three years. Additionally, legacy equity programs remain open that include option and cash based incentives.
Full details are provided in Sections 7 and 8.
Why was the LTI program adopted?
The LTI program encourages members of the KMP to focus on long term Company performance and the achievement of sustainable growth. It provides KMPs with the opportunity to receive equity based rewards and thereby aligns their interests with shareholder‟s interests and encourages them to take a shareholder‟s perspective.
What are the performance hurdles?
The Board believes earnings per share growth is the most appropriate measure of value creation and considers “underlying” earnings per share to be the most accurate and consistent basis of measuring this growth in value.
“Underlying” EPS represents reported earnings per share from continuing operations excluding amortisation of customer relationships and significant items which best reflects the underlying ongoing profitability of the Company. In determining underlying EPS, both positive and negative significant items are excluded. A reconciliation of underlying earnings to net profit is presented in the review and results of operations in the Directors‟ Report.
The performance rights issued in FY2013 include an adjustment to EPS performance hurdles for the effects of actual year-on-year inflation/deflation.
What happens to LTIs when an executive ceases employment?
When a KMP ceases to be an employee of Metcash their unvested LTIs will lapse, except in instances of death and disability or special circumstances as determined by the Board.
For
per
sona
l use
onl
y
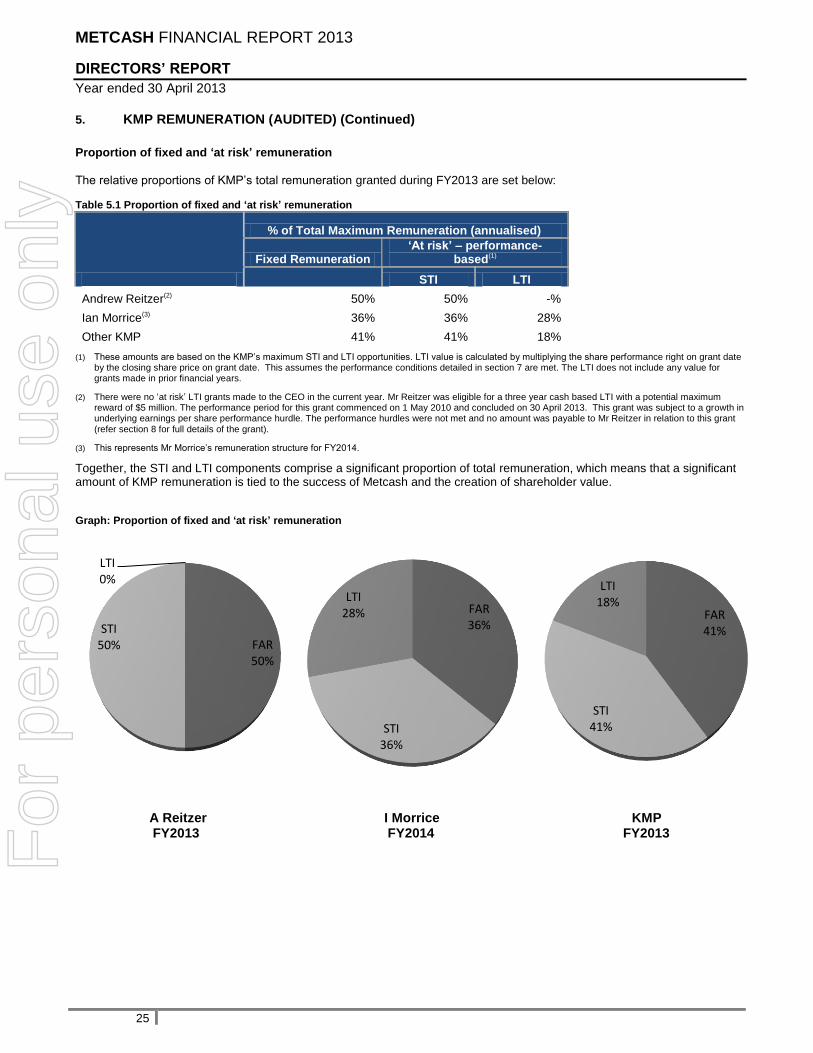
METCASH FINANCIAL REPORT 2013
DIRECTORS’ REPORT
Year ended 30 April 2013
25
5. KMP REMUNERATION (AUDITED) (Continued)
Proportion of fixed and ‘at risk’ remuneration
The relative proportions of KMP‟s total remuneration granted during FY2013 are set below:
Table 5.1 Proportion of fixed and ‘at risk’ remuneration
% of Total Maximum Remuneration (annualised)
Fixed Remuneration ‘At risk’ – performance-
based(1)
STI LTI
Andrew Reitzer(2) 50% 50% -%
Ian Morrice(3) 36% 36% 28%
Other KMP 41% 41% 18%
(1)
These amounts are based on the KMP‟s maximum STI and LTI opportunities. LTI value is calculated by multiplying the share performance right on grant date by the closing share price on grant date. This assumes the performance conditions detailed in section 7 are met. The LTI does not include any value for grants made in prior financial years.
(2)
There were no „at risk‟ LTI grants made to the CEO in the current year. Mr Reitzer was eligible for a three year cash based LTI with a potential maximum reward of $5 million. The performance period for this grant commenced on 1 May 2010 and concluded on 30 April 2013. This grant was subject to a growth in underlying earnings per share performance hurdle. The performance hurdles were not met and no amount was payable to Mr Reitzer in relation to this grant (refer section 8 for full details of the grant).
(3)
This represents Mr Morrice‟s remuneration structure for FY2014.
Together, the STI and LTI components comprise a significant proportion of total remuneration, which means that a significant amount of KMP remuneration is tied to the success of Metcash and the creation of shareholder value. Graph: Proportion of fixed and ‘at risk’ remuneration
A Reitzer I Morrice KMP FY2013 FY2014 FY2013
FAR50%
STI50%
LTI0%
FAR36%
STI36%
LTI28% FAR
41%
STI41%
LTI18%
For
per
sona
l use
onl
y
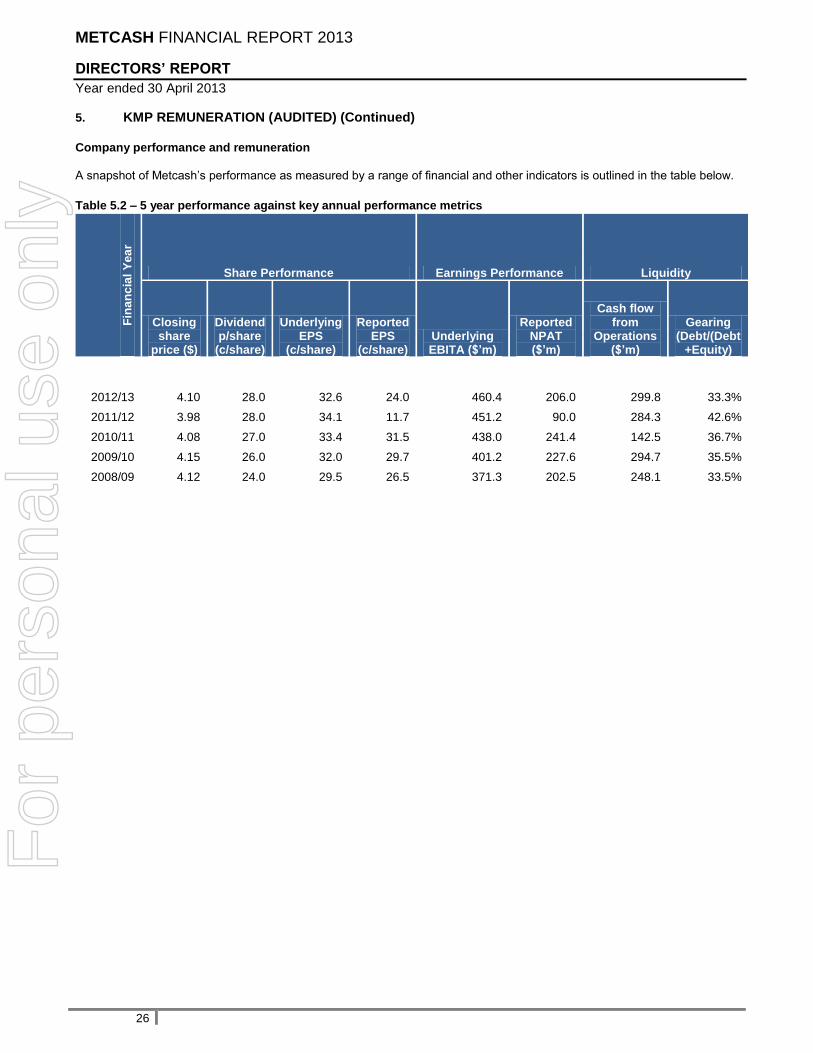
METCASH FINANCIAL REPORT 2013
DIRECTORS’ REPORT
Year ended 30 April 2013
26
5. KMP REMUNERATION (AUDITED) (Continued)
Company performance and remuneration
A snapshot of Metcash‟s performance as measured by a range of financial and other indicators is outlined in the table below.
Table 5.2 – 5 year performance against key annual performance metrics
Fin
an
cia
l Y
ea
r
Share Performance Earnings Performance Liquidity
Closing share
price ($)
Dividend p/share
(c/share)
Underlying EPS
(c/share)
Reported EPS
(c/share) Underlying EBITA ($’m)
Reported NPAT ($’m)
Cash flow from
Operations ($’m)
Gearing (Debt/(Debt
+Equity)
2012/13 4.10 28.0 32.6 24.0 460.4 206.0 299.8 33.3%
2011/12 3.98 28.0 34.1 11.7 451.2 90.0 284.3 42.6%
2010/11 4.08 27.0 33.4 31.5 438.0 241.4 142.5 36.7%
2009/10 4.15 26.0 32.0 29.7 401.2 227.6 294.7 35.5%
2008/09 4.12 24.0 29.5 26.5 371.3 202.5 248.1 33.5%
For
per
sona
l use
onl
y
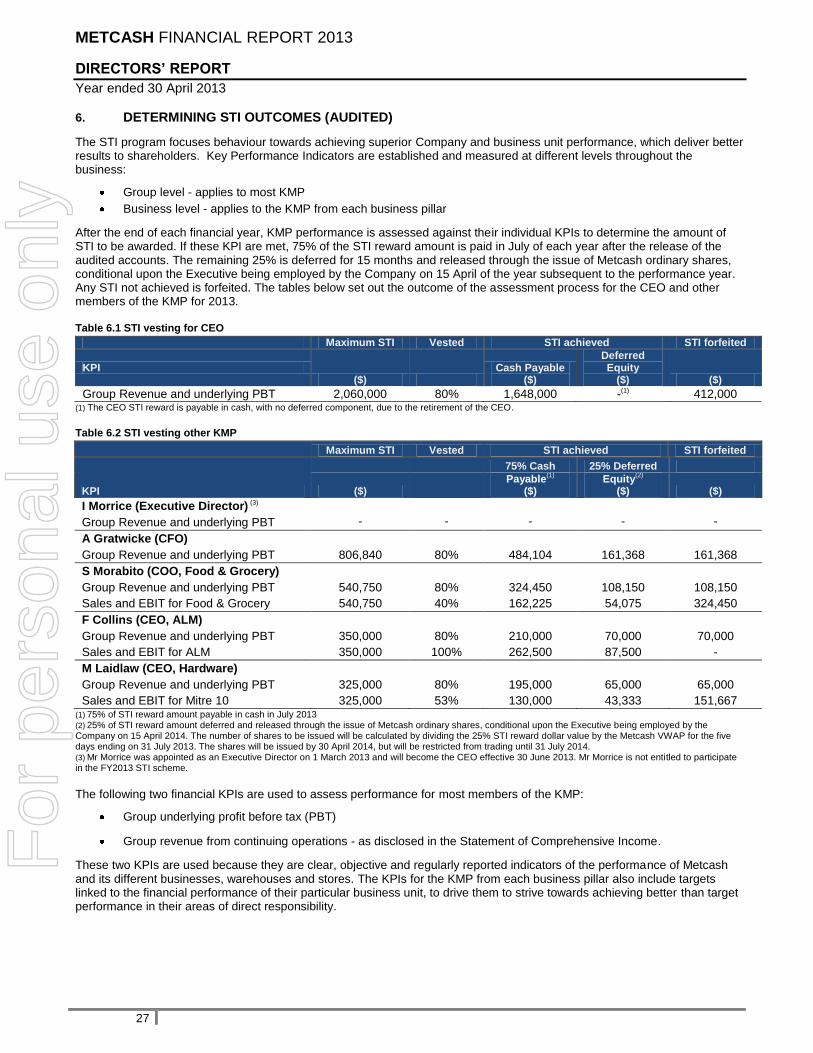
METCASH FINANCIAL REPORT 2013
DIRECTORS’ REPORT
Year ended 30 April 2013
27
6. DETERMINING STI OUTCOMES (AUDITED)
The STI program focuses behaviour towards achieving superior Company and business unit performance, which deliver better results to shareholders. Key Performance Indicators are established and measured at different levels throughout the business:
Group level - applies to most KMP
Business level - applies to the KMP from each business pillar
After the end of each financial year, KMP performance is assessed against their individual KPIs to determine the amount of STI to be awarded. If these KPI are met, 75% of the STI reward amount is paid in July of each year after the release of the audited accounts. The remaining 25% is deferred for 15 months and released through the issue of Metcash ordinary shares, conditional upon the Executive being employed by the Company on 15 April of the year subsequent to the performance year. Any STI not achieved is forfeited. The tables below set out the outcome of the assessment process for the CEO and other members of the KMP for 2013. Table 6.1 STI vesting for CEO
Maximum STI Vested STI achieved STI forfeited
KPI ($)
Cash Payable ($)
Deferred Equity
($) ($)
Group Revenue and underlying PBT 2,060,000 80% 1,648,000 -(1) 412,000 (1) The CEO STI reward is payable in cash, with no deferred component, due to the retirement of the CEO.
Table 6.2 STI vesting other KMP
Maximum STI Vested STI achieved STI forfeited
KPI
75% Cash 25% Deferred
($)
Payable(1)
($)
Equity(2)
($) ($)
I Morrice (Executive Director) (3)
Group Revenue and underlying PBT - - - - -
A Gratwicke (CFO)
Group Revenue and underlying PBT 806,840 80% 484,104 161,368 161,368
S Morabito (COO, Food & Grocery)
Group Revenue and underlying PBT 540,750 80% 324,450 108,150 108,150
Sales and EBIT for Food & Grocery 540,750 40% 162,225 54,075 324,450
F Collins (CEO, ALM)
Group Revenue and underlying PBT 350,000 80% 210,000 70,000 70,000
Sales and EBIT for ALM 350,000 100% 262,500 87,500 -
M Laidlaw (CEO, Hardware)
Group Revenue and underlying PBT 325,000 80% 195,000 65,000 65,000
Sales and EBIT for Mitre 10 325,000 53% 130,000 43,333 151,667 (1)
75% of STI reward amount payable in cash in July 2013
(2) 25% of STI reward amount deferred and released through the issue of Metcash ordinary shares, conditional upon the Executive being employed by the
Company on 15 April 2014. The number of shares to be issued will be calculated by dividing the 25% STI reward dollar value by the Metcash VWAP for the five days ending on 31 July 2013. The shares will be issued by 30 April 2014, but will be restricted from trading until 31 July 2014. (3)
Mr Morrice was appointed as an Executive Director on 1 March 2013 and will become the CEO effective 30 June 2013. Mr Morrice is not entitled to participate
in the FY2013 STI scheme.
The following two financial KPIs are used to assess performance for most members of the KMP:
Group underlying profit before tax (PBT)
Group revenue from continuing operations - as disclosed in the Statement of Comprehensive Income.
These two KPIs are used because they are clear, objective and regularly reported indicators of the performance of Metcash and its different businesses, warehouses and stores. The KPIs for the KMP from each business pillar also include targets linked to the financial performance of their particular business unit, to drive them to strive towards achieving better than target performance in their areas of direct responsibility.
For
per
sona
l use
onl
y

METCASH FINANCIAL REPORT 2013
DIRECTORS’ REPORT
Year ended 30 April 2013
28
6. DETERMINING STI OUTCOMES (AUDITED) (Continued)
For FY2013, the potential (or maximum) STI payable was typically set at a stretch above target revenue and earnings levels. Target revenue and earnings were set at a level consistent with guidance provided to the market for FY2013. This stretch target was largely achieved at Group level during FY2013 and this resulted in the payment of STI rewards at the 80% level. The Food & Grocery, Mitre 10 and ALM business pillar results were reflected in actual STI rewards closer to their individual stretch targets.
7. LONG TERM INCENTIVE (AUDITED)
Objective
The objectives of the LTI program are to ensure the Company is able to attract and retain its key group executives, whilst incentivising these executives to achieve challenging financial performance hurdles which will increase shareholder value. Since 2010, the Board has operated the Metcash Performance Rights Plan („Rights Plan‟). Summary of Performance Rights
The table below sets out the Performance Rights granted to members of the KMP under the Rights Plan. Table 7.1 Performance Rights granted to KMP
Participants Grant date
Vesting date
Number of rights
granted
Fair value per right (at grant date)
Vested in FY2013
Forfeited in FY2013
Andrew Reitzer Dec 2012 7-Sep-15 - N/A N/A N/A
Dec 2011 30-Jun-14 - N/A N/A N/A
Dec 2010 30-Jun-13 - N/A N/A N/A
Ian Morrice(1) - - - - - -
Adrian Gratwicke Dec 2012 7-Sep-15 100,841 $2.30 0.0% 0.0%
Dec 2011 30-Jun-14 73,204 $3.62 0.0% 0.0%
Dec 2010 30-Jun-13 59,770 $3.62 0.0% 100.0%(2)
Silvestro Morabito Dec 2012 7-Sep-15 135,169 $2.30 0.0% 0.0%
Dec 2011 30-Jun-14 72,516 $3.62 0.0% 0.0%
Dec 2010 30-Jun-13 70,171 $3.62 0.0% 100.0%(2)
Fergus Collins Dec 2012 7-Sep-15 87,488 $2.30 0.0% 0.0%
Dec 2011 30-Jun-14 55,725 $3.62 0.0% 0.0%
Dec 2010 30-Jun-13 53,923 $3.62 0.0% 100.0%(2)
Mark Laidlaw Dec 2012 7-Sep-15 81,239 $2.30 0.0% 0.0%
Dec 2011 30-Jun-14 46,201 $3.62 0.0% 0.0%
Dec 2010 30-Jun-13 49,166 $3.62 0.0% 100.0%(2)
(1) Mr Morrice was appointed as an Executive Director on 1 March 2013 and will become the CEO effective 30 June 2013. Mr Morrice is not entitled to participate
in the FY2013 LTI scheme. (2)
The December 2010 Performance Rights did not achieve the minimum underlying EPS performance hurdle. Accordingly, these Performance Rights will be
forfeited on 30 June 2013. The Rights Plan
Performance Rights (granted under the Rights Plan) replaced share options as the Company‟s long term incentive vehicle from 30 June 2010. Further details of Performance Rights are provided in Note 25 to the financial statements. The key terms of the Rights Plan include:
Each Performance Right is an entitlement to receive a fully paid ordinary share in the Company on terms and conditions determined by the Board, including vesting conditions linked to service and performance over a 3 year period;
Performance Rights are offered at no cost to participants; and
Performance Rights do not carry voting or dividend rights, however shares allocated upon vesting of Performance Rights will carry the same rights as other ordinary shares.
For
per
sona
l use
onl
y

METCASH FINANCIAL REPORT 2013
DIRECTORS’ REPORT
Year ended 30 April 2013
29
8. LONG TERM INCENTIVES – LEGACY PLANS (AUDITED)
May 2010 Cash LTI
In May 2010 a three year retention incentive was granted to Mr Reitzer (Group CEO). The performance period for this grant commenced on 1 May 2010 and concluded on 30 April 2013. This grant is subject to a growth in underlying earnings per share performance hurdle and tested at the end of the performance period. A minimum payment of $3 million was payable for the achievement of a 5% annual compounded growth in underlying earnings per share for the three years, based on underlying earnings for the 2010 year, and a maximum payment of $5 million for the achievement of a 10% or better growth in compounded underlying earnings per share over that period. Pro rata payments are to be made for achievements between 5% and 10%. In FY2013, the minimum performance hurdle for this grant was not achieved and accordingly the plan has now concluded with $nil payable. May 2009 Cash LTI
A long term retention incentive of $1 million was granted in May 2009 to Mr Gratwicke (then GM Finance, now CFO). The vesting of the long term incentive grant is subject to achievement of the performance hurdles over a five year period (a compounding 8% increase in underlying earnings per share based on 2009 underlying earnings per share adjusted for material changes to the number of shares issued) and only payable:
on successful achievement of the performance hurdles described above in 2014 and;
if the Executive is still employed by the Company at that time and a member of the Metcash Executive Team. If the compound annual growth achieved by the Company from the base year is;
equal to or greater than the target, then the maximum amount ($1 million) will be paid;
less than 40% of the target at the end of the five year period, no payment will be made or;
greater than or equal to 40% of the target, then the amount paid will be increased to the maximum amount on a pro rata basis.
Prior to this grant Mr Gratwicke was not invited to participate in any cash based LTI plan. This incentive was provided in 2009 to ensure his equitable treatment in relation to other members of the Executive Team and to ensure effective retention arrangements were in place. However, in recognition that Mr Gratwicke has the opportunity to earn benefits from the options issued to him in 2008 (see discussion under “Options” section below), and as these benefits are not available to the other members of the Executive Team, in the event he exercises any of his options during the period up to 30 April 2014, the amount which would otherwise have been payable to him under this 2009 LTI grant will be reduced by an amount equal to the pre-tax profits in respect of exercising the options. In this case, pre-tax profit is calculated using the number of options exercised and the difference between the market price of the options on the day of exercise and the price at which the options were issued. It should be noted that options not exercised by 7 February 2014 will be cancelled. Therefore, the maximum amount payable to Mr Gratwicke under the retention plan will be $1 million less any applicable pre-tax profit earned from exercising the 2008 options. February 2008 Options
Options were issued in February 2008 to Mr Gratwicke (then GM Finance, now CFO) but were not offered to Executive Directors and other members of the Executive Team. A performance hurdle applies to these options, the hurdle being a compounding 8% increase in underlying earnings per share based on underlying earnings per share for the 2007 financial year, which must be achieved in the financial year prior to the financial year in which a tranche of options becomes able to be exercised. Before these options are exercised, agreement is obtained from the Remuneration Committee which verifies that the hurdle has been achieved with confirmation from the Company‟s external auditor. The final 20% tranche of these options met the performance hurdle during FY2013, such that 100% of all options issued have now vested. In total, 500,000 options have been issued to Mr Gratwicke with an exercise price of $4.27 per share, and which lapse on 7 February 2014.
For
per
sona
l use
onl
y
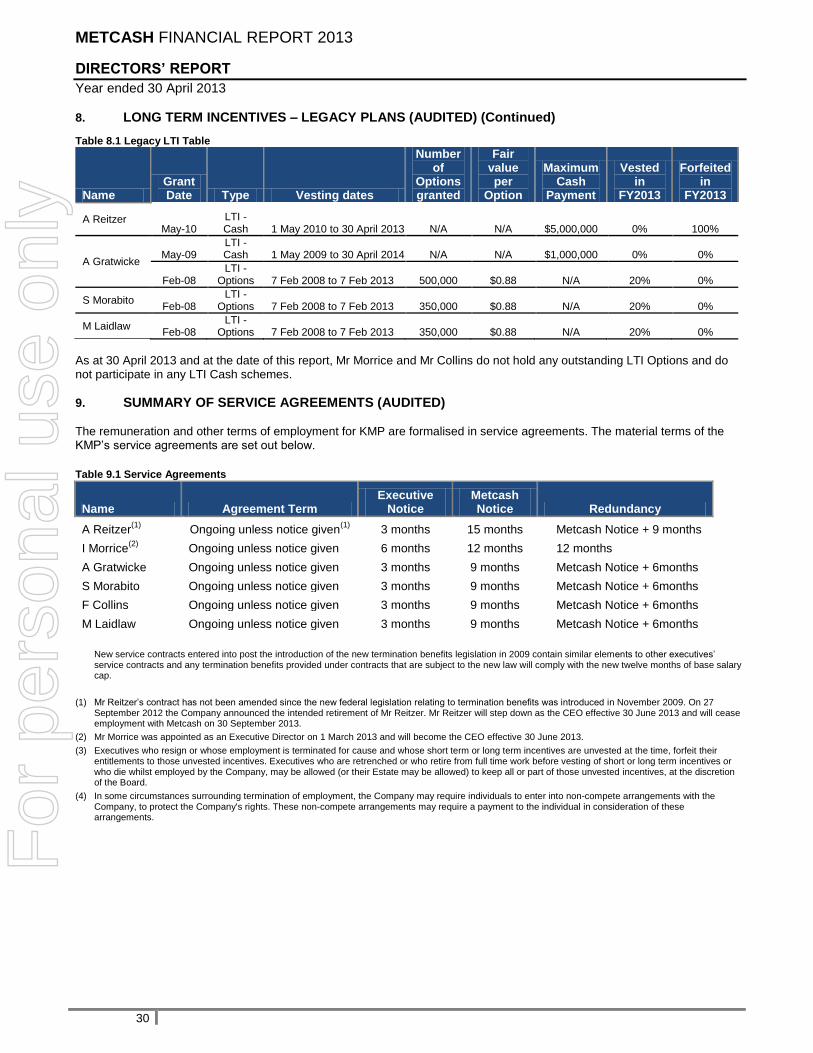
METCASH FINANCIAL REPORT 2013
DIRECTORS’ REPORT
Year ended 30 April 2013
30
8. LONG TERM INCENTIVES – LEGACY PLANS (AUDITED) (Continued)
Table 8.1 Legacy LTI Table
Name Grant Date Type Vesting dates
Number of
Options granted
Fair value per
Option
Maximum Cash
Payment
Vested in
FY2013
Forfeited in
FY2013
A Reitzer May-10
LTI - Cash 1 May 2010 to 30 April 2013 N/A N/A $5,000,000 0% 100%
A Gratwicke May-09
LTI - Cash 1 May 2009 to 30 April 2014 N/A N/A $1,000,000 0% 0%
Feb-08 LTI -
Options 7 Feb 2008 to 7 Feb 2013 500,000 $0.88 N/A 20% 0%
S Morabito Feb-08
LTI - Options 7 Feb 2008 to 7 Feb 2013 350,000 $0.88 N/A 20% 0%
M Laidlaw Feb-08
LTI - Options 7 Feb 2008 to 7 Feb 2013 350,000 $0.88 N/A 20% 0%
As at 30 April 2013 and at the date of this report, Mr Morrice and Mr Collins do not hold any outstanding LTI Options and do not participate in any LTI Cash schemes.
9. SUMMARY OF SERVICE AGREEMENTS (AUDITED)
The remuneration and other terms of employment for KMP are formalised in service agreements. The material terms of the KMP‟s service agreements are set out below.
Table 9.1 Service Agreements
Name Agreement Term Executive
Notice Metcash Notice Redundancy
A Reitzer(1)
Ongoing unless notice given(1)
3 months 15 months Metcash Notice + 9 months
I Morrice(2)
Ongoing unless notice given 6 months 12 months 12 months
A Gratwicke Ongoing unless notice given 3 months 9 months Metcash Notice + 6months
S Morabito Ongoing unless notice given 3 months 9 months Metcash Notice + 6months
F Collins Ongoing unless notice given 3 months 9 months Metcash Notice + 6months
M Laidlaw Ongoing unless notice given 3 months 9 months Metcash Notice + 6months
New service contracts entered into post the introduction of the new termination benefits legislation in 2009 contain similar elements to other executives‟ service contracts and any termination benefits provided under contracts that are subject to the new law will comply with the new twelve months of base salary cap.
(1) Mr Reitzer‟s contract has not been amended since the new federal legislation relating to termination benefits was introduced in November 2009. On 27 September 2012 the Company announced the intended retirement of Mr Reitzer. Mr Reitzer will step down as the CEO effective 30 June 2013 and will cease employment with Metcash on 30 September 2013.
(2) Mr Morrice was appointed as an Executive Director on 1 March 2013 and will become the CEO effective 30 June 2013.
(3) Executives who resign or whose employment is terminated for cause and whose short term or long term incentives are unvested at the time, forfeit their entitlements to those unvested incentives. Executives who are retrenched or who retire from full time work before vesting of short or long term incentives or who die whilst employed by the Company, may be allowed (or their Estate may be allowed) to keep all or part of those unvested incentives, at the discretion of the Board.
(4) In some circumstances surrounding termination of employment, the Company may require individuals to enter into non-compete arrangements with the Company, to protect the Company's rights. These non-compete arrangements may require a payment to the individual in consideration of these arrangements.
For
per
sona
l use
onl
y
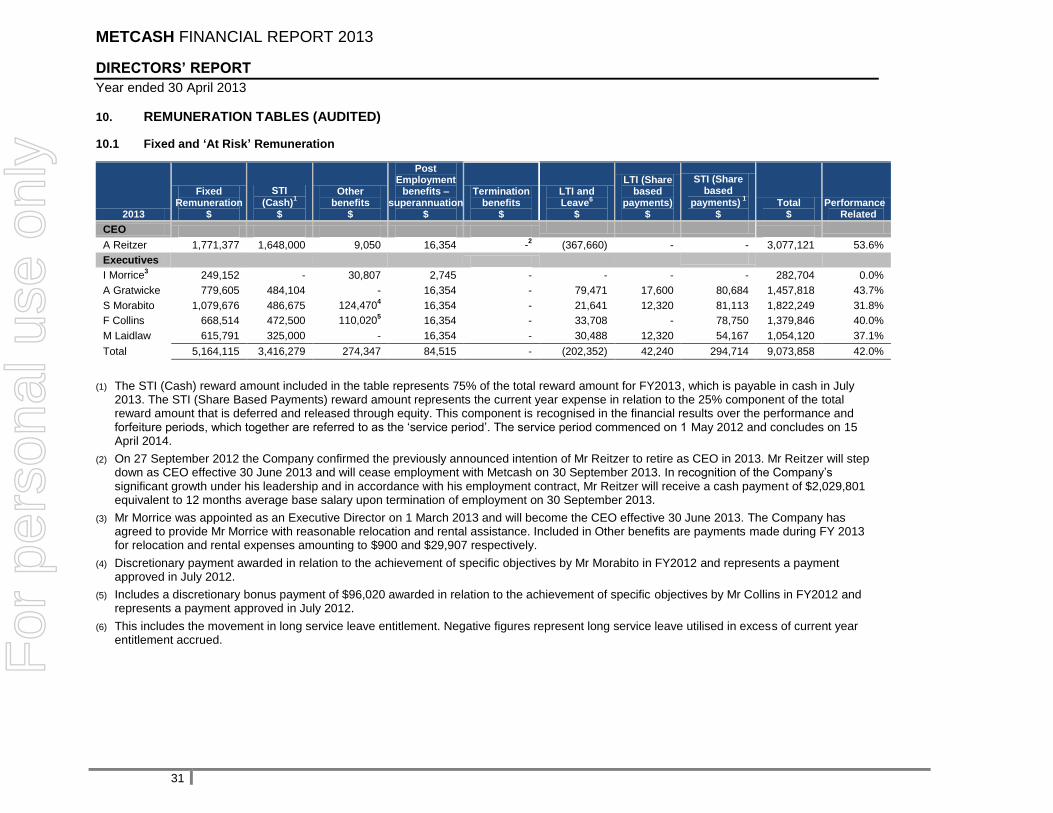
METCASH FINANCIAL REPORT 2013
DIRECTORS’ REPORT
Year ended 30 April 2013
31
10. REMUNERATION TABLES (AUDITED)
10.1 Fixed and ‘At Risk’ Remuneration
2013
Fixed Remuneration
$
STI
(Cash)1
$
Other benefits
$
Post Employment
benefits – superannuation
$
Termination benefits
$
LTI and Leave6
$
LTI (Share based
payments) $
STI (Share based
payments) 1
$ Total
$ Performance
Related
CEO
A Reitzer 1,771,377 1,648,000 9,050 16,354 -2 (367,660) - - 3,077,121 53.6%
Executives
I Morrice3 249,152 - 30,807 2,745 - - - - 282,704 0.0%
A Gratwicke 779,605 484,104 - 16,354 - 79,471 17,600 80,684 1,457,818 43.7%
S Morabito 1,079,676 486,675 124,4704 16,354 - 21,641 12,320 81,113 1,822,249 31.8%
F Collins 668,514 472,500 110,0205 16,354 - 33,708 - 78,750 1,379,846 40.0%
M Laidlaw 615,791 325,000 - 16,354 - 30,488 12,320 54,167 1,054,120 37.1%
Total 5,164,115 3,416,279 274,347 84,515 - (202,352) 42,240 294,714 9,073,858 42.0%
(1) The STI (Cash) reward amount included in the table represents 75% of the total reward amount for FY2013, which is payable in cash in July
2013. The STI (Share Based Payments) reward amount represents the current year expense in relation to the 25% component of the total reward amount that is deferred and released through equity. This component is recognised in the financial results over the performance and forfeiture periods, which together are referred to as the „service period‟. The service period commenced on 1 May 2012 and concludes on 15 April 2014.
(2) On 27 September 2012 the Company confirmed the previously announced intention of Mr Reitzer to retire as CEO in 2013. Mr Reitzer will step down as CEO effective 30 June 2013 and will cease employment with Metcash on 30 September 2013. In recognition of the Company‟s significant growth under his leadership and in accordance with his employment contract, Mr Reitzer will receive a cash payment of $2,029,801 equivalent to 12 months average base salary upon termination of employment on 30 September 2013.
(3) Mr Morrice was appointed as an Executive Director on 1 March 2013 and will become the CEO effective 30 June 2013. The Company has agreed to provide Mr Morrice with reasonable relocation and rental assistance. Included in Other benefits are payments made during FY 2013 for relocation and rental expenses amounting to $900 and $29,907 respectively.
(4) Discretionary payment awarded in relation to the achievement of specific objectives by Mr Morabito in FY2012 and represents a payment approved in July 2012.
(5) Includes a discretionary bonus payment of $96,020 awarded in relation to the achievement of specific objectives by Mr Collins in FY2012 and represents a payment approved in July 2012.
(6) This includes the movement in long service leave entitlement. Negative figures represent long service leave utilised in excess of current year entitlement accrued.
For
per
sona
l use
onl
y

METCASH FINANCIAL REPORT 2013
DIRECTORS’ REPORT
Year ended 30 April 2013
32
10. REMUNERATION TABLES (AUDITED) (Continued)
2012
Fixed Remuneration
$ STI $
Termination benefits
$
Other benefits
$
Post Employment
benefits – superannuation
$
LTI and Leave
$
LTI (Share based
payments) $
Total $
Performance Related
Share Based
Payments
CEO
A Reitzer 2,134,928 600,000 - 3,546 15,679 (1,633,256)1 - 1,120,897 (95.2%)
1 0.0%
Executives
A Gratwicke 709,302 227,052 - 42,695 15,679 (9,196) 67,568 1,053,100 25.6% 6.4%
S Morabito 852,966 124,620 - - 15,679 48,048 54,844 1,096,157 16.4% 5.0%
F Collins 537,731 259,255 - 36,984 15,679 64,0842 (18,552) 895,181 32.8% (2.1%)
M Laidlaw 516,103 249,482 - - 15,679 14,445 62,070 857,779 36.3% 7.2%
Total 4,751,030 1,460,409 - 83,225 78,395 (1,515,875) 165,930 5,023,114 (0.3%) 3.3%
(1) The probability of Mr Reitzer‟s cash based LTI (refer section 8) vesting at the end of the performance period is assessed at each reporting date. Where the pro rata valuation of the cash incentive is assessed as being less than the cumulative amount previously recognised as an expense the cumulative amount payable is reduced. The 2012 valuation result was that the underlying EPS performance hurdle was unlikely to be met, which resulted in the reversal of the $1,666,666 previously recognised as an expense.
(2) This amount includes an accrual of $52,644 in relation to the 2007 Cash LTI plan. In accordance with the Accounting Standards an accrual for the LTI of $200,000 was also made for each of the 2008, 2009, 2010 and 2011 financial years. The total amount payable to Mr Collins in July 2012 under the 2007 LTI plan was therefore $852,644.
For
per
sona
l use
onl
y

METCASH FINANCIAL REPORT 2013
DIRECTORS’ REPORT
Year ended 30 April 2013
33
10. REMUNERATION TABLES (AUDITED) (Continued)
Name
Value of Options exercised during the year
Value of Options lapsed during the
year
2013 $
2012 $
2013 $
2012 $
Non Executive Director
E Jankelowitz - - - 13,858
Chief Executive Officer
A Reitzer - - - 102,336
Executives
I Morrice - - - -
A Gratwicke - 949 - -
S Morabito - 3,491 - -
F Collins - 4,745 - -
M Laidlaw - - - 9,745
11. DIRECTORS AND KEY MANAGEMENT PERSONNEL SHARE AND OPTION HOLDINGS (AUDITED)
For details of shares, performance rights and share options held by KMP, refer to Note 26 in the annual financial statements.
For
per
sona
l use
onl
y

METCASH FINANCIAL REPORT 2013
DIRECTORS’ REPORT
Year ended 30 April 2013
34
12. NON-EXECUTIVE DIRECTORS (AUDITED)
Policy
The objectives of Metcash‟s policy regarding fees for non-executive directors are to:
Safeguard independence - To preserve the independence of non-executive directors, fees do not include any
performance-related element; and
Be market competitive - Fees are set at a level competitive with non-executive directors in the ASX 100 and take
into account the time commitment of overseeing the large and diverse business of the Metcash Group.
To align individual interests with shareholders‟ interests, non-executive directors are encouraged to hold Metcash shares. Non-executive directors fund their own share purchases. All non-executive directors must comply with Metcash‟s share trading policy.
Review of levels of remuneration
Non-executive directors‟ remuneration is within an aggregate limit determined, from time to time, by members at a general meeting. The current limit of $1,600,000 was agreed by members at the Annual General Meeting held on 30 August 2012. The Remuneration Committee has responsibility for reviewing and recommending the level of remuneration for non-executive directors. External professional advice is sought before any changes are made to the amount paid to non-executive directors within the overall maximum amount approved by shareholders. Structure
Non-executive director remuneration, except for certain legacy entitlements as detailed below, is structured as follows:
All non-executive directors are paid an annual fixed fee;
Non-executive directors also performing chairperson or committee duties are paid an additional fixed fee for each role;
Non-executive directors are not entitled to participate in any of the Group‟s short or long term incentive schemes; and
No additional benefits are paid to non-executive directors upon retirement from office
Current per annum fixed fee structure
The current per annum fee structure is set out in the following table. These fee levels are within the aggregate limit approved by members and took effect from the 30 August 2012 Annual General Meeting.
Table 12.1 Non Executive Director Fee Structure
Name Base Fee
$ Chair Fee
$
Committee Fee
$
Super- annuation
$ Total
$
P Barnes 118,450 172,500 11,845 16,470 319,265
N Hamilton 118,450 28,840 - 13,256 160,546
M Butler1 118,450 28,840 - 13,256 160,546
P Allaway 118,450 - 11,845 11,727 142,022
F Balfour 118,450 - 11,845 11,727 142,022
E Jankelowitz 118,450 - - 10,661 129,111
I Morrice2 118,450 - 11,845 11,727 142,022
D Rubin 118,450 - 11,845 11,727 142,022 (1) Mr Butler was appointed the chairman of the audit committee on the retirement of Mr Longes on 30 August 2012. (2) Mr Morrice was appointed as an Executive Director on 1 March 2013 and therefore ceased to be a Non Executive Director on this date.
For
per
sona
l use
onl
y

METCASH FINANCIAL REPORT 2013
DIRECTORS’ REPORT
Year ended 30 April 2013
35
12. NON-EXECUTIVE DIRECTORS (AUDITED) (Continued)
Non-Executive Directors’ Remuneration for 2013
The fees paid or payable to non-executive directors in relation to the 2013 financial year are set out in the following table. The general increase in amounts paid reflects the full year effect of the changes made following the aggregate fee limit increase that was approved at the 30 August 2012 Annual General Meeting and, for certain directors, changes in roles (including appointment as a director and appointment/cessation of chairperson/committee memberships).
Table 12.2 Non-Executive Director Remuneration
Name Financial
Year
Fixed
Fees1
$
Post Employment
(Superannuation)2
$ Total
$
Other
$
P Barnes 2013 301,070 16,872 317,942 N/A
2012 299,000 15,199 314,199 N/A
N Hamilton 2013 145,017 13,052 158,069 N/A
2012 138,000 12,420 150,420 N/A
M Butler 2013 142,175 12,796 154,971 N/A
2012 126,500 11,385 137,885 N/A
R Longes3 2013 35,750 3,218 38,968 211,619
2012 143,000 12,870 155,870 N/A
P Allaway4 2013 52,315 4,708 57,023 N/A
2012 - - - -
F Balfour 2013 129,346 11,641 140,987 N/A
2012 126,500 11,385 137,885 N/A
E Jankelowitz 2013 117,587 10,583 128,170 N/A
2012 115,000 10,350 125,350 N/A
I Morrice5 2013 91,465 8,232 99,697 N/A
2012 - - - -
D Rubin 2013 129,346 11,641 140,987 N/A
2012 126,500 11,385 137,885 N/A
Total 2013 1,144,071 92,743 1,236,814 211,619
2012 1,074,500 84,994 1,159,494 N/A
(1) Fixed fees represent base director fees, chairperson and committee fees. Directors fees that are salary sacrificed are included in this amount. (2) Post employment benefits comprise statutory superannuation obligations. (3) Mr Longes retired from the Board of Directors on 30 August 2012 and was entitled to a retirement benefit as noted below. (4) Mr Allaway was appointed as a Non-executive Director on 7 November 2012. (5) Mr Morrice was appointed as an Executive Director on 1 March 2013 and therefore ceased to be a Non Executive Director on this date.
Legacy entitlements
Metcash previously operated a retirement benefit scheme for non-executive directors, which was discontinued at the 2005 Annual General Meeting. The benefits were in accordance with Section 8.3(g) and (h) of the Company‟s Constitution and Section 200 of the Corporations Law. The accrued retirement benefits were frozen as at the date of the 2005 Annual General Meeting. These benefits, which are inclusive of superannuation, are payable to the following directors in cash upon ceasing to be a director of Metcash Limited. Retirement benefit (fixed) $
P Barnes 211,619
On 30 August 2012, Mr Longes retired from the Board of Directors and in accordance with the above provisions, was paid a retirement benefit of $211,619.
This concludes the remuneration report.
For
per
sona
l use
onl
y
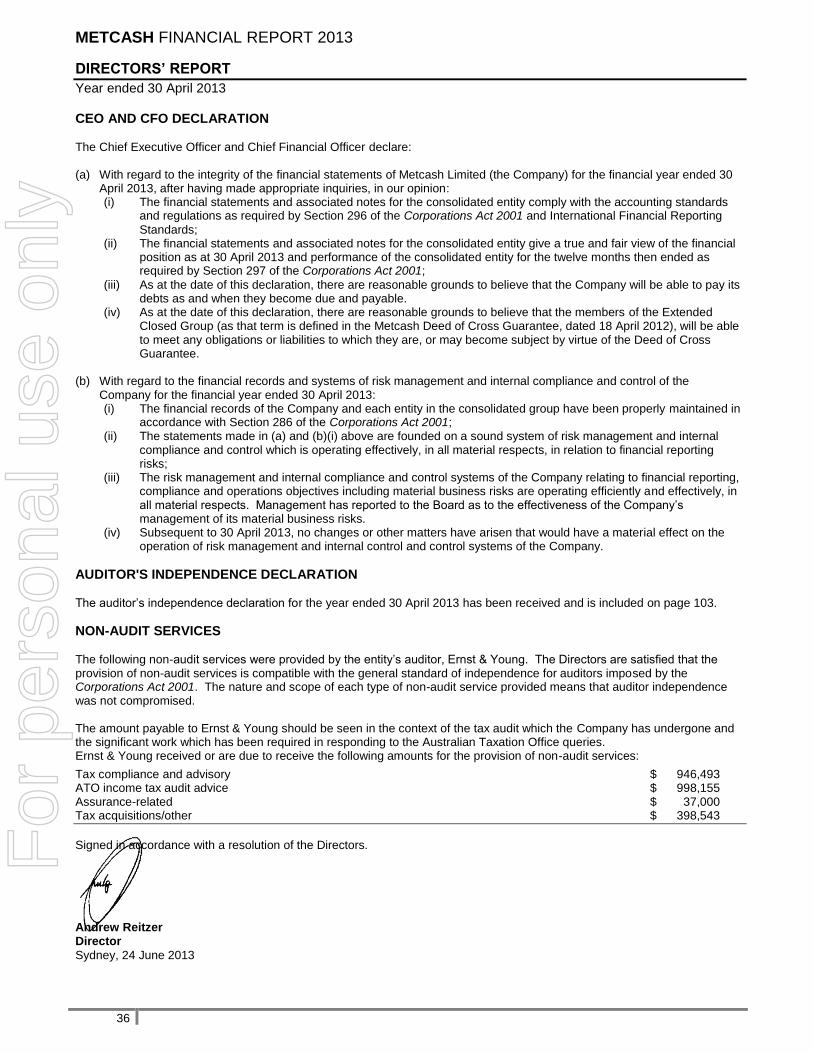
METCASH FINANCIAL REPORT 2013
DIRECTORS’ REPORT
Year ended 30 April 2013
36
CEO AND CFO DECLARATION The Chief Executive Officer and Chief Financial Officer declare: (a) With regard to the integrity of the financial statements of Metcash Limited (the Company) for the financial year ended 30
April 2013, after having made appropriate inquiries, in our opinion: (i) The financial statements and associated notes for the consolidated entity comply with the accounting standards
and regulations as required by Section 296 of the Corporations Act 2001 and International Financial Reporting
Standards; (ii) The financial statements and associated notes for the consolidated entity give a true and fair view of the financial
position as at 30 April 2013 and performance of the consolidated entity for the twelve months then ended as required by Section 297 of the Corporations Act 2001;
(iii) As at the date of this declaration, there are reasonable grounds to believe that the Company will be able to pay its debts as and when they become due and payable.
(iv) As at the date of this declaration, there are reasonable grounds to believe that the members of the Extended Closed Group (as that term is defined in the Metcash Deed of Cross Guarantee, dated 18 April 2012), will be able to meet any obligations or liabilities to which they are, or may become subject by virtue of the Deed of Cross Guarantee.
(b) With regard to the financial records and systems of risk management and internal compliance and control of the
Company for the financial year ended 30 April 2013: (i) The financial records of the Company and each entity in the consolidated group have been properly maintained in
accordance with Section 286 of the Corporations Act 2001; (ii) The statements made in (a) and (b)(i) above are founded on a sound system of risk management and internal
compliance and control which is operating effectively, in all material respects, in relation to financial reporting risks;
(iii) The risk management and internal compliance and control systems of the Company relating to financial reporting, compliance and operations objectives including material business risks are operating efficiently and effectively, in all material respects. Management has reported to the Board as to the effectiveness of the Company‟s management of its material business risks.
(iv) Subsequent to 30 April 2013, no changes or other matters have arisen that would have a material effect on the operation of risk management and internal control and control systems of the Company.
AUDITOR'S INDEPENDENCE DECLARATION The auditor‟s independence declaration for the year ended 30 April 2013 has been received and is included on page 103.
NON-AUDIT SERVICES The following non-audit services were provided by the entity‟s auditor, Ernst & Young. The Directors are satisfied that the provision of non-audit services is compatible with the general standard of independence for auditors imposed by the Corporations Act 2001. The nature and scope of each type of non-audit service provided means that auditor independence was not compromised. The amount payable to Ernst & Young should be seen in the context of the tax audit which the Company has undergone and the significant work which has been required in responding to the Australian Taxation Office queries. Ernst & Young received or are due to receive the following amounts for the provision of non-audit services:
Tax compliance and advisory $ 946,493 ATO income tax audit advice $ 998,155 Assurance-related $ 37,000 Tax acquisitions/other $ 398,543
Signed in accordance with a resolution of the Directors. Andrew Reitzer Director
Sydney, 24 June 2013
For
per
sona
l use
onl
y
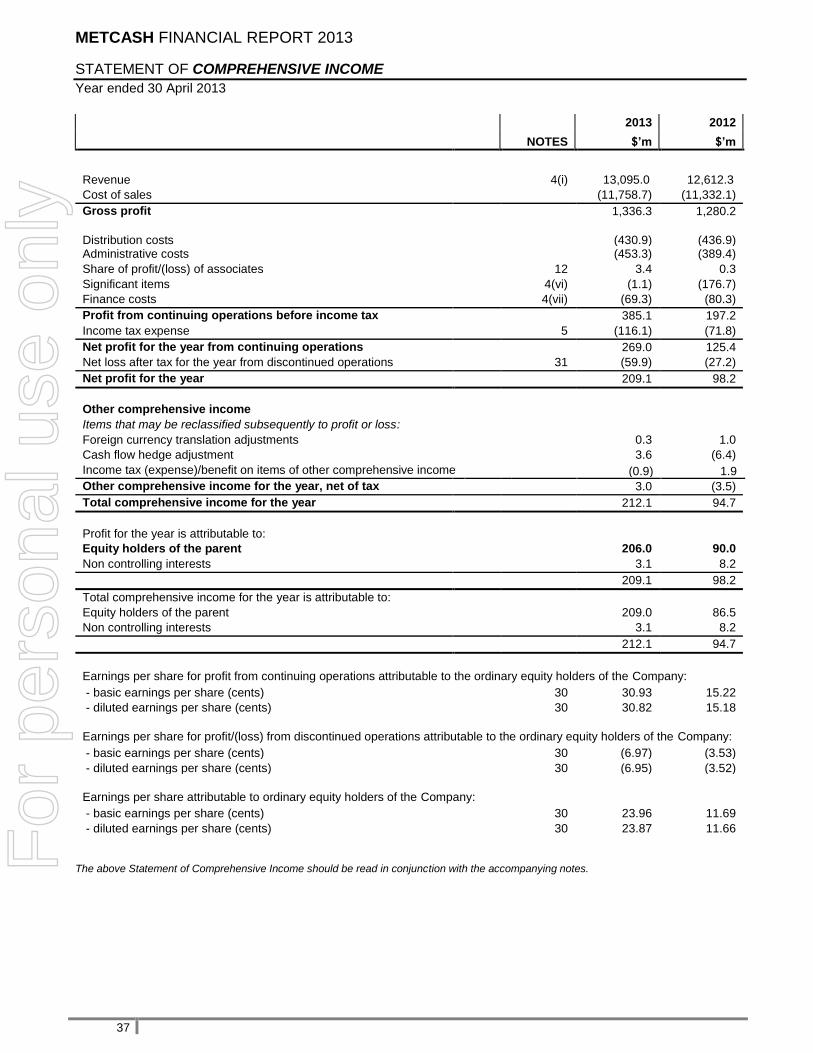
METCASH FINANCIAL REPORT 2013
STATEMENT OF COMPREHENSIVE INCOME
Year ended 30 April 2013
37
2013 2012 NOTES $’m $’m
Revenue 4(i) 13,095.0 12,612.3
Cost of sales (11,758.7) (11,332.1)
Gross profit 1,336.3 1,280.2
Distribution costs
(430.9)
(436.9)
Administrative costs (453.3) (389.4)
Share of profit/(loss) of associates 12 3.4 0.3
Significant items 4(vi) (1.1) (176.7)
Finance costs 4(vii) (69.3) (80.3)
Profit from continuing operations before income tax 385.1 197.2
Income tax expense 5 (116.1) (71.8)
Net profit for the year from continuing operations 269.0 125.4
Net loss after tax for the year from discontinued operations 31 (59.9) (27.2)
Net profit for the year 209.1 98.2
Other comprehensive income
Items that may be reclassified subsequently to profit or loss:
Foreign currency translation adjustments 0.3 1.0
Cash flow hedge adjustment 3.6 (6.4)
Income tax (expense)/benefit on items of other comprehensive income (0.9) 1.9
Other comprehensive income for the year, net of tax 3.0 (3.5)
Total comprehensive income for the year 212.1 94.7
Profit for the year is attributable to:
Equity holders of the parent 206.0 90.0
Non controlling interests 3.1 8.2
209.1 98.2
Total comprehensive income for the year is attributable to:
Equity holders of the parent 209.0 86.5
Non controlling interests 3.1 8.2
212.1 94.7
Earnings per share for profit from continuing operations attributable to the ordinary equity holders of the Company:
- basic earnings per share (cents) 30 30.93 15.22
- diluted earnings per share (cents) 30 30.82 15.18
Earnings per share for profit/(loss) from discontinued operations attributable to the ordinary equity holders of the Company:
- basic earnings per share (cents) 30 (6.97) (3.53)
- diluted earnings per share (cents) 30 (6.95) (3.52)
Earnings per share attributable to ordinary equity holders of the Company:
- basic earnings per share (cents) 30 23.96 11.69
- diluted earnings per share (cents) 30 23.87 11.66
The above Statement of Comprehensive Income should be read in conjunction with the accompanying notes.For
per
sona
l use
onl
y
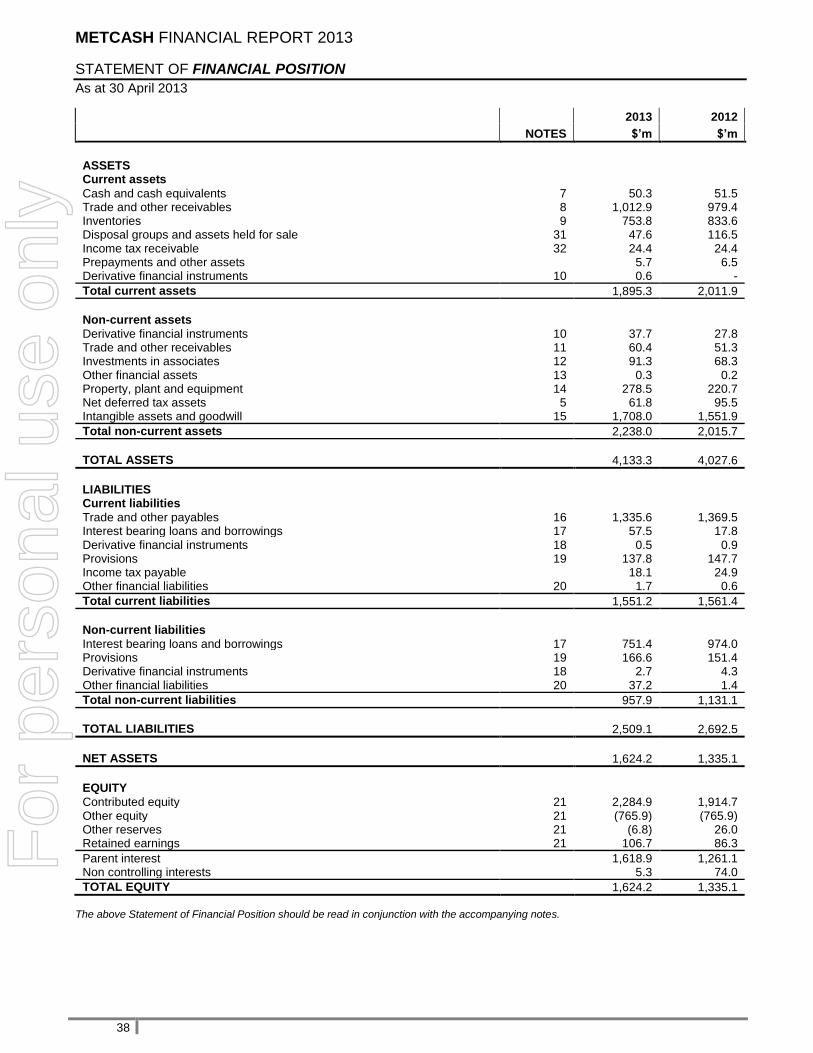
METCASH FINANCIAL REPORT 2013
STATEMENT OF FINANCIAL POSITION
As at 30 April 2013
38
2013 2012
NOTES $’m $’m
ASSETS Current assets Cash and cash equivalents 7 50.3 51.5 Trade and other receivables 8 1,012.9 979.4 Inventories 9 753.8 833.6 Disposal groups and assets held for sale 31 47.6 116.5 Income tax receivable 32 24.4 24.4 Prepayments and other assets 5.7 6.5 Derivative financial instruments 10 0.6 -
Total current assets 1,895.3 2,011.9
Non-current assets Derivative financial instruments 10 37.7 27.8 Trade and other receivables 11 60.4 51.3 Investments in associates 12 91.3 68.3 Other financial assets 13 0.3 0.2 Property, plant and equipment 14 278.5 220.7 Net deferred tax assets 5 61.8 95.5 Intangible assets and goodwill 15 1,708.0 1,551.9
Total non-current assets 2,238.0 2,015.7
TOTAL ASSETS 4,133.3 4,027.6
LIABILITIES Current liabilities Trade and other payables 16 1,335.6 1,369.5 Interest bearing loans and borrowings 17 57.5 17.8 Derivative financial instruments 18 0.5 0.9 Provisions 19 137.8 147.7 Income tax payable 18.1 24.9 Other financial liabilities 20 1.7 0.6
Total current liabilities 1,551.2 1,561.4
Non-current liabilities Interest bearing loans and borrowings 17 751.4 974.0 Provisions 19 166.6 151.4 Derivative financial instruments 18 2.7 4.3 Other financial liabilities 20 37.2 1.4
Total non-current liabilities 957.9 1,131.1
TOTAL LIABILITIES 2,509.1 2,692.5
NET ASSETS 1,624.2 1,335.1
EQUITY Contributed equity 21 2,284.9 1,914.7 Other equity 21 (765.9) (765.9) Other reserves 21 (6.8) 26.0 Retained earnings 21 106.7 86.3
Parent interest 1,618.9 1,261.1 Non controlling interests 5.3 74.0
TOTAL EQUITY 1,624.2 1,335.1
The above Statement of Financial Position should be read in conjunction with the accompanying notes.
For
per
sona
l use
onl
y

METCASH FINANCIAL REPORT 2013
STATEMENT OF CHANGES IN EQUITY
Year ended 30 April 2013
39
Contributed Equity
Other Equity
Share-based
Payments Reserve
Retained Earnings
Capital Reserve
Foreign Currency
Translation Reserve
Cash Flow Hedge
Reserve
Owners of the Parent
Non Controlling
Interest Total Equity
$’m $’m $’m $’m $’m $’m $’m $’m $’m $’m
At 1 May 2012 1,914.7 (765.9) 23.6 86.3 12.8 (5.9) (4.5) 1,261.1 74.0 1,335.1 Total comprehensive income, net of tax - - - 206.0 - 0.3 2.7 209.0 3.1 212.1 Transactions with owners in their capacity as owners: Proceeds from equity raising 375.0 - - - - - - 375.0 - 375.0
Share issue costs net of tax (4.8) - - - - - - (4.8) - (4.8) Acquisition of 49.9% equity interest in Mitre 10 Group - - - - 22.1 - - 22.1 (70.0) (47.9)
Share-based payments - - 0.4 - - - - 0.4 - 0.4 Dividends paid - - - (243.9) - - - (243.9) (1.8) (245.7)
Transfers - - (23.4) 58.3 (34.9) - - - - -
At 30 April 2013 2,284.9 (765.9) 0.6 106.7 - (5.6) (1.8) 1,618.9 5.3 1,624.2
At 1 May 2011 1,904.9 (765.9) 22.3 208.0 12.8 (6.9) - 1,375.2 67.6 1,442.8
Total comprehensive income, net of tax - - - 90.0 - 1.0 (4.5) 86.5 8.2 94.7 Transactions with owners in their capacity as owners:
Exercise of options 9.8 - - - - - - 9.8 - 9.8 Share-based payments - - 1.3 - - - - 1.3 - 1.3 Dividends paid - - - (211.7) - - - (211.7) (1.8) (213.5) At 30 April 2012 1,914.7 (765.9) 23.6 86.3 12.8 (5.9) (4.5) 1,261.1 74.0 1,335.1
Note 21 21 21 21 21 21 21
The above Statement of Changes in Equity should be read in conjunction with the accompanying notes.
For
per
sona
l use
onl
y

METCASH FINANCIAL REPORT 2013
STATEMENT OF CASH FLOWS
Year ended 30 April 2013
40
2013 2012
NOTES $’m $’m
Cash flows from operating activities Receipts from customers 14,180.6 13,713.6 Payments to suppliers and employees (13,510.7) (12,994.5) Dividends received 0.6 1.1 Interest received 7.7 12.7 Finance costs (58.5) (76.9) Income tax paid, net of tax refunds (51.3) (110.3) Goods and services tax paid (268.6) (261.4) Net cash generated by operating activities 7 299.8 284.3
Cash flows from investing activities Proceeds from sale of property, plant and equipment 22.3 7.1 Purchase of property, plant and equipment (83.7) (75.9) Payments for intangibles (49.1) (17.9) Proceeds from sale of discontinued operations 58.3 - Proceeds from sale of business assets 23.9 23.5 Payment on acquisition of businesses net of cash acquired 29(a) (107.4) (205.5) Costs paid on acquisition of businesses (2.6) - Recovery of acquisition costs from ACCC 3.5 - Payment on acquisition of associates (16.6) (1.6) Proceeds from loans repaid by other entities 29.7 18.0 Loans to other entities (57.2) (18.3) Net cash used in investing activities (178.9) (270.6)
Cash flows from financing activities: Proceeds from the issue of ordinary shares 21 375.0 9.8 Share issue costs 21 (6.8) - Payment on acquisition of non controlling interest 21(b) (47.9) - Payment of refinancing costs - (3.4) Proceeds from borrowings – other 4,775.0 3,973.1 Repayments of borrowings – other (4,994.5) (3,872.3) Payment of dividends on ordinary shares 6 (243.9) (211.7) Payment of dividends to non controlling interests (1.8) (1.8) Repayment of finance lease principal (7.0) (9.2) Net cash used in financing activities (151.9) (115.5)
Net decrease in cash and cash equivalents (31.0) (101.8) Add opening cash brought forward 51.5 152.9 Effect of exchange rate changes on cash - 0.4 Cash and cash equivalents at the end of the year 7 20.5 51.5
The above Statement of Cash Flows should be read in conjunction with the accompanying notes.
For
per
sona
l use
onl
y

METCASH FINANCIAL REPORT 2013
NOTES TO THE FINANCIAL STATEMENTS
Year ended 30 April 2013
41
1. CORPORATE INFORMATION
The financial statements of Metcash Limited (the Company) and its controlled entities (the Group) for the year ended 30 April 2013 was authorised for issue in accordance with a resolution of the Directors on 24 June 2013. Metcash Limited is a for profit company limited by ordinary shares incorporated in Australia whose shares are publicly traded on the Australian Securities Exchange. The nature of the operations and principal activities of the Group are described in the Directors‟ Report.
2. SUMMARY OF SIGNIFICANT ACCOUNTING POLICIES
(i) BASIS OF ACCOUNTING
The financial statements are a general purpose financial report that has been prepared in accordance with the requirements of the Corporations Act 2001 and Australian Accounting Standards and other authoritative pronouncements of the Australian Accounting Standards Board. The financial statements have been prepared using the historical cost basis except for derivative financial instruments which have been measured at fair value and share rights which have been valued using options pricing models. The financial statements are presented in Australian dollars and all values are rounded to the nearest $100,000 unless otherwise stated under the option available to the Company under ASIC Class Order 98/100. The Company is an entity to which the Class Order applies. The financial statements present the results of the current year, which comprised the 52 week period that commenced on 30 April 2012 and ended on 28 April 2013. The prior year results comprise a 52 week period that commenced on 2 May 2011 and ended on 29 April 2012.
(ii) STATEMENT OF COMPLIANCE
The financial statements comply with Australian Accounting Standards. The financial statements also comply with International Financial Reporting Standards (IFRS). (a) Changes in accounting policy
(i) The accounting policies adopted are consistent with those of the previous financial year. (ii) The Group has adopted all new and amended Australian Accounting Standards and AASB Interpretations that became
applicable during the current financial year. The adoption of these Standards and Interpretations has not had a material effect on any of the amounts recognised in the current year or any prior year and are not likely to have a material effect on future reporting periods.
For
per
sona
l use
onl
y

METCASH FINANCIAL REPORT 2013
NOTES TO THE FINANCIAL STATEMENTS
Year ended 30 April 2013
42
2. SUMMARY OF SIGNIFICANT ACCOUNTING POLICIES (Continued) (b) Australian Accounting Standards issued but not yet effective/Early adoption of Australian Accounting
Standards
A number of new accounting standards have been issued but were not effective during the year ended 30 April 2013. The Group has elected not to early adopt any of these new standards or amendments in these financial statements. AASB 10 Consolidated Financial Statements (applicable to the Group from the financial year ending 30 April 2014) broadens the situations where an entity is likely to be considered to control another entity and includes new guidance for determining control of an entity. Based on investments held by the Group at 30 April 2013, the Standard is not expected to have a significant impact on the entities that are currently consolidated or equity accounted in the year of initial application. AASB 11 Joint Arrangements (applicable to the Group from the financial year ending 30 April 2014) uses the principle of control in AASB 10 to define joint control and removes the option to choose to account for jointly controlled entities using the proportionate consolidation method or the equity method. This Standard is not expected to have a significant impact on the Group‟s financial results and balance sheet in the year of initial application as the Group will continue to equity account for investments in associates and joint ventures. AASB 12 Disclosure of Interests in Other Entities (applicable to the Group from the financial year ending 30 April 2014) introduces new disclosures about judgements made by management in determining whether control exists, and requires summarised information about joint arrangements, associates, structured entities and subsidiaries with external non-controlling interests. Based on investments held by the Group at 30 April 2013, this standard is not expected to have any impact on the Group‟s financial results and balance sheet in the year of initial application. AASB 13 Fair Value Measurement (applicable to the Group from the financial year ending 30 April 2014) establishes a single source of guidance for determining the fair value of assets and liabilities. This Standard is not expected to have a significant impact on the Group‟s financial results and disclosures in the year of initial application. Except for the above, the Group has yet to fully assess the impact the following accounting standards and amendments to accounting standards will have on the financial statements, when applied in future periods:
AASB 9: Financial Instruments;
AASB 2011-3: Amendments to Australian Accounting Standard - Improvements to AASB 1049;
AASB 2011-7: Amendments to Australian Accounting Standards arising from the Consolidation and Joint Arrangements Standards [AASB 1, 2, 3, 5, 7, 9, 2009-11, 101, 107, 112, 118, 121, 124, 132, 133, 136, 138, 139, 1023 & 1038 and Interpretations 5, 9, 16 & 17];
AASB 2011-8: Amendments to Australian Accounting Standards arising from AASB 13 (September 2011) [AASB 1,2, 3, 4, 5, 7, 9, 2009-11, 2010-7, 101, 102, 108, 110, 116, 117, 118,119, 120, 121, 128, 131, 132, 133, 134, 136, 138, 139, 140, 141, 1004, 1023 & 1038 and Interpretations 2, 4, 12 13, 14, 17, 19, 131 & 132];
AASB 119: Employee Benefits;
AASB 2012-2: Amendments to Australian Accounting Standards – Disclosures – Offsetting Financial Assets and Financial Liabilities;
AASB 2011-4: Amendments to Australian Accounting Standards to Remove Individual Key Management Personnel Disclosure Requirements;
AASB 2012-3: Amendments to Australian Accounting Standards – Offsetting Financial Assets and Financial Liabilities; and
AASB 2010-7: Amendments to Australian Accounting Standards arising from AASB 9 (December 2010) [AASB 1, 3, 4, 5, 7, 101, 102, 108, 112, 118, 120, 121, 127, 128, 131, 132, 136, 137, 139, 1023 & 1038 and Interpretations 2, 5, 10, 12, 19 & 127].
For
per
sona
l use
onl
y

METCASH FINANCIAL REPORT 2013
NOTES TO THE FINANCIAL STATEMENTS
Year ended 30 April 2013
43
2. SUMMARY OF SIGNIFICANT ACCOUNTING POLICIES (Continued)
(iii) BASIS OF CONSOLIDATION
The financial statements comprise the consolidated financial statements of Metcash Limited and its controlled entities as at 30 April 2013.
The financial statements of controlled entities are prepared for the same reporting period as the parent entity, using consistent accounting policies. Controlled entities are all those entities over which the Group has the power to govern the financial and operating policies so as to obtain benefits from their activities. Controlled entities are consolidated from the date on which control is transferred to the Group and cease to be consolidated from the date on which control is transferred out of the Group.
In preparing the consolidated financial statements, all intercompany balances and transactions have been eliminated in full. Investments in controlled entities held by Metcash Limited are accounted for at cost in the separate financial statements of the parent entity less any impairment charges. Dividends received from controlled entities are recorded as a component of other revenues in the separate income statement of the parent entity, and do not impact the recorded cost of the investment. The acquisition of controlled entities is accounted for using the purchase method of accounting. The purchase method of accounting involves allocating the costs of the business combination to the fair value of the assets acquired and the liabilities and contingent liabilities assumed at the date of acquisition. The difference between the above items and the fair value of the consideration (including the fair value of any pre-existing investment in the acquiree) is goodwill or a discount on acquisition. Arrangements within certain business combinations entitle the non-controlling interests to require the Group to acquire their shareholding via exercise of a put option, subject to specific terms and conditions. Where such an arrangement is deemed to be part of the business combination a financial liability is recognised on the acquisition date measured at the present value of the redemption amount under the arrangement. Any contingent consideration to be transferred by the acquirer will be recognised at fair value at the acquisition date. Subsequent changes to the fair value of the contingent consideration that is deemed to be an asset or liability will be recognised in accordance with AASB 139 either in profit or loss or as a change to other comprehensive income. Non-controlling interests are allocated their share of net profit after tax in the statement of comprehensive income and are presented within equity in the statement of financial position, separately from the parent shareholders' equity. For those controlled entities with non-coterminous year ends, management accounts for the relevant period to the Group‟s reporting date have been consolidated. In the opinion of the Directors, the expense of providing additional coterminous statutory accounts, together with consequential delay in producing the Group‟s financial statements, would outweigh any benefit to shareholders.
(iv) REVERSE ACQUISITION
In accordance with AASB 3 Business Combinations, in 2005 when Metcash Limited (the legal parent) acquired the Metoz group (being Metoz Holdings Limited and its controlled entities including Metcash Trading Limited (the legal subsidiary)), the acquisition was deemed to be a reverse acquisition. The consolidated financial statements are issued under the name of the legal parent (Metcash Limited) but are a continuation of the financial statements of the deemed acquirer under the reverse acquisition rules (Metcash Trading Limited).
(v) SIGNIFICANT ACCOUNTING JUDGEMENTS, ESTIMATES AND ASSUMPTIONS
(a) Significant accounting judgements
In the process of applying the Group‟s accounting policies, the following judgements were made, apart from those involving estimations, which have a significant effect on the amounts recognised in the financial statements: Purchase price allocation
Determining the acquisition date fair value of assets acquired and liabilities assumed on acquisition of controlled entities. The basis for determining the purchase price allocation is discussed in Note 29. Contractual customer relationships
Identifying those acquired relationships with customers that meet the definition of separately identifiable intangibles that have a finite life.
For
per
sona
l use
onl
y
METCASH FINANCIAL REPORT 2013
NOTES TO THE FINANCIAL STATEMENTS
Year ended 30 April 2013
44
2. SUMMARY OF SIGNIFICANT ACCOUNTING POLICIES (Continued)
(v) SIGNIFICANT ACCOUNTING JUDGEMENTS, ESTIMATES AND ASSUMPTIONS (Continued)
(b) Significant accounting estimates and assumptions
The carrying amounts of certain assets and liabilities are often determined based on estimates and assumptions of future events. The key estimates and assumptions that have a significant risk of causing a material adjustment to the carrying amounts of certain assets and liabilities within the next annual reporting period are: Provision for restructuring The Group has recognised a provision in accordance with the accounting policy described in Note 2(xxi). The Group has made assumptions in relation to the cost of employee redundancies and the costs associated with the early exit of stores earmarked for closure. Provision for rental subsidy
The Group recognises provisions for rental agreements where the arrangements are estimated to be „onerous‟ to the Group (Refer Note 19(b)(i) for further discussion). In measuring these provisions, assumptions are made about future sales of retail customers, future rental costs and in determining the appropriate discount rate to be used in the cash flow calculations. Impairment of goodwill
The Group determines whether goodwill is impaired on an annual basis. This requires an estimation of the recoverable amount of the cash generating units to which the goodwill is allocated. The assumptions used in this estimation of the recoverable amount and the carrying amount of goodwill are discussed in Note 15. Impairment of investment in associates The Group assesses the recoverable amount of its investment in associates when an indicator of impairment is identified. In assessing the recoverable amount assumptions are made about the growth prospects of the associate and in determining the discount rate used to calculate the net present value of future cash flows when a discounted cash flow model is used. These assumptions are discussed in Note 12. Contractual customer relationships The useful life of contractual customer relationships of between 5 to 25 years is based on expected future attrition rates based on historical rates experienced. (vi) FOREIGN CURRENCY TRANSLATION
Translation of foreign currency transactions Both the functional and presentation currency of Metcash Limited and its Australian subsidiaries are Australian dollars ($). Transactions in foreign currencies are initially recorded in the functional currency at the exchange rate ruling at the date of the transaction. Monetary assets and liabilities denominated in foreign currencies are retranslated at the rate of exchange ruling at the reporting date. All exchange differences, other than those that arise as a result of translating foreign subsidiaries from functional currency to presentation currency are taken to profit or loss in the financial statements. Translation of financial statements of overseas operations
The functional currency of the overseas subsidiaries is as follows:
Tasman Liquor Company Limited is New Zealand dollars.
Metoz Holdings Limited is South African rand.
Soetensteeg 2–61 Exploitatiemaatschappij BV is euros. As at the reporting date the results of the overseas subsidiaries are translated into the presentation currency of Metcash Limited. Assets and liabilities are translated at the rate of exchange ruling at the reporting date whilst all elements contained within the statement of comprehensive income are translated at the weighted average exchange rate for the year. The exchange differences arising on the translation are taken directly to the foreign currency translation reserve. (vii) CASH AND CASH EQUIVALENTS
Cash comprises cash on hand and demand deposits. Cash equivalents are short-term, highly liquid investments that are readily convertible to known amounts of cash, which are subject to an insignificant risk of changes in value and have a maturity of three months or less at the date of acquisition.
For
per
sona
l use
onl
y

METCASH FINANCIAL REPORT 2013
NOTES TO THE FINANCIAL STATEMENTS
Year ended 30 April 2013
45
2. SUMMARY OF SIGNIFICANT ACCOUNTING POLICIES (Continued)
(viii) TRADE AND OTHER RECEIVABLES
Trade receivables are recognised and carried at original invoice amount less a provision for any uncollectable debts. An estimate for doubtful debts is made when collection of the full amount is no longer probable. Bad debts are written off as incurred. Trade receivables provided as security under the Group‟s securitisation facility as detailed in Note 8 are only de-recognised when the receivable is settled by the debtor as the Group retains the significant risks and rewards associated with these receivables until settlement is received. (ix) INVESTMENTS AND OTHER FINANCIAL ASSETS
All investments are initially recognised at cost, being the fair value of the consideration given. After initial recognition, investments which are classified as held for trading or available-for-sale are measured at fair value. Gains or losses on investments held for trading are recognised in the statement of comprehensive income. For investments that are actively traded in organised financial markets, fair value is determined by reference to Stock Exchange quoted market bid prices at the close of business on the relevant reporting date. (x) DERIVATIVE FINANCIAL INSTRUMENTS
The Group uses derivative financial instruments (including forward currency contracts and interest rate swaps) to hedge its risks associated with foreign currency and interest rate fluctuations. Such derivative financial instruments are initially recognised at fair value on the date at which a derivative contract is entered into and are subsequently remeasured to fair value. The fair value of derivative contracts is determined by reference to market values for similar instruments. Derivatives are carried as assets when their fair value is positive and as liabilities when their fair value is negative. The fair values of forward currency contracts are calculated by reference to current forward exchange rates for contracts with similar maturity profiles. The fair values of interest rate swaps are determined using a valuation technique based on cash flows discounted to present value using current market interest rates. Any gains or losses arising from changes in the fair value of derivatives, except for those that qualify as cash flow hedges, are taken directly to profit or loss for the year. For the purposes of hedge accounting, hedges are classified as:
fair value hedges, when they hedge the exposure to changes in the fair value of a recognised asset or liability; or
cash flow hedges, when they hedge the exposure to variability in cash flows that is attributable either to a particular risk associated with a recognised asset or liability or to a forecast transaction.
Hedges that meet the strict criteria for hedge accounting are accounted as follows:
for cash flow hedges the effective portion of the gain or loss on the hedging instrument is recognised directly in equity, while the ineffective portion is recognised in profit or loss.
for fair value hedges, the carrying amount of the hedged item is adjusted for gains and losses attributable to the risk being hedged and the derivative is remeasured to fair value. Gains and losses from both are taken to profit or loss.
Fair value hedges The change in the fair value of a hedging derivative is recognised in the income statement as finance costs. The change in the fair value of the hedged item attributable to the risk hedged is recorded as part of the carrying value of the hedged item and is also recognised in the income statement as finance costs. If the hedged item is derecognised, the unamortised fair value is recognised immediately in profit or loss. When an unrecognised firm commitment is designated as a hedged item, the subsequent cumulative change in the fair value of the firm commitment attributable to the hedged risk is recognised as an asset or liability with a corresponding gain or loss recognised in the profit and loss. Cash flow hedges The effective portion of the gain or loss on the hedging instrument is recognised directly in other comprehensive income in the cash flow hedge reserve, while any ineffective portion is recognised immediately in the income statement as finance costs.
For
per
sona
l use
onl
y

METCASH FINANCIAL REPORT 2013
NOTES TO THE FINANCIAL STATEMENTS
Year ended 30 April 2013
46
2. SUMMARY OF SIGNIFICANT ACCOUNTING POLICIES (Continued)
(x) DERIVATIVE FINANCIAL INSTRUMENTS (Continued)
The Group uses forward currency contracts as hedges of its exposure to foreign currency risk in forecast transactions and firm commitments. The ineffective portion relating to foreign currency contracts is recognised in finance costs. Refer to Note 18 for more details. Amounts recognised as other comprehensive income are transferred to profit or loss when the hedged transaction affects profit or loss, such as when the hedged financial income or financial expense is recognised or when a forecast sale occurs. When the hedged item is the cost of a non-financial asset or non-financial liability, the amounts recognised as other comprehensive income are transferred to the initial carrying amount of the non-financial asset or liability. If the forecast transaction or firm commitment is no longer expected to occur, the cumulative gain or loss previously recognised in equity is transferred to the income statement. If the hedging instrument expires or is sold, terminated or exercised without replacement or rollover, or if its designation as a hedge is revoked, any cumulative gain or loss previously recognised in other comprehensive income remains in other comprehensive income until the forecast transaction or firm commitment affects profit or loss. Current versus non-current classification Derivative instruments that are not designated as effective hedging instruments are classified as current or non-current or separated into current and non-current portions based on an assessment of the facts and circumstances including the underlying contracted cash flows. Derivative instruments that are designated as, and are effective hedging instruments, are classified consistently with the classification of the underlying hedged item. The derivative instrument is separated into a current portion and a non-current portion only if a reliable allocation can be made. (xi) INVESTMENT IN ASSOCIATES
The Group‟s investments in its associates are accounted for using the equity method of accounting in the financial statements. These are the entities in which the Group has significant influence and which are neither subsidiaries nor joint ventures. The investments in associates are carried in the statement of financial position at cost plus post-acquisition changes in the Group‟s share of net assets of the associate, less any impairment in value. Goodwill relating to an associate is included in the carrying amount of the investment and is not amortised. The statement of comprehensive income reflects the Group‟s share of the results of operations of the associates. Where there has been a change recognised directly in the associate‟s equity, the Group recognises its share of any changes and discloses this in the statement of changes in equity. (xii) INVENTORIES
Inventories are valued at the lower of cost or net realisable value. Costs incurred in bringing each product to its present location and condition are accounted for using the standard cost method. Cost is determined by deducting from the supplier‟s invoice price any purchase incentives, allowances, discounts and net marketing income.
Net realisable value is the estimated selling price in the ordinary course of business, less estimated costs of completion and the estimated costs necessary to make the sale. F
or p
erso
nal u
se o
nly

METCASH FINANCIAL REPORT 2013
NOTES TO THE FINANCIAL STATEMENTS
Year ended 30 April 2013
47
2. SUMMARY OF SIGNIFICANT ACCOUNTING POLICIES (Continued)
(xiii) PROPERTY, PLANT AND EQUIPMENT
Cost
All classes of property, plant and equipment are measured at cost less accumulated depreciation and any accumulated impairment losses.
Depreciation Depreciation is provided on a straight-line basis on all property, plant and equipment, other than freehold land and assets under construction.
Major depreciation periods are: 2013 2012
Freehold buildings 50 years 50 years Plant and equipment 5 – 15 years 5 – 15 years De-recognition
An item of property, plant and equipment is de-recognised upon disposal or when no future economic benefits are expected to arise from the continued use of the asset. Any gain or loss arising on de-recognition of the asset (calculated as the difference between the net disposal proceeds and the carrying amount of the item) is included in the statement of comprehensive income in the period the item is de-recognised. (xiv) IMPAIRMENT OF ASSETS
At each reporting date, the Group assesses whether there is any indication that the value of an asset may be impaired. Where an indicator of impairment exists, the Group makes a formal estimate of recoverable amount. Where the carrying amount of an asset exceeds its recoverable amount the asset is considered impaired and is written down to its recoverable amount. Recoverable amount is the greater of fair value less costs to sell and value in use. It is determined for an individual asset, unless the asset‟s value in use cannot be estimated to be close to its fair value less costs to sell and it does not generate cash inflows that are largely independent of those from other assets or groups of assets. In this case, the recoverable amount is determined for the cash-generating unit (CGU) to which the asset belongs. When the carrying amount of an asset or CGU exceeds its recoverable amount, the asset is considered impaired and is written down to its recoverable amount. In assessing value in use, the estimated future cash flows are discounted to their present value using a pre-tax discount rate that reflects current market assessments of the time value of money and the risks specific to the asset. Impairment losses are recognised in the statement of comprehensive income. Goodwill Goodwill is tested for impairment annually and when circumstances indicate that the carrying value may be impaired. Impairment is determined for goodwill by assessing the recoverable amount of each CGU (or group of CGUs) to which the goodwill relates. When the recoverable amount of the CGU is less than its carrying amount, an impairment loss is recognised. Impairment losses for goodwill are not subsequently reversed. Trade names Indefinite life trade name balances will be tested annually for impairment at the same time as goodwill is tested. Finite useful life trade names are tested for impairment when an indicator of impairment is identified. (xv) LEASES
Leases are classified at their inception as either operating or finance leases based on the economic substance of the agreement so as to reflect the risks and benefits incidental to ownership. Operating leases - Group as a lessee Operating leases are those leases where the lessor effectively retains substantially all of the risks and benefits of ownership of the leased item. Operating lease payments are recognised as an expense on a straight-line basis.
For
per
sona
l use
onl
y

METCASH FINANCIAL REPORT 2013
NOTES TO THE FINANCIAL STATEMENTS
Year ended 30 April 2013
48
2. SUMMARY OF SIGNIFICANT ACCOUNTING POLICIES (Continued) (xv) LEASES (Continued)
Operating leases - Group as a lessor Leases in which the Group retains substantially all the risks and benefits of the leased asset are classified as operating leases. Initial direct costs incurred in negotiating an operating lease are added to the carrying amount of the leased asset and recognised as an expense over the lease term on the same basis as rental income. Finance leases Leases that transfer to the Group substantially all the risks and benefits incidental to ownership of the leased item are capitalised at the inception of the lease at the lower of fair value of the leased property or the present value of the minimum lease payments. Capitalised leases are disclosed as property, plant and equipment under lease. A lease liability of equal value is also recognised. Minimum lease payments are apportioned between finance charges and a reduction of the lease liability so as to achieve a constant rate of interest on the remaining balance of the liability. Finance charges are charged directly against income. Capitalised lease assets are depreciated over the shorter of the assets estimated useful life and the lease term. The cost of improvements to or on leasehold property are capitalised, disclosed as leasehold improvements, and amortised over the shorter of the unexpired period of the lease or the estimated useful lives of the improvements. (xvi) GOODWILL
Goodwill acquired in a business combination is initially measured at cost; being the excess of the cost of the business combination over the Group‟s interest in the net fair value of the acquirer's identifiable assets, liabilities and contingent liabilities. Following initial recognition, goodwill is measured at cost less any accumulated impairment losses. Goodwill is not amortised. When goodwill forms part of a group of cash generating units and an operation within that unit is disposed of, the goodwill associated with the operation disposed of is included in the carrying amount of the operation when determining the gain or loss on disposal of the operation. Goodwill disposed of in this circumstance is measured based on the relative values of the operation disposed of and the portion of the groups of cash-generating units retained. (xvii) INTANGIBLE ASSETS
Intangible assets acquired separately or in a business combination are initially measured at cost. Following initial recognition, the cost model is applied to the class of intangible assets. The useful lives of these intangible assets are assessed to be either finite or indefinite. Where amortisation is charged on assets with finite lives, this expense is taken to the profit or loss on a straight-line basis. Intangible assets (excluding software development costs) created within the business are not capitalised and expenditure is charged against profits in the period in which the expenditure is incurred. Intangible assets with finite useful lives are tested for impairment where an indicator of impairment exists. Useful lives are also examined on an annual basis and adjustments, where applicable, are made on a prospective basis. Trade names are recognised as intangible assets where a registered trade mark is acquired with attributable value. Trade names are valued on a relief from royalty method. Trade names are considered to be indefinite life intangibles and are not amortised, unless there is an intention to discontinue use of the name in which case it is amortised over its estimated remaining useful life. Contractual customer relationships are recognised as intangible assets when the criteria specified in AASB 138 Intangible Assets have been met. Contractual customer relationships are assessed to have a finite life and are amortised over the
asset‟s useful life.
For
per
sona
l use
onl
y

METCASH FINANCIAL REPORT 2013
NOTES TO THE FINANCIAL STATEMENTS
Year ended 30 April 2013
49
2. SUMMARY OF SIGNIFICANT ACCOUNTING POLICIES (Continued) (xvii) INTANGIBLE ASSETS (Continued)
Liquor licenses and gaming licenses are valued at cost. They are considered to have an indefinite useful life. As a consequence, no amortisation is charged. They are tested for impairment annually and whenever an indication of impairment exists. Any impairment is recognised immediately in profit or loss. Software development costs incurred on an individual project are carried forward when future recoverability can reasonably be assured. Following the initial recognition of software development costs, the cost model is applied requiring the asset to be carried at cost less any accumulated amortisation and accumulated impairment losses. Any costs carried forward are amortised over the assets‟ useful economic lives. The carrying value of software development costs is reviewed for impairment annually when an asset is not in use or more frequently when an indicator of impairment arises during a reporting period indicating that the carrying value may not be recoverable. Gains or losses arising from de-recognition of an intangible asset are measured as the difference between the net disposal proceeds and the carrying amount of the asset and are recognised in the statement of comprehensive income when the asset is de-recognised. The estimated useful lives of existing finite life intangible assets are as follows: - Customer contracts – five to twenty five years; - Software development costs – five to ten years; and - Other – ten years. (xviii) TRADE AND OTHER PAYABLES
Trade payables and other payables are carried at amortised cost. They represent liabilities for goods and services provided to the Group prior to the end of the financial year that are unpaid and arise when the Group becomes obliged to make future payments in respect of the purchase of these goods and services. (xix) EMPLOYEE LEAVE BENEFITS
Wages, salaries, annual leave and sick leave
Liabilities for wages and salaries, including non-monetary benefits, annual leave and accumulating sick leave, are recognised in provisions in respect of employees‟ services up to the reporting date. They are measured at the amounts expected to be paid when the liabilities are settled. Liabilities expected to be settled within 12 months of the reporting date are classified as current liabilities and those expected to be settled after 12 months of the reporting date are classified as non-current liabilities. Liabilities for non-accumulating sick leave are recognised when the leave is taken and are measured at the rates paid or payable.
Long service leave The liability for long service leave is recognised in the provision for employee benefits and measured as the present value of expected future payments to be made in respect of services provided by employees up to the reporting date using the projected unit credit method. Consideration is given to expected future wage and salary levels, experience of employee departures, and periods of service. Expected future payments are discounted using market yields at the reporting date on national government bonds with terms to maturity that match as closely as possible, the estimated future cash outflows.
(xx) INTEREST-BEARING LOANS AND BORROWINGS
All loans and borrowings are initially recognised at the fair value of the consideration received net of issue costs associated with the borrowing.
After initial recognition, interest-bearing loans and borrowings are subsequently measured at amortised cost using the effective interest method.
Gains and losses are recognised in profit or loss when the liabilities are de-recognised.
For
per
sona
l use
onl
y

METCASH FINANCIAL REPORT 2013
NOTES TO THE FINANCIAL STATEMENTS
Year ended 30 April 2013
50
2. SUMMARY OF SIGNIFICANT ACCOUNTING POLICIES (Continued) (xxi) PROVISIONS
Provisions are recognised when the Group has a present obligation (legal or constructive) as a result of a past event, it is probable that an outflow of resources embodying economic benefits will be required to settle the obligation and a reliable estimate can be made of the amount of the obligation. Where the Group expects some or all of a provision to be reimbursed, for example, under an insurance contract, the reimbursement is recognised as a separate asset but only when the reimbursement is probable. The expense relating to any provision is presented in the statement of comprehensive income net of any reimbursement. If the effect of the time value of money is material, provisions are measured at the net present value of the expected future cash outflows using a current pre-tax rate that reflects the risks specific to the liability. During each period the provision is increased by an amount that is equal to the provision multiplied by the discount rate. This increment, including any change in the value of the provision as a result of a change in discount rate, is treated as a finance cost in the Statement of Comprehensive Income. Provisions for property lease and remediation costs are raised where the economic entity is committed by the requirements of the lease agreement. The future lease costs, net of any income from sub-leasing, are discounted to their net present value in determining the provision. Dividends payable are recognised when a legal or constructive obligation to pay the dividend arises, typically following approval of the dividend at a meeting of directors. (xxii) SHARE-BASED PAYMENT TRANSACTIONS
The Group provides benefits to employees of the Group in the form of share-based payment transactions, whereby employees render services in exchange for shares or rights over shares (equity-settled transactions). The Group provides benefits to executive directors, senior executives and its employees in the form of the Metcash Executive and Senior Managers Performance Rights Plan (Rights Plan) and the Metcash Employee Option Plan (MEOP). The cost of these equity-settled transactions with employees is measured by reference to the fair value of the equity instruments at the date at which they are granted. The fair value is determined using an appropriate valuation model, further details of which are given in Note 25. In valuing equity-settled transactions, no account is taken of any performance conditions, other than conditions linked to the price of the shares of Metcash Limited (market conditions). The cost of equity-settled transactions is recognised, together with a corresponding increase in equity, over the period in which the performance conditions are fulfilled, ending on the date on which the relevant employees become fully entitled to the award (vesting date). The cumulative expense recognised for equity-settled transactions at each reporting date until vesting date reflects (i) the extent to which the vesting period has expired and (ii) the number of awards that, in the opinion of the directors of the Group, will ultimately vest. This opinion is formed based on the best available information at balance date. No adjustment is made for the likelihood of market performance conditions being met as the effect of these conditions is included in the determination of fair value at grant date. Where the terms of an equity-settled award are modified, as a minimum an expense is recognised as if the terms had not been modified. In addition, an expense is recognised for any increase in the value of the transaction as a result of the modification, as measured at the date of modification. Where an equity-settled award is cancelled, it is treated as if it had vested on the date of cancellation, and any expense not yet recognised for the award is recognised immediately. However, if a new award is substituted for the cancelled award, and designated as a replacement award on the date that it is granted, the cancelled and new award are treated as if they were a modification of the original award, as described in the previous paragraph. The dilutive effect, if any, of outstanding options and performance rights are reflected as additional share dilution in the computation of earnings per share.
For
per
sona
l use
onl
y
METCASH FINANCIAL REPORT 2013
NOTES TO THE FINANCIAL STATEMENTS
Year ended 30 April 2013
51
2. SUMMARY OF SIGNIFICANT ACCOUNTING POLICIES (Continued) (xxiii) REVENUE RECOGNITION
Revenue is recognised to the extent that it is probable that the economic benefits will flow to the Group and the revenue can be reliably measured. The specific recognition criteria described below must also be met before revenue is recognised. Sale of goods Revenue from the sale of goods is recognised when the significant risks and rewards of ownership of the goods have passed to the buyer, usually on acceptance of delivery of the goods. Rendering of services Revenue from promotional activities is recognised when the promotional activities occur. Interest Revenue is recognised as the interest is earned. Dividends Revenue is recognised when the right to receive the payment is established. Rental income
Rental income is accounted for on a straight-line basis over the lease term. Contingent rental income is recognised as income in the periods in which it is earned. (xxiv) FINANCE COSTS
Finance costs directly attributable to the acquisition, construction or production of an asset that necessarily takes a substantial period of time to get ready for its intended use or sale are capitalised as part of the cost of the asset. All other finance costs are expensed in the period they occur. Borrowing costs consist of interest and other costs that an entity incurs in connection with the borrowing of funds. Certain provisions are measured at their discounted value. During each period the provision is increased by an amount that is equal to the provision multiplied by the discount rate. This increment, including any change in the value of the provision as a result of a change in discount rate, is treated as a finance cost in the Statement of Comprehensive Income. (xxv) INCOME TAX
Current tax assets and liabilities for the current and prior periods are measured at the amount expected to be recovered from, or paid to the taxation authority. The tax rates and tax laws used to compute the amount are those that are enacted or substantively enacted by the relevant reporting date. Deferred income tax is provided on all temporary differences at the reporting date, between the tax bases of assets and liabilities and their carrying amounts for financial reporting purposes. Deferred income tax liabilities are recognised for all taxable temporary differences:
except where the deferred income tax liability arises from the initial recognition of an asset or liability in a transaction that is not a business combination and, at the time of the transaction, affects neither the accounting nor taxable profit or loss; and
in respect of taxable temporary differences associated with investments in subsidiaries, associates and interests in joint ventures, except where the timing of the reversal of the temporary differences can be controlled and it is probable that the temporary differences will not reverse in the foreseeable future.
Deferred income tax assets are recognised for all deductible temporary differences, carry-forward unused tax assets and unused tax losses, to the extent that it is probable that taxable profit will be available against which the deductible temporary differences, and the carry-forward of unused tax assets and unused tax losses can be utilised:
except where the deferred income tax asset relating to the deductible temporary difference arises from the initial recognition of an asset or liability in a transaction that is not a business combination and, at the time of the transaction, affects neither the accounting nor taxable profit or loss; and
For
per
sona
l use
onl
y

METCASH FINANCIAL REPORT 2013
NOTES TO THE FINANCIAL STATEMENTS
Year ended 30 April 2013
52
2. SUMMARY OF SIGNIFICANT ACCOUNTING POLICIES (Continued) (xxv) INCOME TAX (Continued)
in respect of deductible temporary differences associated with investments in subsidiaries, associates and interests in joint ventures, deferred tax assets are only recognised to the extent that it is probable that the temporary differences will reverse in the foreseeable future and taxable profit will be available against which the temporary differences can be utilised.
The carrying amount of deferred income tax assets is reviewed at each reporting date and reduced to the extent that it is no longer probable that sufficient taxable profit will be available to allow all or part of the deferred income tax asset to be utilised. Deferred income tax assets and liabilities are measured at the tax rates that are expected to apply to the year when the asset is realised or the liability is settled, based on tax rates (and tax laws) that have been enacted or substantively enacted at the relevant reporting date. Deferred tax assets and deferred tax liabilities are offset only if a legally enforceable right exists to set off current tax assets against current tax liabilities and the deferred tax assets and liabilities relate to the same taxable entity and the same taxation authority. Income taxes relating to items recognised directly in equity are recognised in equity and not in the statement of comprehensive income. (xxvi) OTHER TAXES
Revenues, expenses and assets are recognised net of the amount of GST except:
when the GST incurred on a purchase of goods and services is not recoverable from the taxation authority, in which case the GST is recognised as part of the cost of acquisition of the asset or as part of the expense item as applicable; and
receivables and payables which are stated with the amount of GST included. The net amount of GST recoverable from, or payable to, the taxation authority is included as part of receivables or payables in the statement of financial position. Cash flows related to GST are included in the statement of cash flows on a gross basis and the GST component of cash flows arising from investing and financing activities, which is recoverable from, or payable to, the taxation authority, is classified as an operating cash flow. Commitments and contingencies are disclosed net of the amount of GST recoverable or payable. (xxvii) EARNINGS PER SHARE
Basic earnings per share is calculated as net profit attributable to members of the parent, adjusted to exclude any costs of servicing equity (other than dividends) divided by the weighted average number of ordinary shares, adjusted for any bonus element. Diluted earnings per share are calculated as net profit attributable to members of the parent, adjusted for:
costs of servicing equity (other than dividends);
the after tax effect of dividends and interest associated with dilutive potential ordinary shares that have been recognised as expenses; and
other non-discretionary changes in revenues or expenses during the period that would result from the dilution of potential ordinary shares, divided by the weighted average number of ordinary shares and dilutive potential ordinary shares, adjusted for any bonus element.
For
per
sona
l use
onl
y

METCASH FINANCIAL REPORT 2013
NOTES TO THE FINANCIAL STATEMENTS
Year ended 30 April 2013
53
2. SUMMARY OF SIGNIFICANT ACCOUNTING POLICIES (Continued) (xxviii) CONTRIBUTED EQUITY
Ordinary shares are classified as equity. Incremental costs directly attributable to the issue of new shares or options are shown in equity as a deduction, net of tax, from the proceeds.
(xxix) NON-CURRENT ASSETS HELD FOR SALE AND DISCONTINUED OPERATIONS
Non-current assets and disposal groups classified as held for sale are measured at the lower of their carrying amount and fair value less costs to sell. Non-current assets and disposal groups are classified as held for sale if their carrying amounts will be recovered principally through a sale transaction rather than through continuing use. This condition is regarded as met only when the sale is highly probable and the asset or disposal group is available for immediate sale in its present condition. The sale must be committed to and should be expected to qualify for recognition as a completed sale within a reasonable period of time. In the statement of comprehensive income, income and expenses from discontinued operations are reported separately from income and expenses from continuing operations, down to the level of profit after taxes, even when the Group retains a non-controlling interest in the subsidiary after the sale. Once classified as held for sale, property, plant and equipment and intangible assets are not depreciated or amortised. (xxx) RETAIL DEVELOPMENT ASSETS
Costs incurred in respect of a greenfields development which involves the lease or acquisition of land and subsequent construction of a retail store or shopping centre are capitalised as assets under construction and included in property, plant and equipment. On conclusion of the development the capitalised costs are transferred to non-current assets held for sale provided they meet the criteria detailed in Note 2(xxix). Costs incurred in respect of the acquisition of an existing retail store or shopping centre are capitalised as non-current assets held for sale provided they meet the recognition criteria in Note 2(xxix). Any costs subsequent to acquisition required to refurbish the site are capitalised as assets under construction during the refurbishment phase. Once the refurbishment is completed the acquisition costs and refurbishment costs are transferred either to property, plant and equipment or to assets held for sale.
(xxxi) FINANCIAL GUARANTEE CONTRACTS
Financial guarantee contracts issued by the Group are those contracts that require a payment to be made to reimburse the holder for a loss it incurs because the specified debtor fails to make a payment when due in accordance with the terms of a debt instrument. Financial guarantee contracts are recognised initially as a liability at fair value, adjusted for transaction costs that are directly attributable to the issuance of the guarantee. Subsequently, the liability is measured at the higher of the best estimate of the expenditure required to settle the present obligation at the reporting date and the amount recognised less cumulative amortisation.
(xxxii) COMPARATIVE INFORMATION
Certain comparative information was amended in these financial statements to conform to the current year presentation. These amendments do not impact the Group‟s financial results and do not have any significant impact on the Group‟s balance sheet.
For
per
sona
l use
onl
y
METCASH FINANCIAL REPORT 2013
NOTES TO THE FINANCIAL STATEMENTS
Year ended 30 April 2013
54
3. SEGMENT INFORMATION
Identification of reportable segments The Group has identified its operating segments based on the internal reports that are reviewed and used by the CEO (the chief operating decision maker) in assessing performance and in determining the allocation of resources. The operating segments are identified based on the differences in the products and services provided. Discrete financial information about each of these operating segments is reported to the CEO on at least a monthly basis. The reportable segments are based on the aggregated operating segments determined by the similarity of the products sold, as these are the sources of the Group‟s major risks and have the most effect on the rates of return.
Information reported to the CEO for the purposes of resource allocation and assessment of performance is more specifically focused on the category of each type of product. The Group‟s reportable segments are therefore as follows:
Food and Grocery activities comprise the distribution of dry grocery, perishable and general merchandise supplies to retail outlets.
Liquor activities comprise the distribution of liquor products to retail outlets and hotels.
Hardware and Automotive comprises the distribution of hardware supplies and automotive parts and accessories to retail outlets.
On 25 January 2012 the Group announced the amalgamation of IGA>D, IGA Fresh, Campbells Cash and Carry and all the associated merchandising and marketing functions into a single Food & Grocery business pillar. This amalgamation facilitated a change in reporting structures with previously disclosed Food Distribution and Cash and Carry Distribution segments now combined into the Food and Grocery segment. The comparative segment information has been restated. The Automotive and Hardware operating segments have been combined as one reportable segment as these segments, separately, do not meet the quantitative thresholds prescribed by AASB 8 Operating Segments.
On 30 November 2012, the Group announced Project Mustang, which is a $75 million warehouse automation project centred on the Group‟s new distribution facility in Huntingwood, NSW. The capital expenditure represents the latest European technology that will significantly automate the goods receipt, order selection, pallet assembly and distribution processes for both the Food & Grocery and Liquor businesses that operate within this distribution centre. This project is expected to „go live‟ during FY2015, at which point the Food & Grocery and Liquor management structures and reporting will be merged in NSW. As a result, the Food & Grocery and Liquor results will be amalgamated into one reportable segment from 1 May 2014. Geographically the Group operates predominantly in Australia. The New Zealand operation represents less than 5% of revenue, results and assets of the Group. Segment accounting policies The selling price between segments is at normal selling prices and is paid under similar terms and conditions as any other customers of the Group. The Food and Grocery segment results include wholesale sales to Franklins retail stores that are expected to continue to trade but do not include wholesale sales to stores that are expected to close or have closed. Major customers The Group does not have a single external customer which represents greater than 10% of the Group's revenue.
For
per
sona
l use
onl
y

METCASH FINANCIAL REPORT 2013
NOTES TO THE FINANCIAL STATEMENTS For the year ended 30 April 2013
55
3. SEGMENT INFORMATION (Continued)
Business segments
Liquor Hardware and
Automotive Results from
continuing operations Food and Grocery
2013 2012 2013 2012 2013 2012 2013 2012
$’m $’m $’m $’m $’m $’m $’m $’m
Sales to external customers 9,120.6 9,331.7
2,917.6 2,336.2 938.4 833.2 12,976.6 12,501.1
Inter-segment revenues 33.4 21.1 33.2 86.8 0.1 - 66.7 107.9
Total segment revenue 9,154.0 9,352.8 2,950.8 2,423.0 938.5 833.2 13,043.3 12,609.0
Segment profit/(loss) before tax 377.9 397.7 47.1 34.9 36.2 21.2 461.2 453.8
The above excludes the segment results from discontinued operations. (Refer to Note 31)
i) Segment revenue reconciliation to the statement of comprehensive income 2013 2012 $’m $’m
Total segment revenue 13,043.3 12,609.0
Inter-segment revenues elimination (66.7) (107.9)
Rent income 110.7 98.5
Interest from other persons/corporations 7.7 12.7
Total revenue from continuing operations 13,095.0 12,612.3
ii) Segment profit before tax reconciliation to the statement of comprehensive income
2013 2012 $’m $’m
Segment profit before tax 461.2 453.8
Net finance costs (61.6) (67.6)
Share based payments (0.4) (1.3)
Amortisation of customer relationships and licence agreements (12.6) (9.7)
Rent income 110.7 98.5
Rent expense (110.7) (98.5)
Significant items (1.1) (176.7)
Corporate/Unallocated (0.4) (1.3)
Net profit from continuing operations before income tax 385.1 197.2
For
per
sona
l use
onl
y

METCASH FINANCIAL REPORT 2013
NOTES TO THE FINANCIAL STATEMENTS
Year ended 30 April 2013
56
4. REVENUES AND EXPENSES
2013 2012 $’m $’m
(i) Revenue
Sale of goods 12,976.6 12,501.1
Rent 110.7 98.5
Interest from other persons/corporations 7.7 12.7
13,095.0 12,612.3
(ii) Other income
Net profit from disposal of property, plant and equipment 2.7 0.2
(iii) Operating lease rental
Minimum lease payments - warehouse and other 128.4 105.8 Minimum lease payments - stores 110.7 98.5
(iv) Employee benefit expense
Salaries and wages 433.2 404.0 Defined contribution plan expense 33.2 32.4 Workers compensation costs 11.8 11.0 Share based payments 0.4 1.3 Other employee benefit costs 7.1 4.6
(v) Other expenses
Depreciation of property, plant and equipment 34.5 34.0 Amortisation of software 12.4 10.7 Amortisation of customer relationships and licence agreements 12.6 9.7
59.5 54.4
Impairment Software development intangibles - 2.2 Retail development assets 2.2 - Plant and equipment 0.6 -
2.8 2.2
Trade receivables impairment provision 19.9 17.5 Inventories net realisable value provision 6.2 5.8
(vi) Significant items
Acquisition and restructure costs/(recovery) - Distribution centre closure costs - 22.2 - Acquisition costs (recovery)/expense: Franklins (a) (3.5) 6.3 - Acquisition costs: ABG and ATAP (b) 4.6 -
1.1 28.5 Group restructuring
- Lease tail and exit costs - 17.0 - Redundancy costs - 11.5 - Impairment - property, plant & equipment - 9.9 - Impairment - goodwill - 2.5 - Other closure costs - 8.8 - Profit on disposal of business assets - (7.2)
- 42.5 Associate impairment
- Loans and receivables - 50.8 - Equity accounted investment - 24.6 - Customer contract intangibles - 9.1 - Restructure costs (provided) - 12.5 - Restructure costs (paid) - 8.7
- 105.7
1.1 176.7
For
per
sona
l use
onl
y

METCASH FINANCIAL REPORT 2013
NOTES TO THE FINANCIAL STATEMENTS
Year ended 30 April 2013
57
4. REVENUES AND EXPENSES (Continued)
2013 2012 $’m $’m
(vii) Finance costs Interest expense 58.5 74.9 Deferred borrowing cost 1.8 3.4 Finance costs attributable to discounting of provisions and liabilities (Refer note 2xxiv) 9.0 2.0
69.3 80.3
(a) Acquisition costs (recovery)/expense: Franklins
Metcash completed the acquisition of the IGH Group (Franklins) on 30 September 2011. During the prior year, Metcash incurred legal and other costs in connection with the legal proceedings brought by the Australian Competition and Consumer Commission and finally in completing the acquisition. During the current year, Metcash received a reimbursement of $3.5 million of costs from the Australian Consumer and Competition Commission (ACCC) as a result of a court order in relation to the prior period legal proceedings. (b) Acquisition costs: ABG and ATAP
With effect from 1 July 2012 Metcash acquired 75.1% of the Automotive Brands Group (ABG) for $54.7 million. The transaction costs associated with this acquisition have been disclosed as a significant item as the acquisition is deemed to be material. On 16 May 2013 Metcash announced the acquisition, through Automotive Brands Group (ABG), of 100% of the Australian Truck & Auto Parts Group (ATAP) for approximately $84.0 million including acquisition costs. The transaction costs incurred during the current year associated with this acquisition have been disclosed as a significant item as the acquisition is deemed to be material.
5. INCOME TAX
2013 2012
$’m $’m
The major components of income tax expense are:
Current income tax
Current income tax charge 71.2 109.5
Adjustments in respect of income tax of previous years (3.9) (0.7)
Deferred income tax relating to origination and reversal of temporary differences 48.8 (37.0)
Income tax expense reported in the statement of comprehensive income 116.1 71.8
A reconciliation between tax expense and the product of accounting profit before income tax multiplied by the Group‟s applicable income tax rate is as follows:
Accounting profit before income tax 385.1 197.2
At the Group‟s statutory income tax rate of 30% (2012: 30%) 115.5 59.2
Expenditure not allowable for income tax purposes – continuing operations 3.1 1.4
Expenditure not allowable for income tax purposes – significant items 1.4 11.9
Adjustments in respect of income tax of previous years (3.9) (0.7)
Income tax expense reported in the statement of comprehensive income at an effective tax rate of 30% (2012: 30%) 116.1 71.8
Income tax attributable to continuing operations 116.1 71.8
Income tax benefit attributable to discontinued operations (26.0) (11.7)
90.1 60.1
For
per
sona
l use
onl
y

METCASH FINANCIAL REPORT 2013
NOTES TO THE FINANCIAL STATEMENTS
Year ended 30 April 2013
58
5. INCOME TAX (Continued)
2013 2012
$’m $’m
Deferred income tax
Deferred income tax of the Group at 30 April relates to the following:
Deferred tax liabilities
Intangibles 66.8 47.2
Accelerated depreciation for tax purposes 1.3 2.3
Other - 1.6
Set off against deferred tax assets (68.1) (51.1)
- -
Deferred tax assets
Provisions 115.6 133.2
Other 0.7 1.2
Unutilised tax losses 13.6 12.2
Set off from deferred tax liabilities (68.1) (51.1)
61.8 95.5
Recognised net deferred tax assets
Opening balance 95.5 6.6
Credited/(charged) to net profit for the year (48.8) 37.0
Credited/(charged) to other comprehensive income for the year (0.9) 1.9
Tax benefit associated to share issue costs 2.0 -
Adjustment attributable to finalisation of Franklins acquisition (Note 29) 22.8 -
Acquisitions from business combinations (Note 29) (8.8) 50.0
Closing balance 61.8 95.5
At 30 April 2013, there is no recognised or unrecognised deferred income tax liability (2012: $nil) for taxes that would be payable on the unremitted earnings of certain of the Group‟s subsidiaries and associates as the Group has no liability for additional taxation should these earnings be remitted.
The Group has unrecognised gross capital losses of $16 million (2012: $20 million) that are available indefinitely for offset against future capital gains.
TAX CONSOLIDATION
Metcash Limited and its 100% owned Australian resident subsidiaries have formed a tax consolidated group with effect from 1 July 2005. Metcash Limited is the head entity of the tax consolidated group. Members of the group have entered into a tax sharing arrangement in order to allocate income tax expense to the wholly owned subsidiaries on a modified standalone basis. In addition the agreement provides for the allocation of income tax liabilities between the entities should the head entity default on its tax payment obligations. With effect from 1 August 2012, Mittenmet Limited joined the tax consolidated group. TAX EFFECT ACCOUNTING BY MEMBERS OF THE TAX CONSOLIDATED GROUP
Members of the tax consolidated group have entered into a tax funding agreement. The tax funding agreement provides for the allocation of current taxes to members of the tax consolidated group in accordance with a group allocation method using modified stand alone tax calculation as the basis for allocation. Deferred taxes of members of the tax consolidated group are measured and recognised in accordance with the principles of AASB 112 Income Taxes.
Under the tax funding agreement, funding is based upon the amounts allocated and recognised by the member entities. Accordingly, funding results in an increase/decrease in the subsidiaries‟ intercompany accounts with the tax consolidated group head company, Metcash Limited. F
or p
erso
nal u
se o
nly

METCASH FINANCIAL REPORT 2013
NOTES TO THE FINANCIAL STATEMENTS
Year ended 30 April 2013
59
6. DIVIDENDS PAID AND PROPOSED
(a) Dividends paid and declared on ordinary shares during the year
2013 2012
$’m $’m
Dividends paid on ordinary shares during the year
Final fully franked dividend for 2012: 16.5c (2011: 16.0c) 142.6 123.0
Interim fully franked dividend for 2013: 11.5c (2012: 11.5c) 101.3 88.7
243.9 211.7
Dividends declared (not recognised as a liability as at 30 April 2013)
Final fully franked dividend for 2013: 16.5c (2012: 16.5c) 145.3 142.6
(b) Franking credit balance of Metcash Limited
2013 2012
$’m $’m
Franking account balance as at the end of the financial year at 30% (2012: 30%) 92.4 135.4 Franking credits that will arise from the payment of income tax payable as at the end of the financial year 9.3 24.9 Amount of franking credit on dividends declared but not recognised as a distribution to shareholders during the year (62.3) (61.1)
39.4 99.2
The franking credit balance of $39.4 million (2012: $99.2 million) includes certain franking credits associated with the income tax receivable of $24.4 million paid in respect of the Action Stores disputed tax (Note 32). (c) Tax rates
Dividends paid and declared have been fully franked at the rate of 30% (2012: 30%).
For
per
sona
l use
onl
y

METCASH FINANCIAL REPORT 2013
NOTES TO THE FINANCIAL STATEMENTS
Year ended 30 April 2013
60
7. CASH AND CASH EQUIVALENTS
2013 2012
$’m $’m
Cash at bank and on hand 50.3 51.5
Bank overdrafts (Note 17) (29.8) -
20.5 51.5
(a) Reconciliation of net profit after tax to net cash flows from operations
Net profit for the year 209.1 98.2
Adjustments for: Depreciation and amortisation 61.0 54.4
Impairment losses 2.8 -
Net profit on disposal of property, plant and equipment (2.7) (0.2)
Net profit on disposal of discontinued operations (2.5) -
Share of associates‟ net (profit)/loss (3.4) (0.3)
Dividends received from associates 0.6 1.1
Deferred borrowing costs 1.8 3.4
Share based payments 0.4 1.3
Significant items:
Acquisition costs – Costs paid on acquisitions of businesses 4.6 -
Acquisition costs – Recovery of costs from ACCC (3.5) -
Group restructuring – impairment of property, plant & equipment (Note 4(vi)) - 9.9
Group restructuring – impairment of goodwill (Note 4(vi)) - 2.5
Group restructuring – profit on disposal of business assets (Note 4(vi)) - (7.2)
Associate impairment – loans and receivables (Note 4(vi)) - 50.8
Associate impairment – equity accounted investment (Note 4(vi)) - 24.6
Associate impairment – customer contract intangible (Note 4(vi)) - 9.1
Changes in assets and liabilities, net of purchase and disposal of subsidiaries (Increase)/decrease in trade and other receivables (31.3) 13.8
(Increase)/decrease in assets held for sale 19.3 2.7
(Increase)/decrease in other current assets 1.1 0.6
(Increase)/decrease in inventories 89.6 154.0
(Increase)/decrease in deferred tax assets 48.8 (34.8)
(Decrease)/increase in payables and provisions (89.1) (85.7)
(Decrease)/increase in tax payable (6.8) (13.9)
Cash from operating activities 299.8 284.3
(b) Non-cash financing and investing activities
Acquisition of assets by means of finance lease 3.1 4.3
For
per
sona
l use
onl
y

METCASH FINANCIAL REPORT 2013
NOTES TO THE FINANCIAL STATEMENTS
Year ended 30 April 2013
61
8. TRADE AND OTHER RECEIVABLES (CURRENT)
2013 2012
$’m $’m
Trade receivables - securitised (i)
(Note 17 (iv)) 738.8 689.1
Trade receivables - non-securitised (i)
200.7 194.5
Allowance for impairment loss (47.4) (50.1)
892.1 833.5
Customer loans (ii)
43.8 23.6
Allowance for impairment loss (6.5) (1.6)
929.4 855.5
Marketing debtors (iii)
12.4 30.5
Other receivables (iii)
71.1 93.4
1,012.9 979.4
(i) Trade receivables are non-interest bearing and repayment terms vary by business unit. At 30 April 2013, 82.3% of trade
receivables are required to be settled within 30 days (2012: 83.3%), 17.0% have terms extending from 30 to 60 days (2012: 15.8%) and 0.7% have terms greater than 60 days (2012: 0.9%). The amount of the allowance for impairment loss has been measured as the difference between the carrying amount of the trade receivables and the estimated future cash flows expected to be received from the relevant debtors.
(ii) Customer loans receivable are current and have repayment terms of less than 12 months. $2.3 million (2012: $0.7
million) of loans are non-interest-bearing. $41.5 million (2012: $22.9 million) of loans have a weighted average annual interest rate of 9.16% (2012: 8.71%).
(iii) Marketing debtors and other receivables are non-interest bearing and have repayment terms of less than 12 months.
IMPAIRED TRADE RECEIVABLES AND OTHER CURRENT RECEIVABLES
During the year ended 30 April 2013 receivables of the value of $49.2 million (2012: $15.7 million) were considered non-recoverable and written off. As at 30 April 2013, trade receivables and other current receivables with a carrying value of $53.9 million (2012: $51.7 million) were provided for as impaired.
2013 2012
$’m $’m
As at 1 May 51.7 23.9
Reclassified from non-current (Note 11) 31.5 -
Accounts written off as non-recoverable (49.2) (15.7)
Charged as an expense during the year 19.9 17.5
Charged as an expense during the year - significant items - 26.0
As at 30 April 53.9 51.7
TRADE DEBTORS AGEING
As at 30 April 2013, the ageing analysis of trade receivables for the Group that were not impaired is as follows:
NEITHER PAST DUE
OR IMPAIRED
LESS THAN 30
DAYS OVERDUE
MORE THAN 30
LESS THAN 60
MORE THAN 60
LESS THAN 90
MORE THAN 90
LESS THAN 120
MORE THAN 120 TOTAL
$’m $’m $’m $’m $’m $’m $’m
2013 745.1 111.7 20.8 6.8 4.1 3.6 892.1
83.5% 12.5% 2.3% 0.8% 0.5% 0.4% 100.0%
2012 662.7 123.4 19.7 8.4 8.4 10.9 833.5
79.5% 14.8% 2.4% 1.0% 1.0% 1.3% 100.0%
The credit quality of the unimpaired trade receivables is good. Metcash believes that the above trade receivables will be recovered.
For
per
sona
l use
onl
y
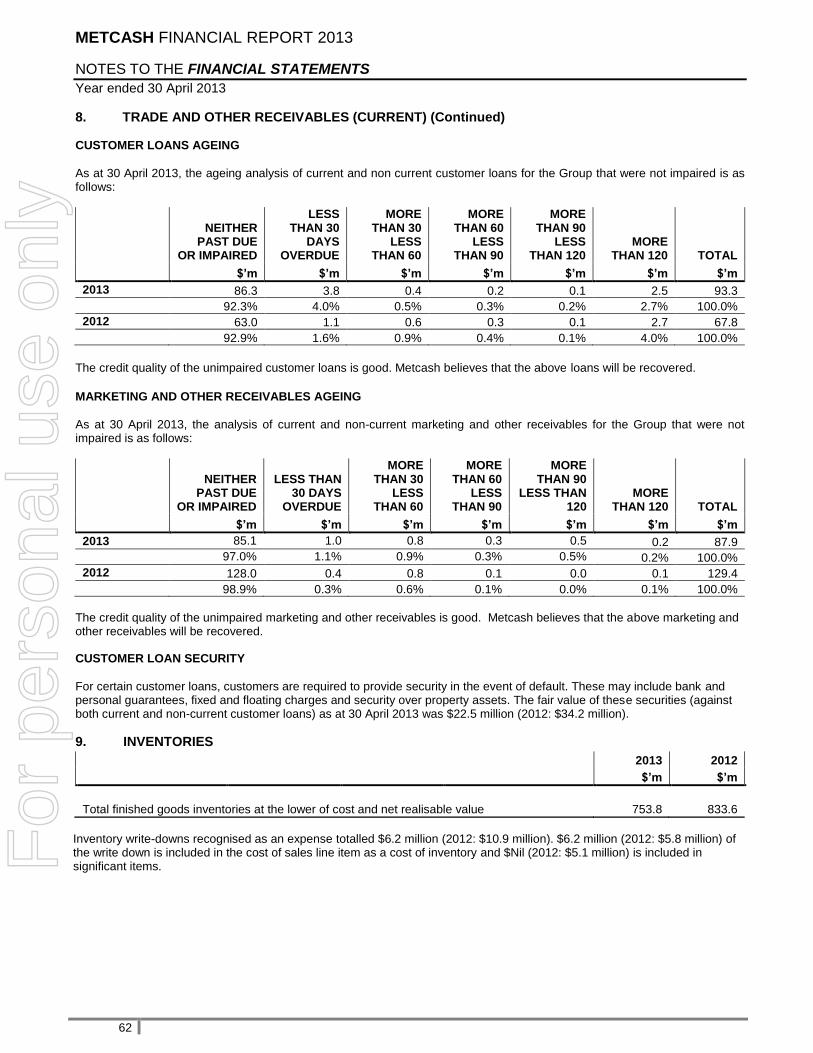
METCASH FINANCIAL REPORT 2013
NOTES TO THE FINANCIAL STATEMENTS
Year ended 30 April 2013
62
8. TRADE AND OTHER RECEIVABLES (CURRENT) (Continued) CUSTOMER LOANS AGEING
As at 30 April 2013, the ageing analysis of current and non current customer loans for the Group that were not impaired is as follows:
NEITHER PAST DUE
OR IMPAIRED
LESS THAN 30
DAYS OVERDUE
MORE THAN 30
LESS THAN 60
MORE THAN 60
LESS THAN 90
MORE THAN 90
LESS THAN 120
MORE THAN 120 TOTAL
$’m $’m $’m $’m $’m $’m $’m
2013 86.3 3.8 0.4 0.2 0.1 2.5 93.3
92.3% 4.0% 0.5% 0.3% 0.2% 2.7% 100.0%
2012 63.0 1.1 0.6 0.3 0.1 2.7 67.8
92.9% 1.6% 0.9% 0.4% 0.1% 4.0% 100.0%
The credit quality of the unimpaired customer loans is good. Metcash believes that the above loans will be recovered.
MARKETING AND OTHER RECEIVABLES AGEING
As at 30 April 2013, the analysis of current and non-current marketing and other receivables for the Group that were not impaired is as follows:
NEITHER PAST DUE
OR IMPAIRED
LESS THAN 30 DAYS
OVERDUE
MORE THAN 30
LESS THAN 60
MORE THAN 60
LESS THAN 90
MORE THAN 90
LESS THAN 120
MORE THAN 120 TOTAL
$’m $’m $’m $’m $’m $’m $’m
2013 85.1 1.0 0.8 0.3 0.5 0.2 87.9
97.0% 1.1% 0.9% 0.3% 0.5% 0.2% 100.0%
2012 128.0 0.4 0.8 0.1 0.0 0.1 129.4
98.9% 0.3% 0.6% 0.1% 0.0% 0.1% 100.0%
The credit quality of the unimpaired marketing and other receivables is good. Metcash believes that the above marketing and other receivables will be recovered. CUSTOMER LOAN SECURITY
For certain customer loans, customers are required to provide security in the event of default. These may include bank and personal guarantees, fixed and floating charges and security over property assets. The fair value of these securities (against both current and non-current customer loans) as at 30 April 2013 was $22.5 million (2012: $34.2 million).
9. INVENTORIES
2013 2012
$’m $’m
Total finished goods inventories at the lower of cost and net realisable value 753.8 833.6
Inventory write-downs recognised as an expense totalled $6.2 million (2012: $10.9 million). $6.2 million (2012: $5.8 million) of the write down is included in the cost of sales line item as a cost of inventory and $Nil (2012: $5.1 million) is included in significant items.
For
per
sona
l use
onl
y

METCASH FINANCIAL REPORT 2013
NOTES TO THE FINANCIAL STATEMENTS
Year ended 30 April 2013
63
10. DERIVATIVE FINANCIAL INSTRUMENTS
2013 2012
$’m $’m
Current
Foreign currency forward contracts 0.6 -
Non current
Cross currency interest rate swaps – US Private Placement 37.7 27.8
The above derivatives are designated and effective as hedging instruments and are carried at fair value through other comprehensive income.
11. RECEIVABLES (NON-CURRENT)
2013 2012
$’m $’m
Customer loans(i)
56.0 77.3
Allowance for impairment loss
- (31.5)
Other receivables(ii)
4.4 5.5
60.4 51.3
(i) Customer loans receivable are non-current and have repayment terms of greater than 12 months. $2.7 million (2012: $1.9 million) of loans are non-interest bearing. $53.3 million (2012: $75.4 million) of the loans have a weighted average annual interest rate of 8.75% (2012: 8.15%). Refer to Note 8 for ageing analysis and credit quality.
(ii) Other receivables are non-interest-bearing and have repayment terms greater than 12 months. These receivables are all
neither past due nor impaired. Refer Note 8 for ageing analysis and credit quality. IMPAIRED CUSTOMER LOANS (NON CURRENT)
As at 30 April 2013, non current customer loans with a carrying value of $Nil (2012: $31.5 million) were provided for as impaired.
2013 2012
$’m $’m
As at 1 May 31.5 -
Reclassified to current (Note 8) (31.5) -
Charge for the year - significant items - 31.5
As at 30 April - 31.5
Refer Note 8 for ageing analysis and credit quality of customer loans that were not impaired. NON CURRENT RECEIVABLES FAIR VALUE
The fair value of non-current receivables is calculated based on cash flows discounted at a rate reflecting current market rates adjusted for counterparty credit risk. The fair value and carrying values of non-current receivables of the Group are as follows:
CARRYING AMOUNT
CARRYING AMOUNT
FAIR VALUE
FAIR VALUE
2013 2012 2013 2012
$’m $’m $’m $’m
Customer loans 56.0 45.8 57.9 46.8
Other receivables 4.4 5.5 4.4 5.5
60.4 51.3 62.3 52.3
For
per
sona
l use
onl
y

METCASH FINANCIAL REPORT 2013
NOTES TO THE FINANCIAL STATEMENTS
Year ended 30 April 2013
64
12. INVESTMENTS IN ASSOCIATES
2013 2012
$’m $’m
As at 1 May 68.3 92.1
Additions 20.2 1.6
Share of profit/(loss) of associates 3.4 0.3
Dividends received (0.6) (1.1)
Impairment – significant items - (24.6)
As at 30 April 91.3 68.3
Interest in associates
OWNERSHIP INTEREST
2013 2012
PRINCIPAL ACTIVITIES BALANCE
DATE % %
Abacus Independent Retail Property Trust Retail property investment 30 June 25.0 25.0
Plumpton Park Developments Pty Limited Property development 30 June 50.0 50.0
Ritchies Stores Pty Ltd Grocery retailing 30 June 26.0 26.0
BMS Retail Group Pty Ltd Grocery retailing 30 June 25.1 25.1
Kangaroo Flat Supermarket Pty Ltd Grocery retailing 30 June 25.1 25.1
Long Gully Supermarket Pty Ltd Grocery retailing 30 June 25.1 25.1
Dramet Pty Ltd Grocery retailing 30 June 26.0 26.0
Dart Trading Co Pty Ltd Grocery retailing 30 June 26.0 26.0
Bamlane Pty Ltd Grocery retailing 30 June 26.0 26.0
Mundin Pty Ltd Grocery retailing 30 June 26.0 26.0
G'Butt Pty ltd Grocery retailing 30 June 26.0 26.0
Mussen Pty Ltd Grocery retailing 30 June 26.0 26.0
Ully Pty Ltd Grocery retailing 30 June 26.0 26.0
Adcome Pty Ltd Grocery retailing 30 April 45.0 45.0
Lecome Pty Ltd Grocery retailing 30 April 50.0 50.0
Progressive Trading Pty Ltd (Progressive) (i)
Grocery retailing 30 April 52.2 52.2
Metfood Pty Limited Merchandise services for Metcash and Foodstuffs
30 April 50.0 50.0
Sunshine Hardware Pty Ltd Hardware retailing 30 June 49.0 49.0
Northern Hardware Group Pty Ltd Hardware retailing 30 June 49.9 49.9
Timberten Pty Ltd Hardware retailing 30 June 40.0 -
Waltock Pty Limited Hardware retailing 30 June 49.0 -
Banner 10 Pty Ltd Hardware retailing 30 June 49.0 -
Mermaid Tavern (Trading) Pty Ltd Liquor retailing and hospitality 30 April 50.0 -
Queens Arms Hotel New Farm Pty Ltd Liquor retailing and hospitality 30 April 50.0 -
Queens Arms Freehold Pty Ltd Property investment 30 April 50.0 -
(i) Metcash has a direct ownership of 45.4% in Progressive, and an indirect ownership of 6.8% via the 25.1% interest in BMS Retail Group Pty Ltd. Although the Group‟s total ownership interest in Progressive is greater than 50%, it is still considered to be an associate of the Group, as Metcash Limited does not have the power to govern the financial and operating policies of Progressive.
The following table illustrates the summarised financial information relating the Group‟s investment in associates. F
or p
erso
nal u
se o
nly
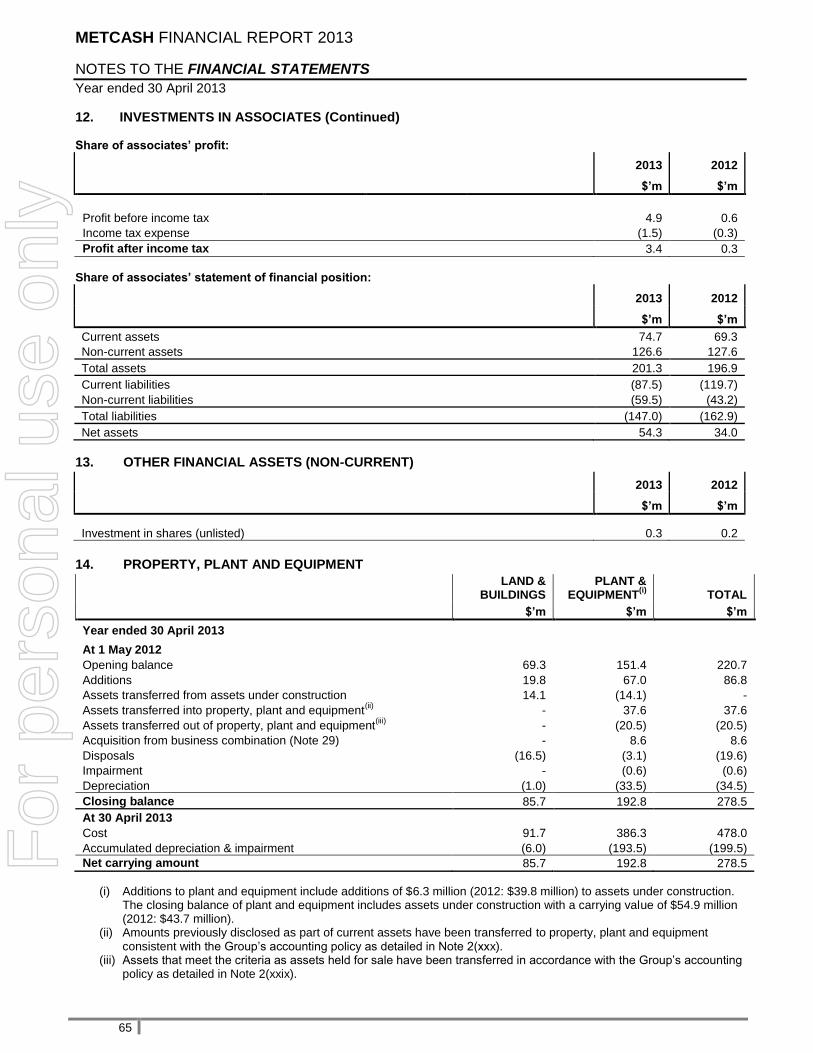
METCASH FINANCIAL REPORT 2013
NOTES TO THE FINANCIAL STATEMENTS
Year ended 30 April 2013
65
12. INVESTMENTS IN ASSOCIATES (Continued) Share of associates’ profit:
2013 2012
$’m $’m
Profit before income tax 4.9 0.6
Income tax expense (1.5) (0.3)
Profit after income tax 3.4 0.3
Share of associates’ statement of financial position:
2013 2012
$’m $’m
Current assets 74.7 69.3
Non-current assets 126.6 127.6
Total assets 201.3 196.9
Current liabilities (87.5) (119.7)
Non-current liabilities (59.5) (43.2)
Total liabilities (147.0) (162.9)
Net assets 54.3 34.0
13. OTHER FINANCIAL ASSETS (NON-CURRENT)
2013 2012
$’m $’m
Investment in shares (unlisted) 0.3 0.2
14. PROPERTY, PLANT AND EQUIPMENT
LAND & BUILDINGS
PLANT & EQUIPMENT
(i)
TOTAL
$’m $’m $’m
Year ended 30 April 2013
At 1 May 2012
Opening balance 69.3 151.4 220.7
Additions 19.8 67.0 86.8
Assets transferred from assets under construction 14.1 (14.1) -
Assets transferred into property, plant and equipment(ii)
- 37.6 37.6
Assets transferred out of property, plant and equipment(iii)
- (20.5) (20.5)
Acquisition from business combination (Note 29) - 8.6 8.6
Disposals (16.5) (3.1) (19.6)
Impairment - (0.6) (0.6)
Depreciation (1.0) (33.5) (34.5)
Closing balance 85.7 192.8 278.5
At 30 April 2013
Cost 91.7 386.3 478.0
Accumulated depreciation & impairment (6.0) (193.5) (199.5)
Net carrying amount 85.7 192.8 278.5
(i) Additions to plant and equipment include additions of $6.3 million (2012: $39.8 million) to assets under construction. The closing balance of plant and equipment includes assets under construction with a carrying value of $54.9 million (2012: $43.7 million).
(ii) Amounts previously disclosed as part of current assets have been transferred to property, plant and equipment consistent with the Group‟s accounting policy as detailed in Note 2(xxx).
(iii) Assets that meet the criteria as assets held for sale have been transferred in accordance with the Group‟s accounting policy as detailed in Note 2(xxix).
For
per
sona
l use
onl
y

METCASH FINANCIAL REPORT 2013
NOTES TO THE FINANCIAL STATEMENTS
Year ended 30 April 2013
66
14. PROPERTY, PLANT AND EQUIPMENT (Continued)
LAND &
BUILDINGS PLANT &
EQUIPMENT
TOTAL
$’m $’m $’m
Year ended 30 April 2012
At 1 May 2011
Opening balance 75.3 122.3 197.6
Additions 0.5 75.4 75.9
Acquisition from business combination (Note 29) - 1.2 1.2
Disposals (5.5) (1.4) (6.9)
Exchange differences - (0.1) (0.1)
Impairment charged to significant items - (13.6) (13.6)
Impairment reversal - 0.6 0.6
Depreciation (1.0) (33.0) (34.0)
Closing balance 69.3 151.4 220.7
At 30 April 2012
Cost 77.1 354.1 431.2
Accumulated depreciation & impairment (7.8) (202.7) (210.5)
Net carrying amount 69.3 151.4 220.7
The carrying value of plant and equipment held under finance leases and hire purchase contracts at 30 April 2013 is $10.6 million (2012: $13.0 million).
15. INTANGIBLE ASSETS AND GOODWILL
SOFTWARE DEVELOPMENT
COSTS CUSTOMER
CONTRACTS GOODWILL TRADE NAMES OTHER TOTAL
$'m $'m $'m $'m $'m $'m
Year ended 30 April 2013
At 1 May 2012
Net carrying amount
74.1 161.9 1,283.6 30.3 2.0 1,551.9
Additions
17.4 36.4 - - - 53.8 Acquisition from business combinations (Note 29) - 30.4 70.0 14.7 2.0 117.1 Adjustment attributable to finalisation of Franklins acquisition (Note 29)
- - 16.2 - - 16.2
Disposals
(0.9) (1.3) (2.3) - - (4.5)
Amortisation
(12.4) (12.3) - (1.5) (0.3) (26.5)
At 30 April 2013 Net carrying amount 78.2 215.1 1,367.5 43.5 3.7 1,708.0
At 30 April 2013
Cost (gross carrying amount) 180.2 268.1 1,367.5 45.1 5.0 1,865.9 Accumulated amortisation and impairment (102.0) (53.0) - (1.6) (1.3) (157.9)
Net carrying amount 78.2 215.1 1,367.5 43.5 3.7 1,708.0
For
per
sona
l use
onl
y

METCASH FINANCIAL REPORT 2013
NOTES TO THE FINANCIAL STATEMENTS
Year ended 30 April 2013
67
15. INTANGIBLE ASSETS AND GOODWILL (Continued)
SOFTWARE DEVELOPMENT
COSTS CUSTOMER
CONTRACTS GOODWILL TRADE NAMES OTHER TOTAL
$'m $'m $'m $'m $'m $'m
Year ended 30 April 2012
At 1 May 2011
Net carrying amount
70.2 151.1 1,040.3 27.2 2.3 1,291.1
Additions
16.8 1.1 - - - 17.9 Acquisition from business combination (Note 29) - 28.1 256.0 3.2 - 287.3
Disposals
- - (10.2) - - (10.2)
Impairment
(2.2) (9.1) (2.5) - - (13.8)
Amortisation
(10.7) (9.3) - (0.1) (0.3) (20.4)
At 30 April 2012 Net carrying amount 74.1 161.9 1,283.6 30.3 2.0 1,551.9
At 30 April 2012
Cost (gross carrying amount) 167.9 215.5 1,286.1 30.4 3.0 1,702.9 Accumulated amortisation and impairment (93.8) (53.6) (2.5) (0.1) (1.0) (151.0)
Net carrying amount 74.1 161.9 1,283.6 30.3 2.0 1,551.9
(a) DESCRIPTION OF THE GROUP’S INTANGIBLE ASSETS AND GOODWILL
Software development costs
Development costs have been capitalised at cost and are amortised using the straight-line method over the asset‟s useful economic life. Useful lives range from five to ten years. Software development costs are tested for impairment where an indicator of impairment exists. Useful lives are also estimated on an annual basis and adjustments, where applicable, are made on a prospective basis. Customer contracts
Customer contracts are acquired either through business combinations or through direct acquisition of contractual relationships. The carrying amount represents the costs less accumulated amortisation. Customer contracts are amortised over 5 to 25 years. The amortisation has been recognised in the statement of comprehensive income in the line item "Administrative Costs". If an impairment indication arises, the recoverable amount is estimated and an impairment loss is recognised to the extent that the recoverable amount is less than the carrying amount.
Trade names
Trade names have been acquired through business combinations and are carried at cost less any impairment losses. These intangible assets have been determined to have either a finite or an indefinite useful life. Trade names with indefinite useful lives will be subjected to impairment testing on an annual basis or whenever there is an indication of impairment. Impairment testing was carried out in February 2013. Trade names are considered to have a finite useful life when there is an intention to discontinue use of the name in which case it is amortised over its estimated remaining useful life.
Other
The Group entered into an Alliance Agreement with Lenards Pty Ltd in 2009 to offer customers the opportunity to purchase products under Lenards Franchise. The agreement fee is being amortised over 10 years, on a straight line basis. The intangible is carried at cost less accumulated amortisation. Included in other intangibles are liquor and gaming licences acquired during the year. These are considered to have indefinite useful lives and will be subjected to impairment testing on an annual basis or whenever there is an indication of impairment. F
or p
erso
nal u
se o
nly

METCASH FINANCIAL REPORT 2013
NOTES TO THE FINANCIAL STATEMENTS
Year ended 30 April 2013
68
15. INTANGIBLE ASSETS AND GOODWILL (Continued)
(b) IMPAIRMENT TESTS FOR GOODWILL AND INTANGIBLES WITH INDEFINITE USEFUL LIVES Goodwill (i) Description of cash generating units
Goodwill acquired through business combinations have been allocated to the lowest level within the entity at which the goodwill is monitored, being the four business pillars (Food & Grocery, ALM, Mitre 10 and ABG). Under AIFRS, goodwill and intangibles with indefinite lives must be tested annually and when impairment indicators arise, provided the testing is done at the same time each year. Impairment testing was conducted in February 2013 for all CGUs. The recoverable amounts of the group of CGUs have been determined based on value in use calculations using cash flow projections based on financial projections covering a five year period. (ii) Key assumptions used in valuations The Group has applied the following key assumptions in its cash flow projections:
Budgeted gross margins – These have been estimated based on the utilisation of existing assets and on the average gross margins achieved immediately before the budgeted year, increased for expected efficiency improvements. Discount rates – The weighted average cost of capital for the Group based on risk free rates of return, the Group‟s risk profile relative to the market, the marginal cost of borrowing for the Group, its average level of gearing and a market risk premium. Future growth – The long term growth rate is driven by population growth, inflation and market share. The pre-tax discount rates applied to cash flow projections are between 9.80% and 10.60% depending on the nature of the business (2012: 8.51%). Cash flows beyond the five-year period are extrapolated using a 1.4% long term growth rate (2012: 2.5%) which is based on the historical population and applicable product inflation and growth rates for each group of CGUs. (iii) Results of testing Based on the testing performed during the current year, no impairment of goodwill was identified in each of the CGUs (2012: $2.5 million). (iv) Sensitivity to changes in assumptions The table below summarises the goodwill attributed to each group of CGUs and the potential impairment trigger point at the impairment testing date of February 2013:
Group of CGUs
Goodwill $’m
As at 28 February 2013
Discount Rate at Which
Impairment is Triggered
%
Increase in Discount Rate
at Which Impairment is
Triggered %
Food and Grocery 1,163.9 19.92% 10.12% Australian Liquor Marketers 88.9 18.39% 8.59% Mitre 10 71.5 12.75% 2.55% Automotive Brands Group 22.4 22.81% 12.21%
No impairment is triggered in the above groups of CGUs if cash flows beyond the five-year period were extrapolated at a growth rate of 0%. Trade names (i) Trade names primarily comprise the Mitre 10, Autobarn and Autopro trade names.
(ii) Key assumptions used in assessing the recoverable amount of the Mitre 10, Autobarn and Autopro trade names:
Royalty rate - An estimate based on similar royalty rates for similar types of franchising store formats in a similar industry from a global analysis. Budgeted gross margins – These have been estimated based on the utilisation of existing assets and on the average gross margins achieved immediately before the budgeted year, increased for expected efficiency improvements. Discount rates – The weighted average cost of capital for the Mitre 10 Group and Automotive Brands Group are based on risk free rates of return, their respective risk profiles relative to the market, the marginal cost of borrowing for the group, their average level of gearing and a market risk premium. Future growth – Mitre 10 and ABG‟s growth is driven by population growth, estimated inflation and changes in market share.
For
per
sona
l use
onl
y

METCASH FINANCIAL REPORT 2013
NOTES TO THE FINANCIAL STATEMENTS
Year ended 30 April 2013
69
15. INTANGIBLE ASSETS AND GOODWILL (Continued)
(c) IMPAIRMENT TESTS FOR GOODWILL AND INTANGIBLES WITH INDEFINITE USEFUL LIVES (continued)
(iii) Results of testing Based on the testing performed during the current year, no impairment of trade names was identified (2012: $Nil). (iv) Sensitivity to changes in assumptions No reasonably possible change in any of the above key assumptions would cause the carrying value of the trade names to materially exceed its recoverable amount.
16. TRADE AND OTHER PAYABLES
2013 2012
$’m $’m
Trade payables 1,081.3 1,112.2
Accruals 254.3 257.3
1,335.6 1,369.5
Trade payables and accruals are non-interest-bearing and are normally settled within 30-day terms. Due to the short term nature of these payables, their carrying value approximates their fair value.
17. INTEREST BEARING LOANS AND BORROWINGS
2013 2012
$’m $’m
Current
Bank overdrafts – working capital(ii)
29.8 -
Bank loans - working capital(ii)
22.0 11.0
Finance lease obligations(i)
5.7 6.8
57.5 17.8
Non-current
Finance lease obligations(i)
6.3 9.1
Bank loans - syndicated(iii)
500.0 600.0
Debt securitisation(iv)
- 130.0
US private placement(v)
248.9 240.0
Deferred borrowing costs (3.8) (5.1)
751.4 974.0
(i) Finance leases have an average lease term of 4 years with the option to purchase the asset at the completion of the lease term for the asset‟s market value. The weighted average interest rate implicit in the lease is 8.52% (2012: 9.19%). Certain lease liabilities are secured by a charge over the leased asset.
(ii) Working capital bank loans represent two unsecured revolving facilities totalling $225 million, which expire in October 2013 ($150 million) and February 2014 ($75 million). Interest payable on any loans drawn under these facilities is based on BBSY or the RBA cash rate plus a margin. These bank loans are subject to certain financial undertakings as detailed in Note 17(vi) below.
(iii) Syndicated bank loans are three and four year senior unsecured loan note subscription facilities, which expire in December 2014 ($400 million) and December 2015 ($300 million). Interest payable on the facility is based on BBSY plus a margin and interest resets are quarterly. The applicable margin is dependent upon an escalation matrix linked to the senior leverage ratio achieved. These bank loans are subject to certain financial undertakings as detailed in Note 17(vi) below.
(iv) Under the $400 million debt securitisation facility, an equitable interest has been granted in certain trade receivables to a special purpose trust, which is managed by a major Australian bank. The facility is subject to the periodic renewal of the facility agreement and is currently committed until May 2014. The Group has therefore classified the facility as non-current at April 2013. Interest payable on the facility is based on BBSY plus a margin.
For
per
sona
l use
onl
y

METCASH FINANCIAL REPORT 2013
NOTES TO THE FINANCIAL STATEMENTS
Year ended 30 April 2013
70
17. INTEREST BEARING LOANS AND BORROWINGS (Continued)
The terms of the facility require that, at any time, the book value of the securitised receivables must exceed by at least a certain proportional amount, the funds drawn under the facility. At the end of the financial year, trade receivables of $738.8 million (2012: $689.1 million) had been securitised, with $Nil (2012: $130 million) of funds drawn under the facility. The resultant security margin exceeded the minimum required at that time.
The facility may be terminated by the trust manager at short notice in the event of an act of default, which includes the insolvency of any of the individual companies securitising trade receivables, failure of the Group to remit funds when due, or a substantial deterioration in the overdue proportion of certain trade receivables.
The Group considers that it does not control the special purpose trust as it does not have power to determine the operating and financial policies of the trust, nor is the Group exposed to the risks and benefits of the trust. Accordingly, the Group does not consolidate the trust in its financial statements.
(v) US private placement (USPP) comprises three tranches of fixed coupon debt of US$70 million maturing September 2018, US$35 million maturing September 2019, and US$120 million maturing September 2023. The foreign exchange and fixed interest rate risk has been hedged using a series of cross currency interest rate swaps that mitigate these risks. The financial effect of these hedges is to convert the US$225 million of USPP fixed interest rate debt into $210.1 million of floating rate debt with interest payable at BBSW plus a margin.
The US$225 million USPP debt has been revalued at balance date to $248.9 million (2012: $240 million) and presented as interest bearing debt as disclosed above. The mark-to-market fair value of the associated cross currency interest rate swaps are separately disclosed within derivative financial instruments ($37.7 million – Note 10), the cash flow hedge reserve ($0.8 million – Note 21), and associated deferred tax assets ($0.3 million – Note 5). Together, these four components reflect the $210.1 million of hedged debt.
The USPP debt is subject to certain financial undertakings as detailed in Note 17(vi) below.
(vi) The Group must comply with three primary covenants which apply to the syndicated bank facility, both working capital bank facilities and the USPP debt. These covenants are: a fixed charges cover ratio (Earnings Before Interest, Tax, Depreciation, Amortisation and Net Rent (EBITDAR) divided by Total Net Interest plus Net Rent Expense), a senior leverage ratio (Total Group Debt divided by Earnings Before Interest, Tax, Depreciation and Amortisation (EBITDA)) and minimum shareholders funds (a fixed figure representing the Group share capital and reserves).
(a) FAIR VALUE
The carrying amount of the Group's current and non-current borrowings approximates their fair value. The weighted average effective interest rate on the syndicated and working capital bank loans, the debt securitisation and the USPP debt, after taking into account cross currency and interest rate swaps, at the end of the financial year was 5.55% (2012: 6.51%).
(b) DEFAULTS OR BREACHES
At the reporting date, there were no defaults or breaches on any of the loans.
(c) INTEREST RATE RISK AND LIQUIDITY RISK
Details regarding interest rate risk and liquidity risk are disclosed in Note 22.
18. DERIVATIVE FINANCIAL INSTRUMENTS
2013 2012
$’m $’m
Current
Interest rate swap contracts 0.2 0.6
Foreign currency forward contracts 0.3 0.3
0.5 0.9
Non current
Interest rate swap contracts 2.6 4.3
Foreign currency forward contracts 0.1 -
2.7 4.3
The above derivatives are designated and effective as hedging instruments and are carried at fair value through other comprehensive income.
For
per
sona
l use
onl
y
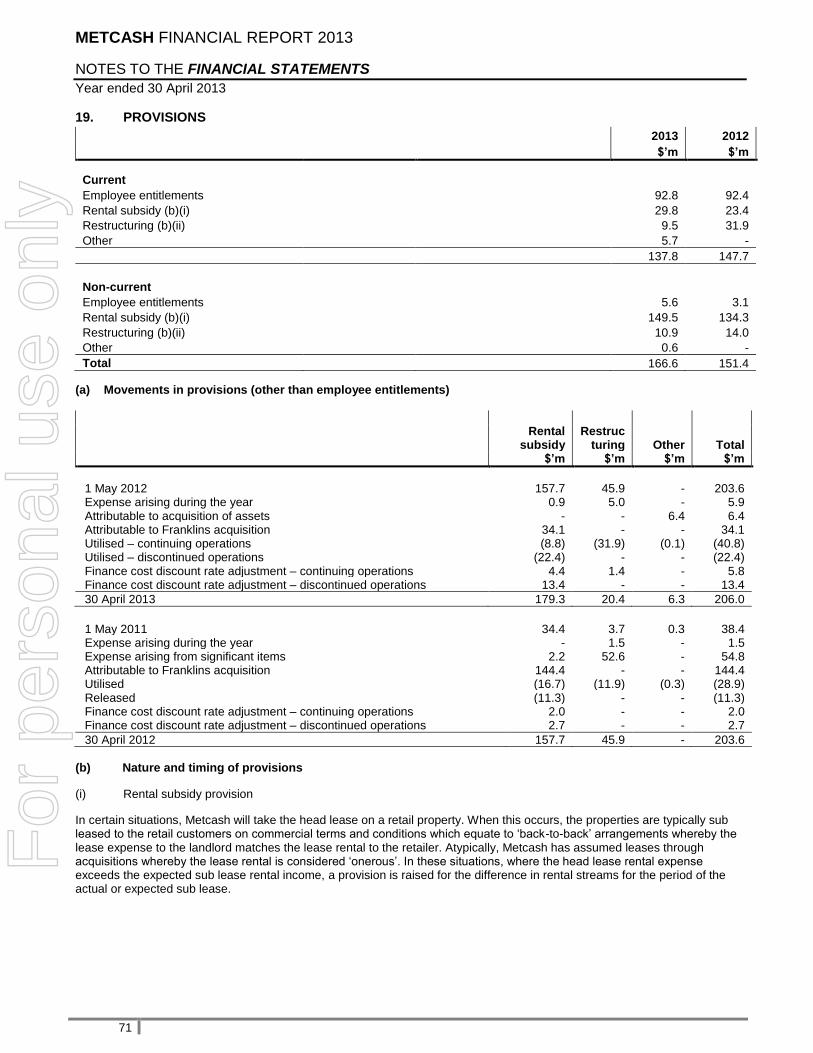
METCASH FINANCIAL REPORT 2013
NOTES TO THE FINANCIAL STATEMENTS
Year ended 30 April 2013
71
19. PROVISIONS
2013 2012
$’m $’m
Current
Employee entitlements 92.8 92.4
Rental subsidy (b)(i) 29.8 23.4
Restructuring (b)(ii) 9.5 31.9
Other 5.7 -
137.8 147.7
Non-current
Employee entitlements 5.6 3.1
Rental subsidy (b)(i) 149.5 134.3
Restructuring (b)(ii) 10.9 14.0
Other 0.6 -
Total 166.6 151.4
(a) Movements in provisions (other than employee entitlements)
Rental
subsidy Restruc
turing Other Total
$’m $’m $’m $’m
1 May 2012 157.7 45.9 - 203.6 Expense arising during the year 0.9 5.0 - 5.9 Attributable to acquisition of assets - - 6.4 6.4 Attributable to Franklins acquisition 34.1 - - 34.1 Utilised – continuing operations (8.8) (31.9) (0.1) (40.8) Utilised – discontinued operations (22.4) - - (22.4) Finance cost discount rate adjustment – continuing operations 4.4 1.4 - 5.8 Finance cost discount rate adjustment – discontinued operations 13.4 - - 13.4
30 April 2013 179.3 20.4 6.3 206.0
1 May 2011 34.4 3.7 0.3 38.4 Expense arising during the year - 1.5 - 1.5 Expense arising from significant items 2.2 52.6 - 54.8 Attributable to Franklins acquisition 144.4 - - 144.4 Utilised (16.7) (11.9) (0.3) (28.9) Released (11.3) - - (11.3) Finance cost discount rate adjustment – continuing operations 2.0 - - 2.0 Finance cost discount rate adjustment – discontinued operations 2.7 - - 2.7
30 April 2012 157.7 45.9 - 203.6
(b) Nature and timing of provisions
(i) Rental subsidy provision
In certain situations, Metcash will take the head lease on a retail property. When this occurs, the properties are typically sub leased to the retail customers on commercial terms and conditions which equate to „back-to-back‟ arrangements whereby the lease expense to the landlord matches the lease rental to the retailer. Atypically, Metcash has assumed leases through acquisitions whereby the lease rental is considered „onerous‟. In these situations, where the head lease rental expense exceeds the expected sub lease rental income, a provision is raised for the difference in rental streams for the period of the actual or expected sub lease.
For
per
sona
l use
onl
y

METCASH FINANCIAL REPORT 2013
NOTES TO THE FINANCIAL STATEMENTS
Year ended 30 April 2013
72
19. PROVISIONS (Continued)
(ii) Restructure provision
The provision represents obligations recognised by the Group as a result of the various restructuring initiatives announced in April 2012 and the decision to vacate the Silverwater and Blacktown distribution centres.
20. OTHER FINANCIAL LIABILITIES
2013 2012
$’m $’m
Current
Financial guarantee contracts 1.5 0.2
Lease incentives 0.2 0.4
1.7 0.6
Non - current
Put options written over non controlling interests (a) 31.0 -
Financial guarantee contracts 2.3 -
Lease incentives 1.4 1.4
Other payables 2.5 -
37.2 1.4
(a) Certain minority shareholders have the right under put options to require Metcash to acquire their shareholding, subject to specific terms and conditions. Where such an arrangement is deemed to be part of the business combination a financial liability is recognised on the acquisition date measured at the present value of the redemption amount under the option. The liability is subsequently remeasured at each reporting date at the estimated redemption value, with any change in redemption value recorded in Administration costs within profit and loss and the net present value unwind is recorded as a finance cost. Refer Note 29(b) for more details.
21. CONTRIBUTED EQUITY AND RESERVES
(a) Ordinary shares:
2013 2012
$'m $'m
Ordinary shares issued and fully paid 2,284.9 1,914.7
2013 2012
NUMBER
OF SHARES $'m NUMBER OF
SHARES $'m
Movements in ordinary shares on issue
At 1 May 771,345,864 1,914.7 768,853,644 1,904.9
Issued during the year:
- Exercise of employee options – at 392.5 cents per share - - 2,489,364 9.8
- Exercise of employee options – at 426.7 cents per share - - 2,856 -
- Institutional placement – at 350.0 cents per share 92,857,143 325.0 - -
- Share placement plan – at 303.0 cents per share 16,501,779 50.0 - -
- Equity raising costs net of tax - (4.8) - -
At 30 April 880,704,786 2,284.9 771,345,864 1,914.7
Fully paid ordinary shares carry one vote per share and carry the right to dividends.
For
per
sona
l use
onl
y

METCASH FINANCIAL REPORT 2013
NOTES TO THE FINANCIAL STATEMENTS
Year ended 30 April 2013
73
21. CONTRIBUTED EQUITY AND RESERVES (Continued)
(b) Reserves:
SHARE-BASED
PAYMENTS RESERVE
CAPITAL RESERVE
CASH FLOW
HEDGE RESERVE
FOREIGN CURRENCY
TRANSLATION RESERVE TOTAL
$'m $'m $'m $'m $'m
At 1 May 2011 22.3 12.8 - (6.9) 28.2
Foreign currency translation adjustments - - - 1.0 1.0
Share-based payments 1.3 - - - 1.3
Movement in fair value of derivatives - - (4.5) - (4.5)
At 30 April 2012 23.6 12.8 (4.5) (5.9) 26.0
Foreign currency translation adjustments - - - 0.3 0.3
Share-based payments 0.4 - - - 0.4
Acquisition of non controlling interest* - 22.1 - - 22.1
Reclassified to profit or loss during the year - - 0.6 - 0.6
Movement in fair value of derivatives - - 3.0 - 3.0
Tax expense related to fair value movements - - (0.9) - (0.9)
Transfer to retained earnings (23.4) (34.9) - - (58.3)
At 30 April 2013 0.6 - (1.8) (5.6) (6.8)
Nature and purpose of reserves
Share-based payments reserve This reserve is used to record the value of equity benefits provided to employees and executive directors as part of their remuneration. Refer to Note 25 for further details of these plans. Once a share option has lapsed the Group no longer has any obligation to convert these options into share capital. The amount transferred to retained earnings represents the value of options previously recognised as an expense through the Statement of Comprehensive Income that have now lapsed.
Capital reserve The capital reserve is used to accumulate realised capital profits. The reserve can be used to pay dividends or issue bonus shares.
* On 31 July 2012 Metcash Limited effectively acquired, through its wholly owned subsidiary Mittenmet Limited, the remaining 49.9% equity interest in the Mitre 10 Group. As part of the initial 50.1% acquisition a series of Redeemable Convertible Preference Shares (RCPS) were issued by Mittenmet to former Mitre 10 shareholders. The RCPS entitled the holders to a 49.9% equity interest in Mittenmet and gave Metcash the right to request Mittenmet redeem the RCPS for cash. On 31 July 2012 Metcash exercised its right and the RCPS were redeemed for a consideration of $46.5 million. The redemption is treated as a transaction between equity holders in accordance with AASB 127 Consolidated and Separate Financial Statements. The difference between the non controlling interest of $70 million assumed, the redemption consideration of $46.5 million and transaction costs of $1.4 million has been recognised as a credit to the capital reserve. The capital reserve consisted of a combination of residual retained profits relating to the non controlling interest of Mittenmet which was acquired by the Group and legacy amounts relating to profits on disposals of capital assets. These realised amounts have been transferred to retained earnings.
Cash flow hedge reserve This reserve records the portion of the unrealised gain or loss on a hedging instrument in a cash flow hedge that is determined to be an effective hedge.
For
per
sona
l use
onl
y

METCASH FINANCIAL REPORT 2013
NOTES TO THE FINANCIAL STATEMENTS
Year ended 30 April 2013
74
21. CONTRIBUTED EQUITY AND RESERVES (Continued)
Foreign currency translation reserve
The foreign currency translation reserve is used to record exchange differences arising from the translation of the financial statements of foreign subsidiaries. It is also used to record the effect of hedging net investments in foreign operations.
2013 2012
$'m $'m
Retained earnings
At 1 May 86.3 208.0
Profit for the year 206.0 90.0
Transfer from Capital Reserve and Share Based Payments Reserve 58.3 -
Dividends paid (243.9) (211.7)
At 30 April 106.7 86.3
Other equity
At 30 April (765.9) (765.9)
The other equity account is used to record the reverse acquisition adjustment on application of AASB 3 Business Combinations in 2005. Refer also Note 2(b)(iv).
22. FINANCIAL RISK MANAGEMENT OBJECTIVES AND POLICIES
FINANCIAL RISK MANAGEMENT OBJECTIVES AND POLICIES
The Group‟s principal financial instruments comprise bank loans, bonds and overdrafts, finance and operating leases, cash and short-term deposits and derivatives.
The main purpose of these instruments is to raise finance for the Group‟s operations. The Group has various other financial assets and liabilities such as trade receivables and payables, which arise directly from its operations. The Group manages its exposure to key financial risks including interest rate and credit risks in accordance with the Group's financial risk management policies. The objective of the policy is to support delivery of the Group's financial targets while protecting future financial security.
The Group enters into a limited number of derivative transactions from time to time principally to manage interest rate and foreign currency risks arising from the Group‟s operations and its sources of finance.
The main risks arising from the Group‟s financial instruments are cash flow interest rate risk, foreign exchange risk and credit risk. The Board reviews and agrees policies for managing each of these risks and they are detailed below.
Details of the significant accounting policies and methods adopted, including the criteria for recognition, the basis of measurement and the basis on which income and expenses are recognised, in respect of each class of financial instrument, financial liability and equity instrument are disclosed in Note 2 Summary of Significant Accounting Policies.
RISK EXPOSURES AND LIQUIDITY RISK EXPOSURES
Interest rate risk
The Group‟s exposure to the risk of changes in market interest rates relates primarily to the Group‟s bank debt obligations with a floating interest rate.
Metcash manages this risk by entering into interest rate swap contracts with various major Australian banks. At 30 April 2013 the principal hedged was $200 million with a weighted average hedge maturity of 1 year and a weighted average interest rate of 5.14%. The Group considers these derivatives to be effective hedges in accordance with AASB 139 Financial Instruments: Recognition and Measurement and therefore treats them as cash flow hedges. These interest rate swap contracts, which had a notional principal value of $200 million (2012: $370 million) had a fair value at the end of the financial year of negative $3.4 million (2012: negative $4.9 million). These contracts are exposed to fair value movements if the interest rate curve changes.
For
per
sona
l use
onl
y
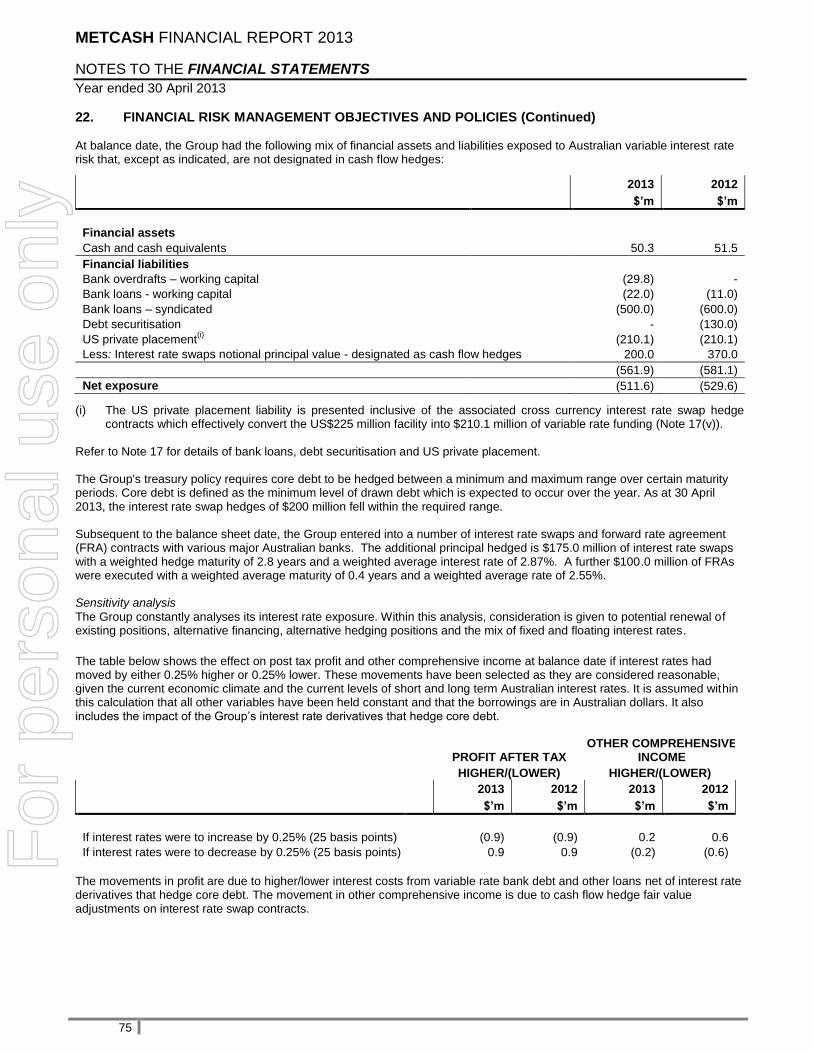
METCASH FINANCIAL REPORT 2013
NOTES TO THE FINANCIAL STATEMENTS
Year ended 30 April 2013
75
22. FINANCIAL RISK MANAGEMENT OBJECTIVES AND POLICIES (Continued) At balance date, the Group had the following mix of financial assets and liabilities exposed to Australian variable interest rate risk that, except as indicated, are not designated in cash flow hedges:
2013 2012
$’m $’m
Financial assets
Cash and cash equivalents 50.3 51.5
Financial liabilities
Bank overdrafts – working capital (29.8) -
Bank loans - working capital (22.0) (11.0)
Bank loans – syndicated (500.0) (600.0)
Debt securitisation - (130.0)
US private placement(i)
(210.1) (210.1)
Less: Interest rate swaps notional principal value - designated as cash flow hedges 200.0 370.0
(561.9) (581.1)
Net exposure (511.6) (529.6)
(i) The US private placement liability is presented inclusive of the associated cross currency interest rate swap hedge contracts which effectively convert the US$225 million facility into $210.1 million of variable rate funding (Note 17(v)).
Refer to Note 17 for details of bank loans, debt securitisation and US private placement. The Group's treasury policy requires core debt to be hedged between a minimum and maximum range over certain maturity periods. Core debt is defined as the minimum level of drawn debt which is expected to occur over the year. As at 30 April 2013, the interest rate swap hedges of $200 million fell within the required range.
Subsequent to the balance sheet date, the Group entered into a number of interest rate swaps and forward rate agreement (FRA) contracts with various major Australian banks. The additional principal hedged is $175.0 million of interest rate swaps with a weighted hedge maturity of 2.8 years and a weighted average interest rate of 2.87%. A further $100.0 million of FRAs were executed with a weighted average maturity of 0.4 years and a weighted average rate of 2.55%. Sensitivity analysis
The Group constantly analyses its interest rate exposure. Within this analysis, consideration is given to potential renewal of existing positions, alternative financing, alternative hedging positions and the mix of fixed and floating interest rates. The table below shows the effect on post tax profit and other comprehensive income at balance date if interest rates had moved by either 0.25% higher or 0.25% lower. These movements have been selected as they are considered reasonable, given the current economic climate and the current levels of short and long term Australian interest rates. It is assumed within this calculation that all other variables have been held constant and that the borrowings are in Australian dollars. It also includes the impact of the Group‟s interest rate derivatives that hedge core debt.
PROFIT AFTER TAX OTHER COMPREHENSIVE
INCOME
HIGHER/(LOWER) HIGHER/(LOWER)
2013 2012 2013 2012
$’m $’m $’m $’m
If interest rates were to increase by 0.25% (25 basis points) (0.9) (0.9) 0.2 0.6
If interest rates were to decrease by 0.25% (25 basis points) 0.9 0.9 (0.2) (0.6)
The movements in profit are due to higher/lower interest costs from variable rate bank debt and other loans net of interest rate derivatives that hedge core debt. The movement in other comprehensive income is due to cash flow hedge fair value adjustments on interest rate swap contracts.
For
per
sona
l use
onl
y

METCASH FINANCIAL REPORT 2013
NOTES TO THE FINANCIAL STATEMENTS
Year ended 30 April 2013
76
22. FINANCIAL RISK MANAGEMENT OBJECTIVES AND POLICIES (Continued) Liquidity risk and funding management
Liquidity risk is the risk that the Group will be unable to meet its payment obligations when they fall due under normal and stress circumstances. To limit this risk, the Group manages assets with liquidity in mind, and monitors future cash flows and liquidity on a daily basis. The Group has five different sources of primary debt funding, of which 53.0% have been utilised at 30 April 2013. The Group monitors forecasts of liquidity reserves on the basis of expected cash flow. Remaining contractual maturities Remaining contractual liabilities consist of non-interest bearing trade and other payables amounting to $1,335.3 million (2012: $1,369.5 million) (Note 16) for the Group and are due in one year or less.
Maturity analysis of financial assets and liabilities based on contracted date The risk implied from the values shown in the table below reflects a balanced view of cash inflows and outflows. Leasing obligations, trade payables and other financial liabilities mainly originate from the financing of assets that are used in ongoing operations such as property, plant, equipment and investments in working capital such as inventories and trade receivables. These assets are considered in the Group's overall liquidity risk. The following table reflects the contracted dates of settlement of financial assets and liabilities. Except where these exposures are provided for, these are also the expected dates of settlement.
1 YEAR OR LESS 1-5 YEARS MORE THAN 5 YEARS
TOTAL
$’m $’m $’m $’m
Year ended 30 April 2013
Financial assets
Cash and cash equivalents 50.3 - - 50.3
Trade and other receivables 1,066.8 60.4 - 1,127.2
Derivative financial instruments 0.6 - 37.7 38.3
1,117.7 60.4 37.7 1,215.8
Financial liabilities
Trade and other payables 1,335.6 - - 1,335.6
Finance lease liability 5.7 6.3 - 12.0
Financial guarantee contracts 1.5 2.3 - 3.8 Put options written over non controlling interests - 31.0 - 31.0
Bank and other loans 51.8 500.0 248.9 800.7
Derivative financial instruments 0.5 2.7 - 3.2
1,395.1 542.3 248.9 2,186.3
1 YEAR OR LESS 1-5 YEARS MORE THAN 5 YEARS
TOTAL
$’m $’m $’m $’m
Year ended 30 April 2012
Financial assets
Cash and cash equivalents 51.5 - - 51.5
Trade and other receivables 1,031.1 82.8 - 1,113.9
Derivative financial instruments - - 27.8 27.8
1,082.6 82.8 27.8 1,193.2
Financial liabilities
Trade and other payables 1,369.5 - - 1,369.5
Finance lease liability 6.8 9.1 - 15.9
Financial guarantee contracts 0.2 - - 0.2
Bank and other loans 11.0 730.0 240.0 981.0
Derivative financial instruments 0.9 4.3 - 5.2
1,388.4 743.4 240.0 2,371.8
For
per
sona
l use
onl
y

METCASH FINANCIAL REPORT 2013
NOTES TO THE FINANCIAL STATEMENTS
Year ended 30 April 2013
77
22. FINANCIAL RISK MANAGEMENT OBJECTIVES AND POLICIES (Continued)
At balance date, the Group had unused credit facilities available for its immediate use as follows:
TOTAL
FACILITY
DEBT USAGE
GUARANTEES & OTHER
USAGE
CASH
FACILITY
AVAILABLE
$’m $’m $’m $’m $’m
Syndicated facility 700.0 500.0 - - 200.0
Securitisation facility 400.0 - - - 400.0
US private placement (i)
210.1 210.1 - - -
Bank guarantee facility (ii)
25.3 - 24.4 - 0.9
Working capital/guarantees 150.0 29.8 41.1 - 79.1
Working capital 75.0 22.0 - - 53.0
1,560.4 761.9 65.5 - 733.0
Cash & cash equivalents - - - 50.3 50.3
1,560.4 761.9 65.5 50.3 783.3
(i) The US Private Placement liability is presented inclusive of the associated cross currency interest rate swap hedge contracts which effectively convert the US$225 million facility into $210.1 million of variable rate funding. (Note 17(v)).
(ii) Bank guarantee facility is used by Franklins Pty Limited to issue bank guarantees for leases and Work Cover obligations. The facility is indemnified by Metcash Trading Limited.
Derivative financial liabilities
The table below details the liquidity risk arising from derivative liabilities held by the Group at the reporting date.
1-6 MTHS 6-12 MTHS 1-5 YEARS >5 YEARS TOTAL
$’m $’m $’m $’m $’m
Year ended 30 April 2013
Derivative liabilities - net settled (1.0) (1.2) (0.6) - (2.8)
Derivative liabilities - gross settled
- Inflows 37.0 9.5 11.8 - 58.3
- Outflows (37.2) (9.6) (11.9) - (58.7)
Net maturity (1.2) (1.3) (0.7) - (3.2)
Year ended 30 April 2012
Derivative liabilities - net settled (1.4) (1.8) (2.0) - (5.2)
Derivative liabilities - gross settled
- Inflows 19.4 3.3 - - 22.7
- Outflows (19.7) (3.3) - - (23.0)
Net maturity (1.7) (1.8) (2.0) - (5.5)
Net settled derivatives comprise interest rate swap contracts that are used to hedge floating rate interest payable on bank debts. Gross settled derivatives comprise forward exchange contracts that are used to hedge anticipated purchase commitments. Credit risk
The Group trades with a large number of customers and it is Group policy that all customers who wish to trade on credit terms are subject to credit verification procedures. In addition, where a loan has been provided, the Group will obtain security over certain assets of the customer wherever possible.
The management of the receivables balance is the key in the minimisation of the Group‟s potential bad debt exposure. Receivables balances are monitored on an ongoing basis and a formal review of all balances occurs every 6 months. Where necessary, appropriate provisions are established.
As identified in Note 8 (Trade and Other Receivables), the current level of impairment provision represents 4.4% of the receivables balance.
All derivatives are transacted with financial institutions that have high investment grade credit ratings. As at 30 April 2013, all derivative counterparts had a credit rating of AA- or better.
For
per
sona
l use
onl
y

METCASH FINANCIAL REPORT 2013
NOTES TO THE FINANCIAL STATEMENTS
Year ended 30 April 2013
78
22. FINANCIAL RISK MANAGEMENT OBJECTIVES AND POLICIES (Continued)
The Group has granted a financial guarantee relating to the bank loan of its associate, Adcome Pty Ltd. The guarantee represents a put option held by Adcome's bank, whereby the holder has the right to require the non Metcash shareholders to „put‟ their remaining shares in Adcome Pty Ltd back to Metcash within an agreed period and under certain prescribed circumstances in return for repayment of the debt by Adcome Pty Ltd to the holder. The estimate of the maximum amount payable in respect of the put option, if exercised, is $52.8 million (2012: $58.3 million), as defined in the option deed. The fair value of the financial guarantee contract at the reporting date was $3.6 million (2012: $0.2 million) and is recognised as a financial liability (Note 20). There are no significant concentrations of credit risk within the Group.
Foreign currency risk
The Group is exposed to foreign exchange fluctuations on transactions and balances in New Zealand dollars in respect of the Tasman Liquor business unit. These operations represent less than 5% of total sales and total profit after tax, and as such the exposure is minimal. In addition, the Group undertakes some foreign currency transactions when purchasing goods and services. The Group enters into forward foreign exchange contracts to manage the risk associated with anticipated purchase commitments denominated in foreign currencies.
The amount of foreign exchange cover is based on anticipated future purchases in light of current conditions in foreign markets, commitments from customers and experience. The Group‟s exposure to foreign exchange risk on principal and interest payments in relation to the US$225 million USPP facility have been hedged using cross currency interest rate swaps (Note 17(v)). Price risk
The Group purchases energy in the form of electricity, petrol and oil, LPG and water from various sources. These costs represent less than 5% of combined Distribution and Administrative expenses. The group enters into periodic contracts for supply of these products via third party tender. No derivative price instruments are used to manage price risk associated with these commodities as the Group's exposure to commodity price risk is minimal. Capital management
The Board‟s intention is to return earnings to shareholders while retaining adequate funds within the business to reinvest in future growth opportunities. A minimum payout ratio of 60% of underlying earnings per share has been set by the Board. A dividend reinvestment plan is in existence, but has been suspended by the Board. The plan is able to be reinstituted at any time.
The Group provides benefits to employees of the Group in the form of share-based payment transactions, whereby employees render services in exchange for shares or rights over shares (equity-settled transactions). The Group provides these benefits in the form of the Metcash Executive and Senior Managers Performance Rights Plan (Rights Plan) and the Metcash Employee Option Plan (MEOP). Details are disclosed in Note 25.
The Board and management set out to achieve and maintain Statement of Financial Position ratios that would satisfy an investment grade rating. Certain Statement of Financial Position ratios are imposed under the Group‟s banking facilities, as summarised in Note 17.
Management monitor capital through the gearing ratio (debt / debt plus total equity). The gearing ratios at 30 April 2013 and 2012 were 33.3% and 42.6% respectively. This is within an acceptable target range.
For
per
sona
l use
onl
y

METCASH FINANCIAL REPORT 2013
NOTES TO THE FINANCIAL STATEMENTS
Year ended 30 April 2013
79
22. FINANCIAL RISK MANAGEMENT OBJECTIVES AND POLICIES (Continued) Fair value
The Group uses various methods in estimating the fair value of a financial instrument. The different methods have been defined as follows:
Level 1: the fair value is calculated using quoted prices in active markets
Level 2: the fair value is estimated using inputs other than quoted prices included in Level 1 that are observable for the asset or liability, either directly (as prices ) or indirectly (derived from prices)
Level 3: the fair value is estimated using inputs for the asset or liability that are not based on observable market data. The table below analyses financial instruments carried at fair value, by valuation method:
LEVEL 1 LEVEL 2 LEVEL 3 TOTAL
$’m $’m $’m $’m
Year ended 30 April 2013
Derivative financial assets - 38.3 - 38.3
Derivative financial liabilities - (3.2) - (3.2)
Financial guarantee contracts - (3.8) - (3.8)
- 31.3 - 31.3
Year ended 30 April 2012
Derivative financial assets - 27.8 - 27.8
Derivative financial liabilities - (5.2) - (5.2)
Financial guarantee contracts - (0.2) - (0.2)
- 22.4 - 22.4
The carrying amount of the financial assets and liabilities recorded in the financial statements approximates their fair value as at the reporting date.
23. COMMITMENTS
(a) Operating lease commitments
The Group has entered into commercial leases on certain forklifts, land and buildings. Contingent rentals are payable to reflect movements in the Consumer Price Index on certain leases and to reflect the turnover of certain stores occupying the land and buildings. Future minimum rentals payable under non-cancellable operating leases as at 30 April are as follows:
2013 2012
$’m $’m
Within 1 year 206.1 209.5
After 1 year but not more than 5 years 641.3 622.9
More than 5 years 750.2 691.1
Aggregate lease expenditure contracted for at reporting date 1,597.6 1,523.5
(b) Operating lease receivables
Certain properties under operating lease have been sublet to third parties. The future lease payments expected to be received at the reporting date are:
2013 2012
$’m $’m
Within 1 year 91.6 83.9
After 1 year but not more than 5 years 279.9 263.2
More than 5 years 390.1 372.4
Aggregate lease income contracted for at the reporting date. 761.6 719.5
For
per
sona
l use
onl
y

METCASH FINANCIAL REPORT 2013
NOTES TO THE FINANCIAL STATEMENTS
Year ended 30 April 2013
80
23. COMMITMENTS (Continued) (c) Finance lease commitments
The Group has finance leases for various vehicles and equipment. The weighted average interest rate implicit in the leases is 8.52% (2012: 9.19%). Future minimum lease payments under finance leases together with the present value of the net minimum lease payments for the Group are as follows:
FUTURE MINIMUM LEASE PAYMENTS
PRESENT VALUE OF MINIMUM LEASE
PAYMENTS
2013 2012 2013 2012
$’m $’m $’m $’m
Within 1 year 6.6 7.7 5.7 6.8
After 1 year but not more than 5 years 7.0 10.4 6.3 9.1
More than 5 years - - - -
13.6 18.1 12.0 15.9
Less amounts representing finance charges (1.6) (2.2) - -
Present value of minimum lease payments 12.0 15.9 12.0 15.9
(d) Capital expenditure commitments
At 30 April 2013, the Group has committed $51.0 million (2012: $Nil) towards significant capital expenditure on the Project Mustang NSW warehouse automation project. These commitments are not provided for at the reporting date and are estimated to be due within the next 2 years.
For
per
sona
l use
onl
y
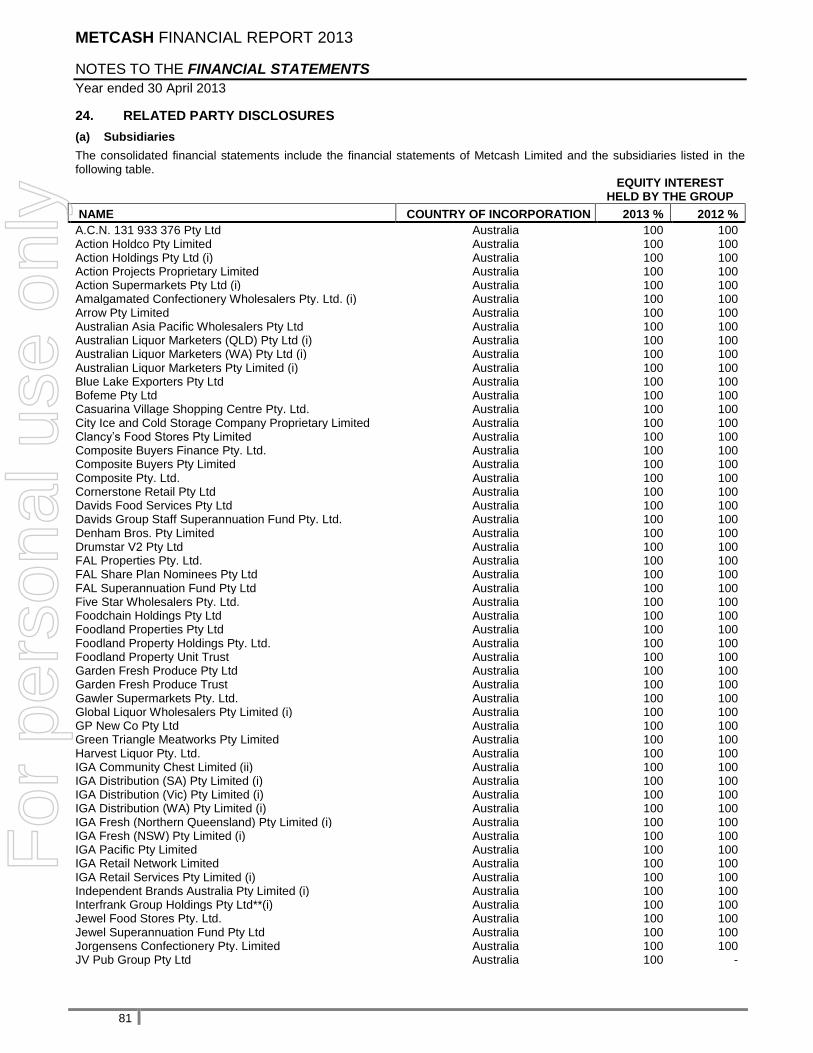
METCASH FINANCIAL REPORT 2013
NOTES TO THE FINANCIAL STATEMENTS
Year ended 30 April 2013
81
24. RELATED PARTY DISCLOSURES
(a) Subsidiaries
The consolidated financial statements include the financial statements of Metcash Limited and the subsidiaries listed in the following table.
EQUITY INTEREST HELD BY THE GROUP
NAME COUNTRY OF INCORPORATION 2013 % 2012 %
A.C.N. 131 933 376 Pty Ltd Australia 100 100 Action Holdco Pty Limited Australia 100 100 Action Holdings Pty Ltd (i) Australia 100 100 Action Projects Proprietary Limited Australia 100 100 Action Supermarkets Pty Ltd (i) Australia 100 100 Amalgamated Confectionery Wholesalers Pty. Ltd. (i) Australia 100 100 Arrow Pty Limited Australia 100 100 Australian Asia Pacific Wholesalers Pty Ltd Australia 100 100 Australian Liquor Marketers (QLD) Pty Ltd (i) Australia 100 100 Australian Liquor Marketers (WA) Pty Ltd (i) Australia 100 100 Australian Liquor Marketers Pty Limited (i) Australia 100 100 Blue Lake Exporters Pty Ltd Australia 100 100 Bofeme Pty Ltd Australia 100 100 Casuarina Village Shopping Centre Pty. Ltd. Australia 100 100 City Ice and Cold Storage Company Proprietary Limited Australia 100 100 Clancy‟s Food Stores Pty Limited Australia 100 100 Composite Buyers Finance Pty. Ltd. Australia 100 100 Composite Buyers Pty Limited Australia 100 100 Composite Pty. Ltd. Australia 100 100 Cornerstone Retail Pty Ltd Australia 100 100 Davids Food Services Pty Ltd Australia 100 100 Davids Group Staff Superannuation Fund Pty. Ltd. Australia 100 100 Denham Bros. Pty Limited Australia 100 100 Drumstar V2 Pty Ltd Australia 100 100 FAL Properties Pty. Ltd. Australia 100 100 FAL Share Plan Nominees Pty Ltd Australia 100 100 FAL Superannuation Fund Pty Ltd Australia 100 100 Five Star Wholesalers Pty. Ltd. Australia 100 100 Foodchain Holdings Pty Ltd Australia 100 100 Foodland Properties Pty Ltd Australia 100 100 Foodland Property Holdings Pty. Ltd. Australia 100 100 Foodland Property Unit Trust Australia 100 100 Garden Fresh Produce Pty Ltd Australia 100 100 Garden Fresh Produce Trust Australia 100 100 Gawler Supermarkets Pty. Ltd. Australia 100 100 Global Liquor Wholesalers Pty Limited (i) Australia 100 100 GP New Co Pty Ltd Australia 100 100 Green Triangle Meatworks Pty Limited Australia 100 100 Harvest Liquor Pty. Ltd. Australia 100 100 IGA Community Chest Limited (ii) Australia 100 100 IGA Distribution (SA) Pty Limited (i) Australia 100 100 IGA Distribution (Vic) Pty Limited (i) Australia 100 100 IGA Distribution (WA) Pty Limited (i) Australia 100 100 IGA Fresh (Northern Queensland) Pty Limited (i) Australia 100 100 IGA Fresh (NSW) Pty Limited (i) Australia 100 100 IGA Pacific Pty Limited Australia 100 100 IGA Retail Network Limited Australia 100 100 IGA Retail Services Pty Limited (i) Australia 100 100 Independent Brands Australia Pty Limited (i) Australia 100 100 Interfrank Group Holdings Pty Ltd**(i) Australia 100 100 Jewel Food Stores Pty. Ltd. Australia 100 100 Jewel Superannuation Fund Pty Ltd Australia 100 100 Jorgensens Confectionery Pty. Limited Australia 100 100 JV Pub Group Pty Ltd Australia 100 -
For
per
sona
l use
onl
y
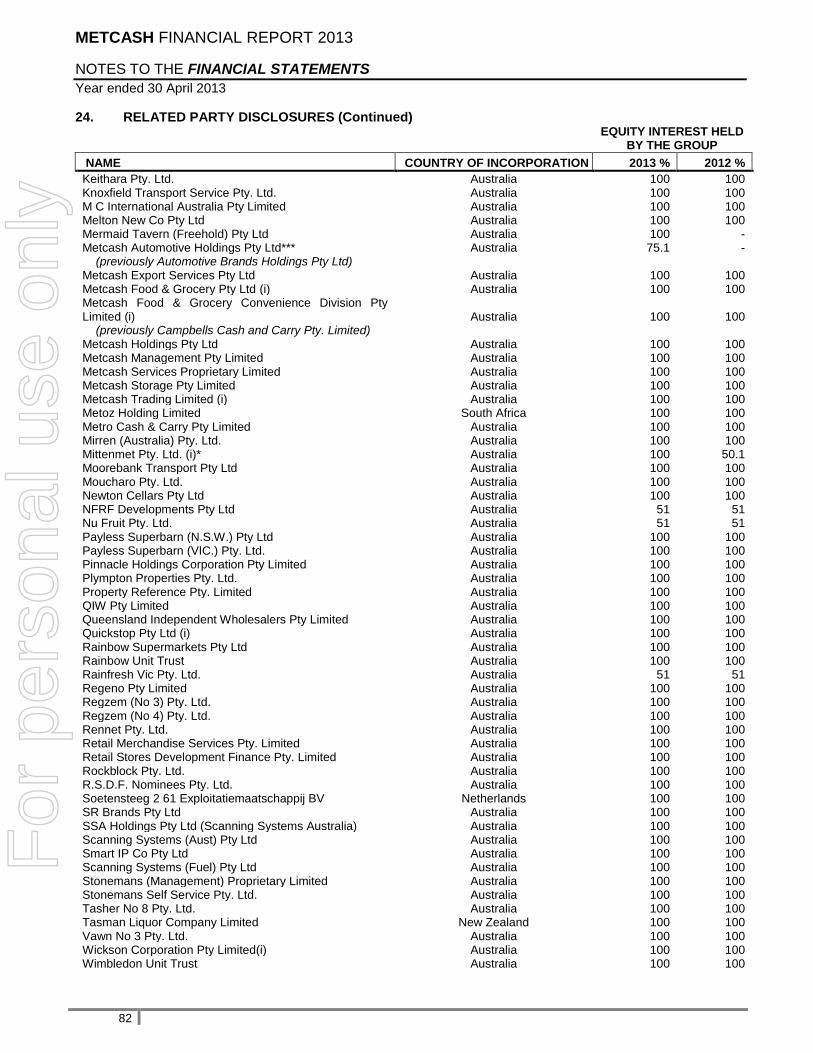
METCASH FINANCIAL REPORT 2013
NOTES TO THE FINANCIAL STATEMENTS
Year ended 30 April 2013
82
24. RELATED PARTY DISCLOSURES (Continued)
EQUITY INTEREST HELD BY THE GROUP
NAME COUNTRY OF INCORPORATION 2013 % 2012 %
Keithara Pty. Ltd. Australia 100 100 Knoxfield Transport Service Pty. Ltd. Australia 100 100 M C International Australia Pty Limited Australia 100 100 Melton New Co Pty Ltd Australia 100 100 Mermaid Tavern (Freehold) Pty Ltd Australia 100 - Metcash Automotive Holdings Pty Ltd*** Australia 75.1 - (previously Automotive Brands Holdings Pty Ltd)
Metcash Export Services Pty Ltd Australia 100 100 Metcash Food & Grocery Pty Ltd (i) Australia 100 100 Metcash Food & Grocery Convenience Division Pty Limited (i) Australia 100 100 (previously Campbells Cash and Carry Pty. Limited)
Metcash Holdings Pty Ltd Australia 100 100 Metcash Management Pty Limited Australia 100 100 Metcash Services Proprietary Limited Australia 100 100 Metcash Storage Pty Limited Australia 100 100 Metcash Trading Limited (i) Australia 100 100 Metoz Holding Limited South Africa 100 100 Metro Cash & Carry Pty Limited Australia 100 100 Mirren (Australia) Pty. Ltd. Australia 100 100 Mittenmet Pty. Ltd. (i)* Australia 100 50.1 Moorebank Transport Pty Ltd Australia 100 100 Moucharo Pty. Ltd. Australia 100 100 Newton Cellars Pty Ltd Australia 100 100 NFRF Developments Pty Ltd Australia 51 51 Nu Fruit Pty. Ltd. Australia 51 51 Payless Superbarn (N.S.W.) Pty Ltd Australia 100 100 Payless Superbarn (VIC.) Pty. Ltd. Australia 100 100 Pinnacle Holdings Corporation Pty Limited Australia 100 100 Plympton Properties Pty. Ltd. Australia 100 100 Property Reference Pty. Limited Australia 100 100 QIW Pty Limited Australia 100 100 Queensland Independent Wholesalers Pty Limited Australia 100 100 Quickstop Pty Ltd (i) Australia 100 100 Rainbow Supermarkets Pty Ltd Australia 100 100 Rainbow Unit Trust Australia 100 100 Rainfresh Vic Pty. Ltd. Australia 51 51 Regeno Pty Limited Australia 100 100 Regzem (No 3) Pty. Ltd. Australia 100 100 Regzem (No 4) Pty. Ltd. Australia 100 100 Rennet Pty. Ltd. Australia 100 100 Retail Merchandise Services Pty. Limited Australia 100 100 Retail Stores Development Finance Pty. Limited Australia 100 100 Rockblock Pty. Ltd. Australia 100 100 R.S.D.F. Nominees Pty. Ltd. Australia 100 100 Soetensteeg 2 61 Exploitatiemaatschappij BV Netherlands 100 100 SR Brands Pty Ltd Australia 100 100 SSA Holdings Pty Ltd (Scanning Systems Australia) Australia 100 100 Scanning Systems (Aust) Pty Ltd Australia 100 100 Smart IP Co Pty Ltd Australia 100 100 Scanning Systems (Fuel) Pty Ltd Australia 100 100 Stonemans (Management) Proprietary Limited Australia 100 100 Stonemans Self Service Pty. Ltd. Australia 100 100 Tasher No 8 Pty. Ltd. Australia 100 100 Tasman Liquor Company Limited New Zealand 100 100 Vawn No 3 Pty. Ltd. Australia 100 100 Wickson Corporation Pty Limited(i) Australia 100 100 Wimbledon Unit Trust Australia 100 100
For
per
sona
l use
onl
y

METCASH FINANCIAL REPORT 2013
NOTES TO THE FINANCIAL STATEMENTS
Year ended 30 April 2013
83
24. RELATED PARTY DISCLOSURES (Continued)
* Mittenmet Pty Ltd
The consolidated financial statements include the financial statements of Mittenmet Pty Ltd and the subsidiaries listed in the following table.
EQUITY INTEREST HELD BY THE GROUP
NAME COUNTRY OF INCORPORATION 2013 % 2012 %
ACN 008 698 093 (WA) Pty Ltd Australia 99.44 99.44 Anzam (Aust.) Pty Ltd (i) Australia 100 100 Australian Hardware Support Services Pty Ltd (i) Australia 100 100 Capeview Hardware Pty Ltd. Australia 100 - Chelsea Heights Operations Pty Limited (i) Australia 100 100 DIY Superannuation Pty Ltd (i) Australia 100 100 Echuca Hardware Pty Ltd (i) Australia 100 100 Faggs Geelong Pty Ltd Australia 75 - Handyman Stores Pty Ltd (i) Australia 100 100 Hardware Property Trust Australia 100 100 Himaco Pty Ltd (i) Australia 100 100 Lilydale Operations Pty Limited (i) Australia 100 100 Mega Property Management Pty Ltd (i) Australia 100 100 Mitre 10 Pty Ltd (i) Australia 100 100 Mitre 10 Australia Pty Ltd (i) Australia 100 100 Mitre 10 Mega Pty Ltd (i) Australia 100 100 Narellan Hardware Pty Ltd (i) Australia 100 100 National Retail Support Services Pty Ltd (i) Australia 100 100 Northern NSW Timber and Hardware Pty Ltd Australia 100 100 Roma Hardware Pty Ltd Australia 100 -
(previously Portland Hardware Pty Ltd)
South Coast Operations Pty Ltd (i) Australia 100 100 South West Operations Pty Ltd (i) Australia 100 100 Sydney Importing Co Limited (In Liquidation) Australia 97.65 97.65 Tasmania Hardware Pty Ltd Australia 80 - Trevisan Pty Ltd Australia 100 - Timber and Hardware Exchange Pty Ltd Australia 52 52 WA Hardware Services Pty Ltd (i) Australia 100 100 (i) These entities entered into a Deed of Assumption with Metcash Limited on 27 February 2013, a copy of which was
lodged with ASIC on 5 March 2013. In accordance with the Deed of Assumption each entity identified above joined the Deed of Cross Guarantee (refer Note 24(c)) on 27 February 2013.
** Interfrank Group Holdings Pty Ltd
The consolidated financial statements include the financial statements of Interfrank Group Holdings Pty Ltd and the subsidiaries listed in the following table:
EQUITY INTEREST HELD BY THE GROUP
NAME COUNTRY OF INCORPORATION 2013 % 2012 %
Franklins Pty Ltd (i) Australia 100 100 Franklins Supermarket Holdings Pty Ltd (i) Australia 100 100 Franklins Franchising Pty Ltd (i) Australia 100 100 Franklins Bankstown Square Pty Ltd (i) Australia 100 100 Franklins Bass Hill Pty Ltd (i) Australia 100 100 Franklins Blacktown Pty Ltd (i) Australia 100 100 Franklins Bonnyrigg Pty Ltd (i) Australia 100 100 Franklins Ulladulla Pty Ltd (i) Australia 100 100 Franklins Casula Pty Ltd (i) Australia 100 100 Franklins Cronulla Pty Ltd (i) Australia 100 100
For
per
sona
l use
onl
y

METCASH FINANCIAL REPORT 2013
NOTES TO THE FINANCIAL STATEMENTS
Year ended 30 April 2013
84
24. RELATED PARTY DISCLOSURES (Continued)
EQUITY INTEREST HELD BY THE GROUP
NAME COUNTRY OF INCORPORATION 2013 % 2012 %
Franklins Drummoyne Pty Ltd (i) Australia 100 100 Franklins Liverpool Pty Ltd (i) Australia 100 100 Franklins Macquarie Pty Ltd (i) Australia 100 100 Franklins Maroubra Pty Ltd (i) Australia 100 100 Franklins Merrylands Pty Limited (i) Australia 100 100 Franklins Moorebank Pty Limited (i) Australia 100 100 Franklins North Rocks Pty Ltd (i) Australia 100 100 Franklins Pennant Hills Pty Ltd (i) Australia 100 100 Franklins Penrith Nepean Pty Ltd (i) Australia 100 100 Franklins Penrith Plaza Pty Ltd (i) Australia 100 100 Franklins Rockdale Plaza Pty Ltd (i) Australia 100 100 Franklins Singleton Pty Ltd (i) Australia 100 100 Franklins Spit Junction Pty Ltd (i) Australia 100 100 Franklins Westleigh Pty Ltd (i) Australia 100 100 Franklins Wetherill Park Pty Ltd (i) Australia 100 100 Franklins Wentworthville Pty Ltd (i) Australia 100 100 Fresco Supermarket Holdings Pty Ltd (i) Australia 100 100 FW Viva 3 Pty Ltd (i) Australia 100 100
*** Metcash Automotive Holdings Pty Ltd (previously Automotive Brands Holdings Pty Ltd)
The consolidated financial statements include the financial statements of Metcash Automotive Holdings Pty Ltd (previously Automotive Brands Holdings Pty Ltd) and the subsidiaries listed in the following table.
EQUITY INTEREST HELD BY ABH GROUP
NAME COUNTRY OF INCORPORATION 2013 % 2012 %
Australian Automotive Distribution Pty Limited Australia 100 - Automotive Brands Group Pty Ltd Australia 100 - (b) Ultimate parent
Metcash Limited is the ultimate parent entity.
(c) Entities subject to class order relief Metcash Limited Pursuant to an order from ASIC under section 340(1) of the Corporations Act 2001 dated 23 April 2012 which is based on Class Order 98/1418 (Order), relief has been granted to certain controlled entities of Metcash Limited, being those marked (i), from the Corporations Act requirements for preparation, audit and lodgement of their financial reports. As a condition of the Order, Metcash Limited and the controlled entities, being those marked as (i) (the Closed Group) entered into a Deed of Cross Guarantee on 18 April 2012. The entities marked (ii) are also party to the Deed of Cross Guarantee, but are not eligible for inclusion in the financial reporting relief. The effect of the deed is that Metcash Limited has guaranteed to pay any deficiency in the event of winding up of these controlled entities. These controlled entities have also given similar guarantees in the event that Metcash Limited is wound up.
Mittenmet Pty Limited and Interfrank Group Holdings Pty Ltd were added to the Closed Group during the 2013 and 2012, respectively, including their subsidiaries identified in Note 24(a) and marked (i).
For
per
sona
l use
onl
y
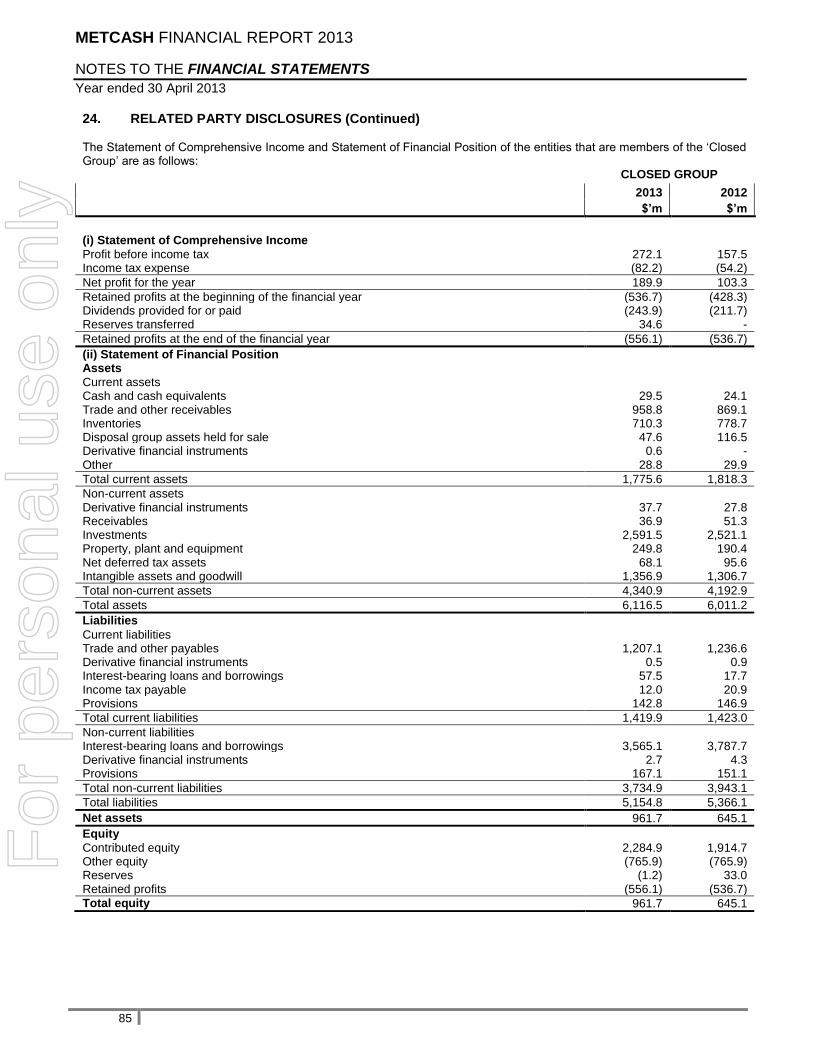
METCASH FINANCIAL REPORT 2013
NOTES TO THE FINANCIAL STATEMENTS
Year ended 30 April 2013
85
24. RELATED PARTY DISCLOSURES (Continued) The Statement of Comprehensive Income and Statement of Financial Position of the entities that are members of the „Closed Group‟ are as follows:
CLOSED GROUP
2013 2012
$’m $’m
(i) Statement of Comprehensive Income Profit before income tax 272.1 157.5 Income tax expense (82.2) (54.2)
Net profit for the year 189.9 103.3
Retained profits at the beginning of the financial year (536.7) (428.3) Dividends provided for or paid (243.9) (211.7) Reserves transferred 34.6 -
Retained profits at the end of the financial year (556.1) (536.7)
(ii) Statement of Financial Position Assets Current assets Cash and cash equivalents 29.5 24.1 Trade and other receivables 958.8 869.1 Inventories 710.3 778.7 Disposal group assets held for sale 47.6 116.5 Derivative financial instruments 0.6 - Other 28.8 29.9
Total current assets 1,775.6 1,818.3
Non-current assets Derivative financial instruments 37.7 27.8 Receivables 36.9 51.3 Investments 2,591.5 2,521.1 Property, plant and equipment 249.8 190.4 Net deferred tax assets 68.1 95.6 Intangible assets and goodwill 1,356.9 1,306.7
Total non-current assets 4,340.9 4,192.9
Total assets 6,116.5 6,011.2
Liabilities Current liabilities Trade and other payables 1,207.1 1,236.6 Derivative financial instruments 0.5 0.9 Interest-bearing loans and borrowings 57.5 17.7 Income tax payable 12.0 20.9 Provisions 142.8 146.9
Total current liabilities 1,419.9 1,423.0
Non-current liabilities Interest-bearing loans and borrowings 3,565.1 3,787.7 Derivative financial instruments 2.7 4.3 Provisions 167.1 151.1
Total non-current liabilities 3,734.9 3,943.1
Total liabilities 5,154.8 5,366.1
Net assets 961.7 645.1
Equity Contributed equity 2,284.9 1,914.7 Other equity (765.9) (765.9) Reserves (1.2) 33.0 Retained profits (556.1) (536.7)
Total equity 961.7 645.1
For
per
sona
l use
onl
y

METCASH FINANCIAL REPORT 2013
NOTES TO THE FINANCIAL STATEMENTS
Year ended 30 April 2013
86
24. RELATED PARTY DISCLOSURES (Continued)
(d) Transactions with related parties
SALES TO RELATED PARTIES
PURCHASES
FROM RELATED PARTIES
OTHER TRANSACTIONS WITH RELATED
PARTIES
RELATED PARTY $’m $’m $’m
Group
Associates
Sales to associates 2013 1,326.7 - -
2012 1,152.9 - -
Lease charges to associates 2013 - - 27.3
2012 - - 25.7
Dividends received from associates 2013 - - 0.6
2012 - - 1.1
Sale of businesses to associates 2013 - - 22.1
2012 - - - Parent
Associates
There were no transactions between the parent and its associates during the year (2012: nil). Subsidiaries
Dividend received 2013 - - 500.0
2012 - - 350.0
Interest expense 2013 - - 203.4
2012 - - 240.5
Terms and conditions of transactions with related parties
All transactions with related parties are made on normal commercial terms and conditions. Terms and conditions of the tax funding agreement are set out in Note 5.
Other transactions with Key Management Personnel Mr Barnes is Chairman of Samuel Smith and Sons Pty Ltd. Mrs Balfour is a director of Salmat Limited. Mr Butler is Chairman of AMP Superannuation Ltd. All organisations are suppliers to the Group under normal commercial terms and conditions. The total level of purchases from all companies is less than 0.2% of Metcash‟s annual purchases and is not considered material. During the year Metcash entered into arrangements in respect of two retail stores with Cheswell Capital Pty Limited (“Cheswell”). Cheswell is a wholly owned subsidiary of Chester Capital Pty Limited (“Chester”). Mr Jankelowitz is a Non Executive Director of Chester. The arrangements were concluded on an arm‟s length basis under normal commercial terms and conditions. As part of the arrangements Metcash provided loan funding of $500,000, repayable over 24 months, to Cheswell. The following details relate to the loan: Balance at the reporting date $478,114 Interest paid (17/12/2012 to 30/04/2013) $ 22,395 Interest rate 10.0% p.a.
Other than noted above there were no loans outstanding to Key Management Personnel or their related entities.
For
per
sona
l use
onl
y

METCASH FINANCIAL REPORT 2013
NOTES TO THE FINANCIAL STATEMENTS
Year ended 30 April 2013
87
24. RELATED PARTY DISCLOSURES (Continued)
(e) Amounts due from and payable to related parties
2013 2012
Related party $’m $’m
Group
Associates
Trade receivables - gross 114.0 111.5
Provision for impairment (14.5) (17.7)
99.5 93.8
Loans receivable – gross 15.9 48.8
Provision for impairment (6.5) (33.1)
9.4 15.7
Parent
Subsidiaries
Loans receivable 2,428.6 1,825.5
Loans payable 3,889.5 3,686.6 Terms and conditions of amounts due from and payable to related parties
Loans and trade receivables are due and payable on normal commercial terms and conditions.
25. SHARE-BASED PAYMENTS
(a) Types of share-based payment plans
The Group has two share-based incentive plans for employees and executive directors of the Group: the Metcash Executives and Senior Managers Performance Rights Plan (Rights Plan) and the legacy Metcash Employees Option Plan (MEOP). Fully paid ordinary shares issued under these plans rank equally with all other existing fully paid ordinary shares, in respect of voting and dividends rights. Metcash Executives and Senior Managers Performance Rights Plan (Rights Plan)
Metcash has two incentive schemes that operate within the Rights Plan structure:
i. The Short Term Incentive („STI‟) Rights Plan; and ii. The Long Term Incentive („LTI‟) Rights Plan.
i. The Short Term Incentive (‘STI’) Rights Plan
The STI program focuses behaviour towards achieving superior Company and business unit performance, which deliver better results to shareholders. Key Performance Indicators are established and measured at different levels throughout the business:
Corporate level - applies to most KMP and executives
Business level - applies to the KMP and executives from each business pillar After the end of each financial year, Executive performance is assessed against their individual KPIs to determine the amount of STI to be awarded. If these KPI are met, 75% of the STI reward amount is paid in July of each year after the release of the audited accounts. The remaining 25% is deferred for 15 months and released through the issue of Metcash ordinary shares, conditional upon the Executive being employed by the Company on 15 April of the year subsequent to the performance year. Any STI not paid is forfeited. For FY2013, the number of shares to be issued will be calculated by dividing the 25% STI reward dollar value by the Metcash VWAP for the five days ending 31 July 2013. These shares will be issued by 30 April 2014, but will be restricted from trading until 31 July 2014.
For
per
sona
l use
onl
y

METCASH FINANCIAL REPORT 2013
NOTES TO THE FINANCIAL STATEMENTS
Year ended 30 April 2013
88
25. SHARE-BASED PAYMENTS (Continued) (a) Types of share-based payment plans (continued)
ii. The Long Term Incentive (‘LTI’) Rights Plan
The Rights Plan provides selected employees with the opportunity to be rewarded with fully paid ordinary shares as an incentive to create long term growth in value for Metcash shareholders. The plan is administered by a trustee who may acquire (and hold in trust) shares for the benefit of participants. These shares are purchased on market or issued to the trustee once the performance rights vest. The essential elements of the Rights Plan are as follows:
each Performance Right is an entitlement to receive a fully paid ordinary share in the Company on terms and conditions determined by the Board, including vesting conditions linked to service and performance over a 3 year period;
Performance Rights are offered at no cost to the employee and as such, significantly fewer Performance Rights are offered than was the case with options;
persons offered Performance Rights will not be offered options under the MEOP or any other form of long term incentive;
Performance Rights do not carry voting or dividend rights, however shares issued upon vesting of Performance Rights will carry the same rights as other ordinary shares;
the number of Performance Rights granted is determined by dividing the value of an employee‟s long term incentive entitlement by the Company‟s share price at the time of issue;
the FY2013 plan hurdles were set at between 4% („lower bound hurdle rate‟) and 7% („upper bound hurdle rate‟) compound underlying EPS growth, both adjusted up or down for the effects of actual year-on-year inflation/deflation, over a three year vesting period as follows:
- Achieving an underlying EPS growth rate equivalent to the lower bound hurdle rate results in 0% vesting.
- Achieving an underlying EPS growth rate equivalent to the upper bound hurdle rate results in 100% vesting.
Pro-rata vesting occurs for EPS growth between the lower and upper bound hurdle rates. Any LTIs that do not vest are forfeited;
the FY2012 and FY2011 plan hurdles, which are not adjusted for the effects of inflation/deflation, were set at between 5% and 10% compound underlying EPS growth over a three year vesting period as follows:
- Achieving 5% underlying EPS growth results in 50% vesting.
- Achieving 10% underlying EPS growth results in 100% vesting.
Pro-rata vesting occurs for EPS growth over 5% and under 10%. Any LTIs that do not vest are forfeited; and
underlying earnings per share is calculated on the Group‟s underlying profit, adjusted for non-recurring and significant items such as goodwill impairment or amortisation, or other non cash accounting items.
Metcash Employee Option Plan (MEOP) (Legacy Plan)
Metcash previously issued invitations to eligible employees and executive directors to participate in the Employee Share Option Plan. The last tranche of options was issued in 2008 and vested on 7 February 2013. The plan will cease in February 2014 when the last options expire. The exercise price of options was determined as the closing price on the Stock Exchange Automated Trading System (SEATS), excluding special crossings, overnight sales and exchange traded option exercises of the shares on the grant date, or such other price as determined by the Board. The vesting of options occurs as follows:
60% of the options issued to a participant become exercisable from the third anniversary of the grant date;
a further 20% become exercisable from the fourth anniversary of the grant date; and
the remaining 20% become exercisable from the fifth anniversary of the grant date. Options must be exercised prior to the sixth anniversary of the grant date, at which time they expire.
For
per
sona
l use
onl
y

METCASH FINANCIAL REPORT 2013
NOTES TO THE FINANCIAL STATEMENTS
Year ended 30 April 2013
89
25. SHARE-BASED PAYMENTS (Continued) (a) Types of share-based payment plans (continued)
Where an employee ceases to be employed by any Group company the options issued to that participant will automatically lapse, except where the employee has ceased to be an employee by reason of total and permanent disability, death, retirement and such other circumstances as the Board may determine. In these circumstances, the Board may give its written approval to the participant or their personal representative to exercise the options during such further period as the Board may determine. In addition, options will lapse on the winding up of the Company or where the participant has acted fraudulently or dishonestly. An option may be exercised immediately in the event of:
any party becoming entitled to acquire shares by way of a compulsory acquisition; or
a resolution being passed by the Company to which any party becomes or will become “entitled” to 100% of the issued shares; or
a participant's employment being terminated by any Group company at any time within the period of six months after any party who is not at the grant date “entitled” to 50% or more of the shares becomes so entitled.
Exercise prices or option holdings will be pro-rated in the event of a bonus issue, rights issue or reorganisation of the share capital of the Company. (b) Summary of rights and options granted
Rights Plan
The following table illustrates the movement in the number of Performance Rights during the year:
2013 2012
NUMBER NUMBER
Outstanding at the beginning of the year 2,785,319 1,399,385
Granted during the year – LTI 1,806,964 1,512,804
Vested during the year - -
Reinstated/(expired/forfeited) during the year (103,018) (126,870)
Outstanding at the end of the year 4,489,265 2,785,319
The outstanding balance as at 30 April 2013 is represented by:
VESTING DATE
TOTAL OUTSTANDING
(NUMBER) EXERCISABLE
(NUMBER)
REMAINING CONTRACTUAL
LIFE
30 June 2013 – LTI 1,285,000 - 2 months
30 June 2014 – LTI 1,397,301 - 1 year 2 months
7 September 2015 – LTI 1,806,964 - 2 years 4 months
Total 4,489,265 -
Weighted average fair value The weighted average fair value of LTI Performance Rights granted during the year was $2.30 per Performance Right (2012: $3.62).
For
per
sona
l use
onl
y

METCASH FINANCIAL REPORT 2013
NOTES TO THE FINANCIAL STATEMENTS
Year ended 30 April 2013
90
25. SHARE-BASED PAYMENTS (Continued) (b) Summary of rights and options granted (continued)
Pricing model The LTI performance rights issued were valued on the grant date using either the Black-Scholes or the binomial options pricing models. The following table lists the inputs to the valuations.
FY2013
Plan LTI FY2012
Plan LTI FY2011
Plan LTI
Dividend yield 7.55% 6.41% 6.19%
Risk free rate 3.06% 3.69% 5.36%
Expected volatility 18.74% 17.64% 16.63%
Days to vesting 994 927 940
Exercise price - - -
Share price at measurement date $3.22 $4.21 $4.20 The FY2013 STI performance rights will be issued based on the volume-weighted average price (VWAP) of Metcash‟s shares for the five days ending 31 July 2013. The rights were valued at $1.2 million, represented by the nominal value of the STI entitlement of the executives as calculated in accordance with the STI Plan rules. MEOP
The following table illustrates the number of options, exercise prices and movements during the year ended 30 April 2013 and 30 April 2012:
2013
2013 EXERCISE
PRICE 2012
2012 EXERCISE
PRICE
NUMBER $ NUMBER $
Outstanding at the beginning of the year 15,361,985 24,126,321
Reinstated during the year 500,000 Various 122,150 Various
Exercised during the year:
- - (2,489,364) 3.925
- - (2,856) 4.267
Expired during the year (2,466,489) Various (6,394,266) Various
Outstanding at the end of the year 13,395,496 15,361,985
The outstanding balance as at 30 April 2013 is represented by:
EXPIRY DATE
EXERCISE PRICE
$
TOTAL OUTSTANDING
(NUMBER) EXERCISABLE
(NUMBER)
REMAINING CONTRACTUAL
LIFE
7 February 2014 4.267 13,395,496 13,395,496 9 months
For
per
sona
l use
onl
y

METCASH FINANCIAL REPORT 2013
NOTES TO THE FINANCIAL STATEMENTS
Year ended 30 April 2013
91
26. DIRECTORS’ AND EXECUTIVES DISCLOSURES
a) Details of Key Management Personnel
Directors Executives
Peter L Barnes Non-executive Chairman Fergus Collins CEO Australian Liquor Marketers
Andrew Reitzer(i) Chief Executive Officer Adrian Gratwicke Chief Financial Officer
Ian R Morrice(i) Executive Director Silvestro Morabito COO Food & Grocery
Patrick N J Allaway(ii) Non-executive Director Mark Laidlaw CEO Hardware
Fiona E Balfour Non-executive Director
Michael R Butler Non-executive Director
Neil D Hamilton Non-executive Director
Edwin M Jankelowitz Non-executive Director
Richard A Longes(iii) Non-executive Director
V Dudley Rubin Non-executive Director
(i) Mr Morrice was appointed as a non-executive Director on 12 June 2012 and was appointed Executive Director on 1 March 2013. Mr Morrice will replace Mr Reitzer who retires as Group CEO on 30 June 2013.
(ii) Mr Allaway was appointed as a non-executive Director on 7 November 2012. (iii) Mr Longes retired from the Board on 30 August 2012.
b) Performance Rights holding of Key Management Personnel
Name Balance 1 May 2012
Granted as remuneration
- LTI
Vested during the
year
Changed, forfeited or
lapsed during the year
Balance 30 April 2013
Balance at report date
Directors P Barnes - - - - - - A Reitzer - - - - - - I Morrice - - - - - - P Allaway - - - - - - F Balfour - - - - - - M Butler - - - - - - N Hamilton - - - - - - E Jankelowitz - - - - - - R Longes - - - - - - D Rubin - - - - - - Executives
F Collins 109,648 87,488 - - 197,136 197,136 A Gratwicke 132,974 100,841 - - 233,815 233,815 M Laidlaw 95,367 81,239 - - 176,606 176,606 S Morabito 142,687 135,169 - - 277,856 277,856
Total 480,676 404,737 - - 885,413 885,413
For
per
sona
l use
onl
y
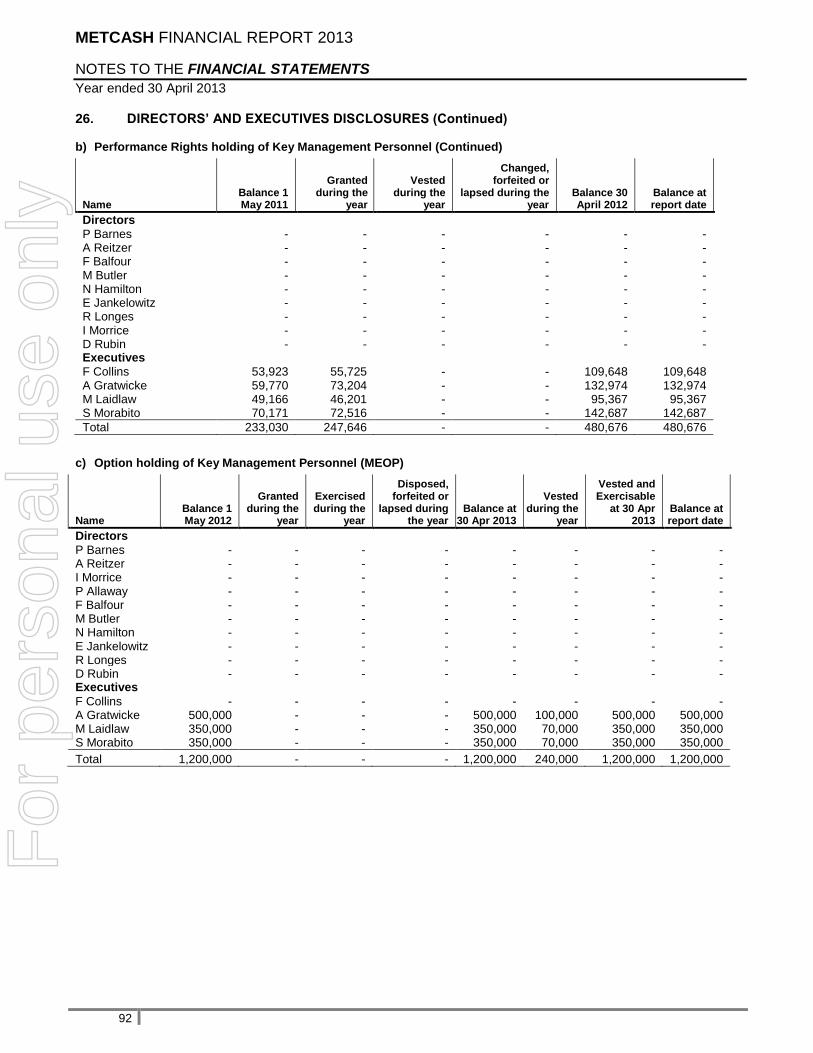
METCASH FINANCIAL REPORT 2013
NOTES TO THE FINANCIAL STATEMENTS
Year ended 30 April 2013
92
26. DIRECTORS’ AND EXECUTIVES DISCLOSURES (Continued) b) Performance Rights holding of Key Management Personnel (Continued)
Name Balance 1 May 2011
Granted during the
year
Vested during the
year
Changed, forfeited or
lapsed during the year
Balance 30 April 2012
Balance at report date
Directors P Barnes - - - - - - A Reitzer - - - - - - F Balfour - - - - - - M Butler - - - - - - N Hamilton - - - - - - E Jankelowitz - - - - - - R Longes - - - - - - I Morrice - - - - - - D Rubin - - - - - - Executives F Collins 53,923 55,725 - - 109,648 109,648 A Gratwicke 59,770 73,204 - - 132,974 132,974 M Laidlaw 49,166 46,201 - - 95,367 95,367 S Morabito 70,171 72,516 - - 142,687 142,687
Total 233,030 247,646 - - 480,676 480,676
c) Option holding of Key Management Personnel (MEOP)
Name Balance 1 May 2012
Granted during the
year
Exercised during the
year
Disposed, forfeited or
lapsed during the year
Balance at 30 Apr 2013
Vested during the
year
Vested and Exercisable
at 30 Apr 2013
Balance at report date
Directors P Barnes - - - - - - - - A Reitzer - - - - - - - - I Morrice - - - - - - - - P Allaway - - - - - - - - F Balfour - - - - - - - - M Butler - - - - - - - - N Hamilton - - - - - - - - E Jankelowitz - - - - - - - - R Longes - - - - - - - - D Rubin - - - - - - - - Executives F Collins - - - - - - - - A Gratwicke 500,000 - - - 500,000 100,000 500,000 500,000 M Laidlaw 350,000 - - - 350,000 70,000 350,000 350,000 S Morabito 350,000 - - - 350,000 70,000 350,000 350,000
Total 1,200,000 - - - 1,200,000 240,000 1,200,000 1,200,000
For
per
sona
l use
onl
y

METCASH FINANCIAL REPORT 2013
NOTES TO THE FINANCIAL STATEMENTS
Year ended 30 April 2013
93
26. DIRECTORS’ AND EXECUTIVES DISCLOSURES (Continued) c) Option holding of Key Management Personnel (MEOP) (continued)
Name Balance 1 May 2011
Granted during the
year
Exercised during the
year
Disposed, forfeited or
lapsed during the year
Balance at 30 Apr 2012
Vested during the
year
Vested and Exercisable
at 30 Apr 2012
Balance at report date
Directors P Barnes - - - - - - - - A Reitzer 1,200,000 - - (1,200,000) - - - - F Balfour - - - - - - - - M Butler - - - - - - - - N Hamilton - - - - - - - - E Jankelowitz 130,000 - - (130,000) - - - - R Longes - - - - - - - - I Morrice - - - - - - - - D Rubin - - - - - - - - Executives F Collins 50,000 - (50,000) - - - - - A Gratwicke 510,000 - (10,000) - 500,000 100,000 400,000 500,000 M Laidlaw 400,000 - - (50,000) 350,000 70,000 280,000 350,000 S Morabito 387,125 - (37,125) - 350,000 70,000 280,000 350,000
Total 2,677,125 - (97,125) (1,380,000) 1,200,000 240,000 960,000 1,200,000
d) Shareholding of Key Management Personnel
Name
Balance at 1 May
2012 Granted as
remuneration On market
trade Options
exercised Other
adjustments(i)
Balance at 30 April
2013 Balance at report date
Directors
P Barnes 177,083 - - - 4,951 182,034 182,034
A Reitzer 1,750,000 - (929,951) - 9,902 829,951 829,951
I Morrice - - 21,000 - - 21,000 21,000
P Allaway - - 54,000 - - 54,000 54,000
F Balfour 13,600 - 11,910 - 4,163 29,673 29,673
M Butler 50,000 - - - 4,951 54,951 54,951
N Hamilton 20,000 - - - - 20,000 20,000
E Jankelowitz 320,000 - - - - 320,000 320,000
R Longes 128,154 - - - 9,902 138,056 138,056
D Rubin 15,000 - 2,500 - - 17,500 17,500
Executives F Collins 1,600 - - - 490 2,090 2,090
A Gratwicke 63,950 - - - 9,528 73,478 73,478
M Laidlaw - - - - - - -
S Morabito 32,575 - - - 6,604 39,179 39,179
Total 2,571,962 - (840,541) - 50,491 1,781,912 1,781,912
(i) Other adjustments represent shares acquired by key management personnel as part of the Share Purchase Plan completed in July 2012.
F
or p
erso
nal u
se o
nly

METCASH FINANCIAL REPORT 2013
NOTES TO THE FINANCIAL STATEMENTS
Year ended 30 April 2013
94
26. DIRECTORS’ AND EXECUTIVES DISCLOSURES (Continued)
d) Shareholding of Key Management Personnel (continued)
Balance at 1 May
2011 Granted as
remuneration On market
trade Options
exercised Other
adjustments
Balance at 30 April
2012
Name
Balance at report date
Directors P Barnes 177,083 - - - - 177,083 177,083 A Reitzer 1,750,000 - - - - 1,750,000 1,750,000 F Balfour 13,600 - - - - 13,600 13,600 M Butler 50,000 - - - - 50,000 50,000 N Hamilton 20,000 - - - - 20,000 20,000 E Jankelowitz 320,000 - - - - 320,000 320,000 R Longes 128,154 - - - - 128,154 128,154 I Morrice - - - - - - - D Rubin 15,000 - - - - 15,000 15,000 Executives F Collins 1,600 - (50,000) 50,000 - 1,600 1,600 A Gratwicke 53,950 - - 10,000 - 63,950 63,950 M Laidlaw - - - - - - - S Morabito 18,275 - (22,825) 37,125 - 32,575 32,575
Total 2,547,662 - (72,825) 97,125 - 2,571,962 2,571,962
e) Compensation by category
2013 2012
$’m $’m
Short-term 10.0 7.4 Long-term (0.2) (1.5) Post employment 0.2 0.2 Termination benefits 0.2 - Share-based payments 0.3 0.2
Total 10.5 6.3
There were no other transactions and balances with key management personnel other than as disclosed in Note 24.
27. INFORMATION RELATING TO METCASH LIMITED (THE PARENT ENTITY)
In accordance with the amendment to the Corporations Act 2001, the Company has replaced the separate entity financial statements with the following note.
METCASH LIMITED
2013 2012
$’m $’m
Current assets 2,428.6 1,825.5 Total assets 7,058.2 6,441.6 Current liabilities 3,901.5 3,707.7 Total liabilities 3,901.5 3,707.7
Net assets 3,156.7 2,733.9
Contributed equity 2,950.9 2,580.7 Retained earnings 205.2 129.6 Share based payments reserve 0.6 23.6
Total equity 3,156.7 2,733.9
Net profit for the year 296.1 218.3 Total comprehensive income for the year, net of tax 296.1 218.3
Metcash Limited has provided guarantees as part of the Closed Group arrangements as disclosed in Note 24(c).
For
per
sona
l use
onl
y
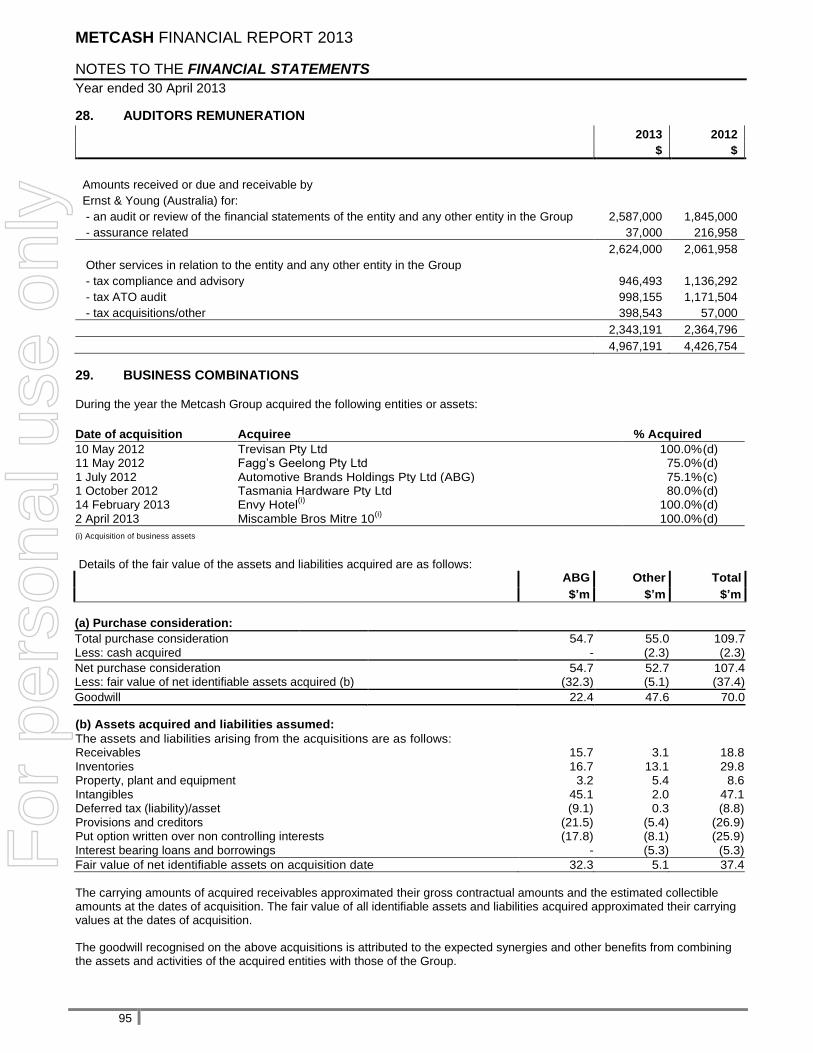
METCASH FINANCIAL REPORT 2013
NOTES TO THE FINANCIAL STATEMENTS
Year ended 30 April 2013
95
28. AUDITORS REMUNERATION
2013 2012
$ $
Amounts received or due and receivable by
Ernst & Young (Australia) for:
- an audit or review of the financial statements of the entity and any other entity in the Group 2,587,000 1,845,000
- assurance related 37,000 216,958
2,624,000 2,061,958
Other services in relation to the entity and any other entity in the Group
- tax compliance and advisory 946,493 1,136,292
- tax ATO audit 998,155 1,171,504
- tax acquisitions/other 398,543 57,000
2,343,191 2,364,796
4,967,191 4,426,754
29. BUSINESS COMBINATIONS
During the year the Metcash Group acquired the following entities or assets:
Date of acquisition Acquiree % Acquired
10 May 2012 Trevisan Pty Ltd 100.0% (d)
11 May 2012 Fagg‟s Geelong Pty Ltd 75.0% (d)
1 July 2012 Automotive Brands Holdings Pty Ltd (ABG) 75.1% (c) 1 October 2012 Tasmania Hardware Pty Ltd 80.0% (d)
14 February 2013 Envy Hotel(i)
100.0% (d)
2 April 2013 Miscamble Bros Mitre 10(i)
100.0% (d)
(i) Acquisition of business assets
Details of the fair value of the assets and liabilities acquired are as follows:
ABG Other Total
$’m $’m $’m
(a) Purchase consideration:
Total purchase consideration 54.7 55.0 109.7
Less: cash acquired - (2.3) (2.3)
Net purchase consideration 54.7 52.7 107.4 Less: fair value of net identifiable assets acquired (b) (32.3) (5.1) (37.4)
Goodwill 22.4 47.6 70.0
(b) Assets acquired and liabilities assumed:
The assets and liabilities arising from the acquisitions are as follows: Receivables 15.7 3.1 18.8
Inventories 16.7 13.1 29.8 Property, plant and equipment 3.2 5.4 8.6
Intangibles 45.1 2.0 47.1 Deferred tax (liability)/asset (9.1) 0.3 (8.8)
Provisions and creditors (21.5) (5.4) (26.9) Put option written over non controlling interests (17.8) (8.1) (25.9)
Interest bearing loans and borrowings - (5.3) (5.3)
Fair value of net identifiable assets on acquisition date 32.3 5.1 37.4
The carrying amounts of acquired receivables approximated their gross contractual amounts and the estimated collectible amounts at the dates of acquisition. The fair value of all identifiable assets and liabilities acquired approximated their carrying values at the dates of acquisition.
The goodwill recognised on the above acquisitions is attributed to the expected synergies and other benefits from combining the assets and activities of the acquired entities with those of the Group.
For
per
sona
l use
onl
y

METCASH FINANCIAL REPORT 2013
NOTES TO THE FINANCIAL STATEMENTS
Year ended 30 April 2013
96
29. BUSINESS COMBINATIONS (Continued)
Details of revenue and profit and loss attributable to the business combinations are as follows:
ABG Other Total
$’m $’m $’m
Revenue since acquisition to the reporting date 83.5 62.3 145.8
Profit/(loss) since acquisition to the reporting date 2.5 2.8 4.7
The Group has not been able to reliably determine the revenue and profit and loss of the acquired entities from the beginning of the reporting period to the acquisition date and therefore cannot disclose the revenue and profit and loss had the entities been acquired effective 1 May 2012.
(c) Automotive Brands Group (ABG)
Metcash acquired 75.1% of the equity of Automotive Brands Holdings Pty Ltd (ABG) on 1 July 2012. The name of the acquired entity was subsequently changed to Metcash Automotive Holdings Pty Ltd. The acquisition positions Metcash firmly in the automotive parts aftermarket sector. ABG is the third largest in the sector and manages the Autobarn franchise and Autopro dealership groups.
Costs amounting to $2.4m were incurred in completing the acquisition. These costs have been disclosed as part of Significant Items in the Statement of Comprehensive Income (refer Note 4(vi)) as they relate to a material acquisition.
The accounting for the ABG business combination is final as at 30 April 2013.
In accordance with the acquisition agreement, Metcash has under certain circumstances the right to acquire the remaining 24.9% equity interest in ABG. The minority shareholder also has the right under certain circumstances to require Metcash to acquire its shareholding in ABG. The purchase consideration is broadly based on an EBITDA multiple calculation. The redemption amount of $17.8 million under the put option was recorded as a financial liability at fair value on the acquisition date.
(d) Other business combinations
During the current year Mitre 10 acquired various businesses in order to broaden its footprint as one of the leading hardware and home improvement businesses and the Group acquired an interest in a hotel. The total purchase consideration for these businesses was $55.0 million which resulted in goodwill of $47.6 million being recognised. The business combinations were not individually significant, and are disclosed above in aggregate.
The costs incurred in completing these acquisitions have been included within Administrative Costs in the Statement of Comprehensive Income as they do not relate to material acquisitions.
The accounting for the above business combinations is provisional as at 30 April 2013.
(e) Prior period acquisitions
On 30 September 2011 Metcash acquired 100% of the equity in the Franklins Group from Pick n Pay Retailers Pty Ltd. The fair value of the net assets acquired recognised in the 30 April 2012 financial statements were based on a preliminary accounting assessment. The final acquisition accounting is as follows:
$’m
(i) Purchase consideration:
Cash paid during the current and prior periods 188.4 Cash consideration accrued at the end of the year 1.2
Total purchase consideration 189.6
Less: cash acquired -
Net purchase consideration 189.6 Add: fair value of net identifiable liabilities assumed (ii) 66.5
Goodwill 256.1
For
per
sona
l use
onl
y
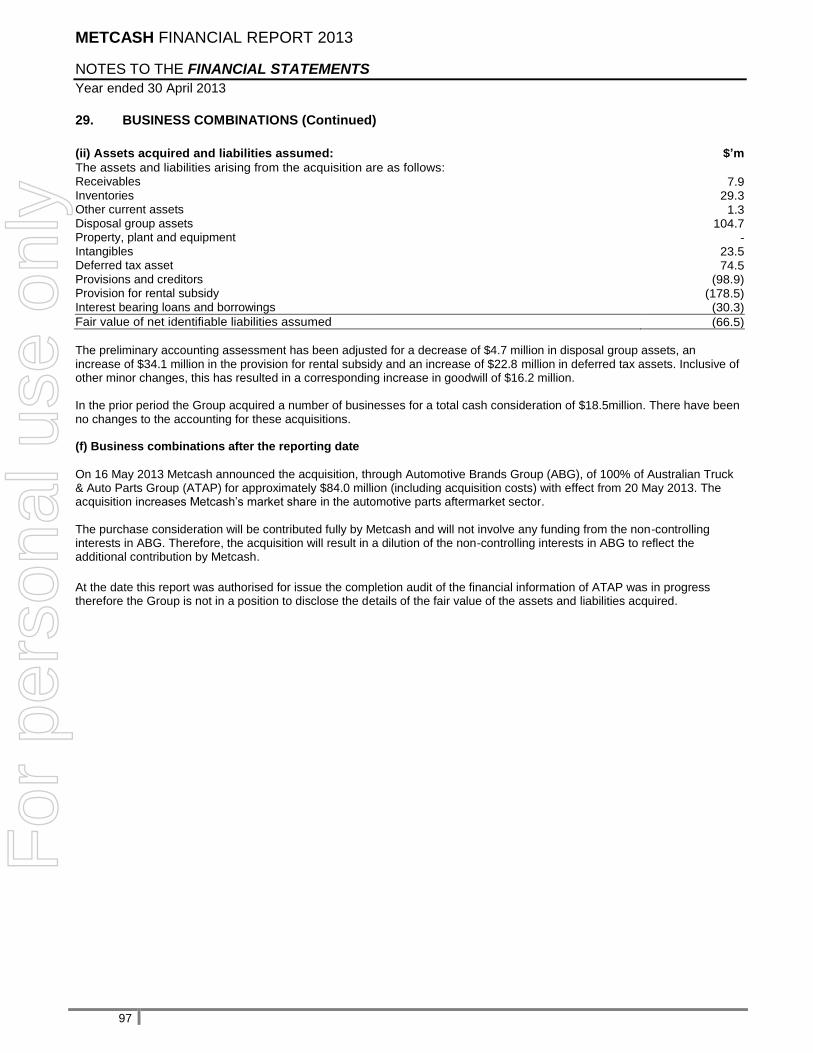
METCASH FINANCIAL REPORT 2013
NOTES TO THE FINANCIAL STATEMENTS
Year ended 30 April 2013
97
29. BUSINESS COMBINATIONS (Continued)
(ii) Assets acquired and liabilities assumed: $’m
The assets and liabilities arising from the acquisition are as follows: Receivables 7.9 Inventories 29.3 Other current assets 1.3 Disposal group assets 104.7 Property, plant and equipment - Intangibles 23.5 Deferred tax asset 74.5 Provisions and creditors (98.9) Provision for rental subsidy (178.5) Interest bearing loans and borrowings (30.3)
Fair value of net identifiable liabilities assumed (66.5)
The preliminary accounting assessment has been adjusted for a decrease of $4.7 million in disposal group assets, an increase of $34.1 million in the provision for rental subsidy and an increase of $22.8 million in deferred tax assets. Inclusive of other minor changes, this has resulted in a corresponding increase in goodwill of $16.2 million. In the prior period the Group acquired a number of businesses for a total cash consideration of $18.5million. There have been no changes to the accounting for these acquisitions. (f) Business combinations after the reporting date
On 16 May 2013 Metcash announced the acquisition, through Automotive Brands Group (ABG), of 100% of Australian Truck & Auto Parts Group (ATAP) for approximately $84.0 million (including acquisition costs) with effect from 20 May 2013. The acquisition increases Metcash‟s market share in the automotive parts aftermarket sector. The purchase consideration will be contributed fully by Metcash and will not involve any funding from the non-controlling interests in ABG. Therefore, the acquisition will result in a dilution of the non-controlling interests in ABG to reflect the additional contribution by Metcash.
At the date this report was authorised for issue the completion audit of the financial information of ATAP was in progress therefore the Group is not in a position to disclose the details of the fair value of the assets and liabilities acquired.
For
per
sona
l use
onl
y
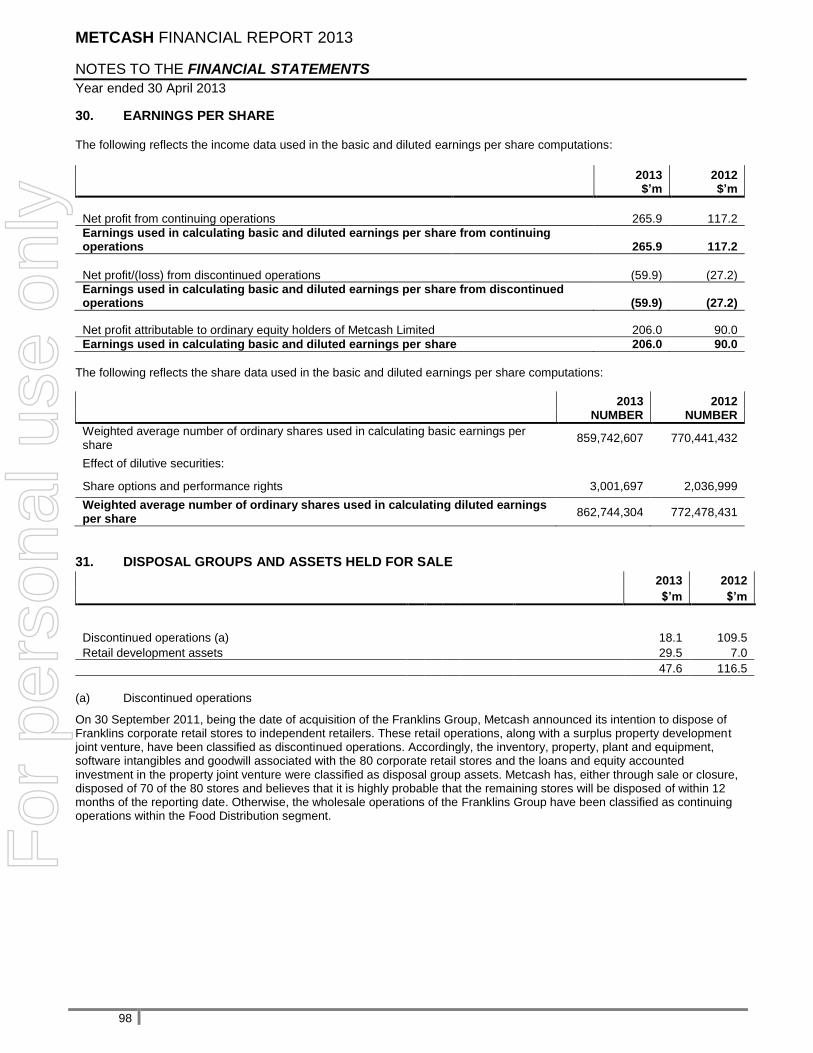
METCASH FINANCIAL REPORT 2013
NOTES TO THE FINANCIAL STATEMENTS
Year ended 30 April 2013
98
30. EARNINGS PER SHARE
The following reflects the income data used in the basic and diluted earnings per share computations:
2013 2012 $’m $’m
Net profit from continuing operations 265.9
117.2
Earnings used in calculating basic and diluted earnings per share from continuing operations 265.9 117.2
Net profit/(loss) from discontinued operations (59.9)
(27.2)
Earnings used in calculating basic and diluted earnings per share from discontinued operations (59.9) (27.2)
Net profit attributable to ordinary equity holders of Metcash Limited 206.0 90.0
Earnings used in calculating basic and diluted earnings per share 206.0 90.0
The following reflects the share data used in the basic and diluted earnings per share computations:
2013 2012 NUMBER NUMBER
Weighted average number of ordinary shares used in calculating basic earnings per share
859,742,607 770,441,432
Effect of dilutive securities:
Share options and performance rights 3,001,697 2,036,999
Weighted average number of ordinary shares used in calculating diluted earnings per share
862,744,304 772,478,431
31. DISPOSAL GROUPS AND ASSETS HELD FOR SALE
2013 2012
$’m $’m
Discontinued operations (a) 18.1 109.5
Retail development assets 29.5 7.0
47.6 116.5
(a) Discontinued operations
On 30 September 2011, being the date of acquisition of the Franklins Group, Metcash announced its intention to dispose of Franklins corporate retail stores to independent retailers. These retail operations, along with a surplus property development joint venture, have been classified as discontinued operations. Accordingly, the inventory, property, plant and equipment, software intangibles and goodwill associated with the 80 corporate retail stores and the loans and equity accounted investment in the property joint venture were classified as disposal group assets. Metcash has, either through sale or closure, disposed of 70 of the 80 stores and believes that it is highly probable that the remaining stores will be disposed of within 12 months of the reporting date. Otherwise, the wholesale operations of the Franklins Group have been classified as continuing operations within the Food Distribution segment.
For
per
sona
l use
onl
y

METCASH FINANCIAL REPORT 2013
NOTES TO THE FINANCIAL STATEMENTS
Year ended 30 April 2013
99
31. DISPOSAL GROUPS AND ASSETS HELD FOR SALE (Continued)
The results of the disposal group are as follows. 2013 2012 $'m $'m
Revenue from sale of goods 109.2 139.2
Cost of sales and other costs (184.2) (175.3)
Finance costs attributable to discounting of provisions (13.4) (2.8)
Operating loss before income tax (88.4) (38.9)
Income tax benefit related to operating loss 26.8 11.7
Operating loss after income tax (61.6) (27.2)
Gain on disposal of assets 2.5 -
Income tax expense related to gain on disposal of assets (0.8) -
Net loss from discontinued operations (59.9) (27.2)
Net loss is attributable to:
Equity holders of the parent (59.9) (27.2)
The net cash inflow from operations, per the Statement of Cash Flows, includes cash outflows of $54.2 million (2012: $43.7 million) from discontinued operations. The net cash outflow from investing activities, per the Statement of Cash Flows, includes cash inflows of $58.3 million (2012: $Nil) from discontinued operations. There were no financing cash flows specifically related to discontinued operations.
32. CONTINGENT ASSETS AND LIABILITIES
2013 2012
$’m $’m
Bank guarantees to third parties in respect of property lease obligations 32.3 30.1
Bank guarantees in respect of Work Cover 32.0 30.0
Standby letter of credit 1.2 1.2
Face value of the outstanding charges due to American Express (a) 204.8 281.0
Put options to third parties (b) 15.4 13.3
Contingent loan to a third party - 0.3
(a) American Express charge card
On 9 May 2007 Metcash Trading Limited entered into an agreement with American Express (Amex), due to expire on 30 September 2013, in relation to Customer Charge Cards. Under the agreement, should a customer default on payment, where Amex has previously made a payment to Metcash Trading Limited, then Metcash Trading Limited must pay Amex an amount equal to the charge outstanding.
The maximum amount payable shall be limited to the actual face value of the outstanding charge due to Amex. This does not include any interest or other fees payable by the customer to Amex. Metcash Trading Limited shall have no other obligation to Amex in respect of the outstanding charge and shall not be liable for any costs, loss or liability of any nature whatsoever incurred by Amex as a result of the failure by the customer to make payment.
(b) Put options
The Group has granted put options relating to the sale of retail store assets to certain customers and associates. The holders of the put option have the right to "put" these non-financial assets back to the Group within an agreed period and under certain prescribed circumstances. The estimate of the financial effect of the put options, if exercised, is the aggregate of the purchase price as defined in the option deed or business sale agreement. This amount is recorded as a contingent liability in the above table.
The Group has entered into certain put option arrangements with joint venture partners which if exercised would result in an increase in Metcash‟s ownership interest in the joint venture. The estimate of the financial effect of the put options, if exercised, is the aggregate of the purchase price as defined in the option deed or business sale agreement. This amount is recorded as a contingent liability in the above table.
For
per
sona
l use
onl
y
METCASH FINANCIAL REPORT 2013
NOTES TO THE FINANCIAL STATEMENTS
Year ended 30 April 2013
100
32. CONTINGENT ASSETS AND LIABILITIES (Continued)
(b) Put options (Continued)
Certain put option arrangements with minority shareholders of partially owned subsidiaries, if exercised, would result in an increase in Metcash‟s ownership interest in the subsidiaries, subject to specific terms and conditions. Where such an arrangement is deemed to be part of the business combination a financial liability is recognised on the acquisition date measured at the present value of the redemption amount under the option. Refer Note 20 for more details.
Certain put options granted to third parties represent financial guarantees provided by the Group. These are measured at fair value and recognised as a financial guarantee contract liability. Refer Note 22 for more details.
(c) Australian Tax Office
Metcash has been subject to an income tax audit by the Australian Tax Office (ATO) covering the 2005 - 2008 income years, which has resulted in the following two disputed items. The ATO have advised Metcash that there are no other areas under consideration and that the audit has otherwise been concluded.
Action Stores Metcash received notices of amended assessments dated 26 May 2011 and 13 June 2011 from the Australian Taxation Office (ATO) seeking payment of a total of $48.8 million. The amended assessments are in relation to a disputed tax liability arising from the sale of various ex-Action Supermarket retail businesses (Action Stores) during the 2007 and 2008 fiscal years that resulted in a net tax loss. The Action Stores were acquired by Metcash in fiscal 2006 as a part of the acquisition of Foodland Associated Limited (FAL), and were sold as part of Metcash‟s ongoing business activities to enhance Australia‟s independent retailer network. The total amount in dispute comprises primary tax of $32.9 million and then flowing from that, interest and penalties of $15.9 million.
Metcash intends to challenge the amended assessments, which assert that the net tax losses from the sale of the Action Stores should be treated as being on capital account. These net tax losses were incurred as part of Metcash‟s ordinary business activities and as such, Metcash has always considered the correct treatment to be on revenue account. Metcash has received external advice in relation to the dispute. Metcash has lodged objections to these amended assessments, and if necessary will appeal the decision to the Federal Court.
Metcash is firmly of the opinion that the treatment it has adopted is appropriate to the circumstances. Based on the strength of its position, Metcash has not recorded an expense in relation to the amended assessments in the current or prior year results presented in these financial statements.
In accordance with ATO policy, Metcash entered into a 50/50 payment agreement with the ATO in relation to the disputed tax liability of $48.8 million. Under the agreement, Metcash has paid the ATO 50% of the disputed tax liability ($24.4 million) in June/July 2011 and in return the ATO has agreed not to seek recovery of the balance until the Commissioner has determined the objection or when a decision is handed down by the relevant appellate tribune or court (as appropriate). The payment amount of $24.4 million has been disclosed as income tax receivable in the statement of financial position.
Foreign Tax Credits Metcash received notices of amended foreign tax credit (FTC) determinations dated 29 May 2012 from the ATO seeking payment of a total of $23.4 million. The amended determinations are in relation to the imposition of what is effectively double taxation on interest income derived by Metcash‟s foreign subsidiaries on intercompany loans during the 2006 and 2007 fiscal years. The ATO contends that Metcash is not entitled to any credit for taxes it has already paid on this interest income in South Africa.
The total amount in dispute comprises primary tax of $23.4 million. The ATO has not sought to impose any penalties or interest in respect of this amount.
Metcash has received external advice in relation to its position. Metcash is firmly of the view that:
• the imposition of double taxation is both inconsistent with the law and contrary to public policy; and
• the Commissioner is in any event out of time to issue such amended FTC determinations given the period of time elapsed since the original determinations.
For
per
sona
l use
onl
y

METCASH FINANCIAL REPORT 2013
NOTES TO THE FINANCIAL STATEMENTS
Year ended 30 April 2013
101
32. CONTINGENT ASSETS AND LIABILITIES (Continued)
(c) Australian Tax Office (Continued)
During the year Metcash lodged objections to the amended determinations which were subsequently disallowed by the ATO. Metcash has appealed the decision to the Administrative Appeals Tribunal, which is expected to be heard during the 2014 fiscal year. Based on the strength of its position, Metcash has not recorded an expense in relation to the amended determinations in the current year results presented in these financial statements.
As the relevant subsidiaries subsequently became members of the Australian tax group, the FTC dispute is restricted solely to the 2006 and 2007 income years. There will be no impact in respect of the 2008 and subsequent income years in connection with this matter.
33. SUBSEQUENT EVENTS
Australian Truck & Auto Parts Group On 16 May 2013 Metcash announced the acquisition, through Automotive Brands Group (ABG), of 100% of the Australian Truck & Auto Parts Group (ATAP) for approximately $84.0 million including acquisition costs. The Group assumed control of ATAP on 20 May 2013 being the date of completion. ATAP is a national wholesaler of brake, clutch and under-car products and also includes: ABS, the franchisor of a national chain of 53 retail service and brake/clutch repair centres, with 4 corporate stores and 5 joint venture stores; IBS Auto Solutions, Garmax, Melbourne Clutch & Brake; and Brake Friction Technology. The acquisition will result in a dilution of the non-controlling interests in ABG to reflect the additional equity contribution by Metcash. Refer Note 29(f) of the financial statements for further details. Mitre 10 joint ventures
On 6 May 2013, Metcash announced that Mitre 10 had entered into joint ventures with two hardware trade groups – Dahlsens and Capeview Building Supplies. Metcash acquired a 36% interest in the Dahlsens joint venture, which includes 11 stores in the Northern Territory, Western Australia and in Northern Queensland. Metcash acquired an 80% interest in Capeview Building Supplies, which includes 5 stores throughout Victoria, particularly in the Gippsland region. Except as noted above, there are no events that have occurred after the end of the financial year that would materially affect the reported results or would require disclosure in this report.
For
per
sona
l use
onl
y

METCASH FINANCIAL REPORT 2013 DIRECTORS’ DECLARATION
Year ended 30 April 2013
102
In accordance with a resolution of the directors of Metcash Limited, I state that: 1. In the opinion of the directors:
a. The financial statements, notes and the additional disclosures included in the directors‟ report designated as audited,
of Metcash Limited are in accordance with the Corporations Act 2001, including:
i. Giving a true and fair view of its financial position as at 30 April 2013 and of its performance for the year ended on that date; and
ii. Complying with Accounting Standards (including the Australian Accounting Interpretations) and Corporations
Regulations 2001; and
b. The financial statements and notes also comply with International Financial Reporting Standards as disclosed in Note 2(a)
c. There are reasonable grounds to believe that the Company will be able to pay its debts as and when they become due and payable.
2. This declaration has been made after receiving the declarations required to be made to the directors in accordance with
section 295A of the Corporations Act 2001 for the financial year ending 30 April 2013.
3. In the opinion of the directors, as at the date of this declaration, there are reasonable grounds to believe that the members of the Closed Group identified in Note 24 will be able to meet any obligation or liabilities to which they are or may become subject, by virtue of the Deed of Cross Guarantee.
On behalf of the Board Andrew Reitzer Director
Sydney, 24 June 2013
For
per
sona
l use
onl
y

103
Auditor's Independence Declaration to the Directors of Metcash Limited
In relation to our audit of the financial report of Metcash Limited for the year ended 30 April 2013, to the best of my knowledge and belief, there have been no contraventions of the auditor independence requirements of the Corporations Act 2001 or any applicable code of professional conduct.
Ernst & Young
Michael J Wright Partner 24 June 2013
For
per
sona
l use
onl
y

104
Independent auditor's report to the members of Metcash Limited
Report on the financial report
We have audited the accompanying financial report of Metcash Limited, which comprises the consolidated statement of financial position as at 30 April 2013, the consolidated statement of comprehensive income, the consolidated statement of changes in equity and the consolidated statement of cash flows for the year then ended, notes comprising a summary of significant accounting policies and other explanatory information, and the directors' declaration of the consolidated entity comprising the company and the entities it controlled at the year's end or from time to time during the financial year.
Directors' responsibility for the financial report
The directors of the company are responsible for the preparation of the financial report that gives a true and fair view in accordance with Australian Accounting Standards and the Corporations Act 2001 and for such internal controls as the directors determine are necessary to enable the preparation of the financial report that is free from material misstatement, whether due to fraud or error. In Note 2, the directors also state, in accordance with Accounting Standard AASB 101 Presentation of Financial Statements, that the financial statements comply with International Financial Reporting Standards.
Auditor's responsibility
Our responsibility is to express an opinion on the financial report based on our audit. We conducted our audit in accordance with Australian Auditing Standards. Those standards require that we comply with relevant ethical requirements relating to audit engagements and plan and perform the audit to obtain reasonable assurance about whether the financial report is free from material misstatement.
An audit involves performing procedures to obtain audit evidence about the amounts and disclosures in the financial report. The procedures selected depend on the auditor's judgment, including the assessment of the risks of material misstatement of the financial report, whether due to fraud or error. In making those risk assessments, the auditor considers internal controls relevant to the entity's preparation and fair presentation of the financial report in order to design audit procedures that are appropriate in the circumstances, but not for the purpose of expressing an opinion on the effectiveness of the entity's internal controls. An audit also includes evaluating the appropriateness of accounting policies used and the reasonableness of accounting estimates made by the directors, as well as evaluating the overall presentation of the financial report.
We believe that the audit evidence we have obtained is sufficient and appropriate to provide a basis for our audit opinion.
Independence
In conducting our audit we have complied with the independence requirements of the Corporations Act 2001. We have given to the directors of the company a written Auditor‟s Independence Declaration, a copy of which is included by reference in the directors‟ report.
For
per
sona
l use
onl
y
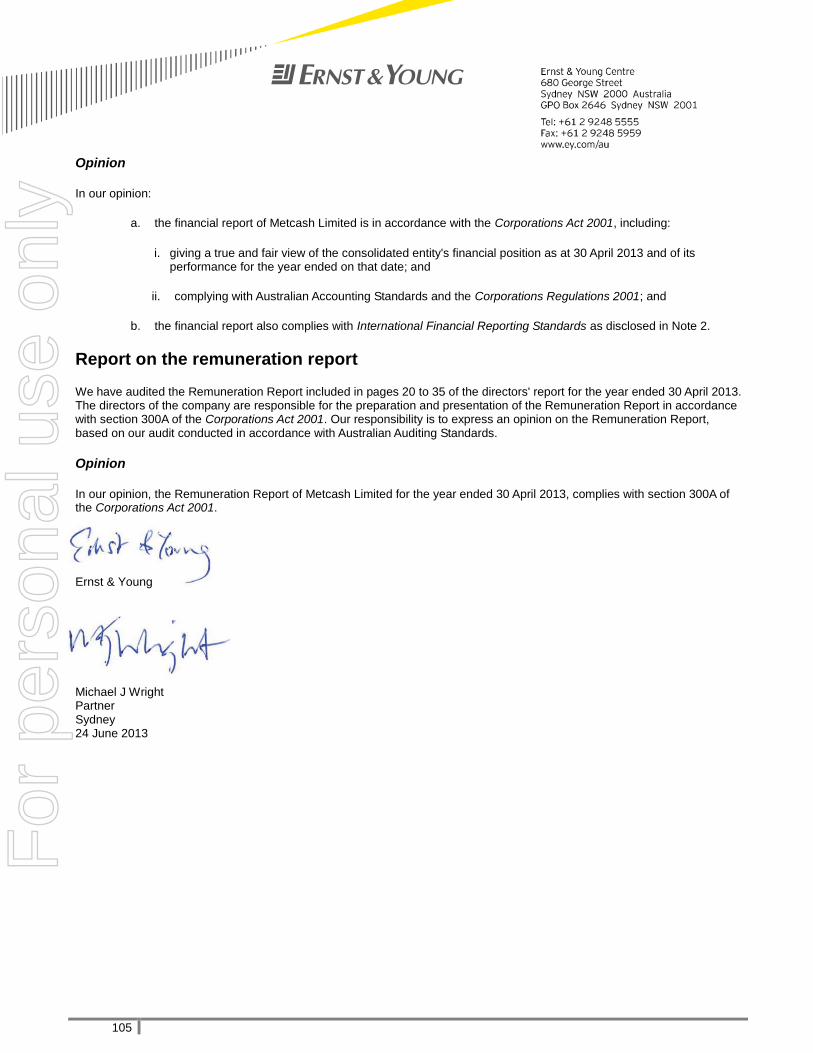
105
Opinion
In our opinion:
a. the financial report of Metcash Limited is in accordance with the Corporations Act 2001, including:
i. giving a true and fair view of the consolidated entity's financial position as at 30 April 2013 and of its performance for the year ended on that date; and
ii. complying with Australian Accounting Standards and the Corporations Regulations 2001; and
b. the financial report also complies with International Financial Reporting Standards as disclosed in Note 2.
Report on the remuneration report
We have audited the Remuneration Report included in pages 20 to 35 of the directors' report for the year ended 30 April 2013. The directors of the company are responsible for the preparation and presentation of the Remuneration Report in accordance with section 300A of the Corporations Act 2001. Our responsibility is to express an opinion on the Remuneration Report, based on our audit conducted in accordance with Australian Auditing Standards.
Opinion
In our opinion, the Remuneration Report of Metcash Limited for the year ended 30 April 2013, complies with section 300A of the Corporations Act 2001.
Ernst & Young Michael J Wright Partner Sydney 24 June 2013
For
per
sona
l use
onl
y