5.7 roadway land value - vtpi.orgvtpi.org/tca/tca0507.pdf · 10 december 2015 page 5.7-1 5.7...
TRANSCRIPT
Transportation Cost and Benefit Analysis II – Roadway Land Value Victoria Transport Policy Institute (www.vtpi.org)
10 December 2015 www.vtpi.org/tca/tca0507.pdf Page 5.7-1
5.7 Roadway Land Value This chapter investigates the amount of land devoted to roads, the value of this land, and how
this cost can be allocated to road users. Although roadway land is often treated as a sunk cost, it
is a valuable resource with alternative uses. Failing to charge road users the equivalent of rent
and taxes on roadway land underprices roads compared with other land uses, and underprices
space-intensive travel modes. This tends to increase the amount of land devoted to roads and
encourage lower-density urban development.
5.7.1 Chapter Index 5.7 Roadway Land Value ....................................................................................... 1
5.7.2 Definition................................................................................................ 1 5.7.3 Discussion ............................................................................................. 1
Roadway Land Area ............................................................................. 1 Accounting for Roadway Land Value ................................................... 4 Roadway Land Valuation ..................................................................... 8
5.7.4 Estimates ............................................................................................... 10 Land Value Studies Summary Table .................................................... 10 Monetary Estimates ............................................................................. 10 Area Estimates ..................................................................................... 13
5.7.5 Variability ............................................................................................... 15 5.7.6 Equity and Efficiency Issues .................................................................. 15 5.7.7 Conclusions ........................................................................................... 16
Automobile Cost Range ....................................................................... 16 5.7.8 Information Resources ........................................................................... 17
5.7.2 Definition Roadway land value reflects the cost of land used for road rights-of-way and other public
facilities dedicated for automobile use. It can be defined as the rent that road users would
pay for roadway land, or at a minimum, the equivalent of property taxes.
5.7.3 Discussion Most roads are publicly owned. Highways and major arterials are usually funded and
owned by state (in Canada, provincial) governments, while minor roads and streets are
usually owned by local governments (roads in new developments are often funded
originally by private developers but turned over to local governments). A small (but not
insignificant) amount of land is devoted to private roads and driveways.
Roadway Land Area
Most roads have two to four lanes, each 10-14 feet wide, plus shoulders, sidewalks,
drainage ditches and landscaping area. Road rights-of-way (the land that is legally
devoted to the road) usually range from 24 to 100 feet wide. Most roads in developed
countries are paved. In high density urban areas road pavement often fills the entire right-
Transportation Cost and Benefit Analysis II – Roadway Land Value Victoria Transport Policy Institute (www.vtpi.org)
10 December 2015 www.vtpi.org/tca/tca0507.pdf Page 5.7-2
of-way, but in other areas there is often an unpaved shoulder area. The amount of land
devoted to roads is affected by:
Projected vehicle traffic demand (which determine the number of traffic lanes).
Road design standards (which determine lane and shoulder widths). Such standards are
usually adopted by transportation agencies based on recommendations by professional
organizations such as the Institute of Transportation Engineers (ITE) or the American
Association of State Transportation and Highway Officials (AASHTO).
On street parking practices (which determine the number of parking lanes).
Additional design features, such as shoulders, sidewalks, ditches and landscaping.
Definition, such as whether unpaved land in road rights-of-way are included in the analysis.
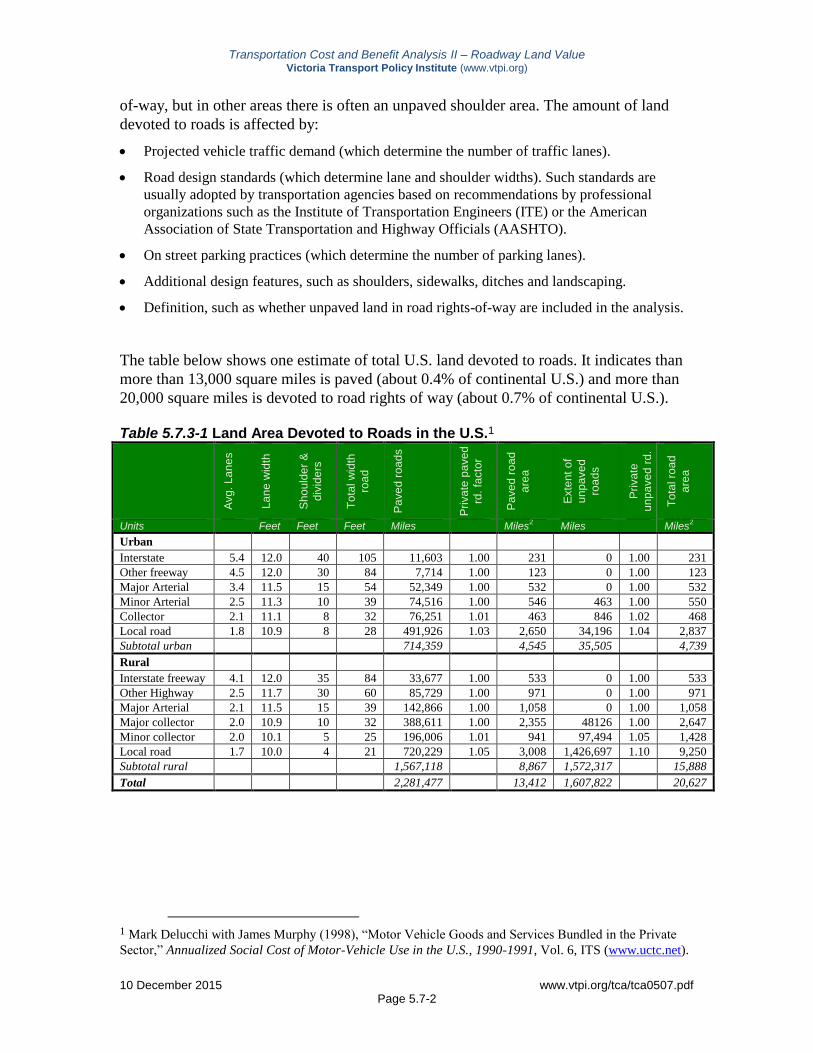
The table below shows one estimate of total U.S. land devoted to roads. It indicates than
more than 13,000 square miles is paved (about 0.4% of continental U.S.) and more than
20,000 square miles is devoted to road rights of way (about 0.7% of continental U.S.).
Table 5.7.3-1 Land Area Devoted to Roads in the U.S.1
Avg
. L
an
es
La
ne
wid
th
Sh
ou
lde
r &
div
ide
rs
To
tal w
idth
roa
d
Pa
ve
d r
oa
ds
Pri
va
te p
ave
d
rd.
facto
r
Pa
ve
d r
oa
d
are
a
Exte
nt
of
un
pa
ve
d
roa
ds
Pri
va
te
un
pa
ve
d r
d.
facto
r T
ota
l ro
ad
are
a
Units Feet Feet Feet Miles Miles2 Miles Miles
2
Urban Interstate 5.4 12.0 40 105 11,603 1.00 231 0 1.00 231
Other freeway 4.5 12.0 30 84 7,714 1.00 123 0 1.00 123
Major Arterial 3.4 11.5 15 54 52,349 1.00 532 0 1.00 532
Minor Arterial 2.5 11.3 10 39 74,516 1.00 546 463 1.00 550
Collector 2.1 11.1 8 32 76,251 1.01 463 846 1.02 468
Local road 1.8 10.9 8 28 491,926 1.03 2,650 34,196 1.04 2,837
Subtotal urban 714,359 4,545 35,505 4,739
Rural Interstate freeway 4.1 12.0 35 84 33,677 1.00 533 0 1.00 533
Other Highway 2.5 11.7 30 60 85,729 1.00 971 0 1.00 971
Major Arterial 2.1 11.5 15 39 142,866 1.00 1,058 0 1.00 1,058
Major collector 2.0 10.9 10 32 388,611 1.00 2,355 48126 1.00 2,647
Minor collector 2.0 10.1 5 25 196,006 1.01 941 97,494 1.05 1,428
Local road 1.7 10.0 4 21 720,229 1.05 3,008 1,426,697 1.10 9,250
Subtotal rural 1,567,118 8,867 1,572,317 15,888
Total 2,281,477 13,412 1,607,822 20,627
1 Mark Delucchi with James Murphy (1998), “Motor Vehicle Goods and Services Bundled in the Private
Sector,” Annualized Social Cost of Motor-Vehicle Use in the U.S., 1990-1991, Vol. 6, ITS (www.uctc.net).

Transportation Cost and Benefit Analysis II – Roadway Land Value Victoria Transport Policy Institute (www.vtpi.org)
10 December 2015 www.vtpi.org/tca/tca0507.pdf Page 5.7-3
Table 5.7.3-2 shows the estimated portion of land devoted to roads in various countries.
Although this is a small portion of total land, roads tend to concentrate in areas with high
populations and industrial activities and so compete with other productive uses. In
regions with high vehicle ownership rates, 10-20% urban land is typically devoted to
roads and parking, with higher values (more than 50%) in commercial centers.2
Table 5.7.3-2 Land Area Devoted to Road and Parking Facilities3
Road & Parking Portion of Total
Land Area
Area Per
Capita
Area Per Motor
Vehicle
Hectares Meters2 Meters
2
United States 15,920,615 1.7% 573 746
Canada 2,276,656 0.2% 734 1319
Mexico 863,832 0.4% 87 1100
Japan 1,316,591 3.5% 104 184
France 1,020,586 1.9% 173 308
Germany 749,725 2.1% 91 164
United Kingdom 425,149 1.8% 72 137
Sweden 241,146 0.6% 268 566
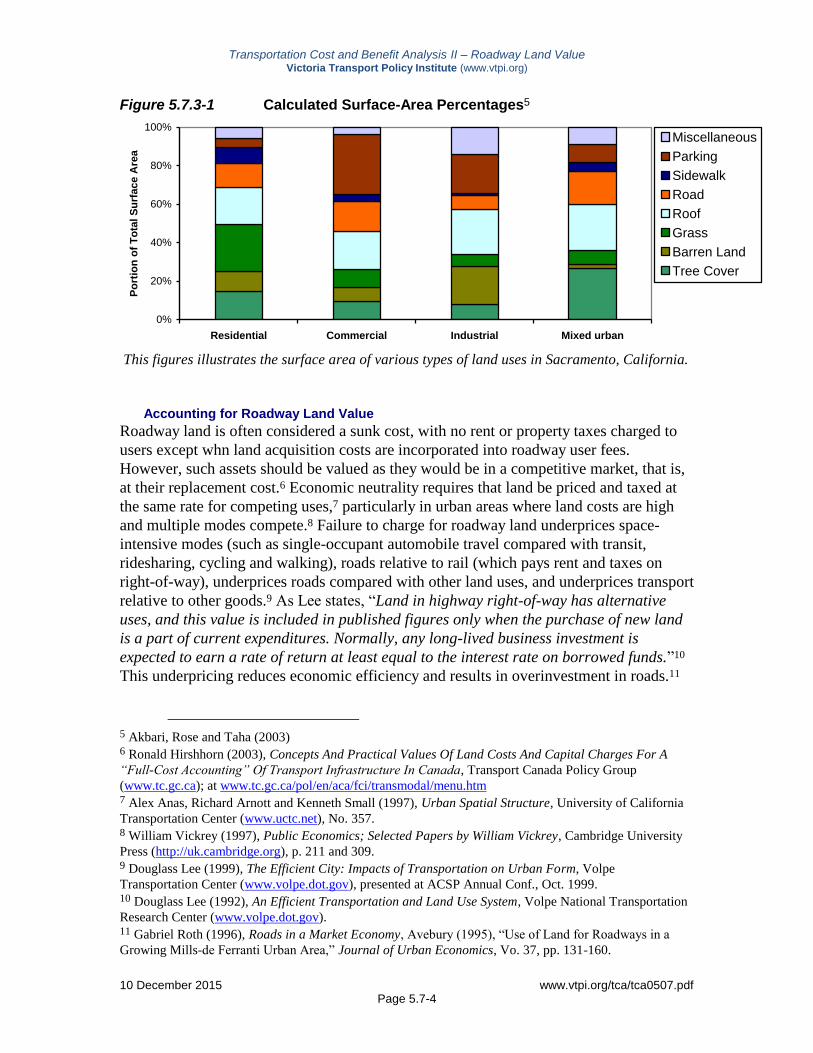
Overall, pavement covers about about 35% of the surface area of most residential areas
and 50–70% in most non-residential areas according to research by Akbari, Rose and
Taha (2003). Table 5.7.3-3 and Figure 5.7.3-1 summarize these results.
Table 5.7.3-3 Calculated Surface-Area Percentages4
Tree
Cover
Barren
Land
Grass Roof Road Sidewalk Parking Miscellaneous
Residential 14.7 10.2 24.5 19.4 12.7 8.0 4.9 5.6
Commercial/service 9.6 7.3 9.3 19.8 15.5 3.7 31.1 3.8
Industrial 8.1 19.7 6.0 23.4 7.3 1.3 20.0 14.3
Transport/communications 0.0 4.0 0.0 5.0 80.0 1.0 10.0 0.0
Industrial and commercial 2.8 15.6 5.6 19.2 10.3 1.3 32.1 13.1
Mixed urban 26.8 2.1 7.1 23.7 17.6 4.5 9.5 8.7
This table summarizes the surface area of various types of land uses in Sacramento, California.
2 H. Levinson (1982), Transportation and Traffic Engineering Handbook, Prentice Hall (www.prenticehall.com), p.
256; K. Button (1994), Transport Economics, Edward Elgar (www.e-elgar.co.uk), p. 117. 3 Rea Janise Kauffman (2001), Paving The Planet, Worldwatch Institute (www.worldwatch.org). 4 Hashem Akbari, L. Shea Rose and Haider Taha (2003), “Analyzing The Land Cover Of An Urban
Environment Using High-Resolution Orthophotos,” Landscape and Urban Planning
(www.sciencedirect.com/science/journal/01692046), Vol. 63, Issue 1, pp. 1–14.
Transportation Cost and Benefit Analysis II – Roadway Land Value Victoria Transport Policy Institute (www.vtpi.org)
10 December 2015 www.vtpi.org/tca/tca0507.pdf Page 5.7-4
Figure 5.7.3-1 Calculated Surface-Area Percentages5
0%
20%
40%
60%
80%
100%
Residential Commercial Industrial Mixed urban
Po
rtio
n o
f T
ota
l S
urf
ac
e A
rea
Miscellaneous
Parking
Sidewalk
Road
Roof
Grass
Barren Land
Tree Cover
This figures illustrates the surface area of various types of land uses in Sacramento, California.
Accounting for Roadway Land Value
Roadway land is often considered a sunk cost, with no rent or property taxes charged to
users except whn land acquisition costs are incorporated into roadway user fees.
However, such assets should be valued as they would be in a competitive market, that is,
at their replacement cost.6 Economic neutrality requires that land be priced and taxed at
the same rate for competing uses,7 particularly in urban areas where land costs are high
and multiple modes compete.8 Failure to charge for roadway land underprices space-
intensive modes (such as single-occupant automobile travel compared with transit,
ridesharing, cycling and walking), roads relative to rail (which pays rent and taxes on
right-of-way), underprices roads compared with other land uses, and underprices transport
relative to other goods.9 As Lee states, “Land in highway right-of-way has alternative
uses, and this value is included in published figures only when the purchase of new land
is a part of current expenditures. Normally, any long-lived business investment is
expected to earn a rate of return at least equal to the interest rate on borrowed funds.”10
This underpricing reduces economic efficiency and results in overinvestment in roads.11
5 Akbari, Rose and Taha (2003) 6 Ronald Hirshhorn (2003), Concepts And Practical Values Of Land Costs And Capital Charges For A
“Full-Cost Accounting” Of Transport Infrastructure In Canada, Transport Canada Policy Group
(www.tc.gc.ca); at www.tc.gc.ca/pol/en/aca/fci/transmodal/menu.htm 7 Alex Anas, Richard Arnott and Kenneth Small (1997), Urban Spatial Structure, University of California
Transportation Center (www.uctc.net), No. 357. 8 William Vickrey (1997), Public Economics; Selected Papers by William Vickrey, Cambridge University
Press (http://uk.cambridge.org), p. 211 and 309. 9 Douglass Lee (1999), The Efficient City: Impacts of Transportation on Urban Form, Volpe
Transportation Center (www.volpe.dot.gov), presented at ACSP Annual Conf., Oct. 1999. 10 Douglass Lee (1992), An Efficient Transportation and Land Use System, Volpe National Transportation
Research Center (www.volpe.dot.gov). 11 Gabriel Roth (1996), Roads in a Market Economy, Avebury (1995), “Use of Land for Roadways in a
Growing Mills-de Ferranti Urban Area,” Journal of Urban Economics, Vo. 37, pp. 131-160.
Transportation Cost and Benefit Analysis II – Roadway Land Value Victoria Transport Policy Institute (www.vtpi.org)
10 December 2015 www.vtpi.org/tca/tca0507.pdf Page 5.7-5
Exempting roadway land from property taxes also imposes a financial burden on
municipal governments. The American Planning Association’s Policy on Transportation
Planning (October 1990) states, “Equal tax treatment requires that transportation
facilities and services not be exempted from general property and sales taxes that
contribute revenues to the general-purpose operation of government.” Poole points out
that land used for transport facilities is undertaxed and tends to be inefficiently managed
because it is not expected to earn rent.12 In addition to financial costs, incremental
increases in the amount of land devoted to roads creates a more dispersed, automobile
dependent land use pattern. Such sprawl tends to increase a number of costs to society,
including public service costs, transportation costs and environmental impacts.13
Since roads often increase adjacent property values, some people argue that roadway land
provides a positive rather than negative social value. It is true that access can increase
property values, but not just automobile access. Failing to charge users for roadway land
favors space-intensive modes over space-efficient modes.
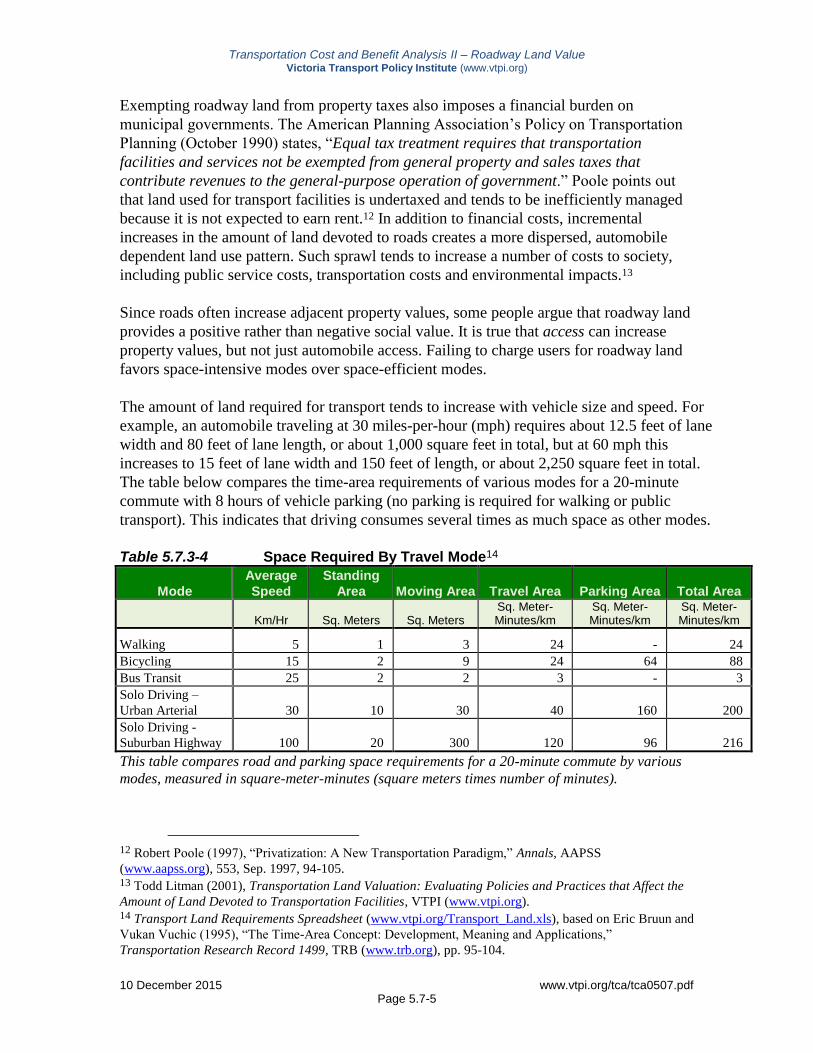
The amount of land required for transport tends to increase with vehicle size and speed. For
example, an automobile traveling at 30 miles-per-hour (mph) requires about 12.5 feet of lane
width and 80 feet of lane length, or about 1,000 square feet in total, but at 60 mph this
increases to 15 feet of lane width and 150 feet of length, or about 2,250 square feet in total.
The table below compares the time-area requirements of various modes for a 20-minute
commute with 8 hours of vehicle parking (no parking is required for walking or public
transport). This indicates that driving consumes several times as much space as other modes.
Table 5.7.3-4 Space Required By Travel Mode14
Mode
Average
Speed
Standing
Area Moving Area Travel Area Parking Area Total Area
Km/Hr Sq. Meters Sq. Meters Sq. Meter-Minutes/km
Sq. Meter-Minutes/km
Sq. Meter-Minutes/km
Walking 5 1 3 24 - 24
Bicycling 15 2 9 24 64 88
Bus Transit 25 2 2 3 - 3
Solo Driving –
Urban Arterial 30 10 30 40 160 200
Solo Driving -
Suburban Highway 100 20 300 120 96 216
This table compares road and parking space requirements for a 20-minute commute by various
modes, measured in square-meter-minutes (square meters times number of minutes).
12 Robert Poole (1997), “Privatization: A New Transportation Paradigm,” Annals, AAPSS
(www.aapss.org), 553, Sep. 1997, 94-105. 13 Todd Litman (2001), Transportation Land Valuation: Evaluating Policies and Practices that Affect the
Amount of Land Devoted to Transportation Facilities, VTPI (www.vtpi.org). 14 Transport Land Requirements Spreadsheet (www.vtpi.org/Transport_Land.xls), based on Eric Bruun and
Vukan Vuchic (1995), “The Time-Area Concept: Development, Meaning and Applications,”
Transportation Research Record 1499, TRB (www.trb.org), pp. 95-104.

Transportation Cost and Benefit Analysis II – Roadway Land Value Victoria Transport Policy Institute (www.vtpi.org)
10 December 2015 www.vtpi.org/tca/tca0507.pdf Page 5.7-6
Figures 5.7.3-2 and 5.7.3-3 illustrate these differences. Automobile travel requires much
more space than walking, bicycling and public transit travel, particularly considering both
road and parking space requirements. Actual space requirements can vary depending on
road design, traffic conditions (speed) and vehicle load factors (passengers per vehicle).
Figure 5.7.3-2 Maximum Passengers Per Hour on Lane By Urban Mode15
The maximum number of passengers that a 3.5-meter urban road lane can carry varies by mode,
travel speed and load factor (number of passengers per vehicle). Automobiles are generally least
space-efficient. This underestimates total automobile road space requirements where city streets
also have parking lanes.
Figure 5.7.3-3 Space Required By Travel Mode
0
50
100
150
200
250
Walking Bicycling Bus Transit Solo Driving - Urban
Arterial
Solo Driving -
Suburban Highway
Sq
ua
re-M
ete
r-M
inu
tes
Pe
r
Kil
om
ete
rmu
te
Parking Area
Travel Area
Automobile travel requires far more space for travel and parking than other modes.
15 ADB (2012), Solutions for Urban Transport, Asian Development Bank (www.adb.org); at
http://farm8.staticflickr.com/7228/7399658942_267b1ba9fc_b.jpg.

Transportation Cost and Benefit Analysis II – Roadway Land Value Victoria Transport Policy Institute (www.vtpi.org)
10 December 2015 www.vtpi.org/tca/tca0507.pdf Page 5.7-7
This does not mean that automobile transport always increases roadway land
requirements 15-100 times. Vehicles often follow closer than safety experts recommend,
reducing road space requirements 20-50% than this analysis indicates, while other
conditions (such as inclement weather) increase road space requirements. Even cities
built before the automobile often had wide roads to accommodate wagon traffic, and to
provide sunlight and air flow.16 But transport land requirements tend to increase with
vehicle ownership.17 Walking cities typically devote less than 10% of land to transport,
while automobile-oriented cities devote two or three times that.18 Automobile dependent
cities average about 7 meters of road length per capita, compared with 2.5 meters in cities
that have more balanced transport systems.19 Figure 5.7.3-1 illustrates how per capita
road supply tends to increase with automobile travel. This indicates that automobile-
dependency increases transport land requirements 3 to 5 times. Put another way, 66% to
80% of the land devoted to roads and parking facilities in modern cities results from the
greater space requirements of automobile transport.
In addition, motor vehicle traffic tends to reduce development density indirectly by
increasing the need for sidewalk and building setbacks to avoid traffic noise and dust, so
larger boulevards, highways shoulders and front lawns can be considered, in part, a land
use cost of motor vehicle transport.
16 Kenneth Button (1994), Transport Economics, 2nd Ed., Edward Elgar (www.e-elgar.co.uk), p. 117. 17 Michael Manville and Donald Shoup (2005), “People, Parking, and Cities,” Journal Of Urban Planning
And Development, American Society of Civil Engineers (www.asce.org), December, pp. 233-245; at
http://shoup.bol.ucla.edu/People,Parking,CitiesJUPD.pdf. 18 Harry Dimitriou (1993), Urban Transport Planning, Routledge, (www.routledge.com). 19 Peter Newman and Jeff Kenworthy (1999), Sustainability and Cities; Overcoming Automobile
Dependence, Island Press (www.islandpress.org), Table 3.9.

Transportation Cost and Benefit Analysis II – Roadway Land Value Victoria Transport Policy Institute (www.vtpi.org)
10 December 2015 www.vtpi.org/tca/tca0507.pdf Page 5.7-8
Roadway Land Valuation
There is some uncertainty concerning urban road rights-of-way valuation. At a minimum,
it is the value of urban periphery land, on the assumption that land used for roads can be
replaced by urban expansion. For example, if automobile transport doubles roadway land
requirements from 10% to 20%, then a city that would otherwise be 1,000 acres could
increase to 1,100. However, this tends to be inappropriate for two reasons. First, many
jurisdictions cannot expand due to physical or political barriers. In such as case, each acre
used for roads represents one less acre available for other purposes.
Figure 5.7.3-4 Relationship Between Vehicle Travel and Road Provision20
R2 = 0.4952
2,000
4,000
6,000
8,000
10,000
0 2 4 6 8 10 12 14Meters of Roadway Per Capita
An
nu
al C
ar
Kilo
me
ters
Pe
r C
ap
ita
As per-capita vehicle travel increases, so too must the amount of land devoted to roads.
The second reason is that cities provide agglomeration economies.21 Land value tends to
increase with development density because it provides more accessibility to desirable
activities, so urban land is generally worth more than rural land. Expanding cities outward
to replace land used for roads reduces this value. The opportunity cost of land used for
roadway rights-of-way is therefore somewhere between that of adjacent parcels and urban
periphery land. It is sometimes argued that not all roadway costs should be charged to
motorists. Even residents who never drive use roads for walking, bicycling, public transit,
deliveries and utility lines. This can be addressed by defining Basic Access road supply
that is unrelated to driving. This is the roadway capacity required to meet the needs of
people who never travel by automobile. The costs of providing this basic road network
can be charged to all residents, while incremental capacity beyond this can be charged to
vehicle users who require additional road space (“users” includes consumers of products
delivered by vehicles, with roadway costs included in delivery charges).
20 Peter Newman and Jeffrey Kenworthy (1989), Cities and Automobile Dependence, Gower
(www.ashgate.com). 21 Jean Jaskold Gabszewicz, et al (1986), Location Theory, Harwood (www.taylorandfrancisgroup.com).

Transportation Cost and Benefit Analysis II – Roadway Land Value Victoria Transport Policy Institute (www.vtpi.org)
10 December 2015 www.vtpi.org/tca/tca0507.pdf Page 5.7-9
As discussed in Chapter 5.6, basic access usually requires just one or two lanes, which is
what consumers typically choose when paying for a driveway, and typically provided in
pedestrian areas such as campuses. Roadway capacity beyond this can be allocated to
vehicle users. Even special pedestrian and bicycle facilities can be considered costs of
driving if motor vehicle traffic is incompatible with these modes, creating the need for
separate facilities; pedestrians and cyclists often use street space rather than sidewalks or
paths in areas with minimal motor vehicle traffic. This implies that two-thirds to three-
quarters of urban roadway land requirements can be charged to motor vehicle users.
Transport Land Costs Tend To Increase With Wealth and Urbanization
With increased wealth and urbanization, land value becomes an increasingly important component of
total transport costs. Traffic and parking congestion problems tend to increase with wealth because
consumers purchase more vehicles, which greatly increases the amount of space needed for travel (a
car trip typically requires an order of magnitude more space than the same trip made by walking,
cycling or transit). Although increased wealth allows greater facility construction expenditures, the
supply of land does not increase. Road and parking facilities must compete for land that is increasingly
expensive due to demand by other uses, so land costs become an increasing portion of project costs
and a limiting factor in roadway and parking capacity expansion. Although sprawl may seem to
overcome this problem by shifting travel to the urban fringe where land costs are lower, dispersed
development increases per-capita vehicle mileage, requiring more lane-miles and parking spaces per
capita, so land costs continue to be a major constraint. As a result, traffic and parking congestion
problems tend to increase, and alternative modes and demand management tend to become more
important with increased wealth and urbanization.
Transportation Cost and Benefit Analysis II – Roadway Land Value Victoria Transport Policy Institute (www.vtpi.org)
10 December 2015 www.vtpi.org/tca/tca0507.pdf Page 5.7-10
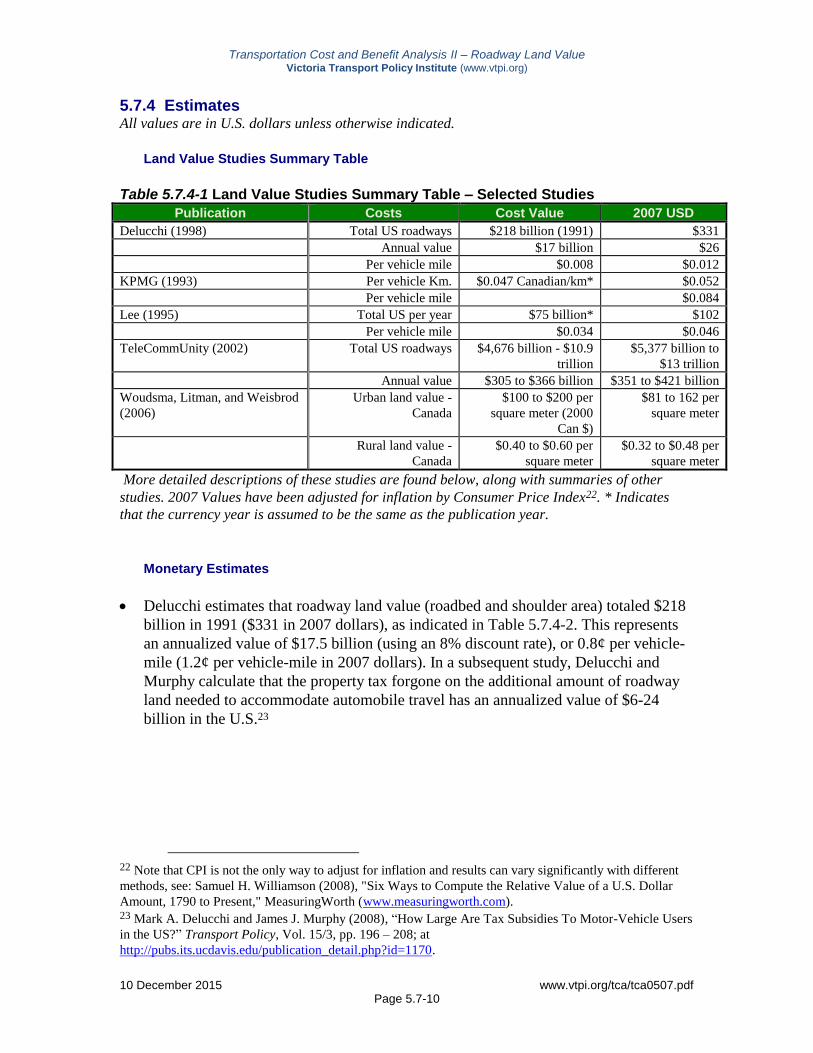
5.7.4 Estimates All values are in U.S. dollars unless otherwise indicated.
Land Value Studies Summary Table
Table 5.7.4-1 Land Value Studies Summary Table – Selected Studies
Publication Costs Cost Value 2007 USD
Delucchi (1998) Total US roadways $218 billion (1991) $331
Annual value $17 billion $26
Per vehicle mile $0.008 $0.012
KPMG (1993) Per vehicle Km. $0.047 Canadian/km* $0.052
Per vehicle mile $0.084
Lee (1995) Total US per year $75 billion* $102
Per vehicle mile $0.034 $0.046
TeleCommUnity (2002) Total US roadways $4,676 billion - $10.9
trillion
$5,377 billion to
$13 trillion
Annual value $305 to $366 billion $351 to $421 billion
Woudsma, Litman, and Weisbrod
(2006)
Urban land value -
Canada
$100 to $200 per
square meter (2000
Can $)
$81 to 162 per
square meter
Rural land value -
Canada
$0.40 to $0.60 per
square meter
$0.32 to $0.48 per
square meter
More detailed descriptions of these studies are found below, along with summaries of other
studies. 2007 Values have been adjusted for inflation by Consumer Price Index22. * Indicates
that the currency year is assumed to be the same as the publication year.
Monetary Estimates
Delucchi estimates that roadway land value (roadbed and shoulder area) totaled $218
billion in 1991 ($331 in 2007 dollars), as indicated in Table 5.7.4-2. This represents
an annualized value of $17.5 billion (using an 8% discount rate), or 0.8¢ per vehicle-
mile (1.2¢ per vehicle-mile in 2007 dollars). In a subsequent study, Delucchi and
Murphy calculate that the property tax forgone on the additional amount of roadway
land needed to accommodate automobile travel has an annualized value of $6-24
billion in the U.S.23
22 Note that CPI is not the only way to adjust for inflation and results can vary significantly with different
methods, see: Samuel H. Williamson (2008), "Six Ways to Compute the Relative Value of a U.S. Dollar
Amount, 1790 to Present," MeasuringWorth (www.measuringworth.com). 23 Mark A. Delucchi and James J. Murphy (2008), “How Large Are Tax Subsidies To Motor-Vehicle Users
in the US?” Transport Policy, Vol. 15/3, pp. 196 – 208; at
http://pubs.its.ucdavis.edu/publication_detail.php?id=1170.

Transportation Cost and Benefit Analysis II – Roadway Land Value Victoria Transport Policy Institute (www.vtpi.org)
10 December 2015 www.vtpi.org/tca/tca0507.pdf Page 5.7-11
Table 5.7.4-2 Estimated U.S. Roadway Land Value in 199124
Road Area (mi
2)
Extra ROW
Factor
Price of Land ($/acre)
Value of Land (1991$10
9)
Totals
Urban P UP P UP P UP P UP P & UP
Interstate Freeway 231 0 1.2 1.2 $50,000 $35,000 $7.4 $0.0 $7.4
Other Freeway 124 0 1.2 1.2 $50,000 $35,000 $3.9 $0.0 $3.9
Principal Arterial 532 0 1.2 1.2 $50,000 $35,000 $17.0 $0.0 $17.0
Minor Arterial 546 3 1.2 1.2 $55,000 $38,500 $19.2 $0.1 $19.3
Collector 458 5 1.2 1.2 $65,000 $45,500 $19.1 $0.1 $19.2
Local Road 2,573 179 1.2 1.2 $70,000 $49,000 $115.3 $5.6 $120.9
Subtotal Urban 4,463 187 Na na na na $181.9 $5.8 $187.7
Rural P UP P UP P UP P UP
Interstate Freeway 533 0 1.25 1.25 $5,000 $600 $1.7 $0.0 $1.7
Other Freeway 971 0 1.25 1.25 $5,000 $600 $3.1 $0.0 $3.1
Principal Arterial 1,058 0 1.25 1.25 $5,000 $600 $3.4 $0.0 $3.4
Minor Arterial 2,355 292 1.25 1.25 $5,000 $600 $7.5 $0.1 $7.6
Collector 932 464 1.25 1.25 $5,000 $600 $3.0 $0.2 $3.2
Local Road 2,865 5,674 1.25 1.25 $5,000 $600 $9.2 $2.2 $11.4
Subtotal Rural 8,715 6,430 Na na na na $27.9 $2.5 $30.4
Urban + Rural 13,178 6,617 na na na Na $209.8 $8.3 $218.1
P = Paved, UP = Unpaved, Na = not applicable
The accounting firm KPMG calculated the value of road land dedicated to motor
vehicle use in the Vancouver area to be worth $578 million a year when amortized at
10%, averaging 4.7¢ Canadian per vehicle km.25
Lee applies FHWA prototypical land acquisition costs per mile to estimate total U.S.
road system land value and calculate annual interest forgone to be $75 billion ($102
billion in 2007 dollars), or 3.4¢ per VMT (4.6¢ per VMT in 2007 dollars).26
The New Zealand Ministry of Transport estimates the annualized value of
“recoverable” road system capital assets (i.e., the value of land and related property)
at NZ$750 million (with a range of $300 million to $980 million), which is about the
same as total annual roadway maintenance expenditures, and the value of “non-
recoverable” assets (i.e., sunk costs associated with building roads is estimated at
$1,860 million).27
24 Mark Delucchi (1998), “Motor Vehicle Infrastructure and Services Provided by the Public Sector,”
Annualized Social Cost of Motor-Vehicle Use in the U.S., 1990-1991, Vol. 7, Institute of Transportation
Studies (http://engineering.ucdavis.edu), UCD-ITS-RR-96-3 (7). 25 KPMG (1993), Cost of Transporting People in the British Columbia Lower Mainland, Greater
Vancouver Regional District (www.metrovancouver.org), p. 27. 26 Douglas Lee (1995), Full Cost Pricing of Highways, Volpe National Transportation Systems Center
(www.volpe.dot.gov), p. 11. 27 Booz Allen Hamilton (2005), Surface Transport Costs and Charges Study, Ministry of Transportation
New Zealand (www.transport.govt.nz), March 2005.
Transportation Cost and Benefit Analysis II – Roadway Land Value Victoria Transport Policy Institute (www.vtpi.org)
10 December 2015 www.vtpi.org/tca/tca0507.pdf Page 5.7-12
Researcher Kerry Wood calculated that standard return on capital required for New
Zealand’s roadway investments (value of land and facilities) would be US$1,155
million, 1.4 times current annual roadway expenditures.28
TeleCommUnity (2002) estimated that U.S. roadway rights-of-way total 22,437
square miles, with a value of $3,565 billion, or up to $10.9 trillion using a
comparable transaction valuation methodology.29 They estimate that the entire
roadway system has a present value of $4,676 billion, of which $3,565 billion (76%)
is land value and $1,110 billion (24%) is for improvements. Using a different
valuation methodology they estimate that entire value of the nation’s rights of way for
a single year produces annual rental value ranging between $305 and $366 billion.
They comment, “…the cost of acquiring a right-of-way corridor necessarily is more
expensive than simply the ATF (Across the Fence) value of the abutting land.
Applying the lowest corridor enhancement factor now employed by appraisers
suggests the value is $7.1 Trillion. These results are consistent and conservative when
measured against comparable transactions reported by federal government agencies.”
Woudsma, Litman, and Weisbrod developed practical methods for quantifying the
values of land used for transport facilities, including roads, railroads, ports and
airports.30 They use property value data to calculate the average value of land in
various geographic zones, with separate techniques for urban and rural conditions to
reflect differences in land use markets and data availability. The results indicate that
urban land values typically range from $100 to $200 per square meter, and rural land
values typically range from $0.40 to $0.60 per square meter (2000 Canadian dollars).
28 Kerry Wood (1997),“New Zealand’s Land Transport Pricing Study,” Streets for People, No. 4, March, p. 8. 29 TeleCommUnity (2002), Valuation Of The Public Rights-Of-Way Asset, TeleCommUnity
(www.telecommunityalliance.org); at www.telecommunityalliance.org/images/valuation2002.pdf 30 Clarence Woudsma, Todd Litman, and Glen Weisbrod (2006), A Report On The Estimation Of Unit
Values Of Land Occupied By Transportation Infrastructures In Canada, Transport Canada (www.tc.gc.ca);
at www.vtpi.org\TC_landvalue.pdf.
Transportation Cost and Benefit Analysis II – Roadway Land Value Victoria Transport Policy Institute (www.vtpi.org)
10 December 2015 www.vtpi.org/tca/tca0507.pdf Page 5.7-13
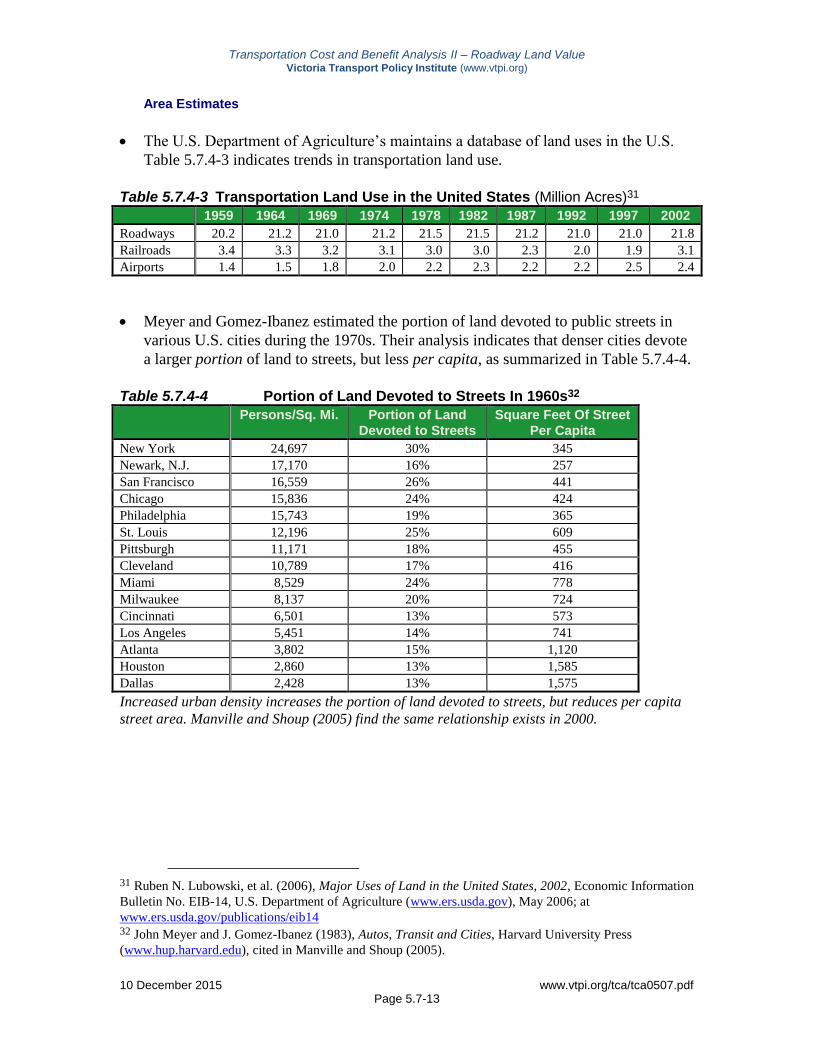
Area Estimates
The U.S. Department of Agriculture’s maintains a database of land uses in the U.S.
Table 5.7.4-3 indicates trends in transportation land use.
Table 5.7.4-3 Transportation Land Use in the United States (Million Acres)31
1959 1964 1969 1974 1978 1982 1987 1992 1997 2002
Roadways 20.2 21.2 21.0 21.2 21.5 21.5 21.2 21.0 21.0 21.8
Railroads 3.4 3.3 3.2 3.1 3.0 3.0 2.3 2.0 1.9 3.1
Airports 1.4 1.5 1.8 2.0 2.2 2.3 2.2 2.2 2.5 2.4
Meyer and Gomez-Ibanez estimated the portion of land devoted to public streets in
various U.S. cities during the 1970s. Their analysis indicates that denser cities devote
a larger portion of land to streets, but less per capita, as summarized in Table 5.7.4-4.
Table 5.7.4-4 Portion of Land Devoted to Streets In 1960s32
Persons/Sq. Mi. Portion of Land
Devoted to Streets
Square Feet Of Street
Per Capita
New York 24,697 30% 345
Newark, N.J. 17,170 16% 257
San Francisco 16,559 26% 441
Chicago 15,836 24% 424
Philadelphia 15,743 19% 365
St. Louis 12,196 25% 609
Pittsburgh 11,171 18% 455
Cleveland 10,789 17% 416
Miami 8,529 24% 778
Milwaukee 8,137 20% 724
Cincinnati 6,501 13% 573
Los Angeles 5,451 14% 741
Atlanta 3,802 15% 1,120
Houston 2,860 13% 1,585
Dallas 2,428 13% 1,575
Increased urban density increases the portion of land devoted to streets, but reduces per capita
street area. Manville and Shoup (2005) find the same relationship exists in 2000.
31 Ruben N. Lubowski, et al. (2006), Major Uses of Land in the United States, 2002, Economic Information
Bulletin No. EIB-14, U.S. Department of Agriculture (www.ers.usda.gov), May 2006; at
www.ers.usda.gov/publications/eib14 32 John Meyer and J. Gomez-Ibanez (1983), Autos, Transit and Cities, Harvard University Press
(www.hup.harvard.edu), cited in Manville and Shoup (2005).
Transportation Cost and Benefit Analysis II – Roadway Land Value Victoria Transport Policy Institute (www.vtpi.org)
10 December 2015 www.vtpi.org/tca/tca0507.pdf Page 5.7-14
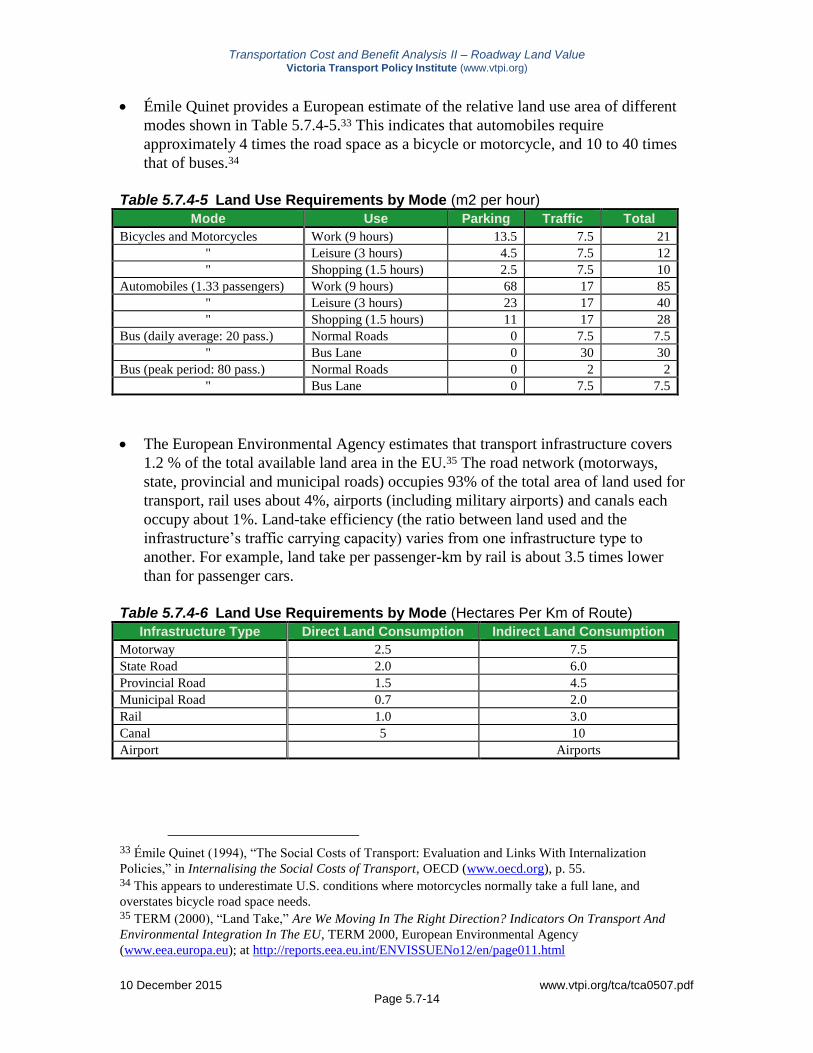
Émile Quinet provides a European estimate of the relative land use area of different
modes shown in Table 5.7.4-5.33 This indicates that automobiles require
approximately 4 times the road space as a bicycle or motorcycle, and 10 to 40 times
that of buses.34
Table 5.7.4-5 Land Use Requirements by Mode (m2 per hour)
Mode Use Parking Traffic Total
Bicycles and Motorcycles Work (9 hours) 13.5 7.5 21
" Leisure (3 hours) 4.5 7.5 12
" Shopping (1.5 hours) 2.5 7.5 10
Automobiles (1.33 passengers) Work (9 hours) 68 17 85
" Leisure (3 hours) 23 17 40
" Shopping (1.5 hours) 11 17 28
Bus (daily average: 20 pass.) Normal Roads 0 7.5 7.5
" Bus Lane 0 30 30
Bus (peak period: 80 pass.) Normal Roads 0 2 2
" Bus Lane 0 7.5 7.5
The European Environmental Agency estimates that transport infrastructure covers
1.2 % of the total available land area in the EU.35 The road network (motorways,
state, provincial and municipal roads) occupies 93% of the total area of land used for
transport, rail uses about 4%, airports (including military airports) and canals each
occupy about 1%. Land-take efficiency (the ratio between land used and the
infrastructure’s traffic carrying capacity) varies from one infrastructure type to
another. For example, land take per passenger-km by rail is about 3.5 times lower
than for passenger cars.
Table 5.7.4-6 Land Use Requirements by Mode (Hectares Per Km of Route)
Infrastructure Type Direct Land Consumption Indirect Land Consumption
Motorway 2.5 7.5
State Road 2.0 6.0
Provincial Road 1.5 4.5
Municipal Road 0.7 2.0
Rail 1.0 3.0
Canal 5 10
Airport Airports
33 Émile Quinet (1994), “The Social Costs of Transport: Evaluation and Links With Internalization
Policies,” in Internalising the Social Costs of Transport, OECD (www.oecd.org), p. 55. 34 This appears to underestimate U.S. conditions where motorcycles normally take a full lane, and
overstates bicycle road space needs. 35 TERM (2000), “Land Take,” Are We Moving In The Right Direction? Indicators On Transport And
Environmental Integration In The EU, TERM 2000, European Environmental Agency
(www.eea.europa.eu); at http://reports.eea.eu.int/ENVISSUENo12/en/page011.html

Transportation Cost and Benefit Analysis II – Roadway Land Value Victoria Transport Policy Institute (www.vtpi.org)
10 December 2015 www.vtpi.org/tca/tca0507.pdf Page 5.7-15
van Essen, et al, describe various method that can be used to calculate the value of
land devoted to transport infrastructure.36 The table below summarizes estimates of
the amount of land devoted to transport infrastructure in the Netherlands.
Table 5.7.4-7 Transport Infrastructure Land Use in The Netherlands (Square Kms)
Components Urban Rural Allocation
Roads Direct Roadways
Parking space
Service areas
Cycle lanes
360
119.1
n.a.
25.3
748
n.a.
15.8
40.3
Full/partial
Full
Full
Partial
Indirect Risk contour
Noise contour
2.1
65
18.9
335
None
Partial
Railroads Direct Track & other Infrastructure 18.6 55.9 Full
Indirect Risk contour
Noise contour
4.1
50
n.a.
100
None
Partial
Inland shipping Harbours & anchorages 21.8 n.a. Partial
Indirect Sight zones 15.7 154.6 Partial
5.7.5 Variability Road land costs are based on vehicle use (which creates demand for roads) and varies
depending on location, with higher land market values in urban areas, and higher non-
market values in areas with high environmental worth.
5.7.6 Equity and Efficiency Issues Since roadway land is usually considered a sunk cost and users pay no rent or taxes on it,
roadway land value can be considered an external cost. Put differently, public land
devoted to road rights-of-way is a public resource that benefits people in proportion to
their motor vehicle travel. To the degree that this benefits some people at the expense of
others (for example, people who prefer less land for roads and more for schools, houses
or parks), it can be considered unfair. To the degree it makes vehicle use more affordable,
it can be considered progressive (vertically equitable), although since vehicle use tends to
increase with income, this benefit is regressively distributed overall. To the degree that
this increases the amount of land devoted to driving, or increases total vehicle travel
beyond what is economically optimal, it is economically inefficient.
36 van Essen, et al (2004), Marginal Costs of Infrastructure Use – Towards a Simplified Approach, CE
Delft; results published in Vermeulen, et al (2004), The Price of Transport, CE Delft (www.ce.nl).

Transportation Cost and Benefit Analysis II – Roadway Land Value Victoria Transport Policy Institute (www.vtpi.org)
10 December 2015 www.vtpi.org/tca/tca0507.pdf Page 5.7-16
5.7.7 Conclusions Land used for roads is a valuable resource with an opportunity cost. To allocate this cost
to vehicles it is appropriate to first subtract the portion of the road system that provides
basic access, which typically represents about 25% of paved road area and a smaller
portion of road rights-of-way. The remaining 75%+ is charged based on vehicle travel.
Although large vehicles require more road space under congested conditions, this is not
considered significant for the total amount of land allocated to road right-of-way.
Inflation adjusted land value estimates from Table 5.7.4-1 range from $0.012 per vehicle
mile (Delucchi 1998) to $0.084 (KPMG 1993). Douglass Lee’s (1995) value of $0.046 is
very close to the mid-range of these values, and is used as the starting point. Subtracting
25% of this cost for basic access leaves $0.036 per mile, which is applied to all motor
vehicles. Although urban land values are higher, urban roads receive greater use per lane
mile, so average costs per vehicle mile are considered to be comparable for both urban
and rural travel. Bicycling and walking are estimated to require 5% of an average
automobile’s road space (walking is not considered to increase road requirements in rural
areas), while rideshare passengers and telework require none.
Table 4.7.7-1 Roadway Land Value Costs (2007 U.S. Dollars per Vehicle Mile)
Vehicle Class Urban Peak Urban Off-Peak Rural Average
Average Car 0.034 0.034 0.034 0.034
Compact Car 0.034 0.034 0.034 0.034
Electric Car 0.034 0.034 0.034 0.034
Van/Light Truck 0.034 0.034 0.034 0.034
Rideshare Passenger 0.000 0.000 0.000 0.000
Diesel Bus 0.034 0.034 0.034 0.034
Electric Bus/Trolley 0.034 0.034 0.034 0.034
Motorcycle 0.034 0.034 0.034 0.034
Bicycle 0.002 0.002 0.002 0.002
Walk 0.002 0.002 0.002 0.002
Telework 0.000 0.000 0.000 0.000
Automobile Cost Range
The range is based on inflation adjusted values discussed in detail in section 5.7.4 above,
in particular $0.012 per mile (Delucci 1998) and $0.084 (KPMG 1993).
Minimum Maximum
$0.01 $0.08

Transportation Cost and Benefit Analysis II – Roadway Land Value Victoria Transport Policy Institute (www.vtpi.org)
10 December 2015 www.vtpi.org/tca/tca0507.pdf Page 5.7-17
5.7.8 Information Resources Resources listed below provide information on transportation land evaluation.
Hashem Akbari, L. Shea Rose and Haider Taha (2003), “Analyzing The Land Cover Of An
Urban Environment Using High-Resolution Orthophotos,” Landscape and Urban Planning
(www.sciencedirect.com/science/journal/01692046), Vol. 63, Issue 1, pp. 1–14.
Booz Allen Hamilton (2005), Surface Transport Costs and Charges Study, Ministry of
Transportation New Zealand (www.transport.govt.nz); at
www.beehive.govt.nz/Documents/Files/STCCS%20Main%20Report.pdf.
Amélie Y. Davis, Bryan C. Pijanowski, Kimberly D. Robinson and Paul B. Kidwell (2010),
“Estimating Parking Lot Footprints In The Upper Great Lakes Region Of The USA” Landscape
and Urban Planning, Vol. 96, Issue 2, May, Pages 68-77; at www.citeulike.org/article/6869205.
Mark Delucchi (1998), “Motor Vehicle Infrastructure and Services Provided by the Public
Sector,” Annualized Social Cost of Motor-Vehicle Use in the U.S., 1990-1991, Vol. 7, Institute of
Transportation Studies (http://engineering.ucdavis.edu), UCD-ITS-RR-96-3 (7).
Mark A. Delucchi and James J. Murphy (2008), “How Large Are Tax Subsidies To Motor-
Vehicle Users in the US?” Transport Policy, Vol. 15/3, pp. 196 – 208; at
http://pubs.its.ucdavis.edu/publication_detail.php?id=1170.
EEA (2006), Land Accounts for Europe 1990-2000, European Environment Agency
(www.eea.europa.eu); at http://reports.eea.europa.eu/eea_report_2006_11.
Ronald Hirshhorn (2003), Concepts And Practical Values Of Land Costs And Capital Charges
For A “Full-Cost Accounting” Of Transport Infrastructure In Canada, Transport Canada Policy
Group (www.tc.gc.ca); at www.tc.gc.ca/pol/en/aca/fci/transmodal/menu.htm.
Ben Janke, John S. Gulliver and Bruce N. Wilson (2011), Development of Techniques to Quantify
Effective Impervious Cover, Center for Transportation Studies, University of Minnesota
(www.cts.umn.edu); at www.cts.umn.edu/Publications/ResearchReports/reportdetail.html?id=2058.
Todd Litman (2004), Pavement Busters Guide, VTPI (www.vtpi.org); at
www.vtpi.org/pavbust.pdf.
Todd Litman (2006), Evaluating Transportation Land Use Impacts, VTPI (www.vtpi.org); at
www.vtpi.org/landuse.pdf.
Todd Litman (2005), Transportation Land Valuation; Evaluating Policies and Practices that
Affect the Amount of Land Devoted to Transportation Facilities, VTPI (www.vtpi.org); at
www.vtpi.org/land.pdf.
Todd Litman (2011), “Why and How to Reduce the Amount of Land Paved for Roads and
Parking Facilities,” Environmental Practice, Vol. 13, No. 1, March, pp. 38-46;
http://journals.cambridge.org/action/displayJournal?jid=ENP.
Transportation Cost and Benefit Analysis II – Roadway Land Value Victoria Transport Policy Institute (www.vtpi.org)
10 December 2015 www.vtpi.org/tca/tca0507.pdf Page 5.7-18
Ruben N. Lubowski, et al. (2006), Major Uses of Land in the United States, 2002, Economic
Information Bulletin EIB-14, USDA (www.ers.usda.gov); at www.ers.usda.gov/publications/eib14.
Michael Manville and Donald Shoup (2005), “People, Parking, and Cities,” Journal Of Urban
Planning And Development, American Society of Civil Engineers (www.asce.org), December,
pp. 233-245; at http://shoup.bol.ucla.edu/People,Parking,CitiesJUPD.pdf; summarized in Access
25, (www.uctc.net), Fall 2004, pp. 2-8.
Christopher McCahill and Norman Garrick (2012), “Automobile Use And Land Consumption:
Empirical Evidence From 12 Cities,” Urban Design International, Vol. 17, Autumn, pp. 221-227
(doi:10.1057/udi.2012.12); summarized in “Cars and Robust Cities Are Fundamentally
Incompatible,” The Atlantic Cities, www.theatlanticcities.com/commute/2013/02/cars-and-
robust-cities-are-fundamentally-incompatible/4651.
TERM (2000), “Land Take,” Are We Moving In The Right Direction? Indicators On Transport
And Environmental Integration In The EU, TERM 2000, European Environmental Agency
(www.eea.europa.eu); at http://reports.eea.eu.int/ENVISSUENo12/en/page011.html.
van Essen, et al (2004), Marginal Costs of Infrastructure Use – Towards a Simplified Approach,
CE Delft (www.ce.nl); at www.ce.nl/?go=home.downloadPub&id=456&file=04_4597_15.pdf.
Clarence Woudsma, Todd Litman, and Glen Weisbrod (2006), A Report On The Estimation Of
Unit Values Of Land Occupied By Transportation Infrastructures In Canada, Transport Canada
(www.tc.gc.ca); at www.vtpi.org\TC_landvalue.pdf.