5hvhdufk - nebula.wsimg.com
TRANSCRIPT

CONSULTING EDITOR
Dr. Surender Kumar
Indo-US Research Institute for Sustainable Development
US Office: 4399 Peralta Blvd Fremont CA 94536
EDITOR IN CHIEF
Prof. G. S. Dangayach
Dept. of Mech. Engg. , MNIT, Jaipur
Editors
Dr. Mayank Agrawal Dr. Rajeev Agrawal Air Liquide, Quai Dorsay Dept. of Mech. Engg , MNIT,
Paris,France Jaipur Associate Editors
J Ramkumar , Dr. M L Meena Dr. Amar Patnaik
IIT,Kanpur Dept. of Mech. Engg, MNIT, Jaipur
Assistant Editors
Rahul Chhibber Dr. Jinesh Kumar Jain Dr. Amit Kumar Singh
IIT, Jodhpur Dept. of Mech. Engg, MNIT, Jaipur
Area Editor’s
Prof. P. N. Rao, University of Northern Iowa,
Prof. Immanuel Edinbarough, The University of Texas Rio Grande Valley, U.S.
Jaideep Motwani, Grand Valley State University, USA
Dr. Nitin Upadhye, University of Modern Sciences, UAE
Dr M. Vijaya Kumar,Dept. of Mech. Engg,NIT Warangal
Language Editor
Dr Spoorthi B, NIT Warangal
Manufacturing Technology & Research
(ISSN No. 0973-0281) Published biannually since 2005
Editorial office: Indo-US Research Institute for Sustainable Development, 4399 Peralta Blvd, Fremont, California, USA Sponsored by: Kogence, Mountain View ,California, USA
Published by: Satya Prakhshan,16/7698, New Rohtak Rd, Karol Bagh,New Delhi-5
AN INTERNATIONAL JOURNAL

International Advisory Board
Prof. Diego Galar, Lulea University of Technology, Sweden
Dr. Rohit Joshi, Associate Professor, IIM Shillong
Bert Verlinden Catholic University, Leuven, Belgium
Raj Kumar Roy, Cranfield University, Cranfield, England
Shiv G. Kapoor, University of IIionois, USA
Prof Vikas Kumar, University of the West of England, United Kingdom
Dr. S. S. Mohapatra,NIT Rourkela, India
Mukul Agrawal, Applied Materials, Santalara, USA
Prof. Jing Shi, University of Cincinnati, USA
Prof. P. Venkateswara Rao, IIT, Delhi
Prof. N. Ramesh Babu, IIT Madras
Dr M Ramulu, University of Washington, Seattle, WA, USA
Prof. Xiaobo Yin, Boulder, Colorado, USA
Prof. Chittaranjan Sahay, Director, Center for Manufacturing and Metrology
Dr. Manoj Gupta, NUS Singapore, Singapore
Imre Horvath, Delft University of Technology
Prof. V K Jain,(Prof. Retd.)IIT, Kanpur
Prof. Albano Augusto Cavaleiro Rodrigues de Carvalho
Prof. Filipe Fernandes, University of Minho, Portugal
Prof. Gusztáv Fekete, Eötvös Loránd University, Hungary
Prof. Y.Lin,
Prof. Milind Kumar Sharma,JNVU,Jodhpur
M K Gupta ,Principal, JGTR&TC
Er. Rana Chkraborty, HEC Ltd.
S.K. Bhagat, CCL, Dr. Vivek Gaba, NIT, Raipur
José Machado, University of Minho (Mech Eng Dept), Portugal
Justyna Trojanowska, Poznan University of Technology, Poland
Robert Sika, Poznan University of Technology, Poland
Leonilde Varela, University of Minho (Production Eng Dept), Portugal
Dr. Eric Costa, Solent University, United Kingdom
Gopalakrishnan Narayanamurthy, University of Liverpool Management School
Sergej Hloch , Institute of Advanced Technologies, Slovak Republic
Vishal S Chauhan, Indian Institute of Technology Mandi
Prof (Dr) Vinod Yadava, MNNIT, Allahabad
Prof. R S Walia ,DTU ,Delhi
Prof Ashok K Pundir, NITIE, Mumbai
Dr. Sandeep Goyal, M. P. Council of Science & Technology, Bhopal
Dr. Naresh Chandra Murmu,CSIR-CMERI, Durgapur, INDIA,
Dr. A. R. Dixit, IIT(ISM), Dhanbad, India
Dr. Santosh B. Rane, SPCOE, Mumbai
Dr. Saurabh Pratap, ,IIITDM, Jabalpur
Dr. Tushar N. Desai, SVNIT, Surat
Dr.S.Vinodh, NIT, Tiruchirappalli
Dr.Rajesh Singh,MD, Thinkstep Sustainability Solutions Pvt Ltd
Professor Dixit Garg, National Institute of Technology Kurukshetra
Mr. R. Chandrasekar, IIPE, Bangalore, India
Dr. Somnath Chattopadhyaya, IIT(ISM), Dhanbad, India
Amit Pal, MECON,
Ajay Kumar, SAIL-CET, Ranchi, India
Dr. Md. Mamun Habib, UNITAR International University, Malaysia
Dr. Venu Gopal A, National Institute of Technology, Warangal
Dr. Sumit Gupta ,ASET,AU,Noida

Jan.-Dec.,2019, Vol.12,No.1,2 Manufacturing Technology & Research (An International Journal)
,(ISSN: 0973-0281), Table of Content
S. No.
Paper title and Authors Page
1. Measuring Quality of Work Life among Workers in Carpet Industries of Jaipur Ashish Kumar Singh,, Makkhan Lal Meena, Govind Sharan Dangayach, Alok Kumar
1-9
2. Experimental Investigation of Turning of AISI 304 Stainless Steel Using Green Fluids Abhishek yadava, Gaurava, Shrikant Mistrya, G S Dangayach
10-22
3. Investigation of Surface Integrity of Cylinder Liner of IC Engine by Honing Process using RSM Technique
B N Tripathi & Suman Gothwal
23-37
4. Design of Hydraulically controlled Machine Tool to Perform Multiple Machining Operations
Mohd. Almasood, Yogendra Singh Rajpoot, A K Sharma
38-43
5. Development and Futuristic Scope of Wind Energy in India Dileep Gangil& Dr. Devendra Singh
44-53
6. Micro-pocket formation on DELRIN by optimizing the parameters of Abrasive Jet Machining (AJM) Vishvas Malika ,Nilesh Ramdas , Varsha Singh , Bhaskar Kandpal , Brijbhushan Tyagi
54-58
7. Utilization of Reverse Supply Chain and its Obscurity in Industries Bhupender Singh and Sanjeev Kumar
59-63
8. An aggregate methodology of process re-engineering with reverse logistics coordination in an OEM unit Neeraj Kumar, Rajesh Kumar Patel, Vivek Kumar Pathak
64-68
Editorial office: Indo-US Research Institute for Sustainable Development, 4399 Peralta Blvd, Fremont, California, USA
Sponsored by: Kogence, Mountain View ,California, USA
Published by: Satya Prakhshan,16/7698, New Rohtak Rd, Karol Bagh,New Delhi-5

From Editor’s Desk
The importance of manufacturing sector in national growth and economy is recently realized by the
policy makers. The success of any firm revolves around how well it manages its resources and
operations. A higher degree of integration of resources with the capabilities of human resource and a
synergy with supply chain management functions are essential. Strong supply chain management can
improve a firm's reputation both with consumers and business partners. Manufacturers must keep a
close watch on three key drivers: Quality, efficiency and productivity. However, these three functions
often have conflicting objectives. Optimization of these objectives will result in reduced
manufacturing cost and enhanced quality leading to customer satisfaction and market share which is
essential for the survival in the competitive open market scenario.
At such a juncture of time, this Volume 12, No.1, 2 will make modestly contribution towards
the same goal by bringing together researchers, academicians, manufacturers and managers from
industry on the same forum.
CONSULTING EDITOR & EDITOR IN CHIEF

Call for papers: Vol. 13, No.1-2, 2020
The papers must be submitted to the Manufacturing technology & Research is a peer reviewed International Journal, electronically through the email to [email protected], [email protected]. The manuscript must be accompanied by a signed statement that it has been neither published nor currently submitted for publication elsewhere. The manuscript should be written in English and a minimum standard of the proficiency in the English language should be met before submission to the editorial office. Email notification to the author for each process stage.
It is important that authors provide functioning email address and functioning mobile number of the first author correctly because all communication will occur on those email address and/or mobile number.
Details of the paper (Title, Abstract, Keywords, Author Name(s), Designation(s), Organization Name(s)) must be same as mentioned in the research paper which you are submitting.
Authors are requested to adhere to guidelines while submitting a manuscript for publication. The detailed manuscript submission guidelines can be downloaded:
http://www.iurisd.org/journal-of-manufacturing-technology---research2.html
Journal of Manufacturing technology & research Dear Readers: Journal of Manufacturing technology & research has just published its latest issue at link of issue We invite you to review the Table of Contents here and then visit our web site to review articles and items of interest. Thanks for the continuing interest in our work, Prof. G.S Dangayach Editor-In-Chief, Journal of Manufacturing Technology and Research
Manufacturing Technology and Research (An International Journal)| Volume 12 | Issue 1-2 | Month Jan-Dec (2019) ISSN: 0973-0281
Page | 1
Measuring Quality of Work Life among Workers in Carpet Industries of Jaipur
Makkhan Lal Meenaa*
, Ashish Kumar Singhb, Govind Sharan Dangayach
c
*,aMalaviya National Institute of Technology Jaipur -302017, India
bIndian Institute of Technology Guwahati – 781039, India
Abstract
In the present era, the multifaceted concept of quality of work-life (QWL) of workers is the prime focus of many academic papers with an attempt to relate it to different experimental and statistical settings. Worker’s QWL is an important factor that may affect organizational performance and success significantly. There is a significant contribution of small scale industries to the economy of India. The productivity of a firm and standard of living of people are directly linked with QWL and may vary from industry to industry. The study aims to evaluate QWL among carpet weavers of Jaipur. The data were collected visiting twenty workshops and 120 randomly selected female/male weavers were surveyed using a questionnaire. The result showed overall dissatisfaction was associated with the work environment among the weavers. Un-ergonomically designed workstations can be the major cause of occupational discomfort which may further responsible for stress and fatigue.
Keywords: QWL; discomfort, workplace, carpet industry
1. Introduction
Indian heritage hand-crafted work and handicrafts are renowned all over the world.
Handicrafts like metal crafts, hand-woven carpets, tufted carpet, hand block printing, blue
pottery, textile screen printing, embroidery, stone carving, gems and jewelry, leather crafts,
bamboo craft, woodcraft account for 50% of the national product by the informal sector.
Handwoven carpets have a massive market demand mainly in American markets. However, the
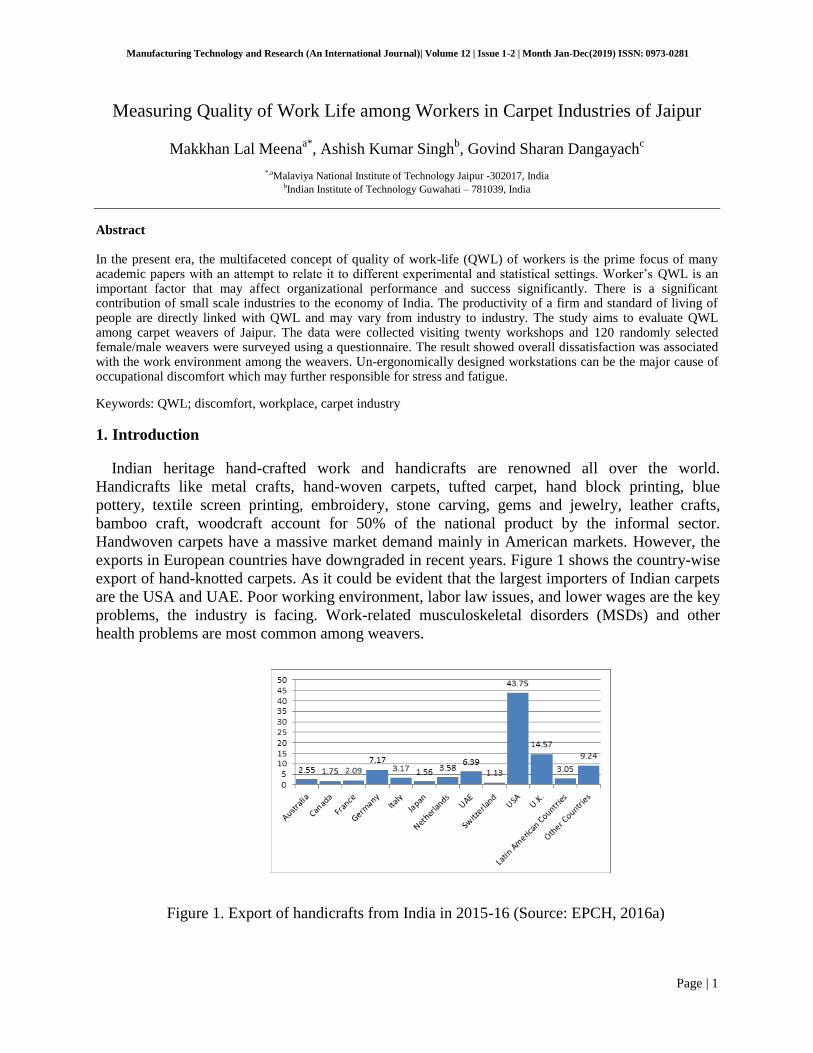
exports in European countries have downgraded in recent years. Figure 1 shows the country-wise
export of hand-knotted carpets. As it could be evident that the largest importers of Indian carpets
are the USA and UAE. Poor working environment, labor law issues, and lower wages are the key
problems, the industry is facing. Work-related musculoskeletal disorders (MSDs) and other
health problems are most common among weavers.
Figure 1. Export of handicrafts from India in 2015-16 (Source: EPCH, 2016a)
Page | 2
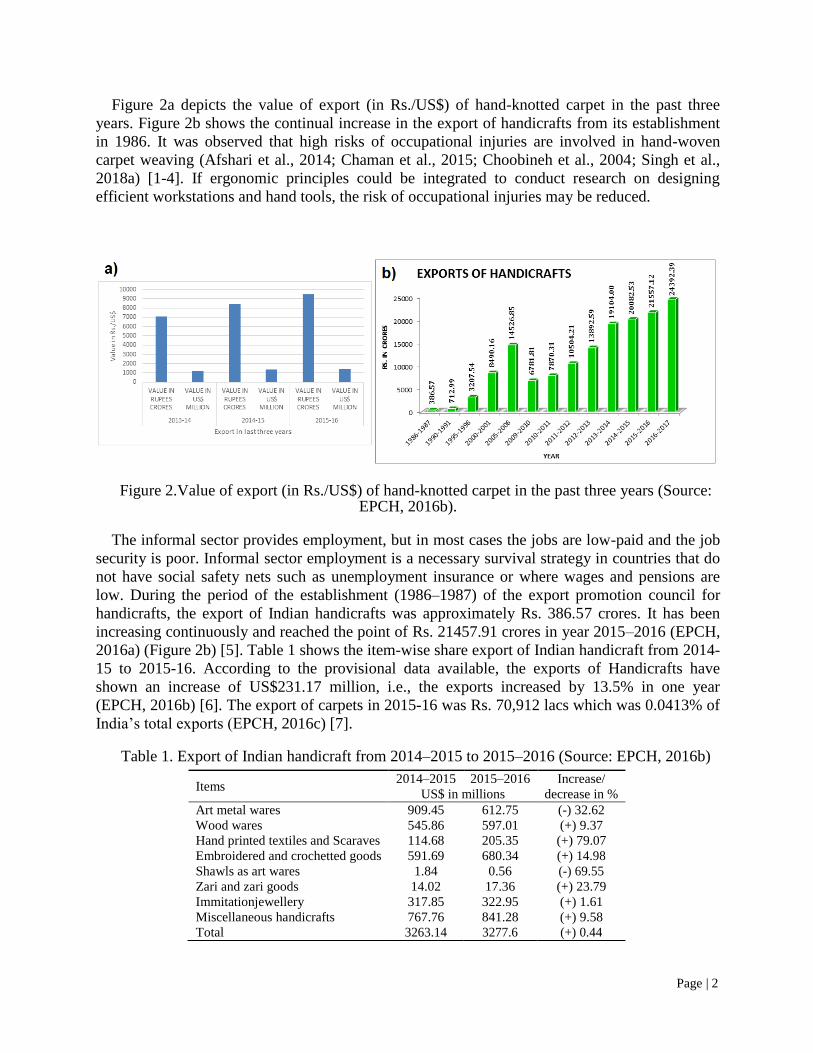
Figure 2a depicts the value of export (in Rs./US$) of hand-knotted carpet in the past three
years. Figure 2b shows the continual increase in the export of handicrafts from its establishment
in 1986. It was observed that high risks of occupational injuries are involved in hand-woven
carpet weaving (Afshari et al., 2014; Chaman et al., 2015; Choobineh et al., 2004; Singh et al.,
2018a) [1-4]. If ergonomic principles could be integrated to conduct research on designing
efficient workstations and hand tools, the risk of occupational injuries may be reduced.
Figure 2.Value of export (in Rs./US$) of hand-knotted carpet in the past three years (Source:
EPCH, 2016b). The informal sector provides employment, but in most cases the jobs are low-paid and the job
security is poor. Informal sector employment is a necessary survival strategy in countries that do
not have social safety nets such as unemployment insurance or where wages and pensions are
low. During the period of the establishment (1986–1987) of the export promotion council for
handicrafts, the export of Indian handicrafts was approximately Rs. 386.57 crores. It has been
increasing continuously and reached the point of Rs. 21457.91 crores in year 2015–2016 (EPCH,
2016a) (Figure 2b) [5]. Table 1 shows the item-wise share export of Indian handicraft from 2014-
15 to 2015-16. According to the provisional data available, the exports of Handicrafts have
shown an increase of US$231.17 million, i.e., the exports increased by 13.5% in one year
(EPCH, 2016b) [6]. The export of carpets in 2015-16 was Rs. 70,912 lacs which was 0.0413% of
India’s total exports (EPCH, 2016c) [7].
Table 1. Export of Indian handicraft from 2014–2015 to 2015–2016 (Source: EPCH, 2016b)
Items 2014–2015 2015–2016 Increase/
decrease in % US$ in millions
Art metal wares 909.45 612.75 (-) 32.62
Wood wares 545.86 597.01 (+) 9.37
Hand printed textiles and Scaraves 114.68 205.35 (+) 79.07
Embroidered and crochetted goods 591.69 680.34 (+) 14.98
Shawls as art wares 1.84 0.56 (-) 69.55
Zari and zari goods 14.02 17.36 (+) 23.79
Immitationjewellery 317.85 322.95 (+) 1.61
Miscellaneous handicrafts 767.76 841.28 (+) 9.58
Total 3263.14 3277.6 (+) 0.44

Page | 3
The quality of work-life (QWL) emerged to end exploitation and injustice on the part of
employers. QWL is an indicator of how free the society is from exploitation. Different kind of
factors that determine such an experience at work. QWL has also been viewed in a variety of
ways that includes a set of industrial interventions to empower employees, and the type of work-
life among workers. Thus, by the increasing workforce in handicrafts occupations, significant
considerations about QWL in these environments should be taken into consideration during the
present time.
The elements that are relevant to an individual’s QWL include the task, the physical work
environment, social environment within the organization, administrative system, and relationship
between life on and off the job (Rose et al., 2006) [8]. Das and Sengupta (1996) [9] advocates the
application of human factor engineering in designing of work system that reported to bring an
effective balance between kind of task and worker.
According to Gani and Ahmad (1995) [10], the quality of work-life concept is the value of
treating the worker as a human being and emphasizing changes in the socio-technical system of
thorough improvement. Milkovich and Boudreau (1994) [11] defined absenteeism as the
frequency and/ or duration of work time lost when employees do not come to work. Kavoussi et
al. (1978) [12] compared the unauthorized absenteeism rates in two large textile factories at
Isfahan in Iran. The working conditions of the factory were unsatisfactory, unlike the control
factory. Kanten and Sadullah (2012) [13] investigated the significant relationship between the
dimension of QWL and work engagement. Rice et al. (1985) [14] emphasized the relationship
between work satisfaction and the quality of people’s lives. Tabassum et al. (2011) [15] studied
reveals that a significant difference exists between male and female employees QWL and in the
following factors of QWL; adequate and fair compensation, flexible work schedule, and job
assignment, attention to job design, and employee relations.
Needless to say, the handicraft work requires high manual labor and effort. Further, it has been
reported in several studies that un-ergonomically designed workplace causes physical (like
backaches, hearing problem, breathing problem, joint pain, etc.) and emotional stress, lower
productivity, and poor QWL among workers (Choobineh et al., 2007; Nurmianto, 2008;
Purnawati, 2007; Singh et al., 2019) [16-20].
According to Mustafa et al. (2009) [21], incorporation of ergonomics in designing tools would
provide many effects on work satisfaction, health, security, work efficiency, and as a result, it
would improve QWL. Based on literature it would not be wrong to say that, the use of Socio-
economic factors will support as a key bone for QWL in the betterment of workers in industries.
This research aimed to evaluate the QWL for the weavers in the carpet manufacturing sector of
Rajasthan. In achieving these objectives, the study hypothesizes that the level of dissatisfaction is
associated with weekly workload among the weavers. Also, we evaluated the association of
dissatisfaction with higher age and experience in the same profession.
2. Research methodology
The present research methodology adopted the surveying of the sample population by
questionnaire. According to survey responses, statistical inferences were made considering
various parameters. The subjects were interviewed for personal characteristics that include
general information and socio-economic conditions, viz. age, gender, marital status,
qualification, salary, experience, health habits, etc. Self-enumeration was difficult, therefore,
interview assistance was provided.
Page | 4
2.1. Participants
The study was conducted within the rural area of Jaipur and its nearby districts. 120 weavers
(89 female and 31 male) were randomly selected from 20 workshops for the survey. The weavers
sit next to each other and wove the carpet as per the provided map using hand tools. The hand
tools include a weaving knife, weaving comb, and a beater. Long hours of the same squat posture
could cause discomfort in different body regions.
2.2. Questionnaire Study
In most grass-root studies, the survey research method is widely used for empirical research
and considered the most appropriate method/ direct measurement (Malhotra and Grover, 1998)
[22]. The researchers have used the primary data that was collected using a structured
questionnaire.
2.3. Statistical Analysis
Chi-square test was adopted to examine the nature of the association between gender and job
satisfaction. It was also used to test the significant association between the level of
dissatisfaction and weekly workload. All of these data were analyzed using the IBM Statistical
Package for Social Science (SPSS) for Windows version 22.0 (IBM SPSS Statistics for Windows
Version 22, Armonk, NY: IBM Corp).
3. Result and data analysis
3.1. Measuring the quality of work life among carpet weavers
The study population comprised 120 weavers (89 female, 31 male). To measure the quality of
work life among weavers, the study subjects according to personal characteristics were
considered and analyzed.
3.1.1. Respondents by personal characteristics
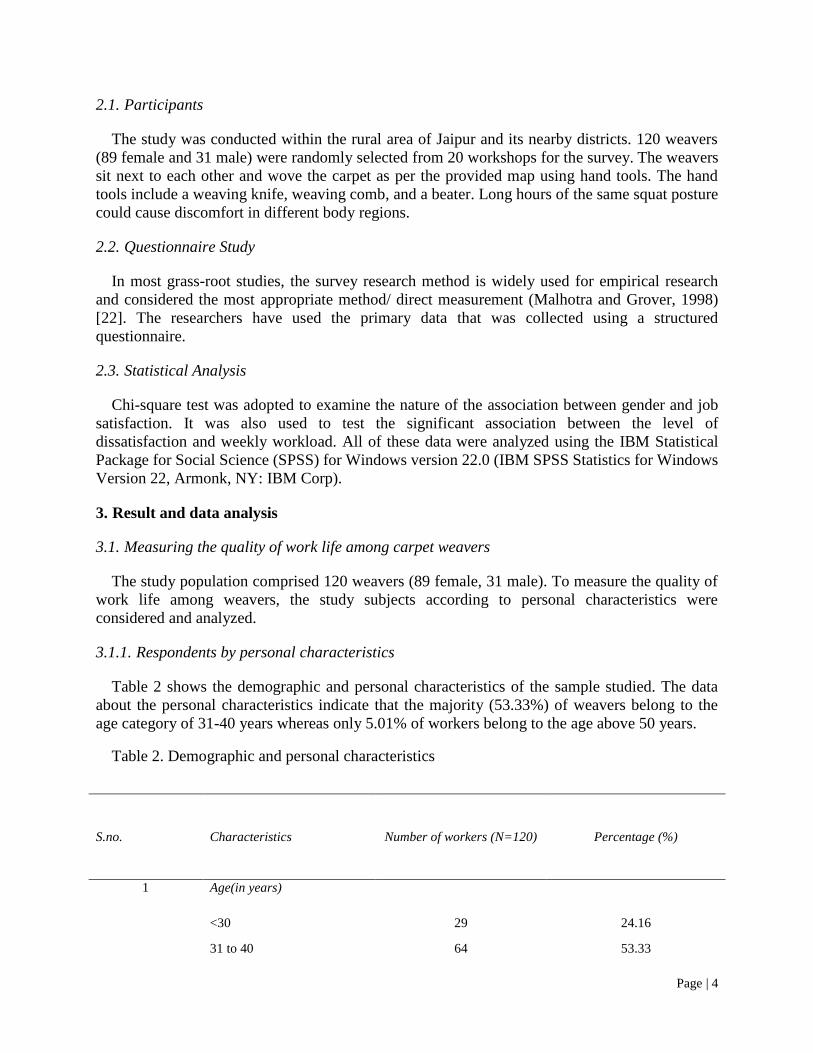
Table 2 shows the demographic and personal characteristics of the sample studied. The data
about the personal characteristics indicate that the majority (53.33%) of weavers belong to the
age category of 31-40 years whereas only 5.01% of workers belong to the age above 50 years. Table 2. Demographic and personal characteristics
S.no. Characteristics Number of workers (N=120) Percentage (%)
1 Age(in years)
<30 29 24.16
31 to 40 64 53.33

Page | 5
3.2. Chi-square analysis
The Chi-square test is the parametric approach used to test the association between different
variables. Before performing the analysis, the data were tested for normality using PP and QQ
plots. The data was found normal in most of the cases for parametric approximation.
3.2.1. Significant relationship between gender and job satisfaction
The chi-square was used to test the significant relationship between gender and job
satisfaction among the weavers. Table 3 depicts the relationship between gender and job
satisfaction among the weavers. The result from the analysis indicates that for a non-significant
chi-square value of 5.18 at 95% level of confidence. Therefore, it can be interpreted that there is
no association between gender and job satisfaction
41 to 50 21 17.50
>50 6 5.01
2 Gender
Male 31 25.83
Female 89 74.17
3 Marital status
Married 103 85.83
Unmarried 17 14.17
4 Qualifications
Upto 10th
std. 112 93.34
12th
std. 7 5.83
College dropout 1 0.83
5 Monthly income
Less than Rs. 5000 98 81.67
Rs. 5000 to Rs. 8000 18 15.00
More than Rs. 8000 4 3.33
6 Work experience
<5 years 21 17.50
5-10 Years 68 56.67
>10 Years 31 25.83
7 Smoking habit
Smoker 15 12.50
Non smoker 105 87.50

Page | 6
Table 3. Association between gender and job satisfaction
Job
satisfaction
Gender
Strongly
satisfied (SS)
Satisfied
(S)
Neither satisfied nor
dissatisfied (NSND)
Dissatisfied
(D)
Strongly
dissatisfied (SD)
Total
Female 2 9 13 25 40 89
Male 0 8 5 8 10 31
Total 2 17 18 33 50 120
Chi -square value
5.18
3.2.2. Significant relationship between weekly workload and job dissatisfaction
Table 4 represents the significant association between weekly workload and level of
dissatisfaction regarding the working environment. It is evident that there is a significant
association between weekly workload and level of dissatisfaction regarding the working
environment. So, the weekly workload does influence the level of dissatisfaction regarding the
working environment.
Work Load/week (Hours)
Level of Dissatisfaction
χ2 P
Somewhat Satisfied 1-3
Dissatisfied 4-7
Highly Dissatisfied 8-10
Less than 30 18 3 8
21.127 0.000*
*
31 to 40 15 21 28
41 to 50 4 8 9
More than 50 0 1 5
The average experience of participants complaining of feeling high dissatisfaction with work
environment was higher (14.43 years) as compared to participants feeling moderate or low dissatisfaction (Figure 3). 61% of the participants were highly dissatisfied with working environment; 18% participants were somewhat satisfied with the working environment. The higher dissatisfaction towards the working environment was seen among the worker with higher experience. The overall perceived rating for dissatisfaction with the work environment among the weavers was 7.1. Un-ergonomically designed workstation is the major cause of many musculoskeletal disorders that are responsible for unnecessary stress and fatigue. So improved working conditions will help to reduce MSDs and better efficiency in work performance.

Page | 7
Figure 3. Level of dissatisfaction with working environment w.r.t average experience.
The results of this study were intended to assist other researchers in identifying key workplace
issues faced by the weavers, in order to develop strategies to address and improve the QWL
conditions for the weavers within each of the carpet manufacturing organizations. The sense of
dissatisfaction was seen regarding the earnings since there is not much difference in the other job
requiring less physical effort and fatigue. This could be due to the difference in the level of
education since 93.34% weavers were less than secondary.
From the analysis, it was seen that for this particular nature of the job, a properly designed
workstation and suitable working conditions are required to improve the QWL of female
weavers. It was also observed during the site visits and surveys, that the working environment is
extremely poor in weaving workshops with-in the villages due to improper workstation design
and lack of adequate infrastructure. Ergonomic intervention and redesign of workstations may
reduce the MSDs and certainly help in improving working environment which in turn improve
the QWL for weavers (Singh et al., 2018b) [23].
4. Conclusion
Carpet sector is part of the handicraft industry and a significant part of the Rajasthan rural
population is dependent on carpet weaving for livelihood. The carpet weaving sector being
unorganized sector suffers from the constraints of illiteracy, absence of proper incentives, poor
exposure to new technologies and absence of market intelligence. In this study, QWL was
studied using questionnaire survey methodology, and factors responsible for QWL were found
out and analyzed in carpet weaving sector.
Overall, it can be concluded that the female weavers are significantly influenced by the use of
improperly designed hand tools. The improvement in QWL should be focused by working
primarily in three major phases, viz. occupational health care, new technological interventions,
and improvement in the existing workstation, working hours (adequate break in the workday).
Female workers having the burden of family and household should be uplift by installing
weaving looms at their homes.
Acknowledgements
The authors express their deepest gratitude and acknowledge the cooperation extended by the all the weavers.

Page | 8
References
1. Afshari, D., Motamedzade, M., Salehi, R., & Soltanian, A. R. (2014). Continuous assessment of back and upper
arm postures by long-term inclinometry in carpet weavers. Applied ergonomics, 45(2), 278-284.
2. Chaman, R., Aliyari, R., Sadeghian, F., Shoaa, J. V., Masoudi, M., Zahedi, S., & Bakhshi, M. A. (2015).
Psychosocial factors and musculoskeletal pain among rural hand-woven carpet weavers in Iran. Safety and health at
work, 6(2), 120-127.
3. Choobineh, A., Shahnavaz, H., & Lahmi, M. (2004). Major health risk factors in Iranian hand-woven carpet
industry. International journal of occupational safety and ergonomics, 10(1), 65-78.
4. Singh, A. K., Meena, M. L., Chaudhary, H., & Dangayach, G. S. (2018a). Ergonomic evaluation of cumulative
trauma disorders among female carpet weavers in India: guidelines to an effective sustainability in work system
design. International Journal of Human Factors and Ergonomics, 5(2), 129-150.
5. Export Promotion Council for Handicrafts (EPCH) (2016a) Country Wise Export’s Share of Handicrafts during
2015–2016, New Delhi [online] http://www.epch.in/more Details.htm(accessed 10 September 2016).
6. Export Promotion Council for Handicrafts (EPCH) (2016b) Review Exports during 2015–2016, New Delhi
[online] http://www.epch.in/policies/exportdata.pdf (accessed 10 September 2016).
7. Export Promotion Council for Handicrafts (EPCH) (2016c) Export Import Data Bank during 2015–2016, New
Delhi [online] http://www.commerce.nic.in/eidb/ecom.asp (accessed 12 September 2016).
8. Rose, R. C., Beh, L., Uli, J., & Idris, K. (2006). Quality of work life: Implications of career dimensions. Journal
of Social Sciences, 2(2), 61-67.
9. Das, B., & Sengupta, A. K. (1996). Industrial workstation design: a systematic ergonomics approach. Applied
ergonomics, 27(3), 157-163.
10. Gani, A., & Ahmad, R. (1995). Correlates of quality of work life: An analytical study. Indian Journal of
Industrial Relations, 31(1), 1-17.
11. Milkovich, G.T. & Boudreau, J.W. (1994) Human Resource Management, 7th ed., Richard D. Irwin, USA.
12. Kavoussi, N., Miller, H. J., & REZYANI, A. (1978). The effects of unsatisfactory working conditions on the
epidemiology of unauthorised absenteeism in an old textile factory in Isfahan, Iran. Journal of human
ergology, 7(1), 81-87.
13. Kanten, S., & Sadullah, O. (2012). An empirical research on relationship quality of work life and work
engagement. Procedia-Social and Behavioral Sciences, 62, 360-366.
14. Rice, R. W., McFarlin, D. B., Hunt, R. G., & Near, J. P. (1985). Organizational work and the perceived quality
of life: Toward a conceptual model. Academy of Management review, 10(2), 296-310.
15. Tabassum, A., RAhMAN, T., & Jahan, K. U. R. S. I. A. (2011). Quality of work life among male and female
employees of private commercial banks in Bangladesh. International Journal of Economics and Management, 5(1),
266-282.
16. Choobineh, A., Hosseini, M., Lahmi, M., Jazani, R. K., & Shahnavaz, H. (2007). Musculoskeletal problems in
Iranian hand-woven carpet industry: Guidelines for workstation design. Applied ergonomics, 38(5), 617-624.

Page | 9
17. Nurmianto, E. (2008) ‘Ergonomic intervention in handicraft producing operation’, 9th Asia Pasific Industrial
Engineering and Management System, 3–5 December, Bali, Indonesia.
18. Purnawati, S. (2007). Occupational health and safety-ergonomics improvement as a corporate responsibility of a
Bali handicraft company: a case study. Journal of human ergology, 36(2), 75-80.
19. Singh, A. K., Meena, M. L., Chaudhary, H., & Karmakar, S. (2020). Assessment of transmissibility of hand-arm
vibration, noise exposure, and shift in hearing threshold among handicraft operatives’: a cross-sectional
study. Journal of Industrial and Production Engineering, 1-14.
20. Garg, S., Kumar, G., Singh, R., Dangayach, G.S., & Rao, P.N. (2018). A life-cycle assessment of household
semi-automatic washing machine in India. International Journal of Manufacturing Technology and Research, 80-
105.
21. Mustafa, S. A., Kamaruddin, S., Othman, Z., & Mokhtar, M. (2009). The effect of ergonomics applications in
work system on mental health of visual display terminal workers. European Journal of Scientific Research, 31(3),
341-354.
22. Malhotra, M. K., & Grover, V. (1998). An assessment of survey research in POM: from constructs to
theory. Journal of operations management, 16(4), 407-425.
23. Singh, A. K., Meena, M. L., & Chaudhary, H. (2018b). Measuring static muscular strength among female
operatives: a cross-sectional comparison in different handicraft occupations. International Journal of Occupational
Safety and Ergonomics, 1-12.

Manufacturing Technology and Research (An International Journal)| Volume 12 | Issue 1-2 | Month Jan-Dec (2019) ISSN: 0973-0281
Page | 10
Experimental Investigation of Turning of AISI 304 Stainless Steel using Green
Fluids
Gaurav Gaurava*
, Mohit Dubey a, Govind Sharan Dangayach
a, Sundeep Kumar
b, Sumit Gupta
c
aDepartment of Mechanical Engineering, Malaviya National Institute of Technology Jaipur, Jaipur, 302017, India
bDirector, Centre for Electronic Governance, Technical Education Department, Government of Rajasthan,302017, India
CAmity School of Engineering and Technology, Amity University Noida, Noida, 201313, UP, India
Abstract
In order to increase the efficiency of any machining process, knowledge of the correct cutting fluid in the
machining of different work piece materials is essential. The purpose of this study is to investigate the effect of
green fluid i.e vegetable oil on surface roughness (Ra) and chip thickness during turning of AISI 304 Stainless
Steel with carbide tool. The performance of vegetable oil (canola oil and sunflower oil) compared with semi-
synthetic (chemoleum oil) at different combination of machining parameters i.e cutting speed (RPM), feed
(mm/rev) and depth of cut (mm) using L9 Taguchi design. The results show that canola oil is better than the
other two cutting fluids in reducing chip thickness and improving surface finish. According to the signal-to-
noise (S/N) ratio analysis, the best combinations of parameters (cutting speed, feed and depth of cut) for the
best surface roughness and maximum chip thickness are 1500, 1, 0.1; 1000, 0.05 and 1.25 respectively.
Key words: Turning; AISI 304 Stainless Steel; Vegetable oil (canola oil and sunflower oil); machining; Green
fluids; Carbide tool; Taguchi Method.
1. Introduction
Lubricants are used to lubricate the machine parts in all sector of the industry. A survey
shows that approximately 38 million tons of lubricants were used globally in 2005, and grew
by 1.2% in the next decade (Kline & Company, 2006). Nearly 85% of lubricant being used
are petroleum based. In today's industry there is sudden demand of environmental friendly,
bio-degradable, non-toxic and cheaper fluid is increasing. This is due to harmful effect of
cutting oil on environment and workers’ health. Owing to these environmental degradations
some countries made strict regulations on use of mineral oil based cutting fluids as coolant.
Those countries are Japan, Hungary, Canada, United States of America, European Union and
Austria (Bartz, 2006).
Corresponding author E-mail address: [email protected]

Manufacturing Technology and Research (An International Journal)| Volume 12 | Issue 1-2 | Month Jan-Dec (2019) ISSN: 0973-0281
Page | 11
1.2 Cutting fluids
Cutting fluids have been used in machining processes to improve the performance of
machining system. Interestingly, Taylor first reported the use of coolants in machining in
1907. When using high-speed steel tools to process steel with water as a coolant, cutting
speeds increased by 40%. (Taylor, 1907). Cutting fluid provides lubrication between the
workpiece and the tool, and also eliminates heat produce during machining (De Chiffre and
Belluco, 2000). The use of conventional petroleum-based cutting fluids is potentially
dangerous. The impact of a particular cutting fluid on humans, the work environment, work
pieces and machine tools, and the overall life environment in general is expressed in terms of
its ecological parameters. Machine operators are affected by contact with various substances
in the cutting fluid. (Mijanovic and Sokovic, 2001).
1.3 Vegetable-based cutting fluids
Traditionally, mineral oil-based cutting fluids have traditionally been used in production
plants due to their chemical stability and frequent reuse. However, the current trend of new
cutting fluids based on vegetable oils and esters in machining obviously has higher
biodegradability and lower environmental impact, which is reasonable. Ionic and non-ionic
surfactants are used to prepare vegetable oil emulsions for use as metalworking fluids.
Vegetable oils and fats have been used for many years and retain their importance as
metalworking lubricants. Most concerned are vegetable oil-based emulsions, which are rarely
used as references for metalworking fluids. The use of vegetable oils in metalworking
applications can alleviate problems faced by workers, such as skin cancer and inhalation of
toxic mists in the work environment. A plant-based emulsion was developed by (John,
Bhattacharya and Raynor, 2004) that can be used in the metalworking industry to partially or
completely replace commonly used petroleum-based emulsions. Vegetable oil has good
lubricity and has been used to formulate metal cutting emulsions (Herdan, 1999). (Belluco
and De Chiffre, 2002) made an investigation on the effect The effect of new vegetable oil
formulations on reaming and tapping operations using AISI 316L stainless steel on surface
integrity and part accuracy was investigated. The cutting fluid was found to have a significant
impact on surface integrity and the thickness of the subsurface strain hardened layer, as well
as the accuracy of the part. Vegetable oil-based cutting fluids show better performance than
mineral oils. By measuring tool life, tool wear, cutting forces and chip formation, the

Manufacturing Technology and Research (An International Journal)| Volume 12 | Issue 1-2 | Month Jan-Dec (2019) ISSN: 0973-0281
Page | 12
efficiency of six cutting oils was evaluated in AISI 316L austenitic stainless steel drilled
holes using conventional HSS-Co tools. In terms of extending tool life and reducing thrust,
all vegetable-based oils produce better results than commercially available mineral oils.
Many problems can be found with cutting fluids, such as health and environmental issues.
There is an urgent need to develop new environmentally friendly cutting fluids, such as
vegetable-based cutting fluids, to reduce these harmful effects. In this study, performances of
two vegetable cutting fluid (sunflower and canola oils) is compared with commercial
available Semi- synthetic oil (Chemoleum oil Grade-50) during the Turning of AISI 304
Stainless Steel. The purpose of this study is to investigate the effect of green fluid i.e
vegetable oil in terms of surface roughness (Ra) and Chip Morphology during turning of AISI
304L. S/N ratio and Comparative analysis of different cutting fluid conditions was performed
to obtain important parameters affecting the surface roughness and chip thickness ratio
(CTR).
2. Materials and methodology
For the experimental work, AISI 304 austenitic stainless steel work piece of diameter 45 mm
and length 111 mm was used, and turning operation was performed under different
metalworking fluids. The turning operations were performed under two different cutting
environment of oil i.e. Semi- synthetic oil (Chemoleum oil Grade-50) and vegetable oil
(Sunflower oil and canola oil). Properties of cutting fluids used are listed in table 1.
Table:1 Properties of cutting fluids used
Parameter Canola oil
(Vegetable oil)
Sunflower oil
(Vegetable oil)
Chemoleum oil
(Mineral oil)
Relative Density(gm/cm³,20ºC/water at
20ºC)
0.914 0.918 0.8130
Viscosity (kinematic at20ºC,mm²/sec) 78.2 49.14 45.13
Cold Test(15 Hrs at 4 ºC) Passed Passed Passed
Flash Point,Open Cup (ºC) 275 227 170
Specific Heat (J/g at 20 ºC ) 1.91 1.67 1.40
Thermal Conductivity (W/mK) 0.188 0.167 0.170
Turning experiments are performed with TiN coated carbide insert and MTJNL2525M16 tool
holder are used to accommodate the cutting insert. In this study, turning operations are

Manufacturing Technology and Research (An International Journal)| Volume 12 | Issue 1-2 | Month Jan-Dec (2019) ISSN: 0973-0281
Page | 13
performed on MaxTurn Plus+ CNC lathe and specification of this lathe machine is listed in
table 2.
Table: 2 Specifications of MaxTurn Plus+ CNC lathe
Parameters Value
Chuck size 165 mm
Distance Between Centers 380 mm
Maximum Turning Length 360 mm
Maximum Turning Diameter 235 mm
Swing over Bed 410 mm
Number of Axes 2
Spindle Motor Capacity 5.5 Kw
Taylor Hobson surface tester was used for quantifying surface roughness (Ra) of the
machined surface. The average value of Ra is measured at four different locations to
minimize the deviation. Specification of Taylor Hobson Profilometer is listed in table 3.
Table: 3 Specifications of Taylor Hobson Profilometer
Manufacturer Taylor Hobson Ltd
Working Temperature 20 ± 2
Least Count 5 nm
Stylus radius 5 µm
Spindle speed, feed speed and cutting depth are considered turning parameters. The range of
turning parameters is selected based on the recommendations of the tool manufacturer. The
machining factors and their levels are shown in table 4. Taguchi arranges experimental plans
for three cutting parameters (spindle speed, cutting depth, feed rate), three levels (33) and one
parameter (cutting fluid type). Method (L9 orthogonal array, table 5). Minitab 16 trial version
is used for Design of Experiments (DOE). Using the Taguchi method to reduce a large
number of experiments is important for reliable design in experimental research. In the
optimization process, there are three characteristics of signal-to-noise ratio; the lower the
better, the higher the better, and nominally the better. In this study, in order to obtain the best
conditions, the surface roughness and chip thickness ratio (CTR) were studied, and lower- the
better quality characteristic (S/N ratio) for surface roughness, and Larger- the better quality
characteristic (S/N ratio) for chip thickness ratio (CTR) are selected in the experimental plan.

Manufacturing Technology and Research (An International Journal)| Volume 12 | Issue 1-2 | Month Jan-Dec (2019) ISSN: 0973-0281
Page | 14
Table: 4 Variables in experiments
Parameter Unit Level-1 Level -2 Level-3
Speed RPM 500 1000 1500
Feed Rate mm/rev 0.050 0.100 0.125
Depth of cut mm 0.50 1.00 1.25
Table:5 Matrix of Design of experiment
Experiment No. Cutting speed (RPM) Feed (mm/rev) Depth of Cut (mm)
1 500 0.050 0.50
2 500 0.100 1.00
3 500 0.125 1.25
4 1000 0.050 1.00
5 1000 0.100 1.25
6 1000 0.125 0.50
7 1500 0.050 1.25
8 1500 0.100 0.50
9 1500 0.125 1.00
3. Results and discussion
Surface roughness(Ra), and Chip Morphology were measured for both Canola oil (Vegetable
oil and Sunflower oil (Vegetable oil) and reference commercial Chemoleum oil (Mineral oil)
in the performance experiments during the turning of AISI 304 Stainless material.
3.1 Surface finish
Nine experiments were conducted as per L9 orthogonal array and average surface roughness
(Ra) were measured for all metal working fluids. Table 6 shows the L9 orthogonal array and
Surface roughness (Ra) measurements for both vegetable oils and mineral oil. Effect of
turning parameters (cutting speed, feed rate, depth of cut) on Surface Roughness are shown in
figure 1-3. From the figure 1 it can be seen that the surface roughness is decreases as the
cutting speed increases. In comparison to all three oil, lower surface roughness was obtained
by the use of canola oil as a working fluid under different cutting speed.

Manufacturing Technology and Research (An International Journal)| Volume 12 | Issue 1-2 | Month Jan-Dec (2019) ISSN: 0973-0281
Page | 15
Table: 6 L9 orthogonal array and Surface roughness (Ra) measurements
Sample
No.
Cutting
speed
(RPM)
Feed
(mm/rev)
Depth of
Cut (mm)
Ra (µm) of
Sunflower oil
(Vegetable oil)
Ra (µm) of
Canola oil
(Vegetable oil)
Ra (µm)of
Chemoleum oil
(Mineral oil)
1 500 0.050 0.50 0.87 0.63 1.10
2 500 0.100 1.00 0.77 0.70 1.03
3 500 0.125 1.25 1.00 0.90 1.13
4 1000 0.050 1.00 0.90 0.76 0.93
5 1000 0.100 1.25 1.0 0.73 1.10
6 1000 0.125 0.50 0.93 0.97 0.96
7 1500 0.050 1.25 1.36 1.17 1.40
8 1500 0.100 0.50 0.67 0.43 0.68
9 1500 0.125 1.00 0.63 0.50 0.80
Figure: 1 Effect of cutting speed on surface roughness under different metalworking fluid.
From the figure 2 it can be seen that the surface roughness is first decrease with increase of
cutting speed but on further increment in feed surface roughness increases rapidly. So the
minimum value of surface finish is obtained at feed of 0.1 mm/rev. In comparison to all three
oil, lower surface roughness was obtained by the use of canola oil as a working fluid under
different feed.
Manufacturing Technology and Research (An International Journal)| Volume 12 | Issue 1-2 | Month Jan-Dec (2019) ISSN: 0973-0281
Page | 16
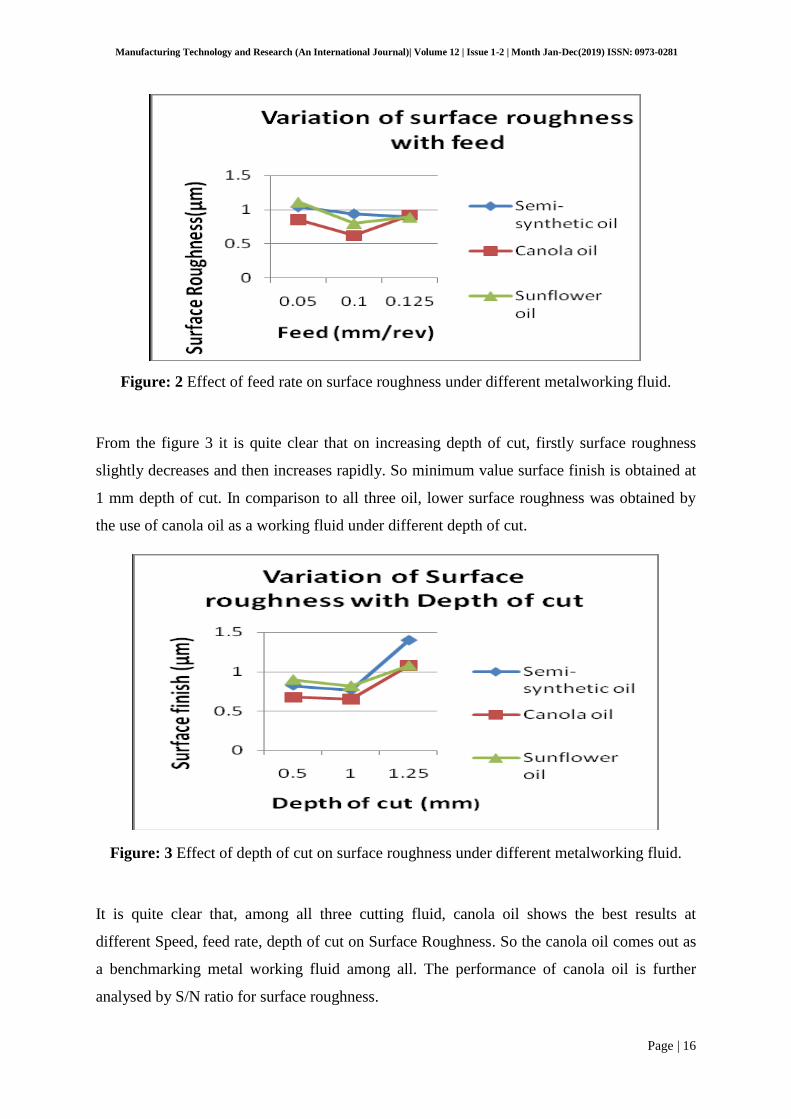
Figure: 2 Effect of feed rate on surface roughness under different metalworking fluid.
From the figure 3 it is quite clear that on increasing depth of cut, firstly surface roughness
slightly decreases and then increases rapidly. So minimum value surface finish is obtained at
1 mm depth of cut. In comparison to all three oil, lower surface roughness was obtained by
the use of canola oil as a working fluid under different depth of cut.
Figure: 3 Effect of depth of cut on surface roughness under different metalworking fluid.
It is quite clear that, among all three cutting fluid, canola oil shows the best results at
different Speed, feed rate, depth of cut on Surface Roughness. So the canola oil comes out as
a benchmarking metal working fluid among all. The performance of canola oil is further
analysed by S/N ratio for surface roughness.
Manufacturing Technology and Research (An International Journal)| Volume 12 | Issue 1-2 | Month Jan-Dec (2019) ISSN: 0973-0281
Page | 17
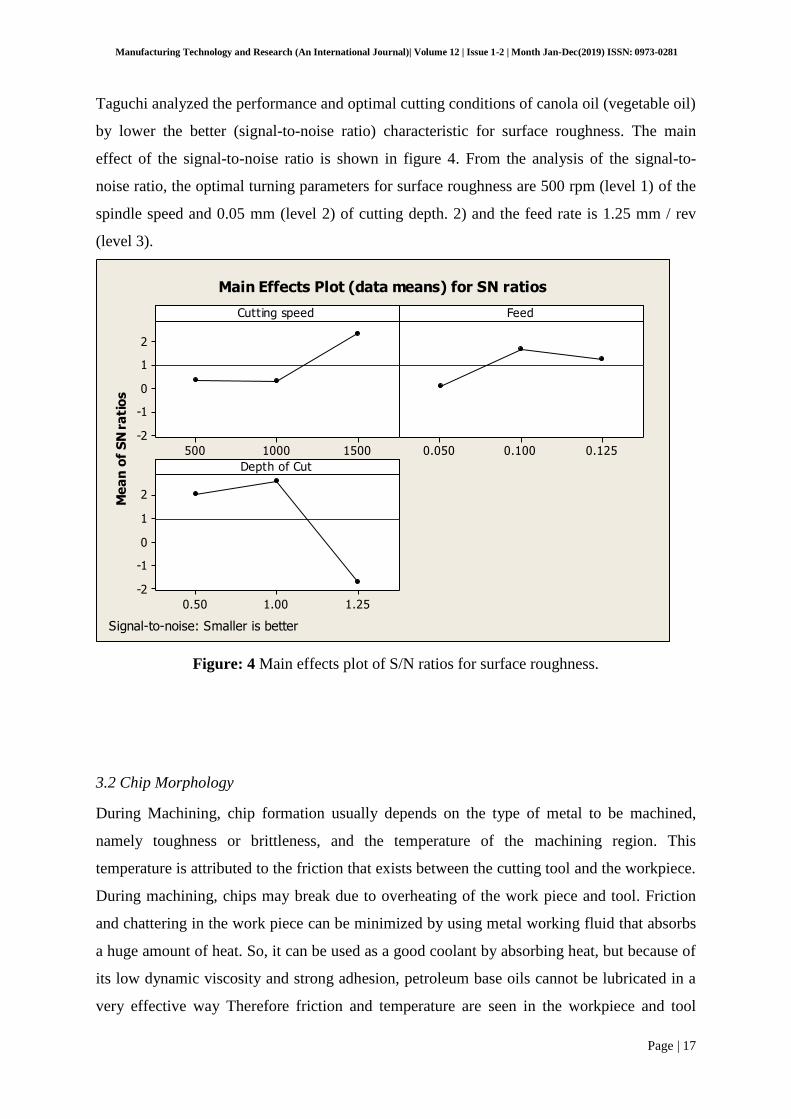
Taguchi analyzed the performance and optimal cutting conditions of canola oil (vegetable oil)
by lower the better (signal-to-noise ratio) characteristic for surface roughness. The main
effect of the signal-to-noise ratio is shown in figure 4. From the analysis of the signal-to-
noise ratio, the optimal turning parameters for surface roughness are 500 rpm (level 1) of the
spindle speed and 0.05 mm (level 2) of cutting depth. 2) and the feed rate is 1.25 mm / rev
(level 3).
Me
an
of
SN
ra
tio
s
15001000500
2
1
0
-1
-2
0.1250.1000.050
1.251.000.50
2
1
0
-1
-2
Cutting speed Feed
Depth of Cut
Main Effects Plot (data means) for SN ratios
Signal-to-noise: Smaller is better
Figure: 4 Main effects plot of S/N ratios for surface roughness.
3.2 Chip Morphology
During Machining, chip formation usually depends on the type of metal to be machined,
namely toughness or brittleness, and the temperature of the machining region. This
temperature is attributed to the friction that exists between the cutting tool and the workpiece.
During machining, chips may break due to overheating of the work piece and tool. Friction
and chattering in the work piece can be minimized by using metal working fluid that absorbs
a huge amount of heat. So, it can be used as a good coolant by absorbing heat, but because of
its low dynamic viscosity and strong adhesion, petroleum base oils cannot be lubricated in a
very effective way Therefore friction and temperature are seen in the workpiece and tool

Manufacturing Technology and Research (An International Journal)| Volume 12 | Issue 1-2 | Month Jan-Dec (2019) ISSN: 0973-0281
Page | 18
during machining. The different chip at various condition using Semi-synthetic and vegetable
oil (Canola and sunflower) oil are shown with their Chip thickness (CT).
The reliability of the lubricant can be determined by measuring the chip thickness ratio,
which is defined as the ratio of the cutting depth to the chip thickness. In previous study
(Childs, 2000), it was observed that chip thickness is greatly affected by lubrication. In dry
conditions, the chips formed are thicker, but the addition of a lubricant will make the chips
thin and curl. That is, the addition of a lubricant causes a reduction in friction between the
chips and the tool. The increase in chip thickness ratio is usually related to the reduction of
cutting force, cutting temperature and power consumption. This can be understand by
following relations:
Where, d = Depth of cut (mm), t = Chip thickness
From the above relation we can see that chip thickness ratio is inversely proportional to the
chip thickness, i. e. higher the chip thickness lowers the CTR and vice versa.
Table: 7 L9 orthogonal array and Chip Thickness (CT) and Chip Thickness Ratio (CTR)
measurements
Sample
No.
Cutting
speed
(RPM)
Feed
(mm/rev)
Depth of
Cut (mm)
Sunflower oil
(Vegetable oil)
Canola oil
(Vegetable oil)
Chemoleum oil
(Mineral oil)
CT CTR CT CTR CT CTR
1 500 0.050 0.50 0.78 0.641 0.63 0.793 0.80 0.625
2 500 0.100 1.00 1.55 0.645 1.40 0.714 1.70 0.588
3 500 0.125 1.25 1.70 0.735 1.64 0.762 1.80 0.694
4 1000 0.050 1.00 1.30 0.769 1.10 0.909 1.22 0.819
5 1000 0.100 1.25 1.90 0.657 1.70 0.735 1.95 0.641
6 1000 0.125 0.50 0.70 0.714 0.85 0.588 1.00 0.500
7 1500 0.050 1.25 1.65 0.757 1.50 0.833 1.60 0.781
8 1500 0.100 0.50 1.20 0.416 0.95 0.526 1.19 0.420
9 1500 0.125 1.00 1.95 0.513 1.80 0.555 2.10 0.476
Nine tests were conducted according to L9 orthogonal array and CT and CTR were measured
for all metal working fluids. Table:7 shows the L9 orthogonal array and CT and CTR
Manufacturing Technology and Research (An International Journal)| Volume 12 | Issue 1-2 | Month Jan-Dec (2019) ISSN: 0973-0281
Page | 19
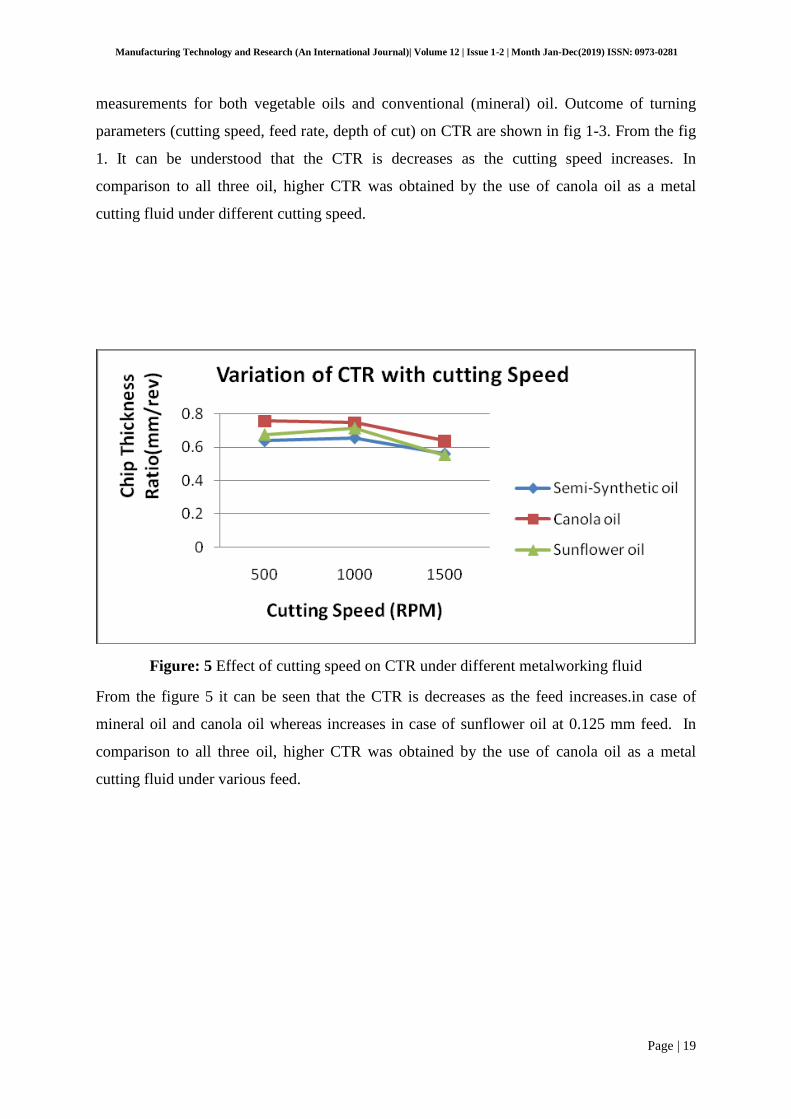
measurements for both vegetable oils and conventional (mineral) oil. Outcome of turning
parameters (cutting speed, feed rate, depth of cut) on CTR are shown in fig 1-3. From the fig
1. It can be understood that the CTR is decreases as the cutting speed increases. In
comparison to all three oil, higher CTR was obtained by the use of canola oil as a metal
cutting fluid under different cutting speed.
Figure: 5 Effect of cutting speed on CTR under different metalworking fluid
From the figure 5 it can be seen that the CTR is decreases as the feed increases.in case of
mineral oil and canola oil whereas increases in case of sunflower oil at 0.125 mm feed. In
comparison to all three oil, higher CTR was obtained by the use of canola oil as a metal
cutting fluid under various feed.

Manufacturing Technology and Research (An International Journal)| Volume 12 | Issue 1-2 | Month Jan-Dec (2019) ISSN: 0973-0281
Page | 20
Figure: 6 Effect of feed on CTR under different metalworking fluid
From the figure 6 it is quite clear that on increasing depth of cut, CTR deceases in all case. In
comparison to all three oil, Higher CTR was obtained by the use of canola oil as a metal
cutting fluid under various depth of cut.
Figure: 7 Effect of depth of cut on CTR under different metalworking fluid
It is quite clear that, among all three cutting fluid, canola oil shows the best results at
different Speed, feed rate, depth of cut on CTR. So the canola oil comes out as a
benchmarking metal working fluid among all. The performance of canola oil in term of
surface roughness is further analysed by S/N ratio analysis.
Manufacturing Technology and Research (An International Journal)| Volume 12 | Issue 1-2 | Month Jan-Dec (2019) ISSN: 0973-0281
Page | 21
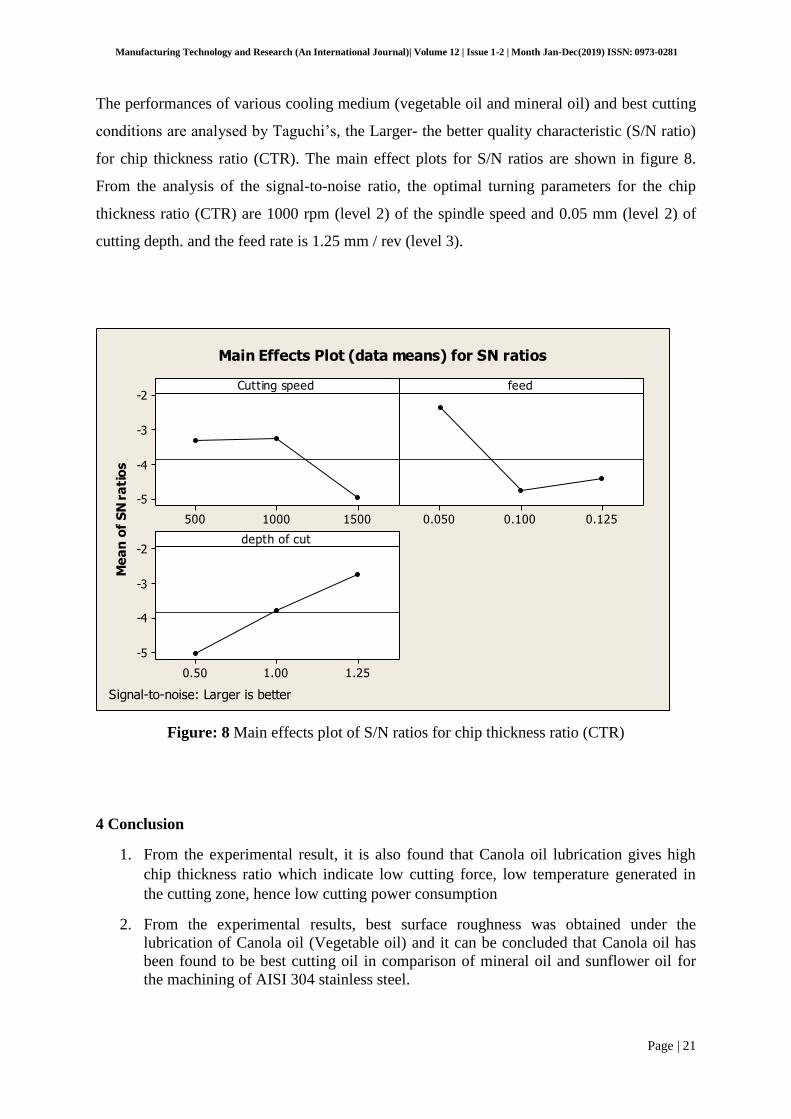
The performances of various cooling medium (vegetable oil and mineral oil) and best cutting
conditions are analysed by Taguchi’s, the Larger- the better quality characteristic (S/N ratio)
for chip thickness ratio (CTR). The main effect plots for S/N ratios are shown in figure 8.
From the analysis of the signal-to-noise ratio, the optimal turning parameters for the chip
thickness ratio (CTR) are 1000 rpm (level 2) of the spindle speed and 0.05 mm (level 2) of
cutting depth. and the feed rate is 1.25 mm / rev (level 3).
Me
an
of
SN
ra
tio
s
15001000500
-2
-3
-4
-5
0.1250.1000.050
1.251.000.50
-2
-3
-4
-5
Cutting speed feed
depth of cut
Main Effects Plot (data means) for SN ratios
Signal-to-noise: Larger is better
Figure: 8 Main effects plot of S/N ratios for chip thickness ratio (CTR)
4 Conclusion
1. From the experimental result, it is also found that Canola oil lubrication gives high
chip thickness ratio which indicate low cutting force, low temperature generated in
the cutting zone, hence low cutting power consumption
2. From the experimental results, best surface roughness was obtained under the
lubrication of Canola oil (Vegetable oil) and it can be concluded that Canola oil has
been found to be best cutting oil in comparison of mineral oil and sunflower oil for
the machining of AISI 304 stainless steel.

Manufacturing Technology and Research (An International Journal)| Volume 12 | Issue 1-2 | Month Jan-Dec (2019) ISSN: 0973-0281
Page | 22
3. This experimental research clearly shows that mineral based cutting oil might be
replaced by vegetable based cutting oil since vegetable based oil reduce occupational
health risks, lower costs towards waste treatment due to their inherently higher
biodegradability and better performance rate.
References
Bartz, W. J. (2006) ‘Ecotribology : Environmentally acceptable tribological practices’, 39,
pp. 728–733. doi: 10.1016/j.triboint.2005.07.002.
Belluco, W. and De hiffre, L. (2002) ‘Surface integrity and part accuracy in reaming and
tapping stainless steel with new vegetable based cutting oils’, Tribology International,
35(12), pp. 865–870. doi: 10.1016/S0301-679X(02)00093-2.
De Chiffre, L. and Belluco, W. (2000) ‘ omparison of methods for cutting fluid performance
testing’, CIRP Annals - Manufacturing Technology, 49(1), pp. 57–60. doi: 10.1016/S0007-
8506(07)62895-9.
Herdan, J. (1999) ‘Rolling fluids based on vegetable oils’, J. Synth. Lubr. Elsevier B.V. doi:
10.1016/j.wear.2014.12.044.
John, J., Bhattacharya, M. and Raynor, P. . (2004) ‘Emulsions containing vegetable oils for
cutting fluid application’, Colloids and Surfaces A: Physicochemical and Engineering
Aspects, 237(1–3), pp. 141–150. doi: 10.1016/j.colsurfa.2003.12.029.
Kline & Company, I. (2006) Competitive intelligence for the global lubricants industry,
2004–2014.
Mijanovic, K. and Sokovic, M. (2001) ‘Ecological aspects of the cutting fuids and its
infuence on quantifiable parameters of the cutting processes’, 109, pp. 181–189.
Taylor, F. (1907) ‘On the art of metal cutting’, Trans. ASME.

Manufacturing Technology and Research (An International Journal)| Volume 12 | Issue 1-2 | Month Jan-Dec (2019) ISSN: 0973-0281
Page | 23
Investigation of Surface Integrity of Cylinder Liner of IC Engine by Honing Process
using RSM Technique B N Tripathi
1, Suman Gothwal
2
1Chhatrapati Shivaji Maharaj University Panvel, Navi Mumbai
2Ajay Kumar Garg Engineering College, Ghaziabad
Abstract
Honing is an important fine finishing operation, often used for internal cylindrical surfaces such as gun barrels,
hydraulic cylinders, bearings and engine cylinder bores (Armergo and Brown, 1969). Excess material is removed by
means of slow moving abrasive sticks pressed against the surface to be machined. Two kinds of motion, namely
rotational and reciprocating are imparted by the honing machine to the hone (or honing tool) carrying the abrasive
sticks. Although honing can be used on flat and external cylindrical surfaces too, it is predominantly used for
finishing internal cylindrical surfaces (holes). Surface roughness of any manufactured components is an important and
valuable performance measure, as far as theoretical and practical applications are concerned. It is widely used as an
index of product quality and is in most cases a technical requirement for mechanical products (Ozcelik and
Bayramouglu, 2005). Surface roughness is an important design consideration as it imparts many part characteristics
such as fatigue strength, assembly tolerances, coefficient of friction, wear rate, corrosion resistance and aesthetics
(Dabnun et al., 2005).There are implications of detailed topographical information scanned from cast iron automotive
cylinder liners.. Worn and unworn surfaces measured both by AFM (Atomic Force Microscopy) and stylus .te
Chauvin P.S. et al (2013) studied the effect of different honing parameters such as honing feed pressures (rough and
finish) and peripheral speed of the honing head, on the quality of surface produced in honing of grey cast iron liners
of engine cylinder bores. cinques were compared visually and quantitatively using an effective relocation technique.
Quantitative comparison was made of 3D and 2D surface parameters, such as root mean square roughness and slope
which are significant for the tribological behaviour of the surfaces. The extra surface features found by the AFM
measurements (e.g. steeper slopes and more peaks and valleys) significantly change the numerical values of the
roughness parameters, and this scale-dependent difference, when compared with conventional stylus-measured
parameters, points to the possibilities of deepening the understanding of cylinder liner lubrication in the light of more
finely detailed measurements( Rosen et al.,1996).
Keywords: Honing Process, Surface roughness, RSM technique
Introduction
The numerical assessment of a surface texture is dependent on three types of characteristic lengths. These
lengths are associated with the profile. Fig. 3.1 shows the different lengths of a sample surface.
Cut-off wavelength: This is the wavelength of a sinusoidal profile of which only a certain percentage of its
amplitude is transmitted by the profile filter. It is the wavelength at which a filter becomes effective. For
surface parameters, we normally analyses wavelengths between an upper and a lower cut-
off: these are referred to as λs (shortest) and λc (longest). “Cut off” is also used synonymously as the
sample length lc. Filter is a process to exclude wavelengths above or below a particular frequency. The
measurement system is a mechanical filter. Software can perform mathematical filtering. Profile filters are
identified by their cut-off wavelength values.
Sampling length: It is the length over which the parameter to be measured will have statistical
significance, without being long enough to include irrelevant details. Generally, it is the longest spatial
wavelength to be included in the profile measurement. Roughness sampling length (lc) is the length within
which the roughness average is measured.
Evaluation length: This is the length of the surface over which measurement is made. This length may
include several sampling lengths. The selected length of the cut-off filter is normally at least 2.5 times the
peak spacing, with two peaks and valleys within each cut-off. This cut-off would usually be 0.8 mm, but
there are occasions when either a larger or a smaller cut-off length might be preferable for the surface
under test. For primary profiles the evaluation length is equal to the sample length.

Manufacturing Technology and Research (An International Journal)| Volume 12 | Issue 1-2 | Month Jan-Dec (2019) ISSN: 0973-0281
Page | 24
Traverse length: It is the total length of the surface traversed by the stylus in making a measurement. It is
normally greater than evaluation length, due to the necessity of allowing run-up and over-travels at each
end of the evaluation length to that any mechanical and electrical transients are excluded from the
measurement.
Surface roughness parameters
One of the most common uses of an engineering surface is to provide a bearing surface for another
component moving past it. Their relative motion results in wear. The concept of bearing ratio, which
simulates the effect of this wear, is widely used. The bearing ratio curve mathematically is the integral of
the amplitude distribution function (ASME, 1996). Surface roughness parameters are based on an
advanced statistical and bearing ratio analysis. Bearing (material ratio or Abbott) curves have been
proposed to give a working representation of the portions of the surface at different depths. They combine
aspects of contact area, contact mechanics and wear (Fig. 3.3). The DIN 4776 (1990) standard for honed
bores used in the German automotive industry and currently standardized as ISO 13565-2 : 1996 provides a
linear approximation of the bearing curve. The depth of profile below 40% bearing area is taken to indicate
the steady state wear status of the engine (ISO 13565-2 : 1996).
(a) Amplitude distribution curve (b) Cumulative distribution curve
Material ratio curve
Linear material ratio curve (Abbott curve)
Material ratio (%)
Pro
file
hei
ght
(µm
)
Pro
file
hei
ght
(µm
)
Mean line

Manufacturing Technology and Research (An International Journal)| Volume 12 | Issue 1-2 | Month Jan-Dec (2019) ISSN: 0973-0281
Page | 25
Sampling length (mm) → Material ratio (%) →
Hybrid parameters
The standard ISO 13565-2 specifies five parameters namely the reduced peak height Rpk, the reduced
valley depth Rvk, the core roughness depth Rk, and material ratio determined by the straight line separating
the core roughness from the material side Mr1, and that free from material sideMr2(Fig. 3.4). This new
standard suggests the use of Rk, Rpk, Rvk, Mr1 and Mr2 to replace Ra in the manufacturing of critical
components like, cylinder bores, and connecting rods of an internal combustion engine (Jablonski and
Pawls, 2001). In present investigation Raparameter is being used so that the Atomic Force Microscopy can
measure the center line average value at nanometer levels. The following definition of notation is presented
on the basis of ISO 13565-2 (1996).
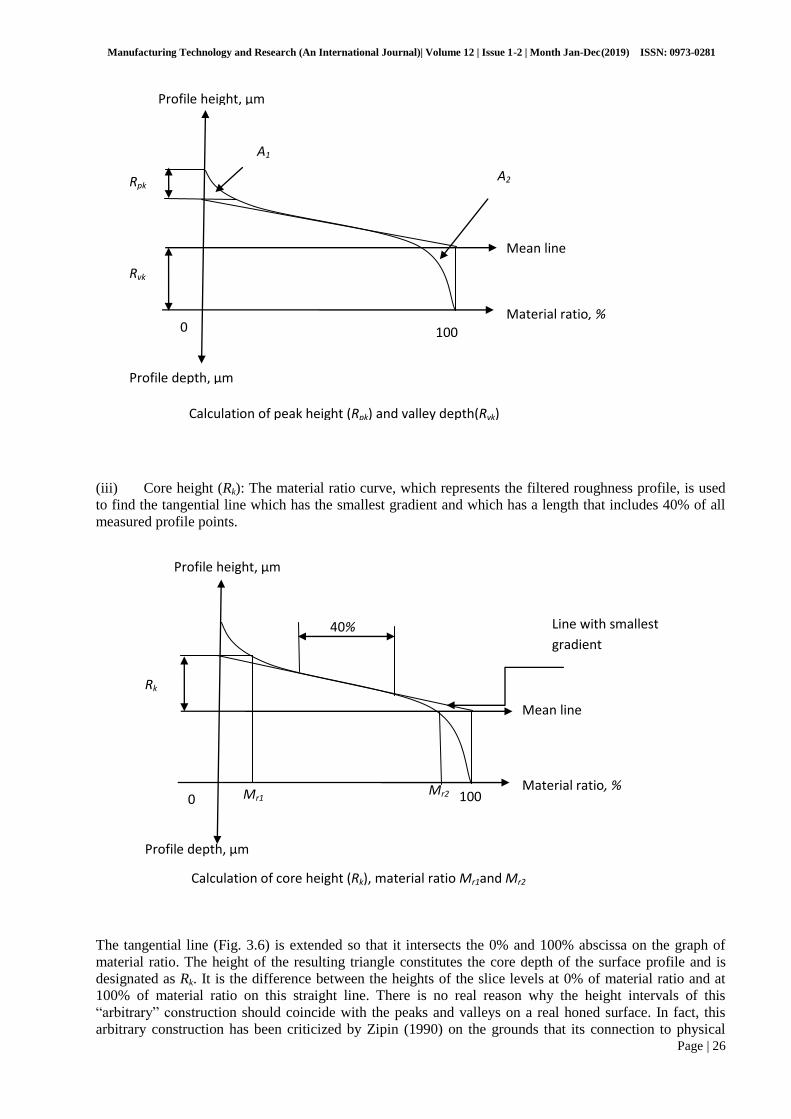
(i) Reduced peak height (Rpk): Normal calculations of material ratio are based on a defined reference
level to avoid the influence of any extreme isolated peaks. These isolated peaks do not, however, affect the
functional properties. Extreme isolated peaks and valleys are eliminated while calculating the peak height
(Rpk) and valley depth (Rvk). The area of the peaks protruding above the core of the profile is represented on
the material ratio curve by the surface A1 (Fig. 3.5). This triangle is converted to a right angle triangle with
the same area and the same length on the base line. The height of the triangle is the reduced peak height
Rpk.Reduced peak height is erased by running in.
(ii) Reduced valley depth (Rvk): The area of the valleys below the core of the profile is represented on
the material ratio curve by the surface A2. This triangle is converted to a right angle triangle with the same
area and the same length on the base line. The height of the triangle is the profile’s reduced valley depth
Rvk. It will retain lubricant in a functioning part.
Pro
file
hei
ght
(µm
)
Manufacturing Technology and Research (An International Journal)| Volume 12 | Issue 1-2 | Month Jan-Dec (2019) ISSN: 0973-0281
Page | 26
(iii) Core height (Rk): The material ratio curve, which represents the filtered roughness profile, is used
to find the tangential line which has the smallest gradient and which has a length that includes 40% of all
measured profile points.
The tangential line (Fig. 3.6) is extended so that it intersects the 0% and 100% abscissa on the graph of
material ratio. The height of the resulting triangle constitutes the core depth of the surface profile and is
designated as Rk. It is the difference between the heights of the slice levels at 0% of material ratio and at
100% of material ratio on this straight line. There is no real reason why the height intervals of this
“arbitrary” construction should coincide with the peaks and valleys on a real honed surface. In fact, this
arbitrary construction has been criticized by Zipin (1990) on the grounds that its connection to physical
Rk
Profile height, µm
Material ratio, % 0 100 Mr1 Mr2
Calculation of core height (Rk), material ratio Mr1and Mr2
Mean line
Profile depth, µm
40% Line with smallest
gradient
A1
A2 Rpk
Rvk
Profile height, µm
Material ratio, % 0 100
Calculation of peak height (Rpk) and valley depth(Rvk)
Mean line
Profile depth, µm

Manufacturing Technology and Research (An International Journal)| Volume 12 | Issue 1-2 | Month Jan-Dec (2019) ISSN: 0973-0281
Page | 27
reality is rather (tenuous). Core roughness height determines the lifetime of the components. In actual
measurement of this surface, the first step is to perform an ordinary triangle filter on the texture profile to
get a first waviness profile. Next, this waviness is used as a truncation line: any primary profile, which
projects below the waviness, is truncated to this waviness value. The truncated primary profile is next
filtered with a second triangle filter. The result is Rk waviness. Subtracting from texture gives the Rk
roughness.
(iv) Material ratio 1 (Mr1): At the points where the tangential line intersects the 0% and 100% abscissa,
two lines are extended parallel with the material ratio axis until they intersect the material ratio curve. The
point of intersection, which determines Mr1, shows the material ratio of the profile at the transition between
peaks and core (Fig.3.6).
(v) Material ratio 2 (Mr2): The point of intersection, which determines Mr2, shows the material ratio of
the profile at the transition between core and valleys.
3.2.2 Surface roughness parameters
Most engineering surfaces have approximately Gaussian height distributions. However, two texture
characteristics are important from functional point of view. They relate to (a) smooth wear resistant and (b)
load bearing plateau with intersecting deep valleys working as oil reservoirs and debris trap (Ogodorov,
2008). Typically, a honed component is machined first by rough honing and then by finish honing. It is
possible to determine several roughness parameters like reduced peak height Rpk, reduced valley depth Rvk,
the core roughness depth Rk, and material ratios determined by the straight line separating the core
roughness from the material side (Mr1) and free from material side (Mr2) (Bohme, 1992).
Surface roughness is quantified by parameters which relate to certain characteristics of the texture. These
parameters can be classified into three groups according to the type of characteristics that they measure.
Amplitude measures the vertical displacements of the profile. Spacing measures the irregularity spacing
along the surface, irrespective of the amplitude of these irregularities. Hybrid parameters measure both
amplitude and spacing of the surface irregularities (Lavoie, 1992). Commonly used roughness parameters
are described below. Ra(in micron/µm)is the most commonly used parameter in surface roughness analysis.
It is also called Centre line average (CLA) or arithmetic average (AA). Mathematically, Ra is the arithmetic
average value of the absolute departure of the profile from the reference line throughout the sampling
length. The Ra value over one sampling length represents the average roughness such that the effect of non-
typical peak or valley is averaged out and does not have a significant influence on the results (Feng and
Wang, 2003). It does not give information regarding the shape of the irregularity. Fig. 3.2 shows a
Traverse length
Evaluation length, L
lc lc lc lc lc lc
Traverse, evaluation and sampling lengths
(All dimensions are in mm)
Sampling length Normal profile
Measured profile
length

Manufacturing Technology and Research (An International Journal)| Volume 12 | Issue 1-2 | Month Jan-Dec (2019) ISSN: 0973-0281
Page | 28
schematic diagram of the profile of a surface over the cut-off length.
When evaluated from digital data, Ra is approximated by the trapezoidal rule:
nyyyR na /).........( 21
iyn
1;
where i varies from 1 to n. (Fig. 3.2)
Ra is calculated from the area between the roughness profile and its mean line, or the integral of the
absolute value of the roughness profile height over the evaluation length.
cl
c
a dxyl
R0
| |1
;
Similar surface profile shapes having different spacing may have different Ra. Similarly, if profiles differ in
shape or spacing, it is hard to distinguish them by this measurement.
Rqis another method of calculating an average roughness value and is known as root mean square (rms). It
is obtained by taking the square of each value of y and taking the square root of the mean of these values. It
is more meaningful than Ra when used in statistical work (Feng et al., 2003).
Mathematically, Rq is given by the following equation.
2
1
21
iq y
nR ; (3.3)
where, i varies from 1 to n.
Sampling length,lc(mm)
Mathematical derivation of Ra andRq
Mean line

Manufacturing Technology and Research (An International Journal)| Volume 12 | Issue 1-2 | Month Jan-Dec (2019) ISSN: 0973-0281
Page | 29
The root sum square (rms) average roughness of a surface may also be calculated from the following
integral of the roughness profile.
` 2
1
0
21
cl
cq dxy
lR ;
There are several other amplitude parameters like Rt, Rz, and others. Spacing parameters measure the
horizontal characteristics of the surface deviations. Spacing parameters used are peak count (Pc), mean
spacing (Rsm) and high spot count (Rhsc) (Taylor Hobson, 2002).
Mechanics of honing process
Honing uses solid abrasives in the form of a set of blocks called hone, which remove the material from the
work piece by a combination of shearing and ploughing action. The movement of hone produces a
characteristic cross hatch lay pattern (Fig.3.7), which is conducive to oil retention. Due to low speed
operation of the hone, the chances of surface damage by heat are minimized (Boothryod and Knight,
1989).
Kinematics of Honing: The hone is subjected to reciprocating and rotating motion. The cutting velocity (Vc)
is the resultant of both reciprocating velocity (Vr) and rotating velocity (Vp) components. Crosshatch angle
2θ, (Fig. 3.7) is dependent on these two velocity components.
Let N be the number of revolutions of hone per second and D be the diameter of hole then, Rotational
velocity = πDN
Let ‘f’ be the frequency of bore and L be the length of stroke,
Average linear velocity i.e. reciprocating velocity (Vr) = 2Lf.
Resultant honing velocity, Vc = 21
22VrVp ; (3.5)
Let θ be the angle between the tangent of the path of grain motion at a given point and the plane
perpendicular to the axis of rotary motion (Fig. 3.7). Cutting angle θ can be obtained by equation (3.6) in
terms of the two velocities.
tan θ = p
r
V
V; (3.6)
Crosshatch formation
In Fig.3.7 arrows on the crosshatch patterns show the directions of two perpendicular motions of the
honing process. The surfaces of varying crosshatch angle are generated which affect the cycle average
coefficient of friction. Friction decreases with decrease in crosshatch angle. The reduction of the
Hone moving
downward
Hone moving
upward 2θ

Manufacturing Technology and Research (An International Journal)| Volume 12 | Issue 1-2 | Month Jan-Dec (2019) ISSN: 0973-0281
Page | 30
crosshatch angle from 90º to 20º leads to 25% reduction in per cycle of coefficient of friction
approximately (Michail and Barber 1995, and Jocsak 2005). Kumar et al. (2006) described a random
base surface roughness profile generated by crosshatch. They defined the surface profile by specifying
the probability distribution of the surface heights and the auto correlation function. Fig. 3.8 is the three
dimensional view of a typical hone tool used for honing an internal cylindrical surface. Honing sticks
are fixed in the hone head which is connected to the spindle that imparts a rotational motion to the
spindle.
Typical honing head (Courtesy of DeGarmo et al., 1997)
Technological Selection of Parameters: Honing process parameters affect surface roughness in many ways.
Some of the more important parameters that affect the honing process include: Rotational speed, speed of
reciprocation, honing pressure, coolant temperature, grit size, honing time etc.
Rotational Velocity (Vp): Rotational velocity is considered as a technological parameter that affects the
surface characteristics and material removal rate. Increase in peripheral speed decreases the surface
roughness if other parameters are kept constant. Excessive speeds contribute to decreased dimensional
accuracy, overheating of the work piece, and glazing of the abrasive. Overheating causes breakdown of the
honing fluid and distortion of the work piece. The choice of optimum surface speed is influenced by the
material being honed, hardness of the material, surface roughness required and number and width of the
stones. Higher speed can be used for metals that shear easily, such as cast iron and some of the softer non-
ferrous metals. Rotational speed varies normally between 20-35 m/min.
Reciprocation speed (Vr): Speed of reciprocation depends largely on the length of the honing tool and the
depth of bore. It is the product of the number of stroke cycles per minute and twice the stroke length.
Combination of reciprocation and rotational speed produces the typical crosshatch angle. When the rotation
and reciprocation speeds are equal, the crosshatch angle is 90º. When rotation speed is greater than speed
of reciprocation, the crosshatch angle is less than 90º. Reciprocation speed is less critical than rotation
speed. Reciprocating speed varies between 12-25 m/min.
Honing fluid pressure: Honing is more often controlled by rate of feed-out than by gauge pressure. In
general, higher feed rates are used for larger diameters, and lower feed rates are used for small diameters.
Excessive pressure causes rougher finish because the abrasive is broken down too fast. Recommended
values for contact pressure of honing tools made of different abrasive materials (Goetz&Burscheid, 1993)
are given in Table 3.1.
Standard values for contact pressure
Slow rotation
Mandrel
Honing shoe
Honing stone
Osc
illat
ion
Spindle

Manufacturing Technology and Research (An International Journal)| Volume 12 | Issue 1-2 | Month Jan-Dec (2019) ISSN: 0973-0281
Page | 31
Abrasive material Rough honing (N/cm2) Finish honing (N/cm
2)
Ceramic honing stones 50-250 20-100
Plastic bonded honing stones 200-400 40-250
Diamond honing edges 300-700 100-300
Boron nitride honing ledges 200-400 100-200
CHOICE OF SPECIMEN
The cylinder liner of an internal combustion engine of Motor bike is subjected to high rate cyclic
loading. High accuracy and tight tolerances of piston in the liner of an automobile are ever more
demanding requirements. Close tolerances and fits to mating components are specified for the
sake of component reliability. The cylinder liner is manufactured by the powder metallurgy,
forging and sometimes even casting. The powder forged (PF) liner is fabricated by consolidating
metal powders into a form, sintering the form and machining to final dimensions. The forged
cylinder liner is fabricated by starting with a wrought steel billet, followed by forging and
machining to the required dimensions. The quality of the bore surface of a components influences
oil consumption, noxious emissions and running performance. Inner surfaces of the cylinder liner
are finished by rough honing followed by finish honing. In the present investigation, the honing
experiments were conducted on cylinder liner used in the 110 cc Honda motorbike cylinder liner.
Three different grades of grey cast iron cylinder liners were used as the work piece for the honing
operation. The chemical compositions of materials of the cylinder liners are given in Table 4.1,
4.2 & 4.3.Work piece materials were normalized and shot blasted. Pearlite and ferrite structures
were more or less uniformly distributed in the materials. The hardness of the materials were
measured as 250 BHN, 230 BHN and 166 BHN respectively for three different grades of grey cast
iron EN-GJL 250, FG 260I and HT 100 respectively. Fig. 4.1 shows the geometric details and
dimensional tolerances of chosen cylinder liners.

Manufacturing Technology and Research (An International Journal)| Volume 12 | Issue 1-2 | Month Jan-Dec (2019) ISSN: 0973-0281
Page | 32
Fig. 4.1: Geometry of cylinder liners (All dimensions are in mm)
Chemical Composition of Gray Cast iron Hardness - 250 BHN
C Mn Cr Ni Mo S P Si
2.80 0.61 0.35 0.04 0.08 0.02 0.02 2.21
SURFACE ROUGHNESS TESTER (AFM)
Atomic Force Microscope(Fig. 4.5) is suitable equipment for measuring surface roughness parameters. It is
only equipment which can measure Ra values very closely; other equipment have are comparatively poor
levels of accuracy or flexibility.
Table 4.7: Specification of AFM
Primary Analysis Filter: Gaussian
Cut offs (lc) None, 0.0025 mm- 0.8 mm
Parameters: Pa, Pq, Pv, Pt, Psk, Pp, Pku, Pz, PLamq,
Roughness Analysis Filter: Gaussian, ISO 2CR, 2CR PC
Cut offs (lc) 0.08 mm – 8.0 mm
Bandwidths: 30:1, 100:1, 300:1
Parameters: Ra, Rq, Rp, Rv, Rt, Rsk, Rku, Rz, Rz, Rz1max, R3y, R3z, RS,
RSm, RLo, Rc, RDela, RLamq,
Rk Analysis Filter: Gaussian
Cut offs (lc) 0.08 mm – 8.0 mm
Bandwidths: 30:1, 100:1, 300:1
Parameters: Rk, Rpk, Rvk, Mr1, Mr2

Manufacturing Technology and Research (An International Journal)| Volume 12 | Issue 1-2 | Month Jan-Dec (2019) ISSN: 0973-0281
Page | 33
Fig. 4.5: Atomic Force Microscope (AFM Laboratories)
Measurements can have an extremely high resolution compared to stylus profilometers or white light
interferometers, often even higher than the scanning electron microscope (SEM). In several studies AFM
measurements of a surface are considered the benchmark. Although the lateral resolution is much higher
than above-mentioned techniques, the range both laterally and vertically is limited (108x108 μm and 6 μm
respectively with the equipment available ). Care must be taken when conducting AFM measurements as
external vibrations can have a severe impact on the measurements, as can improper engagement of the tip
onto the sample.Olsson et al. compared the three techniques, SP, WLI and AFM,by measuring a range of
engineering surfaces, a cylinder liner, steel roller, gear surface and steel sheet. With the AFM
measurements as a benchmark calculation of roughness parameters, including the Ra set, showed a
variation of between 5-20%.
Poon and Bhushan et al.(1995) conducted a similar study. They investigated the Rq, Rp and Peak to Valley
(P-V) parameters and found that the calculated results were ordered as WLI<SP<AFM, while the inverse
was true for the correlation length. Processor control module (PCM) provides an operator interface and
data processing capability for the instrument. All instrument commands, analysis requirements and results
displays are via a touch pad screen. Instructions and data are passed between the processor control module
and a compatible traverse unit via an interconnecting lead or an infrared link. This enables the processor
control module to be used up to a distance of 1.0 m from the traverse unit.
Topographical Representation of Cylinder Liner in Honing:
Fig. shows the CCD images and AFM images of Gray Cast iron(HT100). The AFM images indicate that
the surface morphology of cylinder liner material considerably depends on honing operation. The average
surface roughness (RMS) of experimental material was calculated from AFM images of selected areas of 3
μm×3 μm. The surface morphology of the HT100 material with no honing operation (Fig.4.6 a) was found
to be rough (RMS, 0.20 μm). In the case of honing operation (Fig.4.6 b), HT100 material had a greatly
smooth surface morphology (RMS, 0.07 μm), which was due to the roughness improvement of the material
inner surface. Parallel corresponding Fig shows the curves of surface roughness of cutting tool versus
honing time. The honing curves showed a rapid improvement initially and thereafter the surface roughness
became steady at honing time of 20 s, manifesting a saturation effect.The optimal honing time under given
honing conditions was determined to be approximately 20 s with respect to surface roughness.

Manufacturing Technology and Research (An International Journal)| Volume 12 | Issue 1-2 | Month Jan-Dec (2019) ISSN: 0973-0281
Page | 34
Topography of gray cast iron a) Before honing process b) After honing process
Sl.
Nos.
Grit
Size
(m)
Environmental
Temp. (°C)
Rotational
Speed
(RPM)
Hone
Angle
(Deg.)
Fluid
Pressure
(Bar)
Honing
Time
(Sec.)
Ra
(nm)
Power
(Kw)
Micro
Hardness
(HV1)
1 43 40 600 60 9 60 440 2.3 190
2 68 10 600 20 4 60 575 4.1 188
3 68 10 600 20 9 30 625 4.1 191
4 43 10 1200 60 4 30 366 2.0 195
5 68 10 600 60 4 30 524 3.4 201
6 43 10 600 20 4 30 578 2.2 205
7 43 40 1200 20 4 30 417 2.7 210
8 56 25 900 40 6.5 45 458 3.6 221
9 56 25 900 40 6.5 45 436 3.6 214
10 56 25 900 40 6.5 45 495 3.5 192
11 68 40 600 60 4 60 617 4.4 205
12 68 10 1200 20 4 30 560 3.5 208
13 68 10 1200 60 9 30 509 3.7 231
14 68 10 1200 20 9 60 616 4.3 222
15 43 40 1200 20 9 60 384 2.7 196
16 68 40 600 20 4 30 478 3.8 199
17 68 40 1200 60 9 60 631 4.8 225
18 43 10 1200 60 9 60 405 3.1 216
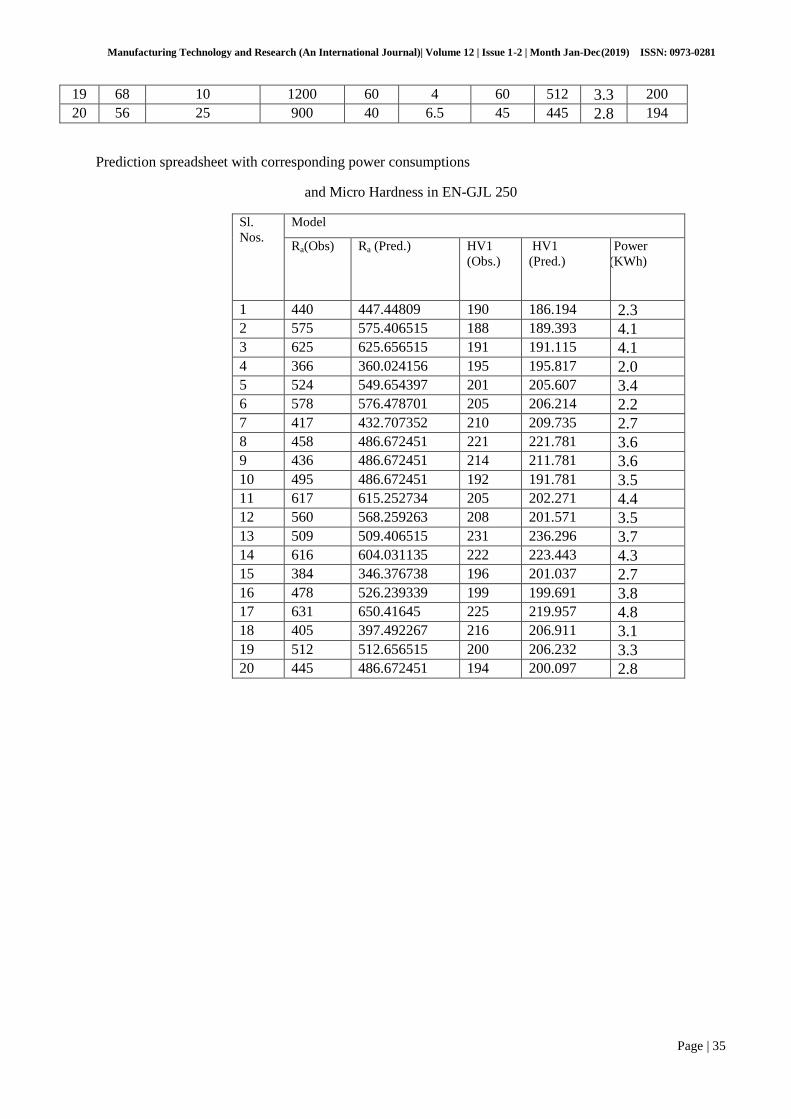
Manufacturing Technology and Research (An International Journal)| Volume 12 | Issue 1-2 | Month Jan-Dec (2019) ISSN: 0973-0281
Page | 35
19 68 10 1200 60 4 60 512 3.3 200
20 56 25 900 40 6.5 45 445 2.8 194
Prediction spreadsheet with corresponding power consumptions
and Micro Hardness in EN-GJL 250
Sl.
Nos.
Model
Ra(Obs) Ra (Pred.) HV1
(Obs.)
HV1
(Pred.)
Power
Co(KWh)
1 440 447.44809 190 186.194 2.3 2 575 575.406515 188 189.393 4.1 3 625 625.656515 191 191.115 4.1 4 366 360.024156 195 195.817 2.0 5 524 549.654397 201 205.607 3.4 6 578 576.478701 205 206.214 2.2 7 417 432.707352 210 209.735 2.7 8 458 486.672451 221 221.781 3.6 9 436 486.672451 214 211.781 3.6 10 495 486.672451 192 191.781 3.5 11 617 615.252734 205 202.271 4.4 12 560 568.259263 208 201.571 3.5 13 509 509.406515 231 236.296 3.7 14 616 604.031135 222 223.443 4.3 15 384 346.376738 196 201.037 2.7 16 478 526.239339 199 199.691 3.8 17 631 650.41645 225 219.957 4.8 18 405 397.492267 216 206.911 3.1 19 512 512.656515 200 206.232 3.3 20 445 486.672451 194 200.097 2.8

Manufacturing Technology and Research (An International Journal)| Volume 12 | Issue 1-2 | Month Jan-Dec (2019) ISSN: 0973-0281
Page | 36
700600500400300200
200
100
0
-100
-200
Fitted Value of Ra
Re
sid
ua
lRa Versus Fits
(response is Ra: EN- GJL 250, Model 3)
Ra versus Fits plots have been drawn for the material and also the correlation coefficient plot
between the RSM predicted and observed surface roughness plotted as in Fig, to predict the best
model.
shows the graphical representation of Raversus Fits which indicates the goodness between observed and
predicted responses. TheR2 values and the slope ofpredictions of Ra(surface roughness) has been
represented by Fig The correlation coefficients of the model is 0.944 . It shows a good relationship
between the two values. Its gradient is 0.9366 which is also close to unity
Literature Survey
y = 0.9366x + 41.815 R² = 0.944
200
300
400
500
600
700
800
200 300 400 500 600 700 800
Ob
serv
ed R
a (
NM
)
Predicted Ra (NM)
Model--EN GJL250

Manufacturing Technology and Research (An International Journal)| Volume 12 | Issue 1-2 | Month Jan-Dec (2019) ISSN: 0973-0281
Page | 37
A brief review of the published studies on the use of techniques based upon regression analysis and RSM for
analysis of various machining processes is presented. The survey reveals marked trend in the use of the
regression analysis and RSM techniques in the construction of models for the analysis of manufacturing
processes and optimization of process parameters. Literature survey shows that a lot of work has been done on
modelling of machining processes like, turning, milling, drilling and grinding in the context of surface finish
using response surface methodology. Various researchers, however, have taken different parameters for study the
surface roughness using RSM modelling. No work has been reported on surface roughness modelling and
optimization using RSM modelling in honing process applied to fine finishing of the bore of grey cast iron made
cylinder liner with six affecting parameters. Conclusions from the literature review have been included
References:
1. Armerego, E.J.A. and Brown, R.H. (1969), The machining of metals, Prentice-Hall Inc., Englewood Cliffs, New
Jersey, pp 370.
2. Dabnun, M.A., Hashmi, M.S.J. and Baradie, M.A. (2005), “Surface roughness prediction model by design of
experiments for turning machinable glass ceramic (Macor),” Journal of Materials Processing and Technology,
vol.164-65, pp1289-1293.
3. Chaudhary, I.A. and Bradie, M.A. (1997), “Surface roughness in turning of high strength steel by RSM design of
experiments,” Journal of Materials Processing Technology, Vol.67, pp55-61.
4. Feng, C., Yu, Z., Kingi, U., and Baig, P. (2006), “Threefold vs fivefold Cross validation in one hidden layer and
two hidden layer predictive Neural Network modelling of machining surface roughness data,” SME Journal of
Manufacturing Systems.
5. Ozcelik, B. and Bayramouglu, M. (2005), “The statistical modelling of surface roughness in high speed flat end
milling,” International Journal of Machine Tools and Manufacture, Vol.46, pp1395-1402.
6. Rogen, B.G. Ohlsson R. and Thomas T.R. (1996), “Wear of cylinder bore micro topography”
Vol. 198 Nos. 1-2pp 271–279
7. Box, G.E.P., and Draper, N. R. (1988), Empirical model building and response surfaces, New York, john Wiley
and Sons.
8. Chavan P.S. (2013), “Effect Of Honing Process Parameters On Surface Quality Of Engine Cylinder Liners”
International Journal of Engineering Research & Technology, Vol 2, No. 4, pp 98-107

Manufacturing Technology and Research (An International Journal)| Volume 12 | Issue 1-2 | Month Jan-Dec (2019) ISSN: 0973-0281
Page | 38
Design of Hydraulically controlled Machine Tool to Perform Multiple Machining
Operations
Mohd Almasood1, Yogendra Singh Rajpoot
2, Dr. A K Sharma
3
1, 2, 3 Department of Mechanical Engineering, Rajkiya Engineering College Mainpuri, Mainpuri, 205119, INDIA
Affiliated to AKTU Lucknow Uttar Pradesh India
Abstract- Since the ancient period, machining is one of the most important processes to produce good overall finished product. There are many machining operations which are required for manufacturing finish product. In earlier days almost all industries were using conventional hand powered machines .Manual manufacturing with the help of these conventional machines leads to high time consumption, high labour cost, less accuracy, poor quality of overall finished product. Now days, with rise in science and technology, the industries are developing rapidly which leads to decrement in man power gradually. Therefore, there is reduction in labour costs.
By the use of automation technology, we try to develop the hydraulic based machine tool for producing better quality products with high productivity, accuracy and low cost. Whole machine tool is made up of hydraulic devices, sensors and mechatronics. Primary reciprocating motion is done by movement of piston of hydraulic cylinder. Above movement is made automated using electro hydraulic components such as hydraulic cylinder, direction control valve, throttle valve (flow control cum check valve), hydraulic power pack, proximity sensors and other electrical and electronic devices.
For the automation of machine tool, hydraulic circuit is developed with the help of hydraulic cylinder, hydraulic power pack, direction control valve and throttle valve while the electric circuit is developed by connecting different electrical and electronic devices such as relays, proximity sensors switches, on/off push button switches etc.
Keywords: Automation; electrohydraulic components; hydraulic power pack; electrical and electronic devices.
1. Introduction
Hydraulic controlled machine tool is a reciprocating type of machine tool. Multiple operations
refers to combination of different machine tool i.e. drill machine tool and grinder while hydraulic
based machine tool refers to its primary mechanism which is based on electro-hydraulic
automation i.e. combination of hydraulic circuit and electric circuit. This machine tool is
expected to perform the individual operation of above two different machine tools. This machine
tool is intended to produce drill the holes, grind the job to produce good surface finish and to
improve its dimensional accuracy.
Since Drill and grinder are the parts of this machine tool, therefore the description of each
machine tool is described below:-
A drill is a machine tool primarily used for making round holes. It is fitted with a bit, either a
drill or driver, depending on application, mounted by a chuck. Around 10,000 years ago, first
machine drill i.e. bow drill was discovered by Homo sapiens [9]. In this machine tool, electrically
powered corded drill is used.
Grinder, is one of machine tools which are used for grinding, it is a type of machining using an
abrasive wheel as the cutting tool. Each grain of abrasive on the wheel's surface cuts a small chip
from the work piece via shear deformation [8]. In this machine tool, bench grinder is used.
Perpendicular axes movement of this hydraulic based machine tool:-
1* Mohd Almasood. Tel.: +91 6394742753; fax: .
E-mail address: [email protected]

Page | 39
1. Reciprocating motion in X-axis is done by movement of piston hydraulic cylinder which
is further controlled by electric circuit.
2. We can also vary the stroke length and its speed in forward direction through proximity
sensors and throttle valve respectively.
3. Motion in Y-direction is governed by screw nut mechanism which is controlled by pulley
wheel arrangement to separate motor.
4. Motion in Z-direction governed by motorized screw jack.
2. General idea of design and production of hydraulic machine tool
Development of hydraulic system: - The solution to a control problem is worked out
according to a system with documentation playing an important role in communicating the final
result. The hydraulic and electric circuit diagrams of hydraulic system are drawn using standard
symbols with their labelling. Complete documentation is required including most of the
following
Circuit diagrams.
Description of operation of the system.
Technical data of components.
Parts list of all components in the system [2].
2.1. Hydraulic circuit diagram of single double acting cylinder
Fig.1 Hydraulic Circuit
This circuit comprise hydraulic cylinder, throttle valve, power pack, pressure relief valve,
4/3 way electric directional control valve, proximity sensors, hose pipes and connectors.
Right side solenoid of valve is designated Y1 and left side of solenoid is designated Y2.
B-port of direction control valve is connected to the throttle valve which is further
connected to the front end port of hydraulic cylinder.
A-port of direction control valve is connected directly to rear end port of hydraulic
cylinder.
0.00 Bar
k1
y1
k1 k1s1 b1
k3
s2
k3 y2
k2
b2 k2
k3
k2
y2y1
b1b2
k2
k1

Page | 40
Pressurized fluid line is connected to P-port while return tank line is connected to T-port.
Proximity sensors are arranged near the piston, one at its desired stroke length and other
at zero stroke length.
2.2. Electric circuit of hydraulic system:
Fig.2 Electric Circuit
Electric circuit comprises of relays coils and its contacts, push button switches, electric
direction control valve, proximity sensors, 24 volts DC power supply.
3 relay coils with 3 contacts of each coil respectively are used.
Relay 1 is designated as K1, relay 2 and relay 3 also designated as K2 and K3 similarly
and respectively.
Relay 1 and relay 3 are connected to power source through two ways, firstly through push
button switches S1and S2 respectively and secondly through proximity sensors switches
B1 and B2.
Solenoid Y1 and solenoid Y2 are actuated by normally open contacts of relay K1 and
relay K2 respectively.
Normally closed contacts of relay 3 are connected in between the relay 1 and relay 2.
2.3. Working of Hydraulic System
When the hydraulic power pack is actuated and 24V DC power supply is on, piston of
hydraulic cylinder is in the range of proximity sensor B1, then solenoid Y1 gets actuated
and piston moves in forward direction.
After reaching in the range of proximity sensor B2, solenoid Y2 gets actuated and piston
moves in backward direction.
This will continue as reciprocating motion till the stop push button switch S2 is pressed.
When the switch S2 is pressed, piston will stop at instant.
At this instant, solenoids Y1 and Y2 both gets deactivated.
When the switch S1 is pressed the solenoid gets actuated again and piston follows the
default reverse backward direction.
With the help of throttle valve, we can vary the speed of piston in forward stroke
depending upon the requirement of machining operation. While the speed of piston
remains constant (i.e. full throttle speed) in reverse stroke. Thus, it fulfills the different
requirements of different operations.
k1
y1
k1 k1s1 b1
k3
s2
k3
y2
k2
b2k2
k3
k2
k2k1

Page | 41
With the variation in distance between the proximity sensors, we can easily vary the
stroke length and fix the position of starting of piston.
3. Design of Model of Complete Machine Tool
Supporting structure of complete machine tool is designed on solidworks 2018 to incorporate
the hydraulic system to perform our intended operations. Structure is divided into parts, in one
part, hydraulic system is incorporated while in other part there will be electrical system for
drilling and grinding operations.
Fig.3 3D Model of Machine tool
In one part of machine tool on leftmost side as we can see in picture, hydraulic piston
cylinder assembly is permanently fastened i.e. welded to nuts of nut screw arrangement.
Nut screw arrangement is basically comprise of two screw which rotates about its own axis
at fixed support while, when nut don’t rotates along the screw, it gets transverse motion.
Nut screw arrangement is mounted on cast body in which both the nuts are connected to
each other and hydraulic piston cylinder assembly while one of the screw is connected to
motor through pulley wheel arrangement to make it electrically controlled.
This nut screw arrangement is used to give transverse motion to hydraulic cylinder.
In second part of machine tool i.e. rightmost side of machine tool, screw jack is mounted on
casted body which is further connected to table.
Screw rod of screw jack is connected to motor, thus it is making the vertical up and down
motion of table (1) electrically controlled.
Hydraulic power pack is kept beside the bed.
Throttle valve is mounted beside nut screw arrangement motor.
Since piston do reciprocating motion in X-axis, thus all perpendicular axes motions are
achieved in design.
On table (1), whole drill and grinder arrangement is mounted.
Work holding device for drill and grinder arrangement is mounted on piston of hydraulic
cylinder.
Grinding wheel
Table (1)
Casted bed
Motorized
screw jack
Work holding
device
Drill chuck
and drill bit
Nut screw
Arrangement
Hydraulic piston
cylinder assembly

Page | 42
Drill and grinder arrangement comprise of drill chuck, drill bit, shaft, motor, abrasive
grinding wheel, bearing support, bearing.
In this arrangement, a little long shaft is coupled with motor and drill chuck and abrasive
wheel is fitted on that same shaft.
4. Working of complete hydraulic based machine tool
For drilling operation, workpiece holding device is connected to piston and rotation of
drill bit is done through attached motor.
Rotating drill bit remains stationary at table (1) while table (1) do reciprocating
vertical up and down motion through screw jack.
Workpiece holding device gets the motion from piston and nut screw arrangement and
fed to drill bit to make required size of hole.
Similarly for grinding operation workpiece holding device is mounted on piston and
rotation of abrasive wheel is done through attached motor. Wheel remains stationary at
rotating table (1) while workpiece holding device gets the same motion from piston,
nut screw arrangement and screw jack as same in case of drilling machine tool to
improve surface finish.
Thus, all the intended operations are performed.
5. Conclusion
In this project the conventional single machine tools are converted into hydraulic based
machine tool by which operating time will be saved. Thus, the output will be increased.
Since this is a combination of machine tools in a single machine tool, so it also reduces the
production cost as well as the cost of machine tool.
This machine tool is converted into semi-automatic and semi-electrically controlled because
the loading and unloading of workpiece, connecting different machine tool is done manually.
It also reduces the large floor area at workplace and allows to perform the different
operations at single platform.
Since this machine tool uses the hydraulic reciprocating mechanism, so there is a very small
inertia of moving parts, therefore there are very less vibration in machine tool.
Hence here we conclude that, this project is made keeping the two things in mind that
different machine tools which are based on mostly same mechanism can be combined in one
machine tool and we can also use the different automation technique.
There is still wide scope in the area of automation to make it fully automatic to reduce the
huge idle time.
We can also add even more different machine tools.
Thus, lots of improvement can be made with the latest technology.

Page | 43
References
1. M. King, B. Zhu, and S. Tang (2001), “Optimal path planning,” Mobile Robots, (vol. 8, no. 2), pp. 520-531.
2. Bharath, Siddharam Patil, RM Lathe (2013), “Shaper automation using Electro-Pneumatic devices and Plcs”,
(vol. 8).
3. Hydraulic and pneumatic manuals- Bosch Rexroth.
4. Manufacturing technology volume 2, metal cutting and machine tools by P N Rao.
5. Design of Hydraulic circuit for CNC lathe machine converted from conventional lathe machine.
6. Low cost automation.
7. Machine tools and automation by H.P. Potts.
8. Grinding: Wikipedia.
9. Drill: Wikipedia.
10. B. Suresh Kumar, N. Baskar, K. Rajaguru (2020), “Drilling operation: A review”, (vol. 21).

Manufacturing Technology and Research (An International Journal)| Volume 12 | Issue 1-2 | Month Jan-Dec (2019) ISSN: 0973-0281
Page | 44
Development and Futuristic Scope of Wind Energy in India
Dileep Gangila, Devendra Singh
b
aDepartment of Mechanical Engineering, Govt. Polytechnic College, Morena-476001 (M.P.) India bDepartment of Mechanical Engineering, Ajay Kumar Garg Engineering College, Ghaziabad-201009 (U.P.) India
Abstract
The paper first deals with the current scenario of the wind energy in India. Energy is vital for the country’s
economic growth and improving the life standard of its citizen. Development and promotion of new and
renewable energy sources such as wind, solar and biomass has gotten considerable attention in India, although
coal and natural gas are still major sources of electricity. The use of various sustainable, renewable energy or
unconventional energy technologies has been rising, as it develops rapidly and can be scaled up easily. Wind
energy has been the fastest growing renewable energy or unconventional energy sector in India. Wind energy is
available without any cost and it does not emit any greenhouse gases. This makes it a great source of energy
production for any developing state. The field of wind energy has tremendous scope for innovation, translating
to real world applications and tremendous economic opportunity. It is crucially important for India, as our
economy continues to evolve and must ensure every Indian has access to opportunity, decent jobs and
livelihood. For that we will need greater resources. The Indian Government has aimed to fully utilize the
abundant resources of this energy, which India has. Clean, sustainable, renewable-and equally important,
domestic sources of energy are essential to fulfil the potential of India in the coming years and it is certain that
wind energy will play a major part in shaping India's future. Wind power has emerged as the biggest source of
renewable energy in the world. This paper provides a detailed description of Indian wind energy industry and
discusses several developments and futuristic scope of wind energy which accelerated its growth. The paper
presents current status, major achievements and futuristic scope of wind energy in India.
Keywords: Unconventional Energy, Wind Energy, Sources of Wind Energy, India, Wind Energy Potential,
Wind Energy Development.
1. Introduction
India is the home of 1.36 billon people i.e. 17.43% of the total world population, which makes it second
most populous country in world. India has the second fastest growing economy of the world. India’s substantial
and sustained economic growth over the years is placing enormous demand on its energy resources.
Energy is a vital input in all sectors of any country’s economy [1]. It is crucial for human development index as
human development is positively correlated to energy consumption [2]. Till late 1980s energy has been
generated largely by burning coal, hydrocarbon oil and natural gas leading to huge carbon emissions. Developed
countries fulfil up to 90% of their demand by fossil fuels and 10% demand by other resources, while under-
developed countries fulfil about 50% of their demand by fossil fuels and 50% by other resources. Hence,
environmental crisis has become a critical concern for the world today. Emission of greenhouse gases, limited
coal availability, environment distortion, rising prices of fossil fuels and pressure on foreign exchange reserves
have created hindrance in the prolongation of these resources [3]. Due to this, new energy economy is
developing. This new energy economy generates energy from wind, sun and through heat within earth itself.
Energy generated by burning fossil fuels damages the environment and causes climate change. However, energy
based on renewable sources in general and wind energy specifically, does not affect the environment that
adversely, which conventional energy sources do. Due to the geographic conditions of India, plenty of
renewable energy sources such as solar, wind, biomass, hydro and tidal are available to it [4]. The electricity
sector in India had an installed capacity of 35129 MW as of 2018. India became the world's fourth largest
producer of electricity in the year 2013 with 4.8% global share in electricity generation surpassing Japan and
Russia. Power development in India was first started in 1897 in Darjeeling, followed by commissioning of a
hydropower station at Sivasamudram in Karnataka during 1902. Thermal power stations which generate
electricity more than 1000 MW are referred as Super Thermal Power Stations. India's electricity generation
capacity additions from 1950 to 1985 were very low when compared to developed nations. Since 1990, India
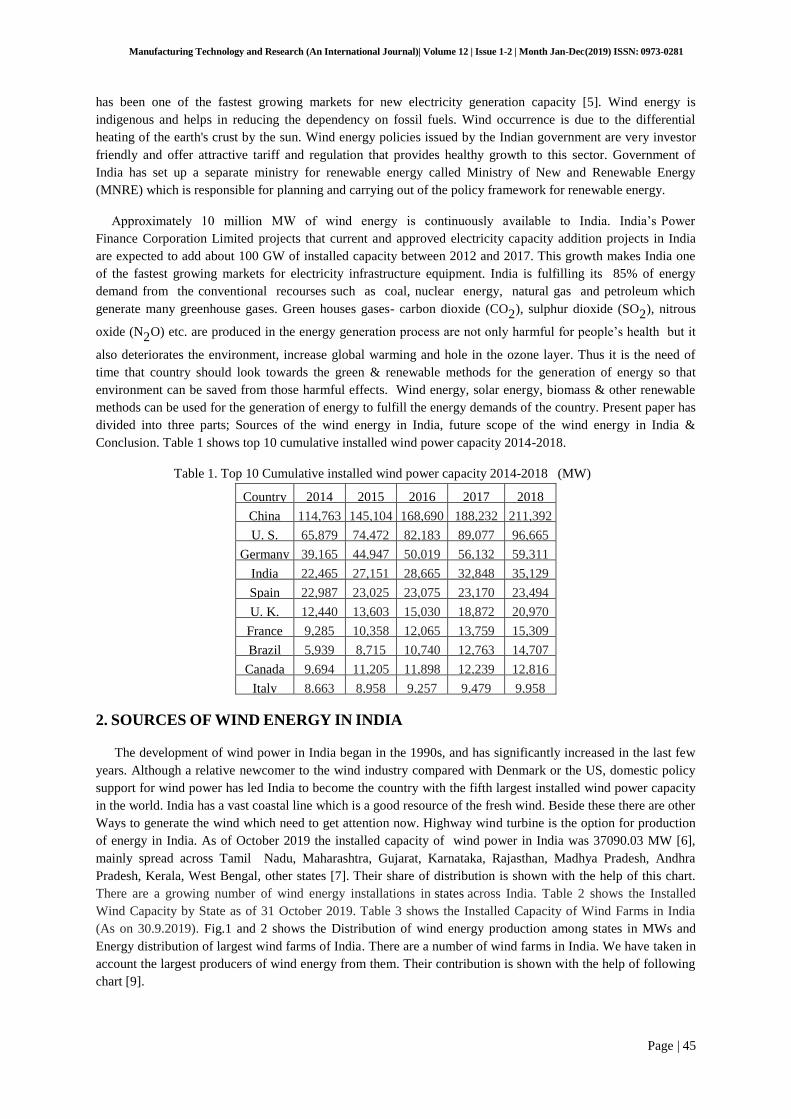
Manufacturing Technology and Research (An International Journal)| Volume 12 | Issue 1-2 | Month Jan-Dec (2019) ISSN: 0973-0281
Page | 45
has been one of the fastest growing markets for new electricity generation capacity [5]. Wind energy is
indigenous and helps in reducing the dependency on fossil fuels. Wind occurrence is due to the differential
heating of the earth's crust by the sun. Wind energy policies issued by the Indian government are very investor
friendly and offer attractive tariff and regulation that provides healthy growth to this sector. Government of
India has set up a separate ministry for renewable energy called Ministry of New and Renewable Energy
(MNRE) which is responsible for planning and carrying out of the policy framework for renewable energy.
Approximately 10 million MW of wind energy is continuously available to India. India’s Power
Finance Corporation Limited projects that current and approved electricity capacity addition projects in India
are expected to add about 100 GW of installed capacity between 2012 and 2017. This growth makes India one
of the fastest growing markets for electricity infrastructure equipment. India is fulfilling its 85% of energy
demand from the conventional recourses such as coal, nuclear energy, natural gas and petroleum which
generate many greenhouse gases. Green houses gases- carbon dioxide (CO2), sulphur dioxide (SO2), nitrous
oxide (N2O) etc. are produced in the energy generation process are not only harmful for people’s health but it
also deteriorates the environment, increase global warming and hole in the ozone layer. Thus it is the need of
time that country should look towards the green & renewable methods for the generation of energy so that
environment can be saved from those harmful effects. Wind energy, solar energy, biomass & other renewable
methods can be used for the generation of energy to fulfill the energy demands of the country. Present paper has
divided into three parts; Sources of the wind energy in India, future scope of the wind energy in India &
Conclusion. Table 1 shows top 10 cumulative installed wind power capacity 2014-2018.
Table 1. Top 10 Cumulative installed wind power capacity 2014-2018 (MW)
Country 2014 2015 2016 2017 2018
China 114,763 145,104 168,690 188,232 211,392
U. S. 65,879 74,472 82,183 89,077 96,665
Germany 39,165 44,947 50,019 56,132 59,311
India 22,465 27,151 28,665 32,848 35,129
Spain 22,987 23,025 23,075 23,170 23,494
U. K. 12,440 13,603 15,030 18,872 20,970
France 9,285 10,358 12,065 13,759 15,309
Brazil 5,939 8,715 10,740 12,763 14,707
Canada 9,694 11,205 11,898 12,239 12,816
Italy 8,663 8,958 9,257 9,479 9,958
2. SOURCES OF WIND ENERGY IN INDIA
The development of wind power in India began in the 1990s, and has significantly increased in the last few
years. Although a relative newcomer to the wind industry compared with Denmark or the US, domestic policy
support for wind power has led India to become the country with the fifth largest installed wind power capacity
in the world. India has a vast coastal line which is a good resource of the fresh wind. Beside these there are other
Ways to generate the wind which need to get attention now. Highway wind turbine is the option for production
of energy in India. As of October 2019 the installed capacity of wind power in India was 37090.03 MW [6],
mainly spread across Tamil Nadu, Maharashtra, Gujarat, Karnataka, Rajasthan, Madhya Pradesh, Andhra
Pradesh, Kerala, West Bengal, other states [7]. Their share of distribution is shown with the help of this chart.
There are a growing number of wind energy installations in states across India. Table 2 shows the Installed
Wind Capacity by State as of 31 October 2019. Table 3 shows the Installed Capacity of Wind Farms in India
(As on 30.9.2019). Fig.1 and 2 shows the Distribution of wind energy production among states in MWs and
Energy distribution of largest wind farms of India. There are a number of wind farms in India. We have taken in
account the largest producers of wind energy from them. Their contribution is shown with the help of following
chart [9].

Manufacturing Technology and Research (An International Journal)| Volume 12 | Issue 1-2 | Month Jan-Dec (2019) ISSN: 0973-0281
Page | 46
Table 2. Installed Wind Capacity by State as of 31 October 2019
S. No. State Total Capacity (MW)
1 Tamil Nadu 9231.77
2 Gujarat 7203.77
3 Maharashtra 4794.13
4 Karnataka 4753.40
5 Rajasthan 4299.73
6 Andhra Pradesh 4092.45
7 Madhya Pradesh 2519.89
8 Telangana 128.10
9 Kerala 62.50
10 Others 4.30
Total 37090.03
Table 3. Installed Capacity of Wind Farms in India (As on 30.9.2019)
From Govt. Of India, Ministry of Power [8]
S.
No.
Sector MW Total
1 Central Sector 91,497 25.2%
2 State Sector 103,015 28.5%
3 Private Sector 168,858 46.5%
Total 360,456
Fig.1. Distribution of wind energy production among states in MWs
Fig.2. Energy distribution of largest wind farms of India
3. INDIAN WIND ENERGY PROGRAMME
The oil shock of the late 1970s had prompted energy planners all over the world to look for alternative
sources of energy [10]. The sudden increase in the price of oil had affected the balance of payment situation
adversely. Hence, Indian government started to concentrate on renewable energy with the missionary work of

Manufacturing Technology and Research (An International Journal)| Volume 12 | Issue 1-2 | Month Jan-Dec (2019) ISSN: 0973-0281
Page | 47
becoming self-sufficient in energy. In 1981, Indian government had instituted the Commission for Additional
Sources of Energy (CASE) with the purpose of formulation and implementation of policies for development of
new and renewable energy and increasing R&D activities in the sector for technical progress [11]. In 1982, a
new department, Department of Non-Conventional Energy (DNES) was created in the then Ministry of Energy
and given the responsibility of taking care of CASE. In 1992, this DNES was transformed into the separate
ministry, Ministry of Non-Conventional Energy Sources (MNES) and became world’s first ministry dedicated
to renewable energy [12]. This ministry has been re-named to Ministry of New and Renewable Energy (MNRE)
in October 2006 [13].
India has always been a frontrunner in the development of renewable energy in Asia. MNRE’s objective is to
increase the contribution of all grid connected renewable energy sources in the energy mix of India. Grid
connected renewable sources include wind power, bio power (including Biomass power and waste to energy),
small hydro power (up to 25 MW generating capacity) and solar power [14]. MNRE supervises autonomous
energy development institutes like National institute of solar energy for solar energy, C-WET for wind energy,
SSS NIRE for biomass energy, AHEC for hydropower and IREDA for financial support and lending to
renewable energy projects [13]. Worldwide, governments started giving attention to wind energy projects in the
1960s, when the National Aeronautical Laboratory (NAL) of U.S.A developed multi vane wind turbine. In
1976–77 it had gone one step further and developed sail type wind turbines. In India wind energy programme
was started in 1983-84 with the aim of carrying out resource assessment survey, setting of demonstration
projects and incentivizing wind energy to make it more competitive. As Indian constitution directs electricity to
be combined responsibility of federal and state government both, hence wind energy programme was executed
with the support of state nodal agencies by MNRE [15]. Indian Wind Turbine Manufacturer Association
(IWTMA) had also played vital role in the development and execution of this programme.
As on October 2019, India has 37090.03 MW of installed renewable energy capacity, out of which wind
energy accounts 21,268.23 MW. Wind energy has been distantly followed by small hydro power and solar
power with 3,803.65 MW and 2,647 MW respectively [16]. Wind energy growth rate has come down in 2012,
due to the negative impact of removal of accelerated depreciation benefit from domestic investor. However, the
Indian government has realised importance of accelerated depreciation and restored this benefit in the recent
annual budget. From 2002 to 2019, the average growth rate of wind energy was 26.87%. Figure 3 shows year
wise installation of global cumulative installed wind energy capacity from 2001 to 2016.
Figure 3. Global cumulative installed wind energy capacity (19, 20)
4. WIND ENERGY STATUS IN INDIA
Demand for energy in India has grown considerably after 1991 due to the speeding up of economic
development. This demand will continue to grow as the speedy development of economy gets coupled with the
growth in population [17]. According to International Energy Agency (IEA), by 2020 India needs 327 GW of
power generation capacity, which means additional capacity of 13 GW should be created every year. India
wants to increase its installed renewable energy capacity from 78 GW to 175 GW (1 GW = 1,000 MW) by

Manufacturing Technology and Research (An International Journal)| Volume 12 | Issue 1-2 | Month Jan-Dec (2019) ISSN: 0973-0281
Page | 48
March 2022. Of that 175 GW, 100 GW is supposed to be solar power. Moreover, India wants to nearly double
the share of renewable power in its total installed capacity to 40% by 2030. MNRE estimates show that 90 GW
of capacity is possible through different renewable or non-conventional energy sources. This includes 48.6 GW
of wind power at 50 meter hub height, 14.3 GW from small hydro power and 26.4 GW from biomass [18].
Table 4 shows that Gujarat, Karnataka, Andhra Pradesh, Maharashtra and Tamil Nadu are having a large
potential of wind energy. These states are having areas with good and consistent wind, suitable for commercial
use of wind energy. Hence, India’s wind energy capacity of 302 GW. Table 5 shows the State wise Installed
Capacity.
Role of wind energy is not only limited to energy generation but it also contribute to increase in GDP.
According Global Wind Energy Council (GWEC), wind energy can create 213,000 green collar jobs every year
[21]. Hence, wind energy can assist in solving longstanding unemployment problem, in an environment friendly
way. Along with reducing hazardous effects of greenhouse gases, it will generate additional revenue by selling
carbon credits through clean development mechanism (CDM).
Table 4. State wise Wind Energy Potential (MW) (19,20)
S. No. State Total Capacity
(MW) 1 Gujarat 84431.33
2 Rajasthan 18770.49
3 Maharashtra 45394.34
4 Tamil Nadu 33799.65
5 Madhya Pradesh 10483.88
6 Karnataka 55857.36
7 Andhra Pradesh 44228.60
8 Kerala 1699.56
9 Telangana 4244.29
10 Odisha 3093.47
11 Chhattisgarh 76.59
12 West Bengal 2.08
13 Fig. 1. Puducherry 152.83
14 Lakshadweep 7.67
15 Goa 0.84
16 Andaman &
Nicobar
8.43
Total in MW 302251.49
Total in GW 302
Table 5. State wise Installed Capacity (19,20), UPTO 31.12.2014
State 200
3-04
2004
-05
2005
-06
2006
-07
2007
-08
2008
-09
2009
-10
2010
-11
2011
-12
2012
-13
2013-
14
2014
-15
Total
Andhra
Pradesh 6.2 21.8 0.5 0.8 0.0 0.0 13.6 55.4 54.1 202.2
298.5
0
166.3
0 912.5
Gujarat 28.9 51.5 84.6 284.0 616.4 313.6 297.1 312.8 789.9 208.3 279.8
0
126.9
0
3581.
3
Karnataka 84.9 201.5 143.8 266.0 190.3 316.0 145.4 254.1 206.7 201.7 183.0
0
230.5
0
2548.
7
Kerala 0.0 0.0 0.0 0.0 8.5 16.5 0.8 7.4 0.0 0.0 0.00 0.00 35.1
Madhya
Pradesh 0.0 6.3 11.4 16.4 130.4 25.1 16.6 46.5 100.5 9.6 37.40
143.9
0 567.3
Maharash
tra 6.2 48.8 545.1 485.3 268.2 183.0 138.9 239.1 416.5 288.6
1074.
50
273.4
5
4369.
8
Rajasthan 117.
8 106.3 73.3 111.8 69.0 199.6 350.0 436.7 545.7 615.4 98.80
267.7
0
3052.
7
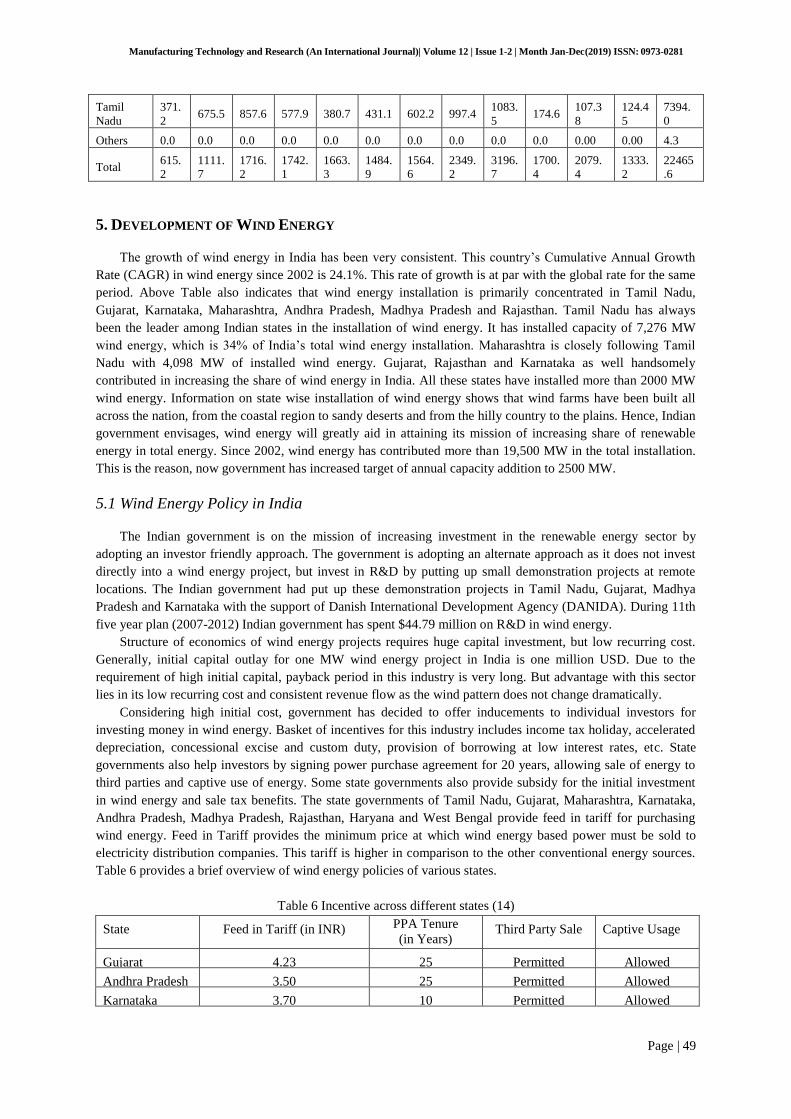
Manufacturing Technology and Research (An International Journal)| Volume 12 | Issue 1-2 | Month Jan-Dec (2019) ISSN: 0973-0281
Page | 49
Tamil
Nadu
371.
2 675.5 857.6 577.9 380.7 431.1 602.2 997.4
1083.
5 174.6
107.3
8
124.4
5
7394.
0
Others 0.0 0.0 0.0 0.0 0.0 0.0 0.0 0.0 0.0 0.0 0.00 0.00 4.3
Total 615.
2
1111.
7
1716.
2
1742.
1
1663.
3
1484.
9
1564.
6
2349.
2
3196.
7
1700.
4
2079.
4
1333.
2
22465
.6
5. DEVELOPMENT OF WIND ENERGY
The growth of wind energy in India has been very consistent. This country’s Cumulative Annual Growth
Rate (CAGR) in wind energy since 2002 is 24.1%. This rate of growth is at par with the global rate for the same
period. Above Table also indicates that wind energy installation is primarily concentrated in Tamil Nadu,
Gujarat, Karnataka, Maharashtra, Andhra Pradesh, Madhya Pradesh and Rajasthan. Tamil Nadu has always
been the leader among Indian states in the installation of wind energy. It has installed capacity of 7,276 MW
wind energy, which is 34% of India’s total wind energy installation. Maharashtra is closely following Tamil
Nadu with 4,098 MW of installed wind energy. Gujarat, Rajasthan and Karnataka as well handsomely
contributed in increasing the share of wind energy in India. All these states have installed more than 2000 MW
wind energy. Information on state wise installation of wind energy shows that wind farms have been built all
across the nation, from the coastal region to sandy deserts and from the hilly country to the plains. Hence, Indian
government envisages, wind energy will greatly aid in attaining its mission of increasing share of renewable
energy in total energy. Since 2002, wind energy has contributed more than 19,500 MW in the total installation.
This is the reason, now government has increased target of annual capacity addition to 2500 MW.
5.1 Wind Energy Policy in India
The Indian government is on the mission of increasing investment in the renewable energy sector by
adopting an investor friendly approach. The government is adopting an alternate approach as it does not invest
directly into a wind energy project, but invest in R&D by putting up small demonstration projects at remote
locations. The Indian government had put up these demonstration projects in Tamil Nadu, Gujarat, Madhya
Pradesh and Karnataka with the support of Danish International Development Agency (DANIDA). During 11th
five year plan (2007-2012) Indian government has spent $44.79 million on R&D in wind energy.
Structure of economics of wind energy projects requires huge capital investment, but low recurring cost.
Generally, initial capital outlay for one MW wind energy project in India is one million USD. Due to the
requirement of high initial capital, payback period in this industry is very long. But advantage with this sector
lies in its low recurring cost and consistent revenue flow as the wind pattern does not change dramatically.
Considering high initial cost, government has decided to offer inducements to individual investors for
investing money in wind energy. Basket of incentives for this industry includes income tax holiday, accelerated
depreciation, concessional excise and custom duty, provision of borrowing at low interest rates, etc. State
governments also help investors by signing power purchase agreement for 20 years, allowing sale of energy to
third parties and captive use of energy. Some state governments also provide subsidy for the initial investment
in wind energy and sale tax benefits. The state governments of Tamil Nadu, Gujarat, Maharashtra, Karnataka,
Andhra Pradesh, Madhya Pradesh, Rajasthan, Haryana and West Bengal provide feed in tariff for purchasing
wind energy. Feed in Tariff provides the minimum price at which wind energy based power must be sold to
electricity distribution companies. This tariff is higher in comparison to the other conventional energy sources.
Table 6 provides a brief overview of wind energy policies of various states.
Table 6 Incentive across different states (14)
State Feed in Tariff (in INR) PPA Tenure
(in Years) Third Party Sale Captive Usage
Gujarat 4.23 25 Permitted Allowed
Andhra Pradesh 3.50 25 Permitted Allowed
Karnataka 3.70 10 Permitted Allowed
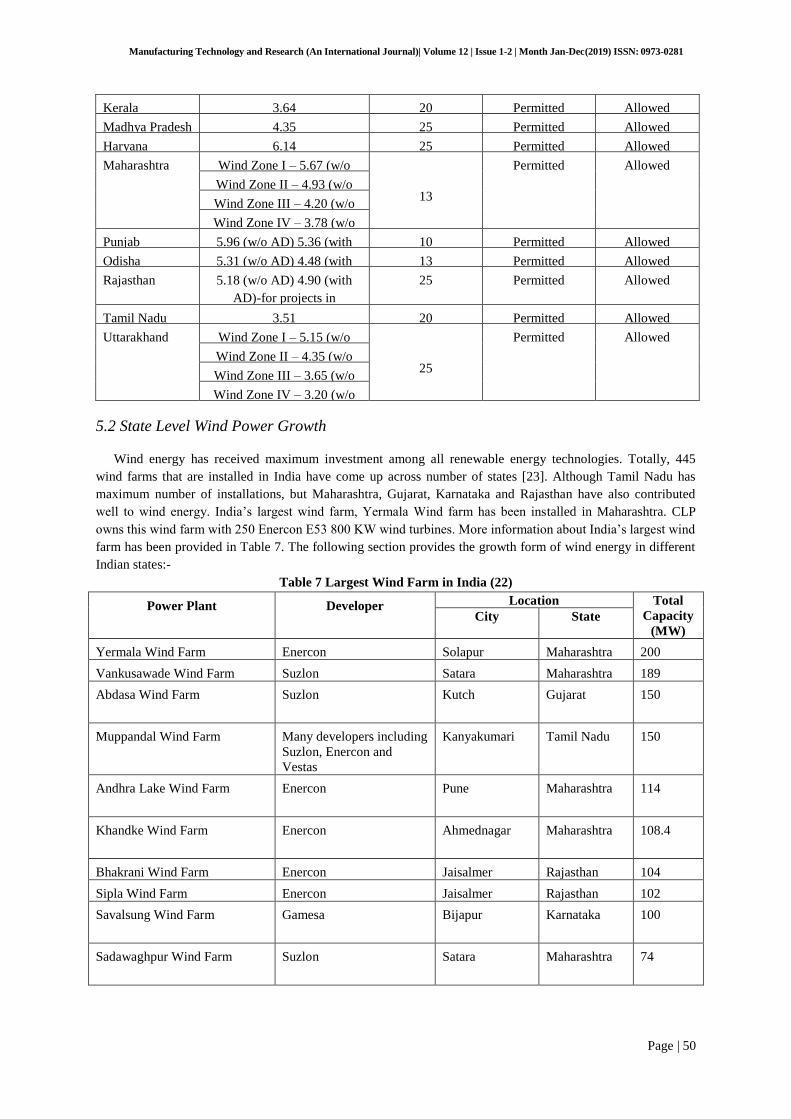
Manufacturing Technology and Research (An International Journal)| Volume 12 | Issue 1-2 | Month Jan-Dec (2019) ISSN: 0973-0281
Page | 50
Kerala 3.64 20 Permitted Allowed
Madhya Pradesh 4.35 25 Permitted Allowed
Haryana 6.14 25 Permitted Allowed
Maharashtra Wind Zone I – 5.67 (w/o
AD), 4.86 (with AD)
13
Permitted Allowed
Wind Zone II – 4.93 (w/o
AD), 4.23 (with AD) Wind Zone III – 4.20 (w/o
AD), 3.60 (with AD) Wind Zone IV – 3.78 (w/o
AD), 3.24 (with AD) Punjab 5.96 (w/o AD) 5.36 (with
AD)
10 Permitted Allowed
Odisha 5.31 (w/o AD) 4.48 (with
AD)
13 Permitted Allowed
Rajasthan 5.18 (w/o AD) 4.90 (with
AD)-for projects in
Jaisalmer, Jodhpur and
Barmer districts. 5.44 (w/o
AD) 5.14 (AD)-for other
districts
25 Permitted Allowed
Tamil Nadu 3.51 20 Permitted Allowed
Uttarakhand Wind Zone I – 5.15 (w/o
AD), 4.75 (with AD)
25
Permitted Allowed
Wind Zone II – 4.35 (w/o
AD), 4.00 (with AD) Wind Zone III – 3.65 (w/o
AD), 3.35 (with AD) Wind Zone IV – 3.20 (w/o
AD), 2.90 (with AD) 5.2 State Level Wind Power Growth
Wind energy has received maximum investment among all renewable energy technologies. Totally, 445
wind farms that are installed in India have come up across number of states [23]. Although Tamil Nadu has
maximum number of installations, but Maharashtra, Gujarat, Karnataka and Rajasthan have also contributed
well to wind energy. India’s largest wind farm, Yermala Wind farm has been installed in Maharashtra. CLP
owns this wind farm with 250 Enercon E53 800 KW wind turbines. More information about India’s largest wind
farm has been provided in Table 7. The following section provides the growth form of wind energy in different
Indian states:-
Table 7 Largest Wind Farm in India (22)
Power Plant Developer Location Total
Capacity
(MW) City State
Yermala Wind Farm Enercon Solapur Maharashtra 200
Vankusawade Wind Farm Suzlon Satara Maharashtra 189
Abdasa Wind Farm Suzlon Kutch Gujarat
150
Muppandal Wind Farm Many developers including
Suzlon, Enercon and
Vestas
Kanyakumari
Tamil Nadu
150
Andhra Lake Wind Farm Enercon Pune
Maharashtra 114
Khandke Wind Farm Enercon Ahmednagar
Maharashtra 108.4
Bhakrani Wind Farm Enercon Jaisalmer Rajasthan 104
Sipla Wind Farm Enercon Jaisalmer Rajasthan 102
Savalsung Wind Farm Gamesa
Bijapur
Karnataka
100
Sadawaghpur Wind Farm Suzlon
Satara
Maharashtra 74
Manufacturing Technology and Research (An International Journal)| Volume 12 | Issue 1-2 | Month Jan-Dec (2019) ISSN: 0973-0281
Page | 51
(a) Tamil Nadu
Tamil Nadu is pioneer of wind energy in India. Due to its encouraging policies for wind energy, this state
has always been preferred by the wind energy industry for installing the projects since the commencement of
Indian wind energy programme. Tamil Nadu tops the list of states with the largest installed wind power
generation capacity in the country. The state's total wind capacity at the end of 2018 stood at 8,631 MW while
its total installed electricity generation capacity stood at 30,447 MW at the end of 2018, with wind sector’s share
at 28.34 per cent.
(b) Maharashtra
Investor-friendly policies of Government of Maharashtra and technical viability of the demonstration projects
have attracted huge investment in the wind sector. Maharashtra is having largest installed capacity of wind
energy after Tamil Nadu with 4098 MW, covering about 19% of India’s total wind capacity [20]. Maharashtra
houses the third-largest installed wind power generation capacity in the country. The state’s wind capacity at the
end of 2018 stood at 4,789 MW while its total installed power generation capacity stood at 43,779 MW at the
end of 2018, with the wind sector’s share at 11 per cent. Maharashtra has been seen as one of the best state to
invest in wind energy due to investor friendly policies. Satara, Sangli, Dhule and Panchgani are places in
Maharashtra those have a good number of wind power generating facilities.
(c) Gujarat
The state of Gujarat is blessed with a long coastline of 1600 kM where the wind speeds are adequate for
conversion into electrical energy. This State’s government is always keen to promote investment in wind
energy, hence it has introduced a number of incentives like higher feed in tariff, wheeling and banking of
energy. Gujarat houses the second-largest installed wind power generation capacity in the country. The state’s
total wind capacity at the end of 2018 stood at 6,044 MW while its total installed electricity generation capacity
stood at 31,382 MW at the end of 2018, with the wind sector’s share at 19.25 per cent.
(d) Karnataka
Karnataka is one of the leading states in potential of renewable energy in India. At present, thermal and hydro is
the primary source of energy in this state. Nevertheless, renewable energy contributes about 24% to state’s
installed capacity. The renewable energy potential of the state is estimated at 28 GW, mainly from wind, small
hydro, co-generation and biomass sectors. Karnataka houses the fourth-largest installed wind power generation
capacity in the country. The state’s wind capacity at the end of 2018 stood at 4,584 MW while its total installed
power generation capacity stood at 27,199 MW at the end of 2018, with the wind sector’s share at 17 per cent.
(e) Rajasthan
Rajasthan is emerging as the most favoured destination for setting up wind power projects. This state has
reached to installation of 2,820 MW on March 2014 from just 16.1 MW in 2002. The prime reason for this
growth is the attention given by state government to develop clean energy sources. Wind energy development
programme in Rajasthan was started in 1999. Rajasthan houses the fifth-largest installed wind power generation
capacity in the country. The state’s wind capacity at the end of 2018 stood at 4,300 MW while its total installed
electricity generation capacity stood at 21,833 MW at the end of 2018, with the wind sector’s share at 20 per
cent.
(f) Andhra Pradesh
According to the studies conducted by C-WET, Andhra Pradesh is having second highest potential for wind
energy with 14.5 GW of generation potential at 80 meter hub height. Andhra Pradesh houses the sixth-largest

Manufacturing Technology and Research (An International Journal)| Volume 12 | Issue 1-2 | Month Jan-Dec (2019) ISSN: 0973-0281
Page | 52
installed wind power generation capacity in the country. The state’s wind capacity at the end of 2018 stood at
4,007 MW while its total installed electricity generation capacity stood at 23,726 MW at the end of 2018, with
the wind sector’s share at 17 per cent.
(g) Madhya Pradesh
The government of Madhya Pradesh has been at the forefront in promoting various renewable energy sources
including wind energy through its policy initiatives and incentives for renewable energy investor. Although
Madhya Pradesh is not among the leading states in wind energy potential as it is having the potential of
generating only 2931 MW energy from wind. But state government is always keen to raise the contribution of
wind energy for sustainable growth. Madhya Pradesh houses the seventh largest installed wind power generation
capacity in the country. The state’s wind capacity at the end of 2018 stood at 2,520 MW while its total installed
electricity generation capacity stood at 21,873 MW at the end of 2018, with the wind sector’s share at 11.52 per
cent.
(h) Kerala
Kerala government had set up The Agency for Non - Conventional Energy and Rural Technology
(ANERT) in 1986 as an independent body for conducting surveys to acquire renewable energy projects.
ANERT has conducted studies in association with MNRE of the wind potential of the state and estimated it to
be 605 MW. Kerala’s installed wind capacity at the end of 2018 stood at 53 MW while its total installed power
generation capacity stood at 5,083 MW at the end of 2018, with the wind sector’s share at 1.04 per cent.
(i) Telangana
Telangana’s installed wind capacity at the end of 2018 stood at 128 MW while its total installed power
generation capacity stood at 15,944 MW at the end of 2018, with the wind sector’s share at 0.80 per cent.
(j) West Bengal
West Bengal Renewable Energy Development Agency (WNREDA), state nodal agency was set up in 1993
for implementation of non-conventional energy programmes in the state. This agency had given mandate to
promote renewable energy projects in the state and create a conducive environment for commercialisation of
these projects. State government encourage power companies to buy energy generated by renewable energy
equipment to increase share of renewable energy in state energy capacity. The total installation in West
Bengal is 2.10 MW till Dec 2009 at Fraserganj, Distt- South 24 Paraganas. More 0.5 MW (approx) at Ganga
Sagar, Kakdwip, Distt - South 24 Paraganas. Both the project owned by West Bengal Renewable Energy
Development Agency (WBREDA), Government of West Bengal. This project was executed on turnkey basis
by Utility Powertech Limited (UPL)
6. Conclusion
Due to liberalisation and change in lifestyle of consumer, demand for energy has increased. This growth of
demand can be effectively tackled by better energy management. India is a land of unlimited potential, but that
potential is not getting used in effective manner. Extensive use of wind energy for large scale power generation
and small scale irrigation can help in solving the energy crisis to some extent in our country. Wind energy is a
great source to fulfil India’s energy needs as well as develop its economy. Future and development of India
depends upon many factors: one of them is being self dependent for its energy demands. It will free India from
its dependency on other countries for nuclear energy generation. Although Government’s plans look ambitious
now but it certainly aims to be self-reliant. Of all the major renewable sources they are primarily focusing on
wind (generation and distribution). But, there are some limitations with implementation of this technology that
must be considered. Wind turbines cannot be set up in many of the unused areas because it requires a huge

Manufacturing Technology and Research (An International Journal)| Volume 12 | Issue 1-2 | Month Jan-Dec (2019) ISSN: 0973-0281
Page | 53
amount of capital investment. Therefore, cost of wind turbines should be less so that they can be easily planted
in more areas. Many research and development centres should be opened for the further enhancement and
progress of wind power. Subject regarding to wind power technology and other renewable energy technologies
must be introduced in colleges and schools which may increase its scope in future tremendously. In India,
metros network can be a great source of wind power generation as it will need lighter equipment than
conventional wind turbines to harness the wind generated by commute of metro trains. In some cities metro rails
are already running and in several other cities government is planning to run it. So, lighter wind turbines can be
installed at sites of the metro tracks so without much extra investment wind energy can be generated. Right now
India’s is headed on an increasing graph with a slower slope than before. It will have to keep the slope of this
growth rate steeper if it wishes to achieve its targets in energy sector.
7. REFERENCES
[1] A.K. Singh, S. K Parida, “National electricity planner and use of distributed energy sources in India”, Sustainable Energy
Technologies and Assessments, vol 2, pp. 42–54, June 2013.
[2] G. Dwivedi, M.P.Sharma, M.Kumar, “Status and policy of biodiesel development in India”. International Journal of Renewable
Energy Research, vol 4 (3), pp. 246–254, 2014.
[3] S. Mani, T. Dhingra, “Policies to accelerate the growth of offshore wind energy sector in India”. Renewable and Sustainable Energy
Reviews, vol 24 (c), pp. 473–482, 2013.
[4] Ashwani Kumar, Kapil Kumar, Naresh Kaushik, Satyawati Sharma, Saroj Mishra, “Renewable energy in India: Current status and
future potentials”, Renewable and Sustainable Energy Reviews, vol 14 (8), pp 2434-2442, October 2010.
[5] R. Bakshi, Wind Energy in India, IEEE Power Engineering Review, 22(9), 2002, 16-18.
[6] Capacity of wind power, http://www.mnre.gov.in/mission-and-vision-2/achievements/ Accessed on October 9, 2019.
[7] List of States & their power generation capacity, http://data.gov.in/access-point-download, Accessed on October 9, 2019.
[8] https://powermin.nic.in/en/content/power-sector-glance-all-india
[9] List of largest Farms in India, www.thewindpower.net/windfarms Accessed on January 9, 2015.
[10] Mazharul Islam, Amir Fartaj, David S.-K Ting, “Current utilization and future prospects of emerging renewable energy applications
in Canada”, Renewableand Sustainable Energy Reviews, vol 8(6), pp 493- 519, December 2004.
[11] S.C. Bhattacharya, Chinmoy Jana, “Renewable energy in India: Historical developments and prospects”, Energy, vol 34, pp. 981-991,
August 2009.
[12] Indu R. Pillai, Rangan Banerjee, “Renewable energy in India: Status and potential”, Energy, vol 34(8), pp. 970-980, August 2009.
[13] Ministry of new and renewable energy, http://www.mnre.gov.in/ [accessed on 01.08.14].
[14] Ministry of New and Renewable Energy.
[15] Gisèle Schmid, “The development of renewable energy power in India: Which policies have been effective?”, Energy Policy, vol 45,
pp. 317-326, June 2012.
[16] http://www.mnre.gov.in/mission-and-vision2/avhievements Accessed on 01 Aug 2019.
[17] A.K. Singh, S. K Parida, “Evaluation of current status and future directions of wind energy in India”. Clean Technologies and
Environmental Policy, vol 15(4), pp. 643–655, December 2012.
[18] http://www.reegle.info/policy-and-regulatoryoverviews/in
[19] http://www.windpowerindia.com/index.php?option=com_content &view=article&id=66&Itemid=72
[20] http://www.cwet.tn.nic.in/html/information
[21] http://www.gwec.net/publications/countryreports/indian-wind-energy-outlook-2009
[22] http://www.thewindpower.net/country_windfarms_en_5_india.php
[23] A. Jagadeesh, “Wind energy development in Tamil Nadu and Andhra Pradesh, India Institutional dynamics and barriers — A case
study”, Energy Policy, Volume 28, pp.157-168, March 2000.
Manufacturing Technology and Research (An International Journal)| Volume 12 | Issue 1-2 | Month Jan-Dec (2019) ISSN: 0973-0281
Page | 54
Micro-pocket formation on DELRIN by optimizing the parameters of Abrasive Jet
Machining (AJM)
Vishvas Malik, Nilesh Ramdas, Varsha Singh, Bhaskar Kandpal, Brij Bhushan tyagi
Department of Mechanical Engineering, Inderprastha Engineering College, Gzb.
Abstract
Abrasive Jet Machining (AJM) is a unique process operates on compressed air alongwith SiC as a abrasive material. The machine works with the help of mach3 mill software as a controller. The machine operates under high ‘air pressure’. The process uses a narrow bore nozzle ranging from 0.5mm to 1.5mm depending upon the type of work to form a coherent, high velocity air jet, which has a pressure up to 100 PSI. Compared with other machining process, AJM is advantageous in various manners such as no thermal distortion(NTD), high flexibility ,high accuracy with great precision , high machining versatility and small machining force. The effects of processing parameters on machined surfaces which are analyzed and summarized in our study and basically we are focusing on nozzle stand-off distance(NSD). In this article our other target is to reduce the environmental effect i.e. reduction of polluting particles from abrasives. This study also intended to highlight and categorize the machining performance of the materials on machining with AJM.
Keywords: AJM; Mach3 mill; NTD; Nozzle Standoff Distance(NSD); Polluting particles.
1. Introduction
Abrasive Jet Machining (AJM) is a NON conventional machining process gained its importance in the last few decades The advancements in this technology have attracted various manufacturing sectors AJM makes use of the principles of abrasive jet machining. The process is most suitable for machining wide range of materials especially brittle materials like glass, ceramics, stone, composite materials, ferrous and non-ferrous alloys. The machined surface characteristics produced by AJM process depend on many factors like jet pressure, standoff distance, abrasive flow rate, traverse speed, properties of work materials, etc. The basic phenomenon of material removal in AJM is erosion caused due to the impact of abrasive particles. In this case, parameters such as jet traverse speed, jet pressure, stand-off distance and abrasive flow rate were investigated to study their effect on the milling process. AJM is one of the most suitable processes for machining or cutting high performance materials. In this work, we are focusing on nozzle stand-off distance (NSD) [3] and to reduce the environmental effect i.e. reduction of polluting particles from abrasives. This work examines the AJM milling behavior of DERLIN in terms of the surface properties of the milled component, like roughness, waviness and there plastic behaviour and behaviour which fills the gap between plastic and metal. Cutting at higher pressure is more efficient than at low pressure for the same power consumption. The increased pressure also reduces the cost due to reduction in abrasives usage and increased cutting speed. The study shows that the depth of cut increases with increase in jet pressure. The present study is carried to characterize machined pockets and optimizing the input parameters in AJM for pocket dimensions, cutting depth and surface roughness

Page | 55
1.1. Experimental Setup
All the experiments are carried on abrasive jet machine at Inderprastha Engineering College having a maximum pressure of 150-170 PSI. The work piece is 10 mm thick which gives the fixed parameters maintained during experimentation and selected factors.
Air Compressor/Gas propulsion system
The main purpose of air compressor is to supply clean and dry, high speed air or gas for
machining. Mostly air, carbon dioxide, nitrogen etc. are used as gas in gas propulsion
system. This system consists compressor, air filter and drier.
Abrasive Feeder
Abrasive feeder is employed to produce abrasive particles in mixture chamber. It is fed
through a sieve that vibrates at 50-60 cps (character per second) and mixture magnitude
relation is management by the vibration of the sieve and its amplitude.
Nozzle
A nozzle is a device designed to control the direction or characterstics of fluid flow
(especially to increase the velocity) as it exits or enters an enclosed chamber or pipe. A
nozzle is often a pipe or tube of varying cross sectional area and it can be used to direct
or modify the flow of a fluid (liquid or gas). These are usually made of tungsten carbide.
They are obtainable in each circular and square cross section. Its life is approximately 12-
300hrs.
Filter
It filters the gas before coming into the mechanical device and combining chamber.
Hopper
Hopper is employed for feeding the abrasive powder.
Pressure gauges and flow regulators
These are used for the management of pressure and regulate the rate of abrasive jet.
Vibrator
A vibrator is used to control the feed of the abrasive powder. The abrasive powder and
the compressed air are thoroughly mixed in the chamber. The pressure of this mixture is
regulated and sent to nozzle.
Fig.1 Components of AJM

Page | 56
1.2. Tables
Table 1: Various parameters for AJM.
1.3 Result and discussion
a) For higher precision work higher pressure and lower stand off distance are adopted to
attain a higher accuracy and penetration rate for AJM.In our case pressure is between
150-170PSI and stand off distance is 0.25-15mm.
Particulars
Values
Medium
Air, CO2, N2
Abrasive
Silica sand, SiC, Al2O3 (of size 90-
150 microns)
Flow rate of Abrasive
3 to 20 gram/min
Velocity
150-300 m/min
Pressure
150-170 psi
Nozzle size
2-5 mm
Material of
Nozzle
Mild steel
Nozzle life
12-300 hrs
Standoff Distance
0.25-15 mm (8 mm generally)
Work material
Derlin
Part application
Drilling, cutting, deburring, etching, Cleaning
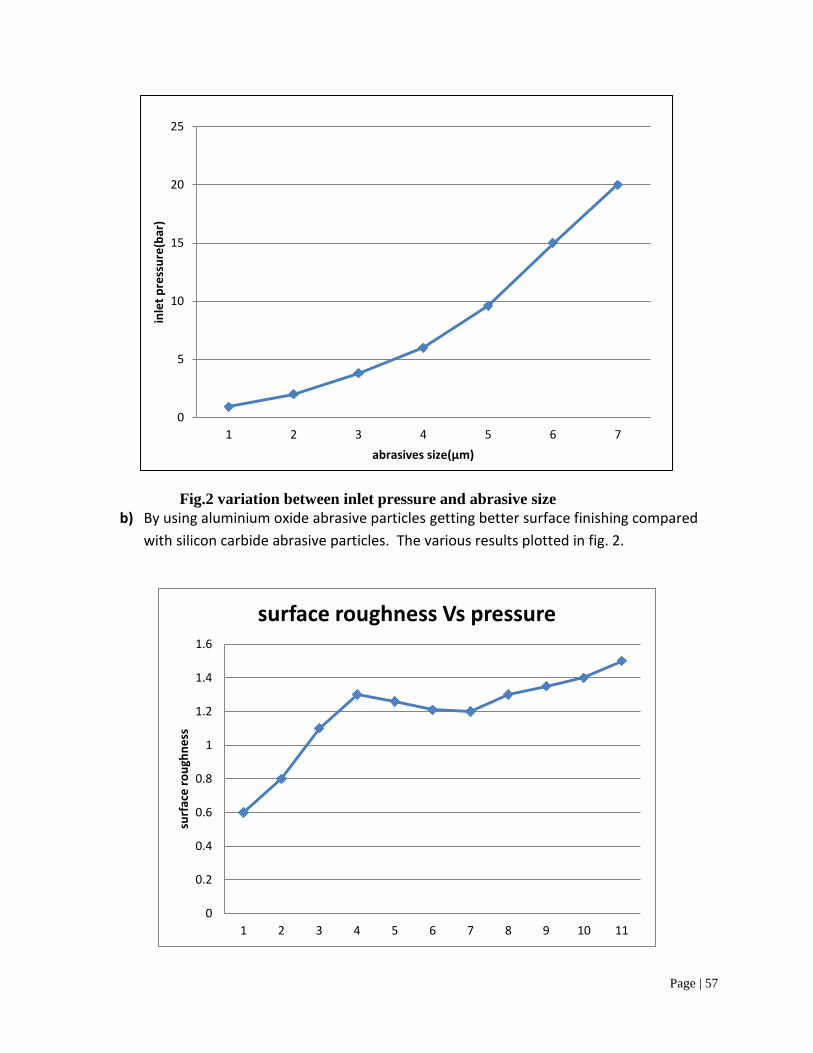
Page | 57
Fig.2 variation between inlet pressure and abrasive size
b) By using aluminium oxide abrasive particles getting better surface finishing compared
with silicon carbide abrasive particles. The various results plotted in fig. 2.
0
5
10
15
20
25
1 2 3 4 5 6 7
inle
t p
ress
ure
(bar
)
abrasives size(µm)
0
0.2
0.4
0.6
0.8
1
1.2
1.4
1.6
1 2 3 4 5 6 7 8 9 10 11
surf
ace
ro
ugh
ne
ss
surface roughness Vs pressure

Page | 58
Fig.3 The impact of pressure variation on surface roughness.
c) The higher standoff distance is preferable where material removal is prime importance.
d) MRR increase with an increase in abrasive jet flow rate, mixing ratio, internal pressure,
standoff distance under certain condition.
References:- [1] D. Arola, M. Ramulu, Material removal in abrasive waterjet machining of metals Surface integrity and texture,
Wear 210 (1–2) (1997) 50–58.
[2] Ahmet Hascalik, Ulas Caydas, Hakan Gurun, Mater. Design 28 (6) (2007) 1953–1957.
[3] Andreas W. Momber, in Hydrodemolition of Concrete Surfaces and Reinforced Concrete, 2005
[4] S.J. Ebeid, M.R.A. Atia, M.M. Sayed, Effect of process parameters on abrasivewater jet plain milling, in:
Technology and Maritime Transport (AASTMT), Sheraton, Cairo, Egypt, 2014.
[5]Author links open overlay panel AbhishekKumar Somashekhar S.Hiremath Machining of Micro-holes on
Sodalime Glass Using Developed Micro-abrasive Jet Machine (μ-AJM) pp 1-8

Manufacturing Technology and Research (An International Journal)| Volume 12 | Issue 1-2 | Month Jan-Dec (2019) ISSN: 0973-0281
Page | 59
Utilization of Reverse Supply Chain and its Obscurity in Industries
Bhupender Singh1, Sanjeev Kumar
1
1Mechanical Engineering Department, JC Bose University of Science and Technology, YMCA, Faridabad, Haryana
Abstract
The reverse supply chain is the series of consequence required to retrieve the product from the customer in the
procedure of abode, reuse or resell it either product is used or unused. This paper deals with the reverse
supply chain management along several steps involved in during whole process and problems faced while
implementation. Attributes effecting reverse logistics are identified based on the literature review and
assistances for identification of barriers, tools, scope and functional area. Thus an endeavour has been made for
reverse logistics importance with respect to Indian scenario in automobile sector in order to find out the driving
forces for reverse logistics during successful implementation in industries.
Keywords: Reverse Supply Chain; Benchmarking; Logistics; Industries
Introduction:
Social and environmental sustainability increasing influence economic policy decisions and
have an impact on economic performance. In such context, consumers and legislations forces
industries to consider their responsibility towards environment therefore to consider
environmental aspects at different level within the organization and supply chain activities.
Industries must design system to reduce their ecological footprint (Povoa et al., 2007).
Reverse logistics is a complex process and need dedicated involvement from the top
management. Industries are giving less attention towards reverse logistics because it involves
physical process that often requires a series of intricate multi layered steps which involve
generating returns authorization, printing a label, determining appropriate product handling,
disposition and arranging transportation (Norek, 2003). Meade et al., (2007) classifies the
factors that led to increase interest in reverse supply chain into two groups: environmental
factors and business factors. Environmental factors include impact of products on
environment, environmental legislations and environmental concern among customers.
In earliest days reverse supply chain (RSC) can be defined as reverse flow of goods (Murphy
and Poist 1989). Rogers and lembke (1999) defined reverse supply chain as the combination
of processes like planning, implementing, and controlling the efficient cost effective flow of
raw materials in process industry, finished goods and related information from the point of
consumption to the point of origin for the purpose of recapturing the value or proper disposal.
Uncertainty in supply, quality and cost benefit relation with RSC is studied by (Kishore and
Gupta, 2003). The flow of product returns is turning into a major concern for several makers
(Blackburn et al., 2004). RSC has considerable potential of value recovery from used
products. It is field of importance due to legislations and directives, consumer awareness,
environmental concerns, corporate social responsibility and sustainable competitiveness.
(Castell et al.,2004). Many organizations are benefited by RSC like Dell, Xerox, Canon,
General Motors (Ashley, 1993; Bergstrom, 1993; Maxie, 1994). This helps in tackling
environmental issues like used product recycling, waste disposal, and industry induced
pollution. In this paper author has discussed about the factors affecting RSC in automobile
sector in India, problems facing by automobile sector, what processes can be applied to
overcome the difficulties, identification of the success factors and how these strategies can be

Manufacturing Technology and Research (An International Journal)| Volume 12 | Issue 1-2 | Month Jan-Dec (2019) ISSN: 0973-0281
Page | 60
implemented.
Reverse Supply Chain System
In RSC process, set of steps are to be followed in order to collect the used products. This
starts with acquisition of products from the customers after acquisition of used products they
have to be transported to facilities for inspecting sorting and disposition. After assessing the
condition of returned products most profitable decision (reuse, repair, remanufacturing,
recycling, cannibalization and disposition) is made for its use after that product is supplied
for distribution and sales.
Product Acquisition Product acquisition is defined as the process of obtaining used products from the customers.
As per the experts it is the key for a profitable supply chain. Quality, quantity and timing of
product returns need to be cautiously managed. Industries must have a good relationship with
retailers and distributors (Domgała and Wolniak, 2013). Organizations can get used products
from three different sources: from forward supply chain (defective or damaged products),
from RSC called market driven system or from waste as discarded products (Guide and
Wassenhove, 2001).
Product return and product recall are the examples of acquisition from forward supply chain.
Products are generally recalled by the organizations. It is a request to return a product after
the discovery of safety issues or product defects that might endanger the consumer or put the
maker at risk. Collection methods depend up on cost structure and collection quantity
decisions (Atasu et al., 2013).
Transportation
Reverse logistics provide alternate use of resources that is cost effective and environmental
friendly by increasing product life cycle (Melbin 1995). Both environmental and economic
goals can be achieved by reverse logistics. But there is no best method available for
transportation of used products from their owners to organizations. Factors affecting reverse
logistics are strategic factors like strategic costs, overall quality, customer service,
environmental concern and legislative concerns and the operational factors like cost benefit
analysis, transportation, warehousing, supply management, remanufacturing, recycling and
packaging (Dowlatshahi, 2000). Thus industries have to quickly transport the product in
order its value will not decay with time.
Inspection and Disposition
In this process testing, sorting, classification of used products is done in order to check
whether they are good for any reconditioning process or they are to be disposed. A
preliminary sorting first occurs upon reception of the returned product by the industry, which
have to examine the item in view of deciding how to treat. The next task is to undertake a

Manufacturing Technology and Research (An International Journal)| Volume 12 | Issue 1-2 | Month Jan-Dec (2019) ISSN: 0973-0281
Page | 61
cross-verification of the returned item with the return authorization given at gatekeeping. Any
discrepancies are corrected in order to control the activity properly. Return products can be
commercial returns, service returns, distribution returns or end of life returns. Transportation,
disposal, disassembly cost and quality of returned product decides sorting of products before
disassembly and remanufacturing (Zikopoulos and Tagaras, 2008). This can be a time
consuming task so it can be automated with the use of technologies like sensors, bar codes.
Reconditioning
It’s the value addition process to used product so that it can be used again in the forward
supply chain. Industries can opt for options that are broadly classified into three categories
that are reuse, recycling, remanufacturing. In reuse, returned product can be used more than
once after cleaning or reprocessing like container, pallet and bottle. In recycling material is
recovered without conserving any product structure (K. Kim et al., 2006) example metal,
glass, paper and plastic. Remanufacturing brings the product back into an as good as new
condition by carrying out the necessary disassembly, overhaul and replacement operations for
example electronic machine, toner cartridge and automobile part. Different industries have
different type of manufacturing system. There are different processes available for different
type of products, but five common alternatives discussed are reuse, repair, remanufacturing,
recycling and disposal (Mutha and Pokharel, 2009).
Distribution and sales
The reconditioned products are sent back to the forward supply chain. Industries have to
search out for the potential customers of remanufactured products for example, industries
should search out for the chances of selling remanufactured products at low cost who cannot
afford new product. Industries should search out for the opportunities of fitting refurbished
products into their market policy for example smartphone manufacturers used to sell
refurbished phones on lesser cost. In reverse logistics system, decisions for locating the
different sites are taken that involved; the gatekeeping, the sorting, and the treatment are
influenced strongly by logistical considerations, such as transportation cost, customs, etc. The
economic aspects of the process include transportation costs, packaging material, space for
preparing orders, and shipping. These costs are varying which depend on the volume of
products and the transportation mode used.
Industrial Policies
Restrictive industrial policies are an important barrier to the reverse logistics (Rogers and
Lembke, 1998). The lack of the importance of the reverse logistics and the management
inattention are related to the policies followed by the industries. Industries want to create a
brand image to the customers. They do not want to compromise on the end-product quality by
using the returned products. Thus, the policies developed by industries of producing only
virgin products also have a major effect of not handling the returned products and to recover
the hidden secondary value from the returns. Due to the advent of extended producer
responsibility (Lindhqvist, 2000) many industries have started to integrate the recovery
options for the products into their supply chain. There seems to be a paradigm shift by the
industries to change their rigid policies to incorporate the returns of the product to recover
value economically that could give them edge over their competitors.

Manufacturing Technology and Research (An International Journal)| Volume 12 | Issue 1-2 | Month Jan-Dec (2019) ISSN: 0973-0281
Page | 62
Conclusion
Reverse supply chain is still unexplored area with respect to current Indian context. There are
various loop holes in reverse logistics system that consider every area and act as the barriers
while implementation. Lack of knowledge, unawareness of customers, lack of top
management commitment, underdeveloped technologies, high capital investment leads to
ineffective reverse supply chain management are the main barriers for reverse supply chain.
This study discussed about barriers in effective reverse logistics system, strategies adopted in
different literatures, the critical factors affecting disposition decisions and various process
while applying reverse supply chain management system.
References
1. Agrawal S., Singh R.K, Murtaza Q. (2016) Outsourcing decisions in reverse logistics: sustainable
balanced scorecard and graph theoretic approach. Resour. Conserv. Recycl 108, p 41-53.
2. Barbosa-Povoa, A., Salema, M., Novais. A. (2007) Design and planning of closed-loop supply chains.
In: Papageorgiou, L., Georgiadis, M.C. (Eds.), Supply Chain Optimization in Supply Chain
Optimization, vol. 7. Wiley-VCH, Germany, p187–218.
3. Blanas G., Koukoumialos S., Kylindri S., (2012) Reverse logistics strategic antinomies: the case of the
automotive sector. Int. Journal of Business Science and Applied Management, Volume 7, Issue 3.
4. Bloemhof J, van Nunen J. (2005) Integration of environmental management and SCM. ERIM Report
Series Research in Management; ERS-2005-030-LIS.
5. Boks C, Nilsson J, Masui K, Suzuki K, Rose C, Lee B. An international comparison of product end-of-
life scenarios and legislation for consumer electronics. In: Proceedings from the IEEE symposium on
electronics and the environment; 1998. P 19–24.
6. Chaves, G.L.D., & Alcântara, R.L. (2006). Reverse Logistics as an activity generator of competitive
advantage for refrigerated food supply chain. Symposium of Production Engineering.
7. Chunguang Bai, Joseph Sarkis (2013). Flexibility in reverse logistics: a framework and evaluation
approach. Journal of Cleaner Production 47 p 306-318.
8. Cooper M. Logistics in the decade of the 1990s. In: Robeson J, Capacino W, Howe E, Editors. The
Logistics Handbook. New York, USA: The Free Press; 1994.
9. Kumar S. and Yamaoka T. (2007) System dynamics study of the Japanese automotive industry closed
loop supply chain. Journal of Manufacturing Technology Management Vol. 18 No. 2, p 115-138.
10. Landers T.L., M.H. Cole, B. Walker, R.W. Kirk (2000). The virtual warehousing concept, Transp. Res.
Part E Logist. Trans. Rev. 36 (2) p 115-125.
11. Lee D.H. and Dong M., (2008) “A heuristic approach to logistics network design for end-of-lease
computer products recovery,” Transportation Research Part E, vol. 44, no. 3, p 455–474.
12. R. Cruz-Rivera and J. Ertel. (2009) “Reverse logistics network design for the collection of end-of-life
vehicles in Mexico,” European Journal of Operational Research, vol. 196, no3, p 930–939.

Manufacturing Technology and Research (An International Journal)| Volume 12 | Issue 1-2 | Month Jan-Dec (2019) ISSN: 0973-0281
Page | 63
13. Rao RV (2006). A material selection model using graph theory and matrix approach. Material Science
Eng A 431(1-2), p 248-255.
14. Chauhan S and Singh B (2016),“A Review on concept of Reverse Supply Chain in Industries,”

Manufacturing Technology and Research (An International Journal)| Volume 12 | Issue 1-2 | Month Jan-Dec (2019) ISSN: 0973-0281
Page | 64
An aggregate methodology of process re engineering with the reverse logistics
coordination in an OEM UNIT
Neeraj Kumar1, Rajesh Kumar Patel
2, Vivek Kumar Pathak
3
KIET group of institutions, Ghaziabad 201206, India
Abstract
Characteristic and financial issues stake significant effects on Reverse designing (Reengineering). These are a
reflection to shape one of the advancing establishments of the legitimate production network. Reverse Logistics is a
trick- unwavering directorial ingenuity, essentially reconsider and reform business training with the objective of
completing reasonable stage on ward in quality, receptivity, outflow, customer contentment and other serious course
performance measures. This investigation contributing an assessment of figuring out dream cantering upon, the
utilization of instructive methods to give a move away from direct successive work relationship towards equal work
and multi disciplinary collaboration.
Keywords: Introduction, development cycle of product, methodology, work structure, results & discussion,
references
1. Introduction
It is an expediently developing order, which wraps countless activities. While regular designing believers building
ideas and models into genuine segments, however in figuring out genuine parts are changed into designing models
and ideas favored situation of the wide-running usage of computer assisted structures need not be rehashed now.
BPR was first exemplified by Michael Hammer in quite a while fundamental article 'Re-designing work: don't
mechanize, pulverize. [1]
1.1 Reengineering
The procedure is an organized, estimated set of exercises intended to create a predetermined yield for a specific
client or market. It suggests a solid accentuation on how work is done inside an association.[2]
Elements
a. Tasks Reformation: Join littler procedure sub-errands and sub-exercises into bigger, incorporated units and bundles. The administration
ought to decrease the quantity of components, sections and ingredients in articles and procedures just diminish the
quantity of parts in items and procedures.[13]
b. Workforce Reformation: It permits the labourers to perform and co-ordinate bigger as opposed to littler segments of the procedure. The
administration ought to energize multi usefulness, work turn, de-specialization and coordinated procedure structure.
c. Information Reformation: Reformation, the capacity to arrange activities deliberately which is particular, atomized, and decrease to a machine
extremity who can't facilitate the activity, however, just performs single and basic and orders. There requirement for
a coordinated as opposed to the particular instruction. [3]
1.2 Reverse Logistics “The way toward arranging, executing and controlling the productive, practical progression of crude materials, in-
process stock, completed merchandise, and related data from the purpose of birthplace to the point of utilization to
fit in with client prerequisites.” [5]
Reverse Logistics/supply chain, the return business actions because of manufactured goods recovery, overflow form
a clogged loop supply chain. The evidence achievements of RSCM premise on proportions of the two makers and
supporters. [11] The time makers require delivering items that are simple for disassembling, reprocess, reuse and
* Neeraj Kumar. Tel.: +91-9999439021

Page | 65
duplicating paid to the law of environmental indemnity. On the opposite side no of clients helping society assurance
by conveying their pre-owned items to assortment focuses is increasing. [5] As indicated by the overview, the all-out
expense that happened in RSCM is the exceptionally gigantic sum, and to diminish it, high use of assortment
focuses, choice of proper area are basic issues. [3] Even more unequivocally, figuring out coordination is the path
toward moving product from their average last objective with the ultimate objective of getting worth, or fitting
expulsion. Re fabricating and redoing practices furthermore may be associated with the significance of converse
reengineering. [12] It is more than reusing compartments and reusing packaging materials. Refreshing packaging to
use less material, or reducing the imperativeness and pollution from transportation are noteworthy activities,
anyway, they might be better placed in the space of "green logistics" [14]
1.3. Reverse Logistics Management:
Procedure advancement
Information support systems
Level connections
Execution estimation
Transportation issues
Transportation issues
Warehousing issues
1.4 Company Profile
The organization is a main producer of automotive brakes pads in India, using
asbestos free technology, began its production as of late in 1998. The organization is persistently providing its
grinding material to exceptionally serious European market. The organization items are very much acknowledged in
the worldwide market due to their quality, seriousness, and conveyance duty. The organization is a completely
possessed auxiliary of Midwest-Air Technologies (MAT), situated in USA. The organization's complete labor is
1.5k and turnover is Rs 220 Billion P.A and holds the enormous use of hydraulic and mechanical presses for
production.
2. Maturity Cycle of Product
Back plate incoming
Powder mixing
Hydraulic pressing
Compression & molding
Curing and powder covering
Grinding and wrapping up
Shim fitment
Pressing and riveting
Final item (Disc Brake Pads)

Page | 66
3. Methodology actualized in plant
Initiation: - Firstly an official agreement on break however business objectives and goals that connote the
raison of this re-designing venture. This stage likewise unmistakably builds up the fundamental linkage
between the advancement business objectives and the Re-designing procedure execution parameters in
regards to the calendar, hazard, and hierarchical change. Additionally unites the re-building group and
brings from the underlying change the executives plan. [7]
Recognition: Builds up a client situated replica of business, recognizes key worth included procedures and
maps associations, assets and volumes to explicit procedures and needs and suggests explicit procedures as
the most elevated effect Re-designing targets.
Visualization: Arches to get through circumstances in the procedures, examination and understanding
them as "vision" of radical change.[8]
Elucidation: Separated into two about equal sub-stages, one to build up the specialized structure to execute
the dreams and the "societal" map which arranges and structures the HR that will staff the restoration
process.
Renovation: Understands the procedure vision, propelling, pilot and full creation adaptations to the new
procedures. Along these lines, this model gives pretty much a direct procedure of undertaking re-designing
activity. [9]
4. Work Structure
Complains Course Counter Measure Improvements
Spots Pressing Unknown material catching, underneath coating formation.
onslaught of punch frequently
Porosity Pressing Fewer mass of face powder blend, unfortunate temperature
accurate scenery of balance, sufficient information of machine constraint to operators
Cracks Pressing Groove unclear, unacceptable treatment
Guarantee correct onslaught of the groove earlier than the operation
Green pads/rusted pads Curing occurrence of moistures at plate face, unacceptable curing
assurance moisture-free plate earlier than curing, inspection of process parameters
Low thickness Grinding indecent recipe assortment, not having knowledge of process parameters
Provide guidance to
machinist of recipe
and parameters
assortment
Setup failure Grinding Operator negligence , unskilled operator
Give all necessary
instructions to
operators before the
operation
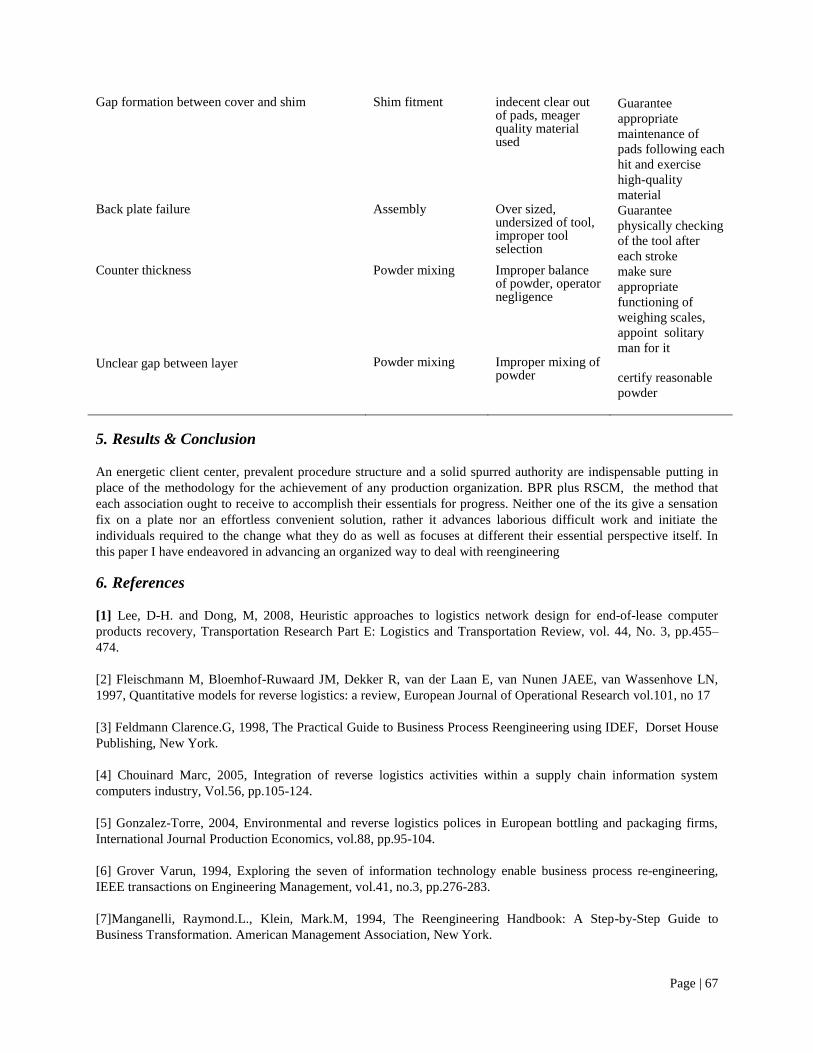
Page | 67
Gap formation between cover and shim Shim fitment indecent clear out of pads, meager quality material used
Guarantee
appropriate
maintenance of
pads following each
hit and exercise
high-quality
material Back plate failure Assembly Over sized,
undersized of tool, improper tool selection
Guarantee
physically checking
of the tool after
each stroke Counter thickness Powder mixing Improper balance
of powder, operator negligence
make sure
appropriate
functioning of
weighing scales,
appoint solitary
man for it
Unclear gap between layer Powder mixing Improper mixing of powder certify reasonable
powder
5. Results & Conclusion
An energetic client center, prevalent procedure structure and a solid spurred authority are indispensable putting in
place of the methodology for the achievement of any production organization. BPR plus RSCM, the method that
each association ought to receive to accomplish their essentials for progress. Neither one of the its give a sensation
fix on a plate nor an effortless convenient solution, rather it advances laborious difficult work and initiate the
individuals required to the change what they do as well as focuses at different their essential perspective itself. In
this paper I have endeavored in advancing an organized way to deal with reengineering
6. References
[1] Lee, D-H. and Dong, M, 2008, Heuristic approaches to logistics network design for end-of-lease computer
products recovery, Transportation Research Part E: Logistics and Transportation Review, vol. 44, No. 3, pp.455–
474.
[2] Fleischmann M, Bloemhof-Ruwaard JM, Dekker R, van der Laan E, van Nunen JAEE, van Wassenhove LN,
1997, Quantitative models for reverse logistics: a review, European Journal of Operational Research vol.101, no 17
[3] Feldmann Clarence.G, 1998, The Practical Guide to Business Process Reengineering using IDEF, Dorset House
Publishing, New York.
[4] Chouinard Marc, 2005, Integration of reverse logistics activities within a supply chain information system
computers industry, Vol.56, pp.105-124.
[5] Gonzalez-Torre, 2004, Environmental and reverse logistics polices in European bottling and packaging firms,
International Journal Production Economics, vol.88, pp.95-104.
[6] Grover Varun, 1994, Exploring the seven of information technology enable business process re-engineering,
IEEE transactions on Engineering Management, vol.41, no.3, pp.276-283.
[7]Manganelli, Raymond.L., Klein, Mark.M, 1994, The Reengineering Handbook: A Step-by-Step Guide to
Business Transformation. American Management Association, New York.

Page | 68
[8] Subramanian Muthu, Larry Whitman, and S Hossein Cheraghi, 1999, 4th Annual international conference on
industrial engineering theory, applications and practice, San Antonio, Texas, USA, pp 17-20.
[9] Mayer, Richard J, Dewitte, Paula.S, 1998, Delivering results: evolving BPR from Art to Engineering, pp 83-129
10] Kumar Sanjay, 2007, Optimization of material, Industrial Engineering Journal, vol.36, no.8, pp.32-34.
[11] Jeremy F. Shapiro, 2004, Challenges of strategic supply chain planning and modeling, Computers and
Chemical Engineering, vol.28, pp. 855–861.
[12] Korpela Jukka, 2001, An analytic approach to supply chain development, International Journal Production
Economics, vol.71, pp.145-155.
[13] Grover Varun, 1994, Exploring the seven of information technology enable business process re-engineering,
IEEE transactions on Engineering Management, vol.41, No.3, pp.276-283.
[14] Kumar Arvind, Gupt P and Garg S K, 2012, Perspectives in reverse supply chain management, a state of the art
literature review,Jordan Journal of Mechanical & Industrial Engiineering, vol 6, issue 1,pp. 87-112.