5q1results2014/1 - lenovo
TRANSCRIPT

2014/15 Q1 Results
2
This presentation contains “forward-looking statements” which are statements that refer to expectations and plans for the future and include, without limitation, statements regarding Lenovo’s future results of operations, financial condition or business prospects as well as other statements based on projections, estimates and assumptions. In some cases, these statements can be identified by terms such as "expect," "intend," "plan," "believe," "estimate," "may," "will," "should" and comparable words (including the negative of such words). These forward-looking statements, reflect the current expectations and plans of the directors and management of Lenovo, which may not materialize or may change. Many risks, uncertainties and other factors, some of which are unpredictable and beyond Lenovo’s control, could affect the matters discussed in these forward-looking statements. These factors include, without limitation, economic and business conditions globally and in the countries where we operate, Lenovo’s ability to predict and respond quickly to market developments, consumer demand, pricing trends and competition; changes in applicable laws and regulations (including applicable tax and tariff rates). Any variance from the expectations or plans on which these forward-looking statements are based could cause Lenovo’s actual results or actions to differ materially from those expressed or implied in these statements. These forward-looking statements are not guarantees of future performance and you are cautioned not to place undue reliance on these statements. Lenovo undertakes no obligation to update any forward-looking statements in this presentation, whether as a result of new information or any subsequent change, development or event. All forward-looking statements in this presentation are qualified by reference to this paragraph.
Forward Looking Statement
2014 LENOVO INTERNAL. ALL RIGHTS RESERVED.
Yuanqing Yang
Chairman and CEO
4
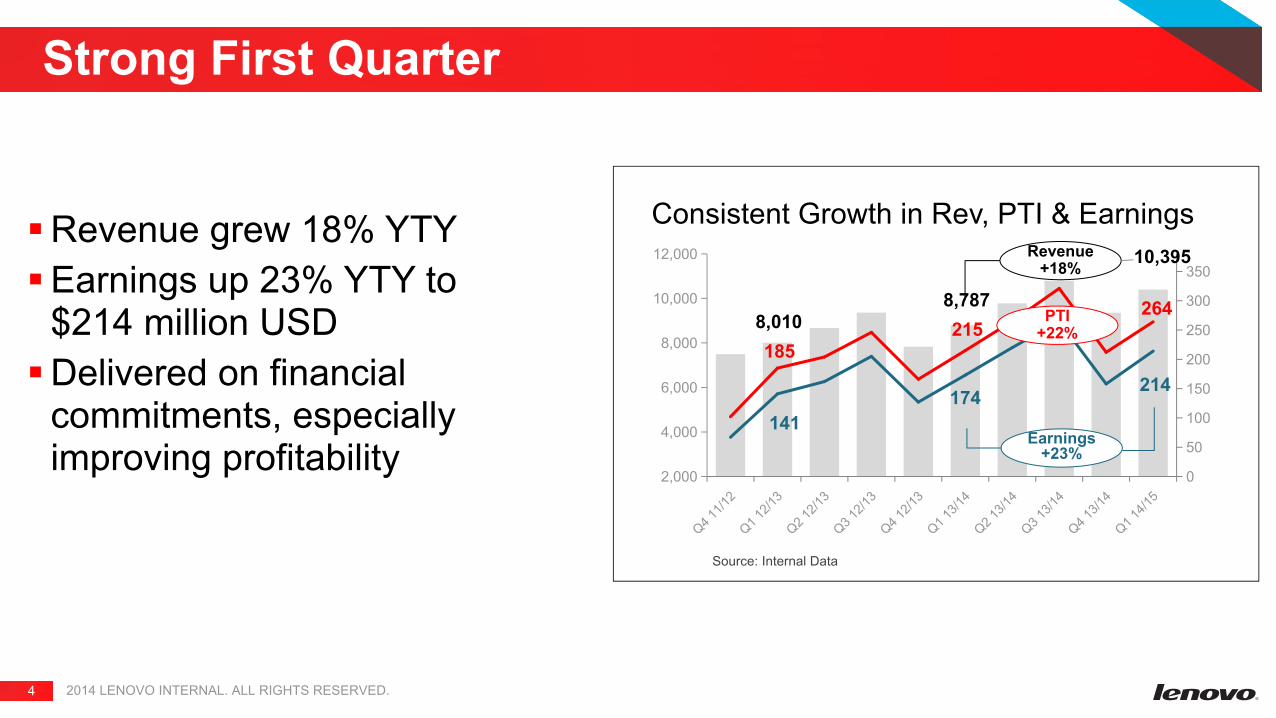
Strong First Quarter
§Revenue grew 18% YTY§Earnings up 23% YTY to
$214 million USD§Delivered on financial
commitments, especially improving profitability
Source: Internal Data
Consistent Growth in Rev, PTI & Earnings
8,010 8,787
10,395
141174 214
185215
264
0
50
100
150
200
250
300
350
2,000
4,000
6,000
8,000
10,000
12,000
Q4 11/1
2
Q1 12/1
3
Q2 12/1
3
Q3 12/1
3
Q4 12/1
3
Q1 13/1
4
Q2 13/1
4
Q3 13/1
4
Q4 13/1
4
Q1 14/1
5
Revenue+18%
Earnings+23%
PTI+22%
2014 LENOVO INTERNAL. ALL RIGHTS RESERVED.
5
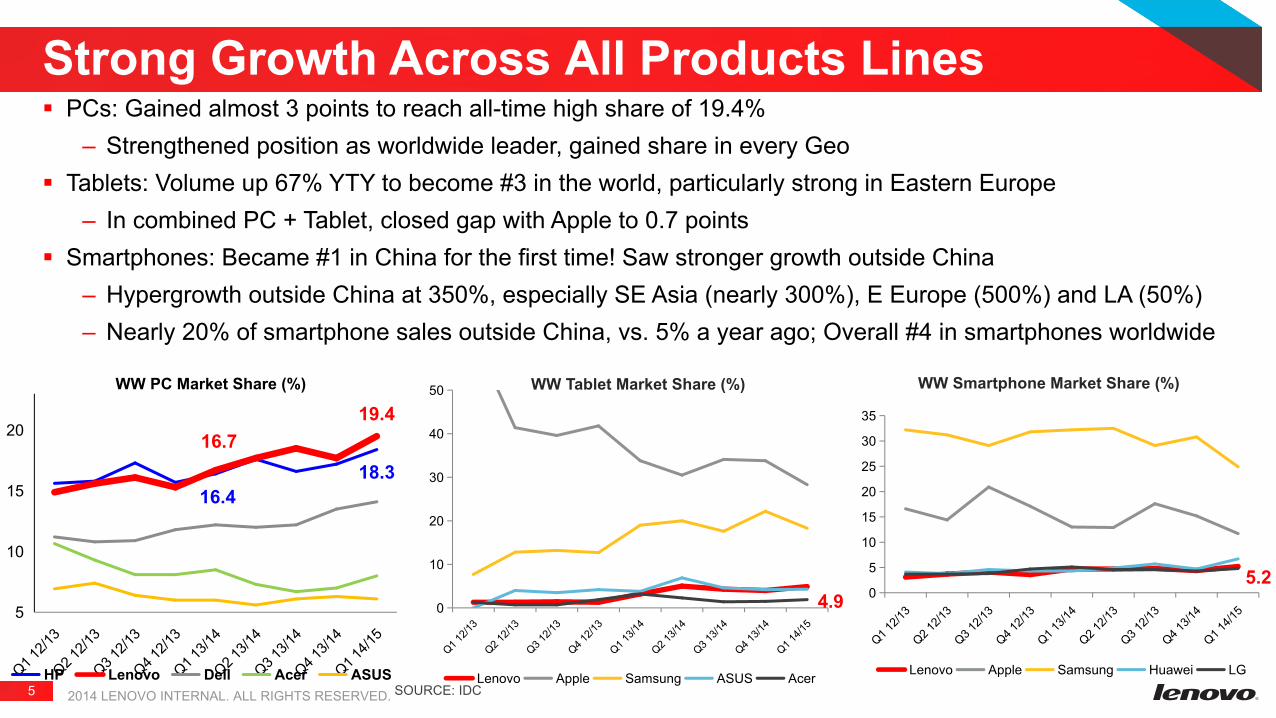
§ PCs: Gained almost 3 points to reach all-time high share of 19.4%– Strengthened position as worldwide leader, gained share in every Geo
§ Tablets: Volume up 67% YTY to become #3 in the world, particularly strong in Eastern Europe– In combined PC + Tablet, closed gap with Apple to 0.7 points
§ Smartphones: Became #1 in China for the first time! Saw stronger growth outside China– Hypergrowth outside China at 350%, especially SE Asia (nearly 300%), E Europe (500%) and LA (50%)– Nearly 20% of smartphone sales outside China, vs. 5% a year ago; Overall #4 in smartphones worldwide
Strong Growth Across All Products Lines
WW Tablet Market Share (%) WW Smartphone Market Share (%)
SOURCE: IDC
16.418.3
16.719.4
5
10
15
20
Q1 12/1
3
Q2 12/1
3
Q3 12/1
3
Q4 12/1
3
Q1 13/1
4
Q2 13/1
4
Q3 13/1
4
Q4 13/1
4
Q1 14/1
5
WW PC Market Share (%)
HP Lenovo Dell Acer ASUS
0
10
20
30
40
50
Q1 12/1
3
Q2 12/1
3
Q3 12/1
3
Q4 12/1
3
Q1 13/1
4
Q2 13/1
4
Q3 13/1
4
Q4 13/1
4
Q1 14/1
5
Lenovo Apple Samsung ASUS Acer
0
5
10
15
20
25
30
35
Q1 12/1
3
Q2 12/1
3
Q3 12/1
3
Q4 12/1
3
Q1 13/1
4
Q2 12/1
3
Q3 12/1
3
Q4 13/1
4
Q1 14/1
5
Lenovo Apple Samsung Huawei LG
5.24.9
2014 LENOVO INTERNAL. ALL RIGHTS RESERVED.
6
13.218.0
Q1 FY14 Q1FY15
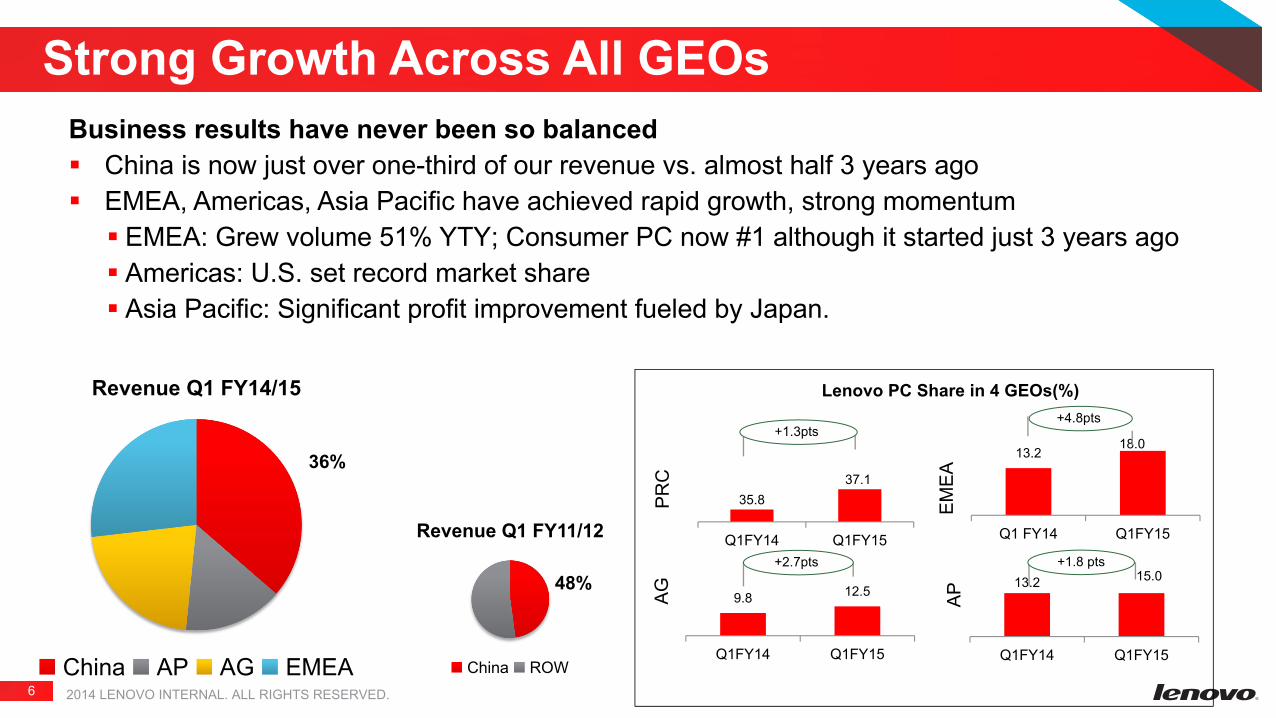
Strong Growth Across All GEOsBusiness results have never been so balanced§ China is now just over one-third of our revenue vs. almost half 3 years ago§ EMEA, Americas, Asia Pacific have achieved rapid growth, strong momentum§ EMEA: Grew volume 51% YTY; Consumer PC now #1 although it started just 3 years ago§ Americas: U.S. set record market share§ Asia Pacific: Significant profit improvement fueled by Japan.
9.8 12.5
Q1FY14 Q1FY15
13.2 15.0
Q1FY14 Q1FY15
+1.3pts +4.8pts
+2.7pts +1.8 pts
PRC
AG
EMEA
AP
Lenovo PC Share in 4 GEOs(%)
35.837.1
Q1FY14 Q1FY15
Revenue Q1 FY14/15
China AP AG EMEA
36%
Revenue Q1 FY11/12
China ROW
48%
2014 LENOVO INTERNAL. ALL RIGHTS RESERVED.
7
IBM, Motorola Acquisitions
2014 LENOVO INTERNAL. ALL RIGHTS RESERVED.
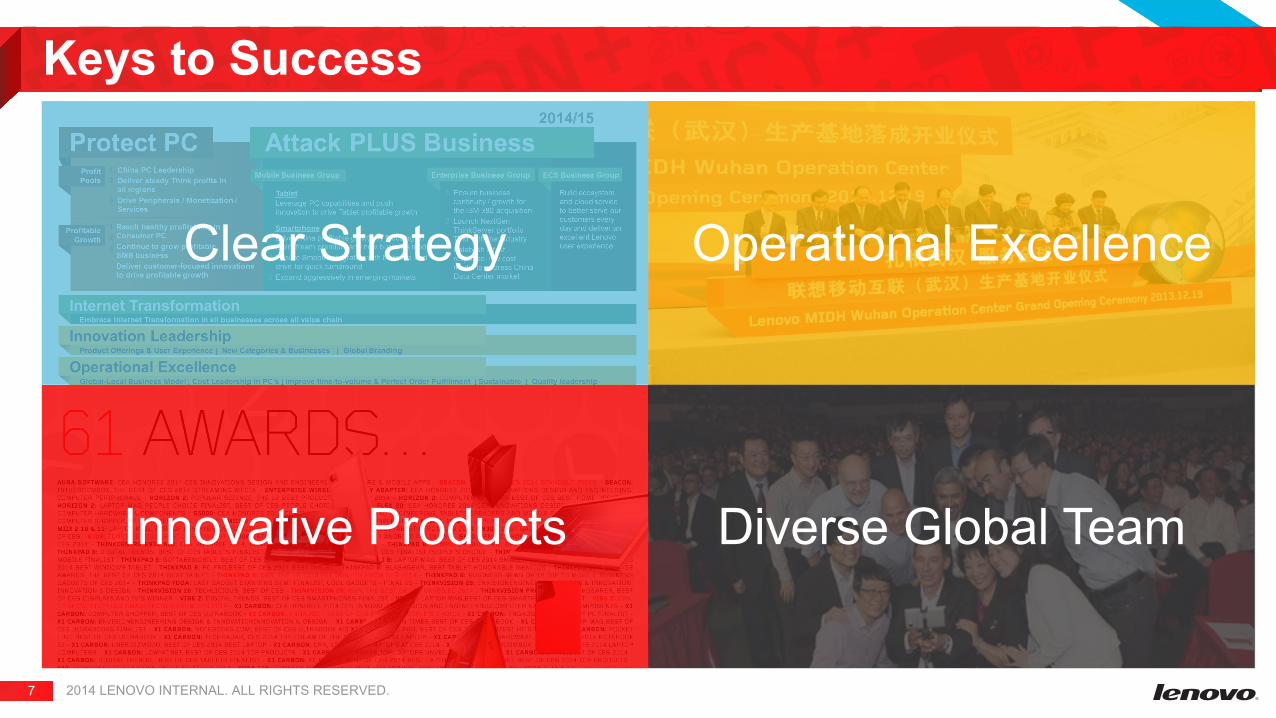
Keys to Success
Innovative Products
Clear Strategy Operational Excellence
Diverse Global Team
8
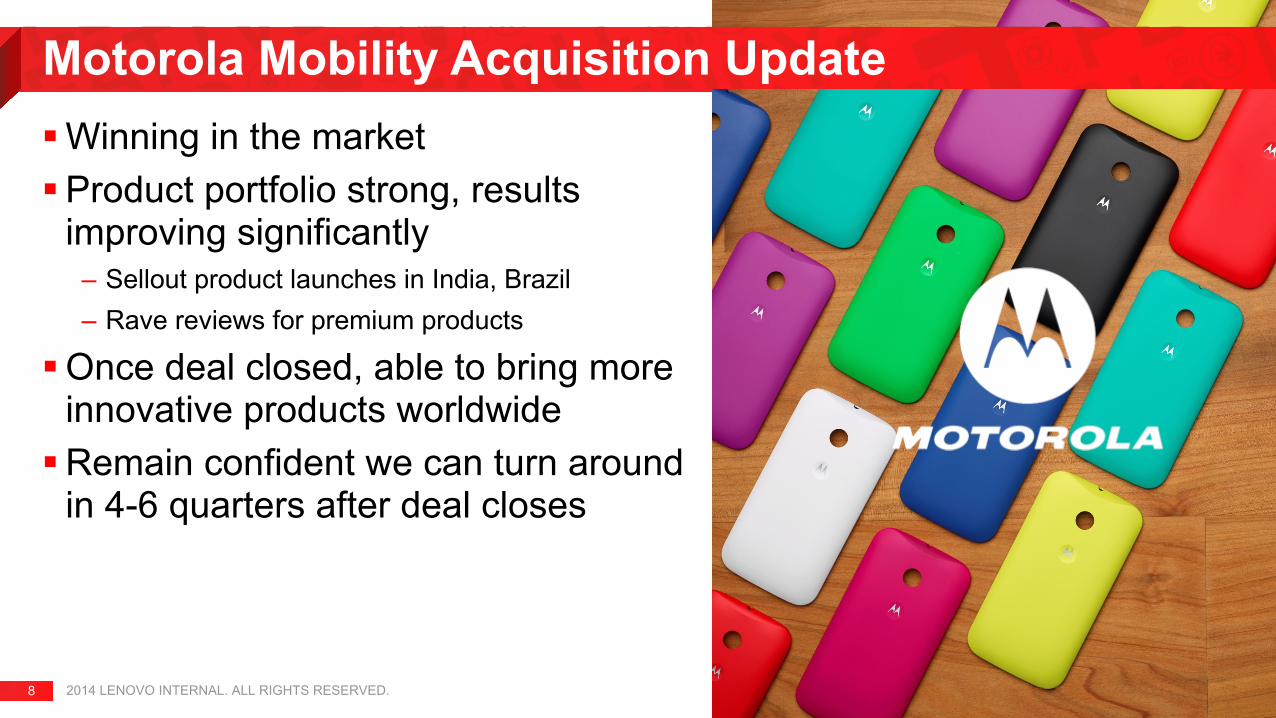
§Winning in the market§Product portfolio strong, results
improving significantly– Sellout product launches in India, Brazil– Rave reviews for premium products
§Once deal closed, able to bring more innovative products worldwide§Remain confident we can turn around
in 4-6 quarters after deal closes
IBM, Motorola Acquisitions
2014 LENOVO INTERNAL. ALL RIGHTS RESERVED.
Motorola Mobility Acquisition Update
9
§Business stabilized in last quarter§Achieved growth in China§Once deal closed, believe we can build
a $5 billion enterprise business, with higher margins than PCs, in one year
2014 LENOVO INTERNAL. ALL RIGHTS RESERVED.
IBM x86 Server Acquisition Update

10 2014 LENOVO
Focus on Next Round of Growth
2014 LENOVO INTERNAL. ALL RIGHTS RESERVED.
Smartphone: • Leverage shift from Premium to mainstream/entry• Solidify China position• Be more aggressive in emerging markets• Will be a stronger global player with the close of Motorola deal
Tablets: • Market squeezed between convertible PC, Phablet• May split into niche PC focusing on media
consumption (8-inch/larger, some with optional attached keyboard) or big-screen smartphones
• We are strong in both parts, will launch new generation of products to attack both categories
PCs:• Market stabilizing, expect our strong growth to
continue• Strengthen our position in every Geo• Leverage our momentum, industry consolidation
to drive profitable growth
11
§First quarter gives us momentum§Well positioned in all product lines, Geos
to grow share and increase profitability§When acquisitions close, will be fully ready
to compete across:– Smart connected devices– Infrastructure devices– Ecosystem space
IBM, Motorola Acquisitions
2014 LENOVO INTERNAL. ALL RIGHTS RESERVED.
Outlook
Wong Wai Ming
Chief Financial Officer
13
Financial Summary
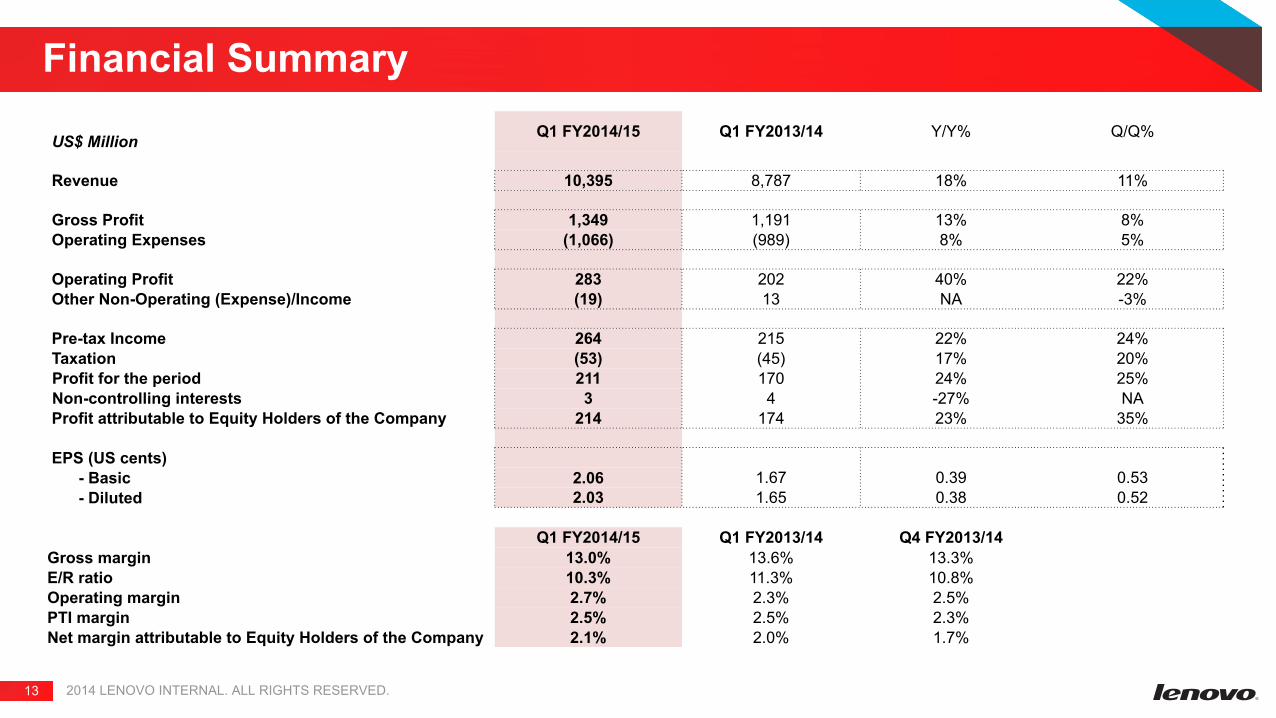
US$ Million Q1 FY2014/15 Q1 FY2013/14 Y/Y% Q/Q%
Revenue 10,395 8,787 18% 11%
Gross Profit 1,349 1,191 13% 8% Operating Expenses (1,066) (989) 8% 5%
Operating Profit 283 202 40% 22% Other Non-Operating (Expense)/Income (19) 13 NA -3%
Pre-tax Income 264 215 22% 24% Taxation (53) (45) 17% 20%
Profit for the period 211 170 24% 25% Non-controlling interests 3 4 -27% NA
Profit attributable to Equity Holders of the Company 214 174 23% 35%
EPS (US cents) - Basic 2.06 1.67 0.39 0.53 - Diluted 2.03 1.65 0.38 0.52
Q1 FY2014/15 Q1 FY2013/14 Q4 FY2013/14 Gross margin 13.0% 13.6% 13.3% E/R ratio 10.3% 11.3% 10.8% Operating margin 2.7% 2.3% 2.5% PTI margin 2.5% 2.5% 2.3% Net margin attributable to Equity Holders of the Company 2.1% 2.0% 1.7%
2014 LENOVO INTERNAL. ALL RIGHTS RESERVED.
14
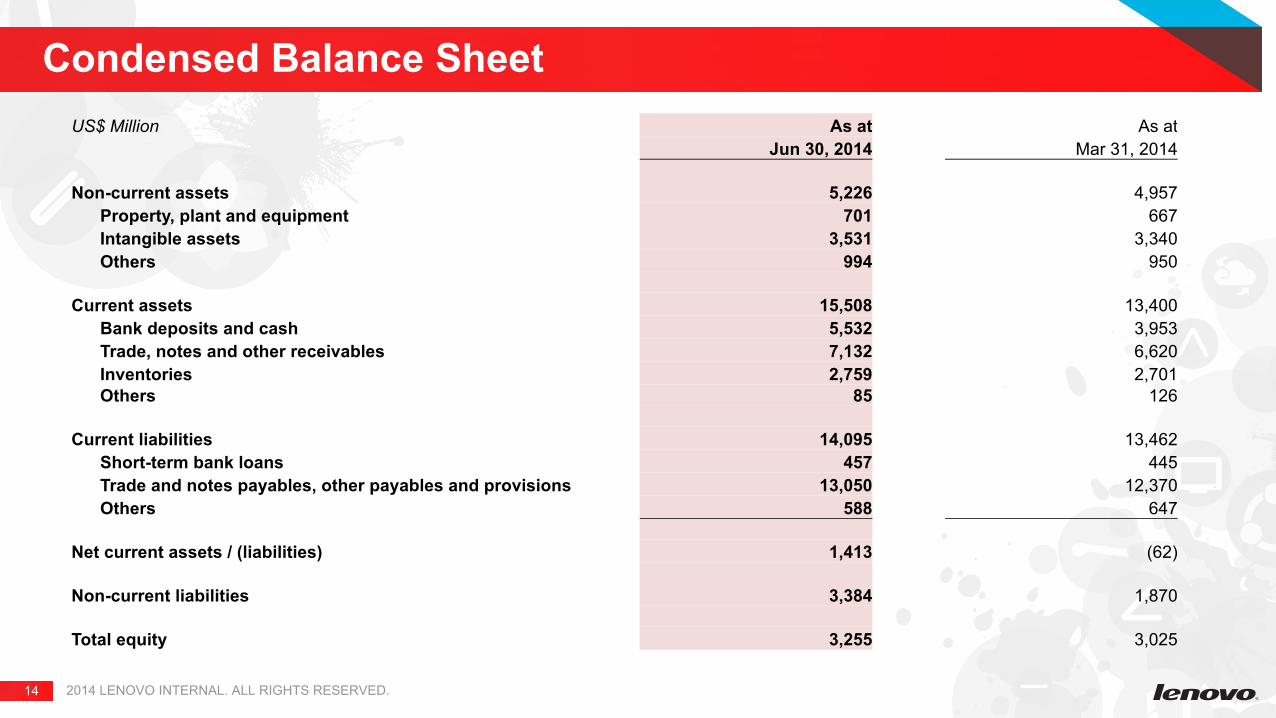
Condensed Balance SheetUS$ Million As at As at
Jun 30, 2014 Mar 31, 2014
Non-current assets 5,226 4,957 Property, plant and equipment 701 667 Intangible assets 3,531 3,340 Others 994 950
Current assets 15,508 13,400 Bank deposits and cash 5,532 3,953 Trade, notes and other receivables 7,132 6,620 Inventories 2,759 2,701 Others 85 126
Current liabilities 14,095 13,462 Short-term bank loans 457 445 Trade and notes payables, other payables and provisions 13,050 12,370 Others 588 647
Net current assets / (liabilities) 1,413 (62)
Non-current liabilities 3,384 1,870
Total equity 3,255 3,025
2014 LENOVO INTERNAL. ALL RIGHTS RESERVED.
15
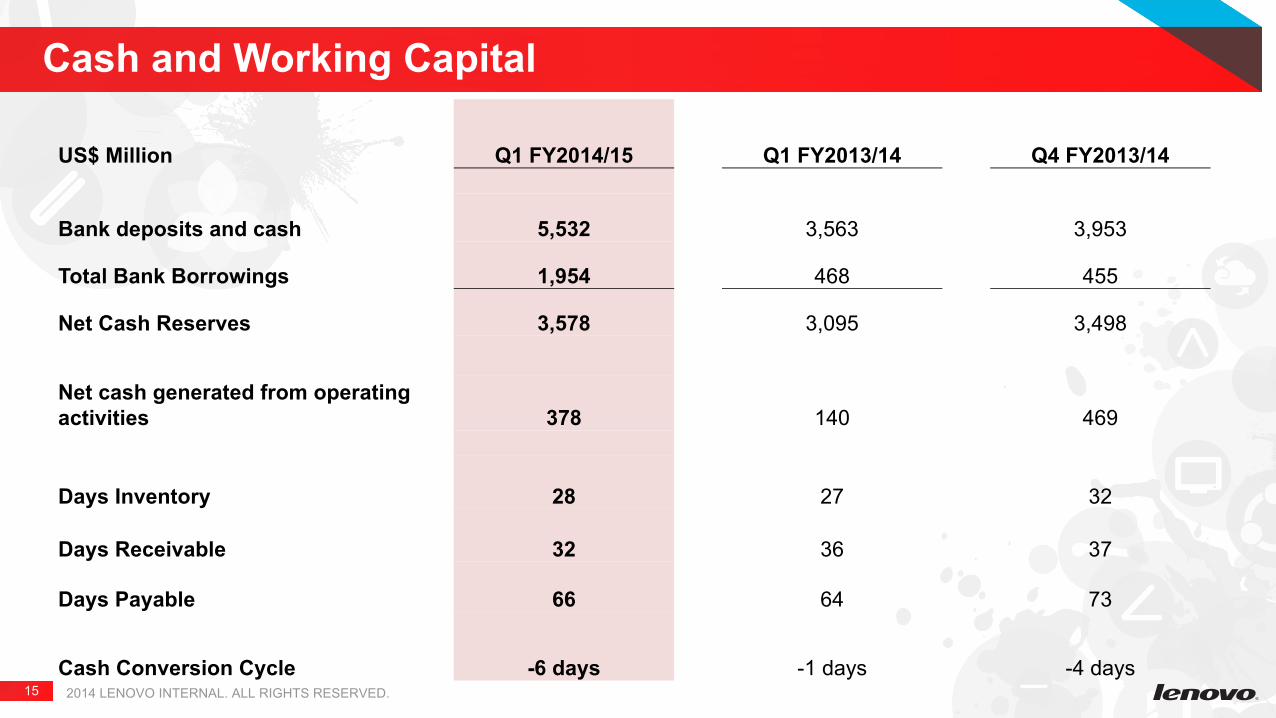
Cash and Working Capital
US$ Million Q1 FY2014/15 Q1 FY2013/14 Q4 FY2013/14
Bank deposits and cash 5,532 3,563 3,953
Total Bank Borrowings 1,954 468 455
Net Cash Reserves 3,578 3,095 3,498
Net cash generated from operating activities 378 140 469
Days Inventory 28 27 32
Days Receivable 32 36 37
Days Payable 66 64 73
Cash Conversion Cycle -6 days -1 days -4 days2014 LENOVO INTERNAL. ALL RIGHTS RESERVED.
16
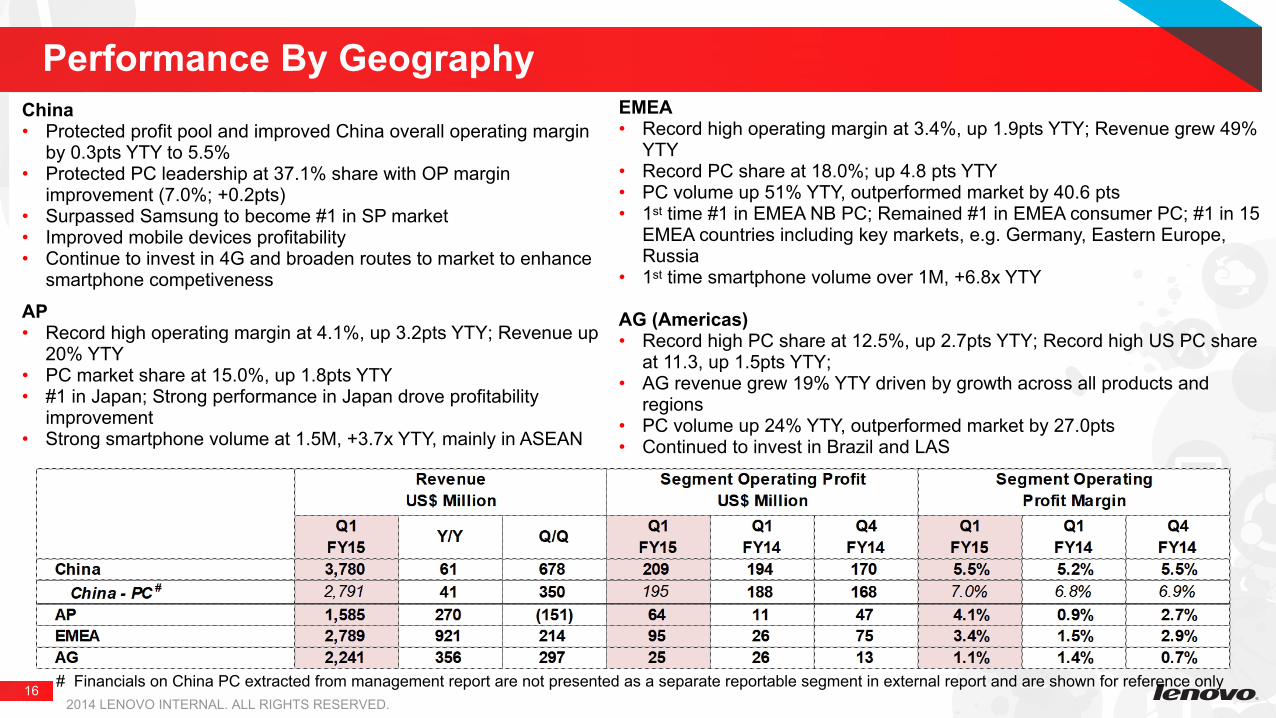
Performance By Geography
# Financials on China PC extracted from management report are not presented as a separate reportable segment in external report and are shown for reference only
China• Protected profit pool and improved China overall operating margin
by 0.3pts YTY to 5.5%• Protected PC leadership at 37.1% share with OP margin
improvement (7.0%; +0.2pts) • Surpassed Samsung to become #1 in SP market • Improved mobile devices profitability• Continue to invest in 4G and broaden routes to market to enhance
smartphone competiveness
AP• Record high operating margin at 4.1%, up 3.2pts YTY; Revenue up
20% YTY• PC market share at 15.0%, up 1.8pts YTY • #1 in Japan; Strong performance in Japan drove profitability
improvement • Strong smartphone volume at 1.5M, +3.7x YTY, mainly in ASEAN
EMEA• Record high operating margin at 3.4%, up 1.9pts YTY; Revenue grew 49%
YTY• Record PC share at 18.0%; up 4.8 pts YTY• PC volume up 51% YTY, outperformed market by 40.6 pts• 1st time #1 in EMEA NB PC; Remained #1 in EMEA consumer PC; #1 in 15
EMEA countries including key markets, e.g. Germany, Eastern Europe, Russia
• 1st time smartphone volume over 1M, +6.8x YTY
AG (Americas)• Record high PC share at 12.5%, up 2.7pts YTY; Record high US PC share
at 11.3, up 1.5pts YTY; • AG revenue grew 19% YTY driven by growth across all products and
regions• PC volume up 24% YTY, outperformed market by 27.0pts• Continued to invest in Brazil and LAS
2014 LENOVO INTERNAL. ALL RIGHTS RESERVED.
17
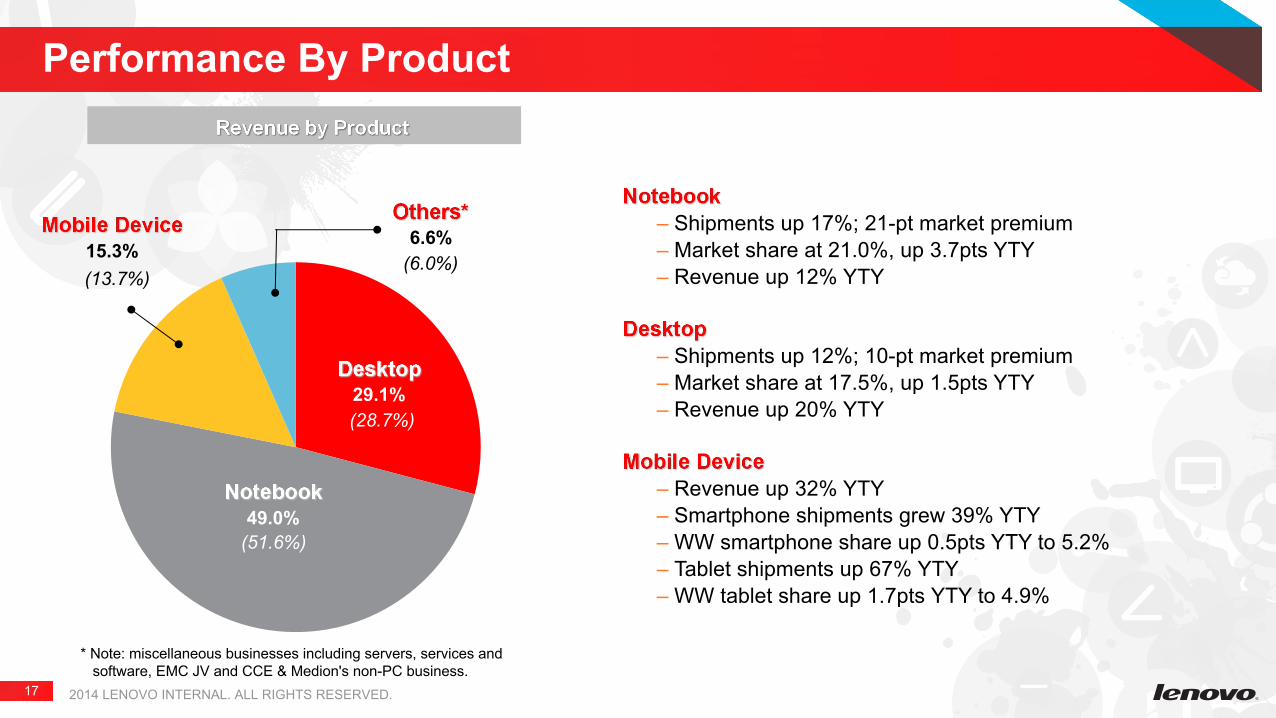
Performance By Product
* Note: miscellaneous businesses including servers, services and software, EMC JV and CCE & Medion's non-PC business.
– Shipments up 17%; 21-pt market premium– Market share at 21.0%, up 3.7pts YTY– Revenue up 12% YTY
– Shipments up 12%; 10-pt market premium– Market share at 17.5%, up 1.5pts YTY– Revenue up 20% YTY
– Revenue up 32% YTY– Smartphone shipments grew 39% YTY– WW smartphone share up 0.5pts YTY to 5.2% – Tablet shipments up 67% YTY– WW tablet share up 1.7pts YTY to 4.9%
(6.0%)6.6%
29.1%(28.7%)
49.0%(51.6%)
(13.7%)15.3%
2014 LENOVO INTERNAL. ALL RIGHTS RESERVED.
Appendix
- Consolidated Income Statement
- Condensed Consolidated Cash Flow Statement
19
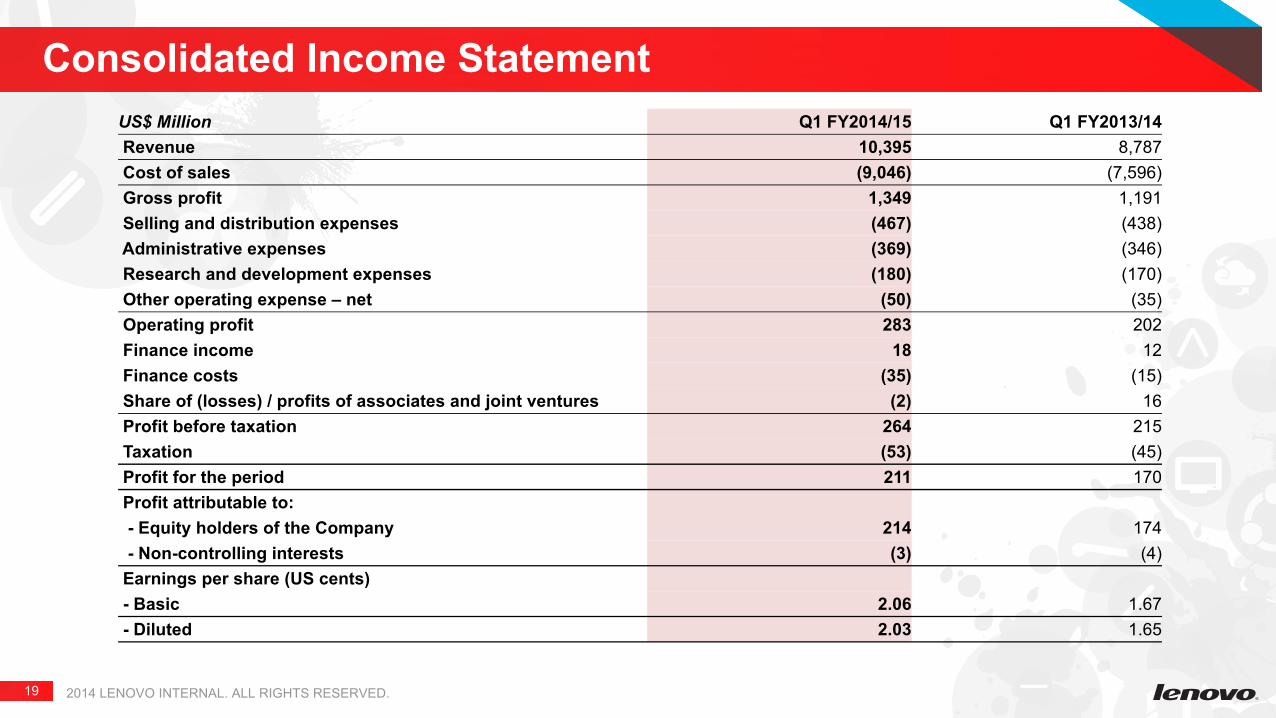
Consolidated Income StatementUS$ Million Q1 FY2014/15 Q1 FY2013/14 Revenue 10,395 8,787 Cost of sales (9,046) (7,596) Gross profit 1,349 1,191 Selling and distribution expenses (467) (438) Administrative expenses (369) (346) Research and development expenses (180) (170) Other operating expense – net (50) (35) Operating profit 283 202 Finance income 18 12 Finance costs (35) (15) Share of (losses) / profits of associates and joint ventures (2) 16 Profit before taxation 264 215 Taxation (53) (45) Profit for the period 211 170 Profit attributable to: - Equity holders of the Company 214 174 - Non-controlling interests (3) (4) Earnings per share (US cents) - Basic 2.06 1.67 - Diluted 2.03 1.65
2014 LENOVO INTERNAL. ALL RIGHTS RESERVED.

20
Condensed Consolidated Cash Flow Statement
US$ Million Q1 FY2014/15 Q1 FY2013/14
Net cash generated from operating activities 378 140
Net cash used in investing activities (302) (139)
Net cash generated from / (used in) financing activities 1,498 (49)
Increase / (decrease) in cash and cash equivalents 1,574 (48)
Effect of foreign exchange rate changes 5 7
Cash and cash equivalents at the beginning of the period 3,858 3,454
Cash and cash equivalents at the end of the period 5,437 3,413
2014 LENOVO INTERNAL. ALL RIGHTS RESERVED.