6.5 ratio analysis - shodhganga : a reservoir of indian...
TRANSCRIPT

223
6.5 Ratio Analysis
Ratio 1; Inventory Turnover Ratio
No. Company 1991 1992 1993 1994 1995 1996 1997 1998 1999 2000 2001 2002 1 ABC 6.991 5.892 4.571 3.391 4.713 4.257 3.835 2.194 2.250 3.140 3.616 4.326 2 ABB 4.543 5.011 6.762 7.154 6.554 7.184 7.884 7.794 7.386 7.714 8.928 10.125 3 Batliboi 4.631 4.742 0.00 9.418 6.410 7.001 6.477 6.451 6.089 6.642 7.880 4.556 4 Bosch Re 3.016 3.735 3.969 5.633 4.820 3.636 3.310 3.109 4.460 4.581 4.328 4.482 5 Blue Star 6.022 5.900 5.574 7.013 7.654 6.579 6.191 6.172 6.849 7.082 7.328 7.200 6 Banco Products 3.789 4.845 4.258 4.434 4.978 4.739 6.405 7.667 7.356 7.095 5.786 5.790 7 Elecon 2.901 1.942 2.229 2.870 3.818 4.336 4.100 4.460 5.520 4.728 3.772 3.165 8 Eimco Elecon 2.887 3.317 1.582 2.663 4.294 4.234 3.489 2.686 3.196 3.139 2.912 2.852 9 FAGBearing 1.942 2.226 2.239 2.670 2.837 3.269 3.439 4.105 4.373 3.945 4.146 4.761
10 GMM 2.505 2.674 2.685 2.876 3.066 3.697 2.830 3.024 3.164 2.798 2.747 2.532 11 Gujarat Apollo 3.226 3.582 5.580 5.905 6.458 6.969 5.543 5.262 6.009 7.489 7.757 6.390 12 HindustanDorr Oliver 22.611 21.348 32.400 47.516 37.924 36.607 22.986 25.703 33.312 14.585 25.929 18.580 13 Hitachi Home &Life 7.340 8.918 6.100 8.943 12.103 7.989 8.640 7.009 5.411 5.299 6.572 3.909 14 Ingersoll Rand 3.736 3.906 3.543 3.496 3.325 3.434 3.829 5.885 NA NA 4.172 NA 15 Jyoti 2.432 2.723 3.119 3.107 3.047 3.289 4.810 6.213 6.477 5.301 5.249 2.567 16 Jord Engg. 4.796 2.641 5.605 5.587 7.186 10.920 4.207 3.056 3.517 2.638 2.898 1.933 17 Kabra Extrusion 6.085 7.533 6.340 6.658 7.554 5.614 2.701 2.974 3.176 4.092 4.966 4.796 18 Kilburn Engg. 2.896 2.425 2.892 3.600 2.500 2.164 2.492 3.784 4.868 3.947 3.536 4.243 19 Mipco Seamless 5.599 5.232 4.930 4.076 3.767 4.882 5.156 4.274 3.957 3.990 2.755 3.618 20 Stovec Industries 4.194 3.167 3.523 3.801 3.712 3.519 3.614 3.073 3.607 5.114 5.473 6.843 21 Windsor Machines 2.617 2.729 1.912 2.112 1.394 3.083 1.747 2.046 1.548 1.803 1.993 1.550

224
Ratio 1
C. I. For Mean Company N Mean S.D. SE of mean Lower Bound Upper Bound
ABC 12 4.098 1.383 0.399 3.017 5.179 ABB 12 7.253 1.510 0.436 6.073 8.434 Batliboi 11 6.391 1.453 0.438 5.181 7.600 Bosch Re 12 4.090 0.773 0.223 3.486 4.694 Blue Star 12 6.630 0.653 0.188 6.120 7.141 Banco Products 12 5.595 1.295 0.374 4.583 6.608 Elecon 12 3.654 1.061 0.306 2.824 4.483 Eimco Elecon 12 3.104 0.722 0.208 2.540 3.668 FAGBearing 12 3.329 0.944 0.273 2.591 4.068 GMM 12 2.883 0.326 0.094 2.628 3.138 Gujarat Apollo 12 5.847 1.375 0.397 4.772 6.923 HindustanDorr Oliver 12 28.292 9.423 2.720 20.925 35.659 Hitachi Home &Life 12 7.353 2.169 0.626 5.657 9.049 Ingersoll Rand 9 3.925 0.781 0.260 3.165 4.685 Jyoti 12 4.028 1.479 0.427 2.872 5.184 Jord Engg. 12 4.582 2.524 0.729 2.609 6.555 Kabra Extrusion 12 5.207 1.709 0.493 3.872 6.543 Kilburn Engg. 12 3.279 0.843 0.243 2.620 3.938 Mipco Seamless 12 4.353 0.820 0.237 3.712 4.994 Stovec Industries 12 4.137 1.118 0.323 3.263 5.011 Windsor Machines 12 2.044 0.519 0.150 1.639 2.450
ANOVA Source of Variation SS df MSS F-Calc P-value F crit
Between Groups 6919.340 20 345.967 58.683 0.000 1.617Within Groups 1338.279 227 5.896 Total 8257.619 247
Mean inventory turnover ratio of ABB is highest (7.253) among all the companies. GMM Pfaudler has mean ratio of 2.883 which is least among all companies. The ANOVA test is applied to compare the mean inventory turnover ratio for all the companies. F value is 58.683 with the corresponding P value 0.000. As P value is less than 0.01, it is concluded that this difference is significant at less than 1 % level of significance.
Sales turnover ratio has been higher in case of Asea Brown Boveri, and Blue Star. ABB and Blue Star are the professionally managed companies. HDO’s performance on this count is ignored, since it is concentrating on fabrication work which are basically labour jobs.
In case of all the companies covered under study, there was an increasing trend of sales from 1991 to 1996. After 1996, in majority of companies, the sales turnover and business activity has shown declining trend, till 2002. The work in process, old non-standard items and unused raw materials have been slow moving items.

225
Ratio 2; Return on Net Assets
No. Company 1991 1992 1993 1994 1995 1996 1997 1998 1999 2000 2001 2002 1 ABC 0.385 0.366 0.289 0.181 0.175 0.161 0.169 0.090 NA 0.100 0.159 0.023 2 ABB 0.262 0.297 0.414 0.327 0.340 0.485 0.202 0.126 0.147 0.194 0.221 0.284 3 Batliboi 0.207 0.192 NA 0.297 0.279 0.202 0.107 0.167 0.266 NA NA NA 4 Bosch Re 0.225 0.222 0.221 0.213 NA 0.171 0.157 0.063 0.079 0.189 0.257 0.229 5 Blue Star 0.163 0.123 0.159 0.175 0.257 0.392 0.220 0.147 0.149 0.191 0.205 0.266 6 Banco Products 0.722 0.278 0.106 0.082 0.061 0.218 0.302 0.253 0.225 0.322 0.161 0.188 7 Elecon 0.191 0.180 0.214 0.198 0.237 0.206 0.168 0.148 0.205 0.090 0.058 0.053 8 Eimco Elecon 0.271 0.310 0.260 0.265 0.322 0.354 0.288 0.196 0.232 0.205 0.220 0.189 9 FAGBearing 0.267 0.148 0.161 0.112 0.214 0.358 0.244 0.152 0.128 0.173 0.192 0.210
10 GMM 0.394 0.424 0.379 0.467 0.317 0.365 0.247 0.139 0.129 0.072 0.055 0.035 11 Gujarat Apollo NA 0.089 0.204 0.219 0.232 0.220 0.228 0.211 0.185 0.182 0.165 0.150 12 HindustanDorr Oliver 0.266 0.230 0.265 0.209 0.166 0.260 0.134 0.238 0.089 NA 0.162 0.150 13 Hitachi Home &Life 0.059 0.075 0.059 0.122 0.124 0.183 0.157 0.132 NA 0.119 NA NA 14 Ingersoll Rand 0.266 0.409 0.375 0.363 0.515 1.103 0.237 0.301 0.245 0.239 0.210 NA 15 Jyoti 0.196 0.173 0.208 0.192 0.182 0.158 0.167 0.168 0.172 0.189 0.139 0.044 16 Jord Engg. NA 0.117 0.137 0.150 0.180 0.159 0.109 0.093 NA NA NA NA 17 Kabra Extrusion 0.192 0.215 0.267 0.300 0.217 0.285 0.136 0.085 0.090 0.124 0.161 0.184 18 Kilburn Engg. 0.252 0.255 0.225 0.151 0.176 0.162 0.192 0.077 NA NA NA 0.186 19 Mipco Seamless 0.252 0.280 0.207 0.160 0.057 0.140 0.206 0.057 NA 0.024 0.001 NA 20 Stovec Industries 0.205 0.100 0.129 0.132 0.089 0.129 0.007 NA 0.061 0.189 0.198 0.170 21 Windsor Machines 0.273 0.227 0.093 0.097 0.260 0.198 0.091 0.122 NA 0.047 0.050 NA

226
Ratio 2
C. I. For Mean Company N Mean S.D. SE of mean Lower Bound Upper Bound
ABC 11 0.191 0.113 0.034 0.097 0.285 ABB 12 0.275 0.106 0.031 0.192 0.358 Batliboi 8 0.215 0.063 0.022 0.146 0.283 Bosch Re 11 0.184 0.063 0.019 0.132 0.236 Blue Star 12 0.204 0.074 0.021 0.146 0.262 Banco Products 12 0.243 0.173 0.050 0.108 0.378 Elecon 12 0.162 0.062 0.018 0.114 0.211 Eimco Elecon 12 0.259 0.053 0.015 0.218 0.301 FAGBearing 12 0.197 0.069 0.020 0.143 0.250 GMM 12 0.252 0.158 0.046 0.128 0.376 Gujarat Apollo 11 0.190 0.043 0.013 0.154 0.225 HindustanDorr Oliver 11 0.197 0.060 0.018 0.147 0.247 Hitachi Home &Life 9 0.114 0.043 0.014 0.073 0.156 Ingersoll Rand 11 0.387 0.255 0.077 0.175 0.599 Jyoti 12 0.166 0.043 0.012 0.132 0.199 Jord Engg. 7 0.135 0.031 0.012 0.098 0.172 Kabra Extrusion 12 0.188 0.072 0.021 0.131 0.245 Kilburn Engg. 9 0.186 0.055 0.018 0.132 0.240 Mipco Seamless 10 0.138 0.099 0.031 0.050 0.227 Stovec Industries 11 0.128 0.061 0.019 0.077 0.179 Windsor Machines 10 0.146 0.086 0.027 0.069 0.223
ANOVA
Source of Variation SS df MSS F-Calc P-value F crit Between Groups 0.812 20 0.041 3.933 0.000 1.622Within Groups 2.126 206 0.010 Total 2.938 226
Mean return on capital employed of Ingersoll Rand is highest (38.70) among all the companies. Hitachi Home & Life has mean ratio of 11.40 which is least among all companies. The ANOVA test is applied to compare the mean return on capital employed for all the companies. F value is 3.933 with the corresponding P value 0.000. As P value is less than 0.01, it is concluded that this difference is significant at less than 1 % level of significance.
Analysis of EBIT compared to net assets has been found highest in case of Ingersoll Rand, ABB and GMM Pfaudler. It is very high in case of Ingersoll Rand.
Return on Capital Employed (EBIT/Net Assets) has been found going down in good companies also, particularly after 1996. ROCE has been down because of reduced fixed assets turnover ratio, increased operating costs and increase in fixed assets not accompanied by turn over.

227
Ratio 3; Fixed Assets Turnover Ratio
No. Company 1991 1992 1993 1994 1995 1996 1997 1998 1999 2000 2001 2002 1 ABC 2.828 3.900 3.644 2.399 3.098 1.819 1.650 1.133 1.092 1.636 2.234 1.503 2 ABB 6.373 6.594 7.682 6.922 8.974 9.117 5.640 4.668 5.627 5.600 6.668 8.174 3 Batliboi 7.147 7.525 NA 10.867 5.987 6.815 5.770 5.267 4.609 NA 2.306 1.396 4 Bosch Re 3.864 4.283 4.290 4.551 5.454 NA 2.829 2.709 3.401 3.966 4.381 5.202 5 Blue Star 7.553 8.510 8.829 10.131 8.954 10.352 11.175 6.432 5.360 5.315 6.227 9.091 6 Banco Products 8.542 8.272 8.899 6.365 5.096 4.903 4.181 4.444 4.060 4.507 5.576 4.625 7 Elecon Engg. 5.025 4.702 5.280 7.631 7.689 4.828 3.602 2.948 4.211 2.814 2.566 2.811 8 Eimco Elecon 7.716 9.246 11.771 6.275 6.048 4.817 3.872 3.471 4.549 3.708 4.076 3.062 9 FAGBearing 2.762 2.676 2.333 1.847 2.106 2.478 1.979 1.885 NA 2.069 2.405 2.535
10 GMM 4.320 4.778 5.465 5.595 3.328 2.545 2.521 1.857 2.335 1.910 2.177 2.072 11 Gujarat Apollo NA 3.403 5.410 4.373 4.215 NA NA NA 5.594 7.365 6.930 5.120 12 HindustanDorr Oliver 22.000 15.726 19.837 21.192 18.375 2.044 1.440 1.669 1.469 0.816 1.092 1.263 13 Hitachi Home &Life 3.189 3.802 4.012 7.285 12.103 NA NA 6.624 5.412 6.372 11.732 7.325 14 Ingersoll Rand 11.394 14.980 14.175 8.590 7.198 6.853 6.091 7.704 6.700 7.753 7.382 NA 15 Jyoti Ltd. 2.267 2.868 3.325 3.321 4.109 5.210 7.754 6.889 47.957 6.883 6.655 3.593 16 Jord Engg. NA 2.931 2.470 3.012 1.794 2.076 3.125 2.088 NA 1.413 1.663 0.746 17 Kabra Extrusion 12.077 13.780 13.737 12.000 8.323 2.933 2.218 2.662 2.595 2.920 3.760 3.755 18 Kilburn Engg. 6.200 4.655 4.917 1.934 1.472 1.774 2.439 3.218 2.577 0.902 0.634 0.900 19 Mipco Seamless 2.213 2.908 3.263 2.076 0.855 1.297 1.700 1.047 0.789 1.302 1.276 1.652 20 Stovec Industries 3.125 2.931 3.162 2.795 1.271 1.449 NA 1.673 1.904 2.512 2.908 2.985 21 Windsor Machines 8.818 7.490 4.565 4.241 5.063 4.940 2.758 3.119 2.486 3.053 3.512 2.977

228
Ratio 3
C. I. For Mean Company N Mean S.D. SE of mean Lower Bound Upper Bound
ABC 12 2.245 0.944 0.273 1.506 2.983 ABB 12 6.837 1.405 0.406 5.738 7.935 Batliboi 10 5.769 2.684 0.849 3.367 8.171 Bosch Re 11 4.084 0.867 0.261 3.363 4.806 Blue Star 12 8.161 1.974 0.570 6.617 9.704 Banco Products 12 5.789 1.795 0.518 4.386 7.193 Elecon 12 4.509 1.751 0.506 3.140 5.878 Eimco Elecon 12 5.718 2.662 0.768 3.637 7.799 FAGBearing 11 2.280 0.319 0.096 2.014 2.546 GMM 12 3.242 1.415 0.409 2.135 4.348 Gujarat Apollo 8 5.301 1.346 0.476 3.855 6.747 HindustanDorr Oliver 12 8.910 9.407 2.716 1.555 16.265 Hitachi Home &Life 10 6.786 3.071 0.971 4.037 9.535 Ingersoll Rand 11 8.984 3.097 0.934 6.404 11.563 Jyoti 12 8.403 12.592 3.635 -1.443 18.248 Jord Engg. 10 2.132 0.767 0.242 1.446 2.818 Kabra Extrusion 12 6.730 4.846 1.399 2.941 10.519 Kilburn Engg. 12 2.635 1.783 0.515 1.241 4.029 Mipco Seamless 12 1.698 0.785 0.227 1.084 2.312 Stovec Industries 11 2.429 0.714 0.215 1.834 3.024 Windsor Machines 12 4.418 1.965 0.567 2.882 5.955
ANOVA
Source of Variation SS df MSS F-Calc P-value F crit Between Groups 1321.232 20 66.062 4.003 0.000 1.619Within Groups 3581.044 217 16.503 Total 4902.276 237
Mean assets turnover ratio of Ingersoll Rand is highest (8.984) among
all the companies. Mipco Seamless has mean ratio of 1.698 which is least among all companies. The ANOVA test is applied to compare the mean assets turnover for all the companies. F value is 4.003 with the corresponding P value 0.000. As P value is less than 0.01, it is concluded that this difference is significant at less than 1 % level of significance.
Asset utilization has been found highest in case of Ingersoll Rand, Jyoti Ltd. and Blue Star.
In most of the companies covered by the study, the fixed assets utilization increased 1991 onwards till 1996. In few companies the increasing trend was till 1997. However, in all the cases, there was a drastic down trend after 1997, till 2002. In very few companies like ABB, Blue Star, Hindustan Dorr Oliver, Ingersoll Rand and Kabra Extrusion, the fixed assets utilization has been found very high as compared to other companies.
229
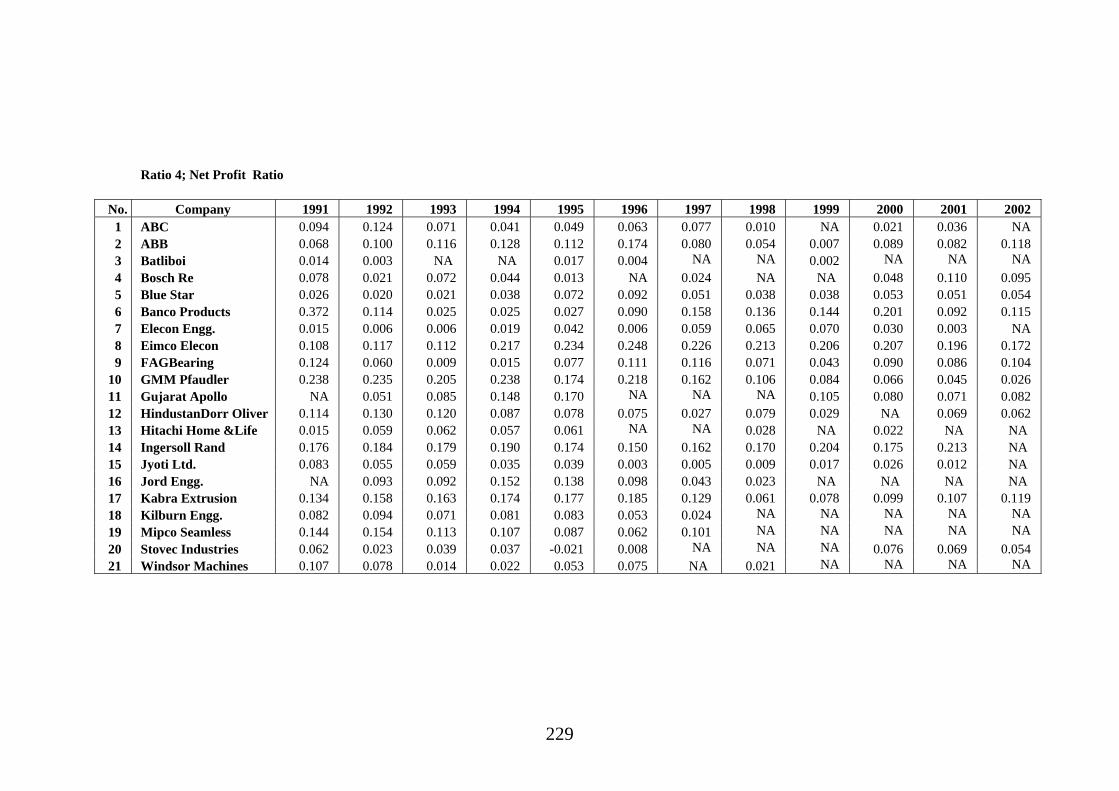
Ratio 4; Net Profit Ratio
No. Company 1991 1992 1993 1994 1995 1996 1997 1998 1999 2000 2001 2002 1 ABC 0.094 0.124 0.071 0.041 0.049 0.063 0.077 0.010 NA 0.021 0.036 NA 2 ABB 0.068 0.100 0.116 0.128 0.112 0.174 0.080 0.054 0.007 0.089 0.082 0.118 3 Batliboi 0.014 0.003 NA NA 0.017 0.004 NA NA 0.002 NA NA NA 4 Bosch Re 0.078 0.021 0.072 0.044 0.013 NA 0.024 NA NA 0.048 0.110 0.095 5 Blue Star 0.026 0.020 0.021 0.038 0.072 0.092 0.051 0.038 0.038 0.053 0.051 0.054 6 Banco Products 0.372 0.114 0.025 0.025 0.027 0.090 0.158 0.136 0.144 0.201 0.092 0.115 7 Elecon Engg. 0.015 0.006 0.006 0.019 0.042 0.006 0.059 0.065 0.070 0.030 0.003 NA 8 Eimco Elecon 0.108 0.117 0.112 0.217 0.234 0.248 0.226 0.213 0.206 0.207 0.196 0.172 9 FAGBearing 0.124 0.060 0.009 0.015 0.077 0.111 0.116 0.071 0.043 0.090 0.086 0.104
10 GMM Pfaudler 0.238 0.235 0.205 0.238 0.174 0.218 0.162 0.106 0.084 0.066 0.045 0.026 11 Gujarat Apollo NA 0.051 0.085 0.148 0.170 NA NA NA 0.105 0.080 0.071 0.082 12 HindustanDorr Oliver 0.114 0.130 0.120 0.087 0.078 0.075 0.027 0.079 0.029 NA 0.069 0.062 13 Hitachi Home &Life 0.015 0.059 0.062 0.057 0.061 NA NA 0.028 NA 0.022 NA NA 14 Ingersoll Rand 0.176 0.184 0.179 0.190 0.174 0.150 0.162 0.170 0.204 0.175 0.213 NA 15 Jyoti Ltd. 0.083 0.055 0.059 0.035 0.039 0.003 0.005 0.009 0.017 0.026 0.012 NA 16 Jord Engg. NA 0.093 0.092 0.152 0.138 0.098 0.043 0.023 NA NA NA NA 17 Kabra Extrusion 0.134 0.158 0.163 0.174 0.177 0.185 0.129 0.061 0.078 0.099 0.107 0.119 18 Kilburn Engg. 0.082 0.094 0.071 0.081 0.083 0.053 0.024 NA NA NA NA NA 19 Mipco Seamless 0.144 0.154 0.113 0.107 0.087 0.062 0.101 NA NA NA NA NA 20 Stovec Industries 0.062 0.023 0.039 0.037 -0.021 0.008 NA NA NA 0.076 0.069 0.054 21 Windsor Machines 0.107 0.078 0.014 0.022 0.053 0.075 NA 0.021 NA NA NA NA

230
Ratio 4 C. I. For Mean
Company N Mean S.D. SE of mean Lower Bound Upper BoundABC 10 0.059 0.034 0.011 0.028 0.089 ABB 12 0.094 0.042 0.012 0.061 0.127 Batliboi 5 0.008 0.007 0.003 -0.004 0.020 Bosch Re 9 0.056 0.034 0.011 0.023 0.090 Blue Star 12 0.046 0.021 0.006 0.030 0.063 Banco Products 12 0.125 0.096 0.028 0.050 0.200 Elecon 11 0.029 0.026 0.008 0.008 0.051 Eimco Elecon 12 0.188 0.049 0.014 0.149 0.227 FAGBearing 12 0.075 0.038 0.011 0.046 0.105 GMM 12 0.150 0.080 0.023 0.087 0.212 Gujarat Apollo 8 0.099 0.040 0.014 0.056 0.142 HindustanDorr Oliver 11 0.079 0.033 0.010 0.051 0.107 Hitachi Home &Life 7 0.043 0.021 0.008 0.018 0.068 Ingersoll Rand 11 0.180 0.018 0.005 0.165 0.194 Jyoti 11 0.031 0.026 0.008 0.010 0.053 Jord Engg. 7 0.091 0.047 0.018 0.035 0.148 Kabra Extrusion 12 0.132 0.040 0.012 0.101 0.164 Kilburn Engg. 7 0.069 0.024 0.009 0.041 0.098 Mipco Seamless 7 0.109 0.032 0.012 0.071 0.148 Stovec Industries 9 0.039 0.031 0.010 0.008 0.069 Windsor Machines 7 0.053 0.035 0.013 0.010 0.096
ANOVA Source of Variation SS df MSS F-Calc P-value F crit
Between Groups 0.496 20 0.025 12.766 0.000 1.628Within Groups 0.356 183 0.002 Total 0.852 203
Mean net profit ratio of Eimco Elecon is highest (18.80) among all the companies. Batliboi has mean ratio of 0.80 which is least among all companies. The ANOVA test is applied to compare the mean net profit ratio for all the companies. F value is 12.766 with the corresponding P value 0.000. As P value is less than 0.01, it is concluded that this difference is significant at less than 0.01, it is concluded that this difference is significant at less than 1% level of significance.
Ingersoll Rand, Eimco Elecon and Kabra Extrusion have been found to have very high profitability. Batliboi and Jyoti Ltd. had least net profit ratio during the period of study, i.e. 1991 to 2002.
In majority of the companies, increase in net profit (profit after tax) has been observed till 1996. After 1996, there is a fall in the amount and rate of net profit earned by the engineering companies till 2002. This shows general slow down of economy after 1996.
In case of two companies, Blue Star and Ingersoll Rand, which are professionally managed companies, the profit level was down after 1996. However, only these two companies were able to restore the level of satisfactory profitability by 2002. In other cases there was a down trend after 1996 till 2002.

231
Ratio 5; Return on Equity
No. Company 1991 1992 1993 1994 1995 1996 1997 1998 1999 2000 2001 2002 1 ABC 0.862 1.034 0.643 0.442 0.466 0.218 0.219 0.021 NA 0.064 0.090 0.000 2 ABB 0.159 0.220 0.186 0.227 0.229 0.384 0.146 0.082 0.101 0.136 0.131 0.190 3 Batliboi 0.089 0.021 NA NA 0.108 0.038 NA NA 0.023 NA NA 0.000 4 Bosch Re 0.221 0.072 0.137 0.139 0.084 NA 0.077 0.071 0.053 NA NA 0.090 5 Blue Star 0.132 0.107 0.112 0.122 0.266 0.256 0.144 0.144 0.144 0.186 0.214 0.246 6 Banco Products 1.343 0.341 0.079 0.003 0.067 0.204 0.242 0.203 0.190 0.240 0.117 0.137 7 Elecon 0.011 0.019 0.021 0.034 0.169 0.210 0.151 0.141 0.120 0.046 0.005 0.000 8 Eimco Elecon 0.245 0.203 0.130 0.201 0.231 0.295 0.184 0.133 0.146 0.141 0.131 0.121 9 FAGBearing 0.195 0.160 0.018 0.038 0.145 0.138 0.178 0.145 0.065 0.147 0.169 0.193
10 GMM 0.298 0.276 0.275 0.340 0.242 0.344 0.238 0.119 0.066 0.043 0.041 0.025 11 Gujarat Apollo NA 0.198 0.269 0.250 0.259 NA NA NA 0.216 0.161 0.150 0.147 12 HindustanDorr Oliver 0.092 0.094 0.072 0.059 0.082 0.076 0.009 0.050 0.015 NA 0.052 0.045 13 Hitachi H & L NA 0.133 0.138 0.218 0.266 NA NA 0.120 NA 0.100 NA 0.000 14 Ingersoll Rand 0.241 0.261 0.254 0.243 0.221 0.220 0.237 0.292 0.265 0.228 0.203 NA 15 Jyoti 0.198 0.153 0.203 0.005 0.010 0.007 0.009 0.007 0.053 0.098 0.036 0.000 16 Jord Engg. NA 0.073 0.077 0.167 0.207 0.176 0.093 0.058 NA NA NA NA 17 Kabra Extrusion 0.214 0.256 0.272 0.293 0.162 0.224 0.114 0.068 0.076 0.117 0.135 0.115 18 Kilburn Engg. 0.251 0.202 0.199 0.110 0.125 0.114 0.067 NA NA NA NA NA 19 Mipco Seamless 0.341 0.259 0.143 0.153 0.155 0.146 0.164 NA NA NA NA NA 20 Stovec Industries 0.224 0.047 0.075 0.072 0.021 0.019 NA NA NA 0.207 0.183 0.105 21 Windsor Machines 0.351 0.170 0.032 0.053 0.107 0.183 0.196 NA 0.060 NA NA 0.000

232
Ratio 5
C. I. For Mean
Company N Mean S.D. SE of mean Lower Bound Upper Bound
ABC 11 0.369 0.353 0.107 0.075 0.663
ABB 12 0.183 0.080 0.023 0.120 0.245
Batliboi 6 0.047 0.043 0.017 -0.014 0.107
Bosch Re 9 0.105 0.053 0.018 0.054 0.156
Blue Star 12 0.173 0.058 0.017 0.127 0.219
Banco Products 12 0.264 0.352 0.102 -0.012 0.539
Elecon 12 0.077 0.075 0.022 0.018 0.136
Eimco Elecon 12 0.180 0.056 0.016 0.136 0.224
FAGBearing 12 0.133 0.060 0.017 0.086 0.179
GMM 12 0.192 0.124 0.036 0.095 0.289
Gujarat Apollo 8 0.206 0.050 0.018 0.152 0.260
HindustanDorr Oliver 11 0.059 0.028 0.009 0.035 0.082
Hitachi Home &Life 7 0.139 0.085 0.032 0.036 0.243
Ingersoll Rand 11 0.242 0.025 0.008 0.222 0.263
Jyoti 12 0.065 0.078 0.023 0.004 0.126
Jord Engg. 7 0.122 0.060 0.023 0.049 0.194
Kabra Extrusion 12 0.171 0.078 0.023 0.109 0.232
Kilburn Engg. 7 0.152 0.065 0.025 0.073 0.231
Mipco Seamless 7 0.194 0.076 0.029 0.102 0.287
Stovec Industries 9 0.106 0.079 0.026 0.029 0.183
Windsor Machines 9 0.128 0.109 0.036 0.022 0.234
ANOVA
Source of Variation SS df MSS F-Calc P-value F crit
Between Groups 1.202 20 0.060 3.252 0.000 1.626
Within Groups 3.493 189 0.018
Total 4.695 209

233
Mean return on equity of Antifriction Bearing Corporation is highest (36.90) among all the companies. Batliboi has mean ratio of 4.70 which is least among all companies. The ANOVA test is applied to compare the mean return on equity for all the companies. F value is 3.252 with the corresponding P value 0.000. As P value is less than 0.01, it is concluded that this difference is significant at less than 1 % level of significance.
Return on equity has been found higher in case of ABC Bearings, Banco Products and Ingersoll Rand.
It is evident that between 1991 to 1996, the share capital of majority of companies has gone up. After 1996 till 2002, there were no major share capital issues by the companies. This is because of the fact that after 1991, on account of Harshad Mehta factor since the stock market was booming, new share issues were a common phenomena. Harshad Mehta's scam came out in 1992, because of which investors were very cautious. Another reason being after 1996, there was a down trend in general economic activity and recessionary trend which did not warrant new fixed investments in different industries.
Earning on shareholders' funds also shown improvement year by year from 1991 till 1996. This has gone down after 1996, and resultant effect on dividends declared on equity shares. Ingersoll Rand has maintained very healthy trend of net profit to net worth throughout the period of study, i. e. 1991 to 2002. In case of some of the companies like Elecon Engineering, FAG Bearings and GMM Pfaudler, this profitability has substantially gone down after 1996. In certain other cases, there have been losses after 1996.
The analysis of return on investment (ROI) of all the companies reveal that ROI rate has gone up year by year after 1991 till 1996. In all the cases, except Ingersoll Rand, ROI has gone down after 1996. The rate of ROI which was in 1996 has not been reached till 2002. Ingersoll Rand has maintained good ROI, being a well managed professional business enterprise in the field of engineering.

234
Ratio 6; Dividend Pay Out Ratio
No. Company 1991 1992 1993 1994 1995 1996 1997 1998 1999 2000 2001 2002 1 ABC 0.266 0.299 0.301 0.306 0.299 0.350 0.349 0.100 NA NA NA NA 2 ABB 0.280 0.300 0.300 0.350 0.400 0.787 0.500 0.500 0.500 0.500 0.500 0.600 3 Batliboi 0.200 0.150 NA NA 0.093 0.107 NA NA NA NA NA NA 4 Bosch Re 0.200 0.142 0.153 0.270 0.293 0.100 NA NA NA NA NA NA 5 Blue Star 0.339 0.180 0.230 0.250 0.349 0.350 0.350 0.350 0.350 0.500 0.550 0.650 6 Banco Products 0.200 0.253 0.122 0.178 0.133 0.180 0.200 0.300 0.350 0.300 0.300 0.400 7 Elecon 0.060 NA 0.080 0.100 0.160 0.160 0.159 0.181 0.200 0.181 NA NA 8 Eimco Elecon 0.202 0.394 0.142 0.250 0.249 0.270 0.270 0.270 0.270 0.270 0.300 0.329 9 FAGBearing 0.200 0.200 0.100 0.120 0.150 0.200 0.200 0.200 0.270 0.350 0.350 0.400
10 GMM 0.550 0.653 0.750 1.100 1.150 1.151 1.151 1.151 1.151 0.748 0.503 0.252 11 Gujarat Apollo NA 0.077 0.136 0.184 0.297 NA NA NA 0.400 0.251 0.200 0.114 12 HindustanDorr Oliver 0.299 0.299 0.299 0.299 0.349 0.600 0.101 0.202 0.101 0.152 0.152 0.120 13 Hitachi H & L 0.100 0.094 0.106 0.139 0.186 NA NA 0.149 NA 0.100 NA NA 14 Ingersoll Rand 0.350 0.450 0.250 0.300 0.350 0.400 0.450 0.650 0.700 0.800 0.800 NA 15 Jyoti NA NA NA NA 0.120 NA NA NA NA NA NA NA 16 Jord Engg. NA 0.068 0.114 0.224 0.237 0.250 NA NA NA NA NA NA 17 Kabra Extrusion 0.150 0.180 0.251 0.281 0.306 0.399 0.399 0.300 0.200 0.200 0.240 0.350 18 Kilburn Engg. 0.120 0.200 0.200 0.186 0.225 0.200 0.101 NA NA NA NA NA 19 Mipco Seamless 0.120 0.150 0.150 0.150 0.150 0.201 0.200 0.075 NA NA NA NA 20 Stovec Industries 0.270 0.261 0.269 0.263 0.100 0.100 NA NA NA 0.254 0.301 0.239 21 Windsor Machines 0.200 0.169 0.100 0.100 0.179 0.240 0.100 0.100 NA NA NA NA

235
Ratio 6
C. I. For Mean
Company N Mean S.D. SE of mean Lower Bound Upper Bound
ABC 8 0.284 0.079 0.028 0.199 0.369
ABB 12 0.460 0.146 0.042 0.346 0.574
Batliboi 4 0.137 0.048 0.024 0.022 0.253
Bosch Re 6 0.193 0.076 0.031 0.086 0.301
Blue Star 12 0.371 0.135 0.039 0.265 0.476
Banco Products 12 0.243 0.088 0.025 0.174 0.312
Elecon 9 0.142 0.050 0.017 0.094 0.190
Eimco Elecon 12 0.268 0.061 0.018 0.220 0.316
FAGBearing 12 0.228 0.095 0.027 0.154 0.303
GMM 12 0.859 0.322 0.093 0.607 1.111
Gujarat Apollo 8 0.208 0.106 0.037 0.094 0.321
HindustanDorr Oliver 12 0.248 0.143 0.041 0.136 0.360
Hitachi Home &Life 7 0.125 0.034 0.013 0.083 0.167
Ingersoll Rand 11 0.500 0.201 0.061 0.332 0.668
Jyoti 1 0.120
Jord Engg. 5 0.179 0.082 0.037 0.035 0.322
Kabra Extrusion 12 0.271 0.083 0.024 0.206 0.336
Kilburn Engg. 7 0.176 0.047 0.018 0.119 0.232
Mipco Seamless 8 0.150 0.041 0.014 0.106 0.193
Stovec Industries 9 0.229 0.075 0.025 0.156 0.301
Windsor Machines 8 0.148 0.056 0.020 0.088 0.208
ANOVA
Source of Variation SS df MSS F-Calc P-value F crit
Between Groups 6.019 20 0.301 17.777 0.000 1.634
Within Groups 2.810 166 0.017
Total 8.830 186
236
Mean dividend payout ratio of GMM Pfaudler is highest (85.90)
among all the companies. Batliboi has mean ratio of 13.70 which is
least among all the companies. The ANOVA test is applied to
compare the mean dividend payout ratiofor all the companies. F value
is 17.777 with the corresponding P value 0.000. As P value is less
than 0.01, it is concluded that this difference is significant at less than
1 % level of significance.
During the period of 1991 to 2002, dividend payout was very high
in case of GMM Pfaudler, Ingersoll Rand and ABB.
Increasing trend has been observed in the rate of dividend declared
by majority of companies from 1991 to 1996. This is on account of
more earnings on equity till 1996. After 1996, the rate of dividend
declared/paid by different companies has fallen down year by year
on account of lesser business and resultant reduced profit before
tax as well as profit after tax. Only in case of two companies,
Ingersoll Rand and Blue Star there was increase of dividend
declared after 1996, on account of their ability to sustain business
operations, cost control and good profitability during that period.
Some of the companies like Bosch Rexroth, Elecon Engineering,
Jord Engineering, Kilburn Engineering and Windsor Machines
incurred losses after 1996 till 2002. This is due to reduced
business, absence of cost control and lower profitability on account
of operations at lower level of activity (Sales), and having heavy
pressure of fixed overheads.

237
Ratio 7; Earnings Per Share
No. Company 1991 1992 1993 1994 1995 1996 1997 1998 1999 2000 2001 2002 1 ABC 8.916 14.831 9.221 6.338 5.882 NA 13.426 1.263 NA 1.870 2.857 NA 2 ABB 10.061 16.907 14.879 16.347 20.129 49.871 15.653 9.112 8.982 13.040 15.415 22.928 3 Batliboi 10.577 2.476 NA NA 10.528 2.545 NA NA 0.939 NA NA NA 4 Bosch Re 6.933 1.511 3.667 3.867 2.333 NA 1.644 NA NA 4.302 8.396 9.189 5 Blue Star 11.962 5.207 5.798 6.071 16.302 9.293 5.454 5.724 6.004 8.577 11.585 14.223 6 Banco Products 48.267 4.000 2.434 3.467 2.219 13.284 20.089 20.237 22.278 17.056 8.935 10.917 7 Elecon 0.638 1.116 1.222 2.036 11.829 18.187 15.105 16.088 15.257 6.018 0.602 NA 8 Eimco Elecon 17.374 17.879 6.411 11.901 17.039 15.407 13.432 10.693 13.293 14.437 14.818 14.558 9 FAGBearing 8.160 5.138 0.840 1.713 4.908 5.122 7.354 6.205 4.326 7.750 9.037 11.895
10 GMM 14.645 16.279 19.547 30.987 25.393 42.929 35.072 19.359 10.999 9.436 9.077 5.795 11 Gujarat Apollo NA 2.950 5.182 7.160 7.143 NA NA NA 10.686 8.943 NA 9.543 12 HindustanDorr Oliver 5.453 5.789 6.695 5.621 8.232 11.411 1.389 7.642 2.253 NA 7.432 6.716 13 Hitachi H & L 0.322 1.582 2.012 3.548 5.865 NA NA 3.663 NA 2.652 NA NA 14 Ingersoll Rand 8.971 11.537 6.665 7.463 7.745 8.715 11.163 15.497 17.188 16.593 16.171 NA 15 Jyoti 15.230 8.907 8.237 3.594 4.503 0.424 0.248 0.197 2.142 3.135 1.200 NA 16 Jord Engg. NA 1.429 1.382 6.272 6.484 8.273 3.636 2.398 NA NA NA NA 17 Kabra Extrusion 3.371 4.794 6.255 8.427 8.980 14.810 7.551 4.781 5.510 8.834 11.079 10.292 18 Kilburn Engg. 3.392 2.910 3.085 2.889 3.422 3.215 1.956 NA NA NA NA NA 19 Mipco Seamless 5.437 5.037 3.002 3.502 3.936 3.983 4.930 NA NA NA NA NA 20 Stovec Industries 19.820 3.866 6.723 7.177 2.010 1.770 NA NA NA 12.919 13.254 6.938 21 Windsor Machines 9.633 6.353 1.203 1.917 4.663 9.018 NA 1.863 NA NA NA NA

238
Ratio 7
C. I. For Mean
Company N Mean S.D. SE of mean Lower Bound Upper Bound
ABC 9 7.178 4.861 1.620 2.450 11.907
ABB 12 17.777 10.945 3.160 9.219 26.335
Batliboi 5 5.413 4.735 2.118 -2.863 13.689
Bosch Re 9 4.649 2.868 0.956 1.859 7.439
Blue Star 12 8.850 3.832 1.106 5.854 11.846
Banco Products 12 14.432 12.951 3.739 4.306 24.557
Elecon 11 8.009 7.272 2.192 1.953 14.065
Eimco Elecon 12 13.937 3.198 0.923 11.436 16.437
FAGBearing 12 6.037 3.076 0.888 3.632 8.442
GMM 12 19.960 11.519 3.325 10.954 28.966
Gujarat Apollo 7 7.372 2.665 1.007 4.143 10.602
HindustanDorr Oliver 11 6.239 2.741 0.827 3.956 8.522
Hitachi Home &Life 7 2.806 1.778 0.672 0.651 4.961
Ingersoll Rand 11 11.610 4.050 1.221 8.237 14.983
Jyoti 11 4.347 4.697 1.416 0.435 8.259
Jord Engg. 7 4.268 2.746 1.038 0.939 7.596
Kabra Extrusion 12 7.890 3.224 0.931 5.370 10.411
Kilburn Engg. 7 2.981 0.499 0.189 2.376 3.586
Mipco Seamless 7 4.261 0.892 0.337 3.180 5.342
Stovec Industries 9 8.275 5.980 1.993 2.458 14.092
Windsor Machines 7 4.950 3.495 1.321 0.714 9.186
ANOVA Source of Variation SS df MSS F-Calc P-value F crit
Between Groups 4776.203 20 238.810 6.246 0.000 1.629Within Groups 6920.274 181 38.234 Total 11696.477 201
239
Mean earnings per share of GMM Pfaudler is highest (199.60)
among all the companies. Kilburn Engineering has mean ratio of
29.81 which is least among all the companies. The ANOVA test is
applied to compare the mean earnings per share for all the
companies. F value is 6.246 with the corresponding P value 0.000.
As P value is less than 0.01 %, it is concluded that this difference
is significant at less than 1 % level of significance.
EPS has been found very high in case of GMM Pfaudler, ABB and
Banco Products. It was very low for Kilburn Engineering and Jord
Engineering.
In most of the cases, the EPS has moderately increased from 1991
to 1996. After 1996 there is a down trend in many companies. In
case of some companies, it has been found that their EPS in 2002
was lower than 1991, on account of recessionary pressures, lower
business, increasing administrative expenses and no control on
overheads. When the EPS of 2002 is compared with EPS of 1991,
it is evident that it has gone up by 127 % for ABB, 20 % for Blue
Star and 90 % for Ingersoll Rand. In case of ABB, the earning per
share in 1996 was at peak, i. e. five times, an increase of 495 %
after 1991. In case of GMM Pfaudler also in 1996 this was four
times compared to 1991 and increase of 300 percent compared to
1991. However, this can be considered an exceptional cases.
Overall, in majority of the cases, the EPS has gone down on
account of general recession in the economy after 1996, lesser
business and pressures on the cost structure.

240
Ratio 8; Tax Provision to Profit Ratio
No. Company 1991 1992 1993 1994 1995 1996 1997 1998 1999 2000 2001 2002
1 ABC 0.513 0.387 0.374 NA 0.160 0.021 0.148 0.110 NA 0.036 0.096 NA 2 ABB 0.418 0.047 0.419 0.036 0.376 0.238 0.255 0.244 0.030 0.023 0.002 0.029 3 Batliboi NA NA NA NA NA NA NA NA NA NA NA NA 4 Bosch Re 0.350 0.382 0.493 NA NA NA 0.295 NA NA 0.066 0.378 0.409 5 Blue Star 0.096 0.119 0.088 0.350 0.259 0.290 0.378 0.146 0.101 0.078 0.008 0.006 6 Banco Products 0.044 0.247 0.140 0.959 1.497 0.187 0.299 0.290 0.278 0.312 0.318 0.277 7 Elecon 0.825 NA 0.169 0.661 0.150 0.171 0.128 0.134 0.375 0.320 0.128 NA 8 Eimco Elecon 0.526 0.606 0.538 0.453 0.402 0.373 0.383 0.376 0.364 0.365 0.402 0.248 9 FAGBearing 0.456 NA 0.026 NA 0.222 0.517 0.436 0.269 0.077 0.301 0.225 0.198
10 GMM 0.375 0.481 0.467 0.453 0.459 0.423 0.333 0.256 0.463 0.303 0.256 0.204 11 Gujarat Apollo NA NA 0.245 0.304 0.265 NA NA NA 0.213 0.039 0.333 0.303 12 HindustanDorr Oliver 0.535 0.521 0.453 0.494 0.236 0.304 0.705 0.442 0.483 NA 0.066 0.243 13 Hitachi H & L NA 0.289 0.040 NA NA NA NA NA NA 0.048 NA NA 14 Ingersoll Rand 0.375 0.412 0.408 0.403 0.344 0.341 0.321 0.315 0.313 0.311 0.291 NA 15 Jyoti NA NA NA NA NA 0.556 0.662 0.850 0.040 0.239 0.393 NA 16 Jord Engg. NA NA NA 0.009 NA NA 0.031 0.024 NA NA NA NA 17 Kabra Extrusion 0.143 0.285 0.345 0.375 0.375 0.191 0.220 0.109 0.156 0.165 0.269 0.235 18 Kilburn Engg. 0.296 0.453 0.435 0.278 0.091 0.172 0.138 NA NA NA NA NA 19 Mipco Seamless NA 0.274 0.411 0.205 NA NA 0.372 NA NA NA NA NA 20 Stovec Industries NA 0.352 0.448 NA NA NA NA NA NA 0.115 0.086 0.076 21 Windsor Machines 0.227 0.269 NA 0.051 0.153 0.120 NA 0.107 NA NA NA NA

241
Ratio 8
C. I. For Mean Company N Mean S.D. SE of mean Lower Bound Upper Bound
ABC 9 0.205 0.175 0.058 0.035 0.375
ABB 12 0.177 0.167 0.048 0.046 0.307
Batliboi 0
Bosch Re 7 0.339 0.135 0.051 0.176 0.502
Blue Star 12 0.160 0.127 0.037 0.060 0.259
Banco Products 12 0.404 0.410 0.118 0.084 0.724
Elecon 10 0.306 0.248 0.079 0.084 0.528
Eimco Elecon 12 0.420 0.097 0.028 0.344 0.495
FAGBearing 10 0.273 0.160 0.051 0.130 0.416
GMM 12 0.373 0.099 0.029 0.296 0.450
Gujarat Apollo 7 0.243 0.099 0.037 0.123 0.363 HindustanDorr Oliver 11 0.408 0.178 0.054 0.259 0.556
Hitachi Home &Life 3 0.125 0.142 0.082 -0.497 0.748
Ingersoll Rand 11 0.349 0.044 0.013 0.312 0.385
Jyoti 6 0.457 0.294 0.120 0.041 0.872
Jord Engg. 3 0.021 0.012 0.007 -0.029 0.072
Kabra Extrusion 12 0.239 0.092 0.026 0.167 0.311
Kilburn Engg. 7 0.266 0.142 0.054 0.094 0.438
Mipco Seamless 4 0.315 0.094 0.047 0.090 0.541
Stovec Industries 5 0.215 0.173 0.077 -0.087 0.517
Windsor Machines 6 0.154 0.081 0.033 0.040 0.269
ANOVA Source of Variation SS Df MSS F-Calc P-value F crit
Between Groups 1.730 19 0.091 2.785 0.000 1.656Within Groups 4.937 151 0.033 Total 6.667 170

242
Mean tax provision to PBT ratio of Jyoti Ltd. is highest (45.70)
among all the companies. Blue Star has mean ratio of 16.00 which
is least among all the companies (Jord Engineering & Hitachi
ignored, since they are loss making companies). The ANOVA test
is applied to compare the mean tax provision to PBT ratio for all
the companies. F value is 2.785 with the corresponding P value
0.000. As P value is less than 0.01, it is concluded that this
difference is significant at less than 1 % level of significance.
It has been observed that among all the companies, Blue Star,
ABB, and FAG Bearings have been doing best tax planning,
whereby they pay least income tax. Their average tax provision
made in books is least among all the companies. Jyoti Ltd.,
Hindustan Dorr Oliver and Banco Products have very weak tax
planning.
Effective Tax planning has not been observed in majority of the
cases. Only professionally managed companies like ABB, Blue
Star and Ingersoll Rand have paid lesser corporation tax than the
rate of effective tax on profit before tax earned by them. To some
extent, companies like Elecon Engineering, Banco products and
Kabra Extrusion are found to practice systemic tax planning, by
making lower tax provision and least possible tax payment. Tax
planning leads to saving of money and its plough back in the
business. This can increase the financial strength of the company.
This has not been observed in case of other companies.

243
Ratio 9; Sales to Admn. and General Expenses Ratio
No. Company 1991 1992 1993 1994 1995 1996 1997 1998 1999 2000 2001 2002 1 ABC 0.015 0.014 0.018 0.032 0.024 0.024 0.045 0.065 0.047 0.046 0.047 0.068 2 ABB 0.116 0.105 0.098 0.111 0.108 0.091 0.109 0.143 0.123 0.116 0.110 0.107 3 Batliboi 0.062 0.066 NA 0.050 0.062 0.070 0.086 0.099 0.116 NA 0.169 0.265 4 Bosch Re 0.134 0.160 0.108 0.175 0.156 0.147 0.136 0.142 0.113 0.115 0.100 0.104 5 Blue Star 0.101 0.082 0.093 0.085 0.084 0.098 0.091 0.085 0.088 0.089 0.086 0.090 6 Banco Products 0.056 0.061 0.067 0.067 0.059 0.065 0.071 0.086 0.094 0.091 0.101 0.091 7 Elecon 0.082 0.089 0.062 0.044 0.054 0.065 0.078 0.085 0.074 0.089 0.100 0.121 8 Eimco Elecon 0.104 0.110 0.098 0.109 0.103 0.126 0.132 0.170 0.154 0.141 0.125 0.129 9 FAGBearing 0.182 0.137 0.151 0.175 0.182 0.116 0.130 0.123 0.115 0.134 0.131 0.144
10 GMM 0.093 0.124 0.148 0.103 0.110 0.125 0.120 0.206 0.158 0.142 0.163 0.151 11 Gujarat Apollo NA 0.074 0.088 0.103 0.102 NA NA NA 0.099 0.083 0.079 0.066 12 HindustanDorr Oliver 0.040 0.050 0.096 0.090 0.108 0.104 0.110 0.118 0.121 0.256 0.191 0.162 13 Hitachi H & L 0.005 0.011 0.046 0.059 0.082 NA NA 0.142 0.148 0.171 0.157 0.148 14 Ingersoll Rand 0.110 0.095 0.122 0.115 0.111 NA 0.087 0.103 0.182 0.213 0.246 NA 15 Jyoti 0.088 0.069 0.074 0.071 0.056 0.068 0.071 0.098 0.117 0.114 0.070 0.087 16 Jord Engg. NA 0.047 0.056 0.038 0.035 0.038 0.067 0.035 NA 0.032 0.021 0.033 17 Kabra Extrusion 0.089 0.055 0.074 0.056 0.058 0.094 0.128 0.126 0.144 0.121 0.134 0.121 18 Kilburn Engg. 0.198 0.265 0.161 0.125 0.166 0.149 0.156 0.170 0.236 1.006 0.440 0.250 19 Mipco Seamless 0.020 0.033 0.035 0.038 0.031 0.025 0.034 0.028 0.073 0.030 0.035 0.061 20 Stovec Industries 0.138 0.117 0.115 0.106 0.124 0.125 NA 0.111 0.126 0.156 0.147 0.122 21 Windsor Machines 0.054 0.055 0.080 0.074 0.064 0.086 0.121 0.131 0.190 0.142 0.134 0.156

244
Ratio 9
C. I. For Mean Company N Mean S.D. SE of mean Lower Bound Upper Bound
ABC 12 0.037 0.019 0.005 0.022 0.052 ABB 12 0.111 0.013 0.004 0.101 0.122 Batliboi 10 0.105 0.067 0.021 0.045 0.164 Bosch Re 12 0.133 0.024 0.007 0.113 0.152 Blue Star 12 0.089 0.006 0.002 0.085 0.094 Banco Products 12 0.076 0.016 0.005 0.063 0.088 Elecon 12 0.079 0.021 0.006 0.062 0.095 Eimco Elecon 12 0.125 0.022 0.006 0.108 0.142 FAGBearing 12 0.143 0.024 0.007 0.124 0.162 GMM 12 0.137 0.031 0.009 0.113 0.161 Gujarat Apollo 8 0.087 0.014 0.005 0.072 0.101 HindustanDorr Oliver 12 0.121 0.059 0.017 0.074 0.167 Hitachi Home &Life 10 0.097 0.064 0.020 0.040 0.154 Ingersoll Rand 10 0.138 0.055 0.017 0.089 0.188 Jyoti 12 0.082 0.019 0.006 0.067 0.097 Jord Engg. 10 0.040 0.013 0.004 0.028 0.052 Kabra Extrusion 12 0.100 0.033 0.010 0.074 0.126 Kilburn Engg. 12 0.277 0.245 0.071 0.085 0.468 Mipco Seamless 12 0.037 0.015 0.004 0.025 0.049 Stovec Industries 11 0.126 0.015 0.005 0.113 0.139 Windsor Machines 12 0.107 0.044 0.013 0.072 0.142
ANOVA
Source of Variation SS df MSS F-Calc P-value F crit Between Groups 0.600 20 0.030 7.365 0.000 1.619Within Groups 0.888 218 0.004 Total 1.488 238
Mean general expenses to sales ratio of Kilburn Engineering is highest
(27.70) among all the companies. Mipco Seamless has mean ratio of
3.70 which is least among all the companies. The ANOVA test is
applied to compare the mean general expenses to sales ratio for all the
companies. F value is 7.365 with the corresponding P value 0.000. As
P value is less than 0.01, it is concluded that this difference is
significant at less than 1 % level of significance.
Kilburn Engineering, FAG Bearings and Ingersoll Rand are having
very heavy administration, sales and general expenses in their cost
structure.

245
Ratio 10; Gross Profit Ratio
No. Company 1991 1992 1993 1994 1995 1996 1997 1998 1999 2000 2001 2002 1 ABC 0.572 0.589 0.581 0.599 0.592 0.405 0.353 0.281 0.456 0.376 0.467 0.425 2 ABB 0.299 0.342 0.296 0.327 0.308 0.294 0.290 0.326 0.273 0.277 0.271 0.272 3 Batliboi 0.882 0.319 NA 0.181 0.185 0.161 0.224 0.205 0.252 NA 0.259 0.351 4 Bosch Re 0.424 0.432 0.420 0.446 0.392 0.173 0.315 0.399 0.237 0.318 0.274 0.476 5 Blue Star 0.214 0.193 0.196 0.213 0.209 0.224 0.216 0.210 0.221 0.234 0.208 0.218 6 Banco Products 0.515 0.208 0.092 0.133 0.049 0.112 0.159 0.158 0.150 0.196 0.122 0.143 7 Elecon 0.370 0.427 0.409 0.302 0.342 0.392 0.449 0.581 0.288 0.241 0.237 0.190 8 Eimco Elecon 0.410 0.439 0.434 0.523 0.510 0.430 0.409 0.431 0.406 0.414 0.363 0.400 9 FAGBearing 0.251 0.274 0.269 0.487 0.507 0.675 0.545 0.520 0.513 0.539 0.543 0.544
10 GMM 0.626 0.648 0.626 0.642 0.564 0.610 0.573 0.622 0.596 0.599 0.571 0.585 11 Gujarat Apollo NA 0.112 0.128 0.168 0.187 NA NA NA 0.116 0.087 0.079 0.094 12 HindustanDorr Oliver 0.276 0.312 0.314 0.276 0.289 0.194 0.180 0.270 0.211 0.217 0.366 0.272 13 Hitachi H & L 0.055 0.101 0.094 0.091 0.086 NA NA 0.043 NA 0.038 0.000 0.000 14 Ingersoll Rand NA 0.159 0.153 0.167 0.157 NA 0.364 0.392 0.392 0.371 0.028 NA 15 Jyoti 0.402 0.377 0.391 0.406 0.381 0.346 0.392 0.385 0.298 0.304 0.310 0.276 16 Jord Engg. NA 0.712 0.249 0.199 0.362 0.204 0.119 0.114 NA 0.053 0.068 0.000 17 Kabra Extrusion 0.424 0.374 0.347 0.344 0.376 0.263 0.341 0.201 0.222 0.272 0.279 0.367 18 Kilburn Engg. 0.461 0.542 0.509 0.461 0.609 0.536 0.481 0.357 0.369 0.366 0.302 0.361 19 Mipco Seamless 0.232 0.234 0.194 0.181 0.193 0.302 0.419 0.361 0.190 0.147 0.338 0.381 20 Stovec Industries 0.549 0.521 0.529 0.524 0.607 0.299 NA 0.261 0.399 0.360 0.329 0.419 21 Windsor Machines 0.293 0.327 0.322 0.302 0.308 0.260 0.400 0.456 0.355 0.444 0.394 0.201

246
Ratio 10 C. I. For Mean
Company N Mean S.D. SE of mean Lower Bound Upper BoundABC 12 0.475 0.110 0.032 0.389 0.561 ABB 12 0.298 0.024 0.007 0.279 0.316 Batliboi 10 0.302 0.213 0.067 0.112 0.492 Bosch Re 12 0.359 0.094 0.027 0.285 0.432 Blue Star 12 0.213 0.011 0.003 0.204 0.222 Banco Products 12 0.170 0.117 0.034 0.078 0.261 Elecon 12 0.352 0.109 0.031 0.267 0.438 Eimco Elecon 12 0.431 0.045 0.013 0.396 0.466 FAGBearing 12 0.472 0.134 0.039 0.368 0.577 GMM 12 0.605 0.028 0.008 0.583 0.627 Gujarat Apollo 8 0.121 0.039 0.014 0.080 0.163 HindustanDorr Oliver 12 0.265 0.055 0.016 0.222 0.308 Hitachi Home &Life 9 0.057 0.039 0.013 0.018 0.095 Ingersoll Rand 9 0.243 0.137 0.046 0.109 0.376 Jyoti 12 0.356 0.046 0.013 0.319 0.392 Jord Engg. 10 0.208 0.206 0.065 0.023 0.393 Kabra Extrusion 12 0.318 0.069 0.020 0.264 0.371 Kilburn Engg. 12 0.446 0.094 0.027 0.372 0.520 Mipco Seamless 12 0.264 0.091 0.026 0.193 0.336 Stovec Industries 11 0.436 0.116 0.035 0.340 0.532 Windsor Machines 12 0.338 0.075 0.022 0.280 0.397
ANOVA
Source of Variation SS df MSS F-Calc P-value F crit Between Groups 3.670 20 0.184 17.993 0.000 1.619Within Groups 2.203 216 0.010
Mean gross profit ratio of GMM Pfaudler is highest (60.50) among all the companies. Hitachi Home and Life Solutions has mean ratio of 5.70 which is least among all the companies. The ANOVA test is applied to compare the mean gross profit ratio for all the companies. F value is 17.993 with the corresponding P value 0.000. As P value is less than 0.01, it is concluded that this difference is significant at less than 1 % level of significance.
As per the data reflected by the financial statements, GMM Pfaudler, Antifriction Bearings and FAG Bearings are having highest gross profit earning capacity. Hitachi Home and Life solutions and Gujarat Apollo are having very low gross profit ratio, and hence heavy material consumption cost and labour cost.
During this period of study fro 1991 to 2002, it is observed that gross profit has gown down in case of all the companies, except Ingersoll Rand after 1996. This is on account of increasing material cost and other direct manufacturing costs. In case of Ingersoll Rand, gross profit ratio has gone up on account of better inventory management and control of direct manufacturing costs.

247
Ratio 11; Earning on Equity Capital Ratio
No. Company 1991 1992 1993 1994 1995 1996 1997 1998 1999 2000 2001 2002 1 ABC 1.830 2.418 1.473 0.634 0.701 1.149 1.576 0.142 NA 0.194 0.316 NA 2 ABB 1.729 3.202 2.560 2.536 3.229 6.549 2.035 1.139 1.908 1.813 1.444 3.275 3 Batliboi 1.057 0.247 NA 0.000 0.748 0.255 NA NA 0.094 NA NA NA 4 Bosch Re 1.067 0.244 0.723 0.653 0.156 0.080 0.233 NA NA 0.460 1.349 1.432 5 Blue Star 1.324 0.590 0.637 0.934 2.199 1.308 0.820 0.630 0.668 0.929 1.257 1.415 6 Banco Products 5.740 2.373 0.455 0.436 0.423 1.633 2.864 2.852 3.086 2.479 1.311 1.550 7 Elecon 3.971 0.112 0.147 0.600 1.389 1.850 1.761 1.837 2.441 0.885 0.069 NA 8 Eimco Elecon 3.667 4.535 1.386 2.177 2.849 2.456 2.179 1.714 2.092 2.276 2.478 2.256 9 FAGBearing 1.499 0.509 0.086 0.171 0.631 1.061 1.302 0.870 0.274 0.486 1.109 1.528
10 GMM 2.346 3.138 3.667 5.667 4.698 7.434 5.258 2.453 1.672 1.354 1.000 0.554 11 Gujarat Apollo NA 0.268 0.604 0.734 0.950 NA NA NA 1.357 1.466 1.266 1.463 12 HindustanDorr Oliver 0.545 0.579 0.802 0.562 0.823 1.640 0.472 1.371 0.436 NA 0.796 0.781 13 Hitachi H & L 1.200 0.223 0.210 0.355 0.586 NA NA 0.328 NA 0.271 NA NA 14 Ingersoll Rand 1.436 1.962 1.126 1.250 1.181 1.322 1.643 2.262 2.503 2.407 2.282 NA 15 Jyoti 1.522 0.891 0.824 0.359 0.450 0.028 0.073 0.131 0.318 0.412 0.198 NA 16 Jord Engg. NA 0.076 0.221 0.321 0.648 0.827 0.375 0.246 NA NA NA NA 17 Kabra Extrusion 0.393 0.670 0.955 1.348 1.437 1.831 0.968 0.536 0.653 1.058 1.516 1.741 18 Kilburn Engg. 0.481 0.531 0.546 0.400 0.376 0.344 0.215 NA NA NA NA NA 19 Mipco Seamless 0.543 0.693 0.503 0.440 0.393 0.399 0.788 NA NA NA NA NA 20 Stovec Industries NA 0.395 1.176 1.679 3.397 0.177 NA NA NA 1.459 1.450 1.139 21 Windsor Machines 1.246 0.869 0.120 0.202 0.551 1.025 NA 0.209 NA NA NA NA

248
Ratio 11 C. I. For Mean Company N Mean S.D. SE of mean Lower Bound Upper BoundABC 10 1.043 0.770 0.243 0.354 1.732 ABB 12 2.618 1.429 0.412 1.501 3.735 Batliboi 6 0.400 0.412 0.168 -0.183 0.983 Bosch Re 10 0.640 0.497 0.157 0.195 1.084 Blue Star 12 1.059 0.469 0.135 0.692 1.426 Banco Products 12 2.100 1.508 0.435 0.921 3.279 Elecon 11 1.369 1.188 0.358 0.380 2.359 Eimco Elecon 12 2.505 0.851 0.246 1.840 3.171 FAGBearing 12 0.794 0.507 0.146 0.397 1.191 GMM 12 3.270 2.122 0.613 1.611 4.929 Gujarat Apollo 8 1.013 0.446 0.158 0.534 1.493 HindustanDorr Oliver 11 0.801 0.380 0.115 0.484 1.117 Hitachi Home &Life 7 0.453 0.353 0.133 0.026 0.881 Ingersoll Rand 11 1.761 0.533 0.161 1.317 2.205 Jyoti 11 0.473 0.446 0.134 0.102 0.845 Jord Engg. 7 0.388 0.262 0.099 0.071 0.705 Kabra Extrusion 12 1.092 0.480 0.139 0.717 1.468 Kilburn Engg. 7 0.413 0.117 0.044 0.272 0.555 Mipco Seamless 7 0.537 0.151 0.057 0.354 0.721 Stovec Industries 8 1.359 0.977 0.345 0.310 2.408 Windsor Machines 7 0.603 0.450 0.170 0.058 1.148
ANOVA Source of Variation SS df MSS F-Calc P-value F crit
Between Groups 143.851 20 7.193 8.694 0.000 1.628Within Groups 152.232 184 0.827 Total 296.082 204
Mean return on equity capital of GMM Pfaudler is highest (327)
among all the companies. Kilburn Engineering has mean ratio of
41.30 which is least among all the companies. The ANOVA test is
applied to compare the mean return on equity for all the companies. F
value is 8.694 with the corresponding P value 0.000. As P value is less
than 0.01, it is concluded that this difference is significant at less than
1 % level of significance.

249
GMM Pfaudler, ABB and Eimco Elecon are having very high EPS
ratio.
The comparison of profit before tax with equity capital has shown
erratic behaviour throughout the period of 1991 to 2002. However
this has been found in the year 1995 and 1996. After 1996, this
ratio has gone down till 2002.This was 743 percent in case of
GMM Pfaudler, which is the highest among all the companies
during the period of study. This is on account of higher margin
orders, monopolistic position and highest amount of sales turnover
of the concerned company during the period of study. This has
been reflected in the highest ever declaration of dividend of 115 %
for the Accounting year 1995-96 in case of GMM Pfaudler Ltd.
However, in case of this company, this ratio has gone down
drastically after 1996, on account of heavy fall in operations and
lower sales year after year, after 1996 till 2002. Only in case of one
company, Ingersoll Rand India Ltd. There was no down trend in
this ratio, i. e. profit before tax to equity capital, even after 1996.
On the contrary, this is increasing. This is even when after 1996,
the sales was down in the year 1999 and 2001. Otherwise also, this
company has very healthy working with professional management,
because of which with reference to different parameters, as
discussed earlier, the performance is found to be best among all
other companies covered by this study. This is praiseworthy, since
the results are showing better performance even during bad
economic and business environment.

250
Ratio 12; Salaries & Wages to Sales Ratio
No. Company 1991 1992 1993 1994 1995 1996 1997 1998 1999 2000 2001 2002 1 ABC 0.010 0.010 0.010 0.010 0.010 0.094 0.087 0.153 0.175 0.160 0.148 0.160 2 ABB 0.111 0.105 0.085 0.092 0.086 0.078 0.095 0.125 0.135 0.128 0.108 0.102 3 Batliboi 0.068 0.066 NA 0.082 0.075 0.076 0.099 0.113 0.169 NA 0.270 0.266 4 Bosch Re 0.090 0.083 0.085 0.103 0.095 0.115 0.142 0.134 0.135 0.138 0.111 0.125 5 Blue Star 0.104 0.096 0.104 0.103 0.091 0.097 0.100 0.106 0.103 0.115 0.100 0.106 6 Banco Products 0.195 0.119 0.095 0.067 0.040 0.083 0.078 0.096 0.087 0.085 0.108 0.081 7 Elecon 0.082 0.113 0.098 0.075 0.090 0.100 0.098 0.113 0.104 0.149 0.104 0.103 8 Eimco Elecon 0.026 0.027 0.025 0.032 0.032 0.032 0.036 0.044 0.045 0.037 0.034 0.050 9 FAGBearing 0.127 0.108 0.111 0.105 0.130 0.135 0.099 0.106 0.102 0.122 0.119 0.114
10 GMM 0.216 0.230 0.113 0.098 0.176 0.161 0.164 0.150 0.165 0.172 0.151 0.160 11 Gujarat Apollo NA 0.018 0.015 0.020 0.019 NA NA NA 0.028 0.024 0.025 0.031 12 HindustanDorr Oliver 0.075 0.080 0.075 0.069 0.075 0.061 0.059 0.077 0.078 0.096 0.175 0.167 13 Hitachi H & L 0.014 0.018 0.022 0.018 0.020 0.040 0.040 0.061 0.071 0.064 0.067 0.073 14 Ingersoll Rand 0.090 0.077 0.074 0.092 0.103 0.093 0.100 0.102 NA 0.090 0.124 NA 15 Jyoti 0.218 0.208 0.209 0.230 0.242 0.248 0.185 0.194 0.168 0.153 0.147 0.244 16 Jord Engg. NA 0.030 0.018 0.015 0.015 0.016 0.013 0.013 NA 0.018 0.012 0.022 17 Kabra Extrusion 0.064 0.051 0.046 0.042 0.037 0.037 0.058 0.052 0.065 0.066 0.063 0.076 18 Kilburn Engg. 0.145 0.157 0.130 0.121 0.145 0.143 0.119 0.094 0.167 0.340 0.345 0.204 19 Mipco Seamless 0.040 0.046 0.049 0.060 0.060 0.090 0.095 0.157 0.208 0.133 0.144 0.121 20 Stovec Industries 0.097 0.125 0.119 0.122 0.135 0.132 0.150 0.140 0.121 0.097 0.090 0.098 21 Windsor Machines 0.074 0.075 0.107 0.111 0.093 0.121 0.155 0.139 0.194 0.168 0.151 0.174

251
Ratio 12
C. I. For Mean Company N Mean S.D. SE of mean Lower Bound Upper Bound
ABC 12 0.086 0.071 0.021 0.030 0.141 ABB 12 0.104 0.018 0.005 0.090 0.118 Batliboi 10 0.128 0.080 0.025 0.057 0.200 Bosch Re 12 0.113 0.022 0.006 0.096 0.130 Blue Star 12 0.102 0.006 0.002 0.097 0.107 Banco Products 12 0.095 0.037 0.011 0.065 0.124 Elecon 12 0.102 0.018 0.005 0.088 0.117 Eimco Elecon 12 0.035 0.008 0.002 0.029 0.041 FAGBearing 12 0.115 0.012 0.003 0.106 0.124 GMM 12 0.163 0.036 0.011 0.134 0.191 Gujarat Apollo 8 0.023 0.005 0.002 0.017 0.028 HindustanDorr Oliver 12 0.091 0.039 0.011 0.060 0.121 Hitachi Home &Life 12 0.042 0.023 0.007 0.024 0.061 Ingersoll Rand 10 0.095 0.014 0.004 0.082 0.107 Jyoti 12 0.204 0.035 0.010 0.177 0.231 Jord Engg. 10 0.017 0.005 0.002 0.012 0.022 Kabra Extrusion 12 0.055 0.012 0.004 0.045 0.065 Kilburn Engg. 12 0.176 0.082 0.024 0.111 0.240 Mipco Seamless 12 0.100 0.053 0.015 0.059 0.142 Stovec Industries 12 0.119 0.020 0.006 0.104 0.134 Windsor Machines 12 0.130 0.039 0.011 0.099 0.161
ANOVA Source of Variation SS df MSS F-Calc P-value F crit
Between Groups 0.509 20 0.025 17.299 0.000 1.618Within Groups 0.325 221 0.001 Total 0.835 241
Mean salaries & wages to Sales ratio of Jyoti Ltd. is highest (20.40)
among all the companies. Eimco Elecon has mean ratio of 3.50 which is
least among all the companies (Jord Engineering ignored). The ANOVA
test is applied to compare the mean Salaries to Sales ratio for all the
companies. F value is 17.299 with the corresponding P value 0.000. As P
value is less than 0.01, it is concluded that this difference is significant at
less than 1 % level of significance.

252
Jyoti Ltd., Kilburn Engineering and GMM are having heavy load
of salaries and wages in their cost structure. This is very low in
case of Eimco Elecon, Hitachi H & L and Antifriction Bearing
Corporation.
By and large, all the companies were able to maintain salaries and
wages cost compared to sales income during the period of study.
This component of cost, in terms of its load on overall activity, has
been found to be constant. Only in case of three companies, HDO,
Kilburn Engineering and Windsor Machines, there is increasing
trend even when there is growth in sales year after year. The fact
that HDO and Kilburn Engineering are the companies engaged in
fabrication business, there is heavy involvement of labour force in
the manufacturing activities of these companies. In case of other
companies, this cost has been under control on account of benefit
of Voluntary Retirement Scheme availed by majority of the
companies.
The ratio of sales and General Administrative expenses has shown
that this block of expenses as a major expenses for engineering
companies. With the increase in activities, i.e., Sales, the
proportion of this type of expenses should come down. However,
in certain companies like Ingersoll Rand, Elecon and GMM
Pfaudler, these expenses proportion has gone up. This shows a link
of this type of expenses with their activities.

253
Ratio 13; Interest Coverage Ratio
No. Company 1991 1992 1993 1994 1995 1996 1997 1998 1999 2000 2001 2002 1 ABC 1.176 1.057 0.557 0.498 0.632 0.786 0.826 0.077 NA 0.251 0.313 NA 2 ABB 0.925 1.226 3.368 2.982 5.700 8.991 5.917 3.871 6.078 6.539 5.342 16.469 3 Batliboi 0.435 0.065 NA -0.619 0.323 0.094 NA -0.002 0.028 NA NA NA 4 Bosch Re 0.658 0.122 0.362 0.237 0.143 NA 0.123 -0.517 NA 0.534 1.395 1.685 5 Blue Star 0.979 0.660 0.671 1.047 3.237 6.343 2.998 2.790 1.650 2.436 2.709 4.911 6 Banco Products 3.017 0.256 0.235 0.574 0.815 1.321 2.248 3.288 3.519 6.904 5.441 11.015 7 Elecon 0.042 0.059 0.057 0.137 0.850 1.262 1.200 1.373 1.019 0.553 0.047 NA 8 Eimco Elecon 0.887 0.617 0.572 2.611 4.686 5.051 3.202 3.809 4.309 4.339 3.563 5.714 9 FAGBearing 1.017 0.461 0.050 0.119 0.749 0.772 0.773 0.683 0.551 1.100 1.534 2.841
10 GMM 23.300 NA NA NA 20.200 10.044 2.876 1.890 0.956 1.484 2.360 2.055 11 Gujarat Apollo NA 5.288 5.483 16.688 24.438 16.938 1.138 6.981 1.202 NA 2.434 1.715 12 HindustanDorr Oliver 54.462 37.163 20.627 21.225 13.892 10.342 14.622 24.832 34.119 20.224 23.100 NA 13 Hitachi H & L 15.111 7.952 17.652 3.662 3.089 0.138 0.060 0.054 0.473 0.828 0.132 NA 14 Ingersoll Rand NA 0.055 0.222 1.147 2.247 2.158 0.848 1.187 NA NA NA NA 15 Jyoti 0.169 0.233 0.279 0.336 0.498 0.668 0.363 0.257 0.355 0.420 0.488 0.372 16 Jord Engg. NA 4.667 2.039 3.900 0.729 0.189 0.106 NA NA NA NA NA 17 Kabra Extrusion 6.037 5.593 3.333 4.375 11.800 4.613 4.214 NA NA NA NA NA 18 Kilburn Engg. 4.400 0.708 0.762 2.000 0.192 0.076 NA NA NA 0.263 0.272 0.123 19 Mipco Seamless 21.146 15.721 4.741 8.160 13.818 6.959 NA 1.328 NA NA NA NA 20 Stovec Industries 0.050 0.158 0.329 0.615 0.761 0.671 0.708 1.126 NA 2.399 NA NA 21 Windsor Machines NA 0.093 0.207 0.381 0.597 0.162 0.198 0.267 0.268 0.216 0.377 0.406

254
Ratio 13
C. I. For Mean Company N Mean S.D. SE of mean Lower Bound Upper Bound
ABC 10 0.617 0.352 0.111 0.302 0.932 ABB 12 5.617 4.120 1.189 2.396 8.839 Batliboi 7 0.047 0.336 0.127 -0.360 0.453 Bosch Re 10 0.474 0.646 0.204 -0.104 1.053 Blue Star 12 2.536 1.742 0.503 1.174 3.897 Banco Products 12 3.219 3.225 0.931 0.698 5.741 Elecon 11 0.600 0.553 0.167 0.139 1.060 Eimco Elecon 12 3.280 1.763 0.509 1.902 4.658 FAGBearing 12 0.888 0.737 0.213 0.312 1.463 GMM 9 7.241 8.694 2.898 -1.217 15.699 Gujarat Apollo 10 8.230 8.189 2.590 0.901 15.559 HindustanDorr Oliver 11 24.965 12.668 3.820 14.414 35.515 Hitachi Home &Life 11 4.468 6.383 1.925 -0.848 9.785 Ingersoll Rand 7 1.123 0.853 0.322 0.089 2.157 Jyoti 12 0.370 0.136 0.039 0.264 0.476 Jord Engg. 6 1.938 1.959 0.800 -0.833 4.709 Kabra Extrusion 7 5.709 2.831 1.070 2.278 9.140 Kilburn Engg. 9 0.977 1.416 0.472 -0.400 2.355 Mipco Seamless 7 10.268 6.911 2.612 1.892 18.643 Stovec Industries 9 0.757 0.699 0.233 0.078 1.437 Windsor Machines 11 0.289 0.142 0.043 0.171 0.406
ANOVA Source of Variation SS df MSS F-Calc P-value F crit
Between Groups 6638.081 20 331.904 15.502 0.000 1.627Within Groups 3982.389 186 21.411 Total 10620.471 206
Mean interest coverage ratio of Hindustan Dorr Oliver is highest (249)
among all the companies. Batliboi has mean ratio of 4.70 which is
least among all the companies. The ANOVA test is applied to
compare the mean interest coverage ratio for all the companies. F
value is 15.502 with the corresponding P value 0.000. As p value is
less than 0.01, it is concluded that this difference is significant at less
than 1 % level of significance.
255
Hindustan Dorr Oliver, Mipco Seamless Rings and Gujarat Apollo
are having very healthy interest coverage ratio. This is very weak
in case of Batliboi, Windsor Machines and Elecon Engineering.
There has been marked mixed performance of different companies
about interest coverage ratio. Some of the companies interest
coverage has improved after 1991 till 2002. But this improvement
is marginal on account of heavy burden of interest cost. It was
highest in case of GMM Pfaudler in initial years (1991 to 1996)
since it was earning interest income on account of heavy liquidity
of funds. However, this company's interest coverage ratio gone
down by eleven times in 2002. This was on account of reduced
profitability and increasing interest cost. In a peculiar situation, the
interest coverage ratio of Ingersoll Rand has gown down after
1991.

256
Ratio 14; Retained Earning to PAT Ratio
No. Company 1991 1992 1993 1994 1995 1996 1997 1998 1999 2000 2001 2002 1 ABC 0.660 0.609 0.913 0.615 0.441 0.323 0.740 0.137 NA 1.000 0.997 NA 2 ABB 0.722 0.822 0.798 0.786 0.801 0.840 0.649 0.396 0.120 0.526 0.648 0.740 3 Batliboi 0.809 0.386 NA -0.329 0.006 1.551 NA NA NA NA NA NA 4 Bosch Re 0.481 1.471 0.073 0.345 0.143 NA 0.986 NA NA 1.000 0.969 1.002 5 Blue Star 0.734 0.651 0.602 0.588 0.786 0.678 0.294 0.328 0.344 0.504 NA 0.087 6 Banco Products 0.959 0.367 0.500 0.487 0.400 2.134 0.895 0.800 0.792 0.429 0.591 0.251 7 Elecon 5.194 1.000 0.348 0.504 0.864 0.912 0.912 0.877 0.817 0.565 1.000 NA 8 Eimco Elecon 0.872 0.650 0.705 0.744 0.777 0.467 0.778 0.695 0.789 0.772 0.745 0.486 9 FAGBearing 0.755 0.778 0.000 0.297 0.695 0.609 0.910 0.678 1.008 2.102 0.075 0.690
10 GMM 0.622 0.602 0.617 0.645 0.547 0.731 0.674 0.347 0.063 0.076 0.458 0.717 11 Gujarat Apollo NA 0.145 0.255 0.449 0.409 0.253 2.742 0.656 2.037 NA NA NA 12 HindustanDorr Oliver 0.083 0.073 0.083 0.053 0.092 0.046 0.001 0.061 0.064 NA 0.024 NA 13 Hitachi H & L NA NA 0.062 0.201 0.321 3.854 NA 7.842 1.618 0.657 NA NA 14 Ingersoll Rand NA 58.474 15.471 3.549 1.887 1.626 3.408 6.980 NA NA NA NA 15 Jyoti 4.533 2.609 2.431 1.102 0.744 0.024 0.093 0.049 0.741 0.795 0.282 NA 16 Jord Engg. NA 0.102 0.144 1.308 1.818 3.014 4.303 NA NA NA NA NA 17 Kabra Extrusion 0.307 0.530 1.111 1.429 1.720 2.587 0.825 NA NA NA NA NA 18 Kilburn Engg. 0.336 0.652 0.463 0.467 1.881 1.541 NA NA NA NA NA NA 19 Mipco Seamless 0.146 0.157 0.352 0.294 0.120 0.060 NA NA NA NA NA NA 20 Stovec Industries 15.833 0.429 0.495 0.556 NA 0.007 NA NA NA 0.559 NA NA 21 Windsor Machines NA 8.407 NA NA 1.420 3.780 NA NA NA NA NA NA

257
Ratio 14
C. I. For Mean Company N Mean S.D. SE of mean Lower Bound Upper Bound
ABC 10 0.643 0.286 0.090 0.387 0.899 ABB 12 0.654 0.214 0.062 0.487 0.821 Batliboi 5 0.485 0.732 0.327 -0.795 1.764 Bosch Re 9 0.719 0.475 0.158 0.257 1.181 Blue Star 11 0.509 0.218 0.066 0.327 0.690 Banco Products 12 0.717 0.500 0.144 0.326 1.108 Elecon 11 1.181 1.348 0.406 0.058 2.304 Eimco Elecon 12 0.707 0.121 0.035 0.612 0.801 FAGBearing 12 0.717 0.536 0.155 0.297 1.136 GMM 12 0.508 0.231 0.067 0.328 0.689 Gujarat Apollo 8 0.868 0.970 0.343 -0.173 1.910 HindustanDorr Oliver 10 0.058 0.028 0.009 0.033 0.083 Hitachi Home &Life 7 2.079 2.866 1.083 -1.395 5.553 Ingersoll Rand 7 13.057 20.593 7.783 -11.901 38.014 Jyoti 11 1.218 1.414 0.426 0.041 2.396 Jord Engg. 6 1.782 1.649 0.673 -0.552 4.115 Kabra Extrusion 7 1.216 0.779 0.294 0.271 2.160 Kilburn Engg. 6 0.890 0.653 0.266 -0.034 1.813 Mipco Seamless 6 0.188 0.111 0.045 0.031 0.345 Stovec Industries 6 2.980 6.300 2.572 -5.933 11.893 Windsor Machines 3 4.536 3.554 2.052 -11.058 20.130
ANOVA Source of Variation SS df MSS F-Calc P-value F crit
Between Groups 1087.483 20 54.374 3.044 0.000 1.636Within Groups 2893.874 162 17.863 Total 3981.357 182
Mean retained earnings ratio of Ingersoll Rand is highest (130.5) among all the companies. Hindustan Dorr Oliver has mean ratio of 5.80 which is least among all the companies. The ANOVA test is applied to compare the mean retained earnings ratio for all the companies. F value is 3.044 with the corresponding P value 0.000. As P value is less than 0.01, it is concluded that this difference is significant at less than 1 % level of significance.
Ingersoll Rand, Windsor Machines and Stovec Industries are having very healthy retained earnings ratio. This is very low for Hindustan Dorr Oliver, Mipco Seamless Rings and Batliboi Ltd.
The retained earnings to net profit ratio has shown down trend after 1996 in case of all the companies. The retained earnings have gone down evev in case of good companies like ABB and Blue Star. This is on account of reduced earnings after 1996.

258
Ratio 15; Net Fixed Assets to Net Worth Ratio
No. Company 1991 1992 1993 1994 1995 1996 1997 1998 1999 2000 2001 2002 1 ABC 2.347 4.094 3.750 3.966 4.389 1.944 2.011 1.992 2.640 1.917 1.226 1.799 2 ABB 0.626 0.725 0.358 0.399 0.493 0.419 0.409 0.459 0.374 0.357 0.349 0.281 3 Batliboi 0.869 0.958 NA 1.654 1.508 1.358 2.005 2.090 2.090 NA 1.615 1.606 4 Bosch Re 1.128 1.263 0.875 1.172 1.161 0.870 1.089 0.998 1.074 0.787 0.722 0.604 5 Blue Star 0.744 0.722 0.666 0.485 0.555 0.416 0.666 0.831 0.833 0.745 0.734 0.536 6 Banco Products 0.423 0.482 0.414 0.534 0.614 0.584 0.532 2.290 0.456 0.389 0.338 0.370 7 Elecon 0.870 0.663 0.761 0.710 0.717 0.764 0.826 0.925 0.650 0.813 0.788 0.785 8 Eimco Elecon 0.617 0.474 0.214 0.270 0.274 0.332 0.345 0.290 0.247 0.290 0.274 0.357 9 FAGBearing 1.923 3.115 1.774 1.333 1.129 0.965 1.413 1.340 1.132 1.173 1.077 0.967
10 GMM 0.400 0.474 0.460 0.463 0.772 0.983 0.812 0.751 0.653 0.500 0.464 0.480 11 Gujarat Apollo NA 0.116 0.074 0.087 0.100 0.070 0.088 0.099 0.111 0.126 0.146 0.174 12 HindustanDorr Oliver 6.469 0.501 0.367 0.334 0.373 1.863 1.907 1.730 1.336 1.182 2.379 NA 13 Hitachi H & L 0.042 0.053 0.049 0.042 0.044 0.068 0.077 0.098 0.123 0.123 0.121 NA 14 Ingersoll Rand 0.550 1.100 0.908 1.111 1.237 1.511 1.954 2.017 2.063 1.835 1.643 NA 15 Jyoti NA 8.077 1.879 1.033 0.591 0.487 0.254 0.277 NA 0.420 NA NA 16 Jord Engg. 0.362 0.346 1.003 0.971 1.509 1.981 1.985 3.532 3.503 4.094 3.630 3.445 17 Kabra Extrusion 0.905 0.864 0.901 0.268 0.472 0.607 0.591 0.724 NA NA NA NA 18 Kilburn Engg. 0.669 0.704 0.838 2.513 2.917 2.696 1.317 2.571 5.103 11.756 NA NA 19 Mipco Seamless 0.519 0.481 0.386 0.285 0.805 0.905 1.133 1.549 1.485 1.457 1.091 0.761 20 Stovec Industries 0.457 0.261 0.299 0.375 0.553 0.494 0.437 0.309 0.431 0.519 0.534 3.320 21 Windsor Machines NA 5.346 4.658 3.217 2.771 3.276 3.149 2.782 2.388 1.967 1.647 1.461

259
Ratio 15
C. I. For Mean Company N Mean S.D. SE of mean Lower Bound Upper Bound
ABC 12 2.673 1.077 0.311 1.831 3.515 ABB 12 0.437 0.126 0.036 0.339 0.535 Batliboi 10 1.575 0.429 0.136 1.191 1.959 Bosch Re 12 0.979 0.205 0.059 0.819 1.139 Blue Star 12 0.661 0.135 0.039 0.556 0.767 Banco Products 12 0.619 0.533 0.154 0.202 1.036 Elecon 12 0.773 0.081 0.023 0.709 0.836 Eimco Elecon 12 0.332 0.112 0.032 0.244 0.419 FAGBearing 12 1.445 0.604 0.174 0.973 1.918 GMM 12 0.601 0.187 0.054 0.455 0.747 Gujarat Apollo 11 0.108 0.031 0.009 0.082 0.134 HindustanDorr Oliver 11 1.677 1.747 0.527 0.222 3.131 Hitachi Home &Life 11 0.076 0.034 0.010 0.048 0.105 Ingersoll Rand 11 1.448 0.503 0.152 1.029 1.867 Jyoti 8 1.627 2.661 0.941 -1.230 4.485 Jord Engg. 12 2.197 1.381 0.399 1.117 3.277 Kabra Extrusion 8 0.667 0.227 0.080 0.423 0.910 Kilburn Engg. 10 3.108 3.328 1.052 0.130 6.087 Mipco Seamless 12 0.905 0.443 0.128 0.559 1.251 Stovec Industries 12 0.666 0.841 0.243 0.008 1.324 Windsor Machines 11 2.969 1.189 0.358 1.979 3.959
ANOVA
Source of Variation SS df MSS F-Calc P-value F crit Between Groups 179.956 20 8.998 7.680 0.000 1.620Within Groups 250.714 214 1.172 Total 430.670 234
Mean fixed assets to net worth ratio of Kilburn Engineering is highest
(310.80) among all companies. Hitachi Home and Life Solutions has mean ratio of 0.076 which is least among all the companies. The ANOVA test is applied to compare the mean fixed assets to net worth ratio for all the companies. F value is 7.680 with the corresponding P value 0.000. As P value is less than 0.01, it is concluded that this difference is significant at less than 1% level of significance.
Majority of fixed assets are financed by shareholders’ funds in case of Gujarat Apollo, Eimco Elecon and ABB.
Financing of fixed assets through shareholders' funds is also studied covering the period of 1991 to 2002.lt has been observed in all the companies throughout this period, that fixed assets are fully financed through shareholders' funds, and balance amount of shareholders' funds has been invested in other current assets.

260
Ratio 16; Equity to Total Assets Ratio
No. Company 1991 1992 1993 1994 1995 1996 1997 1998 1999 2000 2001 2002 1 ABC 0.136 0.135 0.124 0.129 0.126 0.261 0.263 0.269 0.208 0.256 0.339 0.246 2 ABB 0.263 0.211 0.413 0.377 0.352 0.446 0.498 0.538 0.503 0.507 0.477 0.457 3 Batliboi 0.251 0.199 NA 0.149 0.179 0.178 0.130 0.136 0.144 NA 0.245 0.230 4 Bosch Re 0.251 0.205 0.261 0.216 0.151 0.212 0.252 0.284 0.259 0.344 0.326 0.386 5 Blue Star 0.282 0.276 0.250 0.350 0.371 0.443 0.399 0.347 0.336 0.387 0.358 0.366 6 Banco Products 0.294 0.295 0.320 0.404 0.415 0.423 0.541 0.601 0.612 0.699 0.702 0.716 7 Elecon 0.265 0.276 0.223 0.229 0.230 0.321 0.341 0.344 0.417 0.433 0.413 0.356 8 Eimco Elecon 0.270 0.305 0.445 0.604 0.652 0.691 0.690 0.686 0.753 0.701 0.742 0.780 9 FAGBearing 0.261 0.171 0.310 0.376 0.411 0.477 0.312 0.284 0.391 0.380 0.406 0.441
10 GMM 0.428 0.434 0.417 0.460 0.394 0.404 0.338 0.358 0.394 0.612 0.641 0.649 11 Gujarat Apollo 0.495 0.515 0.599 0.600 0.515 0.715 0.829 0.841 0.756 0.933 0.793 0.892 12 HindustanDorr Oliver 0.037 0.222 0.302 0.312 0.281 0.481 0.351 0.352 0.365 0.318 0.141 NA 13 Hitachi H & L 0.518 0.526 0.549 0.565 0.543 0.524 0.591 0.679 0.770 0.874 0.727 NA 14 Ingersoll Rand 0.316 0.149 0.210 0.287 0.296 0.341 0.335 0.312 0.242 0.238 0.067 0.159 15 Jyoti NA 0.427 0.742 0.632 0.542 0.256 0.346 0.296 NA 0.211 NA NA 16 Jord Engg. 0.456 0.464 0.542 0.549 0.832 0.685 0.713 0.759 0.759 0.713 0.755 0.686 17 Kabra Extrusion 0.283 0.248 0.194 0.511 0.367 0.247 0.215 0.189 NA NA NA NA 18 Kilburn Engg. 0.541 0.642 0.717 0.600 0.327 0.313 0.373 0.342 0.183 0.063 NA NA 19 Mipco Seamless 0.347 0.319 0.236 0.478 0.303 0.300 0.280 0.279 0.350 0.296 0.353 0.399 20 Stovec Industries 0.312 0.387 0.384 0.364 0.424 0.356 0.318 0.308 0.212 0.169 0.151 0.029 21 Windsor Machines NA 0.341 0.334 0.264 0.515 0.516 0.436 0.411 0.428 0.432 0.405 0.371

261
Ratio 16
C. I. For Mean Company N Mean S.D. SE of mean Lower Bound Upper Bound
ABC 12 0.208 0.075 0.022 0.149 0.266 ABB 12 0.420 0.102 0.029 0.340 0.500 Batliboi 10 0.184 0.045 0.014 0.143 0.225 Bosch Re 12 0.262 0.065 0.019 0.211 0.313 Blue Star 12 0.347 0.055 0.016 0.304 0.390 Banco Products 12 0.502 0.162 0.047 0.375 0.629 Elecon 12 0.321 0.076 0.022 0.261 0.380 Eimco Elecon 12 0.610 0.174 0.050 0.474 0.746 FAGBearing 12 0.352 0.086 0.025 0.284 0.419 GMM 12 0.461 0.110 0.032 0.375 0.547 Gujarat Apollo 12 0.707 0.157 0.045 0.584 0.829 HindustanDorr Oliver 11 0.287 0.119 0.036 0.188 0.387 Hitachi Home &Life 11 0.624 0.120 0.036 0.524 0.724 Ingersoll Rand 12 0.246 0.086 0.025 0.179 0.313 Jyoti 8 0.431 0.191 0.067 0.227 0.636 Jord Engg. 12 0.659 0.125 0.036 0.562 0.757 Kabra Extrusion 8 0.282 0.109 0.038 0.165 0.399 Kilburn Engg. 10 0.410 0.210 0.066 0.222 0.598 Mipco Seamless 12 0.328 0.064 0.018 0.278 0.378 Stovec Industries 12 0.285 0.119 0.034 0.192 0.377 Windsor Machines 11 0.405 0.076 0.023 0.342 0.468
ANOVA
Source of Variation SS df MSS F-Calc P-value F crit Between Groups 5.235 20 0.262 19.006 0.000 1.619Within Groups 2.975 216 0.014 Total 8.210 236
Mean proprietary ratio of Jord Engineering is highest (65.90) among all the companies. Batliboi has mean ratio of 18.40 which is least among all the companies. The ANOVA test is applied to compare the mean proprietary ratio for all the companies. F value is 19.006 with the corresponding P value 0.000. As P value is less than 0.01, it is concluded that this difference is significant at less than 1 % level of significance.
Gujarat Apollo, Jord Engineering and Hitachi H & L have very healthy proprietory ratio. This is found to be very weak in case of Batliboi, Antifriction Bearing Corp. and Kabra Extrusion.
The proprietary ratio has very moderately increased during 1991 to 2002 for all the companies. This shows much dependant on debt. Only in case of Ingersoll Rand, it has gone down in 2002 compared to 1991.

262
Ratio 17; Current Ratio
No. Company 1991 1992 1993 1994 1995 1996 1997 1998 1999 2000 2001 2002 1 ABC 2.748 51.211 3.665 2.618 2.808 2.425 2.387 3.230 2.760 2.850 3.092 3.351 2 ABB 1.354 1.191 1.506 1.377 1.265 1.445 2.377 1.620 1.774 1.692 1.640 1.622 3 Batliboi 1.142 1.158 NA 1.148 1.034 1.305 1.221 1.248 1.291 NA 1.178 1.194 4 Bosch Re 2.149 1.551 2.081 2.040 1.889 2.301 3.605 2.998 2.455 2.401 2.085 2.673 5 Blue Star 1.214 1.237 1.294 1.422 1.378 1.517 1.385 1.247 1.659 1.592 1.461 1.338 6 Banco Products 6.977 3.394 3.431 3.598 2.629 3.974 4.339 4.259 4.813 4.072 3.746 3.248 7 Elecon 1.332 1.290 1.258 1.239 1.382 0.013 1.386 1.142 1.980 2.412 9.823 2.275 8 Eimco Elecon 3.605 4.121 5.491 5.215 4.175 5.600 5.183 5.947 5.679 6.247 5.502 7.398 9 FAGBearing 0.706 0.975 1.699 1.872 1.622 1.541 1.066 1.217 2.881 2.439 2.094 2.063
10 GMM 1.319 1.345 1.458 1.558 1.320 1.611 1.118 1.749 1.606 2.462 2.698 2.173 11 Gujarat Apollo NA 3.092 2.866 6.822 2.998 3.720 2.812 2.604 2.614 1.946 2.034 2.817 12 HindustanDorr Oliver 1.619 1.942 1.664 1.943 2.000 1.515 1.545 1.583 1.622 1.980 1.545 1.753 13 Hitachi H & L 4.696 2.417 4.166 2.493 2.495 2.233 1.847 1.684 1.594 1.433 1.370 1.094 14 Ingersoll Rand 2.093 1.951 2.106 1.974 1.869 1.745 1.911 2.481 NA 2.930 3.361 NA 15 Jyoti 1.195 1.848 1.585 1.736 1.727 1.597 1.492 1.779 1.543 1.602 1.558 1.691 16 Jord Engg. NA 3.417 3.941 5.685 5.250 3.950 4.604 4.824 NA 5.538 5.994 2.663 17 Kabra Extrusion 1.428 1.689 1.441 1.561 1.806 1.862 3.190 2.814 2.828 2.447 2.742 2.422 18 Kilburn Engg. 1.222 1.128 1.239 1.000 1.422 1.457 1.232 1.388 1.459 0.442 0.304 0.421 19 Mipco Seamless 3.820 4.121 4.039 2.413 3.014 1.208 1.829 1.448 0.929 0.926 1.215 1.900 20 Stovec Industries 2.061 2.325 2.168 0.246 2.061 2.030 2.077 1.558 1.494 1.589 1.536 1.659 21 Windsor Machines 1.859 1.976 2.190 2.015 2.070 2.519 2.477 2.393 1.982 1.847 1.800 1.541
263
Ratio 17
C. I. For Mean
Company N Mean S.D. SE of mean Lower Bound Upper Bound
ABC 12 6.929 13.950 4.027 -3.978 17.836
ABB 12 1.572 0.310 0.090 1.329 1.814
Batliboi 10 1.192 0.080 0.025 1.121 1.263
Bosch Re 12 2.352 0.543 0.157 1.928 2.777
Blue Star 12 1.395 0.142 0.041 1.284 1.507
Banco Products 12 4.040 1.089 0.314 3.188 4.892
Elecon 12 2.128 2.500 0.722 0.173 4.083
Eimco Elecon 12 5.347 1.025 0.296 4.546 6.148
FAGBearing 12 1.681 0.635 0.183 1.185 2.178
GMM 12 1.702 0.491 0.142 1.318 2.085
Gujarat Apollo 11 3.120 1.320 0.398 2.021 4.219
HindustanDorr Oliver 12 1.726 0.188 0.054 1.579 1.873
Hitachi Home &Life 12 2.294 1.107 0.319 1.428 3.159
Ingersoll Rand 10 2.242 0.524 0.166 1.773 2.712
Jyoti 12 1.613 0.169 0.049 1.480 1.745
Jord Engg. 10 4.587 1.079 0.341 3.621 5.552
Kabra Extrusion 12 2.186 0.623 0.180 1.699 2.673
Kilburn Engg. 12 1.059 0.428 0.124 0.725 1.394
Mipco Seamless 12 2.239 1.220 0.352 1.285 3.193
Stovec Industries 12 1.734 0.550 0.159 1.304 2.164
Windsor Machines 12 2.056 0.294 0.085 1.826 2.285
ANOVA
Source of Variation SS df MSS F-Calc P-value F crit
Between Groups 522.519 20 26.126 2.526 0.001 1.618
Within Groups 2317.212 224 10.345
Total 2839.732 244

264
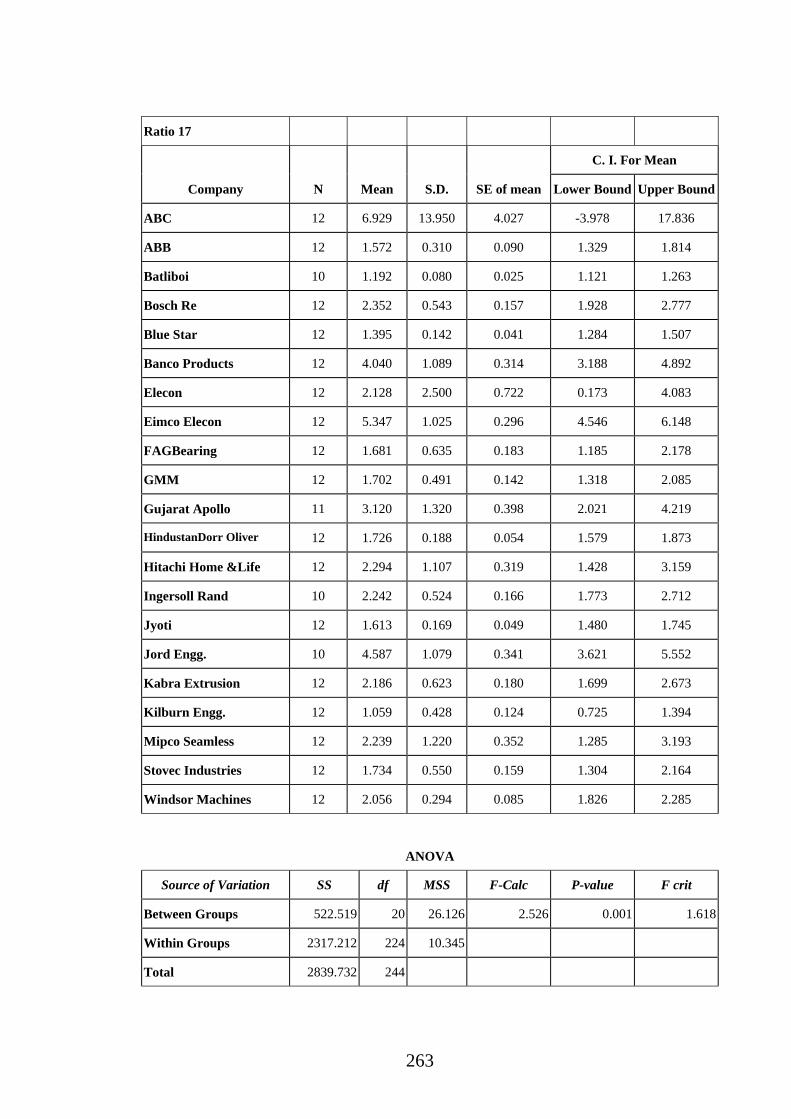
Mean current ratio of Antifriction Bearing Corp. is highest (6.92)
among all the companies. Kilburn Engineering has mean ratio of
1.059 which is least among all the companies. The ANOVA test is
applied to compare the mean current ratio for all the companies. F
value is 2.526 with corresponding P value 0.001. As P value is less
than 0.01, it is concluded that this difference is significant at less
than 1% level of significance.
It is found that Antifriction Bearing Corp., Eimco Elecon and Jord
Engineering were having very healthy current ratio. This was weak
in case of Batliboi, Kilburn Engineering and Blue Star.
Study of current assets and current liabilities during this period has
shown that there is no much improvement in the current ratio
within twelve years' period of 1991 to 2002. Twelve years period is
a very long period, even then there is no improvement. This shows
(a) that the majority of period was a disturbing period for the
manufacturing industries all over the world, and particularly in
India, and (b) the components of current assets and current
liabilities are, to some extent, not controllable by the management
of the business enterprise. In the ultimate analysis, the current ratio
has not become healthy after 1991 in case of all the companies
covered by the study.
265
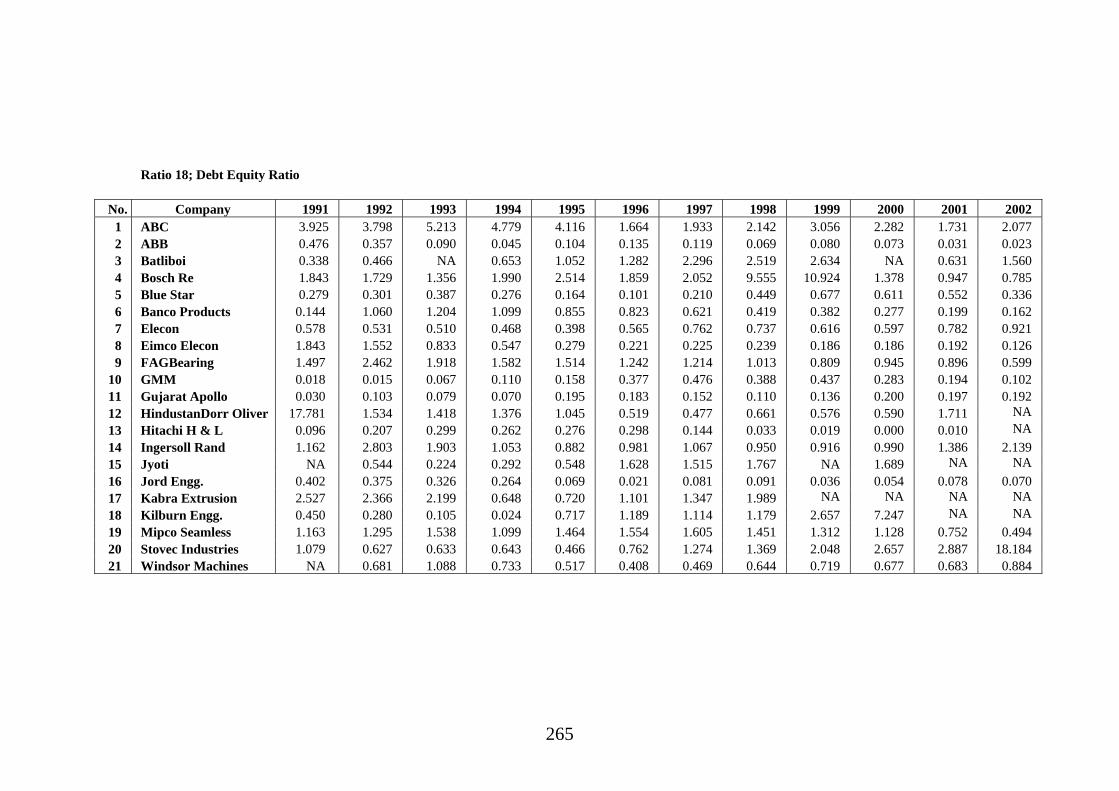
Ratio 18; Debt Equity Ratio
No. Company 1991 1992 1993 1994 1995 1996 1997 1998 1999 2000 2001 2002 1 ABC 3.925 3.798 5.213 4.779 4.116 1.664 1.933 2.142 3.056 2.282 1.731 2.077 2 ABB 0.476 0.357 0.090 0.045 0.104 0.135 0.119 0.069 0.080 0.073 0.031 0.023 3 Batliboi 0.338 0.466 NA 0.653 1.052 1.282 2.296 2.519 2.634 NA 0.631 1.560 4 Bosch Re 1.843 1.729 1.356 1.990 2.514 1.859 2.052 9.555 10.924 1.378 0.947 0.785 5 Blue Star 0.279 0.301 0.387 0.276 0.164 0.101 0.210 0.449 0.677 0.611 0.552 0.336 6 Banco Products 0.144 1.060 1.204 1.099 0.855 0.823 0.621 0.419 0.382 0.277 0.199 0.162 7 Elecon 0.578 0.531 0.510 0.468 0.398 0.565 0.762 0.737 0.616 0.597 0.782 0.921 8 Eimco Elecon 1.843 1.552 0.833 0.547 0.279 0.221 0.225 0.239 0.186 0.186 0.192 0.126 9 FAGBearing 1.497 2.462 1.918 1.582 1.514 1.242 1.214 1.013 0.809 0.945 0.896 0.599
10 GMM 0.018 0.015 0.067 0.110 0.158 0.377 0.476 0.388 0.437 0.283 0.194 0.102 11 Gujarat Apollo 0.030 0.103 0.079 0.070 0.195 0.183 0.152 0.110 0.136 0.200 0.197 0.192 12 HindustanDorr Oliver 17.781 1.534 1.418 1.376 1.045 0.519 0.477 0.661 0.576 0.590 1.711 NA 13 Hitachi H & L 0.096 0.207 0.299 0.262 0.276 0.298 0.144 0.033 0.019 0.000 0.010 NA 14 Ingersoll Rand 1.162 2.803 1.903 1.053 0.882 0.981 1.067 0.950 0.916 0.990 1.386 2.139 15 Jyoti NA 0.544 0.224 0.292 0.548 1.628 1.515 1.767 NA 1.689 NA NA 16 Jord Engg. 0.402 0.375 0.326 0.264 0.069 0.021 0.081 0.091 0.036 0.054 0.078 0.070 17 Kabra Extrusion 2.527 2.366 2.199 0.648 0.720 1.101 1.347 1.989 NA NA NA NA 18 Kilburn Engg. 0.450 0.280 0.105 0.024 0.717 1.189 1.114 1.179 2.657 7.247 NA NA 19 Mipco Seamless 1.163 1.295 1.538 1.099 1.464 1.554 1.605 1.451 1.312 1.128 0.752 0.494 20 Stovec Industries 1.079 0.627 0.633 0.643 0.466 0.762 1.274 1.369 2.048 2.657 2.887 18.184 21 Windsor Machines NA 0.681 1.088 0.733 0.517 0.408 0.469 0.644 0.719 0.677 0.683 0.884

266
Ratio 18
C. I. For Mean Company N Mean S.D. SE of mean Lower Bound Upper Bound
ABC 11 2.981 1.288 0.388 1.908 4.053 ABB 11 0.102 0.092 0.028 0.026 0.179 Batliboi 9 1.455 0.847 0.282 0.631 2.278 Bosch Re 11 3.190 3.534 1.066 0.247 6.133 Blue Star 11 0.369 0.186 0.056 0.214 0.524 Banco Products 11 0.646 0.381 0.115 0.328 0.963 Elecon 11 0.626 0.157 0.047 0.495 0.757 Eimco Elecon 11 0.417 0.430 0.130 0.059 0.775 FAGBearing 11 1.290 0.545 0.164 0.836 1.744 GMM 11 0.237 0.162 0.049 0.102 0.372 Gujarat Apollo 11 0.147 0.050 0.015 0.105 0.188 HindustanDorr Oliver 10 0.991 0.480 0.152 0.561 1.421 Hitachi Home &Life 10 0.155 0.128 0.041 0.040 0.270 Ingersoll Rand 11 1.370 0.636 0.192 0.841 1.899 Jyoti 8 1.026 0.680 0.240 0.296 1.756 Jord Engg. 11 0.133 0.125 0.038 0.029 0.237 Kabra Extrusion 7 1.481 0.706 0.267 0.625 2.337 Kilburn Engg. 9 1.612 2.259 0.753 -0.585 3.810 Mipco Seamless 11 1.245 0.353 0.107 0.950 1.539 Stovec Industries 11 2.868 5.150 1.553 -1.421 7.158 Windsor Machines 11 0.682 0.190 0.057 0.524 0.840
ANOVA
Source of Variation SS df MSS F-Calc P-value F crit Between Groups 193.440 20 9.672 4.013 0.000 1.624Within Groups 474.771 197 2.410 Total 668.210 217
Mean debt equity ratio of Bosch Rexroth is highest (3.190) among all
the companies. ABB has mean ratio of 0.102 which is least among all the companies. The ANOVA test is applied to compare the mean debt equity ratio for all the companies. F value is 4.013 with corresponding P value 0.000. As P value is less than 0.01, it is concluded that this difference is significant at less than 1 % level of significance.
Bosch Rexroth, Antifriction Bearing Corporation and Stovec Industries were having very high debt equity ratio, which is not a healthy phenomena. The companies having comfortable debt equity ratio are Jord Engineering, Gujarat Apollo and Hitachi H & L.
During the period of study, the reliance on debt has gone down in all cases. This has gone up after 1996 only in case of Elecon Engineering, Ingersoll Rand and Stovec Industries, which have used debt finance for requirement for their increased activities.

267
Ratio 19; Debtors Turnover Ratio
No. Company 1991 1992 1993 1994 1995 1996 1997 1998 1999 2000 2001 2002 1 ABC 8.340 10.230 7.455 4.564 6.515 6.424 5.658 3.781 3.564 4.329 3.412 2.762 2 ABB 2.169 2.158 2.489 2.300 2.310 2.483 1.897 1.613 1.838 2.006 2.479 2.641 3 Batliboi 4.903 4.201 NA 5.197 4.244 5.340 4.434 3.811 4.044 0.000 6.065 1.531 4 Bosch Re 5.010 4.006 2.973 3.013 2.466 2.508 2.605 2.013 2.290 2.563 3.354 3.374 5 Blue Star 4.210 3.955 3.525 3.389 4.390 6.606 8.050 7.249 6.371 6.081 6.317 5.942 6 Banco Products 2.334 2.851 3.397 3.838 8.022 5.411 4.177 3.991 3.804 3.657 3.174 3.115 7 Elecon 2.908 2.757 2.985 3.585 3.461 4.049 3.077 1.987 2.567 2.875 2.745 2.465 8 Eimco Elecon 4.110 3.686 3.474 2.694 3.028 3.697 3.279 2.170 2.824 3.180 3.628 3.565 9 FAGBearing 5.003 4.974 4.031 3.694 3.954 4.727 5.068 9.758 8.921 4.624 4.598 4.652
10 GMM 10.330 9.620 10.335 12.216 8.938 8.124 5.109 2.750 3.228 3.497 4.222 5.157 11 Gujarat Apollo 12.003 14.553 6.346 4.229 3.843 0.000 0.000 0.000 7.053 5.080 5.708 4.960 12 HindustanDorr Oliver 2.100 2.287 2.173 2.572 NA 2.397 1.785 1.951 1.607 1.094 1.839 1.581 13 Hitachi H & L 3.302 2.668 1.923 2.978 4.242 0.000 0.000 5.223 5.213 5.581 9.827 7.332 14 Ingersoll Rand 3.100 3.256 3.597 3.353 2.957 NA 6.249 4.329 7.341 7.088 3.181 NA 15 Jyoti 3.455 3.850 3.531 3.230 3.425 3.421 3.798 3.244 2.906 2.595 2.481 1.263 16 Jord Engg. 4.458 4.651 5.754 5.507 6.646 5.391 5.093 4.256 NA 5.053 4.789 1.824 17 Kabra Extrusion 1.910 2.186 1.960 2.475 5.362 3.951 1.593 1.516 1.483 3.378 17.562 26.601 18 Kilburn Engg. 8.788 9.110 10.469 10.857 8.955 11.308 12.013 17.365 13.757 3.939 2.976 3.362 19 Mipco Seamless 9.003 9.748 7.819 6.935 6.618 5.964 4.742 3.693 3.867 7.491 6.020 7.929 20 Stovec Industries 6.948 6.684 5.565 4.327 3.677 5.245 NA 2.703 4.208 5.244 5.137 5.171 21 Windsor Machines 6.790 8.709 4.779 3.989 4.787 4.802 2.598 2.502 1.775 2.606 2.611 2.068
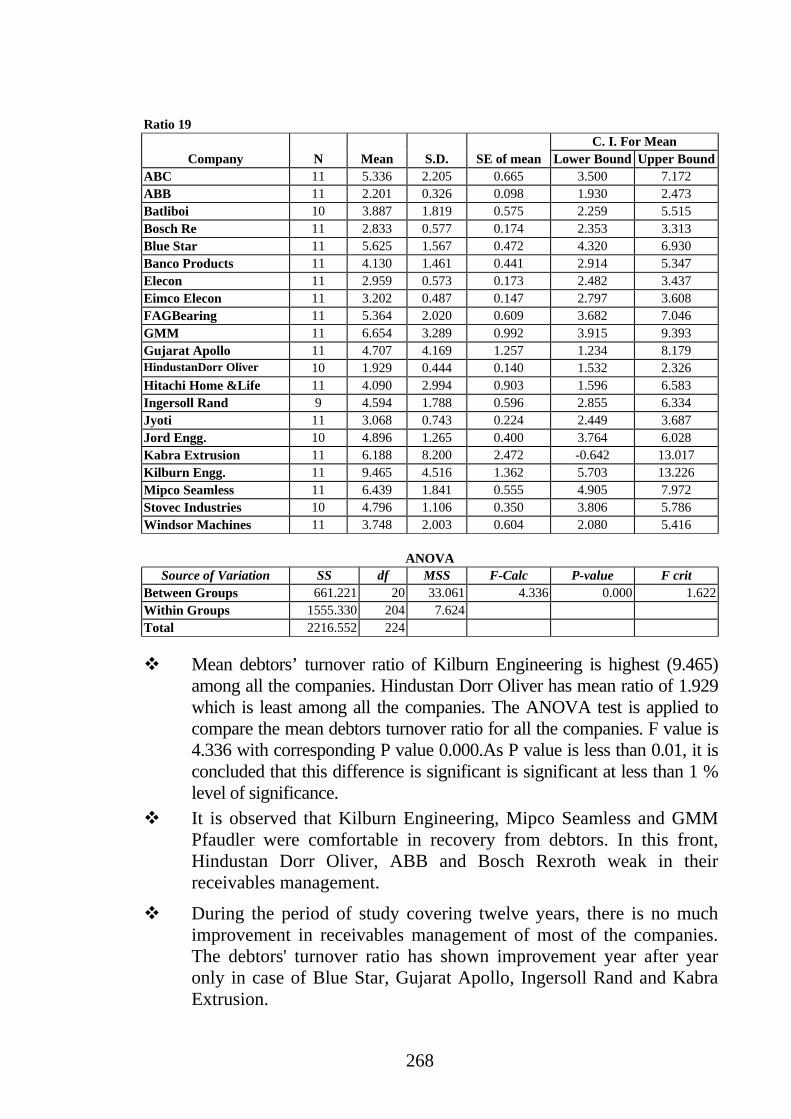
268
Ratio 19
C. I. For Mean Company N Mean S.D. SE of mean Lower Bound Upper Bound
ABC 11 5.336 2.205 0.665 3.500 7.172 ABB 11 2.201 0.326 0.098 1.930 2.473 Batliboi 10 3.887 1.819 0.575 2.259 5.515 Bosch Re 11 2.833 0.577 0.174 2.353 3.313 Blue Star 11 5.625 1.567 0.472 4.320 6.930 Banco Products 11 4.130 1.461 0.441 2.914 5.347 Elecon 11 2.959 0.573 0.173 2.482 3.437 Eimco Elecon 11 3.202 0.487 0.147 2.797 3.608 FAGBearing 11 5.364 2.020 0.609 3.682 7.046 GMM 11 6.654 3.289 0.992 3.915 9.393 Gujarat Apollo 11 4.707 4.169 1.257 1.234 8.179 HindustanDorr Oliver 10 1.929 0.444 0.140 1.532 2.326 Hitachi Home &Life 11 4.090 2.994 0.903 1.596 6.583 Ingersoll Rand 9 4.594 1.788 0.596 2.855 6.334 Jyoti 11 3.068 0.743 0.224 2.449 3.687 Jord Engg. 10 4.896 1.265 0.400 3.764 6.028 Kabra Extrusion 11 6.188 8.200 2.472 -0.642 13.017 Kilburn Engg. 11 9.465 4.516 1.362 5.703 13.226 Mipco Seamless 11 6.439 1.841 0.555 4.905 7.972 Stovec Industries 10 4.796 1.106 0.350 3.806 5.786 Windsor Machines 11 3.748 2.003 0.604 2.080 5.416
ANOVA
Source of Variation SS df MSS F-Calc P-value F crit Between Groups 661.221 20 33.061 4.336 0.000 1.622Within Groups 1555.330 204 7.624 Total 2216.552 224
Mean debtors’ turnover ratio of Kilburn Engineering is highest (9.465)
among all the companies. Hindustan Dorr Oliver has mean ratio of 1.929 which is least among all the companies. The ANOVA test is applied to compare the mean debtors turnover ratio for all the companies. F value is 4.336 with corresponding P value 0.000.As P value is less than 0.01, it is concluded that this difference is significant is significant at less than 1 % level of significance.
It is observed that Kilburn Engineering, Mipco Seamless and GMM Pfaudler were comfortable in recovery from debtors. In this front, Hindustan Dorr Oliver, ABB and Bosch Rexroth weak in their receivables management.
During the period of study covering twelve years, there is no much improvement in receivables management of most of the companies. The debtors' turnover ratio has shown improvement year after year only in case of Blue Star, Gujarat Apollo, Ingersoll Rand and Kabra Extrusion.
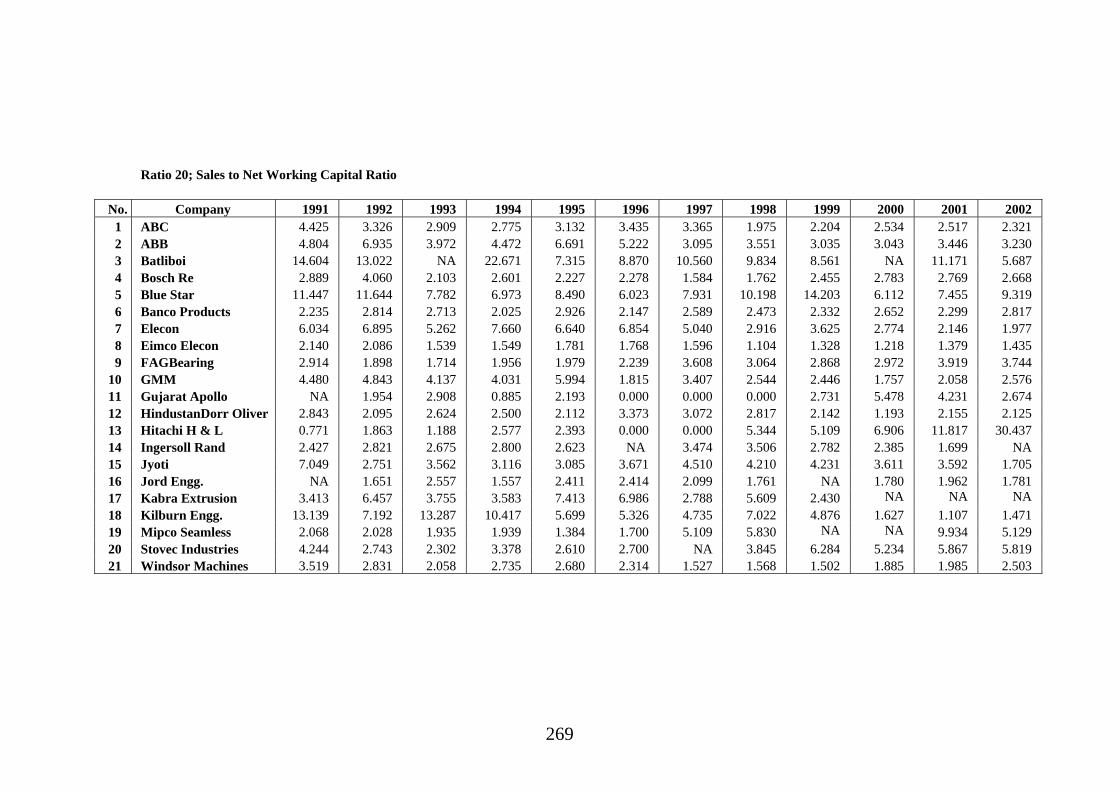
269
Ratio 20; Sales to Net Working Capital Ratio
No. Company 1991 1992 1993 1994 1995 1996 1997 1998 1999 2000 2001 2002 1 ABC 4.425 3.326 2.909 2.775 3.132 3.435 3.365 1.975 2.204 2.534 2.517 2.321 2 ABB 4.804 6.935 3.972 4.472 6.691 5.222 3.095 3.551 3.035 3.043 3.446 3.230 3 Batliboi 14.604 13.022 NA 22.671 7.315 8.870 10.560 9.834 8.561 NA 11.171 5.687 4 Bosch Re 2.889 4.060 2.103 2.601 2.227 2.278 1.584 1.762 2.455 2.783 2.769 2.668 5 Blue Star 11.447 11.644 7.782 6.973 8.490 6.023 7.931 10.198 14.203 6.112 7.455 9.319 6 Banco Products 2.235 2.814 2.713 2.025 2.926 2.147 2.589 2.473 2.332 2.652 2.299 2.817 7 Elecon 6.034 6.895 5.262 7.660 6.640 6.854 5.040 2.916 3.625 2.774 2.146 1.977 8 Eimco Elecon 2.140 2.086 1.539 1.549 1.781 1.768 1.596 1.104 1.328 1.218 1.379 1.435 9 FAGBearing 2.914 1.898 1.714 1.956 1.979 2.239 3.608 3.064 2.868 2.972 3.919 3.744
10 GMM 4.480 4.843 4.137 4.031 5.994 1.815 3.407 2.544 2.446 1.757 2.058 2.576 11 Gujarat Apollo NA 1.954 2.908 0.885 2.193 0.000 0.000 0.000 2.731 5.478 4.231 2.674 12 HindustanDorr Oliver 2.843 2.095 2.624 2.500 2.112 3.373 3.072 2.817 2.142 1.193 2.155 2.125 13 Hitachi H & L 0.771 1.863 1.188 2.577 2.393 0.000 0.000 5.344 5.109 6.906 11.817 30.437 14 Ingersoll Rand 2.427 2.821 2.675 2.800 2.623 NA 3.474 3.506 2.782 2.385 1.699 NA 15 Jyoti 7.049 2.751 3.562 3.116 3.085 3.671 4.510 4.210 4.231 3.611 3.592 1.705 16 Jord Engg. NA 1.651 2.557 1.557 2.411 2.414 2.099 1.761 NA 1.780 1.962 1.781 17 Kabra Extrusion 3.413 6.457 3.755 3.583 7.413 6.986 2.788 5.609 2.430 NA NA NA 18 Kilburn Engg. 13.139 7.192 13.287 10.417 5.699 5.326 4.735 7.022 4.876 1.627 1.107 1.471 19 Mipco Seamless 2.068 2.028 1.935 1.939 1.384 1.700 5.109 5.830 NA NA 9.934 5.129 20 Stovec Industries 4.244 2.743 2.302 3.378 2.610 2.700 NA 3.845 6.284 5.234 5.867 5.819 21 Windsor Machines 3.519 2.831 2.058 2.735 2.680 2.314 1.527 1.568 1.502 1.885 1.985 2.503

270
Ratio 20 C. I. For Mean
Company N Mean S.D. SE of mean Lower Bound Upper BoundABC 12 2.910 0.677 0.195 2.381 3.439 ABB 12 4.291 1.381 0.399 3.212 5.371 Batliboi 10 11.229 4.792 1.515 6.941 15.518 Bosch Re 12 2.515 0.635 0.183 2.018 3.012 Blue Star 12 8.965 2.489 0.719 7.019 10.911 Banco Products 12 2.502 0.293 0.085 2.272 2.731 Elecon 12 4.819 2.045 0.590 3.219 6.418 Eimco Elecon 12 1.577 0.321 0.093 1.326 1.827 FAGBearing 12 2.740 0.773 0.223 2.136 3.344 GMM 12 3.341 1.356 0.391 2.281 4.400 Gujarat Apollo 11 2.096 1.791 0.540 0.604 3.587 HindustanDorr Oliver 12 2.421 0.577 0.166 1.970 2.872 Hitachi Home &Life 12 5.701 8.508 2.456 -0.952 12.353 Ingersoll Rand 10 2.719 0.522 0.165 2.252 3.187 Jyoti 12 3.758 1.280 0.369 2.757 4.758 Jord Engg. 10 1.997 0.355 0.112 1.680 2.315 Kabra Extrusion 9 4.715 1.907 0.636 2.859 6.570 Kilburn Engg. 12 6.325 4.175 1.205 3.060 9.589 Mipco Seamless 10 3.706 2.758 0.872 1.237 6.174 Stovec Industries 11 4.093 1.483 0.447 2.858 5.328 Windsor Machines 12 2.259 0.620 0.179 1.775 2.743
ANOVA
Source of Variation SS df MSS F-Calc P-value F crit Between Groups 1258.413 20 62.921 8.853 0.000 1.619Within Groups 1549.329 218 7.107 Total 2807.742 238
Mean working capital turnover ratio of Batliboi is highest (11.229)
among all the companies. Eimco Elecon has mean ratio of 1.577
which is least among all the companies. The ANOVA test is applied
to compare the mean working capital turnover ratio for all the
companies. F value is 8.853 with corresponding P value 0.000. As P
value is less than 0.01, it is concluded that this difference is significant
at less than 1 % level of significance.
It is observed that Batliboi, Blue Star and Kilburn Engineering have
been making very good use of current assets, in terms of achievement
of sales by use of current assets. This situation is very bad in case of
Eimco Elecon, Jord Engineering and Gujarat Apollo.

271
Ratio 21; Operating Cost to Sales Ratio
No. Company 1991 1992 1993 1994 1995 1996 1997 1998 1999 2000 2001 2002 1 ABC 0.867 0.804 0.849 0.877 0.887 0.840 0.828 0.822 0.970 0.897 0.862 0.979 2 ABB 0.888 0.857 0.864 0.860 0.877 0.812 0.910 0.935 0.924 0.901 0.907 0.877 3 Batliboi 0.953 0.953 NA 0.955 0.968 0.977 1.026 1.007 0.968 NA 1.136 1.131 4 Bosch Re 0.845 0.870 0.830 0.853 0.895 NA 0.790 0.898 0.913 0.847 0.832 0.973 5 Blue Star 0.950 0.954 0.951 0.938 0.911 0.898 0.937 0.949 0.941 0.915 0.932 0.935 6 Banco Products 0.524 0.812 0.918 1.078 0.956 0.854 0.821 0.838 0.849 0.809 0.890 0.875 7 Elecon 0.925 0.890 0.902 0.935 0.916 0.919 0.898 0.894 0.887 0.934 0.946 0.954 8 Eimco Elecon 0.835 0.808 0.798 0.738 0.736 0.721 0.693 0.714 0.732 0.722 0.742 0.787 9 FAGBearing NA 0.672 0.666 0.836 0.805 0.798 0.796 0.763 0.776 0.836 1.009 1.008
10 GMM 0.756 0.760 0.791 0.758 0.821 0.770 0.801 0.849 0.868 0.904 0.945 0.965 11 Gujarat Apollo NA 0.904 0.883 0.843 0.822 NA NA NA 0.875 0.907 0.907 0.889 12 HindustanDorr Oliver 0.881 0.859 0.859 0.895 0.895 0.900 0.944 0.890 0.950 1.047 0.853 0.874 13 Hitachi H & L 0.950 0.912 0.924 0.920 0.922 NA NA 0.941 1.022 0.958 1.026 1.046 14 Ingersoll Rand 0.806 0.804 0.824 0.811 0.820 NA 0.816 0.824 0.833 0.834 0.837 NA 15 Jyoti 0.809 0.853 0.854 0.872 0.884 0.915 0.940 0.943 0.942 0.928 0.941 0.965 16 Jord Engg. NA 0.866 0.874 0.911 0.967 0.779 0.874 0.869 NA 1.054 1.140 1.698 17 Kabra Extrusion 2.259 1.477 1.470 1.453 1.017 1.163 2.203 2.804 2.830 1.058 0.356 0.294 18 Kilburn Engg. 0.329 0.483 0.496 0.502 0.690 0.587 0.336 0.320 0.394 1.530 3.121 2.744 19 Mipco Seamless 0.775 0.815 0.867 0.872 0.880 0.882 0.972 1.067 1.381 1.147 1.162 1.195 20 Stovec Industries 0.869 0.904 0.882 0.894 0.998 0.860 NA 1.004 0.955 0.885 0.895 0.931 21 Windsor Machines 0.854 0.869 0.926 0.933 0.914 0.853 0.964 0.954 1.174 1.096 1.055 1.245

272
Ratio 21
C. I. For Mean Company N Mean S.D. SE of mean Lower Bound Upper Bound
ABC 12 0.874 0.054 0.016 0.831 0.916 ABB 12 0.884 0.034 0.010 0.858 0.911 Batliboi 10 1.007 0.071 0.022 0.944 1.071 Bosch Re 11 0.868 0.050 0.015 0.826 0.909 Blue Star 12 0.934 0.018 0.005 0.921 0.948 Banco Products 12 0.852 0.128 0.037 0.752 0.952 Elecon 12 0.917 0.023 0.007 0.899 0.935 Eimco Elecon 12 0.752 0.044 0.013 0.718 0.786 FAGBearing 11 0.815 0.111 0.033 0.722 0.907 GMM 12 0.832 0.074 0.021 0.774 0.890 Gujarat Apollo 8 0.879 0.031 0.011 0.845 0.912 HindustanDorr Oliver 12 0.904 0.054 0.016 0.861 0.946 Hitachi Home &Life 10 0.962 0.050 0.016 0.917 1.007 Ingersoll Rand 10 0.821 0.012 0.004 0.810 0.831 Jyoti 12 0.904 0.048 0.014 0.866 0.941 Jord Engg. 10 1.003 0.265 0.084 0.766 1.241 Kabra Extrusion 12 1.532 0.844 0.244 0.872 2.192 Kilburn Engg. 12 0.961 0.980 0.283 0.195 1.727 Mipco Seamless 12 1.001 0.187 0.054 0.855 1.147 Stovec Industries 11 0.916 0.050 0.015 0.875 0.958 Windsor Machines 12 0.986 0.128 0.037 0.886 1.087
ANOVA
Source of Variation SS df MSS F-Calc P-value F crit Between Groups 5.558 20 0.278 2.969 0.000 1.619Within Groups 20.217 216 0.094 Total 25.774 236
Mean operating ratio of Kabra Extrusion is highest (1.532) among all the companies. Eimco Elecon has mean ratio of 0.752 which is least among all the companies. The ANOVA test is applied to compare the mean operating ratio for all the companies. F value is 2.969 with corresponding P value 0.000. As P value is less than 0.01, it is concluded that this difference is significant at less than 1 % level of significance.
The operating ratio was found favourable in case of Eimco Elecon, Ingersoll Rand and GMM. Various costs have been out of control in case of Kabra Extrusion, Batliboi and Jord Engineering.
It has been observed that there is no much variation in the operating cost of majority of the companies. If the profitability of the companies has gone down after 1996, it is on account of increase in administrative expenses and other overheads.

273
Ratio 22; Value Added to Salaries and Wages
No. Company 1991 1992 1993 1994 1995 1996 1997 1998 1999 2000 2001 2002 1 ABC 18.429 23.907 20.275 19.033 17.542 4.407 4.158 1.586 2.450 2.217 2.980 2.475 2 ABB 1.671 2.121 2.399 2.396 2.535 2.662 2.003 1.642 1.433 1.572 1.911 2.063 3 Batliboi 1.652 1.591 NA 1.102 1.289 1.518 1.672 1.214 0.894 NA 0.358 0.718 4 Bosch Re 3.418 3.751 3.521 3.555 2.982 0.896 1.757 2.500 1.216 1.819 1.942 3.281 5 Blue Star 1.313 1.243 1.178 1.355 1.543 1.580 1.464 1.262 1.548 1.459 1.486 1.458 6 Banco Products 2.927 2.263 1.694 2.605 2.671 0.747 1.429 1.036 1.120 1.749 0.531 1.167 7 Elecon 2.370 1.715 1.838 1.689 1.417 1.567 1.944 2.178 2.190 1.035 1.713 1.254 8 Eimco Elecon 11.022 12.029 12.673 12.064 12.100 12.659 11.358 9.813 8.758 11.433 10.444 7.707 9 FAGBearing 1.368 1.939 1.816 2.905 2.304 2.365 3.573 3.123 4.414 3.928 3.975 4.178
10 GMM 1.417 1.545 3.184 3.423 1.663 2.133 1.844 2.125 3.025 2.886 3.672 3.548 11 Gujarat Apollo NA 10.286 14.769 13.429 14.821 NA NA NA 3.922 3.396 2.947 2.831 12 HindustanDorr Oliver 2.459 2.510 3.104 2.943 2.873 2.595 1.835 2.888 1.778 0.576 2.553 1.227 13 Hitachi H & L 4.273 6.077 6.389 8.472 8.200 NA NA 0.294 0.000 0.142 0.000 0.000 14 Ingersoll Rand 3.202 3.369 3.902 3.234 2.725 2.832 2.449 2.660 0.000 3.309 1.804 NA 15 Jyoti 1.070 1.012 1.073 0.956 0.803 0.644 0.741 1.379 1.175 1.382 1.509 0.530 16 Jord Engg. NA 6.333 10.250 18.235 19.320 12.945 8.310 0.823 NA 2.302 4.978 0.000 17 Kabra Extrusion 4.360 5.052 6.111 6.667 10.233 6.492 5.302 3.242 2.812 3.500 3.849 4.772 18 Kilburn Engg. 1.516 2.336 2.104 2.248 2.640 2.261 2.715 2.429 1.833 0.601 0.390 1.399 19 Mipco Seamless 5.822 5.032 3.955 3.000 3.247 2.500 3.801 1.697 0.317 0.502 1.755 2.552 20 Stovec Industries 3.566 2.258 2.867 2.165 1.952 1.669 NA 1.266 2.706 3.121 3.061 4.327 21 Windsor Machines 3.066 2.922 1.763 1.551 2.022 1.552 1.980 2.184 1.232 2.037 2.010 0.556

274
Ratio 22
C. I. For Mean Company N Mean S.D. SE of mean Lower Bound Upper Bound
ABC 12 9.955 8.884 2.565 3.009 16.901 ABB 12 2.034 0.404 0.117 1.718 2.350 Batliboi 10 1.201 0.439 0.139 0.808 1.593 Bosch Re 12 2.553 0.997 0.288 1.774 3.332 Blue Star 12 1.407 0.133 0.038 1.303 1.511 Banco Products 12 1.662 0.797 0.230 1.039 2.285 Elecon 12 1.742 0.395 0.114 1.434 2.051 Eimco Elecon 12 11.005 1.562 0.451 9.784 12.227 FAGBearing 12 2.991 1.028 0.297 2.187 3.795 GMM 12 2.539 0.836 0.241 1.885 3.192 Gujarat Apollo 8 8.300 5.560 1.966 2.329 14.271 HindustanDorr Oliver 12 2.278 0.772 0.223 1.674 2.882 Hitachi Home &Life 10 3.385 3.660 1.157 0.109 6.660 Ingersoll Rand 11 2.681 1.047 0.316 1.808 3.553 Jyoti 12 1.023 0.307 0.089 0.783 1.263 Jord Engg. 10 8.350 6.841 2.163 2.227 14.472 Kabra Extrusion 12 5.199 2.026 0.585 3.615 6.783 Kilburn Engg. 12 1.873 0.759 0.219 1.279 2.466 Mipco Seamless 12 2.848 1.667 0.481 1.545 4.152 Stovec Industries 11 2.633 0.886 0.267 1.895 3.370 Windsor Machines 12 1.906 0.678 0.196 1.376 2.436
ANOVA
Source of Variation SS df MSS F-Calc P-value F crit Between Groups 2035.694 20 101.785 12.320 0.000 1.619Within Groups 1809.309 219 8.262 Total 3845.003 239
Mean salaries & wages to Value added ratio is highest (11.005) among all companies. Jyoti Ltd. has mean ratio of 1.023 which is least among all the companies. The ANOVA test is applied to compare the mean salaries to value added ratio for all the companies. F value is 12.320 with corresponding P value 0.000. As P value is less than 0.01, it is concluded that this difference is significant at less than 1 % level of significance.
The comparison of value added and salaries and wages cost of all the
companies studied, shows that there is no much variation in the amount of value added and employee cost. This is one way of examining the earning capacity of the business. Two companies have very high Gross Profit Ratio, and so relatively low material consumption and other direct manufacturing costs. These companies are Eimco Elecon and Kabra Extrusion.

275
Ratio 23; Value Added to Sales
No. Company 1991 1992 1993 1994 1995 1996 1997 1998 1999 2000 2001 2002 1 ABC 0.184 0.238 0.203 0.191 0.174 0.354 0.309 0.204 0.366 0.296 0.388 0.341 2 ABB 0.186 0.223 0.205 0.221 0.217 0.209 0.190 0.205 0.193 0.201 0.206 0.211 3 Batliboi 0.113 0.105 NA 0.091 0.096 0.116 0.165 0.137 0.151 NA 0.097 0.191 4 Bosch Re 0.307 0.311 0.298 0.350 0.285 0.103 0.235 0.321 0.159 0.239 0.210 0.402 5 Blue Star 0.137 0.120 0.123 0.139 0.141 0.153 0.146 0.134 0.160 0.166 0.148 0.154 6 Banco Products 0.571 0.269 0.162 0.200 0.108 0.062 0.112 0.100 0.098 0.146 0.058 0.094 7 Elecon 0.195 0.193 0.179 0.126 0.128 0.156 0.191 0.246 0.226 0.153 0.175 0.129 8 Eimco Elecon 0.291 0.324 0.317 0.391 0.387 0.410 0.388 0.406 0.380 0.393 0.344 0.371 9 FAGBearing 0.174 0.209 0.202 0.306 0.300 0.318 0.352 0.332 0.452 0.467 0.472 0.476
10 GMM 0.305 0.355 0.359 0.334 0.293 0.343 0.301 0.319 0.497 0.496 0.490 0.501 11 Gujarat Apollo NA 0.187 0.216 0.271 0.289 NA NA NA 0.101 0.074 0.066 0.078 12 HindustanDorr Oliver 0.185 0.202 0.233 0.204 0.215 0.158 0.136 0.223 0.157 0.106 0.297 0.183 13 Hitachi H & L 0.060 0.111 0.140 0.150 0.168 NA NA 0.014 0.000 0.007 0.000 0.000 14 Ingersoll Rand 0.290 0.263 0.296 0.304 0.284 NA 0.245 0.273 0.000 0.314 0.211 NA 15 Jyoti 0.233 0.211 0.224 0.219 0.194 0.160 0.137 0.268 0.198 0.212 0.222 0.130 16 Jord Engg. NA 0.187 0.189 0.276 0.282 0.202 0.111 0.011 NA 0.042 0.061 0.000 17 Kabra Extrusion 0.278 0.259 0.281 0.281 0.379 0.240 0.306 0.170 0.183 0.232 0.241 0.326 18 Kilburn Engg. 0.219 0.367 0.274 0.271 0.382 0.306 0.302 0.216 0.278 0.183 0.119 0.253 19 Mipco Seamless 0.232 0.234 0.195 0.180 0.193 0.197 0.362 0.267 0.066 0.067 0.252 0.308 20 Stovec Industries 0.344 0.283 0.342 0.264 0.263 0.220 NA 0.177 0.327 0.302 0.275 0.368 21 Windsor Machines 0.227 0.220 0.188 0.172 0.187 0.187 0.307 0.304 0.239 0.343 0.303 0.097

276
Ratio 23 C. I. For Mean
Company N Mean S.D. SE of mean Lower Bound Upper BoundABC 12 0.271 0.080 0.023 0.208 0.333 ABB 12 0.205 0.012 0.003 0.196 0.215 Batliboi 10 0.126 0.034 0.011 0.096 0.156 Bosch Re 12 0.268 0.083 0.024 0.203 0.334 Blue Star 12 0.143 0.014 0.004 0.132 0.154 Banco Products 12 0.165 0.141 0.041 0.055 0.275 Elecon 12 0.175 0.038 0.011 0.145 0.205 Eimco Elecon 12 0.367 0.039 0.011 0.337 0.397 FAGBearing 12 0.338 0.109 0.032 0.253 0.424 GMM 12 0.383 0.086 0.025 0.315 0.450 Gujarat Apollo 8 0.160 0.092 0.033 0.061 0.259 HindustanDorr Oliver 12 0.192 0.050 0.014 0.153 0.231 Hitachi Home &Life 10 0.065 0.070 0.022 0.002 0.128 Ingersoll Rand 10 0.248 0.092 0.029 0.165 0.330 Jyoti 12 0.201 0.040 0.012 0.169 0.232 Jord Engg. 10 0.136 0.105 0.033 0.042 0.230 Kabra Extrusion 12 0.265 0.058 0.017 0.219 0.310 Kilburn Engg. 12 0.264 0.074 0.021 0.206 0.322 Mipco Seamless 12 0.213 0.086 0.025 0.146 0.280 Stovec Industries 11 0.288 0.057 0.017 0.240 0.335 Windsor Machines 12 0.231 0.071 0.021 0.175 0.287
ANOVA
Source of Variation SS df MSS F-Calc P-value F crit Between Groups 1.474 20 0.074 13.181 0.000 1.619Within Groups 1.219 218 0.006 Total 2.692 238
Mean Sales to Value added ratio of GMM Pfaudler is highest (38.30)
among all the companies. Hitachi Home & Life has mean ratio of 6.50
which is least among all the companies. The ANOVA test is applied
to compare the mean Sales to Value added ratio for all the companies.
F value is 13.181 with corresponding P value 0.000. As P value is less
than 0.01, it is concluded that this difference is significant at less than
1 % level of significance.
The contribution by Sales in value addition has been found highest in
GMM, Eimco Elecon and FAG Bearings. This has been the lowest in
case of Hitachi H & L, Batliboi and Jord Engineering.

277
Ratio 24; Value Added to PBT
No. Company 1991 1992 1993 1994 1995 1996 1997 1998 1999 2000 2001 2002 1 ABC 1.964 1.926 2.861 4.680 3.595 5.575 3.989 19.963 NA 13.888 10.721 NA 2 ABB 2.717 2.233 1.760 1.728 1.934 1.200 2.381 3.789 28.113 2.257 2.526 1.784 3 Batliboi 7.890 36.086 NA NA 5.713 27.847 NA NA 63.250 NA NA NA 4 Bosch Re 3.931 14.527 4.203 8.306 21.557 NA 10.457 NA NA 5.225 1.961 4.332 5 Blue Star 5.285 6.036 5.858 3.637 1.953 1.670 2.838 3.482 4.162 3.163 2.912 2.852 6 Banco Products 1.537 2.365 6.500 6.939 4.035 0.690 0.822 0.748 0.781 0.841 0.589 0.802 7 Elecon 13.359 31.444 28.783 6.805 3.046 26.924 3.208 3.803 3.233 5.188 64.051 NA 8 Eimco Elecon 2.702 2.759 2.830 1.804 1.655 1.653 1.816 2.014 1.925 2.013 1.827 2.228 9 FAGBearing 1.404 3.503 23.628 20.671 3.938 2.867 3.061 4.690 10.597 5.332 5.470 4.577
10 GMM 1.284 1.511 1.748 1.402 1.679 1.575 1.864 3.003 5.902 7.564 12.390 21.750 11 Gujarat Apollo NA 3.661 2.543 1.829 1.700 NA NA NA 0.958 0.920 0.921 0.951 12 HindustanDorr Oliver 1.625 1.552 1.945 2.352 2.738 2.112 5.013 2.822 5.522 NA 4.458 3.016 13 Hitachi H & L 3.917 1.904 2.277 2.626 2.764 NA NA 0.513 NA 0.334 NA NA 14 Ingersoll Rand 1.646 1.420 1.604 1.568 1.610 1.743 1.512 1.601 0.000 1.708 1.047 NA 15 Jyoti 2.799 3.796 3.810 6.317 4.978 54.444 25.225 28.299 11.332 8.043 19.000 NA 16 Jord Engg. NA 2.021 2.050 1.813 2.041 2.051 2.609 0.468 NA NA NA NA 17 Kabra Extrusion 2.076 1.637 1.725 1.611 2.138 1.303 2.380 2.766 2.335 2.333 2.250 3.022 18 Kilburn Engg. 2.685 3.927 3.864 3.356 4.969 6.159 13.648 NA NA NA NA NA 19 Mipco Seamless 1.607 1.524 1.728 1.682 2.229 3.636 3.599 NA NA NA NA NA 20 Stovec Industries 5.527 12.085 8.800 7.087 NA 27.297 NA NA NA 3.990 3.990 7.836 21 Windsor Machines 2.112 2.843 13.250 7.814 3.514 2.493 NA 14.717 NA NA NA NA

278
Ratio 24 C. I. For Mean
Company N Mean S.D. SE of mean Lower Bound Upper BoundABC 10 6.916 6.015 1.902 1.533 12.299 ABB 12 4.369 7.505 2.167 -1.499 10.237 Batliboi 5 28.157 23.500 10.509 -12.914 69.228 Bosch Re 9 8.278 6.329 2.110 2.121 14.435 Blue Star 12 3.654 1.427 0.412 2.538 4.770 Banco Products 12 2.221 2.325 0.671 0.403 4.039 Elecon 11 17.259 19.143 5.772 1.315 33.202 Eimco Elecon 12 2.102 0.430 0.124 1.766 2.438 FAGBearing 12 7.478 7.233 2.088 1.823 13.133 GMM 12 5.139 6.241 1.802 0.260 10.019 Gujarat Apollo 8 1.685 0.993 0.351 0.619 2.751 HindustanDorr Oliver 11 3.014 1.376 0.415 1.868 4.160 Hitachi Home &Life 7 2.048 1.272 0.481 0.506 3.589 Ingersoll Rand 11 1.405 0.502 0.152 0.987 1.824 Jyoti 11 15.277 15.779 4.758 2.135 28.419 Jord Engg. 7 1.865 0.662 0.250 1.062 2.668 Kabra Extrusion 12 2.131 0.498 0.144 1.742 2.520 Kilburn Engg. 7 5.516 3.759 1.421 0.960 10.071 Mipco Seamless 7 2.287 0.937 0.354 1.151 3.422 Stovec Industries 8 9.577 7.643 2.702 1.368 17.785 Windsor Machines 7 6.678 5.357 2.025 0.185 13.170
ANOVA
Source of Variation SS df MSS F-Calc P-value F crit Between Groups 6427.706 20 321.385 5.117 0.000 1.629Within Groups 11431.128 182 62.808 Total 17858.835 202
Mean Profit before Tax to Value added ratio of Batliboi is highest
(28.157) among all the companies. Ingersoll Rand has mean ratio of 1.405 which is least among all the companies. The ANOVA test is applied to compare the mean PBT to Value added ratio for all the companies. F value is 5.117 with corresponding P value 0.000. As P value is less than 0.01, it is concluded that this difference is significant at less than 1 % level of significance.
Value Added to PBT is high incase of FAG, Bosch Rexroth, Elecon and Stovec Industries. However, this is also very erratic. This is the relation of value of various services generated while doing business to PBT. It is found that this has no direct relation with the profitability with the business.

279
Ratio 25; Value Added to Value of Output
No. Company 1991 1992 1993 1994 1995 1996 1997 1998 1999 2000 2001 2002 1 ABC 0.179 0.216 0.199 0.195 0.171 0.418 0.331 0.218 0.492 0.323 0.520 0.408 2 ABB 0.184 0.214 0.208 0.206 0.204 0.209 0.201 0.202 0.195 0.198 0.207 0.212 3 Batliboi 0.113 0.100 NA 0.095 0.093 0.115 0.165 0.136 0.147 0.000 0.110 0.197 4 Bosch Re 0.294 0.303 0.289 0.349 0.258 0.104 0.247 0.380 0.162 0.248 0.196 0.435 5 Blue Star 0.135 0.115 0.124 0.142 0.134 0.145 0.146 0.133 0.162 0.168 0.149 0.155 6 Banco Products 0.503 0.247 0.160 0.169 0.103 0.062 0.128 0.099 0.097 0.145 0.057 0.097 7 Elecon 0.188 0.188 0.166 0.129 0.149 0.147 0.206 0.244 0.230 0.150 0.175 0.120 8 Eimco Elecon 0.301 0.341 0.272 0.477 0.388 0.414 0.411 0.423 0.385 0.423 0.346 0.389 9 FAGBearing 0.152 0.187 0.219 0.298 0.290 0.321 0.331 0.333 0.465 0.458 0.487 0.469
10 GMM 0.286 0.320 0.324 0.316 0.296 0.325 0.325 0.336 0.503 0.496 0.545 0.558 11 Gujarat Apollo NA 0.181 0.206 0.283 0.282 NA NA NA 0.109 0.081 0.075 0.084 12 HindustanDorr Oliver 0.189 0.204 0.236 0.203 0.213 0.156 0.136 0.226 0.159 0.107 0.331 0.187 13 Hitachi H & L 0.059 0.102 0.136 0.144 0.146 NA NA 0.018 0.000 0.009 0.000 0.000 14 Ingersoll Rand 0.284 0.239 0.274 0.301 0.265 0.245 0.256 0.280 0.000 0.314 0.222 NA 15 Jyoti 0.219 0.208 0.226 0.230 0.186 0.174 0.145 0.308 0.205 0.230 0.248 0.132 16 Jord Engg. NA 0.169 0.168 0.363 0.217 0.191 0.102 0.010 NA 0.043 0.061 0.000 17 Kabra Extrusion 0.272 0.252 0.253 0.334 0.375 0.224 0.321 0.168 0.182 0.240 0.237 0.367 18 Kilburn Engg. 0.225 0.340 0.268 0.342 0.310 0.265 0.300 0.236 0.368 0.206 0.146 0.250 19 Mipco Seamless 0.227 0.219 0.205 0.174 0.195 0.181 0.359 0.271 0.072 0.057 0.260 0.325 20 Stovec Industries 0.358 0.263 0.344 0.286 0.220 0.219 NA 0.178 0.358 0.300 0.272 0.434 21 Windsor Machines 0.224 0.207 0.190 0.188 0.180 0.175 0.305 0.304 0.237 0.348 0.310 0.099

280
Ratio 25
C. I. For Mean Company N Mean S.D. SE of mean Lower Bound Upper Bound
ABC 12 0.306 0.127 0.037 0.206 0.405 ABB 12 0.203 0.008 0.002 0.197 0.210 Batliboi 11 0.116 0.050 0.015 0.074 0.157 Bosch Re 12 0.272 0.092 0.027 0.200 0.344 Blue Star 12 0.142 0.015 0.004 0.130 0.154 Banco Products 12 0.156 0.121 0.035 0.061 0.250 Elecon 12 0.174 0.039 0.011 0.144 0.204 Eimco Elecon 12 0.381 0.057 0.017 0.336 0.426 FAGBearing 12 0.334 0.115 0.033 0.244 0.424 GMM 12 0.386 0.105 0.030 0.304 0.468 Gujarat Apollo 8 0.163 0.088 0.031 0.068 0.257 HindustanDorr Oliver 12 0.195 0.057 0.016 0.151 0.240 Hitachi Home &Life 10 0.061 0.064 0.020 0.004 0.119 Ingersoll Rand 11 0.244 0.085 0.026 0.173 0.314 Jyoti 12 0.209 0.047 0.014 0.173 0.246 Jord Engg. 10 0.132 0.112 0.035 0.032 0.232 Kabra Extrusion 12 0.269 0.067 0.019 0.216 0.321 Kilburn Engg. 12 0.271 0.064 0.019 0.221 0.322 Mipco Seamless 12 0.212 0.089 0.026 0.143 0.282 Stovec Industries 11 0.294 0.075 0.023 0.232 0.356 Windsor Machines 12 0.231 0.073 0.021 0.174 0.287
ANOVA
Source of Variation SS df MSS F-Calc P-value F crit Between Groups 1.659 20 0.083 12.893 0.000 1.618Within Groups 1.415 220 0.006 Total 3.074 240
Mean Value added to Value of output ratio of GMM Pfaudler is
highest (38.60) among all the companies. Jord Engineering has mean
ratio of 13.20 which is least among all the companies. The ANOVA
test is applied to compare Value added to Value of output ratio for all
the companies. F value is 12.893 with corresponding P value 0.000.
As P value is less than 0.01, it is concluded that this difference is
significant at less than 1 % level of significance.
There has been very strong relation of value added to value of output
in case of GMM, Eimco Elecon FAG Bearings. This is weak in case
of Jord Engineering, Batliboi and Hitachi Home & Life.

281
General Comments:
All the companies have added new fixed assets year by year after
1991 till 2002, except Antifriction Bearing Corporation and Stovec
Industries. This shows the investment by all the engineering
companies to build up their infrastructure to meet increased
demand of the engineering products manufactured by them.
Trend analysis of Balance Sheet items and profit & Loss items of
these companies has revealed that employee cost and interest cost
have no relation with increase/decrease of sales and activities.
Other costs have relatively more direct relation with activities and
sales effected by the companies.
Common size analysis of the financial statements of some of these
companies reveal that the composition of current assets and current
liabilities change substantially year after year.

282
6.6 Trend Analysis Antifriction Bearings Co.
Rs. in Lacs No. Liabilities 1991 1993 1996 1998 2000 2002 1. Share Capital 100 119 179 179 358 3582. Reserves 100 208 387 981 358 2013. Total Share Holders Funds 100 178 312 373 351 2524. Secured Loans 110 219 992 643 533 3175. Unsecured Loan 00 00 00 00 00 006. Current Liabilities 100 143 237 211 270 1607. Provisions 100 70 67 32 22 24 Total 100 191 370 429 425 276
No. Assets 1991 1993 1996 1998 2000 2002 1. Gross Block 100 141 293 378 386 2922. Net Block 100 288 736 904 819 5513. Investments 100 125 572 572 572 724. Stock 100 206 262 359 360 1495. Debtors 100 188 237 257 378 2586. Total Current Assets 100 169 231 263 288 2067. Loans and Advances 100 161 390 283 231 4238. Misc. Assets 00 00 00 00 00 00 Total 100 191 370 429 425 276 No. Items 1991 1993 1996 1998 2000 2002 1. Sales 100 127 163 121 167 1192. R.M.Consumption 100 124 197 121 167 1093. Employee Cost 100 124 177 206 279 2624. Interest 110 220 338 388 351 3015. Depreciation 00 118 227 230 258 1766. Profit Before Tax 100 96 112 14 38 007. Tax Provision 100 70 5 3 3 08. Net Profit ( PAT) 100 123 226 25 75 0(A) During the period of 1991 to 2002 (i.e. the period of twelve years)
there was maximum increase in share capital and the least increase was in current liabilities. Reserves and secured loans increased after 1991, but declined heavily after 1996. During this period, there was maximum increase in net block and loans and advances. Gross block and investments declined heavily after 2000.
(B) Sales and net profit increased at very slow pace after 1991. Raw material consumption, employee costs and interest grew heavily year after year, on account of which overall performance has been very weak during the period. Net profit started reducing after 1996, and books reported loss in 2002.

283
Asea Brown Boveri Rs. in Lacs
No. Liabilities 1991 1993 1996 1998 2000 2002 1. Share Capital 100 208 315 420 420 4302. Reserves 100 126 708 796 677 8943. Total Share Holders Funds 100 139 646 737 636 8214. Secured Loans 110 37 258 17 52 205. Unsecured Loan 100 40 36 187 68 1076. Current Liabilities 100 146 304 260 252 3987. Provisions 100 309 367 327 356 425 Total 100 168 383 362 331 465 No. Assets 1991 1993 1996 1998 2000 2002 1. Gross Block 100 148 323 470 417 4672. Net Block 100 151 329 478 363 3683. Investments 100 100 162 162 996 2754. Stock 100 114 289 210 202 2005. Debtors 100 153 316 305 317 3556. Total Current Assets 100 171 315 281 283 4357. Loans and Advances 100 88 102 86 76 888. Misc. Assets 00 279 00 00 00 00 Total 100 168 383 362 331 465 No. Items 1991 1993 1996 1998 2000 2002 1. Sales 100 181 470 349 319 4722. R.M.Consumption 100 185 296 223 200 2403. Employee Cost 100 139 330 390 366 4344. Interest 110 85 159 91 77 555. Depreciation 100 266 455 625 599 6546. Profit Before Tax 100 308 1190 289 414 8147. Tax Provision 100 308 681 162 232 5698. Net Profit ( PAT) 100 308 1562 380 544 980
(A) During the period, there is substantial increase in reserves and
shareholders’ funds. Secured loans reduced to 20 % in 2002 from
100 in 1991. There was very high increase in investments after
1993. This was due to liquidity on account of high profitability.
There was a reasonable increase in gross block after 1991.
(B) The trend of twelve years clearly reveals that there was substantial
increase in sales and net profit earning by the company. The
company was economizing on raw material consumption and
interest. Substantial savings in interest are evident after 1996.

284
Bosch Rexroth Rs. in Lacs
No. Liabilities 1991 1993 1996 1998 2000 2002 1. Share Capital 100 200 300 353 353 3532. Reserves 100 205 399 448 447 8233. Total Share Holders Funds 100 203 177 203 203 2984. Secured Loans 110 129 246 246 140 35. Unsecured Loan 100 172 602 515 440 12356. Current Liabilities 100 141 196 221 229 3127. Provisions 100 151 61 111 139 145 Total 100 165 301 306 262 341
No. Assets 1991 1993 1996 1998 2000 2002 1. Gross Block 100 137 318 341 315 3732. Net Block 100 132 293 307 242 2903. Investments 100 100 100 100 100 1004. Stock 100 125 251 180 169 2565. Debtors 100 248 419 452 364 5266. Total Current Assets 100 180 331 315 270 3987. Loans and Advances 100 179 139 185 168 2008. Misc. Assets 100 00 00 00 193 00 Total 100 165 301 306 262 341 No. Items 1991 1993 1996 1998 2000 2002 1. Sales 100 149 215 215 253 4392. R.M.Consumption 100 151 208 183 254 3833. Employee Cost 100 141 340 321 381 5444. Interest 100 192 382 332 270 1835. Depreciation 100 165 395 470 424 5006. Profit Before Tax 100 136 66 1083 153 4747. Tax Provision 100 191 55 48 29 5548. Net Profit ( PAT) 100 106 71 1083 219 468 (A) Reserves and unsecured loans increased substantially after 1991. It
has been observed that the company heavily relied on debt
resources for business activities and other needs. There was high
increase in gross block and total current assets after 1991.
(B) Increase has been found in Sales and net profit. There was high
increase in employee cost and tax provision. Increase in sales and
net profit are positive factors of growth. The increase in employee
costs leads to decrease in profitability. Increase in provision for
income tax indicates lack of effective tax planning.

285
Blue Star
Rs. in Lacs No. Liabilities 1991 1993 1996 1998 2000 2002 1. Share Capital 100 200 763 763 763 5442. Reserves 100 103 249 280 341 3213. Total Share Holders Funds 100 114 305 333 387 3464. Secured Loans 110 180 94 350 543 005. Unsecured Loan 100 185 195 2133 1476 7466. Current Liabilities 100 116 153 180 164 2007. Provisions 100 80 184 198 188 206 Total 100 128 199 270 279 246 No. Assets 1991 1993 1996 1998 2000 2002 1. Gross Block 100 115 178 306 424 3532. Net Block 100 102 155 287 372 2313. Investments 100 100 506 1053 1024 12244. Stock 100 118 219 232 205 2145. Debtors 100 130 101 130 150 1706. Total Current Assets 100 135 202 232 233 2367. Loans and Advances 100 148 229 263 264 2668. Misc. Assets 100 156 12 432 616 1010 Total 100 128 159 270 279 246 No. Items 1991 1993 1996 1998 2000 2002 1. Sales 100 119 213 245 262 2782. Raw Material Consumption 100 121 218 248 243 2693. Employee Cost 100 119 198 246 289 2824. Interest 100 141 92 128 220 1295. Depreciation 100 140 204 444 626 7056. Profit Before Tax 100 96 754 383 536 5817. Tax Provision 100 88 2282 555 429 358. Net Profit ( PAT) 100 97 592 365 547 645 (A) Substantial increase has been observed in share capital and unsecured
loans. Similarly, there is good amount of increase in investments
deferred revenue expenses. Increase in investments show higher
liquidity, which is substantiated by higher net profit ratio.
(B) Sales does not have very high increasing trend. However, there is
substantial increase in profit before tax as well as profit after tax.
Reduced tax provision reveals that company is having effective tax
planning.

286
Elecon Engineering Rs. in Lacs
No. Liabilities 1991 1993 1996 1998 2000 2002 1. Share Capital 100 100 100 100 100 1002. Reserves 100 103 162 222 255 2113. Total Share Holders Funds 100 103 151 200 228 1924. Secured Loans 100 87 77 181 232 2935. Unsecured Loan 100 87 77 643 429 4306. Current Liabilities 100 00 129 103 65 797. Provisions 100 00 11 66 72 00 Total 100 123 126 155 140 142 No. Assets 1991 1993 1996 1998 2000 2002 1. Gross Block 100 107 133 168 183 1812. Net Block 100 90 132 192 213 1733. Investments 100 00 00 108 313 4844. Stock 100 127 92 71 71 945. Debtors 100 139 86 189 132 1516. Total Current Assets 100 105 98 111 91 1017. Loans and Advances 100 259 242 274 222 2608. Misc. Assets 100 116 83 00 00 376 Total 100 123 126 155 140 142 No. Items 1991 1993 1996 1998 2000 2002 1. Sales 100 94 128 113 121 972. R.M. Consumption 100 87 122 73 106 953. Employee Cost 100 112 155 156 216 1214. Interest 100 142 95 77 72 915. Depreciation 100 72 62 101 107 1216. Profit Before Tax 100 40 507 508 243 007. Tax Provision 100 8 10 82 94 1008. Net Profit ( PAT) 100 192 2852 2525 544 00
(A) Increase has been observed only in secured loans and unsecured
loans. In some of the years, after 1991, no provisions are there,
including tax provision, on account of loss during these years. On
the assets side, there is increase in investments and miscellaneous
assets.
(B) Sales increased till 1996. After 1996, there is heavy down trend in
sales. Both the profit before tax and profit after tax have gone
down (loss in some of the years) after 1996. Where there is loss, no
tax provision has been made.

287
GMM Rs. in Lacs
No. Liabilities 1991 1993 1996 1998 2000 2002 1. Share Capital 100 100 100 100 100 1232. Reserves 100 155 322 396 655 6813. Total Share Holders Funds 100 144 277 336 547 5684. Secured Loans 100 916 870 638 820 9125. Unsecured Loan 100 900 856 628 803 8266. Current Liabilities 100 129 158 191 111 1357. Provisions 100 154 357 71 362 186 Total 100 146 288 289 366 330 No. Assets 1991 1993 1996 1998 2000 2002 1. Gross Block 100 139 416 431 474 5042. Net Block 100 144 588 546 582 5513. Investments 100 100 100 100 9400 19954. Stock 100 178 247 165 229 2425. Debtors 100 49 300 590 548 3176. Total Current Assets 100 154 2-8 216 219 1897. Loans and Advances 100 280 223 232 571 5068. Misc. Assets 100 31 31 18 431 1800 Total 100 146 288 289 366 330 No. Items 1991 1993 1996 1998 2000 2002 1. Sales 100 181 346 234 257 2992. R.M. Consumption 100 208 392 258 342 3793. Employee Cost 100 95 194 163 205 1964. Interest 100 116 670 721 730 7565. Depreciation 100 127 179 216 216 2476. Profit Before Tax 100 156 317 104 71 297. Tax Provision 100 194 357 71 57 168. Net Profit ( PAT) 100 133 293 124 79 48 Total 100 181 346 234 257 299 (A) There is substantial increase in reserves, secured loans and
unsecured loans. Similarly, good increase is found in gross block,
investments and miscellaneous assets.
(B) Sales increased till 1996. After 1996, there is a decreasing trend in
sales. Increase is observed in raw material cost and interest cost.

288
Hindustan Dorr Oliver Rs. in Lacs
No. Liabilities 1991 1993 1996 1998 2000 2002 1. Share Capital 100 100 100 100 100 1002. Reserves 100 118 486 488 435 4763. Total Share Holders Funds 100 113 387 389 349 3804. Secured Loans 100 211 711 65 351 8795. Unsecured Loan 100 170 706 649 1070 7466. Current Liabilities 100 102 218 178 113 1517. Provisions 100 88 199 192 117 19 Total 100 107 305 274 233 260 No. Assets 1991 1993 1996 1998 2000 2002 1. Gross Block 100 118 1289 1336 1343 15472. Net Block 100 125 2466 2381 2228 22803. Investments 100 553 707 206 847 20604. Stock 100 51 159 125 89 1785. Debtors 100 136 318 268 142 2336. Total Current Assets 100 108 146 124 81 947. Loans and Advances 100 1030 1306 1016 642 5648. Misc. Assets 100 100 100 100 100 100 Total 100 107 305 274 233 260
No. Items 1991 1993 1996 1998 2000 2002 1. Sales 100 99 214 168 78 1222. R.M. Consumption 100 94 100 100 100 1003. Employee Cost 100 100 172 173 162 2484. Interest 100 392 1020 758 956 9355. Depreciation 100 121 327 396 676 2226. Profit Before Tax 100 104 139 117 00 667. Tax Provision 100 88 80 97 17 308. Net Profit ( PAT) 100 123 209 140 00 123 Total 100 99 214 168 78 122 (A) During this period of twelve years, i.e. 1991 to 2002, the company
has not thought fit to increase the share capital. There is substantial
increase of secured loans and unsecured loans. There was
substantial increase in gross block, investments and loans and
advances during this period.
(B) Sales increased till 1996. After 1996, there was decline in sales and
PBT. There is maximum increase of ten times in the interest cost,
which has negative effect on profitability of the company.
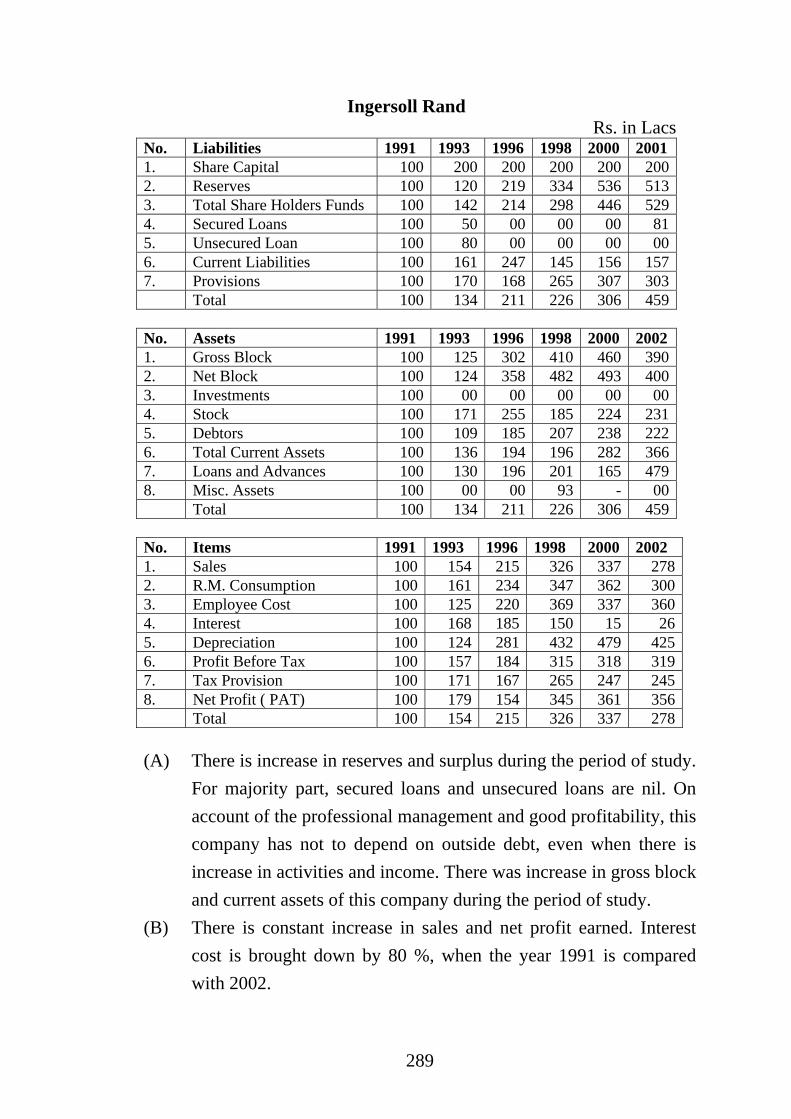
289
Ingersoll Rand Rs. in Lacs
No. Liabilities 1991 1993 1996 1998 2000 2001 1. Share Capital 100 200 200 200 200 2002. Reserves 100 120 219 334 536 5133. Total Share Holders Funds 100 142 214 298 446 5294. Secured Loans 100 50 00 00 00 815. Unsecured Loan 100 80 00 00 00 006. Current Liabilities 100 161 247 145 156 1577. Provisions 100 170 168 265 307 303 Total 100 134 211 226 306 459 No. Assets 1991 1993 1996 1998 2000 2002 1. Gross Block 100 125 302 410 460 3902. Net Block 100 124 358 482 493 4003. Investments 100 00 00 00 00 004. Stock 100 171 255 185 224 2315. Debtors 100 109 185 207 238 2226. Total Current Assets 100 136 194 196 282 3667. Loans and Advances 100 130 196 201 165 4798. Misc. Assets 100 00 00 93 - 00 Total 100 134 211 226 306 459 No. Items 1991 1993 1996 1998 2000 2002 1. Sales 100 154 215 326 337 2782. R.M. Consumption 100 161 234 347 362 3003. Employee Cost 100 125 220 369 337 3604. Interest 100 168 185 150 15 265. Depreciation 100 124 281 432 479 4256. Profit Before Tax 100 157 184 315 318 3197. Tax Provision 100 171 167 265 247 2458. Net Profit ( PAT) 100 179 154 345 361 356 Total 100 154 215 326 337 278 (A) There is increase in reserves and surplus during the period of study.
For majority part, secured loans and unsecured loans are nil. On account of the professional management and good profitability, this company has not to depend on outside debt, even when there is increase in activities and income. There was increase in gross block and current assets of this company during the period of study.
(B) There is constant increase in sales and net profit earned. Interest cost is brought down by 80 %, when the year 1991 is compared with 2002.

290
Kabra Extrusian Rs. in Lacs
No. Liabilities 1991 1993 1996 1998 2000 2002 1. Share Capital 100 100 128 128 128 1282. Reserves 100 226 1257 1399 1611 18693. Total Share Holders Funds 100 146 539 591 669 7634. Secured Loans 100 115 29 71 148 1105. Unsecured Loan 100 111 100 100 100 1006. Current Liabilities 100 102 185 131 169 1537. Provisions 100 586 451 470 469 482 Total 100 133 353 348 418 433 No. Assets 1991 1993 1996 1998 2000 2002 1. Gross Block 100 107 284 296 349 4032. Net Block 100 103 284 276 306 3263. Investments 100 100 100 100 100 1004. Stock 100 251 604 681 670 7215. Debtors 100 165 448 368 479 5936. Total Current Assets 100 98 303 313 327 3827. Loans and Advances 100 150 157 169 189 2068. Misc. Assets 100 92 73 11 00 00 Total 100 133 353 348 418 433 No. Items 1991 1993 1996 1998 2000 2002 1. Sales 100 159 437 381 465 7052. R.M. Consumption 100 230 568 527 578 7603. Employee Cost 100 144 252 314 484 7564. Interest 100 100 115 133 52 895. Depreciation 100 120 285 320 360 4706. Profit Before Tax 100 243 598 175 346 5697. Tax Provision 100 586 800 133 400 9338. Net Profit ( PAT) 100 185 564 182 337 392 Total 100 199 433 381 465 705 (A) Substantial increase has been found in reserves and surplus. This is
on account of improved profitability year after year. There is no
dependence on secured loans and unsecured loans. Inventory and
debtors have shown increasing trend.
(B) There is healthy increase in sales and profit earned, year after year.
Interest cost is under control, since the company does not rely on
borrowed funds. However, there seems absence of proper tax
planning. Heavy tax provisions are made by the company.

291
Windsor Machinery Rs. in Lacs
No. Liabilities 1991 1993 1996 1998 2000 2002 1. Share Capital 100 118 145 145 145 1452. Reserves 100 186 333 312 117 003. Total Share Holders Funds 100 160 264 250 127 194. Secured Loans 100 102 266 336 343 3305. Unsecured Loan 100 102 179 137 123 1106. Current Liabilities 100 118 153 185 227 2287. Provisions 100 100 100 84 70 61 Total 100 121 215 239 218 185 No. Assets 1991 1993 1996 1998 2000 2002 1. Gross Block 100 118 202 242 248 2552. Net Block 100 167 304 356 322 2803. Investments 100 00 310 219 269 2694. Stock 100 117 161 166 156 1605. Debtors 100 176 313 458 409 2586. Total Current Assets 100 115 177 211 157 1637. Loans and Advances 100 124 252 257 186 1618. Misc. Assets 100 307 207 634 343 229 Total 100 121 215 239 218 185 No. Items 1991 1993 1996 1998 2000 2002 1. Sales 100 86 170 137 127 1032. R.M. Consumption 100 86 169 101 99 1103. Employee Cost 100 125 278 237 254 2224. Interest 100 131 309 359 354 2015. Depreciation 100 136 164 145 137 1336. Profit Before Tax 100 12 119 24 00 007. Tax Provision 100 00 63 12 00 008. Net Profit ( PAT) 100 15 136 28 00 00 Total 100 86 170 137 127 103
(A) Maximum increase has been found in secured loans. After 1998,
the company has incurred continuous loss, due to which the
reserves have turned into negative. Debtors have increased year
after year, which shows weak receivables management.
(B) Sales increased till 1996. After 1996, sales has declined heavily.
On account of this, there are repeated losses after 2000. Employee
cost and interest cost are also out of control.

292
6.7 Common Size Analysis 6.8
Asea Brown Boveri Rs. in Lacs
No. Assets 1991 1993 1996 1998 2000 2002 1. Net Block 17 15 16 22 18 132. Investment 00 00 1 1 1 13. Current Assets 80 83 82 76 80 854. Inventory (23) (16) (18) (14) (14) (10)5. Debtors (55) (50) (46) (47) (53) (42)6. Loans & Advances 2 1 1 1 1 17. Misc. Assets 1 1 00 00 00 008. P & L A/c 00 00 00 00 00 00 Total 100 100 100 100 100 100 No. Liabilities 1991 1993 1996 1998 2000 2002 1. Share Capital 4 5 3 5 5 42. Reserves & Surplus 22 17 35 48 45 423. Secured Loans 11 2 14 1 1 14. Unsecured Loans 2 1 1 2 1 15. Current Liabilities 58 69 40 42 45 506. Provisions 3 6 3 2 3 27. Total 100 100 100 100 100 100
No. Items 1991 1993 1996 1998 2000 2002 .1. R.M. Consumption 55 60 54 58 56 54.2. Power & Fuel 2 2 1 1 1 1.3. Employee Cost 11 9 8 12 13 10.4. Sales & General Exp. 13 9 12 14 11 11.5. Interest 4 2 2 1 1 16. Depreciation 1 2 1 1 1 17. Other Exp. 7 4 5 7 8 98. Profit Before Tax 7 12 17 6 9 129. Tax (3) (5) (4) (2) (2) (3)10. Net Profit (4) (7) (13) (4) (7) (9) Total 100 100 100 100 100 100

293
(1) Asea Brown Boveri :
(a) During the period of study, i.e.1991 to 2002, the company
has been able to bring down inventory level to half by 2002.
The level of debtors also has been brought down. This
implies higher inventory turnover ratio and higher debtors’
turnover ratio.This is substantiated by the ratios of the
company referred earlier. The inventory turnover ratio was
4.53 times in 1991 which was increased to 10.13 times in
2002. Similarly, debtors’ turnover ratio was 2.15 times in
1991 which is 2.64 in 2002. Reserves and Surplus have been
doubled in terms of proportion, when 2002 is compared with
1991. This is on account of high amount of Sales and higher
net profit ratio. The net profit ratio was 6 % in 1991 which
went upto 12 % in 2002. When 2002 is compared with
1991, the secured loans and unsecured loans have become
almost neglible. The company is able to repay all debt out of
the earnings during the period of study. The level of current
liabilities also has been brought down.
(b) On the income and expense side, raw materials, employee
costs and other costs have been brought down after 1991.
The power & fuel and interest cost have been brought to 50
%, even after increase of 5 times in activities (production
and sales) after 1991.Both profit before tax and profit after
tax have been doubled by 2002.

294
Blue Star Rs. in Lacs
No. Assets 1991 1993 1996 1998 2000 2002 1. Net Block 3 6 12 9 8 72. Investment 25 22 32 27 32 343. Current Assets 6 9 3 8 12 004. Inventory 1 2 2 11 7 855. Debtors 64 60 50 44 40 536. Loans & Advances 1 1 1 1 1 1 Total 100 100 100 100 100 100 No. Liabilities 1991 1993 1996 1998 2000 2002 1. Share Capital 21 17 17 25 28 212. Reserves & Surplus 00 00 1 2 2 23. Secured Loans 71 75 73 64 61 684. Unsecured Loans (27) (25) (30) (24) (20) (24)5. Current Liabilities (42) (46) (23) (22) (24) (31)6. Provisions 7 8 8 8 8 87. Misc. Assets 1 1 1 1 1 18 P & L A/c 00 00 00 00 00 00 Total 100 100 100 100 100 100 No. Items 1991 1993 1996 1998 2000 2002 .1. R.M. Consumption 63 66 61 65 60 62.2. Power & Fuel 10 10 10 11 12 11.3. Employee Cost 11 10 10 10 12 11.4. Sales & General Exp. 6 6 6 5 5 5.5. Interest 3 3 1 1 2 16. Depreciation 1 1 1 2 2 37. Other Exp. 2 2 2 2 2 28. Profit Before Tax 3 2 9 4 5 59. Tax (1) (1) (3) (1) (1) 010. Net Profit (2) (1) (6) (3) (4) (5) Total 100 100 100 100 100 100 (a) During the period of study of twelve years, reserves and surplus have
gone up by 40 %, secured loans have been fully paid and current
liabilities have been brought down by 20 %. Debtors have also been
brought down by 27 %, even when sales has increased 3 times.
(b) The company has been able to bring down interest cost to one third
by 2002. Other expenses like raw materials consumption, power &
fuel and employee cost have normal trend.
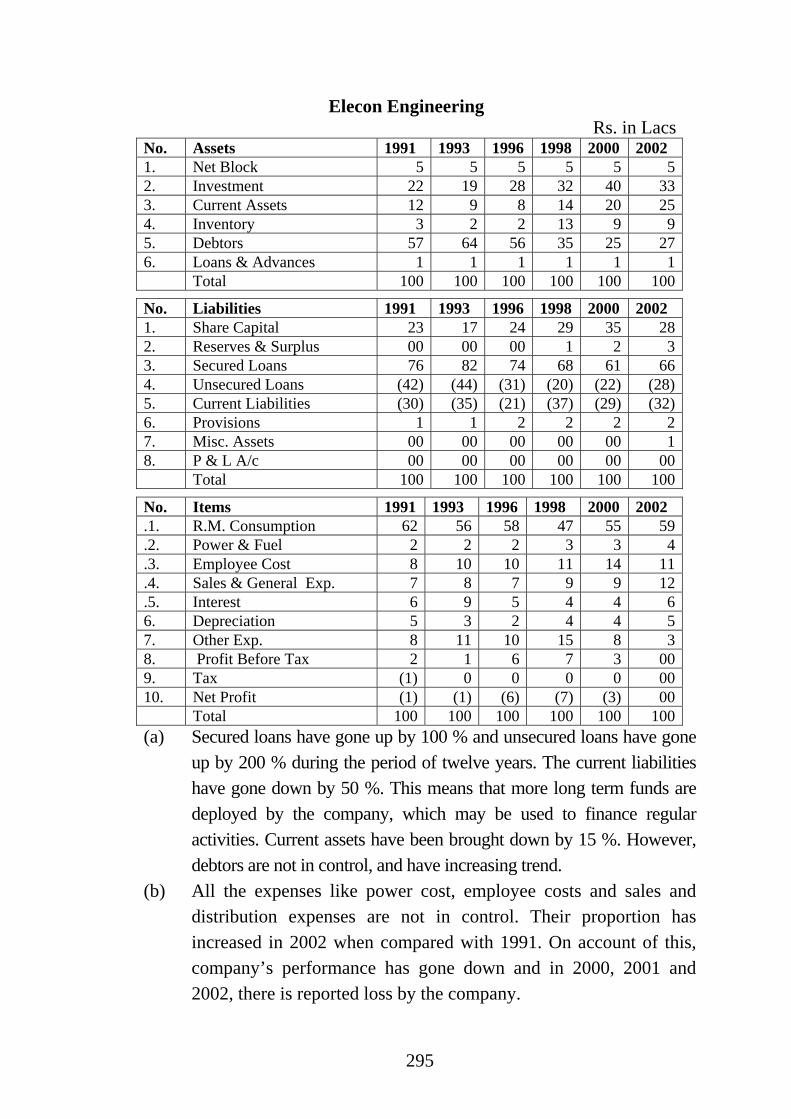
295
Elecon Engineering Rs. in Lacs
No. Assets 1991 1993 1996 1998 2000 2002 1. Net Block 5 5 5 5 5 52. Investment 22 19 28 32 40 333. Current Assets 12 9 8 14 20 254. Inventory 3 2 2 13 9 95. Debtors 57 64 56 35 25 276. Loans & Advances 1 1 1 1 1 1 Total 100 100 100 100 100 100
No. Liabilities 1991 1993 1996 1998 2000 2002 1. Share Capital 23 17 24 29 35 282. Reserves & Surplus 00 00 00 1 2 33. Secured Loans 76 82 74 68 61 664. Unsecured Loans (42) (44) (31) (20) (22) (28)5. Current Liabilities (30) (35) (21) (37) (29) (32)6. Provisions 1 1 2 2 2 27. Misc. Assets 00 00 00 00 00 18. P & L A/c 00 00 00 00 00 00 Total 100 100 100 100 100 100
No. Items 1991 1993 1996 1998 2000 2002 .1. R.M. Consumption 62 56 58 47 55 59.2. Power & Fuel 2 2 2 3 3 4.3. Employee Cost 8 10 10 11 14 11.4. Sales & General Exp. 7 8 7 9 9 12.5. Interest 6 9 5 4 4 66. Depreciation 5 3 2 4 4 57. Other Exp. 8 11 10 15 8 38. Profit Before Tax 2 1 6 7 3 009. Tax (1) 0 0 0 0 0010. Net Profit (1) (1) (6) (7) (3) 00 Total 100 100 100 100 100 100(a) Secured loans have gone up by 100 % and unsecured loans have gone
up by 200 % during the period of twelve years. The current liabilities have gone down by 50 %. This means that more long term funds are deployed by the company, which may be used to finance regular activities. Current assets have been brought down by 15 %. However, debtors are not in control, and have increasing trend.
(b) All the expenses like power cost, employee costs and sales and distribution expenses are not in control. Their proportion has increased in 2002 when compared with 1991. On account of this, company’s performance has gone down and in 2000, 2001 and 2002, there is reported loss by the company.

296
Hindustan Dorr Oliver Rs. in Lacs
No. Assets 1991 1993 1996 1998 2000 2002 1. Net Block 10 10 10 10 10 102. Investment 29 32 45 51 58 533. Current Assets 2 3 3 1 2 54. Inventory 0 0 2 1 2 15. Debtors 53 50 36 33 26 306. Loans & Advances 6 5 4 4 3 1 Total 100 100 100 100 100 100
No. Liabilities 1991 1993 1996 1998 2000 2002 1. Share Capital 5 5 8 7 8 92. Reserves & Surplus 1 3 1 1 2 23. Secured Loans 85 86 79 80 77 764. Unsecured Loans (5) (3) (3) (2) (2) (3)5. Current Liabilities (36) (46) (38) (35) (22) (26)6. Provisions 9 6 10 12 13 137. Misc. Assets 00 00 00 00 00 008. P & L A/c 00 00 00 00 00 00 Total 100 100 100 100 100 100
No. Items 1991 1993 1996 1998 2000 2002 .1. R.M. Consumption 62 62 24 41 15 20.2. Power & Fuel 5 5 6 7 8 8.3. Employee Cost 9 8 6 8 11 15.4. Sales & General Exp. 2 1 1 2 2 2.5. Interest 2 2 3 2 6 46. Depreciation 2 1 1 2 6 17. Other Exp. 10 9 52 30 52 508. Profit Before Tax 11 12 7 8 00 19. Tax (6) (6) (2) (3) 00 (1)10. Net Profit (5) 6 (5) (5) (12) (1) Total 100 100 100 100 100 100
(a) Reserves and surplus have been doubled. Current liabilities have been brought down by 40 %, while current assets have been brought down by 10 %. Fixed assets have been doubled within the period of twelve years of 1991 to 2002.
(b) However, the company has not been able to maintain level of income, because of which after 1998, loss is reported by the accounts. HDO is basically undertaking fabrication jobs. Employee costs and power fuel cost are not in control, which should be managed properly to generate value. The company should think of developing its own product, so that it can sustain the existence and growth in future. Profit before tax and profit after tax have gone down after 1998.

297
Windsor Machines Rs. in Lacs
No. Assets 1991 1993 1996 1998 2000 2002 1. Net Block 10 10 8 6 7 82. Investment 18 28 28 24 10 03. Current Assets 27 22 33 38 41 474. Inventory 5 4 4 3 3 35. Debtors 37 35 26 29 38 446. Loans & Advances 3 1 2 1 1 0 Total 100 100 100 100 100 100
No. Liabilities 1991 1993 1996 1998 2000 2002 1. Share Capital 14 20 20 21 21 212. Reserves & Surplus 4 1 6 5 5 63. Secured Loans 72 70 60 64 66 644. Unsecured Loans 46 45 35 33 34 405. Current Liabilities 16 24 23 30 30 226. Provisions 9 8 11 7 7 77. Misc. Assets 1 1 3 3 2 28. P & L A/c 00 00 00 00 00 00 Total 100 100 100 100 100 100
No. Items 1991 1993 1996 1998 2000 2002 .1. R.M. Consumption 57 58 58 57 53 55.2. Power & Fuel 3 2 1 2 1 2.3. Employee Cost 8 10 11 13 15 16.4. Sales & General Exp. 9 7 9 10 10 12.5. Interest 5 6 9 10 11 86. Depreciation 4 4 3 3 3 37. Other Exp. 4 1 1 3 5 48. Profit Before Tax 10 12 8 2 0 09. Tax (2) 0 (1) 0 0 0010. Net Profit (8) (12) (7) (2) 0 0 Total 100 100 100 100 100 100
(a) There is increase in reserves and surplus after 1991 till 1996. After 1996, on account of sustained losses, reserves became zero by 2002. Debtors level has gone up by 40 % by 2002, which is also one of the reasons of weak liquidity and absence of liquidity.
(b) Employee costs have doubled by 2002. Interest cost has gone up by 60 %. The company turned in to loss making after 1998.
Reference : 1. The ratio analysis, trend analysis and common size analysis has
been done on the basis of data taken from annual reports of the companies, reference to Bombay Stock Exchange Official Directory and Capitaline Plus.

298
6.8 Major Findings of the Study
General
1) The analysis of the data of various companies for the period of
1991 to 2002reveals that by control of manufacturing expenses and
improving labour productivity, gross profit ratio can be improved,
which is very crucial for maintaining overall profitability.
Manufacturing expenses includes power & fuel, sub contracting,
indirect material, overtime and manufacturing overheads. The
companies which have maintained healthy gross profit ratio, have
performed well throughout the period of study.
2) In the long run, it is a prudent policy to maintain steady dividend
payout ratio. This can leverage the debt equity ratio for improving
the profitability, i.e. net profit ratio, of the Company. Here, without
addressing the cost structure, profitability can be strengthened.
3) It is observed from the analysis of data that financing of fixed
assets, particularly machinery, out of own funds leads to increase in
sales revenue without any increase in interest cost and strong
profitability. This testifies the prudent policy of maintaining
healthy dividend payout ratio.
4) Power is a crucial cost factor. By judicious power consumption,
profitability, i.e. ratio, can be improved. This is evident in case of
ABB and Ingersoll rand.
5) The analysis of data of sick companies like Windsor Machines and
Jord Engineering reveals that their problem of worsening
profitability is attributable to weak collections from debtors which
leads to increase in interest cost and disturbed liquidity. This is
hampering the operational efficiency and leading to diseconomies
of slow business activities and lesser revenue generation, which
also widens the gap of revenue and costs.

299
6) It can be observed from the comparative analysis of data of
different companies that those companies who have steady
inventory ratio have not progressed year after year and their
profitability has worsened. Even many companies have been turned
into loss making units. This is because of weak production
planning, lack of control on sub contracting jobs, lesser labour
productivity and slow pace of production. This is evident in case of
Gujarat Apollo, Kilburn Engineering, Jord Engineering and Elecon
Engineering.
7) The companies who practice systematic tax planning and prudent
dividend policy have been able to strengthen their net worth year
after year. In many cases, such companies try to attract minimum
tax liability, which indicates dual benefit of taking advantage of tax
planning measures, at the same time good liquidity for operational
comfort. Compared to 1991, the increase in net worth of ABB,
Ingersoll Rand and Kabra Extrusion has been eight times, six times
and eighteen times respectively by 2002.
8) The use of profit should have threefold comprehensive view.
Payment to the government in terms of income tax, payment of
dividend i.e. dividend payout and retained earnings should be
viewed in terms of their opportunity cost. This requires prudent tax
planning and conservative dividend payout ratio.Paying higher tax
than the rate of tax in the respective year shows unjustified higher
payment of tax and eventual liquidity problems. This has been
observed in case of ABC, Banco Products, GMM and Hindustan
Dorr Oliver. The Engineering companies usually do not have very
high profitability like FMCG and pharmaceutical companies. The
rate of dividend should be justified with reference to return on
equity, else it will have negative effect on shareholder value

300
creation and weak performance of securities in the stock market in
the long run.
9) Another observation is regarding effect interest burden on
profitability. It is evident that in many companies, the interest
coverage ratio has been worsening and debt equity ratio as well as
current ratio has rising trend. This leads to weakening net profit
ratio. This situation requires indepth study of credit policy of the
company and monitoring all the components of working capital
throughout the year. This is the case with Banco Products, Elecon
Engineering and Jyoti Ltd. It is observed that the Companies
having overall good performance are carrying minimum interest
burden. Even this is reducing with increased activities.
10) On the basis of performance of different Companies during the
period of study, it is evident that the parameters which are crucial
for engineering companies and which requires monitoring for
expected year end performance are (a) inventory turnover ratio (b)
manufacturing overheads to value of production (c) PBT to Sales
ratio and (d) tax provision to PBT ratio. This can have acid test of
business performance as per the following matrix.
ENTORYAVERAGEINVSALES
PRODUCTIONOFVALUEOVERHEADSMFG.
PBTPROVISIONTAX
SALESPBT

301
The evaluation as per this matrix will ensure monitoring of (1) speed
and efficiency of production, and ultimate Sales revenue generation (2) rate
of profitability (3) verifying the operating leverage and (4) effective tax
planning, for strengthening the net worth of the company.
Practices for Financial Improvements (Findings as per
Questionnaire)
A questionnaire covering various aspects of financial performance
was prepared and sent to the financial controllers of various engineering
companies. As per the feedback of this questionnaire following
summarized finding have been presented which should be the practices
for financial improvements, since these are the feedback given by the
financial executives working in the real industrial world. This
questionnaire is enclosed as per annexure – I.
(1) Eighty Five percent of the respondents opined that maximizing profit after tax and maximizing return on investment were prime financial objectives of their Company.
(2) Sixty Five percent of the respondents opined that increase in sales and return on investment were important year end parameters considered by the management.
(3) Sixty Five percent of the respondents were of the opinion that they were monitoring inventory consumption for maintaining gross profit ratio.
(4) All the respondents opined that they were concerned about labour cost and labour productivity for maintaining the gross profit ratio.
(5) All the respondents opined that for maintaining good profitability, control of interest and general administrative expenses are important. They keep watch on these expenses.
(6) In the opinion of all the respondents, both increase in turnover and control of costs are important for maintaining the profitability.

302
(7) Sixty Five percent of respondents opined that competitors do influence their company's business. However, they devise suitable strategy to overcome this issue.
(8) It is revealed by Fifty percent companies that many companies were not serious about tax planning foe improving the level of profit after tax (net profit).
(9) Regarding the union budget provisions for taxation of business income, it was the opinion of Fifty percent of the respondents that since the budget provisions are inconsistent year to year, tax planning is hampered.
(10) Seventy percent respondents opined that their company's dividend policy was positive, i.e. favourable to the shareholders.
(11) It was opined by Seventy percent of the respondents that assets turnover ratio is important measure to verify the profitability.
(12) Ninety percent respondents opined by the majority of the respondents that return on capital employed was also an important measure to verify the profitability.
(13) It was opined by the Ninety percent of the respondents that earnings per share is important measure of profitability of the company.
(14) All the respondents opined that substantial amount of earnings should be retained to finance the growth of business.
(15) Seventy percent of the respondents were having positive outlook for business and profitability during the period 2005-2010.
(16) The various strengths of their companies mentioned by the respondents were long experience, sound technical knowledge, good brand name, introduction of new products, cost control, efficient workforce and introduction of ERP.
(17) The various weaknesses of their companies mentioned by the respondents were high increase in input cost, delay in projects, high overheads, lack of cost control, lack of coordination and high taxation.
(18) Some of the opportunities identified by the respondents were opening up of the economy, international market and access to low cost debt.
303
(19) Some of the threats identified by the respondents were down trend in customers' business, increase in indigenous competition, international competition and cheap Chinese products.
(20) Sixty Five percent of the respondents opined that earnings decide the capital requirements and capitalization of the company.
(21) Seventy percent of the respondents opined that cost of the funds and particular requirement of funds for the project go into the decision for getting the debt finance.
(22) It was opined by majority of the respondents that the cost of the fund, timing and control factors have major bearing on the capital structure.
(23) It was opined by majority of the respondents that nowadays, preference shares is not a popular source of capital.
(24) Fifty percent of the respondents opined that level of Sales, operating cycle and credit policy of commercial banks decide the working capital policy of their companies.
(25) It was opined by Ninety percent of the respondents that inventory is the highest component in the working capital of any industrial company.
(26) It was opined by Seventy percent respondents that there is a direct link between sales and inventory in a manufacturing unit.
(27) It was opined by Ninety percent respondents that there is a good amount of relation between sales and debtors.
(28) All the respondents opined that their company was having a particular type of current ratio.
(29) Seventy percent of the respondents opined that raw material is having highest proportion in the inventory of any industrial unit.
(30) Sixty Five percent of the respondents opined that they are having a specified credit policy.
(31) It was opined by the Fifty percent of the respondents that the debtors do not delay the payments always. Usually the payments are in time.

304
(32) Seventy Five percent of the respondents opined that for working capital, they rely on bank finance.
(33) Seventy percent of the respondents opined that they have annual capital investment plan for their company.
(34) Ninety percent of the respondents opined that the addition in plant and machinery is mostly for additional production capacity.
(35) It was opined by Fifty percent of the respondents that the major source of financing of fixed assets is own funds and term loans.
(36) It was opined by the Fifty percent of the respondents that in financing of the fixed assets relevant factors are urgency of funds, cost of the funds and tax considerations.
(37) Ninety percent of the respondents opined that there is a direct relation between addition in fixed (machinery etc.) assets and increase in sales.
(38) Seventy percent of the respondents opined that there is a link between addition in fixed assets and increase in profitability.
(39) It was opined by Fifty percent of the respondents that they occasionally analyse fixed assets turnover ratio to monitor the profitability.
(40) It was opined by Fifty percent of the respondents that they analyse operating leverage for analysis of costs and profitability.
(41) It was opined by Seventy percent of the respondents that usually in the books, the depreciation is charged as per straight line method.
(42) It was opined by Eighty Five percent the majority of the respondents that they undertake the exercise of funds flow for analyzing the use of funds and to monitor the trend of use of funds in the business activities.
6.9 The Engineering Companies should observe the following for
Financial Discipline in their working. Therefore, the
suggestions as under are made on the basis of the study.

305
Suggestions
1) Prudent financial management requires maintaining good profitability in the business. This requires detailed study of the cost structure and controlling all the unproductive expenses. Financial Controllers of the Companies should bring such awareness in the organization, which will ensure financial discipline.
2) Any loss making unit/division of the business should be cut-off to stop draining of hard earned profit.
3) Similarly, there can be expansion/diversification in the similar line of business activity to strengthen the overall profitability.
4) Detailed study of complete production cycle will ensure identification of costs. Strategic reduction of production cycle and mismatch of processes, particularly in Engineering Companies, will boost the productivity and profitability of the company.
5) The real growth should be monitored not by the figures reflected by the Accounts only. This may be due to inflationary effects. The periodical growth should be evaluated with reference to quantitative growth of the activities (quantitative increase in production & sales), which is the real growth ensuring better profitability.
6) For any management decision for expansion, diversification or reorganization, the concurrence of the Finance Controller must be taken. This is to ensure that in the long run there is real cash flow and enough earnings, which will justify the huge amount of resources invested on long term projects.
7) Judicious use of debt finance should be made in the business. This will ensure routine comfort in business activities as also growth in the activities, together with strategic tax planning. Interest is a deductible expense, while payment of dividend is not.

306
8) Good tax planning for every year should be the part of financial
management of the company. This ensures saving of hard earned
money in the business and building strong reserves. This can increase
the book value of Shares, ensuring the growth of shareholders’
investment and better performance in the Share market.
9) Periodical performance measurement must be undertaken by the
management to review and monitor the business results. Primarily,
this should be on the basis of the data generated thro Accounting
system, which is the real performance of the firm.
10) Any business activity must have good cash flow from operations. Such
generation should be monitored for checking the ultimate success of
business operations. Without such cash flow, there can be routine
problems in carrying out of the activities. Cash flow generation is an
important yardstick to be applied to the business operations.
11) Another relevant issue together with what is stated above, is the
issue of credit policy of the organization. Business activities
generate funds. Prudent Credit policy only will decide the quality
and quantity of funds flow. This should be devised wisely by the
top management and it should be ensured that it is followed with
spirit in the interest of the business.
12) A critical component of cost for the engineering companies is that
of power consumption. This requires both control of wastage of
power and devising practical ways for judicious use of power
which is a major cost component as also a very dear cost element
in the total cost. If this is monitored seriously, then the company
can improve its profitability substantially.
307
13) The big units require regular monitoring of activities on quarterly
basis. The activities should be reviewed and assessed covering the
important parameters of (a) inventory turnover ratio(b) debtor
turnover ratio (c) fixed assets turnover ratio (d) value added to
value of output and (e) net profit ratio.
14) The completion schedules for various jobs should be properly
reviewed and adhered to with a view that this does not attract
liquidated damages, which reduces the cash flow as well as the
profitability of the Company.
6.10 Conclusion :
Engineering industry is one of the oldest industry in India. Since
1947, this industry has kept pace of growth and has helped sustain the
development of other industries as well, because the manufacturing
strength of all the industries depend on the engineering industry. Further,
as the industry is capital intensive and operating in the competitive
economic environment, periodical review of financial performance
should be undertaken to ensure overall success. This will ensure
identifying the area of trouble, taking remedial actions, evaluating the
performance and confirming that the best year end results are achieved.
Individual companies may have bench marks or the evaluation may be
done considering the positive or negative trend, compared to the
performance in past. This study covered the evaluation of financial
performance of many engineering companies covering the period from
1991 to 2002. The evaluation covered important areas like profitability,
capital structure, working capital and operations.

308
The analysis covers :
1) Profitability : Return on Net Assets, Net Profit Ratio, Return on
Equity, Earning per Share, Gross Profit Ratio, Earning on Equity
Capital and Operating Cost to Sales Ratio.
2) Capital Structure : Fixed Assets to Net worth, Equity to Total
assets Ratio and Debt Equity Ratio.
3) Working Capital: Current Ratio and Sales to Net Working Capital
Ratio.
4) Operations : Inventory Turnover Ratio and Fixed Assets Turnover
Ratio.
5) Miscellaneous : Dividend Payout Ratio, Tax Provision to PBT,
Sales to Admn. And General Expenses Ratio, Salaries & Wages to
Sales, Interest Coverage, Retained Earnings to PAT Ratio, Debtors'
Turnover, Value Added to Salaries & Wages, Value Added to
Sales, Value Added to PBT and Value Added to Value of
output.
Trend analysis and Common size analysis has also been done. If
the overall performance of all the companies is grouped suitably, it can be
summarized as under.
A) The overall performance of Asea Brown Boveri, Ingersoll Rand,
Blue Star, FAG Bearings and Banco Products is outstanding.
B) The overall performance of Bosch Rexroth, GMM Pfaudler, Kabra
Extrusion,
Elecon Engg., Eimco Elecon, Gujarat Apollo, Hindustan Dorr
Oliver and Stovec Industries is average.
C) The overall performance of Jyoti, Kilburn Engineering, Jord
Engineers, Mipco Seamless, Antifriction Bearings Corp., Batliboi,
Hitachi and Windsor Machines has been very poor.

309
The reasons identified for better performance on various counts are
healthy Gross Profit ratio, good inventory turnover ratio, higher fixed
assets turnover ratio, healthy debt equity ratio and prudent dividend
payout ratio.
It is evident that for the overall success in any business enterprise,
proper care of all the finance functions is of prime importance. Various
propositions for the growth of business
as well as routine matters should have profit orientation. Since risks are
assumed and various resources are committed, the performance is
evaluated with reference to the profitability displayed by such activity.
Routine operations require liquidity also, so that smooth working of
different business activities is ensured. This requires proper management
of current assets and current liabilities, together with effective credit
policy and control of expenses.
Financial management is fully aware about the value of money
with reference to time. Present value of inflow of resources and income
as well as outflow of resources and expenses is measured and recorded
by the system. The finance executive has also to evaluate the value of
money in future and present value of earnings and costs to be incurred in
future.
A company is a wealth generating machine. Rs.100 invested in the
equity of a company may appreciate to Rs. 1,00,000 within a period often
years. Good companies build reserves, which are spare financial
resources, free from any encumbrance. Together with paying handsome
amount of dividend to the shareholders, companies do have a dual goal of
maximization of the value of investment of the shareholders and wealth
of the organization.
Another important issue concerning the finance function is
evaluating the suitability of source of funds in view of its need for short
310
term or long term use as well as financing of expenses, financing of
assets or repayment of liability.
Leverage is another important mechanism which a finance
executive must understand and employ the same in a wise manner.
Financial leverage will increase the EPS for equity. Operating leverage
will ensure the minimum per unit cost and resultant maximum rate of
return. Both the parameters are the tests of successful financial
management.
The real tact of the financial executive is management of funds and
operations when the business is having expansion, modernization and
diversification of business activities. This implies application of most
suitable sources of funds, maintaining liquidity, profitability and
favorable operating leverage in the long run.
With the changing times, the role of finance executive has gone
under transition. It can be summarized as under:
1) Finance function has become strategic.
2) There is more focus on maximizing values and regulatory
compliance.
3) The finance function has become futuristic.
4) The relation between risks and return has become very crucial.
5) Financial MIS aims to become a decision support system.
6) Integration is required on the enterprise level as a whole, and not
only in the area of finance function, for overall and sustained
success.
7) There is increased importance production and information &
communication technology in todays' business enterprises.
Another issue worth noting is that the engineering companies have
started investing in technology as well as information technology to
improve operational efficiency and to monitor daily routines and
311
schedules. Particularly, year 2002 onwards, the financial statements
reflect investment in such technological aspects. Hence, there are other
research aspects to be looked into with regard to contribution of
technology as a whole in reducing costs as well as increasing return.
Engineering industry being capital intensive by nature also requires to
follow sound capital budgeting practices. Effective utilization of overall
technology will decide the profit-path of the companies. Hence, the
financial analysis in future will focus on :
1) Utilisation of assets.
2) Investment in Technology vis-à-vis returns
3) Turnover of Operations, And
4) Distribution of Profits.

312
Bibliography Books :
1) E. A. Helfert, Techniques for Financial Analysis, Richard D. Irwin Inc., USA.
2) Ezra Soloman & John Pringle, An Introduction to Financial Management, Prentice Hall of India, New Delhi).
3) Ezra Soloman, The Theory of Financial Management, Columbia University Press, USA.
4) George Foster, Financial Statement Analysis, Prentice Hall, USA.
5) H. Ansoff, Corporate Strategy, McGraw Hill Publishing Co., London.
6) H. G. Guthman, Analysis of Financial Statements, Prentice Hall Inc., USA.
7) I. M .Pandey, Financial Management, Vikas Publishing House, New Delhi.
8) J. C. Van Horne, Financial Management & Policy, Prentice Hall Of India, New Delhi.
9) J.F. Weston & E.F. Brighan, Managerial Finance, Dryden Press, U.K.
10) Jawaharlal, Corporate Financial Reporting, Taxmann, New Delhi.
11) John Hampton, Financial Decision Making, Prantice Hall of India Pvt. Ltd., New Delhi.
12) John N. Myer, Financial Statement Analysis, Prentice Hall Inc., USA.

313
13) Kennedy and Mc Mullen, Financial Statements : Form, Analysis and Interpretation, Richard D. Irwin Inc., USA.
14) Lawrence Gitman. Harper and Row, Taxmann, Companies Act, New Delhi.
15) M.Y. Khan & PK Jain, Financial Management, Tata McGraw Hill, New Delhi.
16) Michel Porter, Competitive Strategy. Macmillan, UK.
17) Prasanna Chandra, Financial Management, Tata McGraw Hill, New Delhi.
18) Principles of Financial Management :, New York.
19) P.V. Kulkarni & BG Sathyaprasad, Financial Management, Himalaya Publishing House, Mumbai.
20) R S Kulshrestha, Financial Management, Sahitya Bhavan, Agra (1991).
21) R. Brearley & S. Myers, Principles of Corporate Finance, McGraw Hill, USA.
22) R. M. Srivastav, Financial Decision Making, Sterling Publishers Pvt. Ltd., New Delhi.
23) R. N. Anthony & J. S. Reece, Management Accounting Principles, Taraporewala, Bombay.
24) Randolph Westerfield & Jeffrey Jaffe, Corporate Finance : Stephen Ross, Tata McGraw Hill, New Delhi.
25) Ravi Kishore, Financial Management, Taxmann, New Delhi.

314
26) Raymond Kent, Corporate Financial Management, Richard D. Irwin Inc., USA.
27) Robert Anthony & Vijay Govindrajan, Management Control Systems, Tata McGraw Hill, New Delhi.
28) Roy A Foulke, Practical Financial Statement Analysis, Mc Graw Hill publishing company, USA.
29) R. P. Rustagi , Financial Management, Galgotia Publishing Co., New Delhi.
30) S. C. Kuchhal,Financial Management, Chaitanya Publishing House, Allahabad.
31) Strategic Financial Planning : A Manager’s Guide to Improving Profit Performance. McMillan Publishing Co., New York, USA.
32) T. Copeland & J. F. Weston, Financial Theory and Corporate Policy, Addison Wesley, USA.
33) V. S. Murthy, Management Finance, Vakils, Feffer & Simons Ltd., Mumbai.
34) William H. Beaver, Financial Reporting : An Accounting Revolution, Prantice Hall, USA. (1981).
Journals :
1) Accounting World, ICFAI, Hyderabad. 2) Annual Reports of the Companies. 3) Business India 4) Capital Market, Mumbai 5) Case Folio, ICFAI, Hyderabad. 6) Chartered Secretary, ICSI, New Delhi.

315
7) Economic Times Annual, The Economic Times, Mumbai. 8) Finance India : Indian Institute of Finance, New Delhi. 9) Financial Performance of Companies, ICICI Portfolio, Mumbai. 10) Fortune India, Fortune Publications, Mumbai. 11) Harvard Business Review, Harvard Business School, Boston,
Mass., USA. 12) ICFAI Journal of Accounting Research, ICFAI Press, Banjara
Hills, Hyderabad. 13) Journal of Applied Finance, ICFAI, Hyderabad. 14) Kothari’s Guide to Companies, Kothari Publications, Chennai. 15) Management Accountant, Kolkata. 16) Monthly Economic Review, CMIE, Mumbai. 17) RBI Annual Reports, Reserve Bank of India, Mumbai. 18) RBI Monthly Review, Reserve Bank of India, Mumbai. 19) Stock Exchange Official Directory, Bombay Stock Exchange,
Mumbai. 20) The Chartered Accountant, New Delhi. 21) Vikalpa, Indian Institute of Management, Ahmedabad. Dailies: 1) Business Standard 2) Financial Express 3) The Economic Times

316
Annexure : 1
QUESTIONNAIRE Questionnaire for Research study on ' Financial Performance Appraisal of Selected Engineering Companies in Gujarat ' : Notes :
1 Information provided by you will be kept strictly confidential. However, if you do not like to disclose some information, please keep the column blank.
2 The period covered by the study is 1990 - 2002. Your answers should relate to that period.
3 For most of the questions choice answers are provided : Please either : A) Tick mark the appropriate answer ( there can be one or more answers ), or B) Select Yes/No by cancelling the other alternative. or C) Assign value in priority order ( say 1 - 2 - 3 etc. )
4 At some places you may be required to povide some figures or write down some of your observations. Please attach separate sheet whereverrequired.
5 Kindly send a copy of your latest Annual Report. 6 Kindly send the questionnaire feedback to the following Address :
Mr. S M Joshi Faculty ( Accounting & Finance ) SEMCOM College, Vallabh Vidyanagar 388 120. ( Gujarat ) SECTION I
1 Name of the Company :
2 Established in ( Month/year ) :
3 Name of Group (Management) :
4 Share Capital (Paid-up) : Rs.
5 Human Resources : 1) Management : (Nos.) 2) Staff : 3) Workers :
6 Bankers : SECTION II PROFITABILITY
1 Please assign rank to the financial objective in order of their importance for your Company : A) Maximise profit after Tax. B) Maximise return on Investment. …2
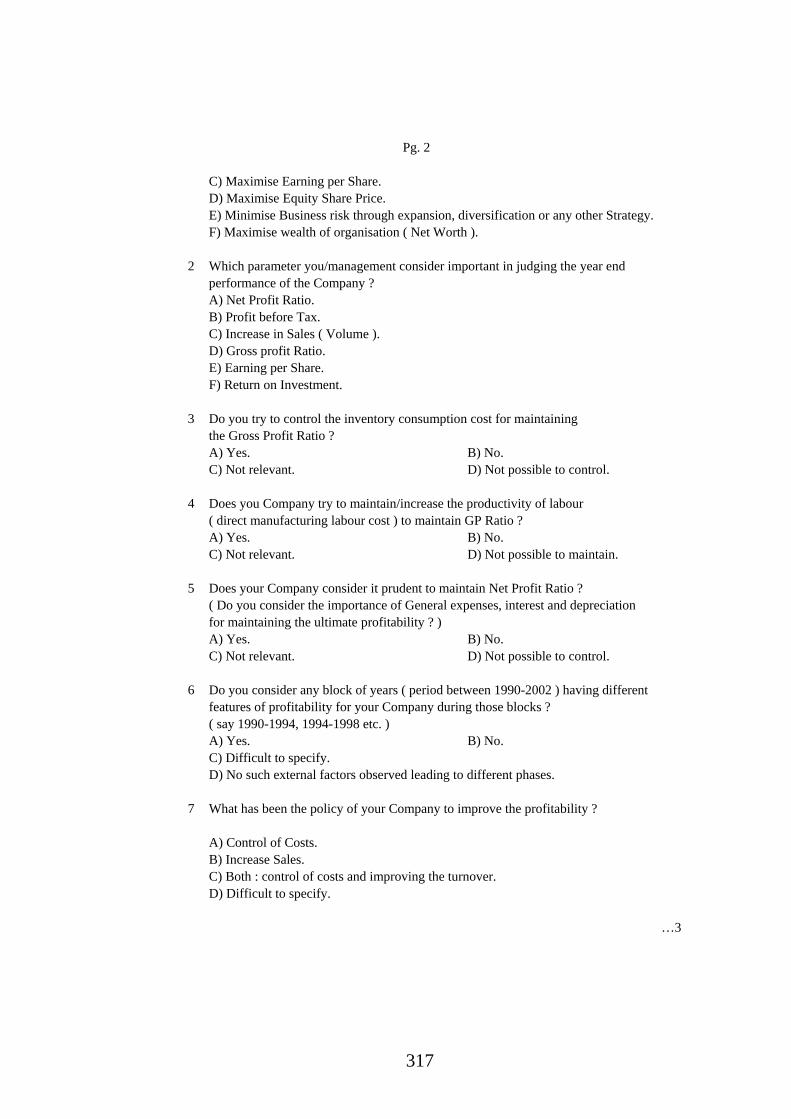
317
Pg. 2 C) Maximise Earning per Share. D) Maximise Equity Share Price. E) Minimise Business risk through expansion, diversification or any other Strategy. F) Maximise wealth of organisation ( Net Worth ).
2 Which parameter you/management consider important in judging the year end performance of the Company ? A) Net Profit Ratio. B) Profit before Tax. C) Increase in Sales ( Volume ). D) Gross profit Ratio. E) Earning per Share. F) Return on Investment.
3 Do you try to control the inventory consumption cost for maintaining the Gross Profit Ratio ? A) Yes. B) No. C) Not relevant. D) Not possible to control.
4 Does you Company try to maintain/increase the productivity of labour ( direct manufacturing labour cost ) to maintain GP Ratio ? A) Yes. B) No. C) Not relevant. D) Not possible to maintain.
5 Does your Company consider it prudent to maintain Net Profit Ratio ? ( Do you consider the importance of General expenses, interest and depreciation for maintaining the ultimate profitability ? ) A) Yes. B) No. C) Not relevant. D) Not possible to control.
6 Do you consider any block of years ( period between 1990-2002 ) having different features of profitability for your Company during those blocks ? ( say 1990-1994, 1994-1998 etc. ) A) Yes. B) No. C) Difficult to specify. D) No such external factors observed leading to different phases.
7 What has been the policy of your Company to improve the profitability ? A) Control of Costs. B) Increase Sales. C) Both : control of costs and improving the turnover. D) Difficult to specify. …3

318
Pg. 3
8 Do your Competitors influence the profitability of your Company's business ? A) Yes. B) No. C) Yes : But we devise strategy to face the competition. D) Difficult to specify.
9 Does your Company try to maximise profit after Tax ? ( Do your Company practice Tax Planning regularly ? ) A) Yes. B) No. C) Not always. D) Many a times it is difficult to put Tax planning in practice.
10 How do you rate the tax provisions in Union Budget ( between 1991-2002 ) for taxation of Business income ? ( there can be Blocks of period ) : A) Positive for Tax planning. B) Negative provisions. C) Budget provisions are inequitable. D) Budget provisions are difficult to be put to practice. E) Budget provisions are not stable year to year.
11 How is your Company's Dividend policy ? A) Positive ( favourable to Shareholders ). B) Cautious. C) Difficult to specify.
12 Do you believe that Assets Turnover Ratio is also an important measure to varify the profitability ? A) Yes. B) No. C) Difficult to specify.
13 Do you believe that the Return on capital employed ( ROCE ) is an important measure to varify the profitability ? A) Yes. B) No. C) Difficult to specify.
14 Do you consider Earnings per Share ( EPS ) is an important measure of profitability of the Company ? A) Yes. B) No. C) Difficult to specify.
15 Do you believe that more amount of earnings should be retained ( after payment of Dividend ) to finance the Business growth ? A) Yes. No. C) Difficult to specify. …4

319
Pg. 4
16 Do you have Value added analysis quarterly/half yearly/ annually ? A) Yes. B) No.
17 What is your forecast for projected profitability/growth of your Company ? ( 2005-2010 ). A) Positive / good. B) Negative / bad. C) Difficult to forecast.
18 As per your opinion, what are the strengths of your company for higher profitability ? A) B) C)
19 As per your opinion, what are the weaknesses of your company, on account of which the required profitability is not attained ? A) B) C)
20 What are the opportunities which your Company can tap to make the company financially strong ? A) B) C)
21 What are the Business threats for your Company ? A) B) C) SECTION III CAPITAL STRUCTURE
1 As per your opinion, what factors decide the capitalisation and capital structure of your Company ? A) Government norms. B) Earnings. C) Risk - return. D) Flexibility. E) Cost. F) Own norms. …5

320
Pg. 5
2 What factors you consider relevant when long term Debt is taken ? A) Cost of Funds. B) Particular requirement of funds for a project. C) Period of Finance. D) Tax considerations. E) Trading on Equity.
3 What factors influence your capital structure decision ? ( Please Rank ) : A) Control. B) Risk. C) Income. D) Tax aspects. E) Flexibility. F) Timing. G) Regulatory norms. H) Cost. I ) Financial leverage. J) Other factors.
4 How do you rate the Preference shares as a source of Capital ? A) Good option. B) Better source as a medium term finance. C) Easy to issue. D) Flexibility. E) Any other factor ( Pl. specify ) :
5 How do you compare the Debentures v/s long term loans in the capital structure ? Debentures : ( Pl. Rate ) : A) Flexibility. B) Cost. C) Control. D) Regulatory aspects. E) Tax considerations. F) Others. Term loans ( Pl. Rate ) : A) Easy availability and lesser documentation. B) Cost. C) Control. D) Flexibility. E) Any other ( Pl. specify ) : SECTION IV WORKING CAPITAL
1 What are the major factors/issues which decide your Company's working capital policy ? A) Nature of Business ( say Engineering units have to keep substantial quantum of funds as working capital ). B) Business demand and Sales of the Company. C) Manufacturing policy. D) Credit policy. E) Availability of Credit. F) Speed of operating cycle. G) Price level changes. H) Any other ( Pl. specify ) : Pg. 6

321
Pg. 6
2 Which component has major proportion of total working capital ? A) Inventory. B) Debtors. C) Cash and Bank balance. D) Loans and Advances. E) Any other ( Pl. specify )
3 Do you consider any relation between Inventory and Sales(volume as well as value)? A) Yes. B) No. C) Marginally - Yes.
4 Do you consider any relation between Debtors and Sales ? A) Yes. B) No. C) Marginally - Yes.
5 Do you consider any relation between Debtors and Creditors ? A) Yes. B) No. C) Marginally - Yes.
6 Is there any specified Current Ratio for your Company ? If so, do you try to maintain that Ratio ? A) Yes. B) No.
7 Which component is having highest proportion in inventory ? A) Raw material. B) Work-in-process. C) Finished goods. D) Stores & spares.
8 Are you having specific Credit policy ? A) Yes. B) No. C) Flexible policy.
9 Are the Debtors delaying the payment ? A) Yes. B) No. C) Not always.
10 Are there Bad debts in your Business ? A) Yes : B) No. 1) Major. 2) Not substantial.
11 How the working capital is financed ? A) Bank finance. B) Own funds. C) Part of long term funds. D) Working capital loan. E) Trade credit. F) Mixed funds. G) Any other ( Pl. specify ) :
12 In your opinion, is there any relation between working capital funds and profit before Tax ? A) Yes. B) No. C) No direct relation. D) Marginally - Yes. Pg. 7

322
Pg. 7
13 Between 1991 to 2002, what trend you have observed in working capital in your Company ? A) Increasing trend. B) Decreasing. C) Uneven behaviour. SECTION V FIXED ASSETS
1 Is your Company having a formal capital investment plan each year ? A) Yes. B) No. C) Need based investment. D) Any other policy.
2 The addition in Plant & Machinery is usually for : A) Additional production facility. B) Asset replacement. C) Modernisation. D) New product line. E) Any other ( Pl. specify )
3 What are the sources of financing Fixed Assets ? A) Term loans. B) Own funds. C) Mixture of debt and own funds. D) Medium term loan. E) Any other.
4 In financing fixed assets, which factors you believe are relevant ? A) Cost of funds. D) Flexibility. B) Urgency of investment. E) Control. C) Tax considerations. F) Availability of funds. G) Management policy.
5 Do you think that there is a relation between increase in Sales and fixed assets ? A) Yes. B) No.
6 Do you think that there is a relation between profitability and Fixed assets ? A) Yes. B) No.
7 Do you analyse Fixed Assets turnover Ratio to monitor the profitability ? A) Yes. B) No. C) Occasionally.
8 Do you analyse the operating leverage for Cost analysis and profitability ? A) Yes. B) No. C) Occasionally.
9 Which method is followed by your Company for charging the depreciation ? A) Straight line method. B) Diminishing balance method. C) Any other ( pl. specify ) Pg. 8

323
Pg. 8
10 During the period 1991-2002, have you observed any trend in Fixed Assets of your Company?
A) Increasing. B) Decreasing. C) Uneven behaviour. SECTION VI SOURCES AND APPLICATION OF FUNDS
1 Do you undertake analysis of sources and application of funds quarterly, half yearly or year end ? A) Yes. B) No. C) Occassionally - as required.
2 The above analysis is undertaken to : A) To analyse trend of funds flow. B) To analyse and check proper utilisation of funds. C) To analyse the composition and flow of funds during a particular period. D) To varify the changes in the composition of assets and liabilities. E) To varify the changes in net worth. F) Any other ( pl. specify )
3 What is the trend of funds flow in terms of funds for financing fixed assets and/or current assets ? ( during the period 1991 - 2002 ). A) Higher for financing fixed assets. B) Higher for financing current assets. C) Overall average and balancing trend. D) Increase in overall funds. E) Decrease in overall funds. F) Any other ( pl. specify )
4 What is the overall trend of funds flow between 1991-2002 ? ( Please specify ) A) B) C) SECTION VII GENERAL
1 Any other details / information which you consider relevant for this study : ( Details may be given below ). Pg. 9

324
Pg. 9 Name : Office address : Phone No. : Fax No. : E Mail ID : Date : Place :